2016 education statistics report
TRANSCRIPT

Kingdom of Lesotho
2016 Education Statistics Report
Bureau of Statistics P.O. Box 455 Maseru 100 Lesotho Tel: +266 223263 93/22323852 Fax: +266 22310177 E-mail: [email protected] Website: www.bos.gov.ls
Mission: To Coordinate the National Statistical System (NSS) and produce accurate, timely, reliable, culturally relevant and internationally comparable statistical data for evidence- based planning, decision making, research, policy, program formulation and monitoring and evaluation to satisfy the needs of users and producers.
Statistical Report No. 28: 2018

i
LIST OF ACRONYMS ACL Anglican Church of Lesotho ADSE Advanced Diploma in Special Education AME African Methodist Episcopal BoS Bureau of Statistics CAS Centre for Accounting Studies CECE Certificate in Early Childhood Education COSC Cambridge Overseas School Certificate CWIQ Core Wealth Indicator Questionnaire DEP Diploma in Primary Education DTE Diploma in Technology Education DTEP Distance Teachers Education Programme ECCD Early Childhood Care and Development EFA Education for All EGIS Education Geographic Information System EMIS Education Management Information System FPE Free Primary Education GER Gross Enrolment Ratio/Rate GoL Government of Lesotho GPS Geographic Positioning Systems HEIs Higher Education Institutions IDM Institute of Development Management JC Junior Certificate LAC Lesotho Agricultural College LeBoHA Lesotho Boston Health Alliance LANFE Lesotho Association of Non-Formal Education LCE Lesotho College of Education LCS Lesotho Correctional Services LDS Lesotho Demographic Survey LDTC Lesotho Distance Teaching Centre LGCSE Lesotho General Certificate in Secondary Education LEC Lesotho Evangelical Church LFS Labour Force Survey LIPAM Lesotho Institute of Public Administration and Management LP Lerotholi Polytechnic LUCT Limkokwing University of Creative Technology MAN Maluti Adventist College MoE Ministry of Education MoET Ministry of Education and Training NER Net Enrolment Ratio/Rate NCDC National Curriculum Development Centre NFE Non-Formal Education NHTC National Health Training Center NUL National University of Lesotho PSLE Primary School Leaving Examination PSN Paray School of Nursing PTC Primary Teachers Certificate RCM Roman Catholic Church RSN Roma School of Nursing Scott Scott Hospital School of Nursing SEN Special Education Needs SRV Senqu River Valley STC Secondary Teachers Certificate TVD Technical and Vocational Department TVET Technical and Vocational Education Training UNESCO United Nations Education Science and Culture Organization UPE Universal Primary Education

ii
Contents…………………………………………………………………………………………….Page List of Acronyms ….………………………………………………………………………………..i Table of Contents……………………………………………………………………………………ii List of Tables….…..………………………………………………………………………………...v List of Figure………...............................................................................................viii Chapter 1: Background .................................................................................... 1
1.0 Introduction ................................................................................................ 1
1.1.1 The Education System .................................................................................... 1 1.2 Data Source and Quality .................................................................................... 2 1.2.1 Source ............................................................................................................ 2 1.2.2 Quality ............................................................................................................ 3 Chapter 2: Early Childhood Care and Development (ECCD) Education ............. 4
2.0 Introduction ................................................................................................ 4
2.1 Enrolment in Reception Classes .................................................................... 4
2.2 Enrolment in ECCD (reception classes included) ............................................ 5
2.2.1 Accessibility of Education in ECCD ................................................................. 7 2.2.1.1 New Entrants in ECCD ................................................................................ 7 2.3 Disability in ECCD Schools .......................................................................... 7
2.4 Orphan-hood in ECCD Schools ..................................................................... 8
Chapter 3: Primary School Education ............................................................ 11
3.0 Introduction .............................................................................................. 11
3.1 Enrolment in Registered Primary Schools .................................................... 11
Table 3.3: Enrolment in Registered Primary Schools by District, Sex and Year, 2014-
2016 .............................................................................................................. 12
3.1.1 Accessibility of Education ........................................................................ 16
3.1.1.1 New Entrants in Registered Primary Schools .......................................... 16
3.1.1.2 Registered Primary Schools Apparent Intake Rates (AIR) and Net Intake
Rates (NIR) ..................................................................................................... 17
Table 3.9: Registered Primary Schools Apparent and Net Intake Rates and Gender
Parity Indices by Sex, 2000-2016 ..................................................................... 18
3.1.2 Gender Parity Index in Registered Primary Schools .................................... 18
3.1.3 Coverage of Participation in Primary Education ......................................... 18
3.2 Disability in Registered Primary Schools ...................................................... 20
3.3 Orphan-hood in Registered Primary Schools ................................................ 21
3.4 Inputs for Primary Education ..................................................................... 23
3.4.1 Primary Schools ..................................................................................... 23
Table 3.16: Registered Primary School Enrolment, Number of Schools, Number of
Teachers and Percentage Change in Enrolment, 2007-2016 ................................ 25

iii
3.4.2 Teachers in Registered Primary Schools ..................................................... 27
Table 3.20: Enrolment, Number of Teachers and Pupil to Teacher Ratios in
Registered Primary Schools by District and Sex, 2016 ........................................ 27
Table 3.21: Primary school teachers by Rank, Agency and Sex, 2016 ................... 29
3.5 Efficiency and Quality of Education ............................................................ 31
3.5.1 Repeaters in Registered Primary Schools .................................................. 31
3.5.2 Primary School Leaving Examination (PSLE) Results ................................ 33
Table 3.27: Primary School Leaving Examination Results (PSLE), 2007 - 2016 ..... 34
3.5.3 Transition Rates from Standard 7 to Form A ............................................. 34
3.5.4 Cohort Analysis ...................................................................................... 35
Chapter 4: Secondary School Education ....................................................... 36
4.0 Introduction .............................................................................................. 36
4.1 Enrolment in Registered Secondary Schools ................................................. 36
4.2 Trend Analysis of Registered Secondary Schools Enrolment .......................... 39
4.3 New Entrants in Registered Secondary Schools ............................................ 39
4.4 Coverage of Participation in Secondary Education ........................................ 40
4.4.1 Gross and Net Enrolment Rates, Pupils to Teacher Ratios and the Gender Parity Indices for Registered Secondary Schools ..................................................... 40 Table 4.5: Secondary School Enrolment Rates, Gender Parity Indices and Pupil
Teacher Ratios, 2003-2016 .............................................................................. 41
4.5 Enrolment of Students with Special Educational Needs in Registered ............. 42
Secondary Schools .......................................................................................... 42
4.6 Orphans in Registered Secondary Schools ................................................... 44
4.7 Inputs for Secondary Education .................................................................. 45
4.7.1 Secondary Schools .................................................................................. 45
4.7.2 Secondary Schools Teachers .................................................................... 48
4.8 Efficiency and Quality of Education in Registered Secondary Schools ............. 50
4.8.1 Repeaters in Registered Secondary Schools ............................................... 50
4.8.2 Transition Rates from Form C to Form D ...................................................... 52 Table 4.20: Transition Rates from Form C to Form D, 2002 – 2015...................... 52
4.8.3 Examination Results ..................................................................................... 52 4.8.3.1 Junior Certificate Examinations ................................................................. 52 Table 4.21: Junior Certificate Examination Results, 2006-2016 .......................... 53
4.8.3.2 Lesotho General Certificate in Secondary Education (LGCSE) .................... 53 Chapter 5: Technical and Vocational Education Training .............................. 55
5.0 Introduction .............................................................................................. 55
5.1 Enrolment ................................................................................................ 55
5.2 Teaching Staff ........................................................................................... 58
Chapter 6: Non Formal Education................................................................. 60
6.0 Introduction .............................................................................................. 60

iv
6.1 Enrolment ........................................................................................................ 60 6.2 Special Educational Needs ......................................................................... 62
6.3 Orphan-Hood ............................................................................................ 63
6.4 Teaching Staff ........................................................................................... 63
ANNEX I: Technical Notes ...................................................................................... 66 ANNEX II: SUMMARY INDICATORS .................................................................. 67
1. Primary Education Level .............................................................................. 67
2. Secondary Education Level........................................................................... 68
ANNEX III: Population projections .................................................................... 69

v
LIST OF TABLES Page Table 2.1: Number of Reception Classes and Enrolment, 2008-2016…………………………………………………………………………………. …. ……....5 Table 2.2: Number of Reception Classes and Enrolment by District, 2014- 2016…..………………………………………………………………………………..……….…5 Table 2.3: ECCD Enrolment by District, Age and Sex, 2016…….………. …. ……..6 Table 2.4(i): ECCD schools Gross and Net Enrolment Rates (NER) and (GER) by Sex, 2015-2016………………………………………………………………………………………..6 Table 2.4(ii): ECCD New Entrants by District and Sex, 2016………………..……....7 Table 2.5: ECCD enrolment of children with special educational needs or disability by District, Age and Sex, 2016............................................................................8 Table 2.6: ECCD Enrolment of disabled pupils by Type of disability, Age and Sex, 2016………………………………………………………………………………………………..8 Table 2.7: ECCD Orphans by District, Age and Sex, 2016……………………..….....8 Table 2.8: ECCD Orphans by District, Age and Sex, 2016…………………....……...9 Table 2.9: ECCD Teachers by District and Sex, 2016………………………..............9 Table 2.10: Number of ECCD Schools by district and Agency, 2016...................10 Table 3.1: Enrolment in Registered Primary Schools by Age, Grade and Sex, 2016……………………………………………….……………………………………………...11 Table 3.2: Enrolment in Registered Primary Schools by Grade, Sex and Year, 2012-2016……………………………………………….………………………………………..….…12 Table 3.3: Enrolment in Registered Primary Schools by District, Sex and Year, 2014-2016……………………………………………………….……………….............…………..12 Table 3.4: Enrolment in Registered Primary Schools by District, Urban and Rural and Sex, 2016……………………………………………………………………………….…13 Table 3.5: Enrolment in Registered Primary Schools by District, Zone and Sex, 2016………………………….……………………………………………………………………13 Table 3.6: Enrolment in Registered Public and Private Schools by District and Sex, 2016……………………………………………………………………….………………………14 Table 3.7: Enrolment in Registered Primary Schools by District, Agency and Sex, 2016 ……………………………………………………………………………………………….15 Table 3.8: New Entrants in Primary Schools by District and Sex, 2016 ……………………………………….…………………………………..………………………....17 Table 3.9: Registered Primary Schools Apparent and Net Intake Rates and Gender Parity Indices by Sex, 2000-2016……………………………………….…………………..18 Table 3.10: Registered Primary Schools Gross and Net Enrolment Rates and Pupils Teacher Ratios, 2000-2016…………………………………..……………………………….19 Table 3.11: Pupils Enrolled in Registered Primary Schools by District, 2016 ……………………………………………………………………….………………………………20 Table 3.12: Enrolment of Pupils with Special Educational Needs in registered Primary by type of disability, Grade, 2016……………………….…………..…………..20 Table 3.13: Enrolment of Pupils with Special Needs in Registered Primary Schools by Age, Grade and Sex, 2016…………………………….………….……………………….21 Table 3.14: Enrolment of Orphans in Registered Primary Schools by Type grade and Sex, 2016………………………………………………….………….………………………….21 Table 3.15: Orphans in Registered Primary Schools by Age, Grade and Sex, 2016……………………………..………………………………………………………………..22 Table 3.16: Registered Primary School Enrolment, Number of Schools, Number of Teachers and Percentage Change in Enrolment, 2005-2016……………………………………………………………………………………………….25 Table 3.17: Registered Primary Schools by District and Ecological Zones, 2016……..……………………………………………………….……………..............……..26 Table 3.18: Number and Percentage Distribution of Registered Public and Private Schools by District, 2016………..………………………………………............…..…...26

vi
Table 3.19: Number and Percentage Distribution of Registered Primary Schools by Residence, and District, 2016………………………………..……………….....27 Table 3.20: Enrolment, Number of Teachers and Pupil to Teacher Ratios in Registered Primary Schools by District and Sex, 2016……………….……27 Table 3.21: Number of Teachers in Registered Primary Schools by Rank, Agency and Sex, 2016…………………………………………………………………………..…29 Table 3.22: Teachers in Registered Primary Schools by District, Agency and Sex, 2016……………………………..……………………………………………………30 Table 3.23: Enrolment of Repeaters in Registered Primary Schools by Age, Grade and Sex, 2016…………………………..………………………………………….32 Table 3.24: Enrolment of Repeaters in Registered Primary School by District, Zone and Sex, 2016…………………………………………………….…………………32 Table 3.25: Repetition Rates in Registered Primary Schools by Grade and Sex, 2011 – 2016………….……………………………………………………………………...33 Table 3.26: Primary Schools Promotion, Repetition and Dropout Rates by Grade, 2011- 2016……………….………………………………………………...............33 Table 3.27: Primary School Leaving Examination Results (PSLE), 2007 – 2016…………………..…………………………………………………………………34 Table 3.28: Transition Rates from Standard 7 to Form A, 2001-2016……………………………………………………………………………………..34 Table 3.29: Crude and Net Cohort Survival Rates in Primary Schools, 2010-2016………….………………………………………………………………………….35 Table 4.1: Distribution of Enrolment in Registered Lower and Upper Secondary Schools by Age, Form and Sex, 2016…………..…………………………….…37 Table 4.2: Distribution of Enrolment in Registered Public and Private Secondary Schools by District and Sex, 2016……………………………………………....38 Table 4.3: Distribution of Enrolment in Registered Secondary Schools by District, Ecological Zone and Sex, 2016……………………………………………………38 Table 4.4: Number and Percentage distribution of Secondary School Students in Registered Schools by District, Sex and Percentage Distribution, 2014-2016…………………………………………………………………………………..…39 Table 4.5: Secondary School Enrolment Rates, Gender Parity Indices and Pupil Teacher Ratios, 2003-2016………………………………………….…………..…41 Table 4.6: Lower and Upper Secondary School NER's by Sex, 2015-2016……………………………………………………………………………………...42 Table 4.7: Number of Students with Special Educational Needs in Registered Secondary Schools by District, Urban and Rural Residence and Sex, 2016………………………………………………………………………………………42 Table 4.8: Number of Students with Special Educational Needs in Registered Secondary Schools by Disability Type, Form and Sex, 2016………………...43 Table 4.9: Students with Special Educational Needs in Registered Secondary Schools by Age, Form and Sex, 2016……………………………………………...43 Table 4.10: Orphans in Registered Secondary Schools by Type, Form and Sex, 2016…………………………………………………………………………………….…44 Table 4.11: Orphans in Registered Secondary Schools by District, Urban and Rural and Sex, 2016………………………………………………………………………..…44 Table 4.12: Orphans in Registered Secondary Schools by Age, Form and Sex, 2016..………………………………………………………………………………………45 Table 4.13: Number of Registered Secondary Schools by District, Public and Private, 2016………………………………………………………………………………………..46 Table 4.14: Number of Registered Secondary Schools by District, Urban and Rural, 2016…………………………………………………………………………………….… 46 Table 4.15: Number of Teachers in Registered Secondary Schools by District and Sex, 2016……….…………………………………………………………………………49 Table 4.16: Teachers in Public and Private Registered Secondary Schools by District and Sex, 2016………………………………………………………………………….…49

vii
Table 4.17: Repeaters in Registered Secondary Schools by District, Zone and Sex, 2016……………………………..…………………………………………………………..50 Table 4.18: Repeaters in Registered Secondary Schools by District, Urban and Rural and Sex, 2016……………………………………………………………………………...51 Table 4.19: Repeaters in Registered Secondary Schools by Age, Form and Sex, 2016………………………………………………………………..……………………… .51 Table 4.20: Transition Rates from Form C to Form D, 2002 – 2016…………………………………………………………………………………………..52 Table 4.21: Junior Certificate Examination Results, 2004-2016…………………………………………………………………………………….…….53 Table 4.22: LGCSE Examination Results, 2016.............................................................................................................54 Table 5.1: Enrolment in Registered Technical and Vocational Schools by Age and Sex, 2016………………………………………………….………………………………….55 Table 5.2: Enrolment in TVET Institutions by level of education and Sex, 2016.…………………………………………………………………………………………..56 Table 5.3: Enrolment in Registered Technical and Vocational Schools by District, Agency and Sex, 2016……………………………………………………………………..56 Table 5.4: Repeaters in Registered Technical and Vocational Schools by District and Sex, 2016……………………………………………………………………………………..57 Table 5.5: Students Who Left School in Registered Technical and Vocational Schools by Reason and Sex, 2016…………………………………………….......................…57 Table 5.6: Students Who Left School in Technical and Vocational Institutions by District, Agency and Sex, 2016…………………………………………………………..58 Table 5.7: Teachers in Registered Technical and Vocational Schools by Teacher's Rank and Sex, 2016…………………………………..………………………………….…58 Table 5.8: Teachers in Technical and Vocational Institutions by District, Agency and Sex, 2016……………………………………………….………………………………………59 Table 6.1: Enrolment in Non Formal Education by Age, Level and Sex, 2016……………………………………………………………………………………………..61 Table 6.2: Enrolment in Non Formal Education by District, Level and Sex, 2016….………………………………………………….………………………………………62 Table 6.3: Non Formal Education Learners with Special Educational Needs by District, Level and Sex, 2016………………………………………………………….......62 Table 6.4: Orphans in Non Formal Education by Age, Level and Sex, 2016……………………………………………………………………………………………...63 Table 6.5 Teachers in Non Formal Education by District, Level and Sex, 2016 ………………………………………………………………………………………………….....64 Table 6.6: Non Formal Education Teachers in Literacy and Numeracy by District, Qualification and Sex, 2016………………………………………………………………...64 Table 6.7: Number of Learning Posts/Centers in Non Formal Education by District and Level, 2016………………………………………………………………………………...65

viii
LIST OF FIGURES PAGE Figure 3.1: Enrolment of New Entrants in Registered Primary Schools by Age and Sex, 2016……………………………………………………………………………………………16 Figure 3.2: Percentage Distribution of Orphans by Age and Sex, 2016 ……………………………………………………………………………………………………….22 Figure 3.3: Percentage Share of Registered Primary Schools and Agency, 2016 ……………………………………………………………………………………………………….23 Figure 4.1: Number of New Entrants in Form A and D by Age and Sex, 2016 ………………………………………………………………………………………………………40 Figure 4.2: Percentage Share of Registered Secondary Schools by Ecological Zones, 2016………………………………………………………………………………………………..47 Figure 4.3: Percentage share of Registered Secondary Schools by Agency, 2016 …………………………………………………………………………………………………..….48

1
Chapter 1: Background 1.0 Introduction Education Management Information System (EMIS) office or Education statistics office under planning unit in the Ministry of Education and Training is mandated to timely and reliably produce annual statistical reports on the current condition of education and training, and meet ad-hoc data and statistical requests of relevant authorities from Ministry of Education and Training, other GOL ministries, development and cooperating partners, the public and private sectors.
To be able to timely and reliably respond to the support inquiries and requests by education policy researchers, analysts, planners, and other management personnel for supporting activities such as indicator development, statistical analysis, budgeting and planning, enrolment projection, studies of educational effectiveness, and other quantitative system analysis and monitoring and evaluation. Thus, Education Management Information System (EMIS) office produces this report on annual basis.
1.1.1 The Education System
The system of education in Lesotho has 8 levels starting from level 0 to level 7. Pre-primary or kinder garden (level 0), elementary or primary school (level 1), Secondary education includes junior (level 2) and senior high school (level 3), post secondary (vocational and technical schools, IBM) (level 4) tertiary or Higher education, (Level 5, 6 and 7).
Level 0 is known as pre-primary education or preparatory education, intended to provide early childhood care and development education. These are institutions that have been developed for children ranging from the ages of three to five in Lesotho. The playing activities, experience, and social interaction at this level are accepted as essential aspects of developing skills and knowledge of a child. Few preparatory schools are operated formally by government, churches and private individuals while many are operated informally by private individuals, local communities and non-governmental organizations. Many parents, especially those in urban areas, take their children to preparatory schools as early as when they are three or four years old. Preparatory schools are usually more expensive than primary schools (level 1). Schools at level 1 offer primary education. This is the basic education in reading, writing and arithmetic, as well as other subjects such as history, geography, religious and social studies. Officially, primary education starts at Grade 1 when a child is at least six years old and lasts for seven years. Successful candidates usually complete primary education when they are 12 or 13 years old, but many complete primary level at older ages because they begin Grade 1 late. At the end of

2
the seven-year primary level schooling, pupils sit for the primary school leaving examination (PSLE) administered by the Examinations Council of Lesotho. The sitting for PSLE assists in making the decision about the promotion and selection of those who qualify to attend secondary school (level 2). The first three years (Forms A, B and C) are called junior or lower secondary; usually referred to as ‘secondary’ or Level 2. The remaining two years (Level 3) are called ‘senior or upper secondary’, usually referred to as high school (Form D and E). Progression from secondary to high school is through the Junior Certificate (JC) examination, administered by the Examinations Council of Lesotho. High school candidates sit for the Cambridge Overseas Certificate (COSC) of the University of Cambridge Examination Syndicate. The COSC currently called LGCSE forms the entry requirement for higher and tertiary programs. The difference between COSC and LGCSE is that LGCSE is a locally prepared while COSC was internationally prepared. Level 4 refers to post-secondary education which is not tertiary education. Institutions belonging to this category offer technical training, they are technical and vocational. All such institutions are owned by the government. Levels 5, 6 and 7 are all grouped under tertiary education. Some of the institutions belonging to this level, to name a few are; Lesotho Collage of Education (LCE) the National University of Lesotho (NUL) and Limkokwing University of Creative Technology (LUCT). LCE trains teachers in both primary and junior secondary schools. It trains part-time teachers that are already in-service as well as full time teachers who have not yet been absorbed into the labour market but were able to precede secondary education and met the entry requirement of LCE. The NUL offers degrees in education, humanities, natural sciences, agriculture, social sciences and law, as well as certificate and diploma courses. It also offers a limited number of postgraduate programs. LUCT, founded in 2008, is determined to transform tertiary education and empower the young generation with creative learning through its new teaching methodologies such as thinking skills, innovative mind-sets and creativity.
1.1.2 Agency or School Ownership The centres, schools or institutions are owned either solely by government, solely by private companies or jointly by government and private companies, churches or communities. These centres, schools or institutions are considered ‘public’ if they are solely owned by government, or they are owned jointly by government and private companies or churches, or owned solely by churches and privately owned but the government has a stake in them. For instance, even if a school is church owned, and government either pays their teachers’ salaries or student school fees school or institution is considered public. Otherwise, schools are considered private.
1.2 Data Source and Quality
1.2.1 Source The main source of information highlighted in this report is the annual school survey. The survey is conducted by sending ER42 (Annual Statistical Returns) forms to district education officers (DEO’s) who in turn transmit the forms to the

3
principals of schools. After completion, the principals submit the form to the DEO’s who in turn convey them to Education Planning Unit, Maseru. The ER42 form is a detailed questionnaire that collects information from schools, centres and institutions. This collected information includes schools’ physical location, type of ownership, general enrolment information, enrolment of repeaters, and orphans, teacher’s profiles, school fees and general facilities such as buildings, classrooms and equipment. The questionnaire collects similar information for all levels of education with minor differences depending on the level’s needs. Apart from information collected from individual schools, centres or institutions, other information is acquired from secondary data within the Ministry of Education and Training; sources include Examinations Council, secondary school bursaries and annual budget plans. Further, information on tertiary bursaries and students studying abroad is gathered from other government departments such as National Manpower Development Secretariat (NMDS). Arrangements are in place to collect data from non- registered schools in the country to locate them to know their coverage so that these schools can be assisted to register with Ministry of Education. Their registration will ease the monitoring of quality of education offered at these schools. The foreign countries’ embassies in Lesotho will also be visited to solicit information on Lesotho citizens who are studying in those respective countries.
1.2.2 Quality Data quality is fairly good. In 2015, about 99.8 percent of all levels of education, including primary and secondary schools submitted their ER42 forms. At the data processing stage, missing information was substituted via proxies, 2014 information from the same schools. The total number of registered primary schools that responded was 1,468 in 2011, this number increased to 1,469 in 2012, 1,472 in 2013, 1,477 in 2014 and 1478 in 2016. It should be noted that these are the schools that were operational and responded in the first two quarters of 2015 school calendar. The schools that were not operational during the data collection period were not covered even if they were already registered schools or opened towards the end of calendar year. Some of the schools were non-operational, not because they were officially closed, but because they had no students at the time. The number of registered secondary schools was 326 in 2011, 321 in 2012, and 337 in 2013 while in 2014 they increased to 339. In 2016 the number of registered secondary schools was 344. This increment resulted from building of new schools.

4
Chapter 2: Early Childhood Care and Development (ECCD) Education 2.0 Introduction Early childhood is viewed as a time of immense growth and development, when the brain develops most rapidly and a period when walking, talking, self-esteem, vision of the world and moral foundations are created within a child. The ECCD as an integral part of the pre-schooling process is influenced by three main dividends. Firstly, children that are exposed to an effective ECCD are better equipped for the demands of the school system; this has been substantiated by records of improved academic achievement compared to children who did not attend the pre-schools. Therefore, ECCD programs enhance children’s readiness for school. Secondly, ECCD activities reduce the number of repeat cases and failure rates, therefore allowing the system to optimally apply its limited resources to reach more school children. Lastly, ECCD has strong gender implications as it enables mothers to go to work and participate in development activities while children are being cared for, therefore ECCD programs also help improve gender equality. ECCD education in Lesotho is divided into reception classes, home bases and centres; reception classes are centres attached to some of the existing primary schools. ECCD centres are privately owned by individuals while home bases are community-initiative pre- schools. All these schools offer the same curriculum; they only differ in ownership status. Data on ECCD education has been difficult to collect and to capture due to poor formal registration of centres and/or home bases which result in inadequate coverage of these centres. However, from 2013 all known ECCD schools were assigned temporary registration numbers and this greatly increased coverage because prior to 2013, only information from reception classes was recorded. 2.1 Enrolment in Reception Classes Table 2.1 shows enrolment in ECCD reception classes from 2008 to 2016. Enrolment increased from 3,930 in 2008 to 6,714 in 2009 as a result of the new ECCD centres that were being attached to existing primary schools. Thereafter enrolment dropped up until in 2013 where it was 5,324 due to very few or no new centres that were being attached to primary schools. However, since 2014, improvement in enrolment was observed as it rose to 6,178 after which it began to decline. Observed in the table again was that the number of schools gradually increased from 2008 to 2015 where a slight fall was noticed.

5
Table 2.1: Number of Reception Classes and Enrolment, 2008-2016 Year Enrolment No. of Schools New Schools 2008 3930 119 22 2009 6714 219 100 2010 5696 219 0 2011 5520 219 0 2012 5417 221 2 2013 5324 221 0 2014 6178 240 19 2015 5772 243 3 2016 5832 241 0 Table 2.2 compares enrolment with the number of reception classes by district from 2014 to 2016. It was observed that enrolment rose in 6 districts out of ten from 2015 to 2016 with the highest increase was in Mokhotlong 9.2 percent followed by Leribe and Mafeteng that shared 8.7 percent. The highest decrease was in mohale’s Hoek with 9.3 percent, trailed by Quthing and Thaba Tseka with 7.9 percent and 3.4 percent respectively. In general, enrolment decreased by 6.7 from 2014 to 215 and increased by 1.0 percent from 2015 to 2016. The number of reception classes increased by 1.3 percent from 2014 to 2015 and decreased by 0.8 percent from 2015 to 2016. Table 2.2: Enrolment and Number of Reception Classes by District, 2014 - 2016
District Enrolment No. of schools
2014 2015 2016 2014 2015 2016
Botha-Bothe 557 532 542 18 19 19
Leribe 745 633 688 28 28 28
Berea 717 723 712 27 28 27
Maseru 991 923 939 34 35 34
Mafeteng 641 623 677 30 30 30
Mohale’s Hoek 585 560 508 27 27 27
Quthing 409 376 346 19 19 19
Qacha's Nek 406 361 365 18 18 18
Mokhotlong 422 391 427 15 15 15
Thaba-Tseka 705 650 628 24 24 24
Total 6178 5772 5832 240 243 241 2.2 Enrolment in ECCD (reception classes included) Table 2.3 shows total enrolment in ECCD centres in 2016 disaggregated by district, age and sex. Enrolment in ECCD centres increased from 53,530 in 2015 to 53,793 in 2016 which implies an increase by 0.49 percent. The table reveals that total enrolment increased with age, for instance, from less than 3 years (5,549) up to age 5 years (14,260), but declined to 10 613 at age greater than 5 years. The distribution of ECCD enrolment by district indicates that Maseru was in the lead with 15,030 (27.9 percent) pupils, followed by Leribe with 10,428 (19.4 percent) and the least number of pupils were in Quthing with 2 142 (4.0 percent). Comparison by

6
sex and district shows that enrolment of girls exceeded that of boys in all the districts except in Quthing where the number of boys exceeded that of girls while on overall, girls constituted 27 422(51 percent) and boys added up to 26,371 (49 percent).
Table 2.3: ECCD Enrolment by District, Age and sex, 2016
DISTRICT AGE<3 AGE 3 AGE 4 AGE 5 AGE>5
Total % M F M F M F M F M F
BUTHA-BUTHE 129 152 253 309 418 444 453 474 332 397 3361 6.2 LERIBE 474 510 866 864 1329 1359 1251 1283 1213 1279 10428 19.4 BEREA 248 222 423 450 567 630 664 658 503 501 4866 9.0 MASERU 905 938 1344 1415 2045 2006 1818 1842 1340 1377 15030 27.9 MAFETENG 223 221 308 333 629 640 594 615 448 438 4449 8.3 MOHALES HOEK 177 203 392 414 604 595 619 686 382 344 4416 8.2 QUTHING 85 96 174 165 244 274 298 267 277 262 2142 4.0 QACHAS NEK 117 125 162 197 304 337 329 403 223 196 2393 4.4 MOKHOTLONG 184 168 225 231 302 298 345 368 131 133 2385 4.4 THABA-TSEKA 162 210 274 374 539 634 625 668 420 417 4323 8.0 Total 2704 2845 4421 4752 6981 7217 6996 7264 5269 5344 53793 100
ECCD Schools Gross and Net Enrolment Rates Gross Enrolment Ratio (GER) for ECCD indicates enrolment of pupils regardless of age expressed as a percentage of the total population aged 3 to 5. This indicator is used to demonstrate the general level of participation at ECCD level. It is also used to indicate the degree to which over-aged and under-aged children enrol in ECCD centres. A high GER shows that, there is a high degree of participation. The overall coverage of participation of the eligible population in the education system is usually indicated by Net Enrolment Rate (NER). A high value of NER indicates a high degree of participation of the official school-age population. Table 2.4(i) shows the sex comparison of GER and NER for ECCD enrolment from 2015 to 2016. In 2015, the overall GER was 33.0 percent which was made up of 32.3 percent of males and 33.7 percent of females. The general GER has increased to 42.16 percent in 2016 and was formed by 41.33 and 42.99 males and females percentages respectively. On the other hand total NER in 2016 was 29.49 percent and both males and females made up percentages of 28.83 and 30.15 orderly.
Table 2.4(i): ECCD Schools Gross Enrolment Rate and Net Enrolment Rate by Sex, 2015-2016 Year Gross Enrolment Rate (NER) Net Enrolment Rate (NER)
Males Females Total Males Females Total
2015 32.3 33.7 33.0 23.0 24.0 23.5
2016 41.33 42.99 42.16 28.83 30.15 29.49

7
2.2.1 Accessibility of Education in ECCD Accessibility refers to a proportion of pupils that have equal and equitable opportunities to take full advantage of their education out of all children of admission age at the corresponding grade, which is age 3 for ECCD centres.
2.2.1.1 New Entrants in ECCD Table 2.4(ii) illustrates ECCD new entrants by district and sex for the year 2016. There were 25,052 new entrants in 2016, out of this number 12,345 (49.3 percent) were boys and 12,707 (50.7 percent) were girls. It was observed that the general pattern of new entrants by district is almost similar to the general pattern of the total enrolment. For instance, Maseru accounted for 6,749 (26.9 percent), followed by Leribe with 4,198 (16.8 percent) and the least were Quthing and Qacha’s Nek that shared 4.6 percent each. Table 2.4(ii): ECCD New Entrants by District and Sex, 2016 DISTRICT M F Total Percentage BOTHA-BOTHE 729 831 1560 6.2 LERIBE 2074 2124 4198 16.8 BEREA 939 943 1882 7.5 MASERU 3357 3392 6749 26.9 MAFETENG 1221 1175 2396 9.6 MOHALE’S HOEK 1048 1170 2218 8.9 QUTHING 561 593 1154 4.6 QACHA’S NEK 569 593 1162 4.6 MOKHOTLONG 653 589 1242 5.0 THABA-TSEKA 1194 1297 2491 9.9 Total 12345 12707 25052 100.0
2.3 Disability in ECCD Schools Table 2.5 shows that out of the total enrolment of 53 793 pupils in ECCD centres in 2016, 937 (1.7 percent) pupils had some form disability. Furthermore, sex comparison shows that 512 (57.3 percent) were boys and 382 which is 42.7 percent were girls. Among the districts, there were more boys with special educational needs than their girl counterparts in each district. The Table further shows that Leribe had the highest number of pupils with some form of disability of 246(26 percent); it was followed by Maseru with 166 (18 percent) and then Berea with 117 (12 percent).

8
Table 2.5: ECCD enrolment of children with special educational needs or disability by District, Age and Sex, 2016
DISTRICT AGE<3 AGE 3 AGE 4 AGE 5 AGE>5
Total
M F M F M F M F M F BOTHA-BOTHE 2 0 1 2 10 1 15 14 12 5 62 LERIBE 12 12 20 12 38 26 31 26 39 30 246 BEREA 4 1 7 8 10 9 19 13 25 21 117 MASERU 8 8 18 9 22 17 22 20 25 17 166 MAFETENG 2 2 2 4 6 13 7 14 8 5 63 MOHALE’S HOEK 4 1 4 2 13 7 13 11 5 8 68 QUTHING 1 0 0 1 4 1 0 1 5 2 15 QACHA’S NEK 0 4 4 7 8 6 9 8 9 4 59 MOKHOTLONG 3 1 3 1 15 1 5 5 5 5 44 THABA-TSEKA 3 1 6 7 9 7 19 21 14 10 97 Total 39 30 65 53 135 88 140 133 147 107 937
Table 2.6 displays enrolment of children with special education by type of disability, age and sex for the year 2016. When disaggregating enrolment of pupils with special education by type of disability, majority of children with special education had physical disability accounting for 383(41 percent). This percentage was followed by the one for intellectual disability which constituted 179(19 percent) of the disabled pupils. Intellectual disability includes forms of learning difficulty, epilepsy and mental retardation. Table 2.6: ECCD Enrolment of Children With Special Education by Type of Disability, Age and Sex, 2016
DISABILITY TYPE AGE<3 AGE 3 AGE 4 AGE 5 AGE>5
Total M F M F M F M F M F
Physical Disability 13 14 27 32 56 40 54 55 48 44 383 Visual Impairment 4 5 6 6 9 9 9 15 15 11 89 Hearing Impairment 7 1 10 3 14 7 22 16 19 9 108 Intellectual Disability 6 3 6 6 32 10 36 22 32 26 179 OTHER 9 7 16 6 24 22 19 25 33 17 178 Total 39 30 65 53 135 88 140 133 147 107 937
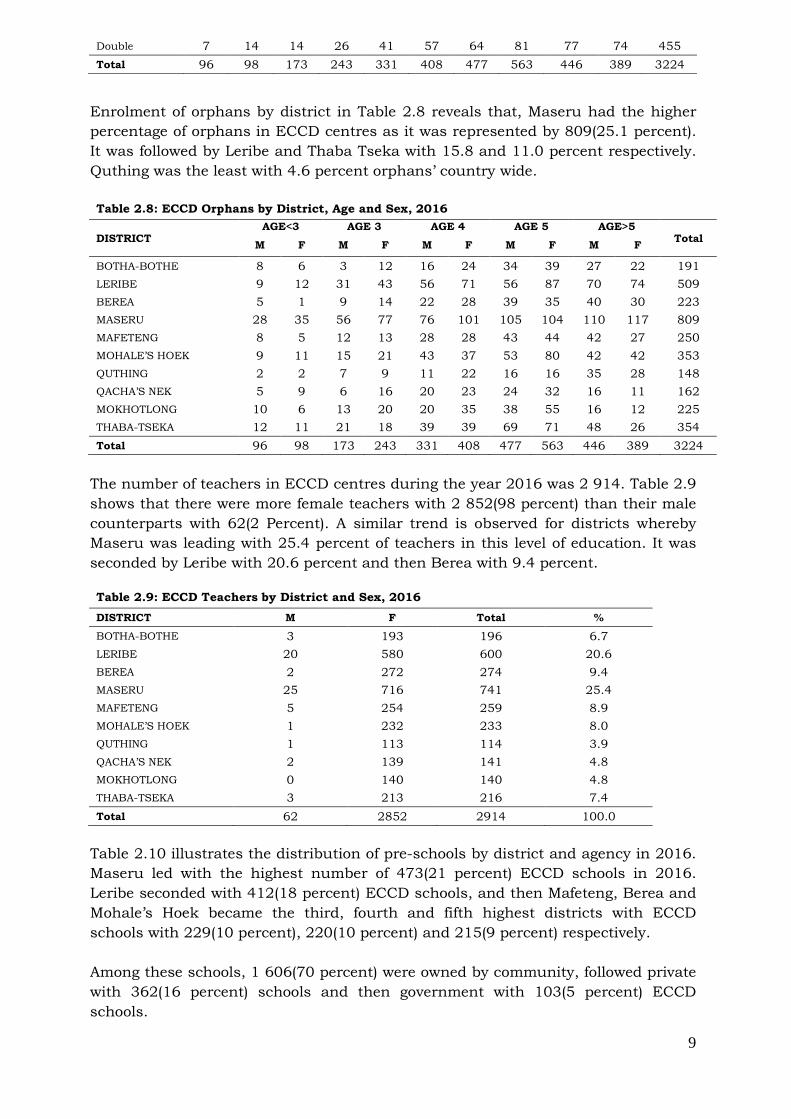
2.4 Orphan-hood in ECCD Schools Out of the total enrolment in ECCD centres, 3 224 were pupils that had either lost one or both of their parents in 2016. As shown in Table 2.7, paternal orphans constituted about 65.4 percent of these orphans, whereas maternal and double orphans accounted for 20.5 and 14.1 percent respectively. Table 2.7: ECCD Orphans by Type, Age and Sex, 2016
ORPHAN TYPE
AGE<3 AGE 3 AGE 4 AGE 5 AGE>5 Total M F M F M F M F M F
Paternal 76 64 123 166 223 251 337 361 265 243 2109 Maternal 13 20 36 51 67 100 76 121 104 72 660
9
Double 7 14 14 26 41 57 64 81 77 74 455 Total 96 98 173 243 331 408 477 563 446 389 3224
Enrolment of orphans by district in Table 2.8 reveals that, Maseru had the higher percentage of orphans in ECCD centres as it was represented by 809(25.1 percent). It was followed by Leribe and Thaba Tseka with 15.8 and 11.0 percent respectively. Quthing was the least with 4.6 percent orphans’ country wide. Table 2.8: ECCD Orphans by District, Age and Sex, 2016
DISTRICT AGE<3 AGE 3 AGE 4 AGE 5 AGE>5
Total M F M F M F M F M F
BOTHA-BOTHE 8 6 3 12 16 24 34 39 27 22 191 LERIBE 9 12 31 43 56 71 56 87 70 74 509 BEREA 5 1 9 14 22 28 39 35 40 30 223 MASERU 28 35 56 77 76 101 105 104 110 117 809 MAFETENG 8 5 12 13 28 28 43 44 42 27 250 MOHALE’S HOEK 9 11 15 21 43 37 53 80 42 42 353 QUTHING 2 2 7 9 11 22 16 16 35 28 148 QACHA’S NEK 5 9 6 16 20 23 24 32 16 11 162 MOKHOTLONG 10 6 13 20 20 35 38 55 16 12 225 THABA-TSEKA 12 11 21 18 39 39 69 71 48 26 354 Total 96 98 173 243 331 408 477 563 446 389 3224
The number of teachers in ECCD centres during the year 2016 was 2 914. Table 2.9 shows that there were more female teachers with 2 852(98 percent) than their male counterparts with 62(2 Percent). A similar trend is observed for districts whereby Maseru was leading with 25.4 percent of teachers in this level of education. It was seconded by Leribe with 20.6 percent and then Berea with 9.4 percent. Table 2.9: ECCD Teachers by District and Sex, 2016 DISTRICT M F Total %
BOTHA-BOTHE 3 193 196 6.7 LERIBE 20 580 600 20.6 BEREA 2 272 274 9.4 MASERU 25 716 741 25.4 MAFETENG 5 254 259 8.9 MOHALE’S HOEK 1 232 233 8.0 QUTHING 1 113 114 3.9 QACHA’S NEK 2 139 141 4.8 MOKHOTLONG 0 140 140 4.8 THABA-TSEKA 3 213 216 7.4 Total 62 2852 2914 100.0
Table 2.10 illustrates the distribution of pre-schools by district and agency in 2016. Maseru led with the highest number of 473(21 percent) ECCD schools in 2016. Leribe seconded with 412(18 percent) ECCD schools, and then Mafeteng, Berea and Mohale’s Hoek became the third, fourth and fifth highest districts with ECCD schools with 229(10 percent), 220(10 percent) and 215(9 percent) respectively. Among these schools, 1 606(70 percent) were owned by community, followed private with 362(16 percent) schools and then government with 103(5 percent) ECCD schools.

10
Table 2.10: Number of ECCD Schools by district and Agency, 2016
DISTRICT GVT COMM LEC RCM ACL AME OTHER PRIVATE Total BOTHA-BOTHE 15 131 3 4 3 0 5 5 166 LERIBE 10 329 5 14 3 0 20 31 412 BEREA 8 141 4 7 1 1 9 49 220 MASERU 11 194 8 10 2 2 15 231 473 MAFETENG 15 176 11 7 1 2 8 9 229 MOHALE’S HOEK 12 166 7 7 3 0 7 13 215 QUTHING 8 77 5 3 2 1 6 11 113 QACHA’S NEK 8 105 2 7 1 0 1 3 127 MOKHOTLONG 6 108 0 3 0 0 2 2 121 THABA-TSEKA 10 179 4 5 0 0 5 8 211 Total 103 1606 49 67 16 6 78 362 2287
11
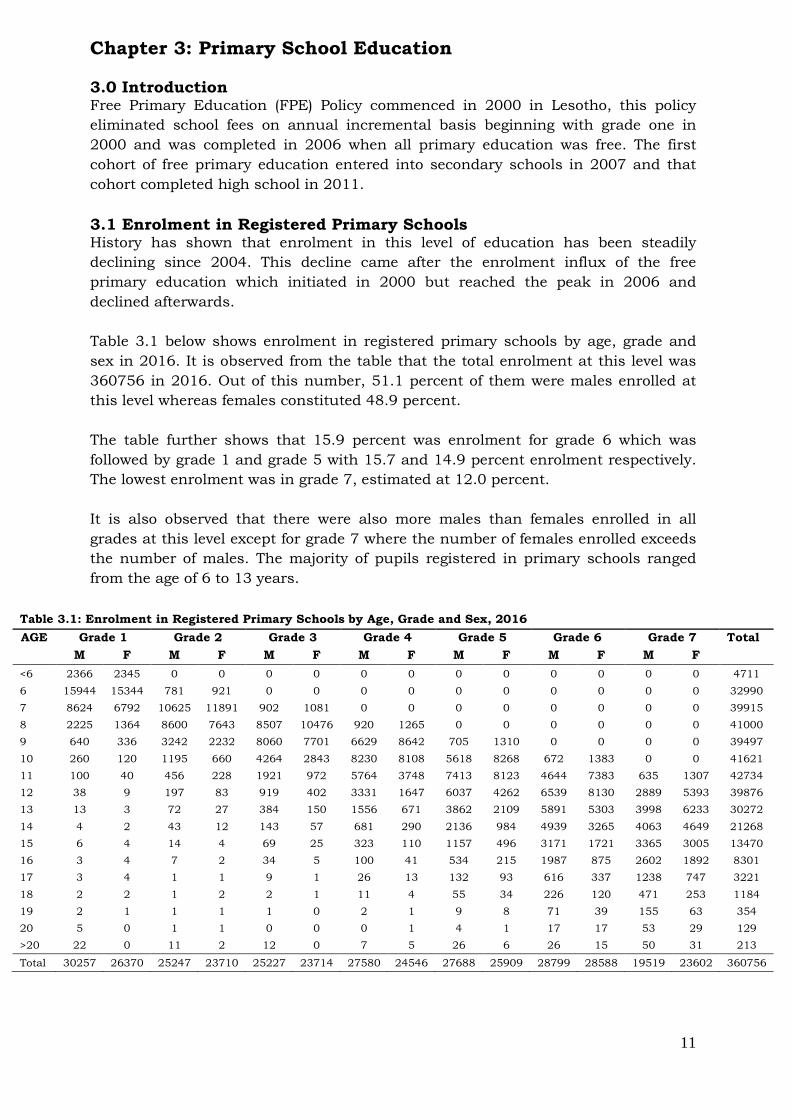
Chapter 3: Primary School Education 3.0 Introduction Free Primary Education (FPE) Policy commenced in 2000 in Lesotho, this policy eliminated school fees on annual incremental basis beginning with grade one in 2000 and was completed in 2006 when all primary education was free. The first cohort of free primary education entered into secondary schools in 2007 and that cohort completed high school in 2011. 3.1 Enrolment in Registered Primary Schools History has shown that enrolment in this level of education has been steadily declining since 2004. This decline came after the enrolment influx of the free primary education which initiated in 2000 but reached the peak in 2006 and declined afterwards. Table 3.1 below shows enrolment in registered primary schools by age, grade and sex in 2016. It is observed from the table that the total enrolment at this level was 360756 in 2016. Out of this number, 51.1 percent of them were males enrolled at this level whereas females constituted 48.9 percent. The table further shows that 15.9 percent was enrolment for grade 6 which was followed by grade 1 and grade 5 with 15.7 and 14.9 percent enrolment respectively. The lowest enrolment was in grade 7, estimated at 12.0 percent. It is also observed that there were also more males than females enrolled in all grades at this level except for grade 7 where the number of females enrolled exceeds the number of males. The majority of pupils registered in primary schools ranged from the age of 6 to 13 years.
Table 3.1: Enrolment in Registered Primary Schools by Age, Grade and Sex, 2016 AGE Grade 1 Grade 2 Grade 3 Grade 4 Grade 5 Grade 6 Grade 7 Total
M F M F M F M F M F M F M F <6 2366 2345 0 0 0 0 0 0 0 0 0 0 0 0 4711 6 15944 15344 781 921 0 0 0 0 0 0 0 0 0 0 32990 7 8624 6792 10625 11891 902 1081 0 0 0 0 0 0 0 0 39915 8 2225 1364 8600 7643 8507 10476 920 1265 0 0 0 0 0 0 41000 9 640 336 3242 2232 8060 7701 6629 8642 705 1310 0 0 0 0 39497 10 260 120 1195 660 4264 2843 8230 8108 5618 8268 672 1383 0 0 41621 11 100 40 456 228 1921 972 5764 3748 7413 8123 4644 7383 635 1307 42734 12 38 9 197 83 919 402 3331 1647 6037 4262 6539 8130 2889 5393 39876 13 13 3 72 27 384 150 1556 671 3862 2109 5891 5303 3998 6233 30272 14 4 2 43 12 143 57 681 290 2136 984 4939 3265 4063 4649 21268 15 6 4 14 4 69 25 323 110 1157 496 3171 1721 3365 3005 13470 16 3 4 7 2 34 5 100 41 534 215 1987 875 2602 1892 8301 17 3 4 1 1 9 1 26 13 132 93 616 337 1238 747 3221 18 2 2 1 2 2 1 11 4 55 34 226 120 471 253 1184 19 2 1 1 1 1 0 2 1 9 8 71 39 155 63 354 20 5 0 1 1 0 0 0 1 4 1 17 17 53 29 129 >20 22 0 11 2 12 0 7 5 26 6 26 15 50 31 213
Total 30257 26370 25247 23710 25227 23714 27580 24546 27688 25909 28799 28588 19519 23602 360756

12
Table 3.2 shows the distribution of enrolment in registered primary schools by grade, sex and year starting from 2012 up to 2016. As indicated earlier, enrolment in primary schools has been showing a declining trend for some years now. This is shown in the table below. Table 3.2: Enrolment in Registered Primary Schools by Grade, Sex and Year, 2012-2016 Grade 2012 2013 2014 2015 2016
M F M F M F M F M F
1 36438 31033 31816 27762 29218 26082 29839 26555 30257 26370
2 32229 27976 30595 26524 27079 24574 24739 23120 25247 23710
3 30265 26462 30298 26797 29624 26132 26435 23937 25227 23714
4 29931 26958 30216 26784 33945 28962 29491 26071 27580 24546
5 25713 26078 25242 25544 26440 25867 32365 28981 27688 25909
6 21860 24962 21801 24423 21961 24583 23452 24977 28799 28588
7 18413 23372 18082 23585 18339 23242 18411 23264 19519 23602
Total 194,849 186,841 188,050 181,419 186,606 179,442 184,732 176,905 184,317 176,439
Sex Ratio (F/M) 0.95523 0.9589 0.9647 0.9576 0.9573
TOTAL 385,437 381,690 369,469 361,637 360,756
Table 3.3 shows enrolment in registered primary schools by district, sex and years from 2014 to 2016. The highest number of pupils were enrolled in Maseru with 82,940 (23.0 percent), followed by Leribe with 55,548 pupils (15.4 percent) and the least were in Qacha’s Nek with 14,574 (4.0 percent). The table further reveals that during these three years period, the total enrolment has been declining from 366,048 in 2014 to 360,756 in 2016. For all the districts, enrolment in primary schools declined between 2014 and 2016, except for Botha-Bothe and while enrolment in Leribe increased only between 2014 and 2015.
Table 3.4 shows enrolment in registered primary schools by district, geographical location and sex of learners. In general, it is shown that majority of primary school
Table 3.3: Enrolment in Registered Primary Schools by District, Sex and Year, 2014- 2016
District 2014 2015 2016 M F Total M F Total M F Total
Botha-Bothe 11436 10823 22259 11479
10808 22287 11776 11159 22935 Leribe 28910 27005 55915 28975 26945 55920 28859 26689 55548 Berea 23265 21336 44601 23029 20915 43944 22929 20726 43655
Maseru 42407 40080 82487 42098 39752 81850 42493 40447 82940
Mafeteng 19296 17806 37102 18943 17208 36151 18627 16956 35583
Mohale’s Hoek 16333 16010 32343 16058 15799 31857 15904 15446 31350
Quthing 11228 10846 22074 11089 10675 21764 10940 10477 21417
Qacha’s Nek 7870 7510 15380 7631 7284 14915 7445 7129 14574
Mokhotlong 10997 11886 22883 10961 11751 22712 10907 11770 22677
Thaba-Tseka 14864 16140 31004 14469 15768 30237 14437 15640 30077 Total 186606 179442 366048 184732 176905 361637 184317 176439 360756
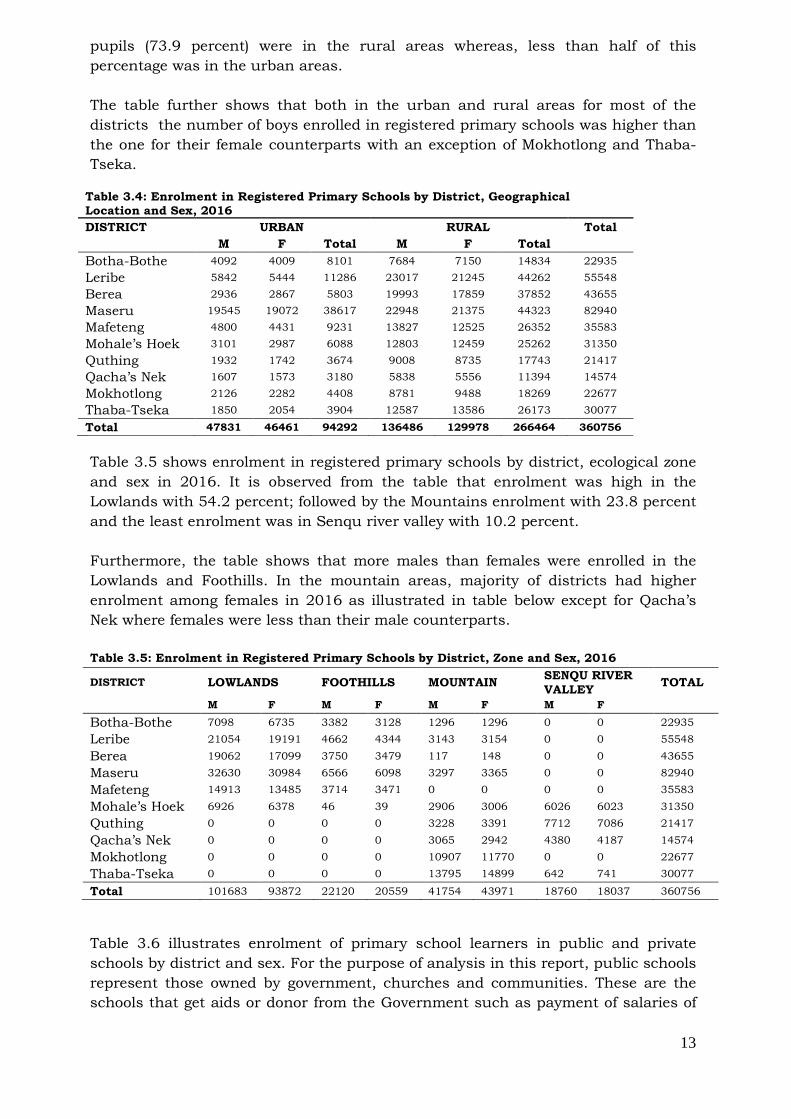
13
pupils (73.9 percent) were in the rural areas whereas, less than half of this percentage was in the urban areas. The table further shows that both in the urban and rural areas for most of the districts the number of boys enrolled in registered primary schools was higher than the one for their female counterparts with an exception of Mokhotlong and Thaba-Tseka.
Table 3.4: Enrolment in Registered Primary Schools by District, Geographical Location and Sex, 2016 DISTRICT URBAN RURAL Total M F Total M F Total Botha-Bothe 4092 4009 8101 7684 7150 14834 22935 Leribe 5842 5444 11286 23017 21245 44262 55548 Berea 2936 2867 5803 19993 17859 37852 43655 Maseru 19545 19072 38617 22948 21375 44323 82940 Mafeteng 4800 4431 9231 13827 12525 26352 35583 Mohale’s Hoek 3101 2987 6088 12803 12459 25262 31350 Quthing 1932 1742 3674 9008 8735 17743 21417 Qacha’s Nek 1607 1573 3180 5838 5556 11394 14574 Mokhotlong 2126 2282 4408 8781 9488 18269 22677 Thaba-Tseka 1850 2054 3904 12587 13586 26173 30077
Total 47831 46461 94292 136486 129978 266464 360756
Table 3.5 shows enrolment in registered primary schools by district, ecological zone and sex in 2016. It is observed from the table that enrolment was high in the Lowlands with 54.2 percent; followed by the Mountains enrolment with 23.8 percent and the least enrolment was in Senqu river valley with 10.2 percent. Furthermore, the table shows that more males than females were enrolled in the Lowlands and Foothills. In the mountain areas, majority of districts had higher enrolment among females in 2016 as illustrated in table below except for Qacha’s Nek where females were less than their male counterparts. Table 3.5: Enrolment in Registered Primary Schools by District, Zone and Sex, 2016
DISTRICT LOWLANDS FOOTHILLS MOUNTAIN SENQU RIVER VALLEY TOTAL
M F M F M F M F
Botha-Bothe 7098 6735 3382 3128 1296 1296 0 0 22935
Leribe 21054 19191 4662 4344 3143 3154 0 0 55548
Berea 19062 17099 3750 3479 117 148 0 0 43655
Maseru 32630 30984 6566 6098 3297 3365 0 0 82940
Mafeteng 14913 13485 3714 3471 0 0 0 0 35583
Mohale’s Hoek 6926 6378 46 39 2906 3006 6026 6023 31350
Quthing 0 0 0 0 3228 3391 7712 7086 21417
Qacha’s Nek 0 0 0 0 3065 2942 4380 4187 14574
Mokhotlong 0 0 0 0 10907 11770 0 0 22677
Thaba-Tseka 0 0 0 0 13795 14899 642 741 30077
Total 101683 93872 22120 20559 41754 43971 18760 18037 360756
Table 3.6 illustrates enrolment of primary school learners in public and private schools by district and sex. For the purpose of analysis in this report, public schools represent those owned by government, churches and communities. These are the schools that get aids or donor from the Government such as payment of salaries of

14
teachers, renovation and construction of classrooms and provision of other facilities. Private schools on the other hand function independent of the Government aid but observe the government stipulated curriculum or follow its guidelines closely if an alternative curriculum is used. It is shown from the table that 98.0 percent of pupils were enrolled in public schools while only 2.0 percent was enrolled in private schools. Amongst all districts, the number of males enrolled in public primary schools was higher than the enrolment for females, except for Mokhotlong and Thaba-Tseka where the number of females enrolled in public primary schools outnumbered that of males. The table further shows that within the private schools, some districts such as Mohale’s Hoek, Quthing, Qacha’s Nek, Mokhotlong and Thaba-Tseka did not have the private primary schools in 2016. Enrolment of males in private primary schools was slightly higher than that of females in Berea and Botha-Bothe while enrolment of females was slightly higher than that of males in Leribe, Mafeteng and Maseru. Table 3.6: Enrolment in Registered Public and Private Schools by District and Sex, 2016
DISTRICT PUBLIC PRIVATE TOTAL M F T M F T
Botha-Bothe 11552 10936 22488 224 223 447 22935
Leribe 28236 26057 54293 623 632 1255 55548
Berea 22457 20264 42721 472 462 934 43655
Maseru 40570 38425 78995 1923 2022 3945 82940
Mafeteng 18315 16640 34955 312 316 628 35583
Mohale’s Hoek 15904 15446 31350 0 0 0 31350
Quthing 10940 10477 21417 0 0 0 21417
Qacha’s Nek 7445 7129 14574 0 0 0 14574
Mokhotlong 10907 11770 22677 0 0 0 22677
Thaba-Tseka 14437 15640 30077 0 0 0 30077
Total 180763 172784 353547 3554 3655 7209 360756

15
Table 3.7 illustrates enrolment in registered primary schools by district, agency and sex in 2016. It is observed from the table that enrolment was highest in LEC primary schools with 119,252 pupils; followed by RCM with 116,691 pupils and least number of pupils was in AME with 3,717 pupils. In disaggregating enrolment by agency and sex, a similar pattern in the previous analysis by sex is observed where enrolment of males dominated the enrolment for females in all the agencies in this case except for other churches schools and private schools where females were more than their male counterparts. Table 3.7: Enrolment in Registered Primary Schools by District, Agency and Sex, 2016 DISTRICT GVT COMMUNITY LEC RCM ACL AME OTHER PRIVATE Total M F M F M F M F M F M F M F M F Botha-Bothe 604 617 1248 1238 4292 3912 2959 2801 1764 1530 200 215 485 623 224 223 22935
Leribe 2063 1884 1748 1574 9124 8270 8189 7662 5239 4709 286 274 1587 1684 623 632 55548 Berea 3190 2813 533 559 7000 6263 8606 7591 2127 2028 0 0 1001 1010 472 462 43655 Maseru 4363 3939 4240 4310 12692 11500 12973 12462 3635 3542 327 278 2340 2394 1923 2022 82940 Mafeteng 1751 1577 544 568 7631 6822 5490 4849 1898 1787 357 374 644 663 312 316 35583 Mohale’s Hoek
1803 1515 526 550 5851 5596 4951 5091 1494 1438 157 104 1122 1152 0 0 31350
Quthing 1099 1166 0 0 5183 4871 3146 2914 1433 1458 0 0 79 68 0 0 21417 Qacha’s Nek 1043 1019 0 0 2932 2798 2558 2416 844 839 68 57 0 0 0 0 14574
Mokhotlong 1128 1067 0 0 3575 3838 4308 4809 1162 1224 504 516 230 316 0 0 22677
Thaba-Tseka 2634 2996 988 1093 3390 3712 6267 6649 891 896 0 0 267 294 0 0 30077
Total 19678 18593 9827 9892 61670 57582 59447 57244 20487 19451 1899 1818 7755 8204 3554 3655 360756

16
3.1.1 Accessibility of Education Accessibility is defined as the proportion of children who have access to schooling out of all children of admission age at the corresponding grade, which is age 6 for grade 1 (primary school) admission in Lesotho. In this section, the extent of access to the first grade of primary education is discussed in detail. 3.1.1.1 New Entrants in Registered Primary Schools Figure 3.1 below shows the enrolment of new entrants in registered primary schools by age and sex. History has shown that since the year 2009, the number of new entrants for boys has been higher than that of their female counterparts. This is also observed in the year 2016 where the percentage of new male enrollees stood at 52.8 percent and females were 47.2 percent. The figure portrays that enrolment of new entrants was at the peak precisely at the age of six (the official admission age) for both boys and girls. Afterwards enrolment for both sexes drastically dropped until it was almost zero at ages 10 and upwards with male’s enrolment being slightly higher. Figure 3.1: Enrolment of New Entrants in Registered Primary Schools by Age and Sex, 2016
Table (3.8) shows the enrolment of new pupils in registered primary schools by district and sex in 2016. It is shown in the table that enrolment of new entrants has a similar pattern to that of the total enrolment in registered primary schools as it is observed that even for the new entrants, Maseru was leading with 23.0 percent of new entrants. It was followed by Leribe with 15.3 percent; then Berea and Mafeteng with 12.6 and 9.3 percent.

17
Table 3.8: New Entrants in Primary Schools by District and Sex, 2016 District Male Male
(%) Female Female
(%) Total
BOTHA-BOTHE 1567 5.7 1552 6.3 3119
LERIBE 4241 15.4 3749 15.3 7990 BEREA 3533 12.9 3038 12.4 6571 MASERU 6198 22.5 5764 23.5 11962 MAFETENG 2604 9.5 2223 9.0 4827 MOHALE’S HOEK 2524 9.2 2186 8.9 4710 QUTHING 1561 5.7 1381 5.6 2942 QACHA’S NEK 1033 3.8 880 3.6 1913 MOKHOTLONG 1835 6.7 1634 6.6 3469 THABA-TSEKA 2393 8.7 2167 8.8 4560
Total 27489 100.0 24574 100.0 52063
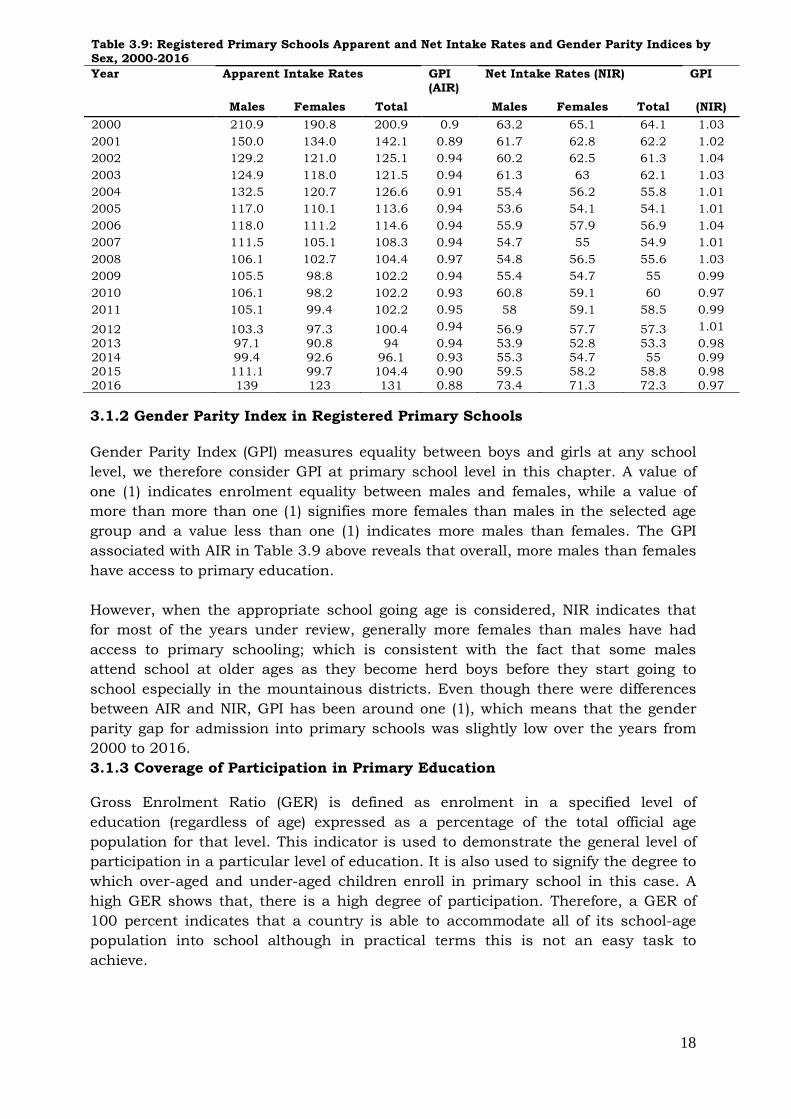
3.1.1.2 Registered Primary Schools Apparent Intake Rates (AIR) and Net Intake Rates (NIR) The Apparent Intake Rates (AIR) and Net Intake Rates (NIR) for Lesotho from 2000 to 2016 are shown in Table 3.9. The Apparent and Net intake rates indicate accessibility of new entrants of a particular entering age for a particular grade, out of all children of admission age at the corresponding grade, which is age 6 in Lesotho for primary schools. The two ratios are essential to policy-makers and planners because they specify the degree of accessibility of primary school education. AIR is a crude measure because it considers all new entrants irrespective of age while NIR accounts for official entrance age for new entrants. The Apparent Intake Rate (AIR) was highest in the year 2000 (200.9 percent) as seen in Table 3.9, and in the following years it decreased continuously until 2008 then remained steady at 102.2 from 2009 to 2011 but subsequently decreased in the following years. The year 2000 recorded a massive AIR due to the commencement of free primary education which resulted in high enrolment and as a result of the introduction of compulsory education in primary in 2012, AIR continued to be high; however, it fell to 94 in 2013. Sex comparison in AIR indicates that historically more males had access to primary education than females. In 2015, AIR increased to 104.4 and further rose to 131 in 2016. Net Intake Rate (NIR) on the other hand, has been steady increasing since 2013 to date ranging between 53.3 and 72.3 percent. Unlike AIR which has been in favour of boys, NIR demonstrates that girls of primary school going age had more access than boys to primary education for most of the years from 2000 to 2016.
18
Table 3.9: Registered Primary Schools Apparent and Net Intake Rates and Gender Parity Indices by Sex, 2000-2016 Year Apparent Intake Rates GPI
(AIR) Net Intake Rates (NIR) GPI
Males Females Total Males Females Total (NIR) 2000 210.9 190.8 200.9 0.9 63.2 65.1 64.1 1.03 2001 150.0 134.0 142.1 0.89 61.7 62.8 62.2 1.02 2002 129.2 121.0 125.1 0.94 60.2 62.5 61.3 1.04 2003 124.9 118.0 121.5 0.94 61.3 63 62.1 1.03 2004 132.5 120.7 126.6 0.91 55.4 56.2 55.8 1.01 2005 117.0 110.1 113.6 0.94 53.6 54.1 54.1 1.01 2006 118.0 111.2 114.6 0.94 55.9 57.9 56.9 1.04 2007 111.5 105.1 108.3 0.94 54.7 55 54.9 1.01 2008 106.1 102.7 104.4 0.97 54.8 56.5 55.6 1.03 2009 105.5 98.8 102.2 0.94 55.4 54.7 55 0.99 2010 106.1 98.2 102.2 0.93 60.8 59.1 60 0.97 2011 105.1 99.4 102.2 0.95 58 59.1 58.5 0.99
2012 103.3 97.3 100.4 0.94 56.9 57.7 57.3 1.01 2013 2014 2015 2016
97.1 99.4 111.1 139
90.8 92.6 99.7 123
94 96.1 104.4 131
0.94 0.93 0.90 0.88
53.9 55.3 59.5 73.4
52.8 54.7 58.2 71.3
53.3 55
58.8 72.3
0.98 0.99 0.98 0.97
3.1.2 Gender Parity Index in Registered Primary Schools Gender Parity Index (GPI) measures equality between boys and girls at any school level, we therefore consider GPI at primary school level in this chapter. A value of one (1) indicates enrolment equality between males and females, while a value of more than more than one (1) signifies more females than males in the selected age group and a value less than one (1) indicates more males than females. The GPI associated with AIR in Table 3.9 above reveals that overall, more males than females have access to primary education. However, when the appropriate school going age is considered, NIR indicates that for most of the years under review, generally more females than males have had access to primary schooling; which is consistent with the fact that some males attend school at older ages as they become herd boys before they start going to school especially in the mountainous districts. Even though there were differences between AIR and NIR, GPI has been around one (1), which means that the gender parity gap for admission into primary schools was slightly low over the years from 2000 to 2016. 3.1.3 Coverage of Participation in Primary Education Gross Enrolment Ratio (GER) is defined as enrolment in a specified level of education (regardless of age) expressed as a percentage of the total official age population for that level. This indicator is used to demonstrate the general level of participation in a particular level of education. It is also used to signify the degree to which over-aged and under-aged children enroll in primary school in this case. A high GER shows that, there is a high degree of participation. Therefore, a GER of 100 percent indicates that a country is able to accommodate all of its school-age population into school although in practical terms this is not an easy task to achieve.
19
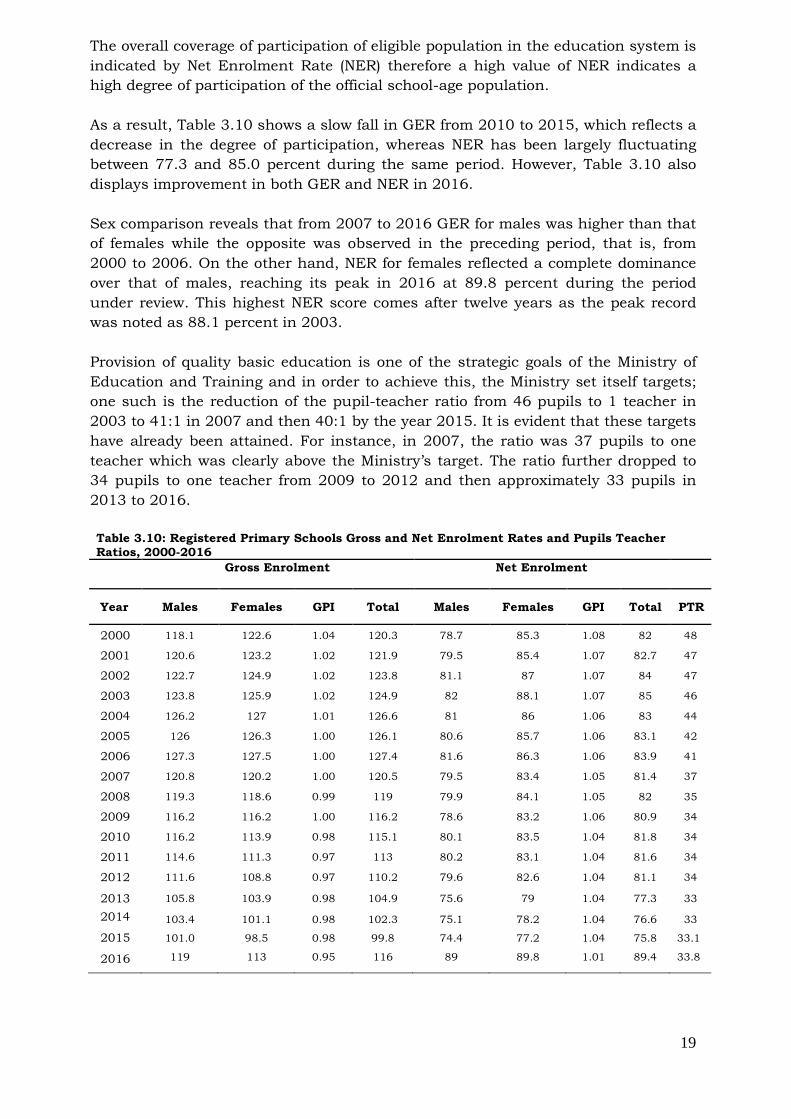
The overall coverage of participation of eligible population in the education system is indicated by Net Enrolment Rate (NER) therefore a high value of NER indicates a high degree of participation of the official school-age population. As a result, Table 3.10 shows a slow fall in GER from 2010 to 2015, which reflects a decrease in the degree of participation, whereas NER has been largely fluctuating between 77.3 and 85.0 percent during the same period. However, Table 3.10 also displays improvement in both GER and NER in 2016. Sex comparison reveals that from 2007 to 2016 GER for males was higher than that of females while the opposite was observed in the preceding period, that is, from 2000 to 2006. On the other hand, NER for females reflected a complete dominance over that of males, reaching its peak in 2016 at 89.8 percent during the period under review. This highest NER score comes after twelve years as the peak record was noted as 88.1 percent in 2003. Provision of quality basic education is one of the strategic goals of the Ministry of Education and Training and in order to achieve this, the Ministry set itself targets; one such is the reduction of the pupil-teacher ratio from 46 pupils to 1 teacher in 2003 to 41:1 in 2007 and then 40:1 by the year 2015. It is evident that these targets have already been attained. For instance, in 2007, the ratio was 37 pupils to one teacher which was clearly above the Ministry’s target. The ratio further dropped to 34 pupils to one teacher from 2009 to 2012 and then approximately 33 pupils in 2013 to 2016. Table 3.10: Registered Primary Schools Gross and Net Enrolment Rates and Pupils Teacher Ratios, 2000-2016
Gross Enrolment
Net Enrolment
Year Males Females GPI Total Males Females GPI Total PTR
2000 118.1 122.6 1.04 120.3 78.7 85.3 1.08 82 48
2001 120.6 123.2 1.02 121.9 79.5 85.4 1.07 82.7 47
2002 122.7 124.9 1.02 123.8 81.1 87 1.07 84 47
2003 123.8 125.9 1.02 124.9 82 88.1 1.07 85 46
2004 126.2 127 1.01 126.6 81 86 1.06 83 44
2005 126 126.3 1.00 126.1 80.6 85.7 1.06 83.1 42
2006 127.3 127.5 1.00 127.4 81.6 86.3 1.06 83.9 41
2007 120.8 120.2 1.00 120.5 79.5 83.4 1.05 81.4 37
2008 119.3 118.6 0.99 119 79.9 84.1 1.05 82 35
2009 116.2 116.2 1.00 116.2 78.6 83.2 1.06 80.9 34
2010 116.2 113.9 0.98 115.1 80.1 83.5 1.04 81.8 34
2011 114.6 111.3 0.97 113 80.2 83.1 1.04 81.6 34
2012 111.6 108.8 0.97 110.2 79.6 82.6 1.04 81.1 34
2013 105.8 103.9 0.98 104.9 75.6 79 1.04 77.3 33
2014
2015
2016
103.4
101.0
119
101.1
98.5
113
0.98
0.98
0.95
102.3
99.8
116
75.1
74.4
89
78.2
77.2
89.8
1.04
1.04
1.01
76.6
75.8
89.4
33
33.1
33.8

20
Table 3.11 summarizes pupil teacher ratios (PTR) for 2016 by districts. It is observed from the table that the pupil teacher ratio for registered primary schools in general was estimated at 33.8 pupils per teacher. It ranged from 29.9 in Qacha’s Nek to 39.5 pupils per teacher in Mokhotlong. Table 3.11: Pupils Enrolled in Registered Primary Schools by District, 2016
District Enrolment Teachers PTR
M F Total M F Total Total
BOTHA-BOTHE 11776 11159 22935 162 544 706 32.5 LERIBE 28859 26689 55548 359 1320 1679 33.1 BEREA 22929 20726 43655 287 999 1286 33.9 MASERU 42493 40447 82940 545 1791 2336 35.5 MAFETENG 18627 16956 35583 321 809 1130 31.5 MOHALE’S HOEK 15904 15446 31350 274 753 1027 30.5 QUTHING 10940 10477 21417 173 508 681 31.4 QACHA’S NEK 7445 7129 14574 130 357 487 29.9 MOKHOTLONG 10907 11770 22677 165 409 574 39.5 THABA-TSEKA 14437 15640 30077 253 528 781 38.5 Total 184317 176439 360756 2669 8018 10687 33.8
3.2 Disability in Registered Primary Schools Out of the total enrolment of 360,756 in registered primary schools in 2016, about 18,232 were pupils with the special educational needs. This implies that 5.1 percent of them had some form of disability in 2016. Table 3.12 below shows enrolment of pupils with special educational needs in registered primary schools by type of disability, grade and sex in 2016. It can be seen from the table that intellectual disability accounted for 55.1 percent of the pupils with disability, followed by visual impairment with 20.6 percent and the form of disability with less pupils is physical disability with 5.9 percent. It should be noted that intellectual disability includes forms of learning difficulty, epilepsy and mental retardation.
Table 3.12: Enrolment of Pupils with Special Educational Needs in registered Primary by type of disability, Grade, 2016 Disability Type Grade 1 Grade 2 Grade 3 Grade 4 Grade 5 Grade 6 Grade 7 Total
M F M F M F M F M F M F M F Physical Disability 120 91 93 69 75 60 93 63 72 56 92 96 51 49 1080
Visual Impairment 205 153 241 160 272 175 353 269 422 299 394 319 230 266 3758
Hearing Impairment 126 74 97 69 123 105 186 163 180 230 208 204 105 142 2012
Intellectual Disability 624 390 692 420 883 530 1183 632 1164 708 1112 715 580 409 10042
Other 134 65 125 64 122 70 118 82 123 73 112 94 94 64 1340
Total 1209 773 1248 782 1475 940 1933 1209 1961 1366 1918 1428 1060 930 18232
Table 3.13 shows enrolment of pupils with special educational needs by age, grade and sex in 2016. There were more learners with disability around the ages of 10, 11

21
and 12. The number of pupils with special needs was increasing from grade 1 to grade 6 and decreases from grade 6 to grade 7. Of the 18,232 pupils with disability, the highest number of pupils with disability was in grade 6 with 18.4 percent while the least number of learners with special needs were in grade 1 with 10.9 percent.
Table 3.13: Enrolment of Pupils with Special Needs in Registered Primary Schools by Age, Grade and Sex, 2016
AGE Grade 1 Grade 2 Grade 3 Grade 4 Grade 5 Grade 6 Grade 7 Total M F M F M F M F M F M F M F
<6 38 36 0 0 0 0 0 0 0 0 0 0 0 0 74 6 558 363 31 14 0 0 0 0 0 0 0 0 0 0 966 7 329 188 411 275 35 27 0 0 0 0 0 0 0 0 1265 8 156 87 424 280 417 307 50 41 0 0 0 0 0 0 1762 9 42 32 198 96 427 264 381 345 41 48 0 0 0 0 1874 10 41 26 97 51 273 160 520 324 346 317 41 58 0 0 2254 11 25 17 39 27 154 73 395 195 471 328 211 232 28 46 2241 12 5 5 24 21 68 46 272 119 379 246 330 291 107 140 2053 13 0 4 9 9 43 25 141 69 308 170 330 238 144 175 1665 14 5 1 8 3 16 10 89 53 201 104 354 207 166 153 1370 15 4 4 5 0 23 17 48 33 100 62 257 140 195 127 1015 16 2 3 0 1 8 6 25 17 68 40 188 116 160 116 750 17 3 3 2 2 6 2 6 5 21 22 91 66 116 82 427 18 1 3 0 1 2 3 5 2 14 12 47 36 81 43 250 19 0 1 0 1 0 0 1 0 6 3 27 17 24 17 97 20 0 0 0 0 0 0 0 1 5 5 22 11 15 15 74 >20 0 0 0 1 3 0 0 5 1 9 20 16 24 16 95
Total 1209 773 1248 782 1475 940 1933 1209 1961 1366 1918 1428 1060 930 18232
3.3 Orphan-hood in Registered Primary Schools Out of the total enrolment of 360,756 in 2016, there were 89,466 pupils enrolled in registered primary schools who had either lost one or both parents through death. Table 3.14 shows enrolment of orphans in registered primary schools by type of orphan-hood, grade and sex in 2016. It is observed from the table that the percentage of paternal orphans was leading with 59.2 percent of all the orphans in registered primary schools; then followed maternal orphans with 21.4 percent and double orphans with 19.4 percent. The table further shows that majority of orphans were males in all the grades except in Grade 6 and 7.
Note: Paternal = Father deceased; Maternal = Mother deceased; Double = Both Parents deceased. Table3.15 presents enrolment of orphans in registered primary schools by age, sex and grade. It is observed from the table that there were more male orphans in the
Table 3.14: Enrolment of Orphans in Registered Primary Schools by Type, grade and Sex, 2016
Type GRADE 1 GRADE 2 GRADE 3 GRADE 4 GRADE 5 GRADE 6 GRADE 7 Total M F M F M F M F M F M F M F Paternal 2898 2325 2834 2619 3402 3020 4213 3598 4623 4265 5174 5255 3960 4802 52988 Maternal 1006 886 1021 923 1126 1125 1468 1213 1723 1591 1969 1948 1390 1726 19115 Double 644 558 669 551 871 691 1239 985 1677 1324 2093 2052 1821 2188 17363
Total 4548 3769 4524 4093 5399 4836 6920 5796 8023 7180 9236 9255 7171 8716 89466

22
lower grades (1 to 5), than female orphans while the number of female orphans outnumbered that of males in the higher grades. It is also shown that there were a fewer number of orphans in the lower grades and more orphans in the upper grades. This has been the observation for the previous five years.
Figure 3.2 presents the percentage distribution of orphans in registered primary school by age and sex in 2016. It is observed from the figure that majority of orphans were at ages 10 to 13 for both sexes. It can also be seen that for both sexes, the number of orphans has been increasing from age less than 6 to 12 years of age, then declines from age 13. Figure 3.2: Percentage Distribution of orphans by Sex and Age in 2016
Table 3.15: Orphans in Registered Primary Schools by Age, Grade and Sex, 2016
AGE Grade 1 Grade 2 Grade 3 Grade 4 Grade 5 Grade 6 Grade 7 Total M F M F M F M F M F M F M F
<6 244 207 0 0 0 0 0 0 0 0 0 0 0 0 451
6 2263 2099 95 115 0 0 0 0 0 0 0 0 0 0 4572
7 1323 1020 1672 1932 148 151 0 0 0 0 0 0 0 0 6246
8 456 298 1556 1280 1579 1958 134 175 0 0 0 0 0 0 7436
9 162 91 673 511 1617 1537 1401 1875 142 274 0 0 0 0 8283
10 65 41 294 162 1017 684 1929 1806 1352 1947 161 294 0 0 9752
11 19 9 115 50 524 294 1575 1059 1895 2145 1133 1897 130 279 11124
12 5 1 68 28 266 121 998 528 1783 1324 1918 2532 839 1596 12007
13 4 0 26 9 125 54 472 211 1373 766 1988 1877 1302 2144 10351
14 3 0 13 3 65 22 236 85 773 397 1791 1293 1508 1965 8154
15 4 1 3 1 31 8 115 36 430 194 1143 725 1366 1336 5393
16 0 0 5 0 17 5 38 12 192 91 725 382 1107 843 3417
17 0 0 2 0 6 0 14 5 54 27 259 152 580 365 1464
18 0 2 1 1 1 2 5 3 19 10 72 61 228 121 526
19 0 0 0 0 1 0 2 0 6 0 26 26 70 37 168
20 0 0 0 0 0 0 0 1 2 1 9 8 24 18 63
>20 0 0 1 1 2 0 1 0 2 4 11 8 17 12 59 Total 4548 3769 4524 4093 5399 4836 6920 5796 8023 7180 9236 9255 7171 8716 89466

23
3.4 Inputs for Primary Education The Ministry of Education and Training values inputs to primary education as key to shifting this level to the higher step. To ensure the support to primary education, the Ministry’s huge responsibility comprises of provision of appropriate buildings, qualified teachers, sufficient facilities and education materials to increase the accessibility of schools and achieve sustainable enrolment gains at this level of education. 3.4.1 Primary Schools During the past century, the majority of the schools in the country belonged to the churches and community. Nowadays, with the Ministry’s huge responsibility there are more schools owned by Government and those that are privately owned. Despite the fact that provision of quality education is a joint responsibility between agencies, the government is hugely responsible for the payment of teachers and provision of financial support for most of these registered schools belonging to churches, the community and government itself. Figure 3.3 presents the percentage share of registered primary schools and agencies in 2016. It is observed from the figure that RCM had the majority of the registered primary schools with 34 percent, followed by LEC with 32 percent and schools registered privately were the least with 1 percent. In general, most primary schools were owned by churches. Figure 3.3: Percentage Share of Registered Primary Schools and Agency, 2016
GOVERNMENT11%
COMMUNITY4%
LEC32%
RCM34%
ACL12%
AME2%
OTHER4%
PRIVATE1%

24
Table 3.16 shows the enrolment in registered primary schools, number of schools, number of teachers and percentage change in enrolment from 2007 to 2016.The table demonstrates that primary school enrolment decreased from 400,934 in 2007 to 360,756 in 2016.The table further indicates that the total number of primary schools increased continuously from 1,455 in 2006 to 1,473 in 2010. The number of schools fluctuated until it stood at 1,478 in 2016. It should be noted that these are the schools that have responded to the annual survey and were operational during data collection period for these ten years. Some of the schools that were not operational were schools that were not officially shut down or closed but rather none-operational because they had no students enrolled in the first and the second quarters of school calendar during data collection. It should be noted that reduced number of schools may not necessarily mean reduction of registered schools, but since Government has been building schools in the remote and hard to walk by children to reduce long walking- distances by children to schools; and so children leave their old schools which are further off to attend new government schools, which are also better equipped with facilities and teaching staff, which leaves old schools with little or no children. Physical access to schools in the mountainous and remote areas where average walking time is over one hour is a major challenge particularly for children from food insecure households. Evidence provided by WFP baseline survey in 2004 indicated that the rations provided at the schools were often the only full meals children have during the day, especially during lean periods and in years with bad harvest. Table 3.16 furthermore shows that number of orphans enrolled in primary school level have been high as it constituted 24.8 percent of the total enrolment in 2016. Evidently, free primary education has facilitated access to education for many orphans at this level of education. It is further shown that the number of pupils with special educational needs in registered primary schools has been higher over the years under observation, however lower than that of orphans. For instance, this group of pupils accounted for 5.1 percent in 2016.

25
Table 3.17 presents the distribution of schools by district and ecological zone. As a result, it is observed that in general, out of 1,478 registered primary schools in 2016, majority of them which is represented by 42.2percent were in the lowlands; this percentage was followed by the one for mountains with 29.7 percent. The Senqu river valley and foot hills accounted for 15.8 and 12.5 percent of schools respectively.
It is further observed from the table that within the Lowlands, Maseru had the highest number of schools (154); it was followed by Leribe with 135 and then Mafeteng with 123 while Berea had 114 registered primary schools in this ecological zone. It is further observed that from Quthing to Thaba-Tseka there were no Lowlands or no schools in the Lowlands.
In the Foothills, majority of schools were also in Maseru (64); it was followed by Mafeteng with 35 schools; Leribe with 33; Botha-Bothe with 28 and lastly Berea with 24 schools; whereas; the rest of the districts had no Foothills or no schools in that Ecological zone. Berea had only one (1) school in the Mountains while Mafeteng had no school in the Mountains or there are no Mountainous areas in that district. Botha-Bothe had 12 schools in the same Ecological zone. On the other hand, Thaba-Tseka and Mokhotlong accounted respectively for 30.4 and 24.1 percent of schools in the Mountains of Lesotho. There are only four districts with the Senqu River Valley; Namely; Mohale’s Hoek; Quthing and Qacha’s Nek and their respective percentages ranged from 3.5 to 39.1.
Table 3.16: Registered Primary School Enrolment, Number of Schools, Number of Teachers and Percentage Change in Enrolment, 2007-2016 Indicators 2007 2008 2009 2010 2011 2012 2013 2014 2015 2016
Enrolment 400934 396041 389424 388681 385437 381690 369469 366048 361637 360756 % Change in Enrolment
-5.6 -1.2 -1.7 -0.2 -0.8 -1 -3.2 -0.9 -0.01 -0.2
Number of schools 1455 1472 1479 1473 1468 1469 1472 1477 1478 1478
Number of teachers 10778 11301 11536 11508 11378 11200 11324 11164 10932 10687
Number of Orphans 111335 121175 121155 120463 116558 122178 115379 110825 94333 89466
Number of Pupils with Special needs
20359 20301 20527 20490 20635 19682 20100 20357 18951 18232

26
Table 3.17: Registered Primary Schools by District and Ecological Zones, 2016 DISTRICT LOWLANDS FOOTHILLS MOUNTAIN S R V Total BOTHA-BOTHE 43 28 12 0 83 LERIBE 135 33 31 0 199 BEREA 114 24 1 0 139 MASERU 154 64 36 0 254 MAFETENG 123 35 0 0 158 MOHALE’S HOEK 54 1 47 69 171 QUTHING 0 0 35 90 125 QACHA’S NEK 0 0 38 63 101 MOKHOTLONG 0 0 106 0 106 THABA-TSEKA 0 0 134 8 142
Total 623 185 440 230 1478
Table 3.18 presents the number and percentage distribution of registered schools by district and type of institution. It is shown from the table that majority of registered primary schools were public, while private schools were fewer in number. In general out of 1,478 registered primary schools in Lesotho, 98.6 percent were public schools in 2015. Maseru accounted for more registered public and private primary schools estimated at 16.9 and 38.1 percent respectively. It was followed by Leribe with respectively 13.3 and 23.8 percent; public schools in Mohale’s Hoek followed with 11.7 percent. For private schools alone, Mohale’s Hoek and Berea accounted for equal percentages of 14.3. Table 3.18: Number and Percentage Distribution of Registered Schools by District and type of institution, 2016
PUBLIC PRIVATE District NO. OF SCHOOLS PERCENT NO. OF SCHOOLS PERCENT TOTAL
Botha-Bothe 81 5.6 2 9.5 83
Leribe 194 13.3 5 23.8 199
Berea 136 9.3 3 14.3 139
Maseru 246 16.9 8 38.1 254
Mafeteng 155 10.6 3 14.3 158
Mohale’s Hoek 171 11.7 0 0 171
Quthing 125 8.6 0 0 125
Qacha’s Nek 101 6.9 0 0 101
Mokhotlong 106 7.3 0 0 106
Thaba-Tseka 142 9.8 0 0 142
Total 1457 100.0 21 100.0 1478
Table 3.19 displays the number and percentage distribution of registered primary schools by residence and district in 2016. It is shown in the table that 85.2 percent of the registered primary schools were in the rural areas. In the urban areas, Maseru constituted the highest percentage estimated at 28.8 while in the rural areas Maseru and Leribe accounted for about 15.2 percent and 14.1 each district. Mokhotlong and Qacha’s Nek also had equal percentages of registered primary school in the rural areas in 2014.

27
Table 3.19: Number and Percentage Distribution of Registered Primary Schools by Residence, and District, 2016 Residence Urban Rural Total District No. of
Schools Percent No. of
Schools Percent
BOTHA-BOTHE 19 8.7 64 5.1 83 LERIBE 22 10.0 177 14.1 199 BEREA 13 5.9 126 10.0 139 MASERU 63 28.8 191 15.2 254 MAFETENG 24 11.0 134 10.6 158 MOHALE’S HOEK 19 8.7 152 12.1 171 QUTHING 19 8.7 106 8.4 125 QACHA’S NEK 9 4.1 92 7.3 101 MOKHOTLONG 17 7.8 89 7.1 106 THABA-TSEKA 14 6.4 128 10.2 142 Total 219 100 1259 100 1478
3.4.2 Teachers in Registered Primary Schools
This sub-section focuses mainly on teachers and whether they were qualified or not. It further compares them by district and pupil to teacher ratio by district and sex. Out of the total number of 10,687 primary school teachers in 2016, 83.2 percent were qualified. However, it is observed that these qualified teachers were not willing to teach in the mountainous districts such as Mokhotlong and Thaba-Tseka. It is further observed that generally there were more pupils per qualified primary school teacher than primary school pupils per teacher irrespective of the qualifications. Thus one qualified teacher was to teach 41 primary school pupils, whereas, there were 33 primary school pupils who were supposed to be taught by one teacher irrespective of the teacher’s qualification. The ratios for the qualified teachers were highest in Thaba-Tseka 52 and Mokhotlong with 48 pupils per qualified teacher; then followed Berea and Maseru respectively with 41 pupils per qualified teacher. Even though the ratios for all teachers were high also in Mokhotlong and Thaba-Tseka they were lower than the ones for the qualified teachers as they were estimated at 40 and 39 respectively in Mokhotlong and Thaba-Tseka. The table further shows that the female teachers outnumbered their male counterparts as they constituted 67.9 percent among unqualified teachers and 75.0 percent among qualified teachers.
Table 3.20: Enrolment, Number of Teachers and Pupil to Teacher Ratios in Registered Primary Schools by District and Sex, 2016 District Enrolment Total Teachers Qualified Teachers Unqualified Teachers Pupil qualified)
Teacher Ratios M F Total M F Total M F Total M F Tota
l PTR PQTR
Botha-Bothe 11776 11159 22935 162 544 706 140 489 629 22 55 77 32 36
Leribe 28859 26689 55548 359 1320 1679 305 1197 1502 54 123 177 33 37
Berea 22929 20726 43655 287 999 1286 222 847 1069 65 152 217 34 41
Maseru 42493 40447 82940 545 1791 2336 458 1545 2003 87 246 333 36 41
Mafeteng 18627 16956 35583 321 809 1130 274 682 956 47 127 174 31 37
Mohale’s Hoek
15904 15446 31350 274 753 1027 180 604 784 94 149 243 31 40

28
Quthing 10940 10477 21417 173 508 681 120 411 531 53 97 150 31 40
Qacha's Nek 7445 7129 14574 130 357 487 92 272 364 38 85 123 30 40
Mokhotlong 10907 11770 22677 165 409 574 129 340 469 36 69 105 40 48
Thaba-Tseka 14437 15640 30077 253 528 781 172 409 581 81 119 200 39 52 Total 184317 176439 360756 2669 8018 10687 2092 6796 8888 577 1222 1799 34 41

29
Table 3.21 below shows the number of teachers in registered primary schools by rank, agency and sex in 2016. Out of the total 10,687 teachers, 56.2 occupied the rank of Teacher; 15.6 percent were Senior Teachers; 11.8 were Teacher Assistants (1a); while Teacher Assistants (1b) and Associate Teachers accounted for 7.6 percent and 3.9 percent respectively. The table further shows that out of all teachers in registered primary schools, 32.4 percent were in LEC schools; 32.1 percent were in RCM schools; while 11.4 percent were from both Government and ACL schools. Table 3.21: Primary school teachers by Rank, Agency and Sex, 2016
Rank GOVERNMENT COMMUNITY LEC RCM ACL AME OTHER PRIVATE
Total M F M F M F M F M F M F M F M F
1a-Teacher Assistant 36 52 6 25 138 355 143 296 41 92 7 14 12 33 7 3 1260
1b-Teacher Assistant 13 11 4 9 44 81 59 104 13 34 1 5 6 23 4 10 421
1c-Teacher Assistant 4 0 0 0 1 4 0 5 1 0 0 1 10 9 1 1 37
1d-Teacher Assistant 1 2 1 0 4 6 6 12 1 4 1 2 0 3 1 3 47
1e-Teacher Assistant 1 0 1 1 0 0 3 0 0 0 0 0 0 3 1 0 10
1f-Teacher Assistant 1 1 0 0 1 5 3 7 0 1 0 3 0 2 0 0 24
2-Associate Teacher 17 38 3 39 48 217 38 268 13 69 3 13 2 22 2 18 810
3-Teacher 218 531 76 240 470 1410 506 1424 154 529 16 44 58 193 29 105 6003
4-Senior Teacher 64 178 17 91 111 430 111 337 43 169 6 10 6 64 10 22 1669
5-Assistant Specialist Teacher 8 29 1 13 10 80 14 61 8 33 0 3 0 15 2 4 281
6-Specialist Teacher 0 6 2 8 5 28 6 16 2 3 0 1 3 1 0 4 85
7-Senior Specialist Teacher 0 3 4 3 2 8 4 4 0 4 0 1 0 5 0 2 40
Total 363 851 115 429 834 2624 893 2534 276 938 34 97 97 373 57 172 10687

30
The distribution of teachers in registered primary schools by district, agency and sex is illustrated in Table 3.22. From the table, it is observed that out of 10,687 teachers in registered primary schools, 10,458 which are 97.9 percent of them were in public schools. There were also more female teachers than male teachers in registered primary schools as female teachers in registered public primary schools were represented by 75.0 percent and those in private primary schools also accounted for 75.1 percent. The table further shows that Maseru district accounted for 21.8 of all primary teachers; it was followed by Leribe with 15.7 and then Berea and Mafeteng with 12.0 and 10.6 percent respectively. Table 3.22: Teachers in Registered Primary Schools by District, Agency and Sex, 2016
District PUBLIC PRIVATE
Total
M F Total M F Total BOTHA-BOTHE 155 536 691 7 8 15 706 LERIBE 348 1293 1641 11 27 38 1679 BEREA 282 980 1262 5 19 24 1286 MASERU 515 1693 2208 30 98 128 2336 MAFETENG 317 789 1106 4 20 24 1130 MOHALE'S HOEK 274 753 1027 0 0 0 1027 QUTHING 173 508 681 0 0 0 681 QACHA'S NEK 130 357 487 0 0 0 487 MOKHOTLONG 165 409 574 0 0 0 574 THABA-TSEKA 253 528 781 0 0 0 781 Total 2612 7846 10458 57 172 229 10687

31
3.5 Efficiency and Quality of Education
The term ‘efficiency’ is derived from economic theory; it is defined as the optimal relationship between inputs and outputs. An activity is said to be carried out efficiently when a given quantity of output is obtained with a minimum amount of inputs or when a given quantity of inputs produces maximal output. The term applies to all types of planned behavior geared towards defined objectives hence its adoption by planners in the field of education. The pupil-year concept is a convenient, non-monetary way of measuring inputs. One pupil-year stands for all the resources used to keep one pupil in school for one academic year. Therefore, it represents one year’s worth of education and accompanying expenditure. Two pupil years, for instance, represent the resources needed to keep one pupil in school for two years. If a pupil repeats a grade, he is getting only one year’s worth education, but consuming two years’ worth of expenditure. If it takes 6 years to qualify for a certain diploma, a pupil who has dropped out of school after only three years has used three years’ worth of expenditure but failed to obtain the qualifying diploma. In the analysis of efficiency, repeaters and dropouts represent waste in the educational system. In order to track the flow of pupils through an education system, at the beginning of the year it is necessary to ask a question such as: “What has become of the pupils enrolled in a particular grade the previous year?” There are three possible and mutually exclusive events: (a) Pupils may have been promoted to the next higher grade, (b) Pupils may have repeated the same grade, (c) Pupils may have dropped out (that is, left school entirely, emigrated to another school system or died). Successful pupils might have gone through the cycle and graduated from the final year of the cycle. Promotion, repetition and dropout rates are the three likely paths of pupils’ flow from grade to grade and they characterize the efficiency of the education system in producing graduates. These rates are, therefore, used for monitoring, evaluation and projection of the efficiency of pupil flow in an education system. 3.5.1 Repeaters in Registered Primary Schools Table 3.23 shows enrolment of repeaters in registered primary schools by age, sex and grade in 2016. It is revealed that out of the total 360,756 pupils enrolled in registered primary schools in 2016, about 9.2 percent were repeaters. The table also illustrates that generally the percentage of repeaters was 11.9 percent in grade 1, it decline to 9.7 in grade 2. The percentage of increased afterwards from 10.7 in grade 3 to 20.2 percent in grade 5 and then declined to 15.3 percent in grade 7. The percentage of repeaters was highest (11.8) in age 12 years, and then followed 11.6 in age 11 years. About 11.3 percent of repeaters were in age 13 years. For age 10 and 14, the percentages were 10.2 and 10.8 percent respectively. The table further shows that the male repeaters were higher in all grades except for grade 7, where the opposite was true.

32
Table 3.23: Enrolment of Repeaters in Registered Primary Schools by Age, Grade and Sex, 2016 Age Grade 1 Grade 2 Grade 3 Grade 4 Grade 5 Grade 6 Grade 7 Total Total
M F M F M F M F M F M F M F M F <6 25 22 0 0 0 0 0 0 0 0 0 0 0 0 25 22 47
6 273 176 7 5 0 0 0 0 0 0 0 0 0 0 280 181 461
7 1462 954 182 93 13 10 0 0 0 0 0 0 0 0 1657 1057 2714
8 645 341 745 461 167 93 12 11 0 0 0 0 0 0 1569 906 2475
9 209 126 644 377 632 456 138 129 5 15 0 0 0 0 1628 1103 2731
10 70 33 320 145 784 468 744 528 137 110 12 21 0 0 2067 1305 3372
11 36 16 125 46 460 230 1149 577 527 471 76 90 16 14 2389 1444 3833
12 14 4 75 23 256 78 799 347 976 533 314 359 39 90 2473 1434 3907
13 2 1 19 8 104 37 410 131 792 419 626 595 227 359 2180 1550 3730
14 0 0 8 1 52 12 222 96 522 265 732 546 397 720 1933 1640 3573
15 0 2 3 1 19 10 81 33 288 131 653 418 524 598 1568 1193 2761
16 1 1 1 0 4 4 37 15 148 55 453 254 487 501 1131 830 1961
17 2 3 0 0 2 0 9 4 54 25 192 105 305 258 564 395 959
18 1 1 0 1 1 0 3 3 7 7 56 35 157 77 225 124 349
19 0 0 0 0 0 0 2 0 2 1 18 17 36 36 58 54 112
20 0 0 0 0 0 0 0 1 4 0 7 5 21 7 32 13 45
>20 0 0 0 0 1 0 0 1 4 1 6 8 12 11 23 21 44
Total 2740 1680 2129 1161 2495 1398 3606 1876 3466 2033 3145 2453 2221 2671 19802 13272 33074
The analysis of repeaters by District, Ecological Zone, and Sex is shown in Table 3.24. It is revealed in the table below that the Lowlands and Mountains had the higher number of primary school repeaters represented by 44.1 and 30.0 percent respectively, while the Foothills and Senqu River Valley had the least number of repeaters estimated at 13.1 and 12.8 percent respectively. Maseru also had the highest number of repeaters represented by 20.3 percent, whereas Botha-Bothe constituted only 4.8 percent of repeaters.
The repetition rates in Table 3.25 also exhibited a similar pattern to that of repeaters in that male repetition rates were higher than the rates for females. This has been the case over the years since 2009. This observation was consistent within the grades, though the repetition rates were higher in the lower grades and gradually declined along the upper grades in 2011 and 2012. Moreover, the table
Table 3.24: Registered Primary School Repeaters by District, Ecological Zone and Sex, 2016
DISTRICT LOWLANDS FOOTHILLS MOUNTAIN SENQU RIVER
VALLEY Total M F Total M F Total M F Total M F Total
BOTHA-BOTHE 617 364 981 274 168 442 109 71 180 0 0 0 1603
LERIBE 1963 1138 3101 444 239 683 216 182 398 0 0 0 4182
BEREA 863 533 1396 380 231 611 0 0 0 0 0 0 2007
MASERU 2721 1681 4402 919 620 1539 434 356 790 0 0 0 6731
MAFETENG 2087 1177 3264 641 420 1061 0 0 0 0 0 0 4325
MOHALE'S HOEK 906 524 1430 0 0 0 452 345 797 830 591 1421 3648
QUTHING 0 0 0 0 0 0 449 398 847 1023 699 1722 2569
QACHA'S NEK 0 0 0 0 0 0 335 208 543 437 294 731 1274
MOKHOTLONG 0 0 0 0 0 0 1212 986 2198 0 0 0 2198
THABA-TSEKA 0 0 0 0 0 0 2316 1860 4176 174 187 361 4537
Total 9157 5417 14574 2658 1678 4336 5523 4406 9929 2464 1771 4235 33074

33
reflects that repetition rates have been steadily declining from the year 2011 (16.5) to 2014 (8.3), although there was no improvement in 2015 as the repetition rate was recorded as 9.1.
As indicated before, promotion, repetition and dropout rates are used to assess the efficiency of the education system in producing graduates. The promotion rate shows the percentage of pupils who enrolled in a given year that have successfully completed their training, while dropout rate represents the percentage of pupils who quit training in a given year and therefore assesses the scale of loss in a program. When comparing the promotion, repetition and dropout rates from 2013 to 2015 in Table 3.26, a general improvement is observed in this level of education; promotion rate has minimally increased from 90.4 in 2013 to 90.6 in 2015, while repetition rate increased from 8.7 percent to 9.1 percent; and dropout rate declined from 0.9 to 0.2 percent during the same period.
3.5.2 Primary School Leaving Examination (PSLE) Results Table 3.27displays the primary school leaving examination results over the course of ten years from 2007 to 2016 and it is observed that pass rates range from 85.8 to 87.4 percent. The highest pass rate was observed in 2013 with 88.1 percent, followed by 2014 with 87.8 and the least pass rate was recorded in 2007 with 83.1 percent. First class pass rates have been under 20 percent while second class rates varied from 23 to 27.3 percent. The table further demonstrates that the overall pass rates, thus, the first class and second class pass rates and number of students who sat for examinations improved from 2011 to 2012 but declined from 2014 to 2015.
Table 3.25: Repetition Rates in Registered Primary School by Grade, Year and Sex 2011-2015
2011 2012 2013 2014 2015
Grade M F T M F T M F T M F T M F T
1
21.6 15.6 18.9 13.9 10.4 12.3 6.4 4.4 5.5 7.7 5.3 6.6 9.2 6.3 7.8
2
20 13.4 16.9 13.5 9 11.4 3.9 2.7 3.4 6.9 4.4 5.7 8.6 5.0 6.9
3
19.3 12.1 16 13.1 8.4 10.9 3.8 2.1 3.0 6.9 4.5 5.8 9.4 5.8 7.7
4
22.6 15.2 19.1 22.5 14.3 18.6 17.4 11.3 14.5 8.3 5.3 6.9 12.2 7.2 9.9
5
19.3 13.6 16.4 17.5 12.7 15.1 16.1 10.9 13.5 14.4 9.0 11.7 10.7 7.0 9.0
6
15.3 12.1 13.6 13.9 10.9 12.3 12.9 10.1 11.4 13.4 10.1 11.7 13.4 9.8 11.6
7
12.2 12.9 12.6 10.8 12.8 12 10.8 11.6 11.2 10.8 11.5 11.2 12.1 11.5 11.7
TOTAL
19.2 13.6 16.5 15.2 11.2 13.2 9.8 7.4 8.7 9.5 7.1 8.3 10.7 7.5 9.1
Table 3.26: Primary Schools Promotion, Repetition and Dropout Rates by Grade, 2013- 2015
Grade 2013
2014 2015 Prom Rep Drop Prom Rep Drop Prom Rep Drop 1 83.5 5.5 11.0 81.2 6.6 12.2 81.0 7.8 11.2
2 94.6 3.4 2.1 91.3 5.7 3.1 94.1 6.9 -1.0
3 95.7 3.0 1.3 91.9 5.8 2.3 92.6 7.7 -0.3
4 79.7 14.5 5.7 87.8 6.9 5.4 86.6 9.9 3.6
5 81.3 13.5 5.2 82.2 11.7 6.1 84.4 9.0 6.6 6 79.8 11.4 8.8 79.5 11.7 8.8 78.9 11.6 9.5 7 84.2 11.2 4.5 84.1 11.2 4.7 84.0 11.7 4.2
Total 90.4 8.7 0.9 90.5 8.7 1.2 90.6 9.1 0.2
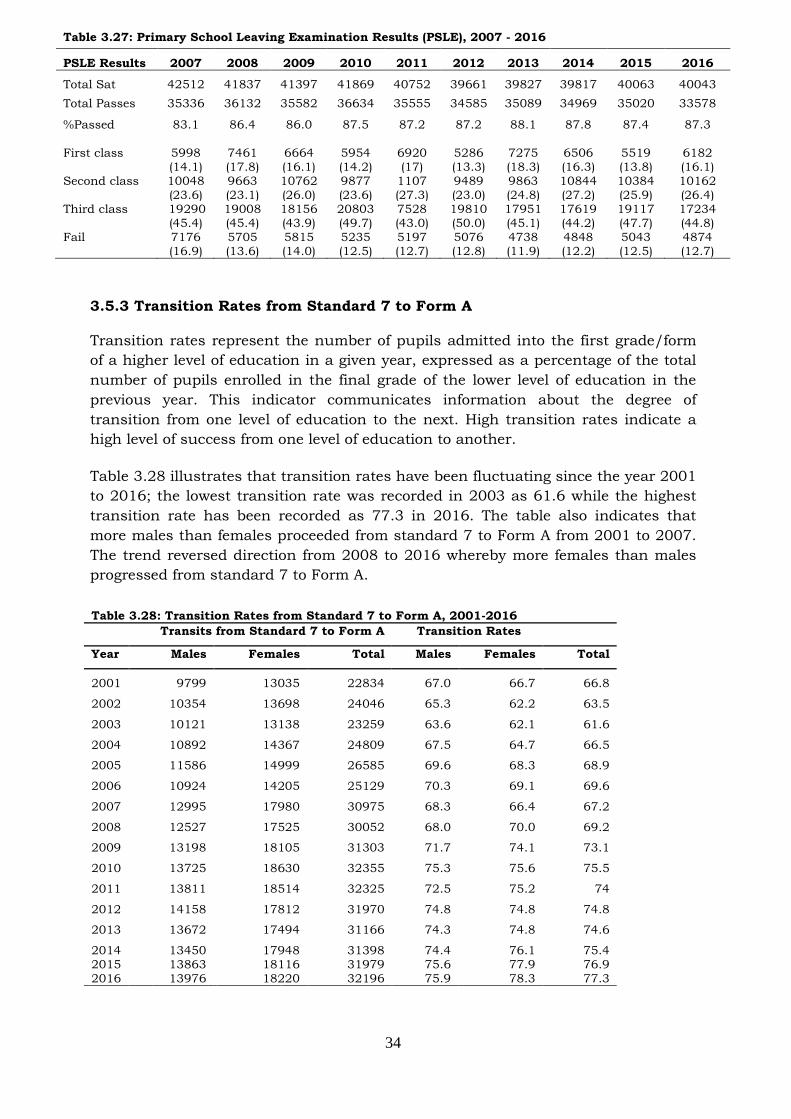
34
3.5.3 Transition Rates from Standard 7 to Form A Transition rates represent the number of pupils admitted into the first grade/form of a higher level of education in a given year, expressed as a percentage of the total number of pupils enrolled in the final grade of the lower level of education in the previous year. This indicator communicates information about the degree of transition from one level of education to the next. High transition rates indicate a high level of success from one level of education to another. Table 3.28 illustrates that transition rates have been fluctuating since the year 2001 to 2016; the lowest transition rate was recorded in 2003 as 61.6 while the highest transition rate has been recorded as 77.3 in 2016. The table also indicates that more males than females proceeded from standard 7 to Form A from 2001 to 2007. The trend reversed direction from 2008 to 2016 whereby more females than males progressed from standard 7 to Form A.
Table 3.28: Transition Rates from Standard 7 to Form A, 2001-2016 Transits from Standard 7 to Form A Transition Rates
Year Males Females Total Males Females Total
2001 9799 13035 22834 67.0 66.7 66.8
2002 10354 13698 24046 65.3 62.2 63.5
2003 10121 13138 23259 63.6 62.1 61.6
2004 10892 14367 24809 67.5 64.7 66.5
2005 11586 14999 26585 69.6 68.3 68.9
2006 10924 14205 25129 70.3 69.1 69.6
2007 12995 17980 30975 68.3 66.4 67.2
2008 12527 17525 30052 68.0 70.0 69.2
2009 13198 18105 31303 71.7 74.1 73.1
2010 13725 18630 32355 75.3 75.6 75.5
2011 13811 18514 32325 72.5 75.2 74
2012 14158 17812 31970 74.8 74.8 74.8
2013 13672 17494 31166 74.3 74.8 74.6
2014 13450 17948 31398 74.4 76.1 75.4 2015 2016
13863 13976
18116 18220
31979 32196
75.6 75.9
77.9 78.3
76.9 77.3
Table 3.27: Primary School Leaving Examination Results (PSLE), 2007 - 2016
PSLE Results 2007 2008 2009 2010 2011 2012 2013 2014 2015 2016
Total Sat 42512 41837 41397 41869 40752 39661 39827 39817 40063 40043 Total Passes 35336 36132 35582 36634 35555 34585 35089 34969 35020 33578
%Passed 83.1 86.4 86.0 87.5 87.2 87.2 88.1 87.8 87.4 87.3 First class 5998
(14.1) 7461 (17.8)
6664 (16.1)
5954 (14.2)
6920 (17)
5286 (13.3)
7275 (18.3)
6506 (16.3)
5519 (13.8)
6182 (16.1)
Second class
10048 (23.6)
9663 (23.1)
10762 (26.0)
9877 (23.6)
1107 (27.3)
9489 (23.0)
9863 (24.8)
10844 (27.2)
10384 (25.9)
10162 (26.4)
Third class 19290 (45.4)
19008 (45.4)
18156 (43.9)
20803 (49.7)
7528 (43.0)
19810 (50.0)
17951 (45.1)
17619 (44.2)
19117 (47.7)
17234 (44.8)
Fail 7176 (16.9)
5705 (13.6)
5815 (14.0)
5235 (12.5)
5197 (12.7)
5076 (12.8)
4738 (11.9)
4848 (12.2)
5043 (12.5)
4874 (12.7)

35
3.5.4 Cohort Analysis Cohort survival symbolizes the life span of a group of pupils as they enter primary school in the same year. Their survival is observed in the final grade of primary level by considering how the pupils were affected by dropout rates and repetition rates as they proceeded from one grade to the next grade up to the final year. The survival rate is a crude measure while the new entrants include repeaters of the previous year’s cohort and the reverse holds true for net survival rate. Table 3.29 shows the crude and net cohort survival rates in registered primary schools from 2010 to 2016; it is therefore observed from this table that the net cohort survival rates have been fluctuating for the years under review. They increased by 5.5 percent between 2010 and 2011 and decreased by 1.2 percent between 2011 and 2012 cohorts. That was followed by an appreciation of 1.9 percent recorded between 2012 and 2013 cohorts. In 2015, the net cohort survival rate was 72.0 percent indicating an increase in net cohort survival rate of 0.2 percent while crude cohort survival rate was 60.1 percent signifying an increment of 2.7 percent from 2014 to 2015. The crude and net cohort survival rates of 61.3 and 72.7 percent in 2016 suggest trivial percentages growth between 2015 and 2016.
Table 3.29: Crude and Net Cohort Survival Rates in Primary Schools, 2010-2016
Enrolment/Repeaters 2010 2011 2012 2013 2014 2015 2016
Total Enrolment 388,681 385,437 381,690 369469 366048 361637 360756
Total Repeaters 77,794 74,833 63,613 50497 32027 30363 33074
Net of Enrolment 310,887 310,604 318,077 318972 334021 331274 327682
Cohort 2004-10 2005-11 2006-12 2007-13 2008-14 2009-15 2010-16
Crude Cohort Survival Rate 53.8 54.6 53.9 54.6 57.4 60.1 61.3
Net Cohort Survival Rate 61.2 66.7 65.5 67.4 71.8 72 72.7

36
Chapter 4: Secondary School Education 4.0 Introduction Secondary education is an intermediate level between Primary Level and Technical School College or University. This level of education generally comprises of junior or lower and senior or upper secondary education. Junior secondary level covers Form A to Form C, and the Junior Certificate (JC) is awarded on successful completion of Form C. Senior secondary level begins from Form D to Form E. Cambridge Overseas School Certificate (COSC) which is currently known as the Lesotho General Certificate in Secondary Education (LGCSE) is awarded on successful completion of Form E. Usually provided at this level is general, technical or vocational and college preparatory curricula. In Lesotho, junior and senior secondary schools are inseparable in terms of facilities and teaching staff. 4.1 Enrolment in Registered Secondary Schools Table 4.1 below shows enrolment in Lower and Upper Registered Secondary schools by age, level of education and sex. The total enrolment in the lower secondary education (Form A - C) for the year 2016 was 93739 which consist of 39980 boys and 53,759 girls. While in the upper secondary education (Form D - E) total enrolment in the same year was 35,041 which consist of 15,052 boys and 19,989 girls. The overall enrolment in 2016 in registered secondary schools was 128780 students. This number consists of 55,032 boys and 73748 girls enrolled in all registered secondary schools. The overall enrolment in 2016 in registered secondary schools was 128780 students, while in 2015 the total enrolment was 128701. This shows an increase in enrolment of 0.06 percent between 2015 and 2016. While between 2014 and 2015 the total enrolment in registered secondary schools increased by 0.18 percent. On the other hand, between 2013 and 2014 the enrolment increased by 1.1 percent. This shows that for the past 4 years enrolment in registered secondary schools has be increasing at a decreasing rate. The table further shows that enrolment for girls has always been higher than that of their boys’ counterparts in all levels of secondary education. For instance, out of 128,780 students enrolled in 2016; 73,748 were girls while 55,032 were boys. Indicating that 57 percent of the total enrolment in registered secondary schools in 2016 were girls while 43 percent were boys. The historic trend also shows that for the past four years there were more girls than boys enrolled in registered secondary schools.

37
Table 4.1: Distribution of Enrolment in Lower and Upper Registered Secondary Schools by Age, Level of education and Sex, 2016
Age FORMA FORMB FORMC TOTAL FORMD FORME TOTAL
Total M F M F M F M F T M F M F M F T
<13 634 1282 0 0 0 0 634 1282 1916 0 0 0 0 0 0 0 1916
13 2553 5184 465 968 0 0 3018 6152 9170 0 0 0 0 0 0 0 9170
14 3454 5387 1934 3953 338 859 5726 10199 15925 0 0 0 0 0 0 0 15925
15 3289 3855 2818 4807 1415 3091 7522 11753 19275 338 697 0 0 338 697 1035 20310
16 2915 2701 3179 4476 2046 3593 8140 10770 18910 1367 2676 360 598 1727 3274 5001 23911
17 1846 1322 2754 3068 2146 2750 6746 7140 13886 1912 2948 997 1942 2909 4890 7799 21685
18 806 398 1864 1467 1675 1792 4345 3657 8002 1798 2203 1405 2135 3203 4338 7541 15543
19 291 175 821 593 1070 952 2182 1720 3902 1378 1435 1236 1533 2614 2968 5582 9484
20 78 49 320 196 605 400 1003 645 1648 986 850 974 973 1960 1823 3783 5431
21 26 19 118 64 244 146 388 229 617 521 380 675 518 1196 898 2094 2711
22 7 8 34 29 122 56 163 93 256 264 216 350 262 614 478 1092 1348
23 9 2 14 15 42 25 65 42 107 98 94 152 168 250 262 512 619
24 4 8 10 10 16 13 30 31 61 47 49 95 92 142 141 283 344
>24 4 10 7 16 7 20 18 46 64 37 100 62 120 99 220 319 383
Total 15916 20400 14338 19662 9726 13697 39980 53759 93739 8746 11648 6306 8341 15052 19989 35041 128780
Table 4.2 below shows the distribution of secondary enrolment in the district, Agency and Sex in 2016. This shows that there were more students in registered public secondary schools as compared to students enrolled in registered private secondary schools. This shows that 126928 (98.6 percent) of students enrolled in registered public secondary schools as compared to 1852 (1.4 percent) enrolled in registered private secondary schools. In both public and private registered secondary schools the number of girls enrolled is higher than that of boys. There were 72768 girls enrolled in registered public secondary schools compared to 54160 boys. While in private registered secondary schools there were 980 girls and 872 boys. This also shows that among students who enrolled in registered private secondary schools a larger proportion of students is enrolled in Maseru district with 73.3 percent, while Leribe followed with 12.8 percent. Berea and BOTHA-BOTHE followed with 9.7 percent and 3.5 percent respectively, and Mafeteng had the lowest enrolment with 0.7 percent. Furthermore, it shows that this registered private secondary schools were mostly found in the northern districts of Lesotho which are Botha-Bothe, Leribe, and Berea. While other private schools were found in Maseru and very few in Mafeteng. Other districts, such as Mohale's Hoek, Quthing, Qacha's Nek, Thaba-Tseka and Mokhotlong did not have registered private secondary schools.

38
Table 4.2: Distribution of Enrolment in Registered Public and Private Secondary Schools by District, Public, Private and Sex - 2016
DISTRICT PUBLIC PRIVATE Total
M F T M F T
BUTHA-BUTHE 4093 5472 9565 26 39 65 9630
LERIBE 10246 13669 23915 109 128 237 24152
BEREA 7694 9486 17180 93 87 180 17360
MASERU 14616 18469 33085 635 722 1357 34442
MAFETENG 6203 7826 14029 9 4 13 14042
MOHALES HOEK 3346 4652 7998 0 0 0 7998
QUTHING 2731 3587 6318 0 0 0 6318
QACHAS NEK 1781 2793 4574 0 0 0 4574
MOKHOTLONG 1826 3739 5565 0 0 0 5565
THABA-TSEKA 1624 3075 4699 0 0 0 4699
Total 54160 72768 126928 872 980 1852 128780 Table 4.3 shows distribution of enrolment in registered secondary schools in the districts, ecological zones and sex. It shows that registered secondary schools in Maseru district have the highest proportion of enrolment as compared to other districts. The proportion of students who enrolled in registered secondary schools in Maseru district is 26.7 percent, while Leribe and Berea followed with 18.8 percent and 13.5 percent respectively. The districts with the lowest student enrolment in registered secondary schools were Mokhotlong, Thaba-Tseka and Qacha's Nek with 4.3 percent, 3.6 percent respectively. This table further shows that students enrolment in the lowlands is higher than those in other ecological zones. For instance, the proportion of students enrolled in the lowlands is 72.4 percent of the total enrolment. This is followed by enrolment in the mountainous with 13.3 percent, while the lowest students’ enrolment is in the Foothills and Senqu River Valley with 7.6 and 6.7 percent respectively.
Table 4.3: Distribution of Enrolment in Registered Secondary Schools by District, Ecological Zone and Sex, 2016
District LOWLANDS FOOTHILLS MOUNTAIN SRV
Total M F Total M F Total M F Total M F Total
BUTHA-BUTHE 3366 4306 7672 710 1053 1763 43 152 195 0 0 0 9630
LERIBE 8575 10953 19528 1308 2030 3338 472 814 1286 0 0 0 24152
BEREA 7180 8768 15948 607 805 1412 0 0 0 0 0 0 17360
MASERU 13870 16776 30646 876 1535 2411 505 880 1385 0 0 0 34442
MAFETENG 5913 7284 13197 299 546 845 0 0 0 0 0 0 14042
MOHALES HOEK 2673 3561 6234 0 0 0 80 123 203 593 968 1561 7998
QUTHING 0 0 0 0 0 0 301 664 965 2430 2923 5353 6318
QACHAS NEK 0 0 0 0 0 0 1229 1818 3047 552 975 1527 4574
MOKHOTLONG 0 0 0 0 0 0 1770 3619 5389 56 120 176 5565
THABA-TSEKA 0 0 0 0 0 0 1624 3075 4699 0 0 0 4699
Total 41577 51648 93225 3800 5969 9769 6024 11145 17169 3631 4986 8617 128780
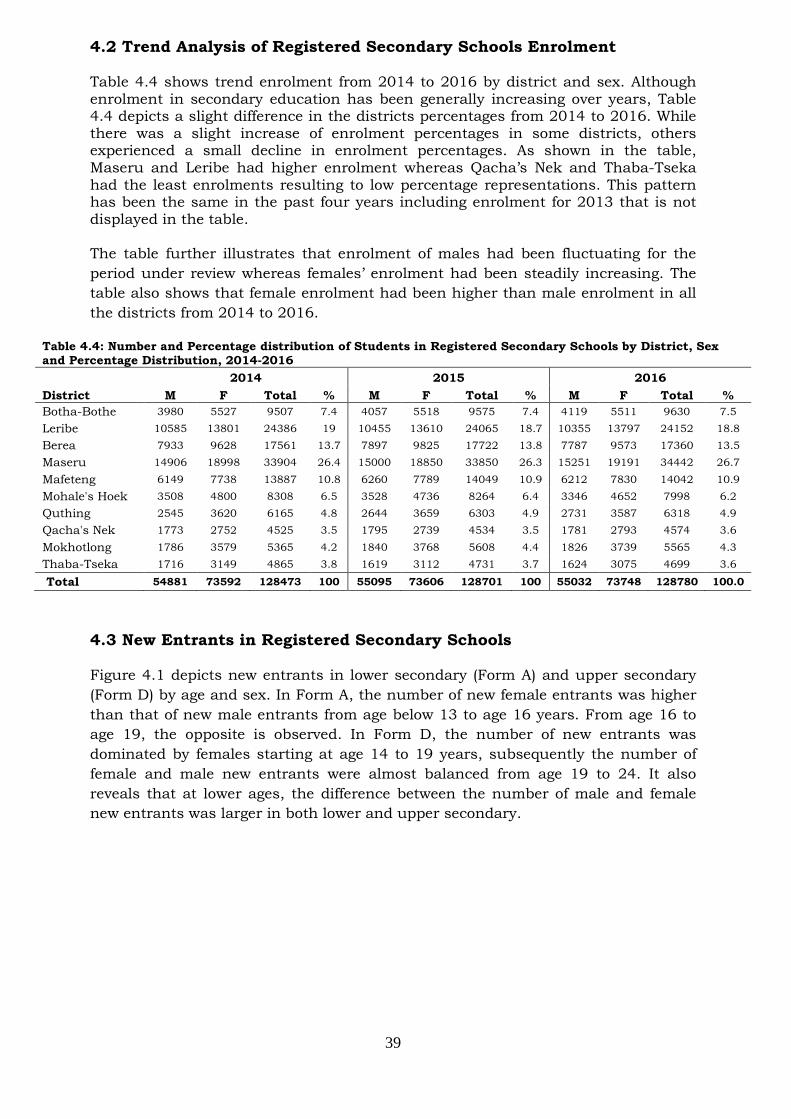
39
4.2 Trend Analysis of Registered Secondary Schools Enrolment Table 4.4 shows trend enrolment from 2014 to 2016 by district and sex. Although enrolment in secondary education has been generally increasing over years, Table 4.4 depicts a slight difference in the districts percentages from 2014 to 2016. While there was a slight increase of enrolment percentages in some districts, others experienced a small decline in enrolment percentages. As shown in the table, Maseru and Leribe had higher enrolment whereas Qacha’s Nek and Thaba-Tseka had the least enrolments resulting to low percentage representations. This pattern has been the same in the past four years including enrolment for 2013 that is not displayed in the table. The table further illustrates that enrolment of males had been fluctuating for the period under review whereas females’ enrolment had been steadily increasing. The table also shows that female enrolment had been higher than male enrolment in all the districts from 2014 to 2016.
4.3 New Entrants in Registered Secondary Schools Figure 4.1 depicts new entrants in lower secondary (Form A) and upper secondary (Form D) by age and sex. In Form A, the number of new female entrants was higher than that of new male entrants from age below 13 to age 16 years. From age 16 to age 19, the opposite is observed. In Form D, the number of new entrants was dominated by females starting at age 14 to 19 years, subsequently the number of female and male new entrants were almost balanced from age 19 to 24. It also reveals that at lower ages, the difference between the number of male and female new entrants was larger in both lower and upper secondary.
Table 4.4: Number and Percentage distribution of Students in Registered Secondary Schools by District, Sex and Percentage Distribution, 2014-2016
District 2014 2015 2016
M F Total % M F Total % M F Total % Botha-Bothe 3980 5527 9507 7.4 4057 5518 9575 7.4 4119 5511 9630 7.5 Leribe 10585 13801 24386 19 10455 13610 24065 18.7 10355 13797 24152 18.8 Berea 7933 9628 17561 13.7 7897 9825 17722 13.8 7787 9573 17360 13.5 Maseru 14906 18998 33904 26.4 15000 18850 33850 26.3 15251 19191 34442 26.7 Mafeteng 6149 7738 13887 10.8 6260 7789 14049 10.9 6212 7830 14042 10.9 Mohale's Hoek 3508 4800 8308 6.5 3528 4736 8264 6.4 3346 4652 7998 6.2 Quthing 2545 3620 6165 4.8 2644 3659 6303 4.9 2731 3587 6318 4.9 Qacha's Nek 1773 2752 4525 3.5 1795 2739 4534 3.5 1781 2793 4574 3.6 Mokhotlong 1786 3579 5365 4.2 1840 3768 5608 4.4 1826 3739 5565 4.3 Thaba-Tseka 1716 3149 4865 3.8 1619 3112 4731 3.7 1624 3075 4699 3.6
Total 54881 73592 128473 100 55095 73606 128701 100 55032 73748 128780 100.0

40
4.4 Coverage of Participation in Secondary Education The Gross Enrolment Rate (GER) and Net Enrolment Rate (NER) indicate the overall coverage of an educational system in relation to the population eligible for participation in the system. A high NER denotes a high degree of participation of the official school-age population. The theoretical maximum value is 100 percent. Therefore increasing trends reflect improvement in the participation at the specified level of education. The incidence of under-aged and over-aged enrolment can be observed by the GER.
4.4.1 Gross and Net Enrolment Rates, Pupils to Teacher Ratios and the Gender Parity Indices for Registered Secondary Schools Table 4.5 demonstrates gross and net enrolment rates, pupils’ teacher ratios and gender parity index for registered secondary schools for the years 2003 to 2015. Compared to the primary level, secondary school ratios remained quite low for the period under review. However, unlike primary schools where rates have been decreasing, rates in secondary schools have been generally increasing over the years, as they increased from 2002 to 2013; it only declined in 2013 and thereafter increased again until it reached 55.8 percent in 2015. However unlike GER that declined in one year, the NER has only been increasing from 2002 to 2015. The total net enrolment rate has been increasing from 22.0 percent in 2002 to 38.7 percent in 2015. On the other hand, the NER for males and females increased by 1.0 and 1.1 percent respectively from 2014 to 2015. The gender parity indices from gross enrolment rates and net enrolment rates have almost remained constant in more than 10 years’ time. This signifies that the gender disparity is slightly in favour of females at this level of education.

41
The pupil’ teacher ratios represent the average number of students per teacher; the figures from 2003 to 2016 are displayed in Table 4.5. During the period under review, the pupil teacher ratios have been fluctuating between 23.5 and 26.6. Although the pupil teacher ratios seemed to be low, some teachers may still be loaded and teach many children while others may be underutilized. The situation originates from the uneven distribution of enrolments and teachers in registered secondary schools. Many teachers would not like to teach in the remote areas hence, are overcrowded in the schools located in the lowlands or urban areas. However in 2016, there was adjustment noticed as pupil teacher ratio remained similar to the previous year at 24.0 percent.
Table 4.5: Secondary School Enrolment Rates, Gender Parity Indices and Pupil Teacher Ratios, 2003-2016
Year Gross Enrolment Rates Net Enrolment Rates
PTR M F T GPI M F T GPI
2003 30.1 39.1 34.5 1.3 17.9 27.9 22.8 1.6 23.9
2004 32.2 41.5 36.8 1.3 18.6 29 23.8 1.5 25.0
2005 34.2 44 39.1 1.3 19.8 31.2 25.4 1.6 26.6
2006 34.8 44.9 39.8 1.3 20 31.4 25.7 1.6 25.7
2007 35.5 47.3 41.4 1.3 20.8 33.4 27 1.6 24.4
2008 37.1 50.6 43.8 1.4 22.3 35.9 29 1.6 24.0
2009 39.7 55.8 47.7 1.4 23.8 39.4 31.5 1.7 23.5
2010 44.4 61.9 53.1 1.4 26 42.5 34.2 1.6 25.8
2011 46.5 64.4 55.4 1.4 27.6 44.2 35.8 1.6 24.9
2012 46.9 64.0 55.4 1.4 28.5 44.6 36.5 1.6 25.1
2013 46.9 63.6 55.2 1.4 29.2 45.6 37.3 1.6 24.1
2014 47.1 64.5 55.7 1.4 29.4 46.2 37.7 1.6 23.9
2015 47.3 64.5 55.8 1.4 30.4 47.3 38.7 1.6 24.0
2016 51.9 70.4 61.0 1.4 34.0 52.3 43.1 1.6 24.0
Table 4.6 displays the net enrolment rates for lower and upper secondary schools aggregated by sex. Generally the GER and NER for the lower secondary education are much higher than those in the upper secondary education. For the NER, this implies that there was high degree of participation of the official school age population in lower secondary than upper secondary. The table also denotes the improvement of both GER and NER rates between 2015 and 2016. The 2016 net enrolment rate for upper secondary was 15.1 percent which was higher than that 13.5 percent observed in 2015. On the other hand the NER for the lower Secondary school in 2016 was 35.2 percent which was higher than 31.6 percent that was recorded in 2015. The variation in participation by sex revealed that female’s participation of the official school age population was higher than that of males. For instance, in 2016 the lower secondary schools NER for males was observed as 25.7 percent and the one for females was 44.8 percent. In the upper secondary schools it was estimated at 10.8 and 19.4 for males and females respectively.

42
Table 4.6 NER and GER for lower and upper Secondary Education, 2015 to 2016
NER and GER 2015 2016
M F T M F T
NER Lower Secondary 22.9 40.4 31.6 25.7 44.8 35.2
NER Upper Secondary 9.4 17.7 13.5 10.8 19.4 15.1
NER Overall Secondary 30.4 47.3 38.7 34.0 52.3 43.1
GER Lower Secondary 56.8 77.3 66.9 63.2 85.7 74.4
GER Upper Secondary 32.9 44.9 38.9 35.1 47.5 41.3
GER Overall Secondary 47.3 64.5 55.8 51.9 70.4 61.0
4.5 Enrolment of Students with Special Educational Needs in Registered Secondary Schools Table 4.7 shows the distribution of students enrolled in registered secondary schools with special education by district, urban-rural residence and sex. This shows that 54.3 percent of students with special education were enrolled in registered secondary schools in rural areas while 45.7 percent were enrolled in the urban areas. It further shows that registered secondary schools with special education in Leribe had the highest number of student who enrolled in 2016 with 26.7 percent, while Maseru district followed with 18.2 percent. The last two districts with the lowest number of students enrolled in registered secondary schools with special education were Thaba-Tseka and Qacha's Nek with 3.2 and 3.1 percent respectively. Table 4.7: Number of Students with Special Education in Registered Secondary Schools by District, Urban-Rural and Sex, 2016
DISTRICT URBAN RURAL
TOTAL
M F Total M F Total %
BOTHA-BOTHE 70 123 193 40 54 94 287 3.9
LERIBE 315 471 786 432 743 1175 1961 26.7
BEREA 193 168 361 378 521 899 1260 17.2
MASERU 399 512 911 159 266 425 1336 18.2
MAFETENG 62 48 110 241 358 599 709 9.7
MOHALE’S HOEK 153 266 419 126 205 331 750 10.2
QUTHING 50 128 178 57 89 146 324 4.4
QACHA’S NEK 52 51 103 40 87 127 230 3.1
MOKHOTLONG 14 71 85 50 105 155 240 3.3
THABA-TSEKA 100 103 203 12 23 35 238 3.2
TOTAL 1408 1941 3349 1535 2451 3986 7335 100.0
Table 4.8 below shows the distribution of students in registered secondary schools with special education by disability type, level of education and sex. This shows that among the disability type that students have in registered secondary schools in 2016 45.2 percent of them had visual impairment. It was followed by those with Intellectual Disability which constituted 20.5

43
percent. Students who had Physical Disability constituted the lowest 6.4 percent of all who registered in secondary schools in 2016. Furthermore, the highest proportion among the students with some form of disabilities in those registered secondary schools were girls in form B with 18.2 percent. It was followed by girls in form A with 15.1 percent, while those in form E constituted 7.6 percent. Generally, in every level of secondary education there were more girls with some form of disability than boys. A higher proportion of boys with disability type were in Form A with 11.2 percent, while the lowest number were in Form E with 5.5 percent. Table 4.8: Number of Students With Special Education in Registered Secondary Schools by Disability Type, Level of Education and Sex, 2016
Disability Type FORM A FORM B FORM C FORM D FORM E Total
M F M F M F M F M F
Physical Disability 66 81 53 69 39 53 39 28 20 18 466
Visual Impairment 325 506 283 558 251 354 222 371 176 268 3314
Hearing Impairment 156 249 113 245 77 201 88 142 81 116 1468
Intellectual Disability 210 186 181 245 128 143 84 118 91 120 1506
Other 65 86 61 70 73 65 25 66 36 34 581
Total 822 1108 691 1187 568 816 458 725 404 556 7335
Table 4.9 bellow shows the distribution of students in registered secondary schools with special education (disability) by age, level of education and sex. This table shows that in registered secondary schools in 2016, out of 128780 students who enrolled 7335 (5.7 percent) had some form of disability. The table further shows that a higher proportion of students with some form of disability were in form A with 26.3 percent of the total disabled. This was followed by those in form B with 25.6 percent. The lowest proportions of students with some form of disability were in form E. This shows that disability decreases as the level of education increases. Table 4.9: Students With Special Education(disability) in Registered Secondary Schools by age, Level of Education and Sex, 2016
Age FORM A FORM B FORM C FORM D FORM E Total M F M F M F M F M F
<13 45 83 0 0 0 0 0 0 0 0 128 13 123 280 24 67 0 0 0 0 0 0 494 14 186 239 94 195 19 55 0 0 0 0 788 15 159 210 155 252 65 153 27 49 0 0 1070 16 121 152 121 277 127 182 75 163 38 81 1337 17 100 91 134 184 113 171 96 157 63 107 1216 18 47 30 84 124 99 113 99 133 83 125 937 19 28 13 50 49 77 65 67 94 87 81 611 20 4 2 16 25 34 39 52 62 62 75 371 21 2 6 6 8 18 23 24 27 27 43 184 22 1 0 1 1 13 1 10 19 21 17 84 23 2 0 2 3 1 7 7 5 5 10 42 24 1 0 0 0 0 3 0 4 8 4 20 >24 3 2 4 2 2 4 1 12 10 13 53

44
Total 822 1108 691 1187 568 816 458 725 404 556 7335 4.6 Orphans in Registered Secondary Schools Table 4.10 shows the distribution of orphans in registered secondary schools by Orphan type, level of education and sex. It shows that a higher proportion of students who are orphans are those who have lost their fathers with 53.3 percent. This is followed by students who have lost both parents with 27.5 percent, and those who lost their mothers constituted 19.3 percent. It further shows that a higher proportion of these students were in Form A with 26.8 percent, while 25.8 percent of orphans were in form B. The lowest number of orphans were in Form E with 12.3 percent. Table 4.10: Orphans in Registered Secondary Schools by Type, Level of Education and Sex, 2016
Orphan Type FORM A FORM B FORM C FORM D FORM E
Total M F M F M F M F M F
Paternal 3173 4027 2834 4010 2087 2920 1757 2504 1372 1800 26484
Maternal 1139 1508 1063 1477 755 1027 594 864 498 668 9593
Double 1448 2038 1393 2053 1133 1557 930 1323 764 1019 13658
Total 5760 7573 5290 7540 3975 5504 3281 4691 2634 3487 49735 Table 4.11 presents the number of orphans in registered secondary schools by district, urban-rural and sex. It is observed from the table that Maseru had the highest proportion of orphans (25.4 percent). It was followed by Leribe (17.7 percent), then Berea (14.1 percent) and Mafeteng with 11.4 percent. The rest of the districts constituted less than 10.0 percent of orphans each. The table further shows that in all the districts, the rural areas had the higher number of orphans than the urban areas. Orphans in the rural areas constituted 64.5 percent while those in the urban areas contributed only 35.5 percent. Table 4.11: Orphans in Registered Secondary Schools by District, Urban-Rural and Sex, 2016 DISTRICT URBAN RURAL Total % M F Total M F Total BOTHA-BOTHE 638 875 1513 672 998 1670 3183 6.4 LERIBE 1057 1323 2380 2746 3660 6406 8786 17.7 BEREA 625 775 1400 2381 3249 5630 7030 14.1 MASERU 3149 3709 6858 2341 3446 5787 12645 25.4 MAFETENG 507 595 1102 1936 2622 4558 5660 11.4 MOHALE’S HOEK 608 759 1367 813 1237 2050 3417 6.9 QUTHING 471 633 1104 733 954 1687 2791 5.6 QACHA’S NEK 403 560 963 324 577 901 1864 3.7 MOKHOTLONG 56 159 215 805 1612 2417 2632 5.3 THABA-TSEKA 276 458 734 399 594 993 1727 3.5 Total 7790 9846 17636 13150 18949 32099 49735 100.0

45
Table 4.12 shows the distribution of orphans in registered secondary schools by age, level of education and sex. According to the definition of orphans any person under the age of 18 years is considered as dependent, and therefore if she/he loses one of both parents due to death is regarded as an orphan. The table shows that out of 128780 students enrolled in 2016, 49735 of them were orphans, which constituted 38.6 percent. Among all orphans enrolled in registered secondary schools in 2016, a larger proportion of them were in form A with 26.8 percent. This was followed by those in form B with 25.8 percent. While those in Form E were the lowest with 12.3 percent. Table 4.12: Orphans in Registered Secondary Schools of by Age, Level of education and Sex, 2016
Age FORM A FORM B FORM C FORM D FORM E
Total M F M F M F M F M F
<13 156 323 0 0 0 0 0 0 0 0 479 13 721 1529 87 287 0 0 0 0 0 0 2624 14 1209 2019 629 1351 122 322 0 0 0 0 5652 15 1226 1662 1029 1871 505 1116 123 224 0 0 7756 16 1180 1134 1243 1794 831 1399 463 940 161 260 9405 17 776 588 1086 1260 875 1186 754 1185 398 732 8840 18 315 201 693 632 710 759 712 949 593 860 6424 19 110 70 322 207 468 434 502 641 549 665 3968 20 38 16 115 81 281 173 371 395 406 460 2336 21 18 10 53 33 119 69 181 156 271 240 1150 22 5 10 15 8 39 23 94 107 138 112 551 23 4 2 5 5 16 9 41 38 62 70 252 24 1 2 7 3 8 6 24 17 24 38 130 >24 1 7 6 8 1 8 16 39 32 50 168
Total 5760 7573 5290 7540 3975 5504 3281 4691 2634 3487 49735 4.7 Inputs for Secondary Education
4.7.1 Secondary Schools
Table 4.13 below shows the distribution of registered secondary schools by districts and school agency. School agency in this case means that the school is either owned by public or private agency. The public schools include those owned by government, churches and the community. While private schools include those owned by individual people. This shows that most of registered secondary schools in Lesotho are owned by the public, almost 97 percent, while 3 percent of them are owned by the private agency. Most of these public schools are found in Maseru and Leribe with 20.9 and 20.1 percent respectively, while Berea district came third with 12.5 percent. The districts with the lowest public secondary schools were Quthing and Mokhotlong with 4.9 and 4.7 percent respectively.

46
Table 4.13: Number of Registered Secondary Schools by District, Public and Private, 2016
DISTRICT PUBLIC PRIVATE Total Percent
BOTHA-BOTHE 22 1 23 6.7
LERIBE 66 3 69 20.1
BEREA 41 2 43 12.5
MASERU 69 3 72 20.9
MAFETENG 39 1 40 11.6
MOHALE’S HOEK 25 0 25 7.3
QUTHING 17 0 17 4.9
QACHA’S NEK 20 0 20 5.8
MOKHOTLONG 16 0 16 4.7
THABA-TSEKA 19 0 19 5.5
TOTAL 334 10 344 100.0 Table 4.14 shows the distribution of registered secondary schools in the districts and urban-rural residence. It shows that most of registered secondary schools are in the rural areas as compared to those in the urban areas. It shows that of all registered secondary schools in Lesotho 76.5 percent of them are in the rural areas, while 23.5 percent are in the urban areas. It further shows that out of the total (81) secondary schools found in the urban areas Maseru district has 30 registered schools which constitutes 37.0 percent. This is followed by schools in Leribe district with 16.0 percent, while Mokhotlong has only one registered secondary school in the urban area. Table 4.14: Number of Registered Secondary Schools by District and urban-rural, 2016
DISTRICT URBAN RURAL Total
BOTHA-BOTHE 9 14 23
LERIBE 13 56 69
BEREA 6 37 43
MASERU 30 42 72
MAFETENG 5 35 40
MOHALE’S HOEK 4 21 25
QUTHING 4 13 17
QACHA’S NEK 5 15 20
MOKHOTLONG 1 15 16
THABA-TSEKA 4 15 19
TOTAL 81 263 344

47
Figure 4.2 depicts the percentage distribution of registered secondary schools by Ecological zones. Most of the schools were in the Lowlands (63 percent). The second highest percentage was for the Mountains with 18.0 percent while Foothills and SRV had only 10.0 percent.
Figure 4.3 presents the distribution of registered secondary schools by agency. It is shown from the figure that majority of schools were owned by Government and RCM with 27.0 percent and 26 percent each. Private and AME schools were the least with only 3.0 percent and 1.0 percent respectively.

48
4.7.2 Secondary Schools Teachers This sub-section focuses on teachers at secondary level; these qualified and unqualified teachers in registered schools are compared by district, pupil to teacher ratio, district and sex. There were 5,361 teachers in registered secondary schools in 2016. Unqualified teachers refer to teachers without teaching qualifications; these include graduates in other fields of study as well as teachers who have only obtained secondary qualifications like LGCSE and JC. Table 4.15 indicates that female teachers constituted 55 percent while males represented 45 percent of the total teachers. Out of the total teachers 5041 were qualified, of whom 56 percent were females and 44 percent were males. Of the total teachers from each district, Maseru had the highest percentage of teachers (27 percent); seconded by Leribe (19 percent) then Berea (14 percent). The pupil teacher ratio (PTR) was 24 pupils per teacher for the entire country and it ranged from 21 to 26 across the districts. In addition, the qualified pupil-teacher ratio (QPTR) was 26 pupils per teacher for the whole country. Leribe and Qacha’s Nek had the lowest QPTRs estimated at 24 children per teacher each; this means that there were many qualified teachers compared to enrolment in this districts. Thaba-Tseka had the least qualified teachers compared to other districts, with 27 pupils per teacher.

49
Table 4.15: Number of Teachers in Registered Secondary Schools by District and Sex, 2016
District
Enrolment Teachers Qualified Unqualified
M F Total M F Total M F Total M F Total PTR QPTR Botha-Bothe 4119 5511 9630 209 199 408 196 193 389 13 6 19 23.6 24.8
Leribe 10355 13797 24152 507 549 1056 473 536 1009 34 13 47 22.9 23.9
Berea 7787 9573 17360 295 392 687 259 358 617 36 34 70 25.3 28.1
Maseru 15251 19191 34442 586 833 1419 548 792 1340 38 41 79 24.3 25.7
Mafeteng 6212 7830 14042 265 334 599 246 317 563 19 17 36 23.4 24.9
Mohale's Hoek 3346 4652 7998 150 185 335 138 179 317 12 6 18 23.9 25.2
Quthing 2731 3587 6318 131 114 245 124 111 235 7 3 10 25.8 26.9
Qacha's Nek 1781 2793 4574 90 125 215 79 114 193 11 11 22 21.3 23.7
Mokhotlong 1826 3739 5565 89 124 213 85 122 207 4 2 6 26.1 26.9
Thaba-Tseka 1624 3075 4699 92 92 184 83 88 171 9 4 13 25.5 27.5
Total 55032 73748 128780 2414 2947 5361 2231 2810 5041 183 137 320 24.0 25.5
Table 4.16 shows the distribution of teachers in registered secondary schools by district, school agency and sex. It shows that most of teachers are teaching in registered secondary schools owned by the public (98.1 percent), while those who work in private registered secondary schools constitutes 1.9 percent. It also shows that a larger proportion of these teachers were in the district of Maseru with 26.5 percent. This was followed by those who were working in Leribe district with 19.7 percent. The lowest proportion of these teachers were in Mokhotlong and Thaba-Tseka with 4.0 and 3.4 percent respectively. Table 4.16: Secondary Teachers in Registered Secondary Schools by District, Public-Private and Sex, 2016
DISTRICT PUBLIC PRIVATE Total M F M F
BOTHA-BOTHE 202 197 7 2 408
LERIBE 498 539 9 10 1056
BEREA 288 385 7 7 687
MASERU 565 801 21 32 1419
MAFETENG 264 329 1 5 599
MOHALE’S HOEK 150 185 0 0 335
QUTHING 131 114 0 0 245
QACHA’S NEK 90 125 0 0 215
MOKHOTLONG 89 124 0 0 213
THABA-TSEKA 92 92 0 0 184
Total 2369 2891 45 56 5361

50
4.8 Efficiency and Quality of Education in Registered Secondary Schools
4.8.1 Repeaters in Registered Secondary Schools
Table 4.17 below shows the distribution of repeaters in registered secondary schools by districts, ecological zone and sex. There are four ecological zones in Lesotho, and each district has different ecological zone based on its location, but no district has all these four ecological zones. It shows that most of students who were repeaters in registered secondary schools were attending schools located in the Lowlands with 72.6 percent. This was followed by those who were in the Mountains with 13.1 percent. The lowest were those in the Foothills and Senqu River Valley with 8.4 and 6.0 percent respectively.
Table 4.17: Repeaters in Registered Secondary Schools by District, Ecological Zone and Sex, 2016
DISTRICT LOWLANDS FOOTHILLS MOUNTAINS SRV Total
M F Total M F Total M F Total M F Total
BOTHA-BOTHE 591 702 1293 120 157 277 0 4 4 0 0 0 1574
LERIBE 1298 1533 2831 148 245 393 47 89 136 0 0 0 3360
BEREA 1067 1130 2197 89 118 207 0 0 0 0 0 0 2404
MASERU 1524 1601 3125 149 293 442 90 145 235 0 0 0 3802
MAFETENG 955 1232 2187 52 93 145 0 0 0 0 0 0 2332
MOHALE’S HOEK 472 585 1057 0 0 0 5 9 14 111 150 261 1332
QUTHING 0 0 0 0 0 0 33 59 92 254 311 565 657
QACHA’S NEK 0 0 0 0 0 0 145 241 386 60 129 189 575
MOKHOTLONG 0 0 0 0 0 0 239 555 794 7 28 35 829
THABA-TSEKA 0 0 0 0 0 0 221 405 626 0 0 0 626
TOTAL 5907 6783 12690 558 906 1464 780 1507 2287 432 618 1050 17491 Table 4.18 shows the distribution of repeaters in registered secondary schools by districts, urban rural residence and sex. It shows that a higher proportion of the repeaters were in Maseru, Leribe and Berea with 21.7, 19.2 and 13.7 percent respectively. The lowest proportions of repeaters were in Quthing, Thaba-Tseka and Qacha's Nek district with 3.7, 3.6 and 3.3 percent respectively. It further shows that 66.1 percent of repeaters in registered secondary schools were in the rural areas. While 33.9 percent were in the urban area.

51
Table 4.18: Repeaters in Registered Secondary Schools by District, Urban-Rural and Sex, 2016
DISTRICT URBAN RURAL
TOTAL M F Total M F Total
BOTHA-BOTHE 362 422 784 349 441 790 1574
LERIBE 478 591 1069 1015 1276 2291 3360
BEREA 235 216 451 921 1032 1953 2404
MASERU 924 901 1825 839 1138 1977 3802
MAFETENG 167 252 419 840 1073 1913 2332
MOHALE’S HOEK 260 254 514 328 490 818 1332
QUTHING 56 96 152 231 274 505 657
QACHA’S NEK 116 198 314 89 172 261 575
MOKHOTLONG 19 77 96 227 506 733 829
THABA-TSEKA 102 199 301 119 206 325 626
TOTAL 2719 3206 5925 4958 6608 11566 17491
Table 4.19 shows the distribution of repeaters in registered secondary schools by age, level of education and sex. It shows that a higher proportion of repeaters in secondary schools were in form B with 39.9 percent, while those in form A followed with 23.6 percent. It further shows that most of these repeaters were in ages 17, 16 and 18 years with 21.9, 19.2 and 17.7 percent respectively.
Table 4.19: Repeaters in Registered Secondary Schools by Age, Level of Education and Sex, 2016
AGE FORM A FORM B FORM C FORM D FORM E
TOTAL M F M F M F M F M F
<13 4 5 0 0 0 0 0 0 0 0 9
13 68 139 8 18 0 0 0 0 0 0 233
14 227 417 66 140 6 5 0 0 0 0 861
15 412 561 297 698 23 60 12 27 0 0 2090
16 467 533 644 1106 85 222 74 168 16 36 3351
17 399 344 809 1079 234 377 191 374 12 17 3836
18 232 124 664 614 280 388 264 476 22 28 3092
19 76 36 312 218 266 251 294 397 15 34 1899
20 35 15 120 73 180 141 239 258 30 26 1117
21 12 2 58 20 92 39 146 108 17 25 519
22 2 1 13 6 50 14 72 59 15 9 241
23 5 0 4 4 18 6 26 26 4 11 104
24 0 3 4 3 4 2 23 21 7 5 72
>24 1 0 4 3 4 7 9 29 4 6 67
Total 1940 2180 3003 3982 1242 1512 1350 1943 142 197 17491

52
4.8.2 Transition Rates from Form C to Form D Table 4.20 illustrates the transition rates from form C to form D. Transition rates reveal that there were more females than males who progressed from Form C to Form D from 2010 to 2013 while more males than females progressed from 2014 to 2015. It also reflects that on overall the gap between male and female transition rates was diminishing in the period under review. The table also reveal that the transition rate had dropped to 71.4 in both 2011 and 2012, and further to 70.6 in 2014 however an appreciation of 73.0 was noticed in 2015.
4.8.3 Examination Results
Examinations Council of Lesotho (ECOL) conducts examinations and assessment tests, for primary and secondary education, in a manner that will improve the culture of learning and maintain the quality and standards of education in Lesotho in order to open opportunities for further education and the world of work within the country and beyond. One of its objectives is to provide certificates to all candidates who have achieved the desired levels of performance in primary and secondary schools. Below is an analysis of Junior Certificate and Cambridge Overseas School Certificate (COSC) examinations results.
4.8.3.1 Junior Certificate Examinations
Table 4.21 displays the Junior Certificate examination results from 2006 to 2016. It is shown from the table that the percentages for Merit and first classes had been fluctuating with minimal differences during the period under review. Recently, merit pass declined from 1.9 in 2015 to 1.4 percent in 2016 while first class improved from 6.4 in 2015 to 6.5 in 2016. Second Class Passes increased from 48.1 in the previous year to 49.9 percent in 2016 whereas third class passes dropped down since 2014 to 2016. The number of those who failed slightly decreased from 31.5 in 2014 to 31.1 percent in 2016.
Table 4.20: Transition Rates from Form C to Form D, 2002 – 2016 Year Males Females Total 2002 74.3 75.2 74.8 2003 79.0 77.0 77.9 2004 78.3 76.4 77.2 2005 75.2 73.7 74.4 2006 68.7 67.0 67.7 2007 71.8 75.7 74.0 2008 71.7 78.2 75.3 2009 78.6 76.2 77.2 2010 73.6 75.3 74.6 2011 69.7 72.7 71.4 2012 70.4 72.6 71.4 2013 2014 2015
74.4 71.1 76.0
75.2 70.2 70.9
74.9 70.6 73.0

53
4.8.3.2 Lesotho General Certificate in Secondary Education (LGCSE)
In the past, more than 20 years ago, completion of Junior Certificate (JC) was followed by Cambridge Overseas School Certificate (COSC) for students who proceeded further with Higher Secondary or Senior Secondary. However, the Government had planned to localize the final examination at this level, hence why an introduction on the Lesotho General Certificate in Secondary Education (LGCSE) which started in the year 2014.
Table 4.22 displays LGCSE/IGSE Examinations results per district in 2016. The table shows that Maseru was top with 4101(29%) students that sad for the examinations and was trailed by Leribe and Berea with 2720(19%) and 1777(13%) respectively. The table further illustrates that most students passed their subjects with symbol D followed by symbol E and C.
Table 4.21: Junior Certificate Examination Results, 2006-2016 Indicators 2006 2007 2008 2009 2010 2011 2012 2013 2014 2015 2016 Candidates 15081 15717 16056 18774 20766 21010 21414 20894 21688 21678 21314 Total passes 9800 11155 11423 12840 14523 14556 14639 14862 14856 14830 14694 Percentage of passes 65.0 71.0 71.1 68.4 70.0 69.3 68.4 71.1 68.5 68.4 68.9 Number of first class with merit 213 159 233 253 333 352 369 379 306 418 288 Merit percentages 1.4 1.0 1.5 1.3 1.6 1.7 1.7 1.8 1.4 1.9 1.4 Number of first class passes 972 906 997 1451 1524 1582 1706 1567 1412 1384 1388 First class percentages 6.4 5.8 6.2 7.7 7.3 7.5 8.0 7.5 6.5 6.4 6.5 Number of second class passes 7155 8257 8370 9364 10656 10679 10285 10596 10490 10425 10641 Second class percentages 47.4 52.5 52.1 49.9 51.3 50.8 48.0 50.7 48.4 48.1 49.9 Number of third class passes 1460 1833 1823 1772 2010 1943 2279 2320 2648 2603 2377
Third class percentages 9.7 11.7 11.4 9.4 9.7 9.2 10.6 11.1 12.2 12 11.2
Number of failures 5281 4562 4633 5934 6243 6454 6775 6032 6832 6848 6620
Percentages of failures 35.0 29.0 28.9 31.6 30.0 30.7 31.6 28.9 31.5 31.5 31.1

54
Table 4.22: LGCSE/IGCSE Examination Results, 2016
DISTRICT Total Students A* A B C D E F G U X Total A*-G % A*-A %
BOTHA- BOTHE 924 28 105 537 1475 1546 1294 1131 609 392 111 7117 6725 94.49 133 1.87
LERIBE 2720 98 483 1841 4122 4230 3889 3104 1698 1072 177 20537 19465 94.78 581 2.83
BEREA 1777 47 229 1032 2607 2946 2738 2059 1144 560 75 13362 12802 95.81 276 2.07
MASERU 4101 186 729 2660 5569 6110 5715 4583 2790 1672 231 30014 28342 94.43 915 3.05
MAFETENG 1494 69 219 916 2413 2485 2291 1612 813 391 127 11209 10818 96.51 288 2.57
MOHALE’S HOEK 839 37 134 583 1299 1274 1166 926 575 401 56 6395 5994 93.73 171 2.67
QUTHING 800 14 70 333 919 1163 1243 1148 754 497 93 6141 5644 91.91 84 1.37
QACHA’S NEK 505 4 27 211 613 770 812 736 429 198 55 3800 3602 94.79 31 0.82
MOKHOTLONG 546 19 65 325 790 762 824 685 368 158 27 3996 3838 96.05 84 2.1
THABA TSEKA 431 4 50 223 525 631 690 574 279 134 24 3110 2976 95.69 54 1.74
Total 14137 506 2111 8661 20332 21917 20662 16558 9459 5475 976 105681 100206 94.82 2617 2.48

55
Chapter 5: Technical and Vocational Education Training 5.0 Introduction
Technical and Vocational Education Training (TVET) can be defined as an occupation and employment based education. Learning may be facilitated either through formal schools, centres or institutions that are publicly or privately owned, or through informal, traditional-apprenticeship and or non-formal semi-structured training. The nature of the content is purposefully designed to prepare learners for specific trades, crafts and careers, largely through practical-based learning and complementary theory to equip learners with the acquisition of practical competencies, the know-how and attitudes necessary to perform in their respective occupations within the labour market. Institutions belonging to this category in Lesotho award appreciation, national and international certificates and diploma’s in a range of study fields from agriculture, basic handicrafts, home economics, hospitality, construction, engineering, business, management and IT. Entry requirements begin with qualifications as low as STD 7 in most institutions and the courses offered range from a period of 2 weeks to 36 months.
5.1 Enrolment
Table 5.1 reveals enrolment in registered technical and vocational schools by age and sex. It can be seen from the table that enrolment in 2016 increased to 4,584 as compared to 2015 where it was recorded as 4,410. There were more female learners with 2,646 (57.7 percent) and their male counterparts accounted for 1,938 (42.3 percent). Age comparison depicts that although there were more learners aged 23 with 723 (15.8 percent), on average most learners at this level were aged between 18 and 25 years.
Table 5.1: Enrolment in Registered Technical and Vocational Schools by Age and Sex, 2016 Age M F Total <14 3 3 6 14 3 0 3 15 3 3 6 16 14 16 30 17 26 53 79 18 94 323 417 19 209 200 409 20 205 325 530 21 154 188 342 22 137 218 355 23 222 501 723 24 141 283 424 25 205 257 462 26 116 104 220 >26 406 172 578 Total 1938 2646 4584

56
Table 5.2 presents enrolment in TVET institutions by level of education and sex, Number of TVET institutions by level of education. It is revealed that most of TVET institutions were in Senior Secondary education, 11 (44.0 percent) and 7 (28.0 percent) were those that were in Junior and beyond Secondary respectively. In contrary, the enrolment was highest in institutions beyond secondary level with 44.0 percent followed by those in senior secondary education with 31.0 percent and lastly those in junior secondary with 25.0 percent.
Table 5.2: Enrolment in TVET Institutions by level of education and Sex, 2016
Level of Education Entry. Req. Male Female Total
Total Percent
Number of Institutions
Total Percent
Junior Secondary Std 7 460 612 1,072 25.0 7 28.0
Senior Secondary JC 495 796 1,291 31.0 11 44.0
Beyond Secondary COSC 991 869 1,860 44.0 7 28.0
Total 1,946 2,277 4,223 100 25 100
Table 5.3 displays enrolment in registered technical and vocational schools by district, agency and sex for the year 2016. Unlike in ECCD, primary and secondary school levels, Technical and Vocational schools are not scattered all over the districts within the country as they are in only seven districts. It can be observed from the table that majority of learners were in the districts of Maseru amounting to 2628(57.3) tracked by Leribe and Mohale’s Hoek that were represented by 959(20.9) and 484(10.6) respectively. It was also observed that the larger portion of students 1780(38.8 percent) were enrolled in private institutions while 1142(24.9 percent) and 1121(24.5 percent) were enrolled in RCM and government institutions respectively.
Table 5.3: Enrolment in Registered Technical and Vocational Schools by District, Agency and Sex, 2016
DISTRICT GOVMENT COMM LEC RCM ACL PRIVATE
Total M F M F M F M F M F M F
LERIBE 151 198 0 0 0 0 261 138 11 107 33 60 959 BEREA 0 0 3 18 0 0 0 0 0 0 0 0 21 MASERU 144 441 15 38 0 0 206 97 0 0 684 1003 2628 MOHALES HOEK 0 0 28 16 0 0 46 394 0 0 0 0 484
QUTHING 0 0 0 0 214 39 0 0 0 0 0 0 253 MOKHOTLONG 0 0 0 0 8 44 0 0 0 0 0 0 52 THABA-TSEKA 134 53 0 0 0 0 0 0 0 0 0 0 187
Total 429 692 46 72 222 83 513 629 11 107 717 1063 4584
Table 5.4 shows repeaters in registered technical and vocational schools by district and sex for the year 2016. Out of the total enrolment in this level of education, repeaters constituted 508 (11.1 percent) out of whom 275 (54.1 percent) were males and 233 (45.9 percent) were females. Comparison by agency demonstrates that majority of repeaters were in RCM institutions with 356 (70.1 percent) trailed by private with 137 (27.0 percent) and lastly LEC institutions with 15 (3.0 percent). Maseru had the highest percentage of repeaters which was 84.6 and was followed by Mohale’s Hoek with 10.4 percent.

57
Table 5.4: Repeaters in Registered Technical and Vocational Schools by District and sex, 2016
District LEC RCM PRIVATE
Total M F M F M F
LERIBE 0 0 0 0 4 6 10 MASERU 0 0 206 97 48 79 430 MOHALES HOEK 0 0 4 49 0 0 53 QUTHING 12 0 0 0 0 0 12 MOKHOTLONG 1 2 0 0 0 0 3
Total 13 2 210 146 52 85 508
Table 5.5 demonstrates the number of students who left school in technical and vocational institutions by district, agency and sex for the year 2016. The table reflects that out of the total enrolment of 4584 students, 778 (16.9 percent) of students dropped out in this level of education. Distribution by district shows that Maseru was leading with 707 (90.9 percent) number of drop outs; this number was followed by that of Leribe which was 41(5.3 percent) while Mohale’s Hoek had 18 (2.3 percent) as number of students who left school. The table further illustrates that 604 (77.6 percent) students who left school were from Government institutions. That was followed by 93 (12.0 percent) that were from private institutions then 61 (7.8 percent) students that were from RCM institutions. Comparison by sex showed an uneven distribution in favour of females constituting a higher percentage of 72.9. Table 5.5: Students Who Left School in Technical and Vocational Institutions by District, Agency and Sex, 2016 DISTRICT GOVMENT COMM LEC RCM PRIVATE Total M F M F M F M F M F LERIBE 10 9 0 0 0 0 0 12 4 6 41 BEREA 0 0 3 2 0 0 0 0 0 0 5 MASERU 144 441 4 2 0 0 11 22 32 51 707 MOHALES HOEK 0 0 0 2 0 0 1 15 0 0 18
MOKHOTLONG 0 0 0 0 2 5 0 0 0 0 7 Total 154 450 7 6 2 5 12 49 36 57 778
Table 5.6 presents the number and percentage of students that dropped out of Technical and Vocational institutions by major reason for dropping out and sex. It is observed from the table that a total of 778 students were reported to have left school in 2016. Out of the total number that left school, the highest proportion 647 (83.2 percent) dropped out because they were seeking employment while 33 (4.2 percent) had no funds and the other 25 (3.2 percent) left because of pregnancy.

58
Table 5.6: Students Who Left School in Registered Technical and Vocational Schools by Reason and Sex, 2016 Major Reasons for Leaving M F Total % Death 4 9 13 1.7 Dismissed 0 2 2 0.3 Don’t like schooling 5 8 13 1.7 Illness 6 10 16 2.1 Herding 1 0 1 0.1 Looking after the sick/old/children 0 2 2 0.3 Marriage 1 15 16 2.1 No founds 12 21 33 4.2 No guardian 1 1 2 0.3 Pregnancy 0 25 25 3.2 Seek Employment 180 467 647 83.2 Transfer 1 0 1 0.1 Other 0 7 7 0.9 Total 211 567 778 100.0
5.2 Teaching Staff
Table 5.7 displays teachers in technical and vocational institutions by district, agency and sex for the year 2016. The number of teachers in TVET institutions decreased from 220 in 2014 to 215 in 2015; and further to 198 in 2016. As majority of the students and institutions were in Maseru, the number of teachers at this level also followed the same trend as 70 (35.4 percent) was highest for teachers in Maseru. Mohale’s Hoek and Leribe had 43 (21.7 percent) and 42 (21.2 percent) respectively; as depicted in the table. Disaggregation of teachers by agency indicated that majority of teachers were in RCM with 77 (38.9 percent) seconded by Private with 50 (25.3 percent) while the least was ACL with 10 (5.1 percent).
Table 5.7: Teachers in Registered Technical and Vocational Schools by District, Agency and Sex, 2016 DISTRICT GOVEMENT COMM LEC RCM ACL PRIVATE Total M F M F M F M F M F M F % LERIBE 1 1 0 0 0 0 15 10 2 8 2 3 42 21.2 BEREA 0 0 4 1 0 0 0 0 0 0 0 0 5 2.5 MASERU 2 3 4 3 0 0 7 6 0 0 26 19 70 35.4 MOHALES HOEK 0 0 3 1 0 0 8 31 0 0 0 0 43 21.7 QUTHING 0 0 0 0 17 2 0 0 0 0 0 0 19 9.6 MOKHOTLONG 0 0 0 0 2 2 0 0 0 0 0 0 4 2.0 THABA-TSEKA 12 3 0 0 0 0 0 0 0 0 0 0 15 7.6
Total 15 7 11 5 19 4 30 47 2 8 28 22 198 100.0
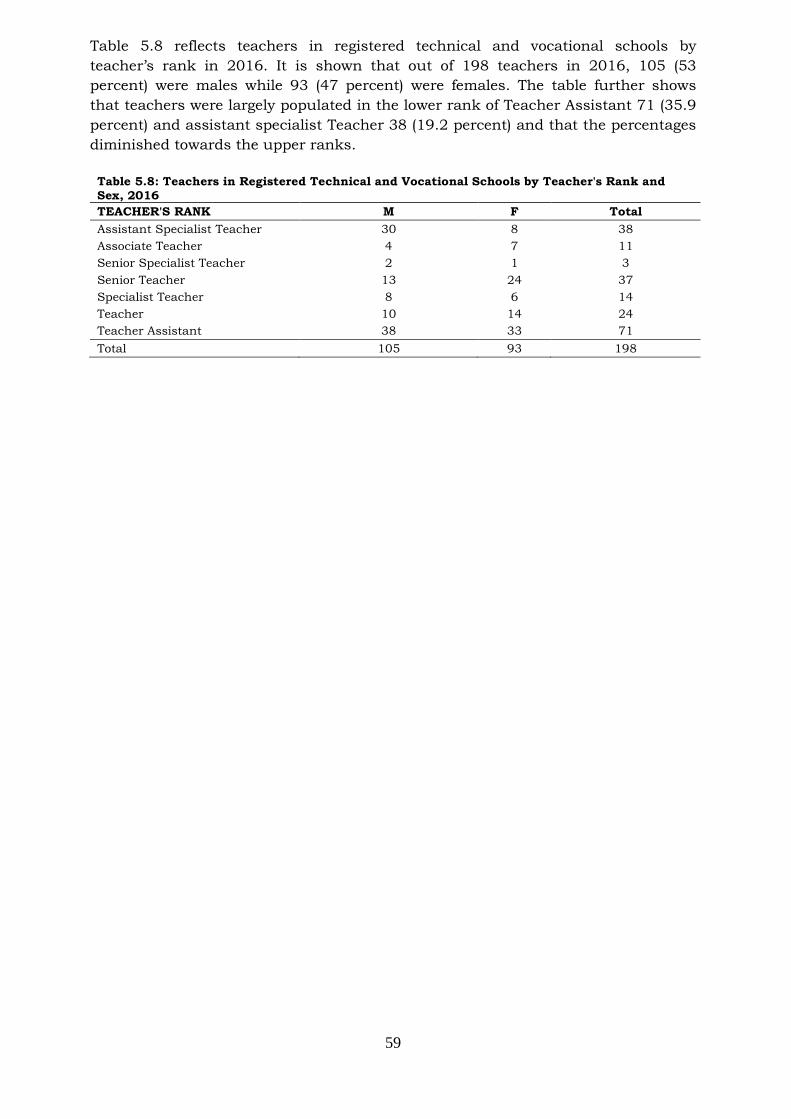
59
Table 5.8 reflects teachers in registered technical and vocational schools by teacher’s rank in 2016. It is shown that out of 198 teachers in 2016, 105 (53 percent) were males while 93 (47 percent) were females. The table further shows that teachers were largely populated in the lower rank of Teacher Assistant 71 (35.9 percent) and assistant specialist Teacher 38 (19.2 percent) and that the percentages diminished towards the upper ranks.
Table 5.8: Teachers in Registered Technical and Vocational Schools by Teacher's Rank and Sex, 2016 TEACHER'S RANK M F Total Assistant Specialist Teacher 30 8 38 Associate Teacher 4 7 11 Senior Specialist Teacher 2 1 3 Senior Teacher 13 24 37 Specialist Teacher 8 6 14 Teacher 10 14 24 Teacher Assistant 38 33 71 Total 105 93 198

60
Chapter 6: Non Formal Education 6.0 Introduction
Non Formal Education (NFE) may be defined as a type of education in which content is adapted to suit the unique needs of students in order to maximize their learning capacity. It is more learner-centred, as optional curriculum is emphasized unlike formal education where the prescribed sequential curriculum is used. NFE learning is facilitated typically through interest-based courses, workshops, community courses, projects and or seminars. Much like formal education, learning takes place in formal learning environments (learning centres) which do not however observe the usual formal school education conventions such as keeping roll, enforcing discipline and writing reports.
There are several bodies that govern institutions belonging to this category in Lesotho. Principally, as part of the government's vision for the role of education in the development process, the Lesotho Distance Teaching Centre (LDTC) was set up in order to complement formal school education; to provide a broader and more practical form of education; and to reach larger and more diverse learners. It covers both formal and non-formal divisions of education. The former is facilitated through correspondence courses at Junior Certificate (JC) and Cambridge Overseas School Certificate (COSC) levels, whereas the latter is facilitated by providing basic practical skills to a large proportion of the population living in the country’s rural areas and offers opportunities for out-of-school youth and adults to develop their literacy and numeracy skills. Apart from LDTC there are other institutions and associations which recognize NFE initiatives in Lesotho such as ‘Lesotho Girl Guides Association’ (LGGA), ‘Lesotho Correctional Services’ (LCS) and ‘Lesotho Association of Non Formal Education’ (LANFE). These institutions or associations are affiliated with LDTC in terms of providing training of teachers, teachers’ guide materials, and learners’ books.
6.1 Enrolment
Table 6.1 portrays enrolment in non-formal education by age, level and sex in 2016. The table reveals uneven distribution of enrolment by sex in favour of males whereby males were recorded as 6,994 which results at 71 percent and females 2,828 (29 percent). Age distribution shows that 2,671 (27 percent) was enrolment of learners below 19 years and 7,151 (72 percent) was the number of learners above 18 years. The table also highlights that most learners below 18 years were enrolled under literacy and numeracy, represented by 2,343 which is 88 percent; it was followed by those who were pursuing secondary constituting 223(14.4 percent) and primary with 105 (4 percent). Sex disparity within those aged below 19 years indicates a wide gap between males and females enrolled whereby 2,334 (87 percent) were males and 337 (13 percent) were their female counterparts. However, the gap reduced between male and female learners aged above 18 years, since males were 4,660 (65 percent) while females were 2,491 (35 percent).

61
Table 6.1:Enrolment in Non-Formal Education by Age, Level and Sex, 2016 LITERACY AND NUMERACY PRIMARY SECONDARY TOTAL
AGE M F Total M F Total M F Total M F Total
<6 30 26 56 38 26 64 0 0 0 68 52 120 6 1 0 1 1 0 1 0 0 0 2 0 2 7 5 0 5 0 0 0 0 0 0 5 0 5 8 16 3 19 0 0 0 0 0 0 16 3 19 9 23 3 26 0 0 0 0 0 0 23 3 26 10 92 0 92 0 0 0 0 0 0 92 0 92 11 89 5 94 0 0 0 0 0 0 89 5 94 12 160 2 162 0 0 0 0 2 2 160 4 164 13 207 5 212 0 0 0 0 0 0 207 5 212 14 261 12 273 0 0 0 1 2 3 262 14 276 15 413 10 423 2 1 3 2 0 2 417 11 428 16 317 18 335 5 0 5 8 23 31 330 41 371 17 271 21 292 8 2 10 22 37 59 301 60 361 18 321 32 353 13 9 22 28 98 126 362 139 501 Sub Total 2206 137 2343 67 38 105 61 162 223 2334 337 2671 19 376 35 411 7 6 13 42 137 179 425 178 603 20 472 78 550 8 14 22 55 155 210 535 247 782 21-35 1703 518 2221 73 50 123 198 555 753 1974 1123 3097 36-55 1204 514 1718 27 10 37 25 91 116 1256 615 1871 >55 459 300 759 5 8 13 6 20 26 470 328 798 Sub Total 4214 1445 5659 120 88 208 326 958 1284 4660 2491 7151 Total 6420 1582 8002 187 126 313 387 1120 1507 6994 2828 9822
Table 6.2 demonstrates the enrolment of non-formal education by district, level and sex for the year 2016. Total enrolment by district reveals that the highest number of learners were in Mokhotlong and Thaba Tseka which were recorded as 2, 298 (23 percent) and 1,403 (14 percent), respectively. They were followed by Maseru and Mafeteng with 1,175 (12 percent) and 1,044 (11 percent) orderly.
The table furthermore shows that continuing with primary education under this level of education, Maseru had the highest percentage of 80, and it was followed by Mohale’s Hoek and Mafeteng with 7 and 4 percent respectively. In secondary continuing education, Leribe was leading with 259 (17 percent) followed by Mohale’s Hoek and Quthing with 200 (13 percent) and 191 (13 percent), separately.
With regard to Literacy and Numeracy, district comparison shows that Mokhotlong was leading with 2,117 (26 percent); it was followed by Thaba-Tseka with 1,319 (16 percent), Berea with 885 (11 percent) and Mafeteng with 841 (11 percent).

62
Table 6.2: Enrolment in Non-Formal Education by District, Level and Sex, 2016
DISTRICT Literacy and Numeracy PRIMARY SECONDARY TOTAL
M F Total M F Total M F Total M F Total
BUTHA-BUTHE 141 96 237 0 0 0 23 85 108 164 181 345 LERIBE 334 188 522 7 4 11 54 205 259 395 397 792 BEREA 622 263 885 8 3 11 4 39 43 634 305 939 MASERU 657 153 810 161 90 251 43 71 114 861 314 1175 MAFETENG 567 274 841 0 12 12 49 142 191 616 428 1044 MOHALES HOEK 201 28 229 9 13 22 38 147 185 248 188 436 QUTHING 176 39 215 0 0 0 54 146 200 230 185 415 QACHAS NEK 593 234 827 0 0 0 53 95 148 646 329 975 MOKHOTLONG 2069 48 2117 2 4 6 53 122 175 2124 174 2298 THABA-TSEKA 1060 259 1319 0 0 0 16 68 84 1076 327 1403
Total 6420 1582 8002 187 126 313 387 1120 1507 6994 2828 9822
6.2 Special Educational Needs Table 7.3 displays non-formal education learners with special education needs by district, level and sex for the year 2016. Out of 9,822 learners enrolled in NFE, 346 learners were identified as those with special educational needs in 2016. As indicated in the table, Thaba Tseka generally topped with 84 students with special education while Maseru followed with 66 and Berea with 53 learners with special education. Most learners were in Literacy and numeracy and accounted for 92 percent of the total enrolment and those in continuing education in both primary and secondary contributed 8 percent. Males with special educational needs were 228 (66 percent); this number surpassed their female counterparts who were 118 (34 percent). Table 6.3: Non Formal Education Learners with Special Educational Needs by District, Level and Sex, 2016
DISTRICT Literacy and Numeracy
Primary Secondary Total
M F Total M F Total M F Total M F Total BOTHA-BOTHE 4 3 7 0 0 0 0 0 0 4 3 7 LERIBE 18 10 28 0 0 0 1 0 1 19 10 29 BEREA 29 11 40 0 0 0 0 13 13 29 24 53 MASERU 35 21 56 3 1 4 6 0 6 44 22 66 MAFETENG 24 19 43 0 0 0 0 0 0 24 19 43 MOHALE’S HOEK 1 0 1 0 0 0 1 1 2 2 1 3 QUTHING 2 0 2 0 0 0 0 0 0 2 0 2 QACHA’S NEK 18 7 25 0 0 0 1 0 1 19 7 26 MOKHOTLONG 33 0 33 0 0 0 0 0 0 33 0 33 THABA-TSEKA 52 32 84 0 0 0 0 0 0 52 32 84 Total 216 103 319 3 1 4 9 14 23 228 118 346

63
6.3 Orphan-Hood Out of the total enrolment in non-formal education, 732 students were orphans; out of which 524 (72 percent) were male orphans while female orphans were 208 (28 percent). Under literacy and numeracy, 89 percent were male orphans and 11 percent were female orphans. For those who were continuing with primary education, the males accounted for 61 percent whereas among those who were continuing with secondary education, majority were female orphans with 76 percent. Distribution of orphans by age shows that the number of orphans increases with an increase in age, thus, at younger ages there were few orphans, but as age increased the number of orphans also rose. The number of male orphans was higher than the number of female orphans in all ages except for ages less than six years whereby there were more female orphans in 2016 than male orphans. Table 6.4: Orphans in Non-Formal Education by Age, Level and Sex, 2016
Age Literacy and Numeracy
Primary Secondary Total
M F Total M F Total M F Total M F Total
<6 13 14 27 13 14 27 0 0 0 26 28 54
6 0 0 0 0 0 0 0 0 0 0 0 0
7 0 0 0 0 0 0 0 0 0 0 0 0
8 1 0 1 0 0 0 0 0 0 1 0 1
9 5 0 5 0 0 0 0 0 0 5 0 5
10 32 0 32 0 0 0 0 0 0 32 0 32
11 15 1 16 0 0 0 0 0 0 15 1 16
12 26 2 28 0 0 0 0 2 2 26 4 30
13 50 0 50 0 0 0 0 0 0 50 0 50
14 58 3 61 0 0 0 1 1 2 59 4 63
15 68 7 75 1 2 3 0 4 4 69 13 82
16 83 8 91 5 2 7 2 6 8 90 16 106
17 61 14 75 8 3 11 9 34 43 78 51 129
18 36 5 41 8 1 9 29 85 114 73 91 164
Total 448 54 502 35 22 57 41 132 173 524 208 732
6.4 Teaching Staff
Table 6.5 displays teachers in non-formal education by district, level and sex for the year 2016. The number of teachers in NFE increased from 520 in 2015 to 536 in 2016 implying 3 percent growth. Maseru was leading with the number of teachers in non-formal education who were estimated at 15.4 percent, followed by Thaba Tseka and Mokhotlong that shared 14.9 percent. Under Literacy and Numeracy education Thaba Tseka and Mokhotlong were leading with 17 percent of teachers while in continuing education Maseru had the highest number of teachers of 34 (24 percent). The distribution of number of teachers by sex reveals inequality in favour of females, in both categories of literacy and numeracy education and continuing education with 377 (70 percent) and 159 (30 percent) respectively.

64
Table 6.5: Teachers in Non-Formal Education by District, Level and Sex, 2016
District Literacy and Numeracy Primary and Secondary Total
M F Total M F Total M F Total
BOTHA-BOTHE 2 11 13 7 6 13 9 17 26
LERIBE 9 20 29 13 1 14 22 21 43 BEREA 26 32 58 1 4 5 27 36 63 MASERU 13 36 49 15 19 34 28 55 83 MAFETENG 11 35 46 6 8 14 17 43 60 MOHALE’S HOEK 2 14 16 6 8 14 8 22 30 QUTHING 0 11 11 6 2 8 6 13 19
QACHA’S NEK 3 37 40 6 6 12 9 43 52 MOKHOTLONG 10 56 66 5 9 14 15 65 80 THABA-TSEKA 10 57 67 8 5 13 18 62 80
Total 86 309 395 73 68 141 159 377 536
Table 6.6 illustrates non-formal education teachers in literacy and numeracy by district, qualification and sex for the year 2016. It can be observed from the table that there were 395 literacy and numeracy teachers out of which 158 (40 percent) had primary education, 82 (21 percent) had Junior Certificate, 78 (20 percent) had COSC and 77 (20 percent) had qualifications higher than COSC such as Diplomas, Bachelors Degree and many others.
Table 6.6: Non-Formal Education Teachers in Literacy and Numeracy by District, Qualification and Sex, 2016
DISTRICT PRIMARY
EDUCATION JUNIOR
CERTIFICATE COSC ABOVE COSC TOTAL
M F T M F T M F T M F T M F T
BOTHA-BOTHE 0 0 0 0 3 3 1 5 6 1 3 4 2 11 13 LERIBE 0 1 1 3 6 9 3 10 13 3 3 6 9 20 29 BEREA 4 9 13 5 8 13 9 7 16 8 8 16 26 32 58 MASERU 1 15 16 0 3 3 2 3 5 10 15 25 13 36 49 MAFETENG 3 6 9 1 13 14 5 10 15 2 6 8 11 35 46 MOHALE’S HOEK 0 10 10 0 1 1 2 0 2 0 3 3 2 14 16 QUTHING 0 9 9 0 0 0 0 0 0 0 2 2 0 11 11 QACHA’S NEK 0 18 18 1 12 13 1 5 6 1 2 3 3 37 40 MOKHOTLONG 5 46 51 0 5 5 2 3 5 3 2 5 10 56 66 THABA-TSEKA 4 27 31 4 17 21 2 8 10 0 5 5 10 57 67 Total 17 141 158 14 68 82 27 51 78 28 49 77 86 309 395
Table 6.7 reveals that out of total number of 387 learning posts and centres, literacy and numeracy had 371 (96percent) while continuing education had only 16 (4 percent). The Majority of literacy and numeracy learning posts were in the mountainous districts namely Mokhotlong and Thaba-Tseka. Mokotlong was forefront with 69 (19 percent) learning posts followed by Thaba Tseka with 66 (18 percent). Most of the districts had at least one ‘continuing education’ centre except Maseru and Berea that had 6 and 2 learning centres correspondingly.

65
Table 6.7: Number of Learning Posts/Centres in Non-Formal Education by District and Level, 2016 DISTRICT Literacy and Numeracy Continuing Education Total BOTHA-BOTHE 13 1 14 LERIBE 29 1 30 BEREA 52 2 54 MASERU 31 6 37 MAFETENG 46 1 47 MOHALE’S HOEK 14 1 15 QUTHING 11 1 12 QACHA’S NEK 40 1 41 MOKHOTLONG 69 1 70 THABA-TSEKA 66 1 67 Total 371 16 387

66
ANNEX I: Technical Notes
Gross Enrolment Ratio: Enrolment in a specified level of education regardless of age expressed as a percentage of the total official age population for that level. This indicator is used to show the general level of participation in a particular level of education. It is also used to indicate the degree in which over-aged and under aged children enrol in schools. A high Gross Enrolment Ratio indicates that, there is a high degree of participation. Hence, a value of 100 shows that, all the school age population can be able to go to school. This indicator can exceed 100 as a result of over-aged and under-aged pupils.
Net Enrolment Ratio: Enrolees of the official age for a specified level of education expressed as a percentage of the total official age population for that level. It is used to show the degree of participation of children in a given level of education who are of the official age for that given level. The higher the value of this ratio, the higher the level of participation of the official age population. The maximum value for this indicator is 100.
Apparent Intake Rate: New entrants in the first grade of primary, regardless of age, expressed as a percentage of the population of the official age for primary education. It indicates the capacity of the education system to provide access to the first grade for the official primary school entrance age. This rate can be more than 100 due to over-aged and under-aged children.
Net Intake Rate: These are new entrants who are of the official entrance age in the first grade of primary education, expressed as a percentage of the population of the same age. The main purpose of this indicator is to show the level of access to primary education of the eligible population of primary school-entrance age. A high rate of this indicator indicates a high degree of access to primary education for the official primary school-entrance age children.
Repetition Rate: This represents the proportion of pupils enrolled in a given grade at a given school year, who are still enrolled in the same grade the following school year. This indicator should as low as possible approach zero if the internal efficiency of the education system high.
Promotion Rate: This shows the proportion of pupils enrolled in a given grade who are enrolled in the next higher grade the following year. Promotion rates can indicate the quality of the education system. The maximum value of this rate is 100.
Dropout Rate: Represents the proportion of pupils who neither passed nor came back the following year. This indicator is expected to decrease.
Pupil Teacher Ratio: It represents the average number of pupils per teacher in a specified level of education in a particular year. This indicator should be lower since a high ratio indicates a large number of pupils to be attended by one teacher.

67
ANNEX II: SUMMARY INDICATORS 1. Primary Education Level
2007 2008 2009 2010 2011 2012 2013 2014 2015 2016
A. Access 1. GER Males 120.8 119.3 116.2 116.2 114.6 111.6 105.8 103.4 101.0
Females 120.2 118.6 116.2 113.9 113.3 108.8 103.9 101.1 98.5
Total 120.5 119.0 116.2 115.1 113.0 110.2 104.9 102.3 99.8
2. NER
Males 79.5 79.9 78.6 80.1 80.2 79.6 75.6 75.1 74.4
Females 83.4 84.1 83.2 83.5 83.1 82.6 79.0 78.2 77.2
Total 81.4 82.0 80.9 81.8 81.6 81.1 77.3 76.6 75.8
3. AIR
Males 111.5 106.1 105.5 106.1 105.1 103.3 97.1 99.4 111.1
Females 105.1 102.7 98.8 98.2 99.4 97.3 90.8 92.6 99.7
Total 108.3 104.4 102.2 102.2 102.2 100.4 94.0 96.1 104.4
4. NIR
Males 54.7 54.8 55.4 60.8 58.0 56.9 53.9 55.3 59.5
Females 55.0 56.5 54.7 59.1 59.1 57.7 52.8 54.7 58.2
Total 75.0 55.6 55 60.0 58.5 57.3 53.3 55.0 58.8
B. Efficiency
1. Promotions
Total - - - - 82.5 83.6 90.4 90.5
2. Repetitions
Total 20.9 19.1 20.0 19.3 16.5 13.2 8.7 8.3
3. Dropouts
Total - - - - 4.9 3.2 0.9 1.2
4.Completion Rates
Total 83.0 - - 80.9 79.9 78.2 78.8
C.Quality Indicators
Pupil: Teacher Ratio
37 35 34 34 34 34 33 33 34
Qualified Teacher Ratio
60.0 - - - - 50 45 42 41
Pupil: Classroom Ratio
55.0 - - - - - 47 44 45

68
2. Secondary Education Level
A. Access 2005 2006 2007 2008 2009 2010 2011 2012 2013 2014 2015 2016
1. GER Males 34.2 34.8 35.5 37.1 39.7 44.4 46.5 46.9 46.9 47.1 47.3
Females 44 44.9 47.3 50.6 55.8 61.9 64.4 64 63.6 64.5 64.5
Total 39.1 39.8 41.4 43.8 47.7 53.1 55.4 55.4 55.2 55.7 55.8
2. NER Males 19.6 20 20.8 22.3 23.8 26 27.6 28.5 29.2 29.4 30.4
Females 31.2 31.4 33.4 35.9 39.4 42.5 44.2 44.6 45.6 46.2 47.3
Total 25.4 25.7 27 29 31.5 34.2 35.8 36.5 37.3 37.7 38.7
B. Efficiency 1.Transition Rates Standard 7- Form A
Males 69.6 70.3 68.3 68 71.7 75.3 72.5 74.8 74.3 74.4 75.6
Females 68.3 69.1 66.4 70 74.1 75.6 75.2 74.8 74.9 76.1 77.9
Total 68.9 69.6 67.2 69.2 73.1 75.5 74 74.8 74.6 75.4 76.9
2.Transition Rates Form C – Form D
Males 75.2 75.2 68.7 71.8 71.7 78.6 73.6 69.7 70.4 71.1
Females 73.7 73.7 67 75.7 78.2 76.2 75.3 72.7 72.6 70.2
Total 74.4 74.4 67.7 74 75.3 77.2 74.6 71.4 71.4 70.6
C. Quality Pupil: Teacher Ratio 26.6 25.7 24.4 24 23.5 25.8 24.9 25.1 24.1 23.9 24.0 24.0 Qualified Teacher Ratio 25.5 25.3 26.0
Class Ratio 40.0 39.9

69
ANNEX III: Population projections
Table 1A: School Age Population
YEARS
AGE 2005 2006 2007 2008 2009 2010 2011 M F M F M F M F M F M F M F
0 28882 28235 29470 28811 29870 29186 29635 28957 29399 28728 29164 28499 28930 28270 1 27205 26729 27772 27288 28450 27938 28851 28311 28624 28088 28396 27865 28169 27643 2 26273 25819 26834 26372 27402 26937 28072 27580 28483 27957 28258 27737 28033 27516 3 25355 24923 25910 25470 26472 26029 27034 26588 27695 27223 28116 27604 27893 27386 4 24581 24201 25000 24581 25556 25135 26112 25687 26666 26239 27320 26867 27749 27252 0-4 132296 129907 134986 132522 137750 135225 139704 137123 140867 138235 141254 138572 140774 138067
5 24469 24087 24473 24077 24884 24454 25438 25003 25991 25553 26543 26103 27194 26728 6 24510 24101 24437 24036 24516 24086 24831 24383 25384 24932 25936 25481 26486 26029 7 24383 23976 24310 23912 24321 23912 24400 23961 24617 24181 25165 24725 25712 25270 8 24161 23774 24089 23711 24105 23715 24116 23716 24194 23764 24315 23906 24856 24445 9 23827 23307 23850 23497 23867 23502 23882 23506 23892 23507 23970 23555 23997 23620 5-9 121350 119245 121159 119233 121693 119669 122667 120569 124078 121937 125929 123770 128245 126092
10 24065 23590 23660 23150 23674 23330 23690 23335 23706 23339 23715 23339 23792 23387 11 23911 23555 23973 23495 23464 22965 23570 23225 23587 23230 23602 23234 23611 23234 12 23975 23677 23881 23510 23835 23357 23329 22830 23527 23170 23544 23175 23558 23178 13 24167 23876 23986 23662 23785 23402 23740 23249 23235 22724 23525 23144 23542 23149 14 23944 23666 24197 23868 23912 23563 23712 23304 23666 23151 23163 22629 23545 23128 10-14
120062 118364 119697 117685 118670 116617 118041 115943 117721 115614 117549 115521 118048 116076
15 23947 23621 23857 23550 24107 23746 23823 23442 23623 23185 23578 23033 23076 22512 16 23983 23568 23825 23465 23762 23418 23989 23588 23706 23286 23507 23030 23461 22879 17 24060 23507 23837 23376 23711 23300 23648 23253 23852 23397 23570 23097 23372 22842 18 24169 23428 23884 23272 23697 23168 23572 23093 23510 23047 23690 23165 23410 22867 15-18
96159 94124 95403 93663 95277 93632 95032 93376 94691 92915 94345 92325 93319 91100
Total 469867 461640 471245 463103 473390 465143 475444 467011 477357 468701 479077 470188 480386 471335