2016 demographics - military onesourcedownload.militaryonesource.mil/12038/mos/reports/... ·...
TRANSCRIPT

2016 D E M O G R A P H I C S
PROFILE OF THE MILITARY COMMUNITY

ACKNOWLEDGEMENTS
This report is published by the Department of Defense (DoD), Office of the Deputy Assistant Secretary of Defense for Military Community and Family Policy (ODASD (MC&FP)), under contract with ICF (https://www.icf.com/services/human-capital-management-and-training).
A special thank you is given to the Defense Manpower Data Center staff who provided data and support for this document.

This page is intentionally blank.

Table of Contents
2016 Demographics Report
Table of Contents EXECUTIVE SUMMARY ........................................................................................................................ i
INTRODUCTION ................................................................................................................................ ix
SECTION 1: TOTAL MILITARY FORCE .................................................................................................... 1
TOTAL MILITARY FORCE ......................................................................................................................... 3 DOD CIVILIAN PERSONNEL ..................................................................................................................... 5 CHARACTERISTICS OF THE TOTAL MILITARY FORCE ............................................................................... 6
SECTION 2: ACTIVE DUTY MEMBERS ................................................................................................. 11
ACTIVE DUTY PERSONNEL .................................................................................................................... 13 GENDER ................................................................................................................................................ 18 RACE/ETHNICITY ................................................................................................................................... 23 GEOGRAPHIC LOCATION ...................................................................................................................... 30 AGE ....................................................................................................................................................... 35 EDUCATION .......................................................................................................................................... 39 MARITAL STATUS .................................................................................................................................. 42 PERSONNEL SEPARATIONS ................................................................................................................... 53
SECTION 3: RESERVE AND GUARD MEMBERS .................................................................................... 57
READY RESERVE PERSONNEL ................................................................................................................ 59 GENDER ................................................................................................................................................ 66 RACE/ETHNICITY ................................................................................................................................... 74 GEOGRAPHIC LOCATION ...................................................................................................................... 83 AGE ....................................................................................................................................................... 89 EDUCATION .......................................................................................................................................... 93 MARITAL STATUS .................................................................................................................................. 96 RESERVE LOSSES ................................................................................................................................. 109
SECTION 4: TOTAL FORCE FAMILIES ................................................................................................ 115
TOTAL FORCE FAMILIES ...................................................................................................................... 117
SECTION 5: ACTIVE DUTY FAMILIES ................................................................................................. 121
FAMILY MEMBERS .............................................................................................................................. 123 FAMILY STATUS .................................................................................................................................. 126 SPOUSES ............................................................................................................................................. 130 DEPENDENTS ...................................................................................................................................... 135
SECTION 6: RESERVE AND GUARD FAMILIES .................................................................................... 143
FAMILY MEMBERS .............................................................................................................................. 145 FAMILY STATUS .................................................................................................................................. 148 SPOUSES ............................................................................................................................................. 153 DEPENDENTS ...................................................................................................................................... 155

Table of Contents
2016 Demographics Report
SECTION 7: REFERENCE TABLES....................................................................................................... 165
2017 BASIC MONTHLY PAY ................................................................................................................. 167 2017 BASIC ALLOWANCE FOR SUBSISTENCE ...................................................................................... 169 2017 DRILL PAY FOR ENLISTED MEMBERS ......................................................................................... 170 2017 DRILL PAY FOR OFFICERS ........................................................................................................... 172 ARMED FORCES COMPARATIVE PAY GRADES AND RANKS ................................................................ 174 UNITED STATES INSTALLATION POPULATION BY STATE .................................................................... 175 INTERNATIONAL POPULATION BY CONTINENT .................................................................................. 186
DATA SOURCES AND REFERENCES .................................................................................................. 187
Table of Exhibits
2016 Demographics Report
Table of Exhibits SECTION 1: TOTAL MILITARY FORCE .................................................................................................... 1
TOTAL MILITARY FORCE ......................................................................................................................... 3
1.01 Military Personnel and Military Civilians (N=3,509,834) .............................................................. 3 1.02 Active Duty and Ready Reserve Personnel (N=2,413,302) ........................................................... 4
DOD CIVILIAN PERSONNEL ..................................................................................................................... 5
1.03 DoD Appropriated Funds (APF) Civilians (N=751,333) ................................................................. 5 1.04 DoD Non-Appropriated Funds (NAF) Civilians (N=123,924) ......................................................... 5
CHARACTERISTICS OF THE TOTAL MILITARY FORCE ............................................................................... 6
1.05 Enlisted Members and Officers in the Total Military Force (N=2,100,328) .................................. 6 1.06 Gender of the Total Military Force (N=2,100,328) ....................................................................... 6 1.07 Race of the Total Military Force (N=2,100,328) ........................................................................... 7 1.08 Hispanic Ethnicity of the Total Military Force (N=2,100,328) ...................................................... 8 1.09 Age of the Total Military Force (N=2,100,328) ............................................................................. 9 1.10 Marital Status of the Total Military Force (N=2,100,328) ............................................................ 9 1.11 Gender of the Total Military Force Trends: 2000–2016 ............................................................. 10
SECTION 2: ACTIVE DUTY MEMBERS ................................................................................................. 11
ACTIVE DUTY PERSONNEL .................................................................................................................... 13
2.01 Enlisted Members and Officers on Active Duty (N=1,288,596) .................................................. 13 2.02 Number and Ratio of Active Duty Enlisted Members to Officers by Service Branch ................. 13 2.03 Active Duty Personnel By Service Branch (N=1,288,596) ........................................................... 14 2.04 Number and Percentage of Active Duty Personnel by Service Branch and Pay Grade .............. 15 2.05 Number of Active Duty Enlisted Members and Officers Trends: 2000–2016 ............................ 16 2.06 Ratio of Active Duty Enlisted Members to Officers by Service Branch Trends: 2000–2016 ...... 16 2.07 Number of Active Duty Personnel by Service Branch Trends: 2000–2016 ................................ 16 2.08 Active Duty Members by Service Branch Trends: 2000–2016 ................................................... 17
GENDER ................................................................................................................................................ 18
2.09 Gender of Active Duty Members (N=1,288,596) ........................................................................ 18 2.10 Gender of Active Duty Enlisted Members (N=1,060,141) .......................................................... 18 2.11 Gender of Active Duty Officers (N=228,455) .............................................................................. 19 2.12 Number and Ratio of Active Duty Enlisted Members and Officers by Service Branch and
Gender ........................................................................................................................................ 19 2.13 Percentage of Active Duty Enlisted Members and Officers by Service Branch and Gender ...... 20 2.14 Number of Male and Female Active Duty Members by Service Branch and Pay Grade ............ 20 2.15 Number of Active Duty Male and Female Enlisted Members by Service Branch Trends:
2000–2016 .................................................................................................................................. 21 2.16 Number of Active Duty Male and Female Officers by Service Branch Trends: 2000–2016 ....... 21 2.17 Percentage of Active Duty Male and Female Enlisted Members by Service Branch Trends:
2000–2016 .................................................................................................................................. 22 2.18 Percentage of Active Duty Male and Female Officers by Service Branch Trends: 2000–2016 .. 22
Table of Exhibits
2016 Demographics Report
RACE/ETHNICITY ................................................................................................................................... 23
2.19 Race of Active Duty Members (N=1,288,596) ............................................................................ 23 2.20 Race of Active Duty Enlisted Members (N=1,060,141) .............................................................. 24 2.21 Race of Active Duty Officers (N=228,455) .................................................................................. 25 2.22 Number and Percentage of Active Duty Members by Ethnicity and Race ................................. 25 2.23 Number of Active Duty Racial Minority Enlisted Members and Officers by Race and Service
Branch ......................................................................................................................................... 26 2.24 Percentage of Active Duty Racial Minority Enlisted Members and Officers by Race and
Service Branch ............................................................................................................................ 26 2.25 Racial Minority Enlisted Members and Officers on Active Duty (N=404,796) ........................... 27 2.26 Number and Ratio of Active Duty Racial Minority Enlisted Members and Officers by Service
Branch ......................................................................................................................................... 27 2.27 Percentage of Active Duty Racial Minorities and Non-minorities by Service Branch and Pay
Grade .......................................................................................................................................... 28 2.28 Number of Active Duty Racial Minority Enlisted Members and Officers by Service Branch
Trends: 2000–2016 ..................................................................................................................... 28 2.29 Percentage of Active Duty Racial Minority Enlisted Members and Officers by Service Branch
Trends: 2000–2016 ..................................................................................................................... 29 2.30 Percentage of Racial Minorities on Active Duty by Service Branch Trends: 2000–2016............ 29
GEOGRAPHIC LOCATION ...................................................................................................................... 30
2.31 Worldwide Geographic Location of Active Duty Members (N=1,288,596) ................................ 30 2.32 Worldwide Geographic Location of Active Duty Enlisted Members (N=1,060,141) .................. 31 2.33 Worldwide Geographic Location of Active Duty Officers (N=228,455) ...................................... 32 2.34 Worldwide Geographic Location by Service Branch ................................................................... 32 2.35 Number and Percentage of Active Duty Members within the United States by State .............. 33 2.36 Number and Percentage of Active Duty Members by Worldwide Geographic Location
Trends: 2000–2016 ..................................................................................................................... 34
AGE ....................................................................................................................................................... 35
2.37 Age of Active Duty Members (N=1,288,596) .............................................................................. 35 2.38 Age of Active Duty Enlisted Members (N=1,060,141) ................................................................ 35 2.39 Age of Active Duty Officers (N=228,455) .................................................................................... 36 2.40 Number of Active Duty Enlisted Members and Officers by Service Branch and Age ................. 36 2.41 Percentage of Active Duty Enlisted Members and Officers by Service Branch and Age ............ 37 2.42 Average Age of Active Duty Enlisted Members and Officers by Service Branch ........................ 37 2.43 Active Duty Member Age Trends: 2000–2016 ........................................................................... 38 2.44 Average Age of Active Duty Enlisted Members and Officers Trends: 2000–2016 ..................... 38
EDUCATION .......................................................................................................................................... 39
2.45 Education Level of Active Duty Members (N=1,288,596) .......................................................... 39 2.46 Education Level of Active Duty Enlisted Members (N=1,060,141) ............................................. 39 2.47 Education Level of Active Duty Officers (N=228,455) ................................................................ 40 2.48 Number of Active Duty Members by Service Branch and Education Level ................................ 40 2.49 Percentage of Active Duty Enlisted Members by Education Level Trends: 2000–2016 ............. 41 2.50 Percentage of Active Duty Officers by Education Level Trends: 2000–2016 ............................. 41

Table of Exhibits
2016 Demographics Report
MARITAL STATUS .................................................................................................................................. 42
2.51 Marital Status of Active Duty Members (N=1,288,596) ............................................................. 42 2.52 Marital Status of Active Duty Enlisted Members (N=1,060,141) ............................................... 42 2.53 Marital Status of Active Duty Officers (N=228,454) ................................................................... 43 2.54 Marital Status of Active Duty Members by Service Branch ........................................................ 43 2.55 Number and Percentage of Married Active Duty Members by Pay Grade and
Service Branch ............................................................................................................................ 44 2.56 Number of Married Active Duty Members by Service Branch and Gender ............................... 44 2.57 Percentage of Married Active Duty Members by Service Branch and Gender .......................... 45 2.58 Average Age of Married Active Duty Enlisted Members and Officers by Service Branch .......... 46 2.59 Number and Percentage of Active Duty Enlisted Members and Officers in Dual-Military
Marriages by Service Branch ...................................................................................................... 46 2.60 Percentage of Married Active Duty Enlisted Members and Officers in Dual-Military
Marriages by Service Branch ...................................................................................................... 46 2.61 Active Duty Members in Dual-Military Marriages by Pay Grade (N=84,553) ............................. 47 2.62 Percentage of Active Duty Members in Dual-Military Marriages by Service Branch and
Gender (N=1,288,596) ................................................................................................................ 47 2.63 Percentage of Married Active Duty Members in Dual-Military Marriages by Service Branch
and Gender (N=689,053) ............................................................................................................ 48 2.64 Estimated Number and Percentage of Enlisted Member and Officer Divorces by Service
Branch ......................................................................................................................................... 48 2.65 Marriage Trends of Active Duty Members: 2000–2016 ............................................................. 49 2.66 Percentage of Married Active Duty Enlisted Members and Officers Trends: 2000–2016 ......... 49 2.67 Percentage of Married Active Duty Members by Service Branch Trends: 2000–2016 .............. 50 2.68 Marriage Trends by Service Branch: 2000–2016 ........................................................................ 50 2.69 Average Age of Married Active Duty Enlisted Members by Service Branch Trends: 2000–
2016 ............................................................................................................................................ 51 2.70 Average Age of Married Active Duty Officers by Service Branch Trends: 2000–2016 ............... 51 2.71 Percentage of Active Duty Enlisted Members and Officers in Dual-Military Marriages by
Service Branch Trends: 2005–2016 ............................................................................................ 51 2.72 Estimated Percentage of Divorces Among Active Duty Enlisted Members and Officers by
Service Branch Trends: 2000–2016 ............................................................................................ 52 2.73 Estimated Percentage of Divorces by Service Branch Trends: 2000–2016 ................................ 52
PERSONNEL SEPARATIONS ................................................................................................................... 53
2.74 Active Duty Separations (N=186,793)......................................................................................... 53 2.75 Active Duty Enlisted Member Separations (N=167,883) ............................................................ 53 2.76 Active Duty Officer Separations (N=18,910) ............................................................................... 54 2.77 Active Duty Separations by Service Branch (N=186,793) ........................................................... 54 2.78 Number of Active Duty Enlisted Member and Officer Separations by Service Branch and
Major Category of Separation .................................................................................................... 55 2.79 Number of Active Duty Enlisted Member and Officer Separations by Service Branch and
Type of Separation ...................................................................................................................... 55 2.80 Number of Retired Active Duty Enlisted Members and Officers by Service Branch and
Type of Retirement ..................................................................................................................... 56 2.81 Active Duty Separations by Service Branch Trends: 2000–2016 ................................................ 56

Table of Exhibits
2016 Demographics Report
SECTION 3: RESERVE AND GUARD MEMBERS .................................................................................... 57
READY RESERVE PERSONNEL ................................................................................................................ 59
3.01 Ready Reserve Enlisted Members and Officers (N=1,085,109) .................................................. 59 3.02 Number of Ready Reserve Enlisted Members and Officers by Ready Reserve Program and
Reserve Component ................................................................................................................... 59 3.03 Ready Reserve Members by Reserve Component (N=1,085,109) ............................................. 60 3.04 Selected Reserve Enlisted Members and Officers (N=818,305) ................................................. 60 3.05 Number and Ratio of Selected Reserve Enlisted Members to Officers by Reserve
Component ................................................................................................................................. 61 3.06 Selected Reserve Personnel by Reserve Component (N=818,305) ............................................ 61 3.07 Number of Selected Reserve Personnel by Reserve Component and Pay Grade ...................... 62 3.08 Percentage of Selected Reserve Personnel by Reserve Component and Pay Grade ................. 63 3.09 Number of Selected Reserve Enlisted Member and Officer Trends: 2000–2016 ...................... 64 3.10 Ratio of Selected Reserve Enlisted Members to Officers by Reserve Component Trends:
2000–2016 .................................................................................................................................. 64 3.11 Number of Selected Reserve Personnel by Reserve Component Trends: 2000–2016 .............. 65 3.12 Selected Reserve Members by Reserve Component Trends: 2000–2016 ................................. 65
GENDER ................................................................................................................................................ 66
3.13 Gender of Selected Reserve Members (N=818,305) .................................................................. 66 3.14 Gender of Selected Reserve Enlisted Members (N=686,560) .................................................... 66 3.15 Gender of Selected Reserve Officers (N=131,745) ..................................................................... 67 3.16 Number and Ratio of Selected Reserve Enlisted Members and Officers by Gender and
Reserve Component ................................................................................................................... 67 3.17 Percentage of Enlisted Members and Officers in the Selected Reserve by Gender and
Reserve Component ................................................................................................................... 68 3.18 Number of Male and Female Selected Reserve Members by Pay Grade and Reserve
Component ................................................................................................................................. 69 3.19 Number of Selected Reserve Male and Female Enlisted Members by Reserve Component
Trends: 2000–2016 ..................................................................................................................... 70 3.20 Number of Selected Reserve Male and Female Officers by Reserve Component Trends:
2000–2016 .................................................................................................................................. 71 3.21 Percentage of Selected Reserve Male and Female Enlisted Members by Reserve
Component Trends: 2000–2016 ................................................................................................. 72 3.22 Percentage of Selected Reserve Male and Female Officers by Reserve Component Trends:
2000–2016 .................................................................................................................................. 73
RACE/ETHNICITY ................................................................................................................................... 74
3.23 Race of Selected Reserve Members (N=818,305) ...................................................................... 74 3.24 Race of Selected Reserve Enlisted Members (N=686,560) ........................................................ 75 3.25 Race of Selected Reserve Officers (N=131,745) ......................................................................... 76 3.26 Number and Percentage of Selected Reserve Members by Ethnicity and Race ........................ 76 3.27 Number of Selected Reserve Racial Minority Enlisted Members and Officers by Race and
Reserve Component ................................................................................................................... 77 3.28 Percentage of Racial Minority Enlisted Members and Officers by Race and Reserve
Component ................................................................................................................................. 78 3.29 Racial Minority Enlisted Members and Officers of the Selected Reserve (N=213,664) ............. 79

Table of Exhibits
2016 Demographics Report
3.30 Number and Ratio of Selected Reserve Racial Minority Enlisted Members and Officers by Reserve Component ................................................................................................................... 79
3.31 Percentage of Selected Reserve Racial Minorities and Non-Minorities by Reserve Component and Pay Grade ......................................................................................................... 80
3.32 Number of Selected Reserve Racial Minority Enlisted Members and Officers by Reserve Component Trends: 2000–2016 ................................................................................................. 81
3.33 Percentage of Selected Reserve Racial Minority Enlisted Members and Officers by Reserve Component Trends: 2000–2016 ................................................................................................. 81
3.34 Percentage of Racial Minorities in the Selected Reserve by Reserve Component Trends: 2000–2016 .................................................................................................................................. 82
GEOGRAPHIC LOCATION ...................................................................................................................... 83
3.35 Worldwide Geographic Location of Selected Reserve Members (N=818,305) .......................... 83 3.36 Worldwide Geographic Location of Selected Reserve Enlisted Members (N=686,560) ............ 84 3.37 Worldwide Geographic Location of Selected Reserve Officers (N=131,745) ............................. 85 3.38 Number and Percentage of Selected Reserve Members by Reserve Component and
Worldwide Geographic Location ................................................................................................ 86 3.39 Number and Percentage of Selected Reserve Members within the United States by State ..... 87 3.40 Number and Percentage of Selected Reserve Members by Worldwide Geographic Location
Trends: 2000–2016 ..................................................................................................................... 88
AGE ....................................................................................................................................................... 89
3.41 Age of Selected Reserve Members (N=818,305) ........................................................................ 89 3.42 Age of Selected Reserve Enlisted Members (N=686,560) .......................................................... 89 3.43 Age of Selected Reserve Officers (N=131,745) ........................................................................... 90 3.44 Number of Selected Reserve Enlisted Members and Officers by Reserve Component and
Age .............................................................................................................................................. 90 3.45 Percentage of Selected Reserve Enlisted Members and Officers by Reserve Component and
Age .............................................................................................................................................. 91 3.46 Average Age of Selected Reserve Enlisted Members and Officers by Reserve Component ...... 91 3.47 Selected Reserve Member Age Trends: 2000–2016 .................................................................. 92 3.48 Average Age of Selected Reserve Enlisted Members and Officers Trends: 2000–2016 ............ 92
EDUCATION .......................................................................................................................................... 93
3.49 Education Level of Selected Reserve Members (N=818,305)..................................................... 93 3.50 Education Level of Selected Reserve Enlisted Members (N=686,560) ....................................... 93 3.51 Education Level of Selected Reserve Officers (N=131,745)........................................................ 94 3.52 Number of Selected Reserve Members by Reserve Component and Education Level .............. 94 3.53 Percentage of Selected Reserve Enlisted Members by Education Level Trends: 2000–2016 .... 95 3.54 Percentage of Selected Reserve Officers by Education Level Trends: 2000–2016 .................... 95
MARITAL STATUS .................................................................................................................................. 96
3.55 Marital Status of Selected Reserve Members (N=818,305) ....................................................... 96 3.56 Marital Status of Selected Reserve Enlisted Members (N=686,560) ......................................... 96 3.57 Marital Status of Selected Reserve Officers (N=131,745) .......................................................... 97 3.58 Marital Status of Selected Reserve Members by Reserve Component ...................................... 97 3.59 Percentage of Married Selected Reserve Members by Pay Grade and Reserve Component
(N=364,537) ................................................................................................................................ 98 3.60 Number of Married Selected Reserve Members by Gender and Reserve Component ............. 98

Table of Exhibits
2016 Demographics Report
3.61 Percentage of Married Selected Reserve Members by Gender and Reserve Component ........ 99 3.62 Average Age of Married Selected Reserve Enlisted Members and Officers by Reserve
Component ............................................................................................................................... 100 3.63 Number of Selected Reserve Enlisted Members and Officers in Dual-Military Marriages by
Reserve Component ................................................................................................................. 100 3.64 Percentage of Selected Reserve Enlisted Members and Officers in Dual-Military Marriages
by Reserve Component ............................................................................................................ 101 3.65 Selected Reserve Members in Dual-Military Marriages by Pay Grade (N=22,191) .................. 101 3.66 Percentage of Selected Reserve Members in Dual-Military Marriages by Reserve
Component and Gender (N=818,305) ...................................................................................... 102 3.67 Percentage of Married Selected Reserve Members in Dual-Military Marriages by Reserve
Component and Gender (N=364,537) ...................................................................................... 102 3.68 Estimated Number and Percentage of Selected Reserve Enlisted Members and Officers
who Divorced by Reserve Component ..................................................................................... 103 3.69 Marriage Trends of Selected Reserve Members: 2000–2016 .................................................. 103 3.70 Percentage of Married Enlisted Members and Officers in the Selected Reserve Trends:
2000–2016 ................................................................................................................................ 104 3.71 Percentage of Married Selected Reserve Members by Reserve Component Trends:
2000–2016 ................................................................................................................................ 104 3.72 Marriage Trends by Reserve Component: 2000–2016 ............................................................. 105 3.73 Average Age of Married Selected Reserve Enlisted Members by Reserve Component
Trends: 2000–2016 ................................................................................................................... 105 3.74 Average Age of Married Selected Reserve Officers by Reserve Component Trends:
2000–2016 ................................................................................................................................ 106 3.75 Percentage of Selected Reserve Enlisted Members and Officers in Dual-Military Marriages
by Reserve Component Trends: 2000–2016 ............................................................................ 106 3.76 Estimated Percentage of Selected Reserve Enlisted Members and Officers who Divorced
by Reserve Component Trends: 2000–2016 ............................................................................ 107 3.77 Estimated Percentage of Selected Reserve Members who Divorced by Reserve
Component Trends: 2000–2016 ............................................................................................... 108
RESERVE LOSSES ................................................................................................................................. 109
3.78 Selected Reserve Member Losses (N=125,933) ....................................................................... 109 3.79 Selected Reserve Enlisted Member Losses (N=112,192) .......................................................... 109 3.80 Selected Reserve Officer Losses (N=13,741) ............................................................................ 110 3.81 Selected Reserve Member Losses by Reserve Component (N=125,933) ................................. 110 3.82 Number of Selected Reserve Enlisted Member and Officer Losses by Reserve Component ... 111 3.83 Number of Selected Reserve Enlisted Member and Officer Losses by Reserve Component
and Type of Loss ....................................................................................................................... 112 3.84 Number of Ready Reserve Enlisted Member and Officer Retirements by Reserve
Component and Type of Retirement ........................................................................................ 113 3.85 Selected Reserve Member Losses by Reserve Component Trends: 2000–2016 ...................... 114

Table of Exhibits
2016 Demographics Report
SECTION 4: TOTAL FORCE FAMILIES ................................................................................................ 115
TOTAL FORCE FAMILIES ...................................................................................................................... 117
4.01 Total Force Military Personnel and Family Members (N=4,819,250) ...................................... 117 4.02 Total Force Parental Status (N=2,100,328) ............................................................................... 117 4.03 Total Force Family Status (N=2,100,328) .................................................................................. 118 4.04 Number of Total Force Personnel in Dual-Military Marriages with Children by DoD
Component and Pay Grade ....................................................................................................... 118 4.05 Age of Military Spouses (N=991,687) ....................................................................................... 119 4.06 Age of Military Children (N=1,715,519) .................................................................................... 119 4.07 Number and Percentage of Total Force Personnel by Family Status Trends: 2000–2016 ....... 120
SECTION 5: ACTIVE DUTY FAMILIES ................................................................................................. 121
FAMILY MEMBERS .............................................................................................................................. 123
5.01 Family Members and Active Duty Members (N=2,958,537) .................................................... 123 5.02 Number, Percentage, and Ratio of Active Duty Members and Family Members by Service
Branch ....................................................................................................................................... 123 5.03 Number and Percentage of Active Duty Enlisted Members and Officers with Spouses or
Dependents by Service Branch ................................................................................................. 124 5.04 Number and Percentage of Active Duty Family Members by Relationship to Member and
Service Branch .......................................................................................................................... 124 5.05 Number and Percentage of Family Members and Active Duty Members Trends:
2000–2016 ................................................................................................................................ 125 5.06 Percentage of Active Duty Enlisted Members and Officers with Spouses or Dependents
Trends: 2000–2016 ................................................................................................................... 125
FAMILY STATUS .................................................................................................................................. 126
5.07 Active Duty Member Parental Status (N=1,288,596) ............................................................... 126 5.08 Active Duty Member Family Status (N=1,288,596) .................................................................. 126 5.09 Active Duty Enlisted Member Family Status by Pay Grade ...................................................... 127 5.10 Active Duty Officer Family Status by Pay Grade ....................................................................... 128 5.11 Number and Percentage of Active Duty Members by Service Branch and Family Status ....... 128 5.12 Number and Percentage of Active Duty Members by Family Status Trends: 2000–2016 ....... 129
SPOUSES ............................................................................................................................................. 130
5.13 Number and Percentage of Active Duty Spouses by Service Branch and Spouse Gender ....... 130 5.14 Age of Spouses of Active Duty Members (N=623,981) ............................................................ 130 5.15 Number of Active Duty Enlisted Spouses and Officer Spouses by Service Branch and
Spouse Age ............................................................................................................................... 131 5.16 Average Age of Active Duty Enlisted Spouses and Officer Spouses by Service Branch ............ 131 5.17 Employment Status of Active Duty Spouses ............................................................................. 132 5.18 Percentage of Active Duty Enlisted Spouses and Officer Spouses by Employment Status ...... 133 5.19 Percentage of Active Duty Spouses by Service Branch and Employment Status ..................... 133 5.20 Percentage of Active Duty Enlisted Spouses and Officer Spouses by Service Member
Report of Spouse Employment Status Trends: 2000–2015 ...................................................... 134 5.21 Active Duty Civilian Spouse Unemployment Rate Trends: 2010–2015 .................................... 134

Table of Exhibits
2016 Demographics Report
DEPENDENTS ...................................................................................................................................... 135
5.22 Average Number of Children and Total Dependents of Active Duty Members ....................... 135 5.23 Number and Percentage of Active Duty Members with Children by Service Branch and
Pay Grade .................................................................................................................................. 135 5.24 Average Age of Active Duty Members at Birth of First Child by Service Branch ...................... 135 5.25 Number of Active Duty Male and Female First-Time Parents by Service Branch and
Age at Birth of First Child .......................................................................................................... 136 5.26 Number of Active Duty Members in Dual-Military Marriages with Children by Service
Branch and Pay Grade .............................................................................................................. 137 5.27 Number of Single Parents on Active Duty by Gender and Service Branch ............................... 137 5.28 Percentage of Single Parents on Active Duty by Service Branch and Pay Grade (N=55,360) .. 137 5.29 Number of Children of Active Duty Members by Service Branch and Child Age ..................... 138 5.30 Age of Children of Active Duty Members (N=1,036,472) ......................................................... 139 5.31 Number of Male and Female Children of Active Duty Members by Child Age and Member
Pay Grade: Birth to Kindergarten ............................................................................................. 139 5.32 Number of Male and Female Children of Active Duty Members by Child Age and Member
Pay Grade: Primary and Middle School .................................................................................... 140 5.33 Number of Male and Female Children of Active Duty Members by Child Age and Sponsor
Pay Grade: High School and Above .......................................................................................... 140 5.34 Age of Adult Dependents of Active Duty Members (N=9,487) ................................................ 141 5.35 Number of Male and Female Adult Dependents of Active Duty Members by Dependent
Age and Sponsor Pay Grade ..................................................................................................... 141 5.36 Number of Single Parents on Active Duty by Service Branch and Gender Trends:
2000–2016 ................................................................................................................................ 142 5.37 Number and Percentage of Active Duty Children by Child Age Trends: 2000–2016 ............... 142 5.38 Number and Percentage of Active Duty Adult Dependents by Dependent Age Trends:
2000–2016 ................................................................................................................................ 142
SECTION 6: RESERVE AND GUARD FAMILIES .................................................................................... 143
FAMILY MEMBERS .............................................................................................................................. 145
6.01 Family Members and Selected Reserve Members (N=1,877,525) ........................................... 145 6.02 Number, Percentage, and Ratio of Selected Reserve Members and Family Members by
Reserve Component ................................................................................................................. 145 6.03 Number and Percentage of Selected Reserve Enlisted Members and Officers with Spouses
or Dependents by Reserve Component ................................................................................... 146 6.04 Number and Percentage of Selected Reserve Family Members by Relationship to Member
and Reserve Component .......................................................................................................... 146 6.05 Number and Percentage of Selected Reserve Members and Family Members Trends:
2000–2016 ................................................................................................................................ 147 6.06 Percentage of Selected Reserve Enlisted Members and Officers with Spouses or
Dependents Trends: 2000–2016 .............................................................................................. 147
FAMILY STATUS .................................................................................................................................. 148
6.07 Selected Reserve Member Parental Status (N=818,305) ......................................................... 148 6.08 Selected Reserve Member Family Status (N=818,305) ............................................................ 148 6.09 Selected Reserve Enlisted Member Family Status by Pay Grade ............................................. 149 6.10 Selected Reserve Officer Family Status by Pay Grade .............................................................. 150

Table of Exhibits
2016 Demographics Report
6.11 Number and Percentage of Selected Reserve Members by Reserve Component and Family Status ........................................................................................................................................ 151
6.12 Number and Percentage of Selected Reserve Members by Family Status Trends: 2000–2016 ................................................................................................................................ 152
SPOUSES ............................................................................................................................................. 153
6.13 Number and Percentage of Selected Reserve Spouses by Spouse Gender and Reserve Component ............................................................................................................................... 153
6.14 Age of Spouses of Selected Reserve Members (N=371,628) ................................................... 153 6.15 Number of Selected Reserve Enlisted Spouses and Officer Spouses by Spouse Age and
Reserve Component ................................................................................................................. 154 6.16 Average Age of Selected Reserve Enlisted Spouses and Officer Spouses by Reserve
Component ............................................................................................................................... 154
DEPENDENTS ...................................................................................................................................... 155
6.17 Average Number of Children and Total Dependents of Selected Reserve Members .............. 155 6.18 Number and Percentage of Selected Reserve Members with Children by Reserve
Component and Pay Grade ....................................................................................................... 155 6.19 Average Age of Selected Reserve Members at Birth of First Child by Reserve Component .... 156 6.20 Number of Selected Reserve Male and Female First-Time Parents by Reserve Component
and Age at Birth of First Child ................................................................................................... 157 6.21 Number of Selected Reserve Members in Dual-Military Marriages with Children by Pay
Grade and Reserve Component ............................................................................................... 158 6.22 Number of Single Parent Selected Reserve Members by Gender and Reserve Component ... 158 6.23 Percentage of Single Parent Selected Reserve Members by Reserve Component and
Pay Grade (N=74,583) ............................................................................................................... 159 6.24 Number of Children of Selected Reserve Members by Reserve Component and Child Age ... 160 6.25 Age of Children of Selected Reserve Members (N=685,344) ................................................... 161 6.26 Number of Male and Female Children of Selected Reserve Members by Child Age and
Sponsor Pay Grade: Birth to Kindergarten ............................................................................... 161 6.27 Number of Male and Female Children of Selected Reserve Members by Child Age and
Member Pay Grade: Primary and Middle School ..................................................................... 162 6.28 Number of Male and Female Children of Selected Reserve Members by Child Age and
Member Pay Grade: High School and Above ........................................................................... 162 6.29 Age of Adult Dependents of Selected Reserve Members (N=1,662) ....................................... 163 6.30 Number of Male and Female Adult Dependents of Selected Reserve Members by
Dependent Age and Member Pay Grade .................................................................................. 163 6.31 Number of Single Parent Selected Reserve Members by Gender and Reserve Component
Trends: 2000–2016 ................................................................................................................... 164 6.32 Number and Percentage of Selected Reserve Children by Child Age Trends: 2005–2016 ...... 164 6.33 Number and Percentage of Selected Reserve Adult Dependents by Dependent Age Trends:
2005–2016 ................................................................................................................................ 164

Table of Exhibits
2016 Demographics Report
SECTION 7: REFERENCE TABLES....................................................................................................... 165
2017 BASIC MONTHLY PAY ................................................................................................................. 167 2017 BASIC ALLOWANCE FOR SUBSISTENCE ...................................................................................... 169 2017 DRILL PAY FOR ENLISTED MEMBERS ......................................................................................... 170 2017 DRILL PAY FOR OFFICERS ........................................................................................................... 172 ARMED FORCES COMPARATIVE PAY GRADES AND RANKS ................................................................ 174 UNITED STATES INSTALLATION POPULATION BY STATE .................................................................... 175 INTERNATIONAL POPULATION BY CONTINENT .................................................................................. 186
DATA SOURCES AND REFERENCES .................................................................................................. 187

i
EXECUTIVE SUMMARY

ii
This page is intentionally blank.

Executive Summary
2016 Demographics Report
iii
Executive Summary This Demographics Report, which was prepared for the U.S. Department of Defense (DoD), presents a synthesis of demographic information describing members and families in the military community in fiscal year 2016.1 Active Duty Service branches include DoD’s Army, Navy, Marine Corps, and Air Force; and the Reserve components include DoD’s Army National Guard, Army Reserve, Navy Reserve, Marine Corps Reserve, Air National Guard and Air Force Reserve, and DHS’s Coast Guard Reserve.
Overview of Military Personnel The total number of military personnel is over 3.5 million strong, including DoD Active Duty military personnel (1,288,596); DHS’s Active Duty Coast Guard members (39,597); DoD Ready Reserve and DHS Coast Guard Reserve members (1,085,109); members of the Retired Reserve (213,405) and Standby Reserve (7,870); and DoD Appropriated and Non-Appropriated Funds civilian personnel (875,257). DoD’s Active Duty and DHS’s Coast Guard Active Duty members comprise the largest portion of the military force (37.8%), followed by Ready Reserve members (30.9%) and DoD civilian personnel (24.9%).
Active Duty Member Highlights Service Branches. The Army has the largest number of Active Duty members (471,271) followed by the Navy (320,101), the Air Force (313,723), and the Marine Corps (183,501). At a total of 1,288,596 DoD Active Duty members, the military force of 2016 is 6.0% smaller than it was in 2000, when there were 1,370,678 Active Duty members. From 2000 to 2016, the Navy (-12.9%), Air Force (-10.7%), and Army (-1.6%) experienced a decrease in the number of members, while the Marine Corps (+6.1%) experienced an increase in the number of members.
Ratio of Ranks. The DoD Active Duty force is composed of 82.3 percent enlisted personnel (1,060,141) and 17.7 percent officers (228,455). Overall, the Active Duty force has 4.6 enlisted personnel for every one officer. In comparison, the Air Force has one officer for every 4.1 enlisted personnel, the Army has one officer for every 4.1 enlisted personnel, the Navy has one officer for every 4.9 enlisted personnel, and the Marine Corps has one officer for every 7.9 enlisted personnel.
Gender. Women, who number 204,628, comprise 15.9 percent of the DoD Active Duty force, while 1,083,968 men comprise 84.1 percent of the DoD Active Duty force. Compared to 2000, both the percentage of Active Duty enlisted members and the percentage of Active Duty officers who are women has increased (from 14.7% and 14.4%, respectively, in 2000 to 15.6% and 17.3%, respectively, in 2016). Overall, the number and ratio of female enlisted members (165,025) to female officers (39,603) is 4.2 female enlisted members for every one female officer, while the number and ratio of male enlisted members (895,116) to male officers (188,852) is 4.7 male enlisted members for every one male officer.
Race/Ethnicity. Less than one-third (31.4%) or 404,796 of Active Duty members identify themselves as a racial minority (i.e., Black or African American, Asian, American Indian or Alaska Native, Native Hawaiian or Other Pacific Islander, Multi-racial, or Other/Unknown). The percentage of Active Duty members who identify themselves as a racial minority has increased since 2010 (from 31.4% of enlisted members and 22.7% of officers in 2012, to 33.2% of enlisted members and 23.0% of officers in 2016). The overall ratio of racial minority enlisted personnel (352,269) to racial minority officers (52,527) is 6.7 racial minority enlisted personnel for every one racial minority officer. To conform to the latest Office of Management
1 Where available, the Demographics Report also provides data for fiscal years 2000, 2005, 2010, and 2015 to
denote trends.

Executive Summary
iv 2016 Demographics Report
and Budget (OMB) directives, Hispanic is not considered a minority race designation and only Active Duty members’ race was used to determine racial minority status.
Geographic Location. While the Active Duty population is located throughout the world, the three primary areas in which Active Duty members are assigned are the United States and its territories (88.0%), Europe (5.1%), and East Asia (5.0%). The ten states with the highest Active Duty military populations are California (123,603), Texas (117,553), North Carolina (96,170), Virginia (87,984), Georgia (62,501), Florida (52,023), Washington (44,148), Hawaii (37,374), South Carolina (36,613), and Colorado (34,930). Active Duty members in these ten states comprise 61.1 percent of the personnel stationed in the United States.
Age. Over half (50.8%) of Active Duty enlisted personnel are 25 years of age or younger, with the next largest age group being 26 to 30 years (21.3%), followed by 31 to 35 years (14.0%), 36 to 40 years (8.8%), and those 41 years or older (5.1%). One-quarter (25.0%) of Active Duty officers are 41 years of age or older, with the next largest age group being 26 to 30 years (22.6%), followed by 31 to 35 years (21.0%), 36 to 40 years (17.7%), and those 25 years or younger (13.7%). Overall, the average age of the Active Duty force is 28.5 years. The average age for Active Duty enlisted personnel is 27.1 years, and the average age for Active Duty officers is 34.6 years.
Education Level. Few enlisted members (8.0%) have a Bachelor’s degree or higher, while most (91.2%) have a high school diploma and/or some college experience but less than a Bachelor’s degree. The majority (85.0%) of officers have a Bachelor’s or higher degree. Compared to 2000, the percentage of total Active Duty members who have a Bachelor’s and/or an advanced degree increased for enlisted personnel (from 3.3% in 2000 to 8.0% in 2016) but has decreased for officers (from 89.9% in 2000, to 85.0% in 2016).
Marital Status. Just over half (53.5%) of Active Duty military members are married, which is higher than the percentage that were married in 2000 (53.1%). In 2016, over half (50.1%) of enlisted members and a majority (69.2%) of officers report themselves as married. Over half (55.0%) of Active Duty males and nearly half (45.4%) of Active Duty females are married. In addition, 6.6 percent of DoD’s Active Duty members are in dual-military marriages.2 During the 2016 fiscal year, 3.5 percent of enlisted personnel and 1.6 percent of officers are estimated to have divorced.
Reserve and Guard (Selected Reserve) Member Highlights Reserve Components. The data pertaining to Reserve and Guard members depict the Selected Reserve only, unless otherwise specified. The introduction to Section III describes the composition of the Reserve forces of the United States, and explains why most data displays are limited to Selected Reserve personnel. The Selected Reserve Force consists of 818,305 members in seven components. The Army National Guard (341,589) and Army Reserve (198,395) have the largest number of Selected Reserve members, followed by the Air National Guard (105,887), the Air Force Reserve (69,364), the Navy Reserve (57,980), the Marine Corps Reserve (38,517), and the DHS’s Coast Guard Reserve (6,573). Similar to the Active Duty force, the overall number of members in the Selected Reserve is lower in 2016 compared to 2000. The Selected Reserve force is 6.3 percent smaller than it was in 2000 (when there were 873,207 Selected Reserve members).
Ratio of Ranks. The Selected Reserve is composed of 83.9 percent enlisted personnel (686,560) and 16.1 percent officers (131,745). Overall, there are 5.2 enlisted personnel for every one officer in the Selected Reserve. This ratio varies across the Selected Reserve, with the Navy Reserve having 3.1 enlisted personnel for every one officer, the Air Force Reserve having 4.0 enlisted personnel for every one officer, the Army
2 A dual-military marriage refers to an Active Duty member or a Reserve and Guard member who is married to an
Active Duty member or to a Reserve and Guard member.

Executive Summary
2016 Demographics Report
v
Reserve having 4.3 enlisted personnel for every one officer, the Coast Guard Reserve having 4.9 enlisted personnel for every one officer, the Air National Guard having 6.0 enlisted personnel for every one officer, the Army National Guard having 6.5 enlisted personnel for every one officer, and the Marine Corps Reserve having 7.9 enlisted personnel for every one officer.
Gender. Women, who number 158,173, comprise 19.3 percent of the Selected Reserve force, while 660,132 men comprise 80.7 percent of the Selected Reserve force. The percentage of women in the Selected Reserve has increased since 2000 (from 16.4% of enlisted members and 17.5% of officers in 2000, to 19.3% of enlisted members and 19.2% of officers in 2016). Overall, the ratio of female enlisted members (132,815) to female officers (25,358) is 5.2 female enlisted members for every one female officer, while the ratio of male enlisted members (553,745) to male officers (106,387) is also 5.2 male enlisted members for every one male officer.
Race/Ethnicity. Approximately one-quarter (26.1% or 213,664) of the Selected Reserve members identify themselves as a racial minority (i.e., Black or African American, Asian, American Indian or Alaska Native, Native Hawaiian or Other Pacific Islander, Multi-racial, or Other/Unknown). The Selected Reserve is composed of 186,952 racial minority enlisted personnel and 26,712 racial minority officers, with 7.0 racial minority enlisted personnel for every one racial minority officer. The overall racial minority representation in the Selected Reserve has increased in the past five years for both enlisted personnel (from 24.9 percent in 2010 to 27.2 percent in 2016) and for officers (from 18.9 percent in 2010 to 20.3 percent in 2016). To conform to the latest Office of Management and Budget (OMB) directives, Hispanic is not considered a minority race designation and only Active Duty members’ race was used to determine racial minority status.
Geographic Location. The majority (98.9% or 809,627) of the Selected Reserve is located throughout the United States and its territories. The ten states with the highest Selected Reserve population are California (57,374), Texas (54,142), Florida (36,733), Pennsylvania (31,306), New York (29,206), Ohio (28,051), Georgia (26,990), Virginia (25,999), Illinois (24,874), and North Carolina (22,365). These ten states comprise 42.5 percent of the total Selected Reserve population in the United States.
Age. More than one-third (38.3%) of Selected Reserve enlisted members are 25 years of age or younger, with the next largest age group being 26 to 30 years (21.0%), followed by 41 years or older (15.7%), 31 to 35 years (15.2%), and those 36 to 40 years (9.8%). Slightly less than half (43.3%) of Selected Reserve officers are 41 years of age or older, with the next largest age group being 31 to 35 years (19.4%), followed by 36 to 40 years (18.8%), 26 to 30 years (12.8%), and those 25 years or younger (5.7%). Overall, the average age of the Selected Reserve is 31.7 years. The average age for Selected Reserve enlisted personnel is 30.3 years, and the average age for Selected Reserve officers is 39.1 years.
Education Level. Most enlisted members (86.0%) have a high school diploma and/or some college experience, and 11.4 percent of enlisted members have a Bachelor’s degree or higher. The majority (87.4%) of Selected Reserve officers have a Bachelor’s degree or higher. Since 2000, the percentage of Selected Reserve members who have a Bachelor’s and/or advanced degree has increased for both enlisted personnel (from 7.1% in 2000 to 11.4% in 2016) and officers (from 74.9% in 2000 to 87.4% in 2016).
Marital Status. Just under half (44.5%) of Selected Reserve members are married, compared to 53.2 percent who were married in 2000. In 2016, 39.9 percent of Selected Reserve enlisted personnel and 68.6 percent of Selected Reserve officers report themselves as married. About one-half (46.8%) of Selected Reserve males and one-third (35.1%) of Selected Reserve females are married. In addition, 2.7 percent of the Selected Reserve report that they are in a dual-military marriage. During the 2016 fiscal year, 2.6 percent of Selected Reserve enlisted personnel and 1.7 percent of Selected Reserve officers are estimated to have divorced.

Executive Summary
vi 2016 Demographics Report
Overview of Military Families Across the Active Duty and Selected Reserve population, there are 2,100,328 military personnel and 2,718,922 family members, including spouses, children, and adult dependents. Of the military personnel, 43.9 percent are single with no children, 34.4 percent are married with children, 15.6 percent are married without children, and 6.2 percent are single with children. Overall, 40.5 percent of military personnel have children in 2016, compared to 39.9 percent in 2000. Of the 1,715,519 total military children in 2016, the largest percentage are between birth and 5 years of age (37.8%), followed by 6 to 11 years of age (31.6%), and 12 to 18 years of age (23.8%). Fewer children are between 19 and 22 years of age (6.8%); however, children ages 21 to 22 must be enrolled as full-time students in order to qualify as dependents. About half (50.0%) of military personnel are married. Of the 991,687 military spouses, nearly one-quarter (23.5%) of spouses are 26 to 30 years of age, while 21.7 percent are 31 to 35 years of age, 20.0 percent are 41 years of age or older, 19.5 percent are 25 years of age or younger, and 15.3 percent are 36 to 40 years of age.
Active Duty Family Highlights There are fewer DoD Active Duty members (1,288,596) than their associated family members (1,669,941). More than one-third of the members (35.6%) of the Active Duty force are married with children and 4.3 percent are single parents. The largest group of children is between birth and 5 years of age (437,079 or 42.2%). The next largest groups are between the ages of 6 and 11 years of age (329,547 or 31.8%), between 12 and 18 years of age (225,241 or 21.7%), and between 19 and 22 years of age (44,605 or 4.3%). There are 9,487 adult dependents 23 years of age and older among the families of Active Duty members.
Reserve and Guard (Selected Reserve) Family Highlights There are fewer DoD and DHS Selected Reserve members (818,305) than their associated family members (1,059,220). Of the 818,305 Selected Reserve members, 32.5 percent are married with children and 9.1 percent are single parents. The largest group of children is between the ages of 6 and 11 years (213,787 or 31.2%), followed by children between birth and 5 years (213,702 or 31.2%), between 12 and 18 years (185,196 or 27.0%), and between the ages of 19 and 22 years (72,659 or 10.6%). In addition, there are 1,662 adult dependents 23 years and older claimed as dependents by Selected Reserve members.

Executive Summary
2016 Demographics Report
vii
Active Duty and Reserve and Guard Summary Table As a summary, the table below presents information for Active Duty and Reserve and Guard on a number of key demographic variables.
Demographic Variable Active Duty Reserve and Guard (Selected Reserve)
Members Total number 1,288,596 818,305 Ratio of enlisted members to officers 4.6 to 1 5.2 to 1 % women / % men 15.9% / 84.1% 19.3% / 80.7% % minorities 31.4% 26.1% % located in United States, U.S. territories 88.0% 98.9% % 25 years of age or younger 44.2% 33.0% % with Bachelor’s degree or higher 21.6% 23.6% % married 53.5% 44.5% % in dual-military marriages 6.6% 2.7% Number of separations/losses 186,793 125,933 Retired personnel 1,581,046 772,162 (Ready Reserve) Families Number of family members 1,669,941 1,059,220 Number of spouses 623,981 371,628 % with children 39.9% 41.6% Average age at birth of first child 25.8 28.0 % of children age 0 to 5 years 42.2% 31.2% Number of adult dependents 9,487 1,662 % single parents 4.3% 9.1%

viii
This page is intentionally blank.

ix
INTRODUCTION

x
This page is intentionally blank.

Introduction
2016 Demographics Report
xi
Introduction This Demographics Report presents a synthesis of demographic information describing Active Duty (Army, Navy, Marine Corps, Air Force, and DHS’s Coast Guard) and Reserve component (Army National Guard, Army Reserve, Navy Reserve, Marine Corps Reserve, Air National Guard, Air Force Reserve, and DHS’s Coast Guard Reserve) members and their families. It serves as a reference tool for professionals who develop policy or deliver programs and services to military members and families in the Armed Forces. For previous years’ reports, please visit Military OneSource at http://www.militaryonesource.mil.
The 2016 Report To provide a holistic profile of the military community, the 2016 Report presents demographic information for Active Duty and Reserve and Guard personnel. In addition, selected Census data are presented as a point of reference, and military demographics trends for 2000, 2005, 2010, 2015, and 2016 are included where possible.
Presentation of Information Military member demographics and family demographics are presented separately for Active Duty and Reserve and Guard populations as follows:
Section I: Total Military Force Section II: Active Duty Members Section III: Reserve and Guard Members Section IV: Total Force Families Section V: Active Duty Families Section VI: Reserve and Guard Families Section VII: Reference Tables Data Sources and References
The data contained in this publication were derived from a variety of sources and, in general, only data that are available on a consistent basis for all Services are presented. The majority of data are managed by the Defense Manpower Data Center, particularly the Active Duty Military Personnel Master File, the Active Duty Military Family File, the Reserve Components Common Personnel Data System, and the Reserve Components Family File.
All exhibits included in this report contain source citations, and the Data Sources and References section of this document provides a reference for all data sources. Readers needing additional information are encouraged to directly access the listed sources.
Guidelines for Interpreting Data Guiding principles for interpreting data include:
Numbers for population groups (e.g., Active Duty, enlisted members) may vary across exhibits as a result of different data sources, missing data, and/or rounding.
Percentages may not total to 100 due to rounding or missing data. Warrant officers are included with officers unless otherwise noted.
In the Active Duty sections of this report, data are presented for the four DoD Service branches (Army, Navy, Marine Corps, and Air Force). Some information about the DHS’s Active Duty Coast Guard is

Introduction
xii 2016 Demographics Report
presented in the Total Military Force section of this report. In the Reserve and Guard Members section, the label “Total DoD” is used to reflect the six Reserve components under DoD (Army National Guard, Army Reserve, Navy Reserve, Marine Corps Reserve, Air National Guard, and Air Force Reserve), while “Total Selected Reserve” includes DHS’s Coast Guard Reserve data in addition to data from the DoD Reserve components.
The data pertaining to Reserve and Guard members depict the Selected Reserve and the National Guard and do not include any other Ready Reserve forces (i.e., Individual Ready Reserve and Inactive National Guard) unless otherwise specified. The introduction to Section III describes the composition of the Reserve forces of the United States and explains why most data displays are limited to Selected Reserve personnel.
All data pertaining to Active Duty and Selected Reserve family members (i.e., spouses, children, and adult dependents) are extracted from the Defense Enrollment and Eligibility Reporting System (DEERS). Therefore, the data are dependent on the military members reporting the necessary information.
For More Information For more information on military demographics, family programs and policy, and military research, refer to:
Military OneSource Around the clock access to family support http://www.militaryonesource.mil

1
SECTION 1
Total Military Force This section contains numeric data for the total military population, including Active Duty, Reserve and Guard forces, and DoD civilians. Each exhibit combines Active Duty and Reserve and Guard member data to display numbers for the total military force.

2
This page is intentionally blank.

Total Military Force Total Military Force
2016 Demographics Report
3
Total Military Force
1.01 ■ Military Personnel and Military Civilians (N=3,509,834) This pie chart presents the total number of Active Duty and Reserve and Guard members from all branches of the DoD and the DHS Coast Guard, as well as the civilian personnel who support the DoD. Overall, the total military force and civilian personnel comprises 3,509,834 people. DoD’s Active Duty members make up 36.7 percent of the total military force. Data for all DoD Active Duty members are presented in Section II. DHS’s Coast Guard Active Duty members make up 1.1 percent of the total military force.
All Reserve and Guard manpower is assigned to one of three Reserve Component categories: the Ready Reserve, the Standby Reserve, or the Retired Reserve. The Ready Reserve makes up 30.9 percent of the total military force. The Ready Reserve comprises the Selected Reserve, the Individual Ready Reserve, and the Inactive National Guard. Because Selected Reserve members train throughout the year and participate annually in Active Duty training exercises, they are the primary focus of the Reserve sections of this report. DHS’s Coast Guard Reserve members are frequently called for duty; therefore, their data are included as well. Data for all Selected Reserve members are presented in Section III.
** Includes Coast Guard Reserve ** Includes Non-Appropriated Funds civilians and Appropriated Funds civilians Note: Percentages may not total to 100 due to rounding. Source: DMDC Active Duty Military Personnel Master File (September 2016), Official Guard and Reserve Manpower Strengths & Statistics FY2016 Summary, DMDC DoD Appropriated Funds (APF) Civilian Master File (September 2016), DMDC DoD Non-Appropriated Funds (NAF) Civilian File (September 2016)
DoD Active Duty (n=1,288,596)
36.7%
Coast Guard Active Duty (n=39,597)
1.1%
Ready Reserve* (n=1,085,109)
30.9%
Standby Reserve* (n=7,870)
0.2%
Retired Reserve*
(n=213,405)6.1%
DoD Civilian Personnel** (n=875,257)
24.9%

Total Military Force Total Military Force
4 2016 Demographics Report
Army Active Duty
(n=471,271)19.5%
Army National Guard
(n=344,862)14.3%
Army Reserve (n=306,272)
12.7%
Navy Active Duty
(n=320,101) 13.3%
Navy Reserve (n=108,864)
4.5%
Marine Corps Active Duty (n=183,501)
7.6%
Marine Corps Reserve
(n=106,581)4.4%
Air Force Active Duty (n=313,723)
13.0%
Air National Guard
(n=105,887)4.4%
Air Force Reserve
(n=104,520)4.3%
Coast Guard Active Duty (n=39,597)
1.6%Coast Guard
Reserve (n=8,123)
0.3%
1.02 ■ Active Duty and Ready Reserve Personnel (N=2,413,302) This pie chart presents the distribution of Active Duty and Ready Reserve personnel by Service branch and Reserve component, respectively. Active Duty, Reserve, and Guard members of the Army make up the largest percentage of military personnel (46.5%), followed by Active Duty, Reserve, and Guard members of the Air Force (21.7%), the Navy (17.8%), the Marine Corps (12.0%), and the Coast Guard (2.0%).
Note: Percentages may not total to 100 due to rounding. Source: DMDC Active Duty Military Personnel Master File (September 2016), Official Guard and Reserve Manpower Strengths & Statistics FY2016 Summary

Total Military Force DoD Civilian Personnel
2016 Demographics Report
5
DoD Civilian Personnel DoD civilians are divided into two primary categories. Appropriated Funds (APF) civilian employees are funded by congressional appropriations. Non-Appropriated Funds (NAF) civilian employees are not funded by congressional appropriations, but are funded by revenue-generating activities.
1.03 ■ DoD Appropriated Funds (APF) Civilians (N=751,333) This pie chart presents the distribution of APF civilian personnel. There are 751,333 APF civilian personnel who constitute 21.4 percent of the total DoD workforce. Of the 751,333 DoD APF civilians, the largest percentage are employed by the Army (34.1%), followed by the Navy (25.4%), Air Force (23.2%), and other areas of the DoD (14.9%). The Marine Corps (2.4%) employs the smallest percentage of APF civilians.
Note: Percentages may not total to 100 due to rounding. Source: DMDC DoD Appropriated Funds (APF) Civilian Master File (September 2016)
1.04 ■ DoD Non-Appropriated Funds (NAF) Civilians (N=123,924) This pie chart presents the distribution of NAF civilian personnel. There are 123,924 NAF civilians who constitute 3.5 percent of the total DoD workforce. The largest percentage are working for the Navy (26.9%), followed by the Army & Air Force Exchange Service (AAFES; 23.2%), Army (21.8%), Air Force (17.7%), and Marine Corps (9.8%). The remainder (0.6%) work within other areas of DoD.
* Includes Defense Logistics Agency. Note: Percentages may not total to 100 due to rounding. Source: DMDC DoD Non-Appropriated Funds (NAF) Civilian File (September 2016)
Army (n=256,421)
34.1%
Navy (n=190,964)
25.4%Marine Corps (n=18,280)
2.4%
Air Force (n=174,040)
23.2%
Other DoD (n=111,628)
14.9%
Army (n=27,028)
21.8%
Navy (n=33,365)
26.9%
Marine Corps (n=12,110)
9.8%
Air Force (n=21,880)
17.7%
Army & Air Force Exchange Service (AAFES)
(n=28,760)23.2%
Other DoD* (n=781)
0.6%

Characteristics of the Total Military Force Total Military Force
6 2016 Demographics Report
Enlisted (n=1,741,238)
82.9%
Officers (n=359,090)
17.1%
Characteristics of the Total Military Force 1.05 ■ Enlisted Members and Officers in the Total Military Force
(N=2,100,328) This pie chart presents the total number of Active Duty and Selected Reserve enlisted members and officers across the DoD. Overall, the total DoD force is composed of 1,741,238 (82.9%) enlisted members and 359,090 (17.1%) officers.
Note: Data are presented for the total DoD military force; therefore, DHS Coast Guard Active Duty and DHS Coast Guard Reserve are not included. Note: Percentages may not total to 100 due to rounding. Source: DMDC Active Duty Military Personnel Master File (September 2016); DMDC Reserve Components Common Personnel Data System (September 2016)
1.06 ■ Gender of the Total Military Force (N=2,100,328) This pie chart presents the distribution of Active Duty and Selected Reserve members by gender. Overall, the total DoD force has 361,684 (17.2%) female members and 1,738,644 (82.8%) male members.
Note: Data are presented for the total DoD military force; therefore, DHS Coast Guard Active Duty and DHS Coast Guard Reserve are not included. Note: Percentages may not total to 100 due to rounding. Source: DMDC Active Duty Military Personnel Master File (September 2016); DMDC Reserve Components Common Personnel Data System (September 2016)
Female (n=361,684)
17.2%
Male (n=1,738,644)
82.8%

Total Military Force Characteristics of the Total Military Force
2016 Demographics Report
7
1.07 ■ Race of the Total Military Force (N=2,100,328) This pie chart presents the race of Active Duty and Selected Reserve members across the DoD. Members who report themselves as White represent the largest proportion of the total DoD force (70.6%), while Black or African American members represent 17.1 percent. Asian, American Indian or Alaska Native, and Native Hawaiian or Other Pacific Islander members make up 4.2 percent, 1.1 percent, and 0.9 percent, respectively. Over two percent (2.5%) of members report themselves as Multi-racial.
* The Army and the Army Reserve do not report “Multi-racial.” Note: Data are presented for the total DoD military force; therefore, DHS Coast Guard Active Duty and DHS Coast Guard Reserve are not included. Note: Percentages may not total to 100 due to rounding. Source: DMDC Active Duty Military Personnel Master File (September 2016); DMDC Reserve Components Common Personnel Data System (September 2016)
American Indian or Alaska Native
(n=22,277)1.1%
Asian (n=89,173)
4.2%
Black or African American
(n=358,361)17.1%
Native Hawaiian or Other Pacific
Islander (n=19,622)
0.9%
White (n=1,483,750)
70.6%
Multi-racial* (n=52,510)
2.5%Other/Unknown
(n=74,635)3.6%

Characteristics of the Total Military Force Total Military Force
8 2016 Demographics Report
1.08 ■ Hispanic Ethnicity of the Total Military Force (N=2,100,328) This pie chart presents the Hispanic ethnicity of Active Duty and Selected Reserve members across the DoD. Members who report themselves as Hispanic or Latino represent 13.5 percent of the total military force.
Note: Data are presented for the total DoD military force; therefore, DHS Coast Guard Active Duty and DHS Coast Guard Reserve are not included. Note: Percentages may not total to 100 due to rounding. Source: DMDC Active Duty Military Personnel Master File (September 2016); DMDC Reserve Components Common Personnel Data System (September 2016)
Hispanic or Latino
(n=284,280)13.5%
Not Hispanic or Latino
(n=1,816,048)86.5%
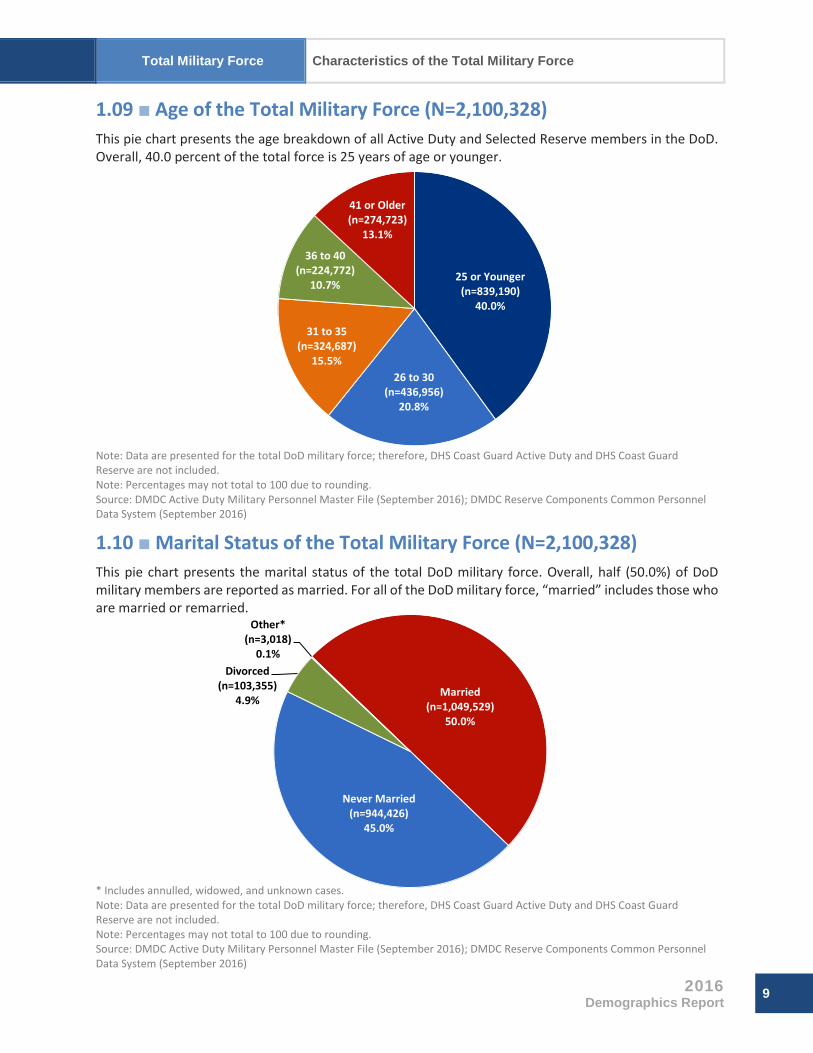
Total Military Force Characteristics of the Total Military Force
2016 Demographics Report
9
1.09 ■ Age of the Total Military Force (N=2,100,328) This pie chart presents the age breakdown of all Active Duty and Selected Reserve members in the DoD. Overall, 40.0 percent of the total force is 25 years of age or younger.
Note: Data are presented for the total DoD military force; therefore, DHS Coast Guard Active Duty and DHS Coast Guard Reserve are not included. Note: Percentages may not total to 100 due to rounding. Source: DMDC Active Duty Military Personnel Master File (September 2016); DMDC Reserve Components Common Personnel Data System (September 2016)
1.10 ■ Marital Status of the Total Military Force (N=2,100,328) This pie chart presents the marital status of the total DoD military force. Overall, half (50.0%) of DoD military members are reported as married. For all of the DoD military force, “married” includes those who are married or remarried.
* Includes annulled, widowed, and unknown cases. Note: Data are presented for the total DoD military force; therefore, DHS Coast Guard Active Duty and DHS Coast Guard Reserve are not included. Note: Percentages may not total to 100 due to rounding. Source: DMDC Active Duty Military Personnel Master File (September 2016); DMDC Reserve Components Common Personnel Data System (September 2016)
25 or Younger (n=839,190)
40.0%
26 to 30 (n=436,956)
20.8%
31 to 35 (n=324,687)
15.5%
36 to 40 (n=224,772)
10.7%
41 or Older (n=274,723)
13.1%
Married (n=1,049,529)
50.0%
Never Married (n=944,426)
45.0%
Divorced (n=103,355)
4.9%
Other* (n=3,018)
0.1%
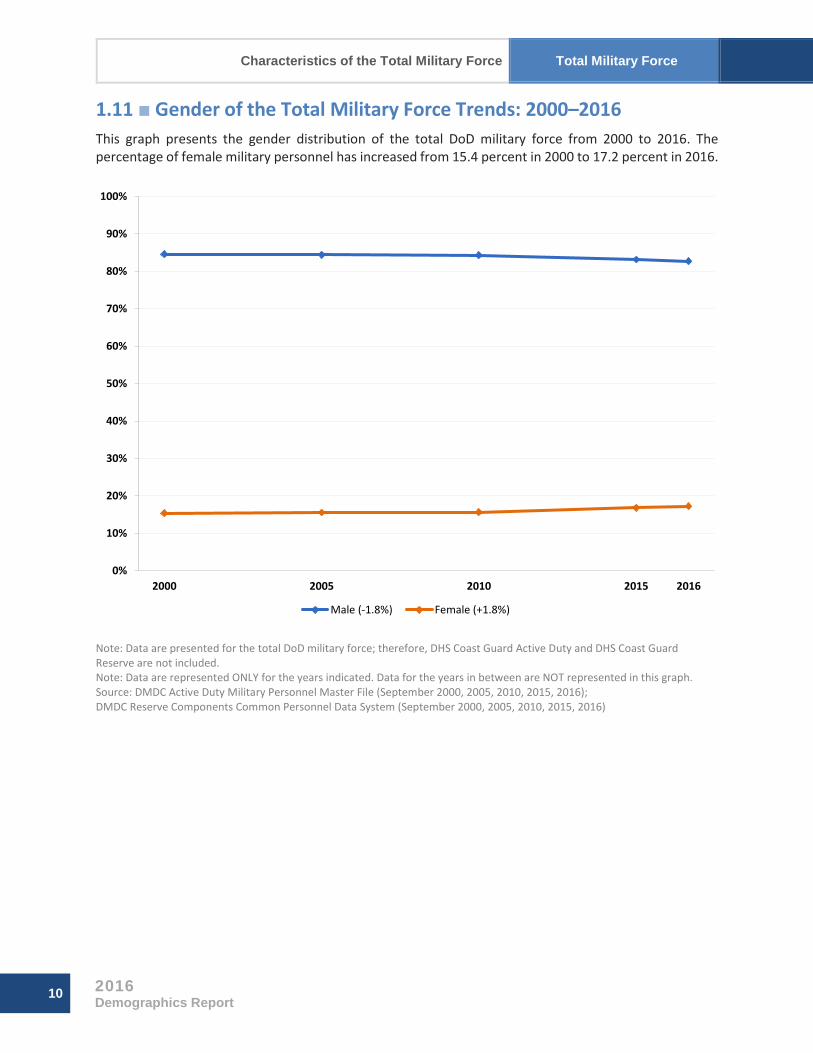
Characteristics of the Total Military Force Total Military Force
10 2016 Demographics Report
1.11 ■ Gender of the Total Military Force Trends: 2000–2016 This graph presents the gender distribution of the total DoD military force from 2000 to 2016. The percentage of female military personnel has increased from 15.4 percent in 2000 to 17.2 percent in 2016.
Note: Data are presented for the total DoD military force; therefore, DHS Coast Guard Active Duty and DHS Coast Guard Reserve are not included. Note: Data are represented ONLY for the years indicated. Data for the years in between are NOT represented in this graph.
Source: DMDC Active Duty Military Personnel Master File (September 2000, 2005, 2010, 2015, 2016); DMDC Reserve Components Common Personnel Data System (September 2000, 2005, 2010, 2015, 2016)
0%
10%
20%
30%
40%
50%
60%
70%
80%
90%
100%
2000 2005 2010 2015 2016
Male (-1.8%) Female (+1.8%)

11
SECTION 2
Active Duty Members This section focuses on the total Active Duty population. Special areas of interest include information on gender, race/ethnicity, geographic location, age, education level, marital status, and retirements and separations from Active Duty.

12
This page is intentionally blank.

Active Duty Members Active Duty Personnel
2016 Demographics Report
13
Enlisted (n=1,060,141)
82.3%
Officers (n=228,455)
17.7%
Active Duty Personnel
2.01 ■ Enlisted Members and Officers on Active Duty (N=1,288,596) The distribution of enlisted members and officers on Active Duty is depicted in this pie graph. Compared to 2015, there was a decrease in the total of Active Duty members in 2016 from 1,301,443 Active Duty members to 1,288,596. Overall, 82.3 percent (1,060,141) of Active Duty members are enlisted members and 17.1 percent (228,455) are officers.
Note: Percentages may not total to 100 due to rounding. Source: DMDC Active Duty Military Personnel Master File (September 2016)
2.02 ■ Number and Ratio of Active Duty Enlisted Members to Officers by Service Branch
This table presents the number and ratio of Active Duty enlisted members to officers by Service branch. Overall, there are 4.6 enlisted personnel for every officer. In comparison, the Air Force has 4.1 enlisted personnel for every officer, the Army has 4.1 enlisted personnel for every officer, the Navy has 4.9 enlisted personnel for every officer, and the Marine Corps has 7.9 enlisted personnel for every officer.
Service Branch Enlisted Officers Total Ratio of Enlisted to Officers Army 378,835 92,436 471,271 4.1 to 1 Navy 265,716 54,385 320,101 4.9 to 1 Marine Corps 162,828 20,673 183,501 7.9 to 1 Air Force 252,762 60,961 313,723 4.1 to 1 Total DoD 1,060,141 228,455 1,288,596 4.6 to 1
Source: DMDC Active Duty Military Personnel Master File (September 2016)

Active Duty Personnel Active Duty Members
14 2016 Demographics Report
2.03 ■ Active Duty Personnel By Service Branch (N=1,288,596) This pie graph presents the distribution of Active Duty personnel by Service branch. The Army has the largest number of personnel with 471,271 members, followed by the Navy with 320,101 members, the Air Force with 313,723 members, and finally the Marine Corps with 183,501 members.
Note: Percentages may not total to 100 due to rounding. Source: DMDC Active Duty Military Personnel Master File (September 2016)
Army (n=471,271)
36.6%
Navy (n=320,101)
24.8%
Marine Corps (n=183,501)
14.2%
Air Force (n=313,723)
24.3%

Active Duty Members Active Duty Personnel
2016 Demographics Report
15
2.04 ■ Number and Percentage of Active Duty Personnel by Service Branch and Pay Grade
The number and percentage of Active Duty personnel is presented by Service branch and pay grade. The pay grades consist of three categories: Enlisted members (“E”), Warrant officers (“W”), and Officers (“O”). More than half (51.2%, or 660,314 members) of Active Duty personnel are pay grades E3 to E5.
Pay Grade Army Navy Marine Corps Air Force Total DoD
N % N % N % N % N % E1 21,862 4.6% 7,864 2.5% 10,997 6.0% 11,273 3.6% 51,996 4.0% E2 26,699 5.7% 14,130 4.4% 20,146 11.0% 7,021 2.2% 67,996 5.3% E3 47,289 10.0% 49,548 15.5% 43,073 23.5% 43,852 14.0% 183,762 14.3% E4 114,509 24.3% 52,855 16.5% 35,340 19.3% 59,550 19.0% 262,254 20.4% E5 64,863 13.8% 63,838 19.9% 26,202 14.3% 59,395 18.9% 214,298 16.6% E6 54,194 11.5% 47,059 14.7% 13,483 7.3% 39,677 12.6% 154,413 12.0% E7 35,236 7.5% 21,410 6.7% 8,322 4.5% 24,484 7.8% 89,452 6.9% E8 10,801 2.3% 6,441 2.0% 3,751 2.0% 4,995 1.6% 25,988 2.0% E9 3,382 0.7% 2,571 0.8% 1,514 0.8% 2,515 0.8% 9,982 0.8% Total Enlisted 378,835 80.4% 265,716 83.0% 162,828 88.7% 252,762 80.6% 1,060,141 82.3% W1 1,952 0.4% 0 0.0% 181 0.1% N/A* N/A* 2,133 0.2% W2 5,897 1.3% 620 0.2% 876 0.5% N/A* N/A* 7,393 0.6% W3 4,172 0.9% 585 0.2% 592 0.3% N/A* N/A* 5,349 0.4% W4 1,960 0.4% 386 0.1% 288 0.2% N/A* N/A* 2,634 0.2% W5 594 0.1% 75 0.0% 103 0.1% N/A* N/A* 772 0.1% Total W1-W5 14,575 3.1% 1,666 0.5% 2,040 1.1% N/A* N/A* 18,281 1.4% O1 8,386 1.8% 6,937 2.2% 2,718 1.5% 6,704 2.1% 24,745 1.9% O2 11,367 2.4% 6,575 2.1% 3,487 1.9% 6,901 2.2% 28,330 2.2% O3 28,912 6.1% 18,621 5.8% 5,951 3.2% 21,252 6.8% 74,736 5.8% O4 15,639 3.3% 10,622 3.3% 3,856 2.1% 12,902 4.1% 43,019 3.3% O5 9,045 1.9% 6,603 2.1% 1,894 1.0% 9,585 3.1% 27,127 2.1% O6 4,193 0.9% 3,153 1.0% 641 0.3% 3,320 1.1% 11,307 0.9% O7 136 0.0% 99 0.0% 37 0.0% 153 0.0% 425 0.0% O8 127 0.0% 62 0.0% 29 0.0% 91 0.0% 309 0.0% O9 44 0.0% 37 0.0% 16 0.0% 40 0.0% 137 0.0% O10 12 0.0% 10 0.0% 4 0.0% 13 0.0% 39 0.0% Total O1-O10 77,861 16.5% 52,719 16.5% 18,633 10.2% 60,961 19.4% 210,174 16.3% Total Officers 92,436 19.6% 54,385 17.0% 20,673 11.3% 60,961 19.4% 228,455 17.7% Total 471,271 100.0% 320,101 100.0% 183,501 100.0% 313,723 100.0% 1,288,596 100.0%
* The Air Force does not have warrant officers. Note: Percentages may not total to 100 due to rounding. Source: DMDC Active Duty Military Personnel Master File (September 2016)

Active Duty Personnel Active Duty Members
16 2016 Demographics Report
2.05 ■ Number of Active Duty Enlisted Members and Officers Trends: 2000–2016
The number of Active Duty enlisted members and officers is presented from 2000 to 2016. The number of enlisted personnel and officers has been decreasing since 2010.
2000 2005 2010 2015 2016 Enlisted 1,153,575 1,147,407 1,182,657 1,070,653 1,060,141 Officers 217,103 226,127 234,713 230,790 228,455 Total 1,370,678 1,373,534 1,417,370 1,301,443 1,288,596
Source: DMDC Active Duty Military Personnel Master File (September 2000, 2005, 2010, 2015, 2016)
2.06 ■ Ratio of Active Duty Enlisted Members to Officers by Service Branch Trends: 2000–2016
This table presents the ratio of Active Duty enlisted members to officers by Service branch from 2000 to 2016. Overall, the ratio of enlisted members to officers has been decreasing since 2000. Throughout this time period, the Marine Corps has had the highest ratio of enlisted members to officers, while the Air Force has had the lowest ratio of enlisted members to officers. In 2016, the Army and Air Force both have the lowest ratios (4.1 to 1).
Service Branch 2000 2005 2010 2015 2016 Army 5.2 to 1 5.0 to 1 5.0 to 1 4.1 to 1 4.1 to 1 Navy 5.9 to 1 5.8 to 1 5.1 to 1 5.0 to 1 4.9 to 1 Marine Corps 8.7 to 1 8.6 to 1 8.5 to 1 7.9 to 1 7.9 to 1 Air Force 4.1 to 1 3.8 to 1 4.0 to 1 4.0 to 1 4.1 to 1 Total DoD 5.3 to 1 5.1 to 1 5.0 to 1 4.6 to 1 4.6 to 1
Source: DMDC Active Duty Military Personnel Master File (September 2000, 2005, 2010, 2015, 2016)
2.07 ■ Number of Active Duty Personnel by Service Branch Trends: 2000–2016
This table presents the total number of Active Duty members by Service branch from 2000 to 2016. The total number of Active Duty members has decreased from 1,417,370 in 2010 to 1,288,596 in 2016. Each of the Service branches experienced a decrease in the number of members from 2010 to 2016.
Service Branch 2000 2005 2010 2015 2016 Army 479,026 486,483 561,979 487,366 471,271 Navy 367,371 357,853 323,139 323,334 320,101 Marine Corps 172,955 179,836 202,612 183,417 183,501 Air Force 351,326 349,362 329,640 307,326 313,723 Total DoD 1,370,678 1,373,534 1,417,370 1,301,443 1,288,596
Source: DMDC Active Duty Military Personnel Master File (September 2000, 2005, 2010, 2015, 2016)

Active Duty Members Active Duty Personnel
2016 Demographics Report
17
2.08 ■ Active Duty Members by Service Branch Trends: 2000–2016 This graph presents the total number of Active Duty members by Service branch from 2000 to 2016. The percentage reported in the legend for each line represents the percentage difference in the number of Active Duty personnel in 2016 compared to 2000. In 2016, the Navy (-12.9%) has had the largest percentage decrease across all of the Service branches, while the Marine Corps (+6.1%) has had the largest percentage increase in the number of members compared to 2000. The actual numbers depicted in this graph can be seen in Exhibit 2.07.
Note: Data are represented ONLY for the years indicated. Data for the years in between are NOT represented in this graph. Source: DMDC Active Duty Military Personnel Master File (September 2000, 2005, 2010, 2015, 2016)
0
100,000
200,000
300,000
400,000
500,000
600,000
2000 2005 2010 2015 2016
Army (-1.6%) Navy (-12.9%) Marine Corps (+6.1%) Air Force (-10.7%)

Gender Active Duty Members
18 2016 Demographics Report
Female (n=165,025)
15.6%
Male (n=895,116)
84.4%
Gender
2.09 ■ Gender of Active Duty Members (N=1,288,596) This pie graph presents the distribution of Active Duty members by gender. In total, there are 204,628 (15.9%) female Active Duty members and 1,083,968 (84.1%) male Active Duty members. The percentage of Active Duty members that are female has increased 0.4% in 2016 compared to 2015 (15.5%).
Note: Percentages may not total to 100 due to rounding. Source: DMDC Active Duty Military Personnel Master File (September 2016)
2.10 ■ Gender of Active Duty Enlisted Members (N=1,060,141) This pie graph presents the distribution of Active Duty enlisted members by gender. Of the 1,060,141 Active Duty enlisted members, 165,025 (15.6%) are female and 895,116 (84.4%) are male.
Note: Percentages may not total to 100 due to rounding. Source: DMDC Active Duty Military Personnel Master File (September 2016)
Female (n=204,628)
15.9%
Male (n=1,083,968)
84.1%

Active Duty Members Gender
2016 Demographics Report
19
Female (n=39,603)
17.3%
Male (n=188,852)
82.7%
2.11 ■ Gender of Active Duty Officers (N=228,455) This pie graph presents the distribution of Active Duty officers by gender. Of the 228,455 Active Duty officers, 39,603 (17.3%) are female and 188,852 (82.7%) are male.
Note: Percentages may not total to 100 due to rounding. Source: DMDC Active Duty Military Personnel Master File (September 2016)
2.12 ■ Number and Ratio of Active Duty Enlisted Members and Officers by Service Branch and Gender
The ratio of Active Duty enlisted members to Active Duty officers is presented by Service branch and gender. The Marine Corps has the highest ratio of both male enlisted personnel to male officers (7.8 to 1) and female enlisted personnel to female officers (8.8 to 1). In 2016, the Army and Air Force both have the lowest ratio of male enlisted personnel to male officers (4.2 to 1), while the Army has the lowest ratio of female enlisted personnel to female officers (3.4 to 1). Overall, there are 4.7 male enlisted personnel for every male officer and 4.2 female enlisted personnel for every female officer.
Service Branch Enlisted Officers Total
Ratio of Enlisted to Officers
Male Female Male Female Male Female Male Female Army 325,603 53,232 76,703 15,733 402,306 68,965 4.2 to 1 3.4 to 1 Navy 215,540 50,176 44,597 9,788 260,137 59,964 4.8 to 1 5.1 to 1 Marine Corps 149,497 13,331 19,150 1,523 168,647 14,854 7.8 to 1 8.8 to 1 Air Force 204,476 48,286 48,402 12,559 252,878 60,845 4.2 to 1 3.8 to 1 Subtotal DoD 895,116 165,025 188,852 39,603 1,083,968 204,628 4.7 to 1 4.2 to 1 Total DoD 1,060,141 228,455 1,288,596 4.6 to 1
Source: DMDC Active Duty Military Personnel Master File (September 2016)

Gender Active Duty Members
20 2016 Demographics Report
2.13 ■ Percentage of Active Duty Enlisted Members and Officers by Service Branch and Gender
This chart presents the percentage of enlisted members and officers by Service branch and gender. Overall, 84.1 percent of Active Duty members are men and 15.9 percent of Active Duty members are women. The Air Force has the largest percentage of female Service members (19.4%), while the Marine Corps has the smallest percentage of female Service members (8.1%).
Female Enlisted Female Officer Female Total Male Enlisted Male Officer Male Total
Note: Percentages may not total to 100 due to rounding. Source: DMDC Active Duty Military Personnel Master File (September 2016)
2.14 ■ Number of Male and Female Active Duty Members by Service Branch and Pay Grade
This table presents the number of male and female Active Duty members by Service branch and pay grade. The Army has the highest number of Active Duty men and women (402,306 and 68,965, respectively), while the Marine Corps has the lowest number of Active Duty men and women (168,647 and 14,854, respectively).
Pay Grade Army Navy Marine Corps Air Force Total DoD
Male Female Male Female Male Female Male Female Male Female E1-E4 177,952 32,407 95,512 28,885 100,194 9,362 98,310 23,386 471,968 94,040 E5-E6 103,908 15,149 92,926 17,971 36,441 3,244 80,529 18,543 313,804 54,907 E7-E9 43,743 5,676 27,102 3,320 12,862 725 25,637 6,357 109,344 16,078 W1-W5 13,195 1,380 1,554 112 1,918 122 N/A* N/A* 16,667 1,614 O1-O3 38,943 9,722 25,362 6,771 11,077 1,079 26,782 8,075 102,164 25,647 O4-O6 24,264 4,613 17,495 2,883 6,070 321 21,346 4,461 69,175 12,278 O7-O10 301 18 186 22 85 1 274 23 846 64 Subtotal DoD 402,306 68,965 260,137 59,964 168,647 14,854 252,878 60,845 1,083,968 204,628 Total DoD 471,271 320,101 183,501 313,723 1,288,596
* The Air Force does not have warrant officers. Source: DMDC Active Duty Military Personnel Master File (September 2016)
Army Air Force Navy Marine Corps Total DoD
85.9% 83.0% 85.4% 81.1% 82.0% 81.3%91.8% 92.6% 91.9%
80.9% 79.4% 80.6% 84.4% 82.7% 84.1%
14.1% 17.0% 14.6% 18.9% 18.0% 18.7%8.2% 7.4% 8.1%
19.1% 20.6% 19.4% 15.6% 17.3% 15.9%
0%
20%
40%
60%
80%
100%

Active Duty Members Gender
2016 Demographics Report
21
2.15 ■ Number of Active Duty Male and Female Enlisted Members by Service Branch Trends: 2000–2016
This table presents trends in the number of Active Duty enlisted personnel by gender from 2000 to 2016 for each of the Service branches. For all Service branches, the number of male Active Duty enlisted members has been decreasing since 2010. The number of female Active Duty enlisted members has been decreasing since 2010 in the Army and Air Force, but has been increasing in the Navy and Marine Corps.
Year Army Navy Marine Corps Air Force Total DoD
Male Female Male Female Male Female Male Female Male Female 2000 339,081 62,491 271,333 42,750 145,539 9,499 227,960 54,344 983,913 169,084 2005 348,079 57,196 261,275 43,698 151,195 9,849 221,207 54,906 981,756 165,649 2010 407,126 60,411 227,307 43,153 169,003 12,218 212,492 50,947 1,015,928 166,729 2015 339,016 53,418 219,273 49,855 150,144 12,625 200,033 46,289 908,466 162,187 2016 325,603 53,232 215,540 50,176 149,497 13,331 204,476 48,286 895,116 165,025
Note: Excludes cases where gender was not reported. Source: DMDC Active Duty Military Personnel Master File (September 2000, 2005, 2010, 2015, 2016)
2.16 ■ Number of Active Duty Male and Female Officers by Service Branch Trends: 2000–2016
This table presents trends in the number of Active Duty officers by gender from 2000 to 2016 for each of the Service branches. From 2000 to 2010, the number of both male and female Active Duty officers increased. Since 2010, the number of male Active Duty officers has been decreasing, while the number of female Active Duty officers has continued to increase.
Year Army Navy Marine Corps Air Force Total DoD
Male Female Male Female Male Female Male Female Male Female 2000 66,085 10,791 45,472 7,816 16,987 930 57,202 11,819 185,746 31,356 2005 68,766 12,442 45,064 7,816 17,699 1,093 59,777 13,470 191,306 34,821 2010 79,346 15,096 44,447 8,232 20,116 1,275 53,838 12,363 197,747 36,966 2015 78,943 15,989 44,792 9,414 19,192 1,456 48,637 12,367 191,564 39,226 2016 76,703 15,733 44,597 9,788 19,150 1,523 48,402 12,559 188,852 39,603
Note: Excludes cases where gender was not reported. Source: DMDC Active Duty Military Personnel Master File (September 2000, 2005, 2010, 2015, 2016)
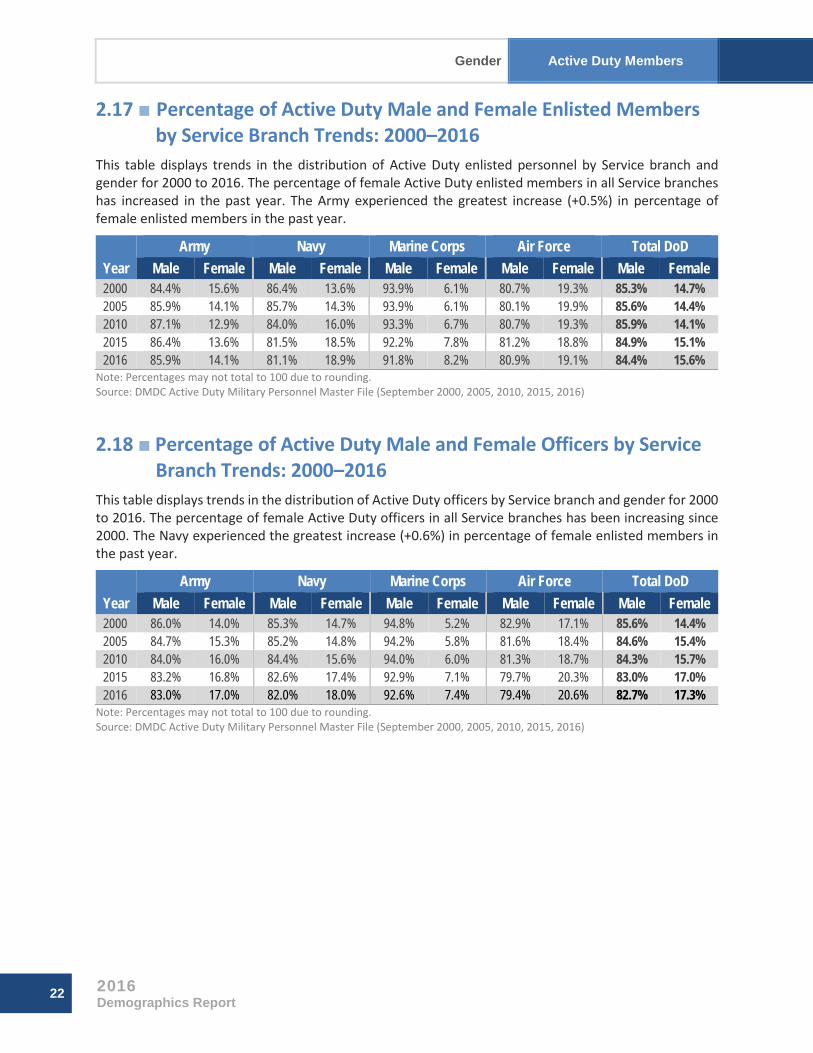
Gender Active Duty Members
22 2016 Demographics Report
2.17 ■ Percentage of Active Duty Male and Female Enlisted Members by Service Branch Trends: 2000–2016
This table displays trends in the distribution of Active Duty enlisted personnel by Service branch and gender for 2000 to 2016. The percentage of female Active Duty enlisted members in all Service branches has increased in the past year. The Army experienced the greatest increase (+0.5%) in percentage of female enlisted members in the past year.
Year Army Navy Marine Corps Air Force Total DoD
Male Female Male Female Male Female Male Female Male Female 2000 84.4% 15.6% 86.4% 13.6% 93.9% 6.1% 80.7% 19.3% 85.3% 14.7% 2005 85.9% 14.1% 85.7% 14.3% 93.9% 6.1% 80.1% 19.9% 85.6% 14.4% 2010 87.1% 12.9% 84.0% 16.0% 93.3% 6.7% 80.7% 19.3% 85.9% 14.1% 2015 86.4% 13.6% 81.5% 18.5% 92.2% 7.8% 81.2% 18.8% 84.9% 15.1% 2016 85.9% 14.1% 81.1% 18.9% 91.8% 8.2% 80.9% 19.1% 84.4% 15.6%
Note: Percentages may not total to 100 due to rounding. Source: DMDC Active Duty Military Personnel Master File (September 2000, 2005, 2010, 2015, 2016)
2.18 ■ Percentage of Active Duty Male and Female Officers by Service Branch Trends: 2000–2016
This table displays trends in the distribution of Active Duty officers by Service branch and gender for 2000 to 2016. The percentage of female Active Duty officers in all Service branches has been increasing since 2000. The Navy experienced the greatest increase (+0.6%) in percentage of female enlisted members in the past year.
Year Army Navy Marine Corps Air Force Total DoD
Male Female Male Female Male Female Male Female Male Female 2000 86.0% 14.0% 85.3% 14.7% 94.8% 5.2% 82.9% 17.1% 85.6% 14.4% 2005 84.7% 15.3% 85.2% 14.8% 94.2% 5.8% 81.6% 18.4% 84.6% 15.4% 2010 84.0% 16.0% 84.4% 15.6% 94.0% 6.0% 81.3% 18.7% 84.3% 15.7% 2015 83.2% 16.8% 82.6% 17.4% 92.9% 7.1% 79.7% 20.3% 83.0% 17.0% 2016 83.0% 17.0% 82.0% 18.0% 92.6% 7.4% 79.4% 20.6% 82.7% 17.3%
Note: Percentages may not total to 100 due to rounding. Source: DMDC Active Duty Military Personnel Master File (September 2000, 2005, 2010, 2015, 2016)

Active Duty Members Race/Ethnicity
2016 Demographics Report
23
Race/Ethnicity
2.19 ■ Race of Active Duty Members (N=1,288,596) This pie graph shows the distribution of Active Duty members by race. Members who report themselves as White make up the highest percentage of Active Duty members (68.6%), while members who report themselves as Black or African American make up 17.4 percent of Active Duty members. Asian, American Indian or Alaska Native, and Native Hawaiian or Other Pacific Islander members make up 4.4 percent, 1.2 percent, and 1.1 percent of Active Duty members, respectively. Over three percent (3.1%) of Active Duty members report themselves as Multi-racial.
* The Army does not report “Multi-racial.” Note: Percentages may not total to 100 due to rounding. Source: DMDC Active Duty Military Personnel Master File (September 2016)
American Indian or Alaska Native
(n=15,858)1.2%Asian
(n=56,068)4.4%
Black or African American
(n=223,700)17.4% Native Hawaiian
or Other Pacific Islander
(n=14,213)1.1%
White (n=883,800)
68.6%
Multi-racial* (n=40,517)
3.1%Other/Unknown
(n=54,440)4.2%

Race/Ethnicity Active Duty Members
24 2016 Demographics Report
2.20 ■ Race of Active Duty Enlisted Members (N=1,060,141) This pie graph shows the distribution of Active Duty enlisted members’ race. Members who report themselves as White make up the highest percentage of Active Duty enlisted members (66.8%), while members who report themselves as Black or African American make up 19.1 percent of Active Duty enlisted members. Asian, American Indian or Alaska Native, and Native Hawaiian or Other Pacific Islander enlisted members make up 4.2 percent, 1.4 percent, and 1.2 percent of Active Duty enlisted members, respectively. Over three percent (3.5%) of Active Duty enlisted members report themselves as Multi-racial.
* The Army does not report “Multi-racial.” Note: Percentages may not total to 100 due to rounding. Source: DMDC Active Duty Military Personnel Master File (September 2016)
American Indian or Alaska Native
(n=14,450)1.4%
Asian (n=44,894)
4.2%
Black or African American
(n=203,095)19.1%
Native Hawaiian or Other Pacific
Islander (n=13,007)
1.2%
White (n=707,872)
66.8%
Multi-racial* (n=36,768)
3.5%
Other/Unknown (n=40,055)
3.8%
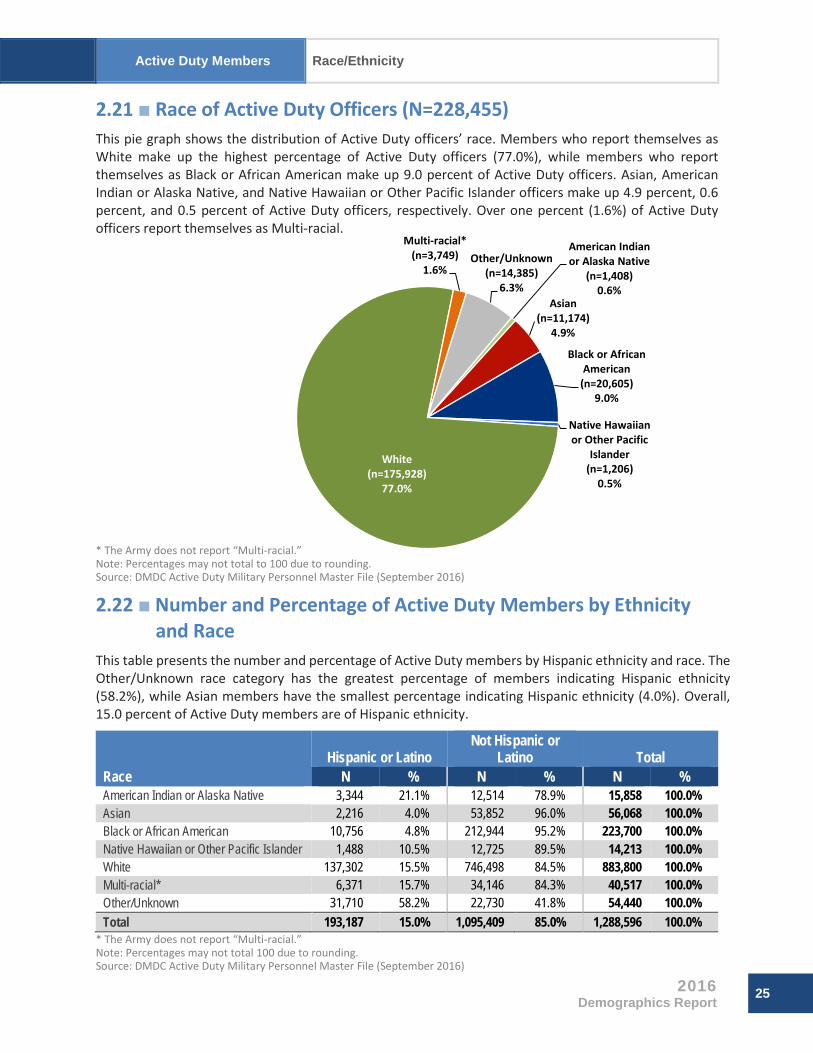
Active Duty Members Race/Ethnicity
2016 Demographics Report
25
2.21 ■ Race of Active Duty Officers (N=228,455) This pie graph shows the distribution of Active Duty officers’ race. Members who report themselves as White make up the highest percentage of Active Duty officers (77.0%), while members who report themselves as Black or African American make up 9.0 percent of Active Duty officers. Asian, American Indian or Alaska Native, and Native Hawaiian or Other Pacific Islander officers make up 4.9 percent, 0.6 percent, and 0.5 percent of Active Duty officers, respectively. Over one percent (1.6%) of Active Duty officers report themselves as Multi-racial.
* The Army does not report “Multi-racial.” Note: Percentages may not total to 100 due to rounding. Source: DMDC Active Duty Military Personnel Master File (September 2016)
2.22 ■ Number and Percentage of Active Duty Members by Ethnicity and Race
This table presents the number and percentage of Active Duty members by Hispanic ethnicity and race. The Other/Unknown race category has the greatest percentage of members indicating Hispanic ethnicity (58.2%), while Asian members have the smallest percentage indicating Hispanic ethnicity (4.0%). Overall, 15.0 percent of Active Duty members are of Hispanic ethnicity.
Race Hispanic or Latino
Not Hispanic or Latino Total
N % N % N % American Indian or Alaska Native 3,344 21.1% 12,514 78.9% 15,858 100.0% Asian 2,216 4.0% 53,852 96.0% 56,068 100.0% Black or African American 10,756 4.8% 212,944 95.2% 223,700 100.0% Native Hawaiian or Other Pacific Islander 1,488 10.5% 12,725 89.5% 14,213 100.0% White 137,302 15.5% 746,498 84.5% 883,800 100.0% Multi-racial* 6,371 15.7% 34,146 84.3% 40,517 100.0% Other/Unknown 31,710 58.2% 22,730 41.8% 54,440 100.0% Total 193,187 15.0% 1,095,409 85.0% 1,288,596 100.0%
* The Army does not report “Multi-racial.” Note: Percentages may not total 100 due to rounding. Source: DMDC Active Duty Military Personnel Master File (September 2016)
American Indian or Alaska Native
(n=1,408)0.6%
Asian (n=11,174)
4.9%
Black or African American
(n=20,605)9.0%
Native Hawaiian or Other Pacific
Islander (n=1,206)
0.5%
White (n=175,928)
77.0%
Multi-racial* (n=3,749)
1.6%Other/Unknown
(n=14,385)6.3%

Race/Ethnicity Active Duty Members
26 2016 Demographics Report
2.23 ■ Number of Active Duty Racial Minority Enlisted Members and Officers by Race and Service Branch
This table presents the number of Active Duty racial minority enlisted personnel and officers by race for each Service branch. In total, there are 352,269 racial minority enlisted members and 52,527 racial minority officers on Active Duty. Racial minority includes those who indicate themselves as Black or African American, Asian, American Indian or Alaska Native, Native Hawaiian or Other Pacific Islander, Multi-racial, and Other/Unknown.
Service Branch
Black or African American Asian
Native Hawaiian or Other Pacific Islander
American Indian or Alaska Native
Enlisted Officers Enlisted Officers Enlisted Officers Enlisted Officers Army 92,032 11,525 17,073 5,069 4,676 523 3,000 484 Navy 50,815 4,300 14,860 2,633 3,244 266 7,963 443 Marine Corps 18,761 1,158 4,424 655 1,872 122 1,761 172 Air Force 41,487 3,622 8,537 2,817 3,215 295 1,726 309 Total DoD 203,095 20,605 44,894 11,174 13,007 1,206 14,450 1,408
Service Branch
Multi-racial Other/Unknown Racial Minority Total Enlisted Officers Enlisted Officers Enlisted Officers
Army N/A* N/A* 15,603 6,754 132,384 24,355 Navy 24,631 2,001 9,353 2,047 110,866 11,690 Marine Corps 1,508 315 5,239 1,695 33,565 4,117 Air Force 10,629 1,433 9,860 3,889 75,454 12,365 Total DoD 36,768 3,749 40,055 14,385 352,269 52,527
* The Army does not report “Multi-racial.” Source: DMDC Active Duty Military Personnel Master File (September 2016)
2.24 ■ Percentage of Active Duty Racial Minority Enlisted Members and Officers by Race and Service Branch
This table depicts the percentage of racial minority enlisted members and officers in relation to the total number of Active Duty enlisted members and officers for each Service branch. The Navy (41.7%) has the largest percentage of Active Duty Enlisted racial minorities, with the Army (26.3%) having the largest proportion of racial minority officers.
Service Branch
Black or African American Asian
Native Hawaiian or Other Pacific Islander
Native American/ Alaska Native
Enlisted Officers Enlisted Officers Enlisted Officers Enlisted Officers Army 24.3% 12.5% 4.5% 5.5% 1.2% 0.6% 0.8% 0.5% Navy 19.1% 7.9% 5.6% 4.8% 1.2% 0.5% 3.0% 0.8% Marine Corps 11.5% 5.6% 2.7% 3.2% 1.1% 0.6% 1.1% 0.8% Air Force 16.4% 5.9% 3.4% 4.6% 1.3% 0.5% 0.7% 0.5% Total DoD 19.2% 9.0% 4.2% 4.9% 1.2% 0.5% 1.4% 0.6%
Service Branch
Multi-racial Other/Unknown Racial Minority Total Enlisted Officers Enlisted Officers Enlisted Officers
Army N/A* N/A* 4.1% 7.3% 34.9% 26.3% Navy 9.3% 3.7% 3.5% 3.8% 41.7% 21.5% Marine Corps 0.9% 1.5% 3.2% 8.2% 20.6% 19.9% Air Force 4.2% 2.4% 3.9% 6.4% 29.9% 20.3% Total DoD 3.5% 1.6% 3.8% 6.3% 33.2% 23.0%
* The Army does not report “Multi-racial.” Source: DMDC Active Duty Military Personnel Master File (September 2016)

Active Duty Members Race/Ethnicity
2016 Demographics Report
27
2.25 ■ Racial Minority Enlisted Members and Officers on Active Duty (N=404,796)
This pie graph presents the distribution of racial minority enlisted members and officers on Active Duty. Self-reported racial minority categories include Black or African American, Asian, American Indian or Alaska Native, Native Hawaiian or Other Pacific Islander, Multi-racial, and Other/Unknown. Of the 404,796 total Active Duty racial minority members, 87.0 percent are enlisted members and 13.0 percent are officers.
Note: Racial minority includes Black or African American, Asian, American Indian or Alaska Native, Native Hawaiian or Other Pacific Islander, Multi-racial, and Other/Unknown. Note: Percentages may not total to 100 due to rounding. Source: DMDC Active Duty Military Personnel Master File (September 2016)
2.26 ■ Number and Ratio of Active Duty Racial Minority Enlisted Members and Officers by Service Branch
This table presents the number and ratio of Active Duty racial minority enlisted members and minority officers by Service branch. The Army has the lowest ratio of racial minority enlisted members to racial minority officers (5.4 to 1), while the Navy has the highest ratio (9.5 to 1). The total DoD ratio of racial minority enlisted members to racial minority officers (6.7 to 1) is higher than the total DoD ratio of enlisted members to officers for all members (4.6 to 1).
Service Branch Racial Minority
Enlisted Racial Minority
Officers Total Ratio of Enlisted
to Officers Army 132,384 24,355 156,739 5.4 to 1 Navy 110,866 11,690 122,556 9.5 to 1 Marine Corps 33,565 4,117 37,682 8.2 to 1 Air Force 75,454 12,365 87,819 6.1 to 1 Total DoD 352,269 52,527 404,796 6.7 to 1
Note: Racial minority includes Black or African American, Asian, American Indian or Alaska Native, Native Hawaiian or Other Pacific Islander, Multi-racial, and Other/Unknown. Source: DMDC Active Duty Military Personnel Master File (September 2016)
Racial Minority Enlisted
(n=352,269)87.0%
Racial Minority Officers
(n=52,527)13.0%

Race/Ethnicity Active Duty Members
28 2016 Demographics Report
2.27 ■ Percentage of Active Duty Racial Minorities and Non-minorities by Service Branch and Pay Grade
This table presents the percentage of Active Duty members who are racial minority and non-minority by Service branch and pay grade. Of the four service branches, the Navy has the greatest percentage of racial minority members (38.3%).
Pay Grade
Army Navy Marine Corps Air Force Total DoD Racial
Minority Non-
minority Racial
Minority Non-
minority Racial
Minority Non-
minority Racial
Minority Non-
minority Racial
Minority Non-
minority E1-E4 32.6% 67.4% 41.1% 58.9% 17.4% 82.6% 29.0% 71.0% 30.8% 69.2% E5-E6 35.3% 64.7% 43.9% 56.1% 24.4% 75.6% 30.5% 69.5% 35.4% 64.6% E7-E9 44.0% 56.0% 36.3% 63.7% 35.3% 64.7% 31.1% 68.9% 37.9% 62.1% W1-W5 32.6% 67.4% 39.3% 60.7% 28.3% 71.7% N/A* N/A* 32.8% 67.2% O1-O3 25.5% 74.5% 22.6% 77.4% 19.7% 80.3% 22.2% 77.8% 23.3% 76.7% O4-O6 24.7% 75.3% 18.3% 81.7% 17.8% 82.2% 17.9% 82.1% 20.4% 79.6% O7-O10 17.2% 82.8% 10.6% 89.4% 11.6% 88.4% 7.4% 92.6% 12.0% 88.0% Total 33.3% 66.7% 38.3% 61.7% 20.5% 79.5% 28.0% 72.0% 31.4% 68.6%
* The Air Force does not have warrant officers. Note: Racial minority includes Black or African American, Asian, American Indian or Alaska Native, Native Hawaiian or Other Pacific Islander, Multi-racial, and Other/Unknown. Note: Percentages may not total to 100 due to rounding. Source: DMDC Active Duty Military Personnel Master File (September 2016)
2.28 ■ Number of Active Duty Racial Minority Enlisted Members and Officers by Service Branch Trends: 2000–2016
This table presents the number of Active Duty racial minority enlisted members and officers from 2000 to 2016 by Service branch. Similar to the trend in total Active Duty members, the number of both racial minority enlisted members and racial minority officers has been decreasing since 2010.
Year Army Navy Marine Corps Air Force Total DoD
Enlisted Officers Enlisted Officers Enlisted Officers Enlisted Officers Enlisted Officers 2000 181,245 18,050 125,219 9,796 53,415 2,904 80,351 10,075 440,230 40,825 2005 169,254 21,252 129,354 10,773 57,957 4,563 85,479 14,103 442,044 50,691 2010 145,346 26,017 112,282 10,053 39,238 4,118 74,977 13,099 371,843 53,287 2015 135,316 25,124 113,507 11,387 33,646 3,974 72,528 12,081 354,997 52,566 2016 132,384 24,355 110,866 11,690 33,565 4,117 75,454 12,365 352,269 52,527
Note: For 2000 & 2005, Hispanic was included as a minority designation. To conform to the Office of Management and Budget (OMB) directives, Hispanic has not been considered a minority race designation since 2010 and only Active Duty members’ race was used to determine minority status.
= Change in OMB definition of race Source: DMDC Active Duty Military Personnel Master File (September 2000, 2005, 2010, 2015, 2016)

Active Duty Members Race/Ethnicity
2016 Demographics Report
29
2.29 ■ Percentage of Active Duty Racial Minority Enlisted Members and Officers by Service Branch Trends: 2000–2016
This table presents the percentage trends from 2000 to 2016 of Active Duty enlisted members and officers who are racial minorities by Service branch. The percentage of racial minority enlisted members and officers on Active Duty has increased or remained constant since 2010.
Year Army Navy Marine Corps Air Force Total DoD
Enlisted Officers Enlisted Officers Enlisted Officers Enlisted Officers Enlisted Officers 2000 45.1% 23.5% 39.9% 18.4% 34.5% 16.2% 28.5% 14.6% 38.2% 18.8% 2005 41.8% 26.2% 42.4% 20.4% 36.0% 24.3% 31.0% 19.3% 38.5% 22.4% 2010 31.1% 27.5% 41.5% 19.1% 21.7% 19.3% 28.5% 19.8% 31.4% 22.7% 2015 34.5% 26.5% 42.2% 21.0% 20.7% 19.2% 29.4% 19.8% 33.2% 22.8% 2016 34.9% 26.3% 41.7% 21.5% 20.6% 19.9% 29.9% 20.3% 33.2% 23.0%
Note: For 2000 & 2005, Hispanic was included as a racial minority designation. To conform to the Office of Management and Budget (OMB) directives, Hispanic has not been considered a minority race designation since 2010 and only Active Duty members’ race was used to determine minority status.
= Change in OMB definition of race Source: DMDC Active Duty Military Personnel Master File (September 2000, 2005, 2010, 2015, 2016)
2.30 ■ Percentage of Racial Minorities on Active Duty by Service Branch Trends: 2000–2016
This graph presents the percentage of Active Duty racial minorities from 2010 to 2016 for each Service branch. From 2010 to 2016, the percentage of racial minorities in the Army, Navy, and Air Force has increased. However, the percentage of racial minority Service members in the Marine Corps decreased from 2010 to 2016. The percentages depicted in this graph are provided in Exhibit 2.29.
Note: Data are represented ONLY for the years indicated. Data for the years in between are NOT represented in this graph. Source: DMDC Active Duty Military Personnel Master File (September 2010, 2015, 2016)
0%
10%
20%
30%
40%
50%
2010 2015 2016
Army (+2.8%) Navy (+0.4%) Marine Corps (-0.9%) Air Force (+1.3%) Total DoD (+1.4%)

Geographic Location Active Duty Members
30 2016 Demographics Report
Geographic Location
2.31 ■ Worldwide Geographic Location of Active Duty Members (N=1,288,596)
The distribution of Active Duty members is presented by geographic location. The majority of Active Duty members (88.0%) are stationed in the United States and U.S. territories. The next largest percentages of Active Duty members are stationed in Europe (5.1%) and East Asia (5.0%).
** United States, U.S. Territories includes the United States, Puerto Rico, Guam, Virgin Islands, American Samoa, and Wake Island. ** Western Hemisphere does not overlap with the United States, U.S. Territories. Note: Percentages may not total to 100 due to rounding. Source: DMDC Active Duty Military Personnel Master File (September 2016)
United States, U.S. Territories*
(n=1,134,083)88.0%
Europe (n=65,621)
5.1%
East Asia (n=64,726)
5.0%
North Africa (n=6,619)
0.5%
Western Hemisphere**
(n=2,729)0.2%
Other/Unknown/Ships Afloat (n=14,818)
1.1%
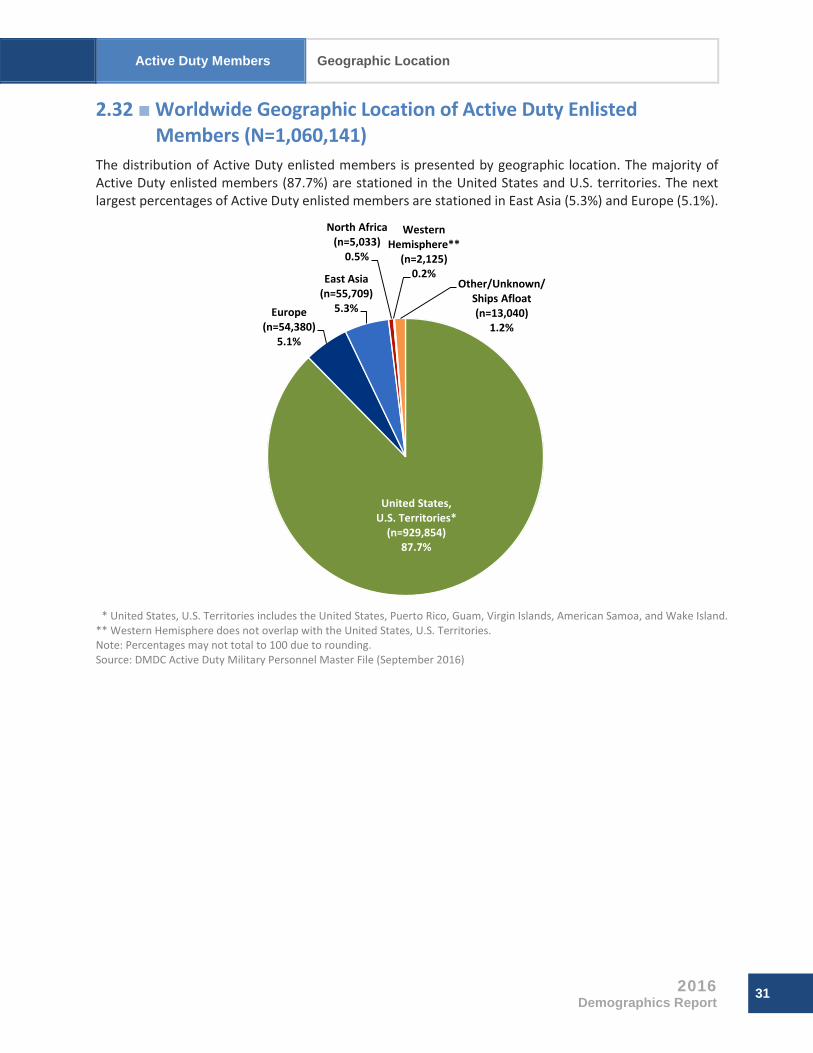
Active Duty Members Geographic Location
2016 Demographics Report
31
2.32 ■ Worldwide Geographic Location of Active Duty Enlisted Members (N=1,060,141)
The distribution of Active Duty enlisted members is presented by geographic location. The majority of Active Duty enlisted members (87.7%) are stationed in the United States and U.S. territories. The next largest percentages of Active Duty enlisted members are stationed in East Asia (5.3%) and Europe (5.1%).
** United States, U.S. Territories includes the United States, Puerto Rico, Guam, Virgin Islands, American Samoa, and Wake Island. ** Western Hemisphere does not overlap with the United States, U.S. Territories. Note: Percentages may not total to 100 due to rounding. Source: DMDC Active Duty Military Personnel Master File (September 2016)
United States, U.S. Territories*
(n=929,854)87.7%
Europe (n=54,380)
5.1%
East Asia (n=55,709)
5.3%
North Africa (n=5,033)
0.5%
Western Hemisphere**
(n=2,125)0.2%
Other/Unknown/Ships Afloat (n=13,040)
1.2%

Geographic Location Active Duty Members
32 2016 Demographics Report
2.33 ■ Worldwide Geographic Location of Active Duty Officers (N=228,455)
The distribution of Active Duty officers is presented by geographic location. The majority of Active Duty officers (89.4%) are stationed in the United States and U.S. territories. The next largest percentages of Active Duty officers are stationed in Europe (4.9%) and East Asia (3.9%).
** United States, U.S. Territories includes the United States, Puerto Rico, Guam, Virgin Islands, American Samoa, and Wake Island. ** Western Hemisphere does not overlap with the United States, U.S. Territories. Note: Percentages may not total to 100 due to rounding. Source: DMDC Active Duty Military Personnel Master File (September 2016)
2.34 ■ Worldwide Geographic Location by Service Branch This table presents the number and percentage of Active Duty members by Service branch and geographic location. For each Service branch, the majority of Active Duty members are located in the U.S. or U.S. territories. Europe has the next largest number of Active Duty members for the Army and Air Force, while East Asia has the next largest number of Active Duty members for the Navy and Marine Corps.
Location of Active Duty Army Navy Marine Corps Air Force Total DoD
N % N % N % N % N % United States, U.S. Territories* 423,584 89.9% 293,646 91.7% 155,000 84.5% 261,853 83.5% 1,134,083 88.0% Europe 26,424 5.6% 8,150 2.5% 3,245 1.8% 27,802 8.9% 65,621 5.1% East Asia 18,853 4.0% 11,883 3.7% 14,158 7.7% 19,832 6.3% 64,726 5.0% North Africa 1,530 0.3% 3,885 1.2% 673 0.4% 531 0.2% 6,619 0.5% Western Hemisphere** 553 0.1% 711 0.2% 991 0.5% 474 0.2% 2,729 0.2% Other/Unknown/Ships Afloat 327 0.1% 1,826 0.6% 9,434 5.1% 3,231 1.0% 14,818 1.1% Total 471,271 100.0% 320,101 100.0% 183,501 100.0% 313,723 100.0% 1,288,596 100.0%
** United States, U.S. Territories includes the United States, Puerto Rico, Guam, Virgin Islands, American Samoa, and Wake Island. ** Western Hemisphere does not overlap with the United States, U.S. Territories. Note: Percentages may not total to 100 due to rounding. Source: DMDC Active Duty Military Personnel Master File (September 2016)
United States, U.S. Territories*
(n=204,229)89.4%
Europe (n=11,241)
4.9%
East Asia (n=9,017)
3.9%
North Africa (n=1,586)
0.7%
Western Hemisphere**
(n=604)0.3%
Other/Unknown/Ships Afloat
(n=1,778)0.8%

Active Duty Members Geographic Location
2016 Demographics Report
33
2.35 ■ Number and Percentage of Active Duty Members within the United States by State
The number of Active Duty members per state, including the District of Columbia, is presented below in descending order. Of the 1,021,370 personnel stationed in the United States, almost half (47.6%) are located in six states (California, Texas, North Carolina, Virginia, Georgia, and Florida).
Rank State
Number of Active
Duty
Percentage of Total
U.S. Active Duty
Cumulative Percentage Rank State
Number of Active
Duty
Percentage of Total
U.S. Active Duty
Cumulative Percentage
1 California 123,603 10.9 10.9 28 Nebraska 6,228 0.5 85.3 2 Texas 117,553 10.4 21.3 29 New Jersey 5,911 0.5 85.8 3 North Carolina 96,170 8.5 29.7 30 Utah 4,104 0.4 86.1 4 Virginia 87,984 7.8 37.5 31 Connecticut 4,050 0.4 86.5 5 Georgia 62,501 5.5 43.0 32 Arkansas 3,953 0.3 86.8 6 Florida 52,023 4.6 47.6 33 Delaware 3,355 0.3 87.1 7 Washington 44,148 3.9 51.5 34 Idaho 3,338 0.3 87.4 8 Hawaii 37,374 3.3 54.8 35 Montana 3,289 0.3 87.7 9 South Carolina 36,613 3.2 58.0 36 South Dakota 3,246 0.3 88.0
10 Colorado 34,930 3.1 61.1 37 Wyoming 3,030 0.3 88.3 11 Kentucky 32,563 2.9 64.0 38 Rhode Island 3,021 0.3 88.5 12 Maryland 28,392 2.5 66.5 39 Pennsylvania 2,358 0.2 88.8 13 Kansas 22,270 2.0 68.4 40 Tennessee 2,014 0.2 88.9 14 New York 20,313 1.8 70.2 41 Massachusetts 1,980 0.2 89.1 15 Oklahoma 20,252 1.8 72.0 42 Michigan 1,053 0.1 89.2 16 Arizona 18,598 1.6 73.7 43 Indiana 922 0.1 89.3 17 Alaska 17,243 1.5 75.2 44 Wisconsin 643 0.1 89.3 18 Illinois 15,882 1.4 76.6 45 Oregon 532 0.0 89.4 19 Missouri 15,512 1.4 78.0 46 New Hampshire 518 0.0 89.4 20 Louisiana 14,623 1.3 79.2 47 Minnesota 498 0.0 89.5 21 New Mexico 12,123 1.1 80.3 48 Maine 333 0.0 89.5 22 Nevada 10,397 0.9 81.2 49 Iowa 219 0.0 89.5 23 Mississippi 9,758 0.9 82.1 50 West Virginia 142 0.0 89.5 24 District of Columbia 8,173 0.7 82.8 51 Vermont 115 0.0 89.5 25 Alabama 7,904 0.7 83.5 Unknown* 6,019 0.5 90.1 26 North Dakota 7,157 0.6 84.1 Total DoD in U.S. 1,021,370 100.0 27 Ohio 6,440 0.6 84.7
* Unknown includes Active Duty members located in the United States whose state information is unknown. Note: Percentages may not total to 100 due to rounding. Source: DMDC Active Duty Military Personnel Master File (September 2016)

Geographic Location Active Duty Members
34 2016 Demographics Report
2.36 ■ Number and Percentage of Active Duty Members by Worldwide Geographic Location Trends: 2000–2016
The number and percentage of Active Duty personnel by geographic location from 2000 to 2016 is presented in the table below. Consistent with last year’s results, 87.5% of Active Duty personnel were stationed in the United States or U.S. Territories, which along with the 2015 percentage, is at its highest percentage (87.5%) over the past 15 years.
Location of Active Duty
2000 2005 2010 2015 2016 N % N % N % N % N %
United States, U.S. Territories* 1,168,749 85.3% 1,177,078 86.1% 1,224,050 86.4% 1,138,399 87.5% 1,134,083 87.5%
Europe 104,514 7.6% 100,018 7.3% 80,420 5.7% 65,965 5.1% 65,621 5.1% East Asia 78,346 5.7% 81,703 6.0% 99,970 7.1% 84,179 6.5% 64,726 6.5% North Africa 3,023 0.2% 183 0.0% 4,871 0.3% 8,568 0.7% 6,619 0.7% Western Hemisphere** 4,293 0.3% 1,991 0.1% 2,185 0.2% 2,379 0.2% 2,729 0.2%
Unknown/Other/ Ships Afloat 11,753 0.9% 5,467 0.4% 5,874 0.4% 1,953 0.2% 14,818 0.2%
Total 1,370,678 100.0% 1,366,440 100.0% 1,417,370 100.0% 1,301,443 100.0% 1,301,443 100.0% ** United States, U.S. Territories includes the United States, Puerto Rico, Guam, Virgin Islands, American Samoa, and Wake Island. ** Western Hemisphere does not overlap with the United States, U.S. Territories. Note: Percentages may not total to 100 due to rounding. Source: Washington Headquarters Service, Directorate for Information Operations and Reports (2000); DMDC Active Duty Military Personnel Master File (September 2005, 2010, 2015, 2016)

Active Duty Members Age
2016 Demographics Report
35
Age
2.37 ■ Age of Active Duty Members (N=1,288,596) This pie graph presents the age breakdown of all Active Duty members. Over 40 percent (44.2%) of Active Duty members are 25 years of age or younger.
Note: Percentages may not total to 100 due to rounding. Source: DMDC Active Duty Military Personnel Master File (September 2016)
2.38 ■ Age of Active Duty Enlisted Members (N=1,060,141) This pie graph presents the distribution of Active Duty enlisted members by age group. Approximately half (50.8%) of Active Duty enlisted personnel are 25 years of age or younger.
Note: Percentages may not total to 100 due to rounding. Source: DMDC Active Duty Military Personnel Master File (September 2016)
25 Years or Younger
(n=569,587)44.2%
26 to 30 Years (n=277,437)
21.5%
31 to 35 Years (n=196,154)
15.2%
36 to 40 Years
(n=133,781)10.4%
41 Years or Older
(n=111,637)8.7%
25 Years or Younger
(n=538,224)50.8%
26 to 30 Years (n=225,844)
21.3%
31 to 35 Years (n=148,118)
14.0%
36 to 40 Years
(n=93,856)8.8%
41 Years or Older
(n=54,590)5.1%

Age Active Duty Members
36 2016 Demographics Report
2.39 ■ Age of Active Duty Officers (N=228,455) This pie graph presents the distribution of Active Duty officers by age group. Overall, 42.7 percent of Active Duty officers are 36 years of age or older, compared to 13.9 percent of Active Duty enlisted members.
Note: Percentages may not total to 100 due to rounding. Source: DMDC Active Duty Military Personnel Master File (September 2016)
2.40 ■ Number of Active Duty Enlisted Members and Officers by Service Branch and Age
This table presents the number of Active Duty enlisted personnel and officers by Service branch and age group. Across all Service branches, the largest number of enlisted members are 25 years of age or younger. The largest number of officers in the Army and Navy are 41 years of age or older, while the largest number of officers in the Marine Corps and Air Force are between the ages of 26 and 30 years.
Age Army Navy Marine Corps Air Force Total DoD
Enlisted Officers Enlisted Officers Enlisted Officers Enlisted Officers Enlisted Officers 25 or Younger 185,523 12,460 124,616 7,434 117,956 3,251 110,129 8,218 538,224 31,363 26 to 30 77,985 18,927 64,565 11,876 22,675 5,280 60,619 15,510 225,844 51,593 31 to 35 54,192 19,239 39,416 10,478 11,926 4,593 42,584 13,726 148,118 48,036 36 to 40 34,461 17,431 24,343 9,401 6,819 3,565 27,742 10,019 93,365 40,416 41 or Older 26,674 24,379 12,776 15,196 3,452 3,984 11,688 13,488 54,590 57,047 Subtotal 378,835 92,436 265,716 54,385 162,828 20,673 252,762 60,961 1,060,141 228,455 Total 471,271 320,101 183,501 313,723 1,288,596
Source: DMDC Active Duty Military Personnel Master File (September 2016)
25 Years or Younger
(n=31,363)13.7%
26 to 30 Years (n=51,593)
22.6%
31 to 35 Years (n=48,036)
21.0%
36 to 40 Years (n=40,416)
17.7%
41 Years or Older (n=57,047)
25.0%

Active Duty Members Age
2016 Demographics Report
37
2.41 ■ Percentage of Active Duty Enlisted Members and Officers by Service Branch and Age
This table presents the percentage of Active Duty enlisted members and officers by Service branch and age group. Across all Service branches, the majority (72.1%) of enlisted members are 30 years or younger, while about two-thirds (63.7%) of officers are over 30 years of age.
Age Army Navy Marine Corps Air Force Total DoD
Enlisted Officers Enlisted Officers Enlisted Officers Enlisted Officers Enlisted Officers 25 or Younger 49.0% 13.5% 46.9% 13.7% 72.4% 15.7% 43.6% 13.5% 50.8% 13.7% 26 to 30 20.6% 20.5% 24.3% 21.8% 13.9% 25.5% 24.0% 25.4% 21.3% 22.6% 31 to 35 14.3% 20.8% 14.8% 19.3% 7.3% 22.2% 16.8% 22.5% 14.0% 21.0% 36 to 40 9.1% 18.9% 9.2% 17.3% 4.2% 17.2% 11.0% 16.4% 8.8% 17.7% 41 or Older 7.0% 26.4% 4.8% 27.9% 2.1% 19.3% 4.6% 22.1% 5.1% 25.0% Total 100.0% 100.0% 100.0% 100.0% 100.0% 100.0% 100.0% 100.0% 100.0% 100.0%
Note: Percentages may not total to 100 due to rounding. Source: DMDC Active Duty Military Personnel Master File (September 2016)
2.42 ■ Average Age of Active Duty Enlisted Members and Officers by Service Branch
This table presents the average age of Active Duty enlisted members and officers by Service branch. The average age of Active Duty enlisted members is 27.1 years, while the average age of Active Duty officers is 34.6 years. The average age of Marine Corps members is younger than the average age for the other Service branches.
Army Navy Marine Corps Air Force Total DoD Enlisted 27.6 27.5 24.1 27.9 27.1 Officers 35.0 35.1 33.4 34.1 34.6 Total 29.1 28.8 25.1 29.1 28.5
Source: DMDC Active Duty Military Personnel Master File (September 2016)

Age Active Duty Members
38 2016 Demographics Report
2.43 ■ Active Duty Member Age Trends: 2000–2016 This chart presents the percentage of Active Duty members in each age group from 2000 to 2016. Since 2000, the largest percentage of Active Duty members have consistently been in the 25 years or younger age group, followed by the 26 to 30 years age group.
Source: DMDC Active Duty Military Personnel Master File (September 2000, 2005, 2010, 2015, 2016)
2.44 ■ Average Age of Active Duty Enlisted Members and Officers Trends: 2000–2016
This table presents the average age of Active Duty enlisted members and officers for 2000 to 2016. Since 2010, the average age for Active Duty enlisted personnel has decreased from 27.3 to 27.1 years of age. The average age for Active Duty officers has decreased from 34.7 to 34.6 years of age in the past year.
2000 2005 2010 2015 2016 Enlisted 27.1 27.1 27.3 27.2 27.1 Officers 34.5 34.6 34.7 34.7 34.6 Total 28.3 28.3 28.5 28.5 28.5
Source: DMDC Active Duty Military Personnel Master File (September 2000, 2005, 2010, 2015, 2016)
7.8% 8.8% 8.8% 8.9% 8.7%
13.3% 11.4% 11.0% 10.4% 10.4%
14.7% 13.9% 13.8% 15.2% 15.2%
18.4% 19.3% 22.1% 21.8% 21.5%
45.8% 46.6% 44.2% 43.8% 44.2%
0%
20%
40%
60%
80%
100%
2000 2005 2010 2015 2016
25 Years or Younger26 to 30 Years31 to 35 Years36 to 40 Years41 Years or Older

Active Duty Members Education
2016 Demographics Report
39
Education 2.45 ■ Education Level of Active Duty Members (N=1,288,596) This pie graph shows the education level of Active Duty personnel. The majority of Active Duty members (76.1%) hold a high school diploma but less than a Bachelor’s degree, and less than one-quarter (21.6%) of Active Duty members hold a Bachelor’s degree or higher.
* Includes cases with at least a high school diploma and possibly additional education less than a Bachelor’s degree (e.g., Associate’s degree).
Note: Percentages may not total to 100 due to rounding. Source: DMDC Active Duty Military Personnel Master File (September 2016)
2.46 ■ Education Level of Active Duty Enlisted Members (N=1,060,141) This pie graph presents the education level of Active Duty enlisted personnel. The majority of Active Duty enlisted members have at least a high school diploma (99.2%), which is higher than the percentage of the U.S. civilian population age 25 and over that had at least a high school diploma (89.1%) in 2016.
* Includes cases with at least a high school diploma and possibly additional education less than a Bachelor’s degree (e.g., Associate’s degree).
Note: Percentages may not total to 100 due to rounding. Source: DMDC Active Duty Military Personnel Master File (September 2016); United States Census (2016)
No High School Diploma or GED
(n=2,167)0.2%
High School Diploma/GED
or Some College*
(n=966,878)91.2%
Bachelor's Degree
(n=73,092)6.9%
Advanced Degree
(n=11,579)1.1%
Unknown (n=6,425)
0.6%
No High School Diploma or GED
(n=2,181)0.2%
High School Diploma/GED
or Some College*
(n=980,851)76.1%
Bachelor’s Degree
(n=171,717)13.3%
Advanced Degree
(n=107,114)8.3%
Unknown (n=26,733)
2.1%

Education Active Duty Members
40 2016 Demographics Report
2.47 ■ Education Level of Active Duty Officers (N=228,455) The education level of Active Duty officers is presented in this pie graph. Overall, the population of Active Duty officers has a higher level of formal education than the civilian population. The majority of officers (85.0%) have a Bachelor’s or advanced degree. In comparison, only 33.4 percent of the U.S. population age 25 and over had a Bachelor’s degree or higher in 2016.
* Includes cases with at least a high school diploma and possibly additional education less than a Bachelor’s degree (e.g., Associate’s degree).
Note: Percentages may not total to 100 due to rounding. Source: DMDC Active Duty Military Personnel Master File (September 2016); United States Census (2016)
2.48 ■ Number of Active Duty Members by Service Branch and Education Level
This table provides a breakdown of the education level of Active Duty members by Service branch. Of the Active Duty members with a known education level, the Air Force has the highest percentage of members with a Bachelor’s degree or higher (27.5%, or 84,930 of 309,361 members), while the Marine Corps has the lowest percentage of members with a Bachelor’s degree or higher (12.0%, or 21,788 of 181,368 members).
Highest Degree Attained Army Navy Marine Corps Air Force Total DoD
No High School Diploma or GED 974 1,116 63 28 2,181 High School Diploma/GED or Some College* 353,664 243,267 159,517 224,403 980,851 Bachelor’s Degree 74,945 34,715 17,762 44,295 171,717 Advanced Degree 40,423 22,030 4,026 40,635 107,114 Unknown 1,265 18,973 2,133 4,362 26,733 Total 471,271 320,101 183,501 313,723 1,288,596
* Includes cases with at least a high school diploma and possibly additional education less than a Bachelor’s degree (e.g., Associate’s degree).
Source: DMDC Active Duty Military Personnel Master File (September 2016)
No High School Diploma or GED
(n=14)0.0%
High School Diploma/GED
or Some College*
(n=13,973)6.1%
Bachelor's Degree
(n=98,625)43.2%
Advanced Degree
(n=95,535)41.8%
Unknown (n=20,308)
8.9%

Active Duty Members Education
2016 Demographics Report
41
2.49 ■ Percentage of Active Duty Enlisted Members by Education Level Trends: 2000–2016
This table presents the distribution of Active Duty enlisted personnel by education level from 2000 to 2016. The percentage of Active Duty enlisted members with a Bachelor’s degree or higher has been increasing since 2000.
Highest Degree Attained 2000
(N=1,153,575) 2005
(N=1,147,407) 2010
(N=1,182,657) 2015
(N=1,301,443) 2016
(N=1,060,141) No High School Diploma or GED 0.7% 0.8% 0.6% 0.2% 0.2% High School Diploma/GED or Some College* 95.2% 94.1% 93.6% 91.6% 91.2%
Bachelor’s Degree 3.0% 3.7% 4.3% 6.6% 6.9% Advanced Degree 0.3% 0.4% 0.6% 1.0% 1.1% Unknown 0.8% 0.9% 0.9% 0.6% 0.6% Total 100.0% 100.0% 100.0% 100.0% 100.0%
* Includes cases with at least a high school diploma and possibly additional education less than a Bachelor’s degree (e.g., Associate’s degree).
Note: Percentages may not total to 100 due to rounding. Source: DMDC Active Duty Military Personnel Master File (September 2000, 2005, 2010, 2015, 2016)
2.50 ■ Percentage of Active Duty Officers by Education Level Trends: 2000–2016
This table presents the distribution of Active Duty officers by education level from 2000 to 2016. The percentage of Active Duty officers who are reported to have at least a Bachelor’s degree decreased from 2000 (89.9%) to 2010 (82.7%), but has increased to 85.0 percent in 2016.
Highest Degree Attained 2000
(N=217,103) 2005
(N=226,127) 2010
(N=234,713) 2015
(N=230,790) 2016
(N=228,455) No High School Diploma or GED 0.1% 0.2% 0.0% 0.0% 0.0% High School Diploma/GED or Some College* 6.0% 8.4% 8.0% 6.5% 6.1% Bachelor’s Degree 49.9% 52.3% 45.0% 42.3% 43.2% Advanced Degree 40.0% 33.9% 37.7% 41.5% 41.8% Unknown 4.1% 5.2% 9.2% 9.7% 8.9% Total 100.0% 100.0% 100.0% 100.0% 100.0%
* Includes cases with at least a high school diploma and possibly additional education less than a Bachelor’s degree (e.g., Associate’s degree).
Note: Percentages may not total to 100 due to rounding. Source: DMDC Active Duty Military Personnel Master File (September 2000, 2005, 2010, 2015, 2016)

Marital Status Active Duty Members
42 2016 Demographics Report
Marital Status 2.51 ■ Marital Status of Active Duty Members (N=1,288,596) This pie graph presents the marital status of Active Duty members. Of the 1,288,596 Active Duty members, 53.5 percent are reported as married in 2016. “Married” includes those who are married or remarried.
* Includes annulled, widowed, and unknown cases. Note: The Navy only reports “Married” or “Never Married” for military members’ marital status. Note: Percentages may not total to 100 due to rounding. Source: DMDC Active Duty Military Personnel Master File (September 2016)
2.52 ■ Marital Status of Active Duty Enlisted Members (N=1,060,141) The marital status of Active Duty enlisted personnel is presented below. Half (50.1%) of Active Duty enlisted personnel are married and over two-fifths (45.8%) have never been married.
* Includes annulled, widowed, and unknown cases. Note: The Navy only reports “Married” or “Never Married” for military members’ marital status. Note: Percentages may not total to 100 due to rounding. Source: DMDC Active Duty Military Personnel Master File (September 2016)
Married (n=689,058)
53.5%
Never Married (n=548,486)
42.6%
Divorced (n=49,309)
3.8%
Other* (n=1,743)
0.1%
Married (n=530,989)
50.1%
Never Married (n=486,045)
45.8%
Divorced (n=41,578)
3.9%
Other* (n=1,529)
0.1%

Active Duty Members Marital Status
2016 Demographics Report
43
2.53 ■ Marital Status of Active Duty Officers (N=228,454) The marital status of Active Duty officers is presented below. The majority of Active Duty officers are married (69.2%), though over one-quarter (27.3%) of officers have never been married.
* Includes annulled, widowed, and unknown cases. Note: The Navy only reports “Married” or “Never Married” for military members’ marital status. Note: Percentages may not total to 100 due to rounding. Source: DMDC Active Duty Military Personnel Master File (September 2016)
2.54 ■ Marital Status of Active Duty Members by Service Branch This table displays the marital status of Active Duty members by Service branch. In the Army, Navy, and Air Force, the greatest number of Active Duty members are married, whereas in the Marine Corps, the greatest number of members have never been married. The Service branch with the highest percentage of married members is the Army (57.0%).
Marital Status Army Navy Marine Corps Air Force Total DoD
N % N % N % N % N % Married 268,447 57.0% 166,023 51.9% 78,162 42.6% 176,426 56.2% 689,058 53.5% Never Married 177,987 37.8% 153,275 47.9% 99,658 54.3% 117,566 37.5% 548,486 42.6% Divorced 24,285 5.2% N/A* N/A* 5,554 3.0% 19,470 6.2% 49,309 3.8% Other** 552 0.1% 803 0.3% 127 0.1% 261 0.1% 1,743 0.1% Total 471,271 100.0% 320,101 100.0% 183,501 100.0% 313,723 100.0% 1,288,596 100.0%
** The Navy only reports “Married” or “Never Married” for military members’ marital status. ** Includes annulled, widowed, and unknown cases. Source: DMDC Active Duty Military Personnel Master File (September 2016)
Married (n=158,068)
69.2%Never Married
(n=62,441)27.3%
Divorced (n=7,731)
3.4%
Other* (n=214)
0.1%

Marital Status Active Duty Members
44 2016 Demographics Report
2.55 ■ Number and Percentage of Married Active Duty Members by Pay Grade and Service Branch
This table displays the number and percentage of military members who are married by pay grade and Service branch. For example, of the 210,359 junior enlisted members (E1-E4) in the Army, 71,439, or 34.0 percent, are married. The pay grade with the highest percentage of married members is O7-O10 (95.8%).
Service Branch E1-E4 E5-E6 E7-E9 W1-W5
N % N % N % N % Army 71,439 34.0% 91,142 76.6% 41,068 83.1% 12,335 84.6% Navy 36,017 29.0% 68,154 61.5% 25,427 83.6% 1,464 87.9% Marine Corps 24,710 22.6% 27,393 69.0% 11,812 86.9% 1,820 89.2% Air Force 37,382 30.7% 69,488 70.1% 26,957 84.3% N/A* N/A* Total DoD 169,548 30.0% 256,177 69.5% 105,264 83.9% 15,619 85.4%
Service Branch O1-O3 O4-O6 O7-O10 Total
N % N % N % N % Army 27,054 55.6% 25,099 86.9% 310 97.2% 268,447 57.0% Navy 16,901 52.6% 17,861 87.6% 199 95.7% 166,023 51.9% Marine Corps 6,568 54.0% 5,776 90.4% 83 96.5% 78,162 42.6% Air Force 19,563 56.1% 22,756 88.2% 280 94.3% 176,426 56.2% Total DoD 70,086 54.8% 71,492 87.8% 872 95.8% 689,058 53.5%
* The Air Force does not have warrant officers. Source: DMDC Active Duty Military Personnel Master File (September 2016)
2.56 ■ Number of Married Active Duty Members by Service Branch and Gender
This table presents the number of married Active Duty personnel by Service branch and gender. Of the 689,058 Active Duty military members who are married, 596,170 (86.5%) are male and 92,888 (13.5%) are female.
Gender Army Navy Marine Corps Air Force Total DoD Male 235,388 141,980 72,699 146,103 596,170 Female 33,059 24,043 5,463 30,323 92,888 Total 268,447 166,023 78,162 176,426 689,058
Source: DMDC Active Duty Military Personnel Master File (September 2016)

Active Duty Members Marital Status
2016 Demographics Report
45
2.57 ■ Percentage of Married Active Duty Members by Service Branch and Gender
This chart presents Active Duty members who are married as a percentage of the total number of Active Duty members of that Service branch and gender. Of the 204,628 females on Active Duty, 45.4 percent are married. Of the 1,083,968 males on Active Duty, 55.0 percent are married. Across all Service branches, a higher percentage of male members are married than female members.
Source: DMDC Active Duty Military Personnel Master File (September 2016)
58.5%
54.6%
43.1%
57.8%55.0%
47.9%
40.1%
36.8%
49.8%
45.4%
57.0%51.9%
42.6%
56.2%53.5%
0%
10%
20%
30%
40%
50%
60%
70%
Army Navy Marine Corps Air Force Total DoD
Male
Female
Total
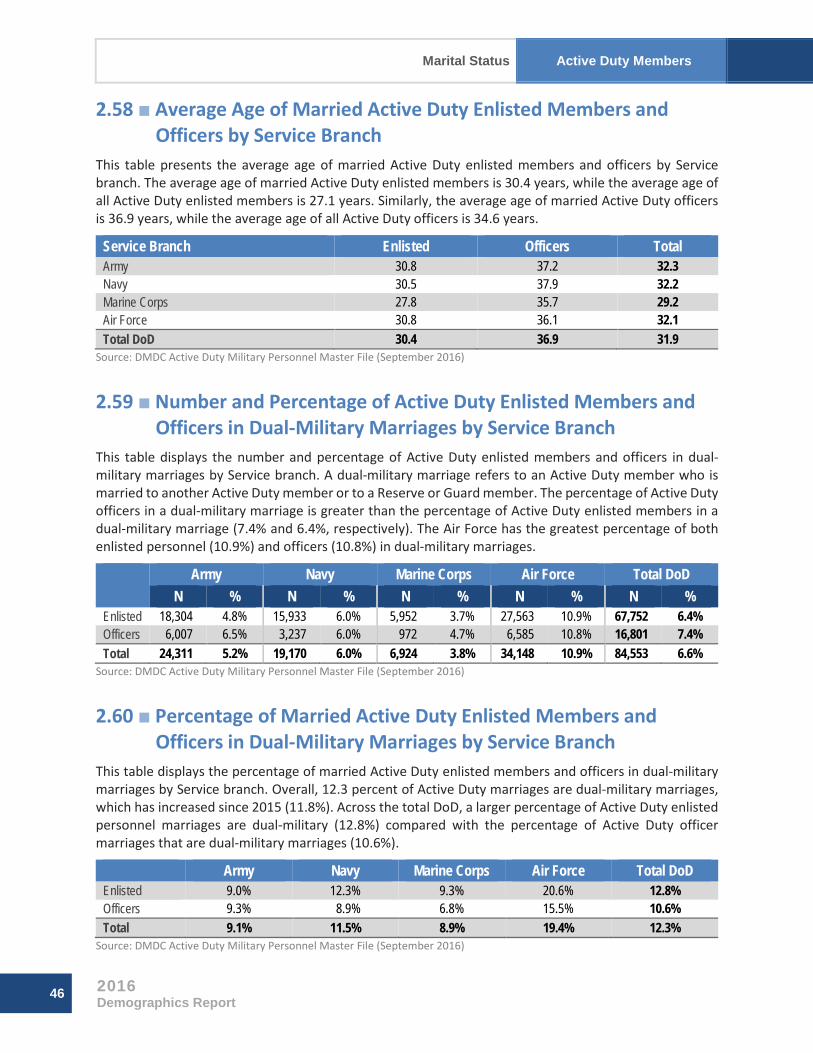
Marital Status Active Duty Members
46 2016 Demographics Report
2.58 ■ Average Age of Married Active Duty Enlisted Members and Officers by Service Branch
This table presents the average age of married Active Duty enlisted members and officers by Service branch. The average age of married Active Duty enlisted members is 30.4 years, while the average age of all Active Duty enlisted members is 27.1 years. Similarly, the average age of married Active Duty officers is 36.9 years, while the average age of all Active Duty officers is 34.6 years.
Service Branch Enlisted Officers Total Army 30.8 37.2 32.3 Navy 30.5 37.9 32.2 Marine Corps 27.8 35.7 29.2 Air Force 30.8 36.1 32.1 Total DoD 30.4 36.9 31.9
Source: DMDC Active Duty Military Personnel Master File (September 2016)
2.59 ■ Number and Percentage of Active Duty Enlisted Members and Officers in Dual-Military Marriages by Service Branch
This table displays the number and percentage of Active Duty enlisted members and officers in dual-military marriages by Service branch. A dual-military marriage refers to an Active Duty member who is married to another Active Duty member or to a Reserve or Guard member. The percentage of Active Duty officers in a dual-military marriage is greater than the percentage of Active Duty enlisted members in a dual-military marriage (7.4% and 6.4%, respectively). The Air Force has the greatest percentage of both enlisted personnel (10.9%) and officers (10.8%) in dual-military marriages.
Army Navy Marine Corps Air Force Total DoD N % N % N % N % N %
Enlisted 18,304 4.8% 15,933 6.0% 5,952 3.7% 27,563 10.9% 67,752 6.4% Officers 6,007 6.5% 3,237 6.0% 972 4.7% 6,585 10.8% 16,801 7.4% Total 24,311 5.2% 19,170 6.0% 6,924 3.8% 34,148 10.9% 84,553 6.6%
Source: DMDC Active Duty Military Personnel Master File (September 2016)
2.60 ■ Percentage of Married Active Duty Enlisted Members and Officers in Dual-Military Marriages by Service Branch
This table displays the percentage of married Active Duty enlisted members and officers in dual-military marriages by Service branch. Overall, 12.3 percent of Active Duty marriages are dual-military marriages, which has increased since 2015 (11.8%). Across the total DoD, a larger percentage of Active Duty enlisted personnel marriages are dual-military (12.8%) compared with the percentage of Active Duty officer marriages that are dual-military marriages (10.6%).
Army Navy Marine Corps Air Force Total DoD Enlisted 9.0% 12.3% 9.3% 20.6% 12.8% Officers 9.3% 8.9% 6.8% 15.5% 10.6% Total 9.1% 11.5% 8.9% 19.4% 12.3%
Source: DMDC Active Duty Military Personnel Master File (September 2016)

Active Duty Members Marital Status
2016 Demographics Report
47
2.61 ■ Active Duty Members in Dual-Military Marriages by Pay Grade (N=84,553)
This pie graph presents the distribution of Active Duty members in dual-military marriages by pay grade. In total, 80.1 percent of Active Duty dual-military marriages are among enlisted members, while 19.9 percent of Active Duty dual-military marriages are among officers.
Note: Percentages may not total to 100 due to rounding. Source: DMDC Active Duty Military Personnel Master File (September 2016)
2.62 ■ Percentage of Active Duty Members in Dual-Military Marriages by Service Branch and Gender (N=1,288,596)
This table presents the percentage of total Active Duty members in dual-military marriages by Service branch and gender. Of the 1,288,596 Active Duty members, 6.6 percent are in dual-military marriages. The Air Force has the highest percentage of military members in a dual-military marriage (10.9%). In all Service branches, a higher percentage of female military members are in dual-military marriages than males. In particular, over one-quarter of female Air Force members (26.9%) and more than one-fifth of female Marine Corps members (20.9%) are married to another military member.
Gender of Active Duty Member Army Navy Marine Corps Air Force Total DoD Male 3.0% 3.6% 2.3% 7.0% 4.0% Female 17.8% 16.6% 20.9% 26.9% 20.4% Total 5.2% 6.0% 3.8% 10.9% 6.6%
Source: DMDC Active Duty Military Personnel Master File (September 2016)
O1-O3 (n=9,769)
11.6%
O4-O6 (n=5,958)
7.0%O7-O10 (n=24)0.0%
W1-W5 (n=1,050)
1.2%
E1-E4 (n=25,431)
30.1%
E5-E6 (n=31,506)
37.3%
E7-E9 (n=10,815)
12.8%

Marital Status Active Duty Members
48 2016 Demographics Report
2.63 ■ Percentage of Married Active Duty Members in Dual-Military Marriages by Service Branch and Gender (N=689,053)
This table presents the percentage of married Active Duty members in dual-military marriages by Service branch and gender. Of the 689,053 Active Duty members who are married, 12.3 percent (84,553) are in dual-military marriages, which has increased since 2015 (11.8%). Over half of married female members in the Marine Corps (56.7%) and Air Force (54.0%) are in dual-military marriages.
Gender of Active Duty Member Army Navy Marine Corps Air Force Total DoD Male 5.1% 6.5% 5.3% 12.2% 7.2% Female 37.1% 41.3% 56.7% 54.0% 44.9% Total 9.1% 11.5% 8.9% 19.4% 12.3%
Source: DMDC Active Duty Military Personnel Master File (September 2016)
2.64 ■ Estimated Number and Percentage of Enlisted Member and Officer Divorces by Service Branch
This table presents the number of estimated divorces of enlisted members and officers by Service branch. The DoD collects information on marital status from year to year. The number of members who divorced in the past year is estimated by comparing the number of people who indicated that they were married in 2015, but no longer indicate a status of married in 2016. As such, the number of members divorced displayed is a count of the members who became divorced in 2016, not a count of all military members who are divorced. The percentages are calculated by taking the count and dividing it by the number of people that were married in 2015. Just over 3 percent (3.1%) of married Active Duty members divorced in 2016.
Service Branch
Enlisted Officers Total Married as of
Sept 2015 Divorced in
2016 Married as of
Sept 2015 Divorced in
2016 Married as of
Sept 2015 Divorced in
2016 N N % N N % N N %
Army 216,699 7,327 3.4% 66,747 1,212 1.8% 283,446 8,539 3.0% Navy 129,332 4,795 3.7% 36,736 567 1.5% 166,068 5,362 3.2% Marine Corps 65,928 2,261 3.4% 14,414 226 1.6% 80,342 2,487 3.1% Air Force 134,729 5,053 3.8% 42,648 602 1.4% 177,377 5,655 3.2% Total DoD 564,969 19,932 3.5% 166,722 2,666 1.6% 731,691 22,598 3.1%
Note: These figures include widowed cases. However, the number of people who were widowed between September 2015 and September 2016 is expected to be small and should not affect the reported percentages. Source: DMDC Active Duty Military Personnel Master File (September 2015, 2016)

Active Duty Members Marital Status
2016 Demographics Report
49
2.65 ■ Marriage Trends of Active Duty Members: 2000–2016 This graph presents the percentage of Active Duty members who were reported as married from 2000 to 2016. Although the percentage of married Active Duty members is 0.4 percent higher in 2016 than in 2000, this percentage has decreased 2.9 percent in the past six years. The percentages depicted in this graph are provided in Exhibit 2.66.
Note: Data are represented ONLY for the years indicated. Data for the years in between are NOT represented in this graph. Source: DMDC Active Duty Military Personnel Master File (September 2000, 2005, 2010, 2015, 2016)
2.66 ■ Percentage of Married Active Duty Enlisted Members and Officers Trends: 2000–2016
This table presents the percentage of married enlisted personnel and married officers from 2000 to 2016. The percentage of married enlisted members has been decreasing since its peak in 2010 at 53.7 percent to 50.1 percent in 2016. The percentage of married officers has been decreasing since 2000 from 70.4 percent in 2000 to 69.2 percent in 2016.
Year Enlisted Officers Total 2000 49.8% 70.4% 53.1% 2005 51.6% 70.1% 54.6% 2010 53.7% 69.9% 56.4% 2015 51.1% 69.6% 54.3% 2016 50.1% 69.2% 53.5%
Source: DMDC Active Duty Military Personnel Master File (September 2000, 2005, 2010, 2015, 2016)
0%
20%
40%
60%
80%
2000 2005 2010 2015 2016
Active Duty (+0.4%)

Marital Status Active Duty Members
50 2016 Demographics Report
2.67 ■ Percentage of Married Active Duty Members by Service Branch Trends: 2000–2016
This table presents the percentage of Active Duty members who were reported as married from 2000 to 2016 by Service branch. The Marine Corps consistently reports the lowest percentage of members who are married. From 2000 to 2010, the Air Force reported the highest percentage of military members who were married, but the Army has reported the highest percentage of married members in recent years.
Service Branch 2000 2005 2010 2015 2016 Army 53.3% 54.0% 58.7% 58.2% 57.0% Navy 48.4% 54.4% 54.3% 51.4% 51.9% Marine Corps 43.4% 44.9% 48.8% 43.8% 42.6% Air Force 62.0% 60.8% 59.2% 57.7% 56.2% Total DoD 53.1% 54.6% 56.4% 54.3% 53.5%
Source: DMDC Active Duty Military Personnel Master File (September 2000, 2005, 2010, 2015, 2016)
2.68 ■ Marriage Trends by Service Branch: 2000–2016 This graph presents the percentage of Active Duty members who were reported as married by Service branch from 2000 to 2016. The percentage of married Active Duty members in all Service branches has decreased since 2010. The percentages depicted in this graph are provided in Exhibit 2.67.
Note: Data are represented ONLY for the years indicated. Data for the years in between are NOT represented in this graph. DMDC Active Duty Military Personnel Master File (September 2000, 2005, 2010, 2015, 2016)
0%
10%
20%
30%
40%
50%
60%
70%
2000 2005 2010 2015 2016
Army (+4.9%) Navy (+3.0%) Marine Corps (+0.4%) Air Force (-4.3%)
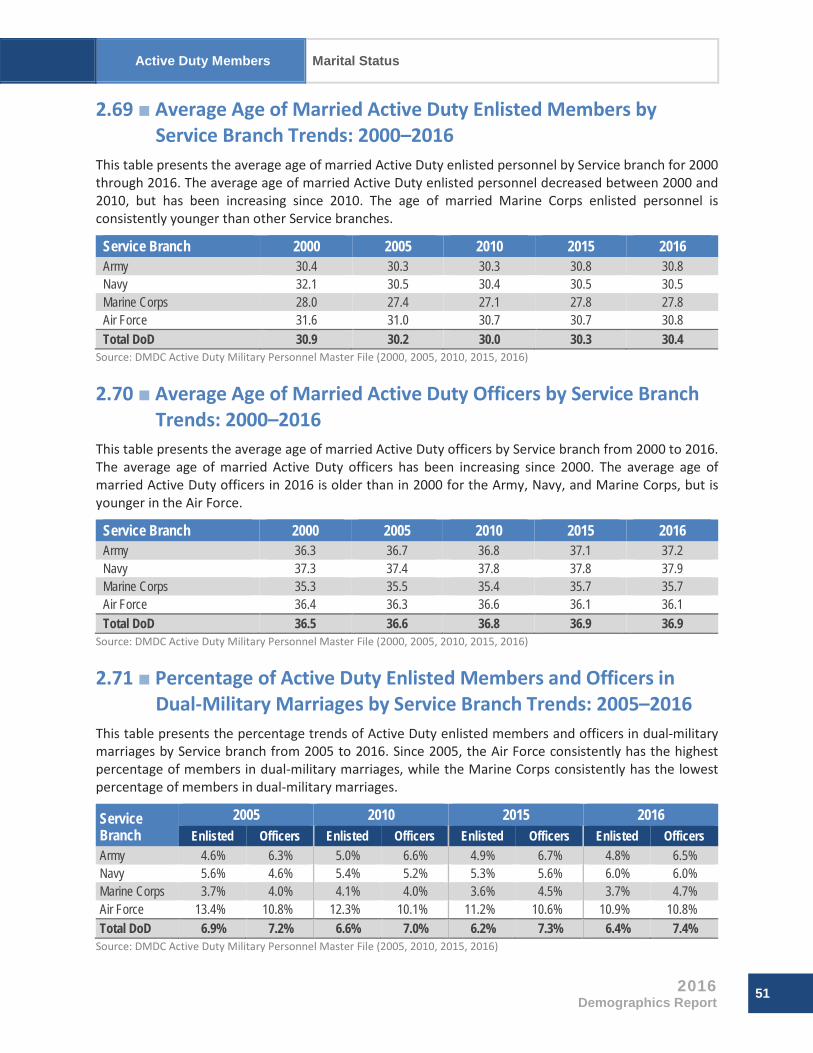
Active Duty Members Marital Status
2016 Demographics Report
51
2.69 ■ Average Age of Married Active Duty Enlisted Members by Service Branch Trends: 2000–2016
This table presents the average age of married Active Duty enlisted personnel by Service branch for 2000 through 2016. The average age of married Active Duty enlisted personnel decreased between 2000 and 2010, but has been increasing since 2010. The age of married Marine Corps enlisted personnel is consistently younger than other Service branches.
Service Branch 2000 2005 2010 2015 2016 Army 30.4 30.3 30.3 30.8 30.8 Navy 32.1 30.5 30.4 30.5 30.5 Marine Corps 28.0 27.4 27.1 27.8 27.8 Air Force 31.6 31.0 30.7 30.7 30.8 Total DoD 30.9 30.2 30.0 30.3 30.4
Source: DMDC Active Duty Military Personnel Master File (2000, 2005, 2010, 2015, 2016)
2.70 ■ Average Age of Married Active Duty Officers by Service Branch Trends: 2000–2016
This table presents the average age of married Active Duty officers by Service branch from 2000 to 2016. The average age of married Active Duty officers has been increasing since 2000. The average age of married Active Duty officers in 2016 is older than in 2000 for the Army, Navy, and Marine Corps, but is younger in the Air Force.
Service Branch 2000 2005 2010 2015 2016 Army 36.3 36.7 36.8 37.1 37.2 Navy 37.3 37.4 37.8 37.8 37.9 Marine Corps 35.3 35.5 35.4 35.7 35.7 Air Force 36.4 36.3 36.6 36.1 36.1 Total DoD 36.5 36.6 36.8 36.9 36.9
Source: DMDC Active Duty Military Personnel Master File (2000, 2005, 2010, 2015, 2016)
2.71 ■ Percentage of Active Duty Enlisted Members and Officers in Dual-Military Marriages by Service Branch Trends: 2005–2016
This table presents the percentage trends of Active Duty enlisted members and officers in dual-military marriages by Service branch from 2005 to 2016. Since 2005, the Air Force consistently has the highest percentage of members in dual-military marriages, while the Marine Corps consistently has the lowest percentage of members in dual-military marriages.
Service Branch
2005 2010 2015 2016 Enlisted Officers Enlisted Officers Enlisted Officers Enlisted Officers
Army 4.6% 6.3% 5.0% 6.6% 4.9% 6.7% 4.8% 6.5% Navy 5.6% 4.6% 5.4% 5.2% 5.3% 5.6% 6.0% 6.0% Marine Corps 3.7% 4.0% 4.1% 4.0% 3.6% 4.5% 3.7% 4.7% Air Force 13.4% 10.8% 12.3% 10.1% 11.2% 10.6% 10.9% 10.8% Total DoD 6.9% 7.2% 6.6% 7.0% 6.2% 7.3% 6.4% 7.4%
Source: DMDC Active Duty Military Personnel Master File (2005, 2010, 2015, 2016)

Marital Status Active Duty Members
52 2016 Demographics Report
2.72 ■ Estimated Percentage of Divorces Among Active Duty Enlisted Members and Officers by Service Branch Trends: 2000–2016
This table presents the estimated percentage of members who divorced each year for Active Duty enlisted members and officers by Service branch from 2000 to 2016. Across the total DoD, the estimated percentage of members who divorced in 2016 is higher compared to 2000 for both enlisted members and officers, but the percentages have declined in the past year.
Service Branch
2000 2005 2010 2015 2016 Enlisted Officers Enlisted Officers Enlisted Officers Enlisted Officers Enlisted Officers
Army 2.3% 1.7% 3.6% 3.4% 3.4% 2.2% 4.0% 2.5% 3.4% 1.8% Navy 2.6% 1.1% 3.2% 3.4% 3.4% 1.7% 4.0% 2.0% 3.7% 1.5% Marine Corps 3.3% 1.6% 3.2% 2.8% 2.8% 1.7% 3.9% 1.8% 3.4% 1.6% Air Force 3.6% 1.3% 3.7% 3.7% 3.7% 1.6% 4.6% 1.7% 3.8% 1.4% Total DoD 2.9% 1.4% 3.5% 3.4% 3.4% 1.9% 4.1% 2.1% 3.5% 1.6%
Note: These figures include widowed cases. However, the number of people who were widowed is expected to be small and should not affect the reported percentages. Source: DMDC Active Duty Military Personnel Master File (2000, 2005, 2010, 2015, 2016)
2.73 ■ Estimated Percentage of Divorces by Service Branch Trends: 2000–2016
This graph presents the estimated percentage of married Active Duty members who divorced during Fiscal Years 2000, 2005, 2010, 2015, and 2016. Active Duty member divorces are higher in 2016 than in 2000 for all Service branches, but have been declining in the past 6 years.
Note: Data are represented ONLY for the years indicated. Data for the years in between are NOT represented in this graph. Note: These figures include widowed cases. However, the number of people who were widowed is expected to be small and should not affect the reported percentages. Source: DMDC Active Duty Military Personnel Master File (2000, 2005, 2010, 2015, 2016)
0.0%
1.0%
2.0%
3.0%
4.0%
5.0%
2000 2005 2010 2015 2016
Army (+3.0%) Navy (+3.2%) Marine Corps (+3.1%) Air Force (+3.2%)
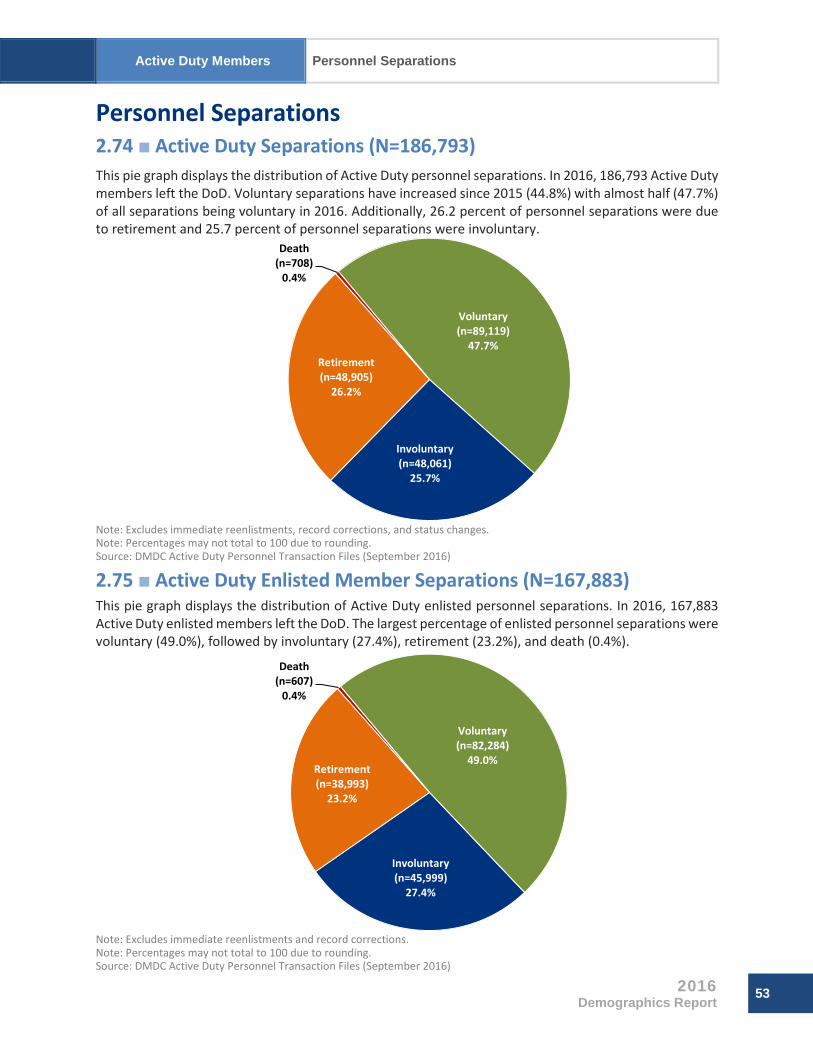
Active Duty Members Personnel Separations
2016 Demographics Report
53
Voluntary (n=89,119)
47.7%
Involuntary (n=48,061)
25.7%
Retirement (n=48,905)
26.2%
Death (n=708)
0.4%
Personnel Separations 2.74 ■ Active Duty Separations (N=186,793) This pie graph displays the distribution of Active Duty personnel separations. In 2016, 186,793 Active Duty members left the DoD. Voluntary separations have increased since 2015 (44.8%) with almost half (47.7%) of all separations being voluntary in 2016. Additionally, 26.2 percent of personnel separations were due to retirement and 25.7 percent of personnel separations were involuntary.
Note: Excludes immediate reenlistments, record corrections, and status changes. Note: Percentages may not total to 100 due to rounding. Source: DMDC Active Duty Personnel Transaction Files (September 2016)
2.75 ■ Active Duty Enlisted Member Separations (N=167,883) This pie graph displays the distribution of Active Duty enlisted personnel separations. In 2016, 167,883 Active Duty enlisted members left the DoD. The largest percentage of enlisted personnel separations were voluntary (49.0%), followed by involuntary (27.4%), retirement (23.2%), and death (0.4%).
Note: Excludes immediate reenlistments and record corrections. Note: Percentages may not total to 100 due to rounding. Source: DMDC Active Duty Personnel Transaction Files (September 2016)
Voluntary (n=82,284)
49.0%
Involuntary (n=45,999)
27.4%
Retirement (n=38,993)
23.2%
Death (n=607)
0.4%
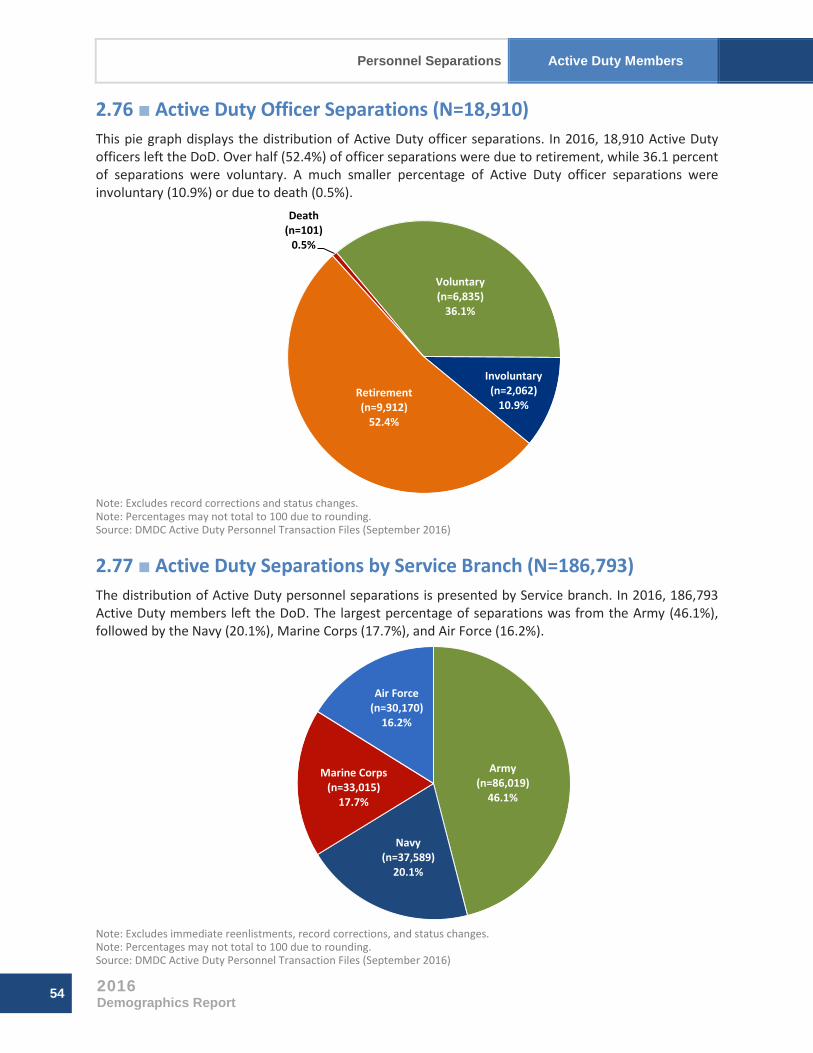
Personnel Separations Active Duty Members
54 2016 Demographics Report
2.76 ■ Active Duty Officer Separations (N=18,910) This pie graph displays the distribution of Active Duty officer separations. In 2016, 18,910 Active Duty officers left the DoD. Over half (52.4%) of officer separations were due to retirement, while 36.1 percent of separations were voluntary. A much smaller percentage of Active Duty officer separations were involuntary (10.9%) or due to death (0.5%).
Note: Excludes record corrections and status changes. Note: Percentages may not total to 100 due to rounding. Source: DMDC Active Duty Personnel Transaction Files (September 2016)
2.77 ■ Active Duty Separations by Service Branch (N=186,793) The distribution of Active Duty personnel separations is presented by Service branch. In 2016, 186,793 Active Duty members left the DoD. The largest percentage of separations was from the Army (46.1%), followed by the Navy (20.1%), Marine Corps (17.7%), and Air Force (16.2%).
Note: Excludes immediate reenlistments, record corrections, and status changes. Note: Percentages may not total to 100 due to rounding. Source: DMDC Active Duty Personnel Transaction Files (September 2016)
Army (n=86,019)
46.1%
Navy (n=37,589)
20.1%
Marine Corps (n=33,015)
17.7%
Air Force (n=30,170)
16.2%
Voluntary (n=6,835)
36.1%
Involuntary (n=2,062)
10.9%Retirement (n=9,912)
52.4%
Death (n=101)
0.5%

Active Duty Members Personnel Separations
2016 Demographics Report
55
2.78 ■ Number of Active Duty Enlisted Member and Officer Separations by Service Branch and Major Category of Separation
This table presents the number of Active Duty separations by Service branch and major category of separation for both enlisted personnel and officers. A total of 167,883 enlisted members and 18,910 officers separated from Active Duty in 2016. The most common category of separation for enlisted members was voluntary separation, while the most common category of separation for officers was retirement.
Category of Separation
Army (N=86,019)
Navy (N=37,589)
Marine Corps (N=33,015)
Air Force (N=30,170)
Total DoD (N=186,793)
Enlisted Officers Enlisted Officers Enlisted Officers Enlisted Officers Enlisted Officers Involuntary 22,662 1,114 10,525 524 6,312 222 6,500 202 45,999 2,062 Voluntary 33,297 3,072 16,981 1,367 20,601 689 11,405 1,707 82,284 6,835 Retirement* 20,618 4,932 5,946 2,095 4,221 869 8,208 2,016 38,993 9,912 Death 271 53 134 17 90 11 112 20 607 101 Total 76,848 9,171 33,586 4,003 31,224 1,791 26,225 3,945 167,883 18,910 * Includes disability and non-disability retirements. Note: Excludes immediate reenlistments for enlisted members, status changes for officers, and record corrections for enlisted members and officers. Source: DMDC Active Duty Personnel Transaction Files (September 2016)
2.79 ■ Number of Active Duty Enlisted Member and Officer Separations by Service Branch and Type of Separation
This table presents the number of Active Duty separations by specific type of separation for enlisted personnel and officers in each Service branch. In every service branch, voluntary separations, including expiration of term of service (ETS) and early release, were the most common type of separations for enlisted members, while non-disability retirement was the most common type of separation for officers.
Type of Separation Army Navy Marine Corps Air Force Total DoD
Enlisted Officers Enlisted Officers Enlisted Officers Enlisted Officers Enlisted Officers ETS/Voluntary/ Early Release 28,572 3,069 15,480 1,357 19,550 689 9,496 1,687 73,098 6,802
Personal/Family 2,584 3 769 10 108 0 505 20 3,966 33 Medical/Disability 13,505 950 1,431 78 1,905 50 2,947 238 19,788 1,316 Military Requirement/ Behavior/Performance 17,263 345 5,367 69 3,720 56 4,462 52 30,812 522
Death 271 53 134 17 90 11 112 20 607 101 Other Military Service 2,141 N/A* 732 N/A* 943 N/A* 1,404 N/A* 5,220 N/A* Legal Issues/ Standards of Conduct 5,248 23 3,026 6 2,367 5 1,349 28 11,990 62
Non-Selection for Promotion N/A* 674 N/A* 264 N/A* 161 N/A* 112 N/A* 1,211 Non-Disability Retirement 7,113 3,982 4,515 2,017 2,316 819 5,261 1,778 19,205 8,596
Other 151 72 2,132 185 225 0 689 10 3,197 267 Subtotal 76,848 9,171 33,586 4,003 31,224 1,791 26,225 3,945 167,883 18,910 Total 86,019 37,589 33,015 30,170 186,793
* Other Military Service separations are not applicable for officers, and Non-Selection for Promotion separations are not applicable for enlisted members.
Note: Excludes immediate reenlistments for enlisted members, status changes for officers, and record corrections for enlisted members and officers. Source: DMDC Active Duty Personnel Transaction Files (September 2016)

Personnel Separations Active Duty Members
56 2016 Demographics Report
0
20,000
40,000
60,000
80,000
100,000
120,000
140,000
160,000
180,000
2000 2005 2010 2015 2016
Army (-46.4%) Navy (-59.1%) Marines (-28.8%) Air Force (-61.5%)
2.80 ■ Number of Retired Active Duty Enlisted Members and Officers by Service Branch and Type of Retirement
This table presents the number of retirements among Active Duty enlisted members and officers by Service branch and retirement type. As of 2016, the total number of personnel retired from Active Duty service is 1,581,046. Of the Service branches, the Air Force has the largest number of retired personnel (541,414), followed by the Army (515,646), the Navy (406,299), and the Marine Corps (117,687).
Type of Retirement Army Navy Marine Corps Air Force Total DoD
Enlisted Officers Enlisted Officers Enlisted Officers Enlisted Officers Enlisted Officers Non-disability 303,676 102,429 293,583 78,219 64,845 25,592 396,092 110,173 1,058,196 316,413 Permanent disability 96,788 5,746 29,017 2,426 23,236 1,249 30,843 2,890 179,884 12,311 Temporary disability 6,477 530 2,875 179 2,691 74 1,316 100 13,359 883 Subtotal 406,941 108,705 325,475 80,824 90,772 26,915 428,251 113,163 1,251,439 329,607 Total 515,646 406,299 117,687 541,414 1,581,046
Source: Official Guard and Reserve Manpower Strengths & Statistics FY 2016 Summary
2.81 ■ Active Duty Separations by Service Branch Trends: 2000–2016 This graph presents the number of Active Duty separations by Service branch from 2000 to 2016. The total number of Active Duty separations decreased from 2000 to 2010 but increased in the last six years for the Army and Navy. The Marine Corps and Air Force have seen a decrease from 2015 to 2016 in separations.
Note: Data are represented ONLY for the years indicated. Data for the years in between are NOT represented in this graph. Note: Excludes immediate reenlistments for enlisted members, status changes for officers, and record corrections for enlisted members and officers. Source: DMDC Active Duty Personnel Transaction Files (September 2000, 2005, 2010, 2015, 2016)

57
SECTION 3
Reserve and Guard Members This section contains numeric data on the Reserve and Guard population, including the DoD Reserve and Guard components as well as the DHS Coast Guard Reserve. All Reserve and Guard manpower is assigned to one of three Reserve component categories: the Ready Reserve, the Standby Reserve, and the Retired Reserve. The first few exhibits in this section present information on Ready Reserve personnel. The Ready Reserve comprises the Selected Reserve, the Individual Ready Reserve, and the Inactive National Guard. Because Selected Reserve members train throughout the year and participate annually in Active Duty training exercises, the rest of the exhibits in this section focus on the Selected Reserve. The specific characteristics of the Selected Reserve components addressed in this section include gender, race/ethnicity, geographic location, age, education level, marital status, and retirements and losses.

58
This page is intentionally blank.

Reserve and Guard Members Ready Reserve Personnel
2016 Demographics Report
59
Ready Reserve Enlisted
(n=923,957)85.1%
Ready Reserve Officers
(n=161,152)14.9%
Ready Reserve Personnel 3.01 ■ Ready Reserve Enlisted Members and Officers (N=1,085,109) The distribution of enlisted personnel and officers of the Ready Reserve is depicted in this pie chart. The Ready Reserve is a major source of manpower and includes the Selected Reserve, the Individual Ready Reserve (IRR), and the Inactive National Guard (ING). IRR and ING members typically have served as Active Duty or Selected Reserve members in the past, but do not currently participate in organized training. Selected Reserve members train throughout the year and participate annually in Active Duty training exercises. Across all components of the Ready Reserve, there are 923,957 total enlisted members and 161,152 total officers.
Note: Percentages may not total to 100 due to rounding. Source: Official Guard & Reserve Manpower Strengths and Statistics FY 2016 Summary
3.02 ■ Number of Ready Reserve Enlisted Members and Officers by Ready Reserve Program and Reserve Component
This table presents the total number of Ready Reserve members in the Selected Reserve or Individual Ready Reserve. Of the 1,085,109 members of the Ready Reserve, 818,305 are members of the Selected Reserve and 266,804 are members of the IRR and ING.
Reserve Component Selected Reserve IRR and ING* Total Ready Reserve
Enlisted Officers Total Enlisted Officers Total Enlisted Officers Total Army National Guard 296,061 45,528 341,589 3,211 62 3,273 299,272 45,590 344,862 Army Reserve 161,048 37,347 198,395 97,765 10,112 107,877 258,813 47,459 306,272 Navy Reserve 43,683 14,297 57,980 42,136 8,748 50,884 85,819 23,045 108,864 Marine Corps Reserve 34,199 4,318 38,517 64,836 3,228 68,064 99,035 7,546 106,581 Air National Guard 90,655 15,232 105,887 N/A** N/A** N/A** 90,655 15,232 105,887 Air Force Reserve 55,451 13,913 69,364 28,052 7,104 35,156 83,503 21,017 104,520 Total DoD 681,097 130,635 811,732 236,000 29,254 265,254 917,097 159,889 1,076,986 Coast Guard Reserve 5,463 1,110 6,573 1,397 153 1,550 6,860 1,263 8,123 Total 686,560 131,745 818,305 237,397 29,407 266,804 923,957 161,152 1,085,109
** The Army National Guard is the only Reserve Component with ING members. ** The Air National Guard does not have IRR or ING members. Source: Official Guard & Reserve Manpower Strengths and Statistics FY 2016 Summary

Ready Reserve Personnel Reserve and Guard Members
60 2016 Demographics Report
3.03 ■ Ready Reserve Members by Reserve Component (N=1,085,109) This pie chart presents the distribution of Ready Reserve personnel by Reserve component. Of the 1,085,109 members of the Ready Reserve, the largest proportion are serving in the Army National Guard (31.8%), followed by the Army Reserve (28.2%), the Navy Reserve (10.0%), the Marine Corps Reserve and Air National Guard (9.8% each), Air Force Reserve (9.6%), and Coast Guard Reserve (0.7%).
Note: Percentages may not total to 100 due to rounding. Source: Official Guard & Reserve Manpower Strengths and Statistics FY 2016 Summary
3.04 ■ Selected Reserve Enlisted Members and Officers (N=818,305) The number and percentage of total Selected Reserve members that are enlisted personnel and officers are depicted below. Of the 818,305 members of the Selected Reserve, 83.9 percent are enlisted members and 16.1 percent are officers.
Note: Percentages may not total to 100 due to rounding. Source: DMDC Reserve Components Common Personnel Data System (September 2016)
Army National Guard
(n=344,862)31.8%
Army Reserve (n=306,272)
28.2%
Navy Reserve (n=108,864)
10.0%
Marine Corps Reserve
(n=106,581)9.8%
Air National Guard
(n=105,887)9.8%
Air Force Reserve (n=104,520)
9.6%
Coast Guard Reserve
(n=8,123)0.7%
Enlisted (n=686,560)
83.9%
Officers (n=131,745)
16.1%

Reserve and Guard Members Ready Reserve Personnel
2016 Demographics Report
61
3.05 ■ Number and Ratio of Selected Reserve Enlisted Members to Officers by Reserve Component
This table depicts the number and ratio of Selected Reserve enlisted personnel and officers by Reserve component. The ratio of enlisted members to officers varies across Reserve components, with the Marine Corps Reserve having the highest ratio of enlisted members to officers (i.e., 7.9 enlisted members for every officer), and the Navy Reserve having the lowest ratio of enlisted members to officers (i.e., 3.1 enlisted members for every officer). Overall, there are 5.2 enlisted members for every officer across all Reserve components.
Reserve Component Enlisted Officers Total Ratio of Officers
to Enlisted Army National Guard 296,061 45,528 341,589 6.5 to 1 Army Reserve 161,048 37,347 198,395 4.3 to 1 Navy Reserve 43,683 14,297 57,980 3.1 to 1 Marine Corps Reserve 34,199 4,318 38,517 7.9 to 1 Air National Guard 90,655 15,232 105,887 6.0 to 1 Air Force Reserve 55,451 13,913 69,364 4.0 to 1 Total DoD 681,097 130,635 811,732 5.2 to 1 Coast Guard Reserve 5,463 1,110 6,573 4.9 to 1 Total Sel Res 686,560 131,745 818,305 5.2 to 1
Source: DMDC Reserve Components Common Personnel Data System (September 2016)
3.06 ■ Selected Reserve Personnel by Reserve Component (N=818,305) This pie chart presents the distribution of Selected Reserve personnel by Reserve component. Of the 818,305 members of the Selected Reserve, the largest proportion are serving in the Army National Guard (41.7%), followed by the Army Reserve (24.2%), Air National Guard (12.9%), Air Force Reserve (8.5%), Navy Reserve (7.1%), Marine Corps Reserve (4.7%), and the Coast Guard Reserve (0.8%).
Note: Percentages may not total to 100 due to rounding. Source: DMDC Reserve Components Common Personnel Data System (September 2016)
Army National Guard
(n=341,589)41.7%
Army Reserve (n=198,395)
24.2%Navy Reserve (n=57,980)
7.1%
Marine Corps Reserve
(n=38,517)4.7%
Air National Guard
(n=105,887)12.9%
Air Force Reserve (n=69,364)
8.5%
Coast Guard Reserve
(n=6,573)0.8%
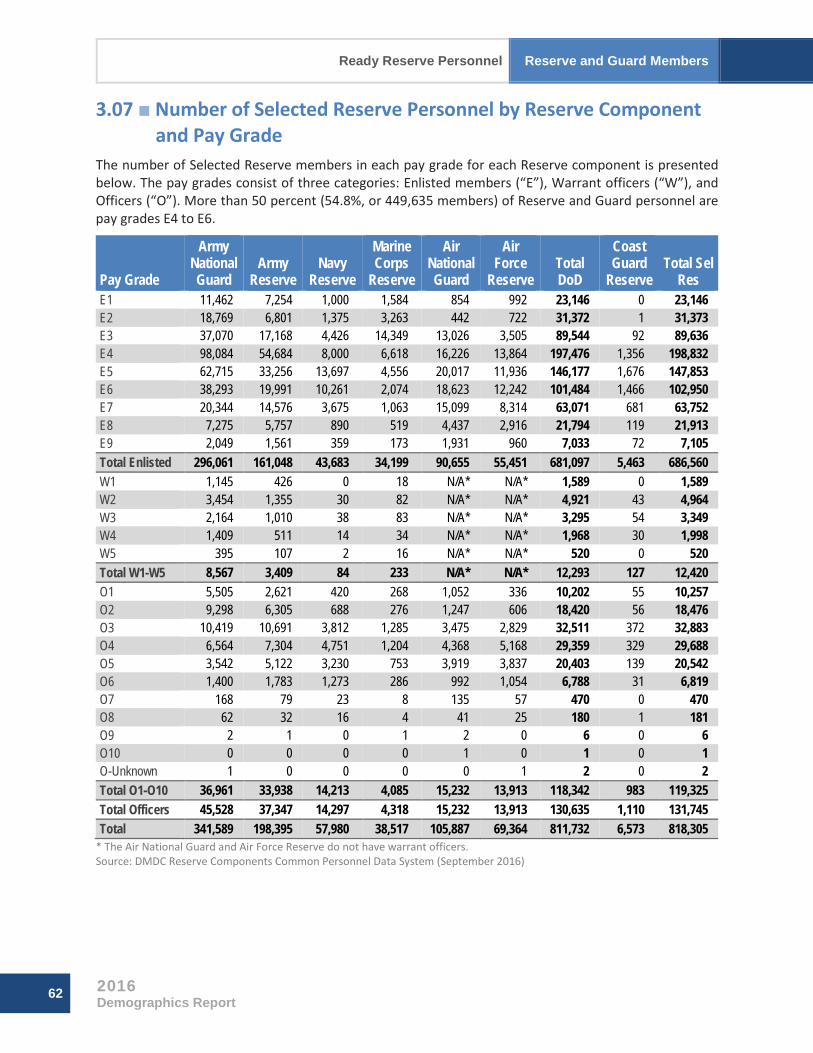
Ready Reserve Personnel Reserve and Guard Members
62 2016 Demographics Report
3.07 ■ Number of Selected Reserve Personnel by Reserve Component and Pay Grade
The number of Selected Reserve members in each pay grade for each Reserve component is presented below. The pay grades consist of three categories: Enlisted members (“E”), Warrant officers (“W”), and Officers (“O”). More than 50 percent (54.8%, or 449,635 members) of Reserve and Guard personnel are pay grades E4 to E6.
Pay Grade
Army National Guard
Army Reserve
Navy Reserve
Marine Corps
Reserve
Air National Guard
Air Force
Reserve Total DoD
Coast Guard
Reserve Total Sel
Res E1 11,462 7,254 1,000 1,584 854 992 23,146 0 23,146 E2 18,769 6,801 1,375 3,263 442 722 31,372 1 31,373 E3 37,070 17,168 4,426 14,349 13,026 3,505 89,544 92 89,636 E4 98,084 54,684 8,000 6,618 16,226 13,864 197,476 1,356 198,832 E5 62,715 33,256 13,697 4,556 20,017 11,936 146,177 1,676 147,853 E6 38,293 19,991 10,261 2,074 18,623 12,242 101,484 1,466 102,950 E7 20,344 14,576 3,675 1,063 15,099 8,314 63,071 681 63,752 E8 7,275 5,757 890 519 4,437 2,916 21,794 119 21,913 E9 2,049 1,561 359 173 1,931 960 7,033 72 7,105 Total Enlisted 296,061 161,048 43,683 34,199 90,655 55,451 681,097 5,463 686,560 W1 1,145 426 0 18 N/A* N/A* 1,589 0 1,589 W2 3,454 1,355 30 82 N/A* N/A* 4,921 43 4,964 W3 2,164 1,010 38 83 N/A* N/A* 3,295 54 3,349 W4 1,409 511 14 34 N/A* N/A* 1,968 30 1,998 W5 395 107 2 16 N/A* N/A* 520 0 520 Total W1-W5 8,567 3,409 84 233 N/A* N/A* 12,293 127 12,420 O1 5,505 2,621 420 268 1,052 336 10,202 55 10,257 O2 9,298 6,305 688 276 1,247 606 18,420 56 18,476 O3 10,419 10,691 3,812 1,285 3,475 2,829 32,511 372 32,883 O4 6,564 7,304 4,751 1,204 4,368 5,168 29,359 329 29,688 O5 3,542 5,122 3,230 753 3,919 3,837 20,403 139 20,542 O6 1,400 1,783 1,273 286 992 1,054 6,788 31 6,819 O7 168 79 23 8 135 57 470 0 470 O8 62 32 16 4 41 25 180 1 181 O9 2 1 0 1 2 0 6 0 6 O10 0 0 0 0 1 0 1 0 1 O-Unknown 1 0 0 0 0 1 2 0 2 Total O1-O10 36,961 33,938 14,213 4,085 15,232 13,913 118,342 983 119,325 Total Officers 45,528 37,347 14,297 4,318 15,232 13,913 130,635 1,110 131,745 Total 341,589 198,395 57,980 38,517 105,887 69,364 811,732 6,573 818,305
* The Air National Guard and Air Force Reserve do not have warrant officers. Source: DMDC Reserve Components Common Personnel Data System (September 2016)

Reserve and Guard Members Ready Reserve Personnel
2016 Demographics Report
63
3.08 ■ Percentage of Selected Reserve Personnel by Reserve Component and Pay Grade
The percentage of Selected Reserve members in each pay grade, relative to the total number of Selected Reserve members for that Reserve component, is presented below. The pay grades consist of three categories: Enlisted members (“E”), Warrant officers (“W”), and Officers (“O”). The Navy Reserve has a higher percentage of personnel who are officers (24.5%) than other Reserve components.
Pay Grade
Army National Guard
Army Reserve
Navy Reserve
Marine Corps
Reserve
Air National Guard
Air Force
Reserve Total DoD
Coast Guard
Reserve Total Sel
Res E1 3.4% 3.7% 1.7% 4.1% 0.8% 1.4% 2.9% 0.0% 2.8% E2 5.5% 3.4% 2.4% 8.5% 0.4% 1.0% 3.9% 0.0% 3.8% E3 10.9% 8.7% 7.6% 37.3% 12.3% 5.1% 11.0% 1.4% 11.0% E4 28.7% 27.6% 13.8% 17.2% 15.3% 20.0% 24.3% 20.6% 24.3% E5 18.4% 16.8% 23.6% 11.8% 18.9% 17.2% 18.0% 25.5% 18.1% E6 11.2% 10.1% 17.7% 5.4% 17.6% 17.6% 12.5% 22.3% 12.6% E7 6.0% 7.3% 6.3% 2.8% 14.3% 12.0% 7.8% 10.4% 7.8% E8 2.1% 2.9% 1.5% 1.3% 4.2% 4.2% 2.7% 1.8% 2.7% E9 0.6% 0.8% 0.6% 0.4% 1.8% 1.4% 0.9% 1.1% 0.9% Total Enlisted 86.7% 81.2% 75.3% 88.8% 85.6% 79.9% 83.9% 83.1% 83.9% W1 0.3% 0.2% 0.0% 0.0% N/A* N/A* 0.2% 0.0% 0.2% W2 1.0% 0.7% 0.1% 0.2% N/A* N/A* 0.6% 0.7% 0.6% W3 0.6% 0.5% 0.1% 0.2% N/A* N/A* 0.4% 0.8% 0.4% W4 0.4% 0.3% 0.0% 0.1% N/A* N/A* 0.2% 0.5% 0.2% W5 0.1% 0.1% 0.0% 0.0% N/A* N/A* 0.1% 0.0% 0.1% Total W1-W5 2.5% 1.7% 0.1% 0.6% N/A* N/A* 1.5% 1.9% 1.5% O1 1.6% 1.3% 0.7% 0.7% 1.0% 0.5% 1.3% 0.8% 1.3% O2 2.7% 3.2% 1.2% 0.7% 1.2% 0.9% 2.3% 0.9% 2.3% O3 3.1% 5.4% 6.6% 3.3% 3.3% 4.1% 4.0% 5.7% 4.0% O4 1.9% 3.7% 8.2% 3.1% 4.1% 7.5% 3.6% 5.0% 3.6% O5 1.0% 2.6% 5.6% 2.0% 3.7% 5.5% 2.5% 2.1% 2.5% O6 0.4% 0.9% 2.2% 0.7% 0.9% 1.5% 0.8% 0.5% 0.8% O7 0.0% 0.0% 0.0% 0.0% 0.1% 0.1% 0.1% 0.0% 0.1% O8 0.0% 0.0% 0.0% 0.0% 0.0% 0.0% 0.0% 0.0% 0.0% O9 0.0% 0.0% 0.0% 0.0% 0.0% 0.0% 0.0% 0.0% 0.0% O10 0.0% 0.0% 0.0% 0.0% 0.0% 0.0% 0.0% 0.0% 0.0% O-Unknown 0.0% 0.0% 0.0% 0.0% 0.0% 0.0% 0.0% 0.0% 0.0% Total O1-O10 10.8% 17.1% 24.5% 10.6% 14.4% 20.1% 14.6% 15.0% 14.6% Total Officers 13.3% 18.8% 24.7% 11.2% 14.4% 20.1% 16.1% 16.9% 16.1% Total 100.0% 100.0% 100.0% 100.0% 100.0% 100.0% 100.0% 100.0% 100.0%
* The Air National Guard and Air Force Reserve do not have warrant officers. Note: Percentages may not total to 100 due to rounding. Source: DMDC Reserve Components Common Personnel Data System (September 2016)

Ready Reserve Personnel Reserve and Guard Members
64 2016 Demographics Report
3.09 ■ Number of Selected Reserve Enlisted Member and Officer Trends: 2000–2016
The trend numbers of Selected Reserve enlisted members and officers for 2000 through 2016 are presented below. Overall, the number of Selected Reserve enlisted members has decreased 7.2 percent since 2000 (a decrease of 53,292 enlisted members) and the number of Selected Reserve officers has decreased by 1.2 percent since 2000 (a decrease of 1,610 officers).
2000 2005 2010 2015 2016 Enlisted 739,852 703,477 730,148 694,977 686,560 Officers 133,355 125,528 127,113 131,129 131,745 Total 873,207 829,005 857,261 826,106 818,305
Source: DMDC Reserve Components Common Personnel Data System (September 2000, 2005, 2010, 2015, 2016)
3.10 ■ Ratio of Selected Reserve Enlisted Members to Officers by Reserve Component Trends: 2000–2016
This exhibit shows the trends of Selected Reserve enlisted member to officer ratios from 2000 through 2016. The number of enlisted members for each officer has been decreasing over the last 6 years in the Selected Reserve from 5.7 enlisted members to every officer in 2010 to 5.2 enlisted members for every officer in 2016.
Ratio of Enlisted Members to Officers 2000 2005 2010 2015 2016
Army National Guard 8.4 to 1 8.1 to 1 7.6 to 1 6.7 to 1 6.5 to 1 Army Reserve 3.9 to 1 4.1 to 1 4.6 to 1 4.4 to 1 4.3 to 1 Navy Reserve 3.6 to 1 3.5 to 1 3.5 to 1 3.0 to 1 3.1 to 1 Marine Corps Reserve 9.0 to 1 10.7 to 1 9.3 to 1 8.3 to 1 7.9 to 1 Air National Guard 7.0 to 1 6.8 to 1 6.5 to 1 6.0 to 1 6.0 to 1 Air Force Reserve 3.3 to 1 3.5 to 1 3.8 to 1 3.9 to 1 4.0 to 1 Total DoD 5.5 to 1 5.6 to 1 5.8 to 1 5.3 to 1 5.2 to 1 Coast Guard Reserve 5.6 to 1 5.3 to 1 4.9 to 1 5.0 to 1 4.9 to 1 Total Sel Res 5.5 to 1 5.6 to 1 5.7 to 1 5.3 to 1 5.2 to 1
Source: DMDC Reserve Components Common Personnel Data System (September 2000, 2005, 2010, 2015, 2016)

Reserve and Guard Members Ready Reserve Personnel
2016 Demographics Report
65
3.11 ■ Number of Selected Reserve Personnel by Reserve Component Trends: 2000–2016
The trend numbers of Selected Reserve members by Reserve component are presented from 2000 to 2016. Since 2015, the number of members in the Navy Reserve, Air National Guard, and Air Force Reserve has increased whereas the total number of members in the other four components (Army National Guard, Army Reserve, Marine Corps Reserve, and Coast Guard Reserve) has decreased.
2000 2005 2010 2015 2016 Army National Guard 353,045 333,177 362,015 350,023 341,589 Army Reserve 206,892 189,005 205,281 198,552 198,395 Navy Reserve 86,933 76,466 65,006 57,359 57,980 Marine Corps Reserve 39,667 39,938 39,222 38,906 38,517 Air National Guard 106,365 106,430 107,676 105,728 105,887 Air Force Reserve 72,340 75,802 70,119 68,494 69,364 Total DoD 865,242 820,818 849,319 819,062 811,732 Coast Guard Reserve 7,965 8,187 7,942 7,044 6,573 Total Sel Res 873,207 829,005 857,261 826,106 818,305
Source: DMDC Reserve Components Common Personnel Data System (September 2000, 2005, 2010, 2015, 2016)
3.12 ■ Selected Reserve Members by Reserve Component Trends: 2000–2016
This graph presents the number of DoD and DHS Selected Reserve personnel by Reserve component from 2000 to 2016. The percentage reported in the legend for each line represents the percentage difference in the number of Selected Reserve personnel in 2016 compared to 2000. The Navy Reserve has had the largest percentage decrease across all of the Reserve components (-33.3%, a decrease of 28,953 personnel), while the Air National Guard has had the smallest percentage decrease in members compared to 2000 (-0.4%, a decrease of 478 personnel). The values depicted in this graph are provided in Exhibit 3.11.
Note: Data are represented ONLY for the years indicated. Data for the years in between are NOT represented in this graph. Source: DMDC Reserve Components Common Personnel Data System (September 2000, 2005, 2010, 2015, 2016)
0
50,000
100,000
150,000
200,000
250,000
300,000
350,000
400,000
2000 2005 2010 2015 2016
Army National Guard (-3.2%) Army Reserve (-4.1%) Navy Reserve (-33.3%)Marine Corps Reserve (-2.9%) Air National Guard (-0.4%) Air Force Reserve (-4.1%)Coast Guard Reserve (-17.5%)

Gender Reserve and Guard Members
66 2016 Demographics Report
Female (n=132,815)
19.3%
Male (n=553,745)
80.7%
Gender
3.13 ■ Gender of Selected Reserve Members (N=818,305) The gender of all Selected Reserve personnel is depicted below. The Selected Reserve has 158,173 (19.3%) female members and 660,132 (80.7%) male members.
Note: Percentages may not total to 100 due to rounding. Source: DMDC Reserve Components Common Personnel Data System (September 2016)
3.14 ■ Gender of Selected Reserve Enlisted Members (N=686,560) The gender of Selected Reserve enlisted personnel is depicted below. Of the 686,560 Selected Reserve enlisted personnel, 132,815 (19.3%) are female and 553,745 (80.7%) are male.
Note: Percentages may not total to 100 due to rounding. Source: DMDC Reserve Components Common Personnel Data System (September 2016)
Female (n=158,173)
19.3%
Male (n=660,132)
80.7%

Reserve and Guard Members Gender
2016 Demographics Report
67
Female (n=25,358)
19.2%
Male (n=106,387)
80.8%
3.15 ■ Gender of Selected Reserve Officers (N=131,745) The gender of Selected Reserve officers is depicted below. Of the 131,745 Selected Reserve officers, 25,358 (19.2%) are female and 106,387 (80.8%) are male.
Source: DMDC Reserve Components Common Personnel Data System (September 2016)
3.16 ■ Number and Ratio of Selected Reserve Enlisted Members and Officers by Gender and Reserve Component
This table presents the number and ratio of Selected Reserve enlisted personnel and officers by gender for each of the Reserve components. The Marine Corps Reserve has the highest ratio of male enlisted members to male officers, with 8.2 enlisted members for every officer, while the Army National Guard has the highest ratio of female enlisted members to female officers, with 8.1 enlisted members for every officer. Overall, the Selected Reserve has the same ratio of enlisted members to officers for both genders (5.2 male enlisted members for every male officer, and 5.2 female enlisted members for every female officer).
Reserve Component Enlisted Officers Total
Ratio of Enlisted to Officers
Male Female Male Female Male Female Male Female Army National Guard 245,826 50,235 39,324 6,204 285,150 56,439 6.3 to 1 8.1 to 1 Army Reserve 124,353 36,695 28,126 9,221 152,479 45,916 4.4 to 1 4.0 to 1 Navy Reserve 33,250 10,433 11,623 2,674 44,873 13,107 2.9 to 1 3.9 to 1 Marine Corps Reserve 32,957 1,242 3,995 323 36,952 1,565 8.2 to 1 3.8 to 1 Air National Guard 72,129 18,526 12,373 2,859 84,502 21,385 5.8 to 1 6.5 to 1 Air Force Reserve 40,633 14,818 10,087 3,826 50,720 18,644 4.0 to 1 3.9 to 1 Subtotal DoD 549,148 131,949 105,528 25,107 654,676 157,056 5.2 to 1 5.3 to 1 Coast Guard Reserve 4,597 866 859 251 5,456 1,117 5.4 to 1 3.5 to 1 Subtotal Sel Res 553,745 132,815 106,387 25,358 660,132 158,173 5.2 to 1 5.2 to 1 Total Sel Res 686,560 131,745 818,305 5.2 to 1
Source: DMDC Reserve Components Common Personnel Data System (September 2016)

Gender Reserve and Guard Members
68 2016 Demographics Report
3.17 ■ Percentage of Enlisted Members and Officers in the Selected Reserve by Gender and Reserve Component
This chart presents the percentage of Selected Reserve enlisted members, officers, and total Selected Reserve members by Reserve component and gender. Overall, 80.7 percent of Selected Reserve members are men, and 19.3 percent of Selected Reserve members are women. The Air Force Reserve has the largest percentage of women at 26.9 percent, while the Marine Corps Reserve has the smallest percentage of women at 4.1 percent.
Female Enlisted Female Officer Female Total Male Enlisted Male Officer Male Total
Note: Percentages may not total to 100 due to rounding. Source: DMDC Reserve Components Common Personnel Data System (September 2016)
83.0% 86.4% 83.5%77.2% 75.3% 76.9% 76.1% 81.3% 77.4%
96.4% 92.5% 95.9%
79.6% 81.2% 79.8%
17.0% 13.6% 16.5%22.8% 24.7% 23.1% 23.9% 18.7% 22.6%
3.6% 7.5% 4.1%
20.4% 18.8% 20.2%
0%
20%
40%
60%
80%
100%
Army National Guard
Air National Guard
Army Reserve
Navy Reserve
Marine Corps Reserve
73.3% 72.5% 73.1%80.6% 80.8% 80.7% 84.1%
77.4% 83.0% 80.7% 80.8% 80.7%
26.7% 27.5% 26.9%19.4% 19.2% 19.3% 15.9%
22.6% 17.0% 19.3% 19.2% 19.3%
0%
20%
40%
60%
80%
100%
Coast Guard Reserve
Air Force Reserve
Total DoD Total Sel Res

Reserve and Guard Members Gender
2016 Demographics Report
69
3.18 ■ Number of Male and Female Selected Reserve Members by Pay Grade and Reserve Component
The number of males and females by pay grade is presented for each component of the Selected Reserve. The Army National Guard is the largest Reserve component with the highest number of both men (285,150) and women (56,439). The Coast Guard Reserve is the smallest component with the lowest number of both men (5,456) and women (1,117).
Reserve Component E1-E4 E5-E6 E7-E9 W1-W5
Male Female Male Female Male Female Male Female Army National Guard 133,015 32,370 86,316 14,692 26,495 3,173 7,714 853 Army Reserve 65,084 20,823 42,114 11,133 17,155 4,739 2,864 545 Navy Reserve 11,047 3,754 18,343 5,615 3,860 1,064 77 7 Marine Corps Reserve 25,098 716 6,200 430 1,659 96 220 13 Air National Guard 23,104 7,444 31,444 7,196 17,581 3,886 N/A* N/A* Air Force Reserve 13,212 5,871 18,274 5,904 9,147 3,043 N/A* N/A* Subtotal DoD 270,560 70,978 202,691 44,970 75,897 16,001 10,875 1,418 Coast Guard Reserve 1,225 224 2,629 513 743 129 111 16 Subtotal Sel Res 271,785 71,202 205,320 45,483 76,640 16,130 10,986 1,434 Total Sel Res 342,987 250,803 92,770 12,420
Reserve Component O1-O3 O4-O6 O7-O10 Total
Male Female Male Female Male Female Male Female Army National Guard 21,288 3,935 10,108 1,398 214 18 285,150 56,439 Army Reserve 13,946 5,671 11,223 2,986 93 19 152,479 45,916 Navy Reserve 3,734 1,186 7,780 1,474 32 7 44,873 13,107 Marine Corps Reserve 1,716 113 2,047 196 12 1 36,952 1,565 Air National Guard 4,408 1,366 7,802 1,477 163 16 84,502 21,385 Air Force Reserve 2,518 1,254 7,500 2,559 69 13 50,720 18,644 Subtotal DoD 47,610 13,525 46,460 10,090 583 74 654,676 157,056 Coast Guard Reserve 369 114 378 121 1 0 5,456 1,117 Subtotal Sel Res 47,979 13,639 46,838 10,211 584 74 660,132 158,173 Total Sel Res 61,618 57,049 658 818,305
* The Air National Guard and the Air Force Reserve do not have warrant officers. Source: DMDC Reserve Components Common Personnel Data System (September 2016)

Gender Reserve and Guard Members
70 2016 Demographics Report
3.19 ■ Number of Selected Reserve Male and Female Enlisted Members by Reserve Component Trends: 2000–2016
This table presents trends in the number of Selected Reserve enlisted members by gender from 2000 to 2016 for each of the Reserve components. The number of female Selected Reserve enlisted members has been increasing since 2005, while the number of male Selected Reserve enlisted members has been decreasing since 2010.
Year
Army National Guard Army Reserve Navy Reserve
Marine Corps Reserve
Air National Guard
Male Female Male Female Male Female Male Female Male Female 2000 279,183 36,461 123,806 41,222 54,216 13,783 34,055 1,644 77,131 15,888 2005 257,787 38,836 116,991 35,079 46,564 12,907 34,842 1,697 75,943 16,815 2010 273,475 46,367 129,577 39,140 40,145 10,573 33,810 1,613 75,949 17,338 2015 253,590 50,727 125,378 36,585 32,902 10,012 33,411 1,295 72,565 18,079 2016 245,826 50,235 124,353 36,695 33,250 10,433 32,957 1,242 72,129 18,526
Year Air Force Reserve Total DoD Coast Guard Reserve Total Sel Res Male Female Male Female Male Female Male Female
2000 44,035 11,641 612,426 120,639 5,833 928 618,259 121,567 2005 45,526 13,600 577,653 118,934 5,914 975 583,567 119,909 2010 41,655 13,904 594,611 128,935 5,616 982 600,227 129,917 2015 40,176 14,381 558,022 131,079 4,942 932 562,964 132,011 2016 40,633 14,818 549,148 131,949 4,597 866 553,745 132,815
Note: Excludes cases where gender was not reported. Source: DMDC Reserve Components Common Personnel Data System (September 2000, 2005, 2010, 2015, 2016)

Reserve and Guard Members Gender
2016 Demographics Report
71
3.20 ■ Number of Selected Reserve Male and Female Officers by Reserve Component Trends: 2000–2016
The table below presents the trends for Selected Reserve officers’ gender from 2000 through 2016 by Reserve component. The number of female Selected Reserve officers has been increasing since 2005. The number of male officers has decreased from 2000 overall, but has been increasing since 2005.
Year
Army National Guard Army Reserve Navy Reserve
Marine Corps Reserve
Air National Guard
Male Female Male Female Male Female Male Female Male Female 2000 33,965 3,435 31,689 10,147 15,711 3,222 3,731 237 11,361 1,985 2005 32,630 3,924 28,175 8,760 14,182 2,813 3,201 198 11,484 2,188 2010 36,958 5,211 27,672 8,892 11,942 2,346 3,540 259 11,901 2,488 2015 39,579 6,126 27,588 9,001 11,726 2,719 3,899 301 12,232 2,852 2016 39,324 6,204 28,126 9,221 11,623 2,674 3,995 323 12,373 2,859
Year Air Force Reserve Total DoD Coast Guard Reserve Total Sel Res Male Female Male Female Male Female Male Female
2000 12,575 4,089 109,032 23,115 1,023 181 110,055 23,296 2005 12,405 4,271 102,077 22,154 1,068 229 103,145 22,383 2010 10,872 3,688 102,885 22,884 1,074 270 103,959 23,154 2015 10,152 3,785 105,176 24,784 909 257 106,085 25,041 2016 10,087 3,826 105,528 25,107 859 251 106,387 25,358
Note: Excludes cases where gender was not reported. Source: DMDC Reserve Components Common Personnel Data System (September 2000, 2005, 2010, 2015, 2016)

Gender Reserve and Guard Members
72 2016 Demographics Report
3.21 ■ Percentage of Selected Reserve Male and Female Enlisted Members by Reserve Component Trends: 2000–2016
This table displays trends in the distribution of Selected Reserve enlisted personnel by gender for 2000 through 2016. Compared to 2000, the percentage of enlisted personnel in 2016 who are female increased in most Reserve components, including the Army National Guard, Navy Reserve, Air National Guard, Air Force Reserve, and Coast Guard Reserve, with the greatest percentage increase seen in the Air Force Reserve (+5.8%). The Army Reserve and the Marine Corps Reserve saw a decrease in female enlisted personnel, with the greatest percentage decrease in the Army Reserve (-2.2%).
Year
Army National Guard Army Reserve Navy Reserve
Marine Corps Reserve
Air National Guard
Male Female Male Female Male Female Male Female Male Female 2000 88.4% 11.6% 75.0% 25.0% 79.7% 20.3% 95.4% 4.6% 82.9% 17.1% 2005 86.9% 13.1% 76.9% 23.1% 78.3% 21.7% 95.4% 4.6% 81.9% 18.1% 2010 85.5% 14.5% 76.8% 23.2% 79.2% 20.8% 95.4% 4.6% 81.4% 18.6% 2015 83.3% 16.7% 77.4% 22.6% 76.7% 23.3% 96.3% 3.7% 80.1% 19.9% 2016 83.0% 17.0% 77.2% 22.8% 76.1% 23.9% 96.4% 3.6% 79.6% 20.4%
Year Air Force Reserve Total DoD Coast Guard Reserve Total Sel Res Male Female Male Female Male Female Male Female
2000 79.1% 20.9% 83.5% 16.5% 86.3% 13.7% 83.6% 16.4% 2005 77.0% 23.0% 82.9% 17.1% 85.8% 14.2% 83.0% 17.0% 2010 75.0% 25.0% 82.2% 17.8% 85.1% 14.9% 82.2% 17.8% 2015 73.6% 26.4% 81.0% 19.0% 84.1% 15.9% 81.0% 19.0% 2016 73.3% 26.7% 80.6% 19.4% 84.1% 15.9% 80.7% 19.3%
Note: Percentages may not total to 100 due to rounding. Source: DMDC Reserve Components Common Personnel Data System (September 2000, 2005, 2010, 2015, 2016)

Reserve and Guard Members Gender
2016 Demographics Report
73
3.22 ■ Percentage of Selected Reserve Male and Female Officers by Reserve Component Trends: 2000–2016
This table displays trends in the distribution of Selected Reserve officers by gender for 2000 through 2016. The percentage of Selected Reserve officers who are female has been increasing since 2000. The Coast Guard Reserve had the highest increase in female Selected Reserve officers since 2000 (+7.6%).
Year
Army National Guard Army Reserve Navy Reserve
Marine Corps Reserve
Air National Guard
Male Female Male Female Male Female Male Female Male Female 2000 90.8% 9.2% 75.7% 24.3% 83.0% 17.0% 94.0% 6.0% 85.1% 14.9% 2005 89.3% 10.7% 76.3% 23.7% 83.4% 16.6% 94.2% 5.8% 84.0% 16.0% 2010 87.6% 12.4% 75.7% 24.3% 83.6% 16.4% 93.2% 6.8% 82.7% 17.3% 2015 86.6% 13.4% 75.4% 24.6% 81.2% 18.8% 92.8% 7.2% 81.1% 18.9% 2016 86.4% 13.6% 75.3% 24.7% 81.3% 18.7% 92.5% 7.5% 81.2% 18.8%
Year Air Force Reserve Total DoD Coast Guard Reserve Total Sel Res Male Female Male Female Male Female Male Female
2000 75.5% 24.5% 82.5% 17.5% 85.0% 15.0% 82.5% 17.5% 2005 74.4% 25.6% 82.2% 17.8% 82.3% 17.7% 82.2% 17.8% 2010 74.7% 25.3% 81.8% 18.2% 79.9% 20.1% 81.8% 18.2% 2015 72.8% 27.2% 80.9% 19.1% 78.0% 22.0% 80.9% 19.1% 2016 72.5% 27.5% 80.8% 19.2% 77.4% 22.6% 80.8% 19.2%
Note: Percentages may not total to 100 due to rounding. Source: DMDC Reserve Components Common Personnel Data System (September 2000, 2005, 2010, 2015, 2016)

Race/Ethnicity Reserve and Guard Members
74 2016 Demographics Report
Race/Ethnicity
3.23 ■ Race of Selected Reserve Members (N=818,305) This pie chart presents the race of Selected Reserve members. Members who report themselves as White represent the largest proportion of Selected Reserve members (73.9%), while Black or African American members represent 16.5 percent. Members who are Asian make up 4.1 percent, members who are Multi-racial make up 1.5 percent, and members who report themselves as American Indian or Alaska Native and Native Hawaiian or Other Pacific Islander each make up less than one percent of the Selected Reserve.
* The Army Reserve does not report “Multi-racial.” Note: Percentages may not total to 100 due to rounding. Source: DMDC Reserve Components Common Personnel Data System (September 2016)
American Indian or
Alaska Native (n=6,499)
0.8%Asian
(n=33,211)4.1%
Black or African American
(n=134,913)16.5%
Native Hawaiian or Other Pacific
Islander (n=5,457)
0.7%
White (n=604,641)
73.9%
Multi-racial* (n=12,277)
1.5%
Other/Unknown (n=21,307)
2.6%

Reserve and Guard Members Race/Ethnicity
2016 Demographics Report
75
3.24 ■ Race of Selected Reserve Enlisted Members (N=686,560) This pie chart presents the race of Selected Reserve enlisted members. Members who report themselves as White represent the largest proportion of Selected Reserve enlisted members (72.8%), while Black or African American members represent 17.8 percent. Members who are Asian make up 4.0 percent, members who are Multi-racial make up 1.5 percent, and members who report themselves as American Indian or Alaska Native and Native Hawaiian or Other Pacific Islander each make up less than one percent of Selected Reserve enlisted members.
* The Army Reserve does not report “Multi-racial.” Note: Percentages may not total to 100 due to rounding. Source: DMDC Reserve Components Common Personnel Data System (September 2016)
American Indian or
Alaska Native (n=5,812)
0.8%Asian
(n=27,791)4.0%
Black or African American
(n=122,127)17.8%
Native Hawaiian or Other Pacific
Islander (n=4,888)
0.7%
White (n=499,608)
72.8%
Multi-racial* (n=10,476)
1.5%
Other/Unknown (n=15,858)
2.3%
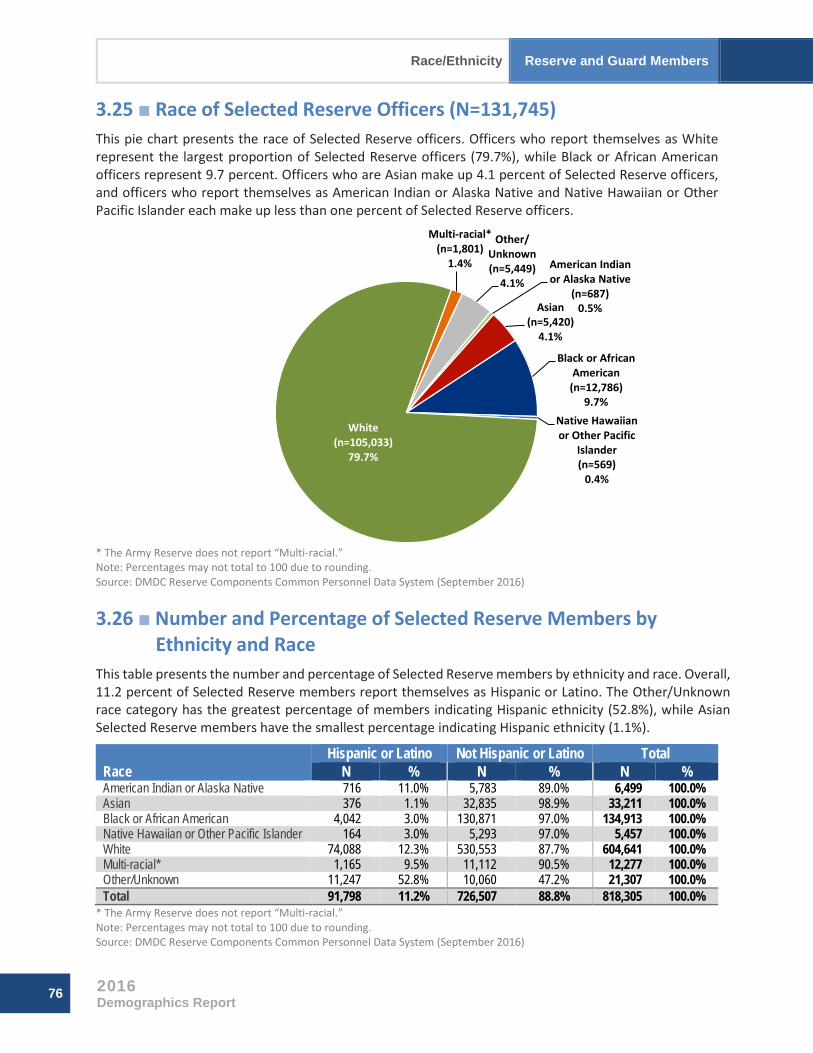
Race/Ethnicity Reserve and Guard Members
76 2016 Demographics Report
3.25 ■ Race of Selected Reserve Officers (N=131,745) This pie chart presents the race of Selected Reserve officers. Officers who report themselves as White represent the largest proportion of Selected Reserve officers (79.7%), while Black or African American officers represent 9.7 percent. Officers who are Asian make up 4.1 percent of Selected Reserve officers, and officers who report themselves as American Indian or Alaska Native and Native Hawaiian or Other Pacific Islander each make up less than one percent of Selected Reserve officers.
* The Army Reserve does not report “Multi-racial.” Note: Percentages may not total to 100 due to rounding. Source: DMDC Reserve Components Common Personnel Data System (September 2016)
3.26 ■ Number and Percentage of Selected Reserve Members by Ethnicity and Race
This table presents the number and percentage of Selected Reserve members by ethnicity and race. Overall, 11.2 percent of Selected Reserve members report themselves as Hispanic or Latino. The Other/Unknown race category has the greatest percentage of members indicating Hispanic ethnicity (52.8%), while Asian Selected Reserve members have the smallest percentage indicating Hispanic ethnicity (1.1%).
Race Hispanic or Latino Not Hispanic or Latino Total
N % N % N % American Indian or Alaska Native 716 11.0% 5,783 89.0% 6,499 100.0% Asian 376 1.1% 32,835 98.9% 33,211 100.0% Black or African American 4,042 3.0% 130,871 97.0% 134,913 100.0% Native Hawaiian or Other Pacific Islander 164 3.0% 5,293 97.0% 5,457 100.0% White 74,088 12.3% 530,553 87.7% 604,641 100.0% Multi-racial* 1,165 9.5% 11,112 90.5% 12,277 100.0% Other/Unknown 11,247 52.8% 10,060 47.2% 21,307 100.0% Total 91,798 11.2% 726,507 88.8% 818,305 100.0%
* The Army Reserve does not report “Multi-racial.” Note: Percentages may not total to 100 due to rounding. Source: DMDC Reserve Components Common Personnel Data System (September 2016)
American Indian or Alaska Native
(n=687)0.5%Asian
(n=5,420)4.1%
Black or African American
(n=12,786)9.7%
Native Hawaiian or Other Pacific
Islander (n=569)
0.4%
White (n=105,033)
79.7%
Multi-racial* (n=1,801)
1.4%
Other/Unknown (n=5,449)
4.1%
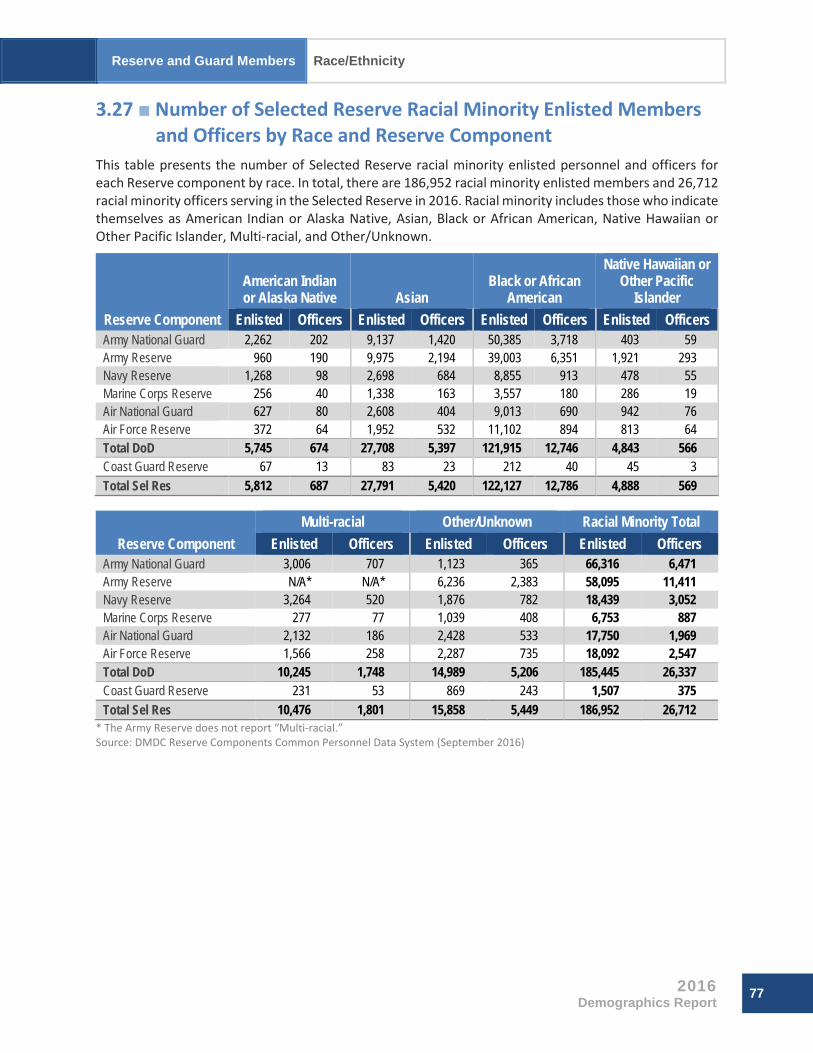
Reserve and Guard Members Race/Ethnicity
2016 Demographics Report
77
3.27 ■ Number of Selected Reserve Racial Minority Enlisted Members and Officers by Race and Reserve Component
This table presents the number of Selected Reserve racial minority enlisted personnel and officers for each Reserve component by race. In total, there are 186,952 racial minority enlisted members and 26,712 racial minority officers serving in the Selected Reserve in 2016. Racial minority includes those who indicate themselves as American Indian or Alaska Native, Asian, Black or African American, Native Hawaiian or Other Pacific Islander, Multi-racial, and Other/Unknown.
Reserve Component
American Indian or Alaska Native Asian
Black or African American
Native Hawaiian or Other Pacific
Islander Enlisted Officers Enlisted Officers Enlisted Officers Enlisted Officers
Army National Guard 2,262 202 9,137 1,420 50,385 3,718 403 59 Army Reserve 960 190 9,975 2,194 39,003 6,351 1,921 293 Navy Reserve 1,268 98 2,698 684 8,855 913 478 55 Marine Corps Reserve 256 40 1,338 163 3,557 180 286 19 Air National Guard 627 80 2,608 404 9,013 690 942 76 Air Force Reserve 372 64 1,952 532 11,102 894 813 64 Total DoD 5,745 674 27,708 5,397 121,915 12,746 4,843 566 Coast Guard Reserve 67 13 83 23 212 40 45 3 Total Sel Res 5,812 687 27,791 5,420 122,127 12,786 4,888 569
Reserve Component Multi-racial Other/Unknown Racial Minority Total
Enlisted Officers Enlisted Officers Enlisted Officers Army National Guard 3,006 707 1,123 365 66,316 6,471 Army Reserve N/A* N/A* 6,236 2,383 58,095 11,411 Navy Reserve 3,264 520 1,876 782 18,439 3,052 Marine Corps Reserve 277 77 1,039 408 6,753 887 Air National Guard 2,132 186 2,428 533 17,750 1,969 Air Force Reserve 1,566 258 2,287 735 18,092 2,547 Total DoD 10,245 1,748 14,989 5,206 185,445 26,337 Coast Guard Reserve 231 53 869 243 1,507 375 Total Sel Res 10,476 1,801 15,858 5,449 186,952 26,712
* The Army Reserve does not report “Multi-racial.” Source: DMDC Reserve Components Common Personnel Data System (September 2016)

Race/Ethnicity Reserve and Guard Members
78 2016 Demographics Report
3.28 ■ Percentage of Racial Minority Enlisted Members and Officers by Race and Reserve Component
This table presents the percentage of racial minority enlisted members and officers in each Reserve component in relation to the total number of enlisted members and officers for each Reserve component. The Navy Reserve has the highest percentage of racial minority enlisted personnel (42.2%), followed by the Army Reserve (36.1%), while the Coast Guard Reserve has the highest percentage of racial minority officers (33.8%), followed by the Army Reserve (30.6%).
Reserve Component
American Indian or Alaska Native Asian
Black or African American
Native Hawaiian or Other Pacific
Islander Enlisted Officers Enlisted Officers Enlisted Officers Enlisted Officers
Army National Guard 0.8% 0.4% 3.1% 3.1% 17.0% 8.2% 0.1% 0.1% Army Reserve 0.6% 0.5% 6.2% 5.9% 24.2% 17.0% 1.2% 0.8% Navy Reserve 2.9% 0.7% 6.2% 4.8% 20.3% 6.4% 1.1% 0.4% Marine Corps Reserve 0.7% 0.9% 3.9% 3.8% 10.4% 4.2% 0.8% 0.4% Air National Guard 0.7% 0.5% 2.9% 2.7% 9.9% 4.5% 1.0% 0.5% Air Force Reserve 0.7% 0.5% 3.5% 3.8% 20.0% 6.4% 1.5% 0.5% Total DoD 0.8% 0.5% 4.1% 4.1% 17.9% 9.8% 0.7% 0.4% Coast Guard Reserve 1.2% 1.2% 1.5% 2.1% 3.9% 3.6% 0.8% 0.3% Total Sel Res 0.8% 0.5% 4.0% 4.1% 17.8% 9.7% 0.7% 0.4%
Reserve Component Multi-racial Other/Unknown Racial Minority Total
Enlisted Officers Enlisted Officers Enlisted Officers Army National Guard 1.0% 1.6% 0.4% 0.8% 22.4% 14.2% Army Reserve N/A* N/A* 3.9% 6.4% 36.1% 30.6% Navy Reserve 7.5% 3.6% 4.3% 5.5% 42.2% 21.3% Marine Corps Reserve 0.8% 1.8% 3.0% 9.4% 19.7% 20.5% Air National Guard 2.4% 1.2% 2.7% 3.5% 19.6% 12.9% Air Force Reserve 2.8% 1.9% 4.1% 5.3% 32.6% 18.3% Total DoD 1.5% 1.3% 2.2% 4.0% 27.2% 20.2% Coast Guard Reserve 4.2% 4.8% 15.9% 21.9% 27.6% 33.8% Total Sel Res 1.5% 1.4% 2.3% 4.1% 27.2% 20.3%
* The Army Reserve does not report “Multi-racial.” Source: DMDC Reserve Components Common Personnel Data System (September 2016)
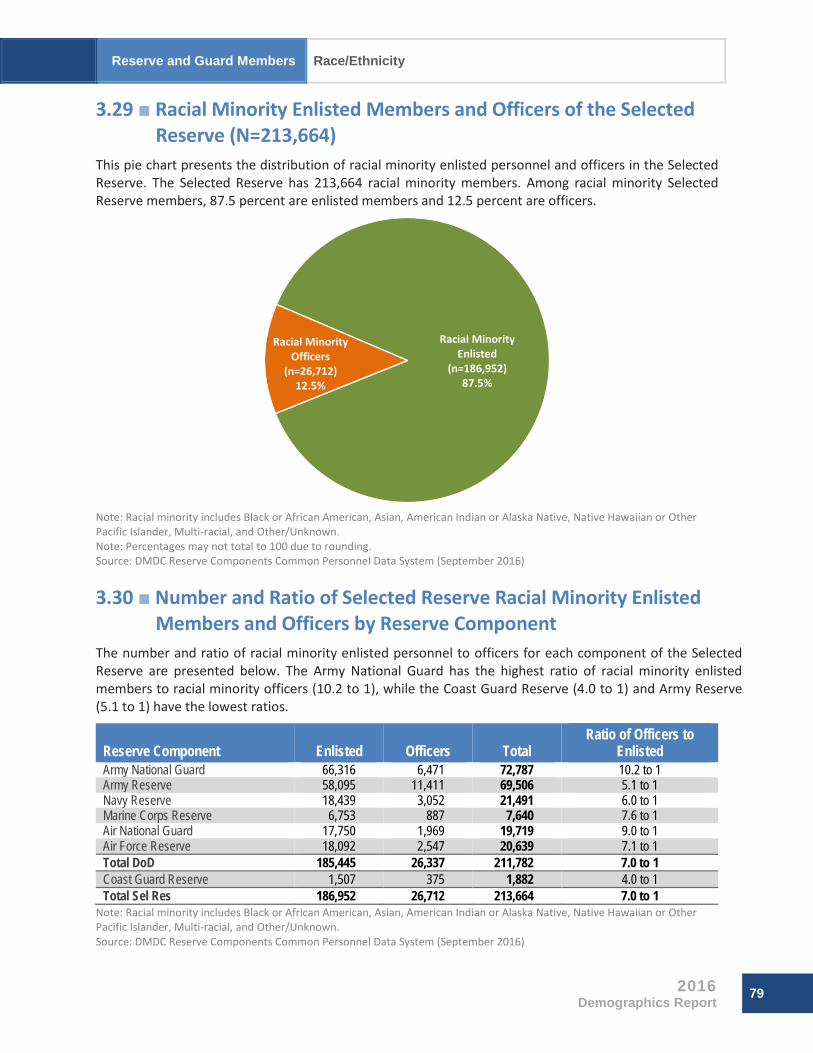
Reserve and Guard Members Race/Ethnicity
2016 Demographics Report
79
3.29 ■ Racial Minority Enlisted Members and Officers of the Selected Reserve (N=213,664)
This pie chart presents the distribution of racial minority enlisted personnel and officers in the Selected Reserve. The Selected Reserve has 213,664 racial minority members. Among racial minority Selected Reserve members, 87.5 percent are enlisted members and 12.5 percent are officers.
Note: Racial minority includes Black or African American, Asian, American Indian or Alaska Native, Native Hawaiian or Other Pacific Islander, Multi-racial, and Other/Unknown. Note: Percentages may not total to 100 due to rounding. Source: DMDC Reserve Components Common Personnel Data System (September 2016)
3.30 ■ Number and Ratio of Selected Reserve Racial Minority Enlisted Members and Officers by Reserve Component
The number and ratio of racial minority enlisted personnel to officers for each component of the Selected Reserve are presented below. The Army National Guard has the highest ratio of racial minority enlisted members to racial minority officers (10.2 to 1), while the Coast Guard Reserve (4.0 to 1) and Army Reserve (5.1 to 1) have the lowest ratios.
Reserve Component Enlisted Officers Total Ratio of Officers to
Enlisted Army National Guard 66,316 6,471 72,787 10.2 to 1 Army Reserve 58,095 11,411 69,506 5.1 to 1 Navy Reserve 18,439 3,052 21,491 6.0 to 1 Marine Corps Reserve 6,753 887 7,640 7.6 to 1 Air National Guard 17,750 1,969 19,719 9.0 to 1 Air Force Reserve 18,092 2,547 20,639 7.1 to 1 Total DoD 185,445 26,337 211,782 7.0 to 1 Coast Guard Reserve 1,507 375 1,882 4.0 to 1 Total Sel Res 186,952 26,712 213,664 7.0 to 1
Note: Racial minority includes Black or African American, Asian, American Indian or Alaska Native, Native Hawaiian or Other Pacific Islander, Multi-racial, and Other/Unknown. Source: DMDC Reserve Components Common Personnel Data System (September 2016)
Racial Minority Enlisted
(n=186,952)87.5%
Racial Minority Officers
(n=26,712)12.5%

Race/Ethnicity Reserve and Guard Members
80 2016 Demographics Report
3.31 ■ Percentage of Selected Reserve Racial Minorities and Non-Minorities by Reserve Component and Pay Grade
This exhibit displays the percentage of racial minority and non-minority Selected Reserve members within each Reserve component and pay grade. Racial minority members represent more than one-quarter (26.1%) of the Selected Reserve. The lowest proportion of racial minority Selected Reserve members is found among high-ranking officers in all of the Reserve components.
Pay Grade
Army National Guard Army Reserve Navy Reserve
Marine Corps Reserve
Air National Guard
Racial Minority
Non-minority
Racial Minority
Non-minority
Racial Minority
Non-minority
Racial Minority
Non-minority
Racial Minority
Non-minority
E1-E4 26.0% 74.0% 36.1% 63.9% 48.6% 51.4% 18.1% 81.9% 22.4% 77.6% E5-E6 18.4% 81.6% 34.0% 66.0% 41.2% 58.8% 22.9% 77.1% 19.7% 80.3% E7-E9 16.1% 83.9% 41.0% 59.0% 27.7% 72.3% 31.7% 68.3% 15.3% 84.7% W1-W5 10.0% 90.0% 26.1% 73.9% 19.0% 81.0% 35.2% 64.8% N/A* N/A* O1-O3 16.8% 83.2% 34.8% 65.2% 24.9% 75.1% 22.4% 77.6% 14.9% 85.1% O4-O6 11.6% 88.4% 25.9% 74.1% 19.5% 80.5% 17.6% 82.4% 11.8% 88.2% O7-O10 10.3% 89.7% 17.0% 83.0% 20.5% 79.5% 0.0% 100.0% 7.3% 92.7% Total 21.3% 78.7% 35.0% 65.0% 37.1% 62.9% 19.8% 80.2% 18.6% 81.4%
Pay Grade
Air Force Reserve Total DoD Coast Guard Reserve Total Sel Res Racial
Minority Non-
minority Racial
Minority Non-
minority Racial
Minority Non-
minority Racial
Minority Non-
minority E1-E4 39.5% 60.5% 29.3% 70.7% 26.7% 73.3% 29.3% 70.7% E5-E6 30.7% 69.3% 25.5% 74.5% 28.9% 71.1% 25.5% 74.5% E7-E9 25.7% 74.3% 24.0% 76.0% 24.2% 75.8% 24.0% 76.0% W1-W5 N/A* N/A* 15.0% 85.0% 23.6% 76.4% 15.1% 84.9% O1-O3 22.5% 77.5% 23.6% 76.4% 39.1% 60.9% 23.7% 76.3% O4-O6 16.8% 83.2% 17.7% 82.3% 31.3% 68.7% 17.8% 82.2% O7-O10 4.9% 95.1% 10.4% 89.6% 0.0% 100.0% 10.3% 89.7% Total 29.8% 70.2% 26.1% 73.9% 28.6% 71.4% 26.1% 73.9%
*The Air National Guard and Air Force Reserve do not have warrant officers. Note: Racial minority includes Black or African American, Asian, American Indian or Alaska Native, Native Hawaiian or Other Pacific Islander, Multi-racial and Other/Unknown. Note: Percentages may not total to 100 due to rounding. Source: DMDC Reserve Components Common Personnel Data System (September 2016)
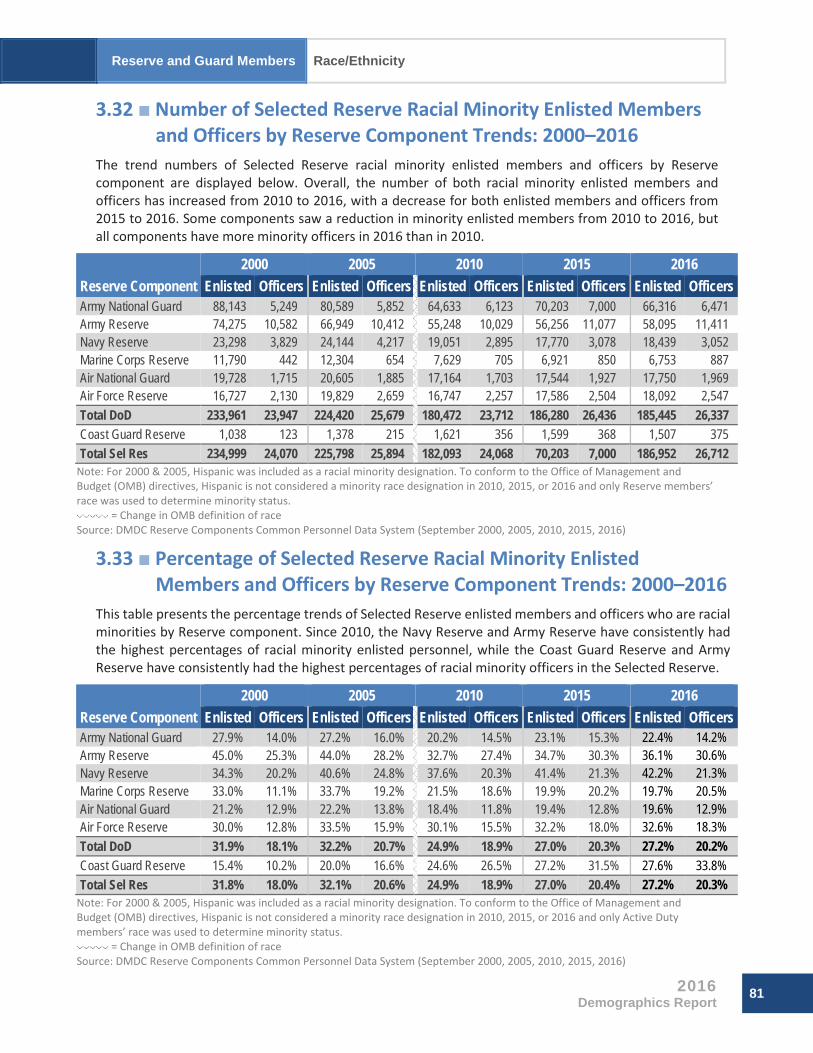
Reserve and Guard Members Race/Ethnicity
2016 Demographics Report
81
3.32 ■ Number of Selected Reserve Racial Minority Enlisted Members and Officers by Reserve Component Trends: 2000–2016
The trend numbers of Selected Reserve racial minority enlisted members and officers by Reserve component are displayed below. Overall, the number of both racial minority enlisted members and officers has increased from 2010 to 2016, with a decrease for both enlisted members and officers from 2015 to 2016. Some components saw a reduction in minority enlisted members from 2010 to 2016, but all components have more minority officers in 2016 than in 2010.
Reserve Component 2000 2005 2010 2015 2016
Enlisted Officers Enlisted Officers Enlisted Officers Enlisted Officers Enlisted Officers Army National Guard 88,143 5,249 80,589 5,852 64,633 6,123 70,203 7,000 66,316 6,471 Army Reserve 74,275 10,582 66,949 10,412 55,248 10,029 56,256 11,077 58,095 11,411 Navy Reserve 23,298 3,829 24,144 4,217 19,051 2,895 17,770 3,078 18,439 3,052 Marine Corps Reserve 11,790 442 12,304 654 7,629 705 6,921 850 6,753 887 Air National Guard 19,728 1,715 20,605 1,885 17,164 1,703 17,544 1,927 17,750 1,969 Air Force Reserve 16,727 2,130 19,829 2,659 16,747 2,257 17,586 2,504 18,092 2,547 Total DoD 233,961 23,947 224,420 25,679 180,472 23,712 186,280 26,436 185,445 26,337 Coast Guard Reserve 1,038 123 1,378 215 1,621 356 1,599 368 1,507 375 Total Sel Res 234,999 24,070 225,798 25,894 182,093 24,068 70,203 7,000 186,952 26,712
Note: For 2000 & 2005, Hispanic was included as a racial minority designation. To conform to the Office of Management and Budget (OMB) directives, Hispanic is not considered a minority race designation in 2010, 2015, or 2016 and only Reserve members’ race was used to determine minority status.
= Change in OMB definition of race Source: DMDC Reserve Components Common Personnel Data System (September 2000, 2005, 2010, 2015, 2016)
3.33 ■ Percentage of Selected Reserve Racial Minority Enlisted Members and Officers by Reserve Component Trends: 2000–2016
This table presents the percentage trends of Selected Reserve enlisted members and officers who are racial minorities by Reserve component. Since 2010, the Navy Reserve and Army Reserve have consistently had the highest percentages of racial minority enlisted personnel, while the Coast Guard Reserve and Army Reserve have consistently had the highest percentages of racial minority officers in the Selected Reserve.
Reserve Component 2000 2005 2010 2015 2016
Enlisted Officers Enlisted Officers Enlisted Officers Enlisted Officers Enlisted Officers Army National Guard 27.9% 14.0% 27.2% 16.0% 20.2% 14.5% 23.1% 15.3% 22.4% 14.2% Army Reserve 45.0% 25.3% 44.0% 28.2% 32.7% 27.4% 34.7% 30.3% 36.1% 30.6% Navy Reserve 34.3% 20.2% 40.6% 24.8% 37.6% 20.3% 41.4% 21.3% 42.2% 21.3% Marine Corps Reserve 33.0% 11.1% 33.7% 19.2% 21.5% 18.6% 19.9% 20.2% 19.7% 20.5% Air National Guard 21.2% 12.9% 22.2% 13.8% 18.4% 11.8% 19.4% 12.8% 19.6% 12.9% Air Force Reserve 30.0% 12.8% 33.5% 15.9% 30.1% 15.5% 32.2% 18.0% 32.6% 18.3% Total DoD 31.9% 18.1% 32.2% 20.7% 24.9% 18.9% 27.0% 20.3% 27.2% 20.2% Coast Guard Reserve 15.4% 10.2% 20.0% 16.6% 24.6% 26.5% 27.2% 31.5% 27.6% 33.8% Total Sel Res 31.8% 18.0% 32.1% 20.6% 24.9% 18.9% 27.0% 20.4% 27.2% 20.3%
Note: For 2000 & 2005, Hispanic was included as a racial minority designation. To conform to the Office of Management and Budget (OMB) directives, Hispanic is not considered a minority race designation in 2010, 2015, or 2016 and only Active Duty members’ race was used to determine minority status.
= Change in OMB definition of race Source: DMDC Reserve Components Common Personnel Data System (September 2000, 2005, 2010, 2015, 2016)
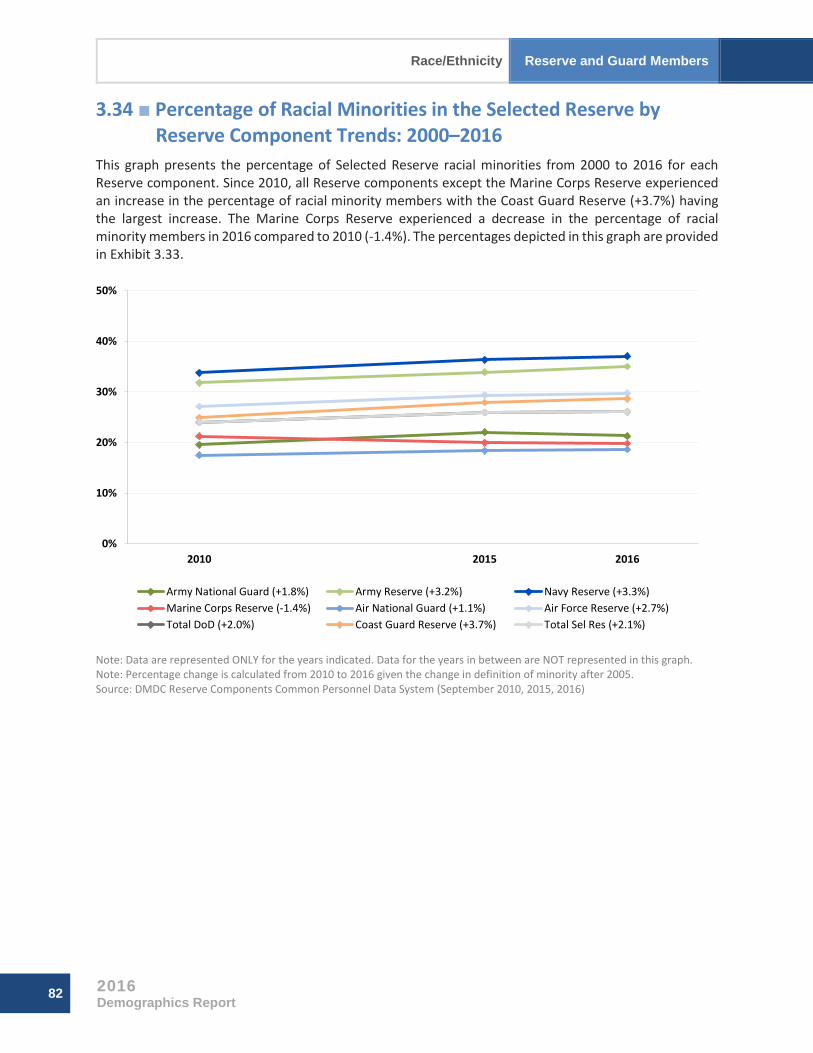
Race/Ethnicity Reserve and Guard Members
82 2016 Demographics Report
3.34 ■ Percentage of Racial Minorities in the Selected Reserve by Reserve Component Trends: 2000–2016
This graph presents the percentage of Selected Reserve racial minorities from 2000 to 2016 for each Reserve component. Since 2010, all Reserve components except the Marine Corps Reserve experienced an increase in the percentage of racial minority members with the Coast Guard Reserve (+3.7%) having the largest increase. The Marine Corps Reserve experienced a decrease in the percentage of racial minority members in 2016 compared to 2010 (-1.4%). The percentages depicted in this graph are provided in Exhibit 3.33.
Note: Data are represented ONLY for the years indicated. Data for the years in between are NOT represented in this graph. Note: Percentage change is calculated from 2010 to 2016 given the change in definition of minority after 2005. Source: DMDC Reserve Components Common Personnel Data System (September 2010, 2015, 2016)
0%
10%
20%
30%
40%
50%
2010 2015 2016
Army National Guard (+1.8%) Army Reserve (+3.2%) Navy Reserve (+3.3%)Marine Corps Reserve (-1.4%) Air National Guard (+1.1%) Air Force Reserve (+2.7%)Total DoD (+2.0%) Coast Guard Reserve (+3.7%) Total Sel Res (+2.1%)

Reserve and Guard Members Geographic Location
2016 Demographics Report
83
Geographic Location
3.35 ■ Worldwide Geographic Location of Selected Reserve Members (N=818,305)
This pie chart presents the location of Selected Reserve members. Most of the Selected Reserve members (98.9%) are located in the United States or U.S. territories.
** United States, U.S. Territories includes the United States, Puerto Rico, Guam, Virgin Islands, American Samoa, and Wake Island. ** Western Hemisphere does not overlap with the United States, U.S. Territories. Note: Percentages may not total to 100 due to rounding. Source: DMDC Reserve Components Common Personnel Data System (September 2016)
United States, U.S. Territories*
(n=809,627)98.9%
Europe (n=1,918)
0.2%
East Asia (n=764)
0.1%
North Africa (n=445)
0.1%
Western Hemisphere**
(n=135)0.0%
Other/Unknown/Ships Afloat
(n=5,416)0.7%

Geographic Location Reserve and Guard Members
84 2016 Demographics Report
3.36 ■ Worldwide Geographic Location of Selected Reserve Enlisted Members (N=686,560)
This pie chart presents the location of Selected Reserve enlisted members. Of these Selected Reserve enlisted members, 99.0 percent are located in the United States or U.S. territories.
** United States, U.S. Territories includes the United States, Puerto Rico, Guam, Virgin Islands, American Samoa, and Wake Island. ** Western Hemisphere does not overlap with the United States, U.S. Territories. Note: Percentages may not total to 100 due to rounding. Source: DMDC Reserve Components Common Personnel Data System (September 2016)
United States, U.S. Territories*
(n=679,732)99.0%
Europe (n=1,089)
0.2%
East Asia (n=438)
0.1%
North Africa (n=314)
0.0%
Western Hemisphere**
(n=93)0.0%
Other/Unknown/Ships Afloat
(n=4,894)0.7%

Reserve and Guard Members Geographic Location
2016 Demographics Report
85
3.37 ■ Worldwide Geographic Location of Selected Reserve Officers (N=131,745)
This pie chart presents the location of Selected Reserve officers. Almost all (98.6%) Selected Reserve officers are located in the United States or U.S. territories.
** United States, U.S. Territories includes the United States, Puerto Rico, Guam, Virgin Islands, American Samoa, and Wake Island. ** Western Hemisphere does not overlap with the United States, U.S. Territories. Note: Percentages may not total to 100 due to rounding. Source: DMDC Reserve Components Common Personnel Data System (September 2016)
United States, U.S. Territories*
(n=129,895)98.6%
Europe (n=829)
0.6%
East Asia (n=326)
0.2%
North Africa (n=131)
0.1%
Western Hemisphere**
(n=42)0.0%
Other/Unknown/Ships Afloat
(n=522)0.4%
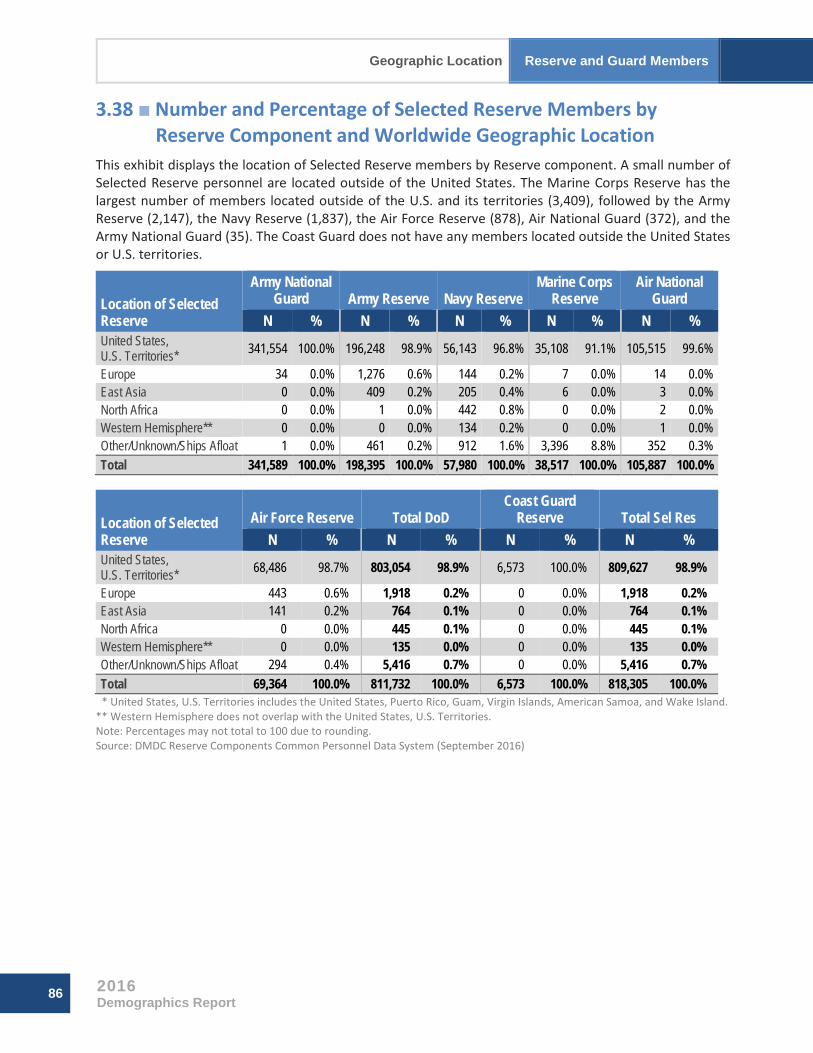
Geographic Location Reserve and Guard Members
86 2016 Demographics Report
3.38 ■ Number and Percentage of Selected Reserve Members by Reserve Component and Worldwide Geographic Location
This exhibit displays the location of Selected Reserve members by Reserve component. A small number of Selected Reserve personnel are located outside of the United States. The Marine Corps Reserve has the largest number of members located outside of the U.S. and its territories (3,409), followed by the Army Reserve (2,147), the Navy Reserve (1,837), the Air Force Reserve (878), Air National Guard (372), and the Army National Guard (35). The Coast Guard does not have any members located outside the United States or U.S. territories.
Location of Selected Reserve
Army National Guard Army Reserve Navy Reserve
Marine Corps Reserve
Air National Guard
N % N % N % N % N % United States, U.S. Territories* 341,554 100.0% 196,248 98.9% 56,143 96.8% 35,108 91.1% 105,515 99.6%
Europe 34 0.0% 1,276 0.6% 144 0.2% 7 0.0% 14 0.0% East Asia 0 0.0% 409 0.2% 205 0.4% 6 0.0% 3 0.0% North Africa 0 0.0% 1 0.0% 442 0.8% 0 0.0% 2 0.0% Western Hemisphere** 0 0.0% 0 0.0% 134 0.2% 0 0.0% 1 0.0% Other/Unknown/Ships Afloat 1 0.0% 461 0.2% 912 1.6% 3,396 8.8% 352 0.3% Total 341,589 100.0% 198,395 100.0% 57,980 100.0% 38,517 100.0% 105,887 100.0%
Location of Selected Reserve
Air Force Reserve Total DoD Coast Guard
Reserve Total Sel Res N % N % N % N %
United States, U.S. Territories* 68,486 98.7% 803,054 98.9% 6,573 100.0% 809,627 98.9%
Europe 443 0.6% 1,918 0.2% 0 0.0% 1,918 0.2% East Asia 141 0.2% 764 0.1% 0 0.0% 764 0.1% North Africa 0 0.0% 445 0.1% 0 0.0% 445 0.1% Western Hemisphere** 0 0.0% 135 0.0% 0 0.0% 135 0.0% Other/Unknown/Ships Afloat 294 0.4% 5,416 0.7% 0 0.0% 5,416 0.7% Total 69,364 100.0% 811,732 100.0% 6,573 100.0% 818,305 100.0%
** United States, U.S. Territories includes the United States, Puerto Rico, Guam, Virgin Islands, American Samoa, and Wake Island. ** Western Hemisphere does not overlap with the United States, U.S. Territories. Note: Percentages may not total to 100 due to rounding. Source: DMDC Reserve Components Common Personnel Data System (September 2016)

Reserve and Guard Members Geographic Location
2016 Demographics Report
87
3.39 ■ Number and Percentage of Selected Reserve Members within the United States by State
The number and percentage of Selected Reserve members per state are presented below in descending order. A total of 793,560 Selected Reserve members are assigned to the 50 states and the District of Columbia. Approximately half (49.9%) of the Selected Reserve are assigned to the United States in thirteen states (California, Texas, Florida, Pennsylvania, New York, Ohio, Georgia, Virginia, Illinois, North Carolina, Alabama, Missouri, and Louisiana).
Rank State
Number of
Selected Reserve
Percentage of Sel Res Living in
State Cumulative Percentage Rank State
Number of
Selected Reserve
Percentage of Sel Res Living in
State Cumulative Percentage
1 California 57,374 7.2% 7.2% 27 Colorado 13,756 1.7% 79.4% 2 Texas 54,142 6.8% 14.1% 28 Kentucky 12,501 1.6% 81.0% 3 Florida 36,733 4.6% 18.7% 29 Utah 11,794 1.5% 82.5% 4 Pennsylvania 31,306 3.9% 22.6% 30 Arkansas 11,541 1.5% 83.9% 5 New York 29,206 3.7% 26.3% 31 Iowa 11,083 1.4% 85.3% 6 Ohio 28,051 3.5% 29.8% 32 Kansas 10,761 1.4% 86.7% 7 Georgia 26,990 3.4% 33.2% 33 Oregon 9,752 1.2% 87.9% 8 Virginia 25,999 3.3% 36.5% 34 Hawaii 9,308 1.2% 89.1% 9 Illinois 24,874 3.1% 39.7% 35 West Virginia 8,048 1.0% 90.1% 10 North Carolina 22,365 2.8% 42.5% 36 Nevada 7,750 1.0% 91.1% 11 Alabama 20,065 2.5% 45.0% 37 Connecticut 6,902 0.9% 91.9% 12 Missouri 19,532 2.5% 47.5% 38 Nebraska 6,392 0.8% 92.7% 13 Louisiana 19,485 2.5% 49.9% 39 Idaho 5,335 0.7% 93.4% 14 Indiana 19,148 2.4% 52.3% 40 New Mexico 5,167 0.7% 94.1% 15 Washington 19,112 2.4% 54.7% 41 Delaware 5,156 0.6% 94.7% 16 Minnesota 18,846 2.4% 57.1% 42 Alaska 4,664 0.6% 95.3% 17 Tennessee 18,749 2.4% 59.5% 43 South Dakota 4,632 0.6% 95.9% 18 Maryland 18,707 2.4% 61.8% 44 North Dakota 4,494 0.6% 96.5% 19 South Carolina 18,301 2.3% 64.1% 45 Rhode Island 4,489 0.6% 97.0% 20 New Jersey 17,592 2.2% 66.4% 46 Montana 4,488 0.6% 97.6% 21 Mississippi 16,379 2.1% 68.4% 47 New Hampshire 4,273 0.5% 98.1% 22 Massachusetts 15,408 1.9% 70.4% 48 District of Columbia 4,116 0.5% 98.6% 23 Michigan 15,069 1.9% 72.3% 49 Maine 3,943 0.5% 99.1% 24 Arizona 14,685 1.9% 74.1% 50 Vermont 3,917 0.5% 99.6% 25 Wisconsin 14,436 1.8% 75.9% 51 Wyoming 2,911 0.4% 100.0% 26 Oklahoma 13,833 1.7% 77.7% Total Sel Res in U.S. 793,560 100.0%
Note: Percentages may not total to 100 due to rounding. Source: DMDC Reserve Components Common Personnel Data System (September 2016)

Geographic Location Reserve and Guard Members
88 2016 Demographics Report
3.40 ■ Number and Percentage of Selected Reserve Members by Worldwide Geographic Location Trends: 2000–2016
The number of Selected Reserve members by geographic location from 2000 to 2016 is presented in the table below. The number of Selected Reserve members in Europe, East Asia, North Africa, and the Western Hemisphere is larger in 2016 compared to 2000, with the greatest increase occurring in East Asia. From 2015 to 2016, there is a decrease in the number of Selected Reserve members in the U.S. and its territories and the Western Hemisphere, and an increase in the number of Selected Reserve personnel in Europe, East Asia, and North Africa.
Location of Active Duty
2000 2005 2010 2015 2016 N % N % N % N % N %
United States, U.S. Territories* 852,033 97.6% 821,355 99.1% 849,729 99.1% 819,887 99.2% 809,627 98.9%
Europe 234 0.0% 517 0.1% 714 0.1% 516 0.1% 1,918 0.2% East Asia 93 0.0% 262 0.0% 172 0.0% 419 0.1% 764 0.1% North Africa 2 0.0% 463 0.1% 1,512 0.2% 228 0.0% 445 0.1% Western Hemisphere** 1 0.0% 44 0.0% 81 0.0% 152 0.0% 135 0.0%
Unknown/Other/ Ships Afloat 20,844 2.4% 6,364 0.8% 5,053 0.6% 4,904 0.6% 5,416 0.7%
Total 873,207 100.0% 829,005 100.0% 857,261 100.0% 826,106 100.0% 818,305 100.0% ** United States, U.S. Territories includes the United States, Puerto Rico, Guam, Virgin Islands, American Samoa, and Wake Island. ** Western Hemisphere does not overlap with the United States, U.S. Territories. Note: Percentages may not total to 100 due to rounding. Source: DMDC Reserve Components Common Personnel Data System (September 2000, 2005, 2010, 2015, 2016)

Reserve and Guard Members Age
2016 Demographics Report
89
Age
3.41 ■ Age of Selected Reserve Members (N=818,305) This pie chart presents the age breakdown of all Selected Reserve members. Approximately one-third (33.0%) of Selected Reserve members are 25 years of age or younger.
Note: Percentages may not total to 100 due to rounding. Source: DMDC Reserve Components Common Personnel Data System (September 2016)
3.42 ■ Age of Selected Reserve Enlisted Members (N=686,560) The age breakdown of Selected Reserve enlisted personnel is presented below. Selected Reserve enlisted members are younger than Selected Reserve officers, with 59.2 percent of enlisted members being 30 years of age or younger, as compared to 18.5 percent of officers. Compared to Active Duty enlisted members, however, there are fewer Selected Reserve enlisted members who are 30 years old or younger (59.2% of Selected Reserve enlisted members compared to 72.1% of Active Duty enlisted members).
Note: Percentages may not total to 100 due to rounding. Source: DMDC Reserve Components Common Personnel Data System (September 2016)
25 Years or Younger
(n=270,184)33.0%
26 to 30 Years (n=160,895)
19.7%
31 to 35 Years (n=130,166)
15.9%
36 to 40 Years (n=92,218)
11.3%
41 Years or Older
(n=164,842)20.1%
25 Years or Younger
(n=262,703)38.3%
26 to 30 Years (n=144,001)
21.0%
31 to 35 Years (n=104,652)
15.2%
36 to 40 Years
(n=67,442)9.8% 41 Years or
Older (n=107,762)
15.7%

Age Reserve and Guard Members
90 2016 Demographics Report
3.43 ■ Age of Selected Reserve Officers (N=131,745) The age breakdown of Selected Reserve officers is presented below. Selected Reserve officers are older than Active Duty officers, with 62.1 percent who are 36 years of age or older, as compared to 42.7 percent of Active Duty officers.
Note: Percentages may not total to 100 due to rounding. Source: DMDC Reserve Components Common Personnel Data System (September 2016)
3.44 ■ Number of Selected Reserve Enlisted Members and Officers by Reserve Component and Age
This table presents the age of Selected Reserve enlisted personnel and officers for each Reserve component. In the Army National Guard, Army Reserve, Navy Reserve, Marine Corps Reserve, and Air National Guard, the largest number of enlisted members are 25 years of age or younger, while in the Air Force Reserve and Coast Guard Reserve the largest number of enlisted members are 26 to 30 years of age and 31 to 35 years of age, respectively. The largest number of officers in each Reserve component are 41 years or older.
Age
Army National Guard Army Reserve Navy Reserve
Marine Corps Reserve
Air National Guard
Enlisted Officers Enlisted Officers Enlisted Officers Enlisted Officers Enlisted Officers 25 Years or Younger 134,776 4,349 58,757 2,721 10,861 32 23,958 165 21,970 123 26 to 30 Years 60,396 8,227 35,805 4,982 9,741 886 6,289 709 17,931 1,227 31 to 35 Years 39,099 9,146 25,280 6,578 8,311 2,676 2,243 1,100 16,948 3,149 36 to 40 Years 24,270 7,344 15,404 5,942 6,633 3,248 996 910 11,857 3,508 41 Years or Older 37,520 16,462 25,802 17,124 8,137 7,455 713 1,434 21,949 7,225 Total 296,061 45,528 161,048 37,347 43,683 14,297 34,199 4,318 90,655 15,232
Age Air Force Reserve Total DoD
Coast Guard Reserve Total Sel Res
Enlisted Officers Enlisted Officers Enlisted Officers Enlisted Officers 25 Years or Younger 11,801 90 262,123 7,480 580 1 262,703 7,481 26 to 30 Years 12,501 825 142,663 16,856 1,338 38 144,001 16,894 31 to 35 Years 11,329 2,674 103,210 25,323 1,442 191 104,652 25,514 36 to 40 Years 7,328 3,551 66,488 24,503 954 273 67,442 24,776 41 Years or Older 12,492 6,773 106,613 56,473 1,149 607 107,762 57,080 Total 55,451 13,913 681,097 130,635 5,463 1,110 686,560 131,745
Source: DMDC Reserve Components Common Personnel Data System (September 2016)
25 Years or Younger
(n=7,481)5.7%
26 to 30 Years (n=16,894)
12.8%
31 to 35 Years (n=25,514)
19.4%
36 to 40 Years (n=24,776)
18.8%
41 Years or Older (n=57,080)
43.3%

Reserve and Guard Members Age
2016 Demographics Report
91
3.45 ■ Percentage of Selected Reserve Enlisted Members and Officers by Reserve Component and Age
This table presents the percentage of Selected Reserve enlisted members and officers by Reserve component and age. Less than one-fifth (15.7%) of Selected Reserve enlisted members are 41 years of age or older, whereas 43.3 percent of Selected Reserve officers are 41 years of age or older. The Marine Corps Reserve has the lowest percentage of enlisted members (2.1%) and officers (33.2%) 41 years of age or older.
Age
Army National Guard Army Reserve Navy Reserve
Marine Corps Reserve
Air National Guard
Enlisted Officers Enlisted Officers Enlisted Officers Enlisted Officers Enlisted Officers 25 Years or Younger 45.5% 9.6% 36.5% 7.3% 24.9% 0.2% 70.1% 3.8% 24.2% 0.8% 26 to 30 Years 20.4% 18.1% 22.2% 13.3% 22.3% 6.2% 18.4% 16.4% 19.8% 8.1% 31 to 35 Years 13.2% 20.1% 15.7% 17.6% 19.0% 18.7% 6.6% 25.5% 18.7% 20.7% 36 to 40 Years 8.2% 16.1% 9.6% 15.9% 15.2% 22.7% 2.9% 21.1% 13.1% 23.0% 41 Years or Older 12.7% 36.2% 16.0% 45.9% 18.6% 52.1% 2.1% 33.2% 24.2% 47.4% Total 100.0% 100.0% 100.0% 100.0% 100.0% 100.0% 100.0% 100.0% 100.0% 100.0%
Age Air Force Reserve Total DoD
Coast Guard Reserve Total Sel Res
Enlisted Officers Enlisted Officers Enlisted Officers Enlisted Officers 25 Years or Younger 21.3% 0.6% 38.5% 5.7% 10.6% 0.1% 38.3% 5.7% 26 to 30 Years 22.5% 5.9% 20.9% 12.9% 24.5% 3.4% 21.0% 12.8% 31 to 35 Years 20.4% 19.2% 15.2% 19.4% 26.4% 17.2% 15.2% 19.4% 36 to 40 Years 13.2% 25.5% 9.8% 18.8% 17.5% 24.6% 9.8% 18.8% 41 Years or Older 22.5% 48.7% 15.7% 43.2% 21.0% 54.7% 15.7% 43.3% Total 100.0% 100.0% 100.0% 100.0% 100.0% 100.0% 100.0% 100.0%
Note: Percentages may not total to 100 due to rounding. Source: DMDC Reserve Components Common Personnel Data System (September 2016)
3.46 ■ Average Age of Selected Reserve Enlisted Members and Officers by Reserve Component
This exhibit presents the average age of Selected Reserve enlisted personnel and officers by Reserve component. The average age of Selected Reserve enlisted members is 30.3, while the average age of Selected Reserve officers is 39.1 years of age. On average, the Marine Corps Reserve has the youngest members (25.9 years of age), while the Coast Guard Reserve has the oldest members (35.7 years of age).
Reserve Component Enlisted Officers Total Army National Guard 28.9 37.3 30.0 Army Reserve 30.5 39.4 32.2 Navy Reserve 32.4 41.5 34.7 Marine Corps Reserve 24.5 37.2 25.9 Air National Guard 33.6 40.6 34.6 Air Force Reserve 33.6 40.9 35.0 Total DoD 30.3 39.1 31.7 Coast Guard Reserve 34.5 41.5 35.7 Total Sel Res 30.3 39.1 31.7
Source: DMDC Reserve Components Common Personnel Data System (September 2016)

Age Reserve and Guard Members
92 2016 Demographics Report
3.47 ■ Selected Reserve Member Age Trends: 2000–2016 This exhibit displays the average age trends of Selected Reserve members from 2000 through 2016. The percentage of Selected Reserve members 35 years of age and younger has increased from 58.9 percent in 2000 to 68.6 percent in 2016, which is a decrease from 2015 (-0.1%)
Source: DMDC Reserve Components Common Personnel Data System (2000, 2005, 2010, 2015, 2016)
3.48 ■ Average Age of Selected Reserve Enlisted Members and Officers Trends: 2000–2016
This table presents the average age trends of Selected Reserve enlisted personnel and officers for the years 2000 through 2016. The average age of all Selected Reserve personnel is 1.7 years younger in 2016 than it was in 2000 and has been decreasing since 2000. The average age of Selected Reserve enlisted members in 2016 is 1.9 years younger than in 2000, while the average age of Selected Reserve officers in 2016 is 1.1 years younger than in 2000.
2000 2005 2010 2015 2016 Enlisted 32.2 31.9 30.8 30.3 30.3 Officers 40.3 40.5 40.1 39.2 39.1 Total 33.4 33.2 32.2 31.7 31.7
Source: DMDC Reserve Components Common Personnel Data System (2000, 2005, 2010, 2015, 2016)
24.5% 25.8% 23.8% 20.7% 20.1%
16.5% 15.5%12.1%
10.6% 11.3%
16.2% 13.7%
12.2%15.5% 15.9%
15.4%13.7%
18.6% 19.2% 19.7%
27.3% 31.2% 33.4% 34.0% 33.0%
0%
20%
40%
60%
80%
100%
2000 2005 2010 2015 2016
25 Years or Younger26 to 30 Years31 to 35 Years36 to 40 Years41 Years or Older

Reserve and Guard Members Education
2016 Demographics Report
93
No High School Diploma or GED
(n=15,442)2.2%
High School Diploma/GED
or Some College*
(n=590,446)86.0%
Bachelor's Degree
(n=65,513)9.5%
Advanced Degree
(n=12,443)1.8%
Unknown (n=2,716)
0.4%
Education
3.49 ■ Education Level of Selected Reserve Members (N=818,305) This pie chart presents the education level of the Selected Reserve. The majority of Selected Reserve members (73.5%) hold at least a high school diploma, but less than a Bachelor's degree.
* Includes cases with at least a high school diploma and possibly additional education less than a Bachelor’s degree (e.g., Associate’s degree).
Note: Percentages may not total to 100 due to rounding. Source: DMDC Reserve Components Common Personnel Data System (September 2016)
3.50 ■ Education Level of Selected Reserve Enlisted Members (N=686,560)
This pie chart presents the education breakdown of Selected Reserve enlisted personnel. The percentage of Selected Reserve enlisted members who have a high school diploma or higher is 97.4 percent, while in the U.S. population, 89.1 percent of those age 25 or over had at least a high school diploma in 2016.
* Includes cases with at least a high school diploma and possibly additional education less than a Bachelor’s degree (e.g., Associate’s degree).
Note: Percentages may not total to 100 due to rounding. Source: DMDC Reserve Components Common Personnel Data System (September 2016); United States Census (2016)
No High School Diploma or GED
(n=15,497)1.9%
High School Diploma/GED
or Some College*
(n=601,801)73.5%
Bachelor's Degree
(n=133,474)16.3%
Advanced Degree
(n=59,688)7.3%
Unknown (n=7,845)
1.0%

Education Reserve and Guard Members
94 2016 Demographics Report
3.51 ■ Education Level of Selected Reserve Officers (N=131,745) This pie chart presents the education breakdown of Selected Reserve officers. The majority of Selected Reserve officers (87.4%) hold a Bachelor's degree or higher, while in the U.S. population, only 33.4 percent of those age 25 and over had a Bachelor's degree or higher in 2016.
* Includes cases with at least a high school diploma and possibly additional education less than a Bachelor’s degree
(e.g., Associate’s degree). Note: Percentages may not total to 100 due to rounding. Source: DMDC Reserve Components Common Personnel Data System (September 2016); United States Census (2016)
3.52 ■ Number of Selected Reserve Members by Reserve Component and Education Level
The education level of Selected Reserve members is broken down by Reserve component below. The Air Force Reserve has the highest percentage of members with a Bachelor's degree or higher (31.0%, N=21,692), while the Marine Corps Reserve has the lowest percentage of members with a Bachelor's degree or higher (14.7%, N=5,672).
Highest Degree Attained Army National
Guard Army
Reserve Navy
Reserve Marine Corps
Reserve No High School Diploma or GED 7,235 6,704 179 12 High School Diploma/GED or Some College* 266,129 134,491 38,088 32,550 Bachelor’s Degree 51,749 38,641 9,656 4,104 Advanced Degree 15,675 17,373 6,204 1,568 Unknown 801 1,186 3,853 283 Total 341,589 198,395 57,980 38,517
Highest Degree Attained
Air National Guard
Air Force Reserve
Total DoD
Coast Guard
Reserve Total Sel
Res No High School Diploma or GED 972 339 15,441 56 15,497 High School Diploma/GED or Some College* 78,720 47,043 597,021 4,780 601,801 Bachelor’s Degree 16,882 11,217 132,249 1,225 133,474 Advanced Degree 8,045 10,475 59,340 348 59,688 Unknown 1,268 290 7,681 164 7,845 Total 105,887 69,364 811,732 6,573 818,305
* Includes cases with at least a high school diploma and possibly additional education less than a Bachelor’s degree (e.g., Associate’s degree).
Source: DMDC Reserve Components Common Personnel Data System (September 2016)
No High School Diploma or GED
(n=55)0.0%
High School Diploma/GED
or Some College*
(n=11,355)8.6%
Bachelor's Degree
(n=67,961)51.6%
Advanced Degree
(n=47,245)35.9%
Unknown (n=5,129)
3.9%

Reserve and Guard Members Education
2016 Demographics Report
95
3.53 ■ Percentage of Selected Reserve Enlisted Members by Education Level Trends: 2000–2016
The education trends of Selected Reserve enlisted personnel from 2000 through 2016 are presented below. Since 2000, the percentage of enlisted personnel with no high school diploma or GED has continued to decline to 2.2 percent in 2016, while the percentage with a Bachelor's degree or higher has continued to increase from 7.1 percent in 2000 to 11.3 percent in 2016.
Highest Degree Attained 2000
(N=739,852) 2005
(N=703,477) 2010
(N=730,148) 2015
(N=694,977) 2016
(N=686,560) No High School Diploma or GED 5.2% 4.4% 3.4% 2.3% 2.2% High School Diploma/GED or Some College* 86.6% 86.4% 88.2% 86.7% 86.0% Bachelor’s Degree 6.3% 7.0% 7.0% 9.0% 9.5% Advanced Degree 0.8% 0.9% 1.0% 1.6% 1.8% Unknown 1.3% 1.3% 0.4% 0.4% 0.4%
* Includes cases with at least a high school diploma and possibly additional education less than a Bachelor’s degree (e.g., Associate’s degree).
Note: Percentages may not total to 100 due to rounding. Source: DMDC Reserve Components Common Personnel Data System (2000, 2005, 2010, 2015, 2016)
3.54 ■ Percentage of Selected Reserve Officers by Education Level Trends: 2000–2016
The education trends of Selected Reserve officers from 2000 to 2016 are presented in the exhibit below. At 87.5 percent in 2016, the percentage of Selected Reserve officers with a Bachelor's or advanced degree is higher than in any of the previous years for which data are presented, and has increased from 74.9 percent in 2000.
Highest Degree Attained 2000
(N=133,355) 2005
(N=125,528) 2010
(N=127,113) 2015
(N=131,129) 2016
(N=131,745) No High School Diploma or GED 0.3% 0.1% 0.1% 0.0% 0.0% High School Diploma/ GED or Some College* 21.1% 10.6% 10.9% 9.0% 8.6% Bachelor’s Degree 48.4% 53.8% 54.1% 52.1% 51.6% Advanced Degree 26.5% 31.7% 30.4% 34.6% 35.9% Unknown 3.7% 3.8% 4.5% 4.2% 3.9%
* Includes cases with at least a high school diploma and possibly additional education less than a Bachelor’s degree (e.g., Associate’s degree).
Note: Percentages may not total to 100 due to rounding. Source: DMDC Reserve Components Common Personnel Data System (2000, 2005, 2010, 2015, 2016)

Marital Status Reserve and Guard Members
96 2016 Demographics Report
Marital Status 3.55 ■ Marital Status of Selected Reserve Members (N=818,305) The marital status of the Selected Reserve is presented below. Overall, 44.5 percent of Selected Reserve members are reported as married and 48.6 percent have never been married. “Married” includes those who are married or remarried.
* Includes annulled, widowed, and unknown cases. Note: Percentages may not total to 100 due to rounding. Source: DMDC Reserve Components Common Personnel Data System (September 2016)
3.56 ■ Marital Status of Selected Reserve Enlisted Members (N=686,560) The marital status of Selected Reserve enlisted personnel is presented below. More than half (53.4%) of Selected Reserve enlisted personnel have never been married, while 39.9 percent are currently married.
* Includes annulled, widowed, and unknown cases. Note: Percentages may not total to 100 due to rounding. Source: DMDC Reserve Components Common Personnel Data System (September 2016)
Married (n=364,537)
44.5%
Never Married (n=397,922)
48.6%
Divorced (n=54,564)
6.7%
Other* (n=1,282)
0.2%
Married (n=274,202)
39.9%
Never Married (n=366,580)
53.4%
Divorced (n=44,850)
6.5%
Other* (n=928)
0.1%

Reserve and Guard Members Marital Status
2016 Demographics Report
97
3.57 ■ Marital Status of Selected Reserve Officers (N=131,745) The marital status of Selected Reserve officers is presented below. The majority of Selected Reserve officers are married (68.6%), and approximately one-quarter (23.8%) of officers have never been married.
* Includes annulled, widowed, and unknown cases. Note: Percentages may not total to 100 due to rounding. Source: DMDC Reserve Components Common Personnel Data System (September 2016)
3.58 ■ Marital Status of Selected Reserve Members by Reserve Component This table presents the marital status of Selected Reserve members by Reserve Component. The Coast Guard Reserve has the highest percentage of married members at 61.9 percent, whereas the Marine Corps Reserve has the lowest percentage of married members at 26.8 percent. The Air Force Reserve has the highest percentage of divorced members at 9.6 percent.
Marital Status
Army National Guard Army Reserve Navy Reserve
Marine Corps Reserve
Air National Guard
N % N % N % N % N % Married 131,790 38.6% 90,026 45.4% 32,306 55.7% 10,331 26.8% 58,419 55.2% Never Married 190,442 55.8% 92,949 46.9% 21,825 37.6% 27,050 70.2% 38,669 36.5% Divorced 18,947 5.5% 14,971 7.5% 3,752 6.5% 1,116 2.9% 8,628 8.1% Other* 410 0.1% 449 0.2% 97 0.2% 20 0.1% 171 0.2% Total 341,589 100.0% 198,395 100.0% 57,980 100.0% 38,517 100.0% 105,887 100.0%
Marital Status Air Force Reserve Total DoD Coast Guard Reserve Total Sel Res
N % N % N % N % Married 37,599 54.2% 360,471 44.4% 4,066 61.9% 364,537 44.5% Never Married 25,005 36.0% 395,940 48.8% 1,982 30.2% 397,922 48.6% Divorced 6,632 9.6% 54,046 6.7% 518 7.9% 54,564 6.7% Other* 128 0.2% 1,275 0.2% 7 0.1% 1,282 0.2% Total 69,364 100.0% 811,732 100.0% 6,573 100.0% 818,305 100.0%
* Includes annulled, widowed, and unknown cases. Note: Percentages may not total to 100 due to rounding. Source: DMDC Reserve Components Common Personnel Data System (September 2016)
Married (n=90,335)
68.6%Never Married (n=31,342)
23.8%
Divorced (n=9,714)
7.4%
Other* (n=354)
0.3%

Marital Status Reserve and Guard Members
98 2016 Demographics Report
3.59 ■ Percentage of Married Selected Reserve Members by Pay Grade and Reserve Component (N=364,537)
This table displays the Selected Reserve members who are married as a percentage of Selected Reserve members in each pay grade within the Reserve component. In all Reserve components except for the Marine Corps Reserve, pay grades O7-O10 have the highest percentage of married Selected Reserve members. In the Marine Corps Reserve, pay grades O4-O6 have the highest percentage of married Selected Reserve members.
Reserve Component E1-E4 E5-E6 E7-E9 W1-W5 O1-O3 O4-O6 O7-O10 Total Army National Guard 16.1% 52.3% 77.9% 76.5% 50.9% 83.7% 92.2% 38.6% Army Reserve 24.2% 55.3% 72.6% 74.3% 51.8% 78.5% 91.1% 45.4% Navy Reserve 26.5% 57.9% 76.4% 81.0% 64.7% 80.6% 92.3% 55.7% Marine Corps Reserve 9.8% 50.8% 78.2% 79.4% 54.3% 83.8% 76.9% 26.8% Air National Guard 22.1% 58.8% 79.3% N/A* 68.5% 83.8% 96.1% 55.2% Air Force Reserve 24.4% 56.0% 72.7% N/A* 61.6% 81.0% 89.0% 54.2% Total DoD 19.1% 54.8% 76.2% 76.0% 54.7% 81.4% 92.4% 44.4% Coast Guard Reserve 36.4% 62.2% 79.6% 87.4% 73.1% 85.4% 100.0% 61.9% Total Sel Res 19.2% 54.9% 76.2% 76.1% 54.9% 81.4% 92.4% 44.5%
* The Air National Guard and Air Force Reserve do not have warrant officers. Source: DMDC Reserve Components Common Personnel Data System (September 2016)
3.60 ■ Number of Married Selected Reserve Members by Gender and Reserve Component
This table displays the number of married Selected Reserve members by gender and Reserve component. Of the 364,537 Selected Reserve members who are married, 55,581 are female and 308,956 are male.
Reserve Component Female Male Total Army National Guard 14,353 117,437 131,790 Army Reserve 16,286 73,740 90,026 Navy Reserve 5,608 26,698 32,306 Marine Corps Reserve 602 9,729 10,331 Air National Guard 9,556 48,863 58,419 Air Force Reserve 8,550 29,049 37,599 Total DoD 54,955 305,516 360,471 Coast Guard Reserve 626 3,440 4,066 Total Sel Res 55,581 308,956 364,537
Source: DMDC Reserve Components Common Personnel Data System (September 2016)

Reserve and Guard Members Marital Status
2016 Demographics Report
99
3.61 ■ Percentage of Married Selected Reserve Members by Gender and Reserve Component
This chart presents the Selected Reserve members who are married as a percentage of the total number of Selected Reserve members of that gender and Reserve component. Overall, 44.5% of Selected Reserve members are married. Of the 660,132 males and 158,173 females in the Selected Reserve, 46.8 percent and 35.1 percent, respectively, are married.
Source: DMDC Reserve Components Common Personnel Data System (September 2016)
41.2%
48.4%
59.5%
26.3%
57.8% 57.3%
46.7%
63.0%
46.8%
25.4%
35.5%
42.8%
38.5%
44.7% 45.9%
35.0%
56.0%
35.1%
38.6%
45.4%
55.7%
26.8%
55.2% 54.2%
44.4%
61.9%
44.5%
0%
10%
20%
30%
40%
50%
60%
70%
ArmyNational
Guard
ArmyReserve
NavyReserve
MarineCorps
Reserve
AirNational
Guard
AirForce
Reserve
Total DoD CoastGuard
Reserve
TotalSel Res
Male
Female
Total
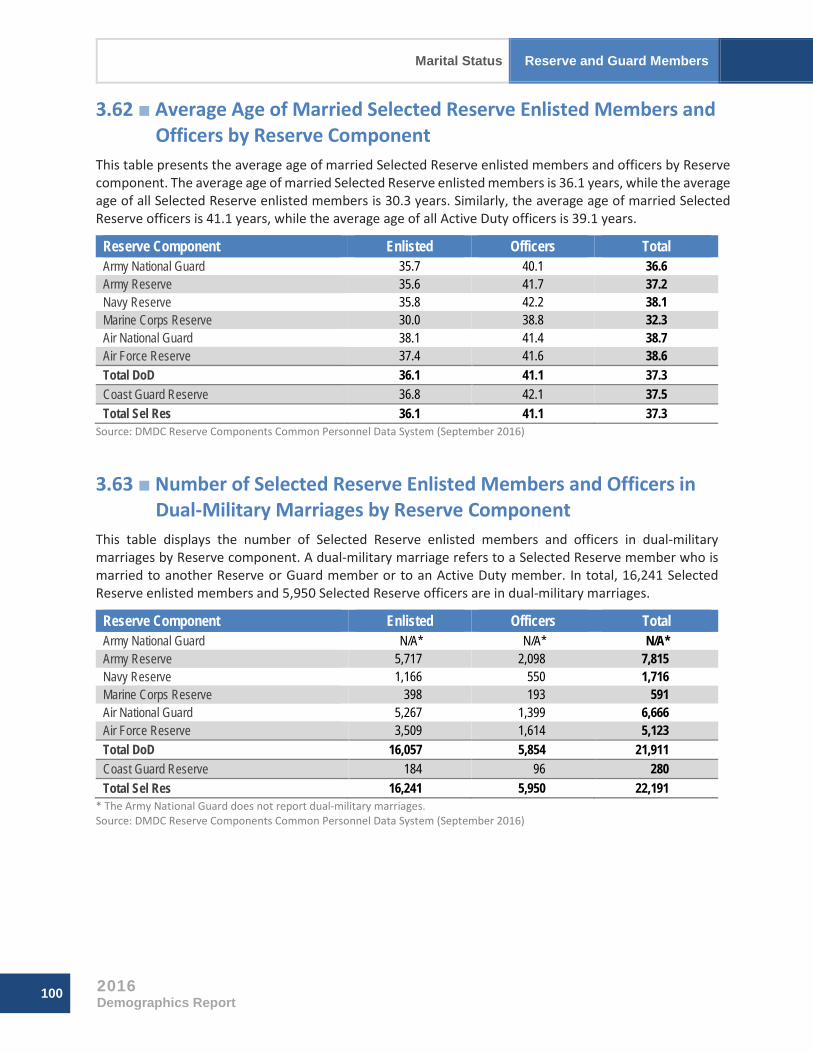
Marital Status Reserve and Guard Members
100 2016 Demographics Report
3.62 ■ Average Age of Married Selected Reserve Enlisted Members and Officers by Reserve Component
This table presents the average age of married Selected Reserve enlisted members and officers by Reserve component. The average age of married Selected Reserve enlisted members is 36.1 years, while the average age of all Selected Reserve enlisted members is 30.3 years. Similarly, the average age of married Selected Reserve officers is 41.1 years, while the average age of all Active Duty officers is 39.1 years.
Reserve Component Enlisted Officers Total Army National Guard 35.7 40.1 36.6 Army Reserve 35.6 41.7 37.2 Navy Reserve 35.8 42.2 38.1 Marine Corps Reserve 30.0 38.8 32.3 Air National Guard 38.1 41.4 38.7 Air Force Reserve 37.4 41.6 38.6 Total DoD 36.1 41.1 37.3 Coast Guard Reserve 36.8 42.1 37.5 Total Sel Res 36.1 41.1 37.3
Source: DMDC Reserve Components Common Personnel Data System (September 2016)
3.63 ■ Number of Selected Reserve Enlisted Members and Officers in Dual-Military Marriages by Reserve Component
This table displays the number of Selected Reserve enlisted members and officers in dual-military marriages by Reserve component. A dual-military marriage refers to a Selected Reserve member who is married to another Reserve or Guard member or to an Active Duty member. In total, 16,241 Selected Reserve enlisted members and 5,950 Selected Reserve officers are in dual-military marriages.
Reserve Component Enlisted Officers Total Army National Guard N/A* N/A* N/A* Army Reserve 5,717 2,098 7,815 Navy Reserve 1,166 550 1,716 Marine Corps Reserve 398 193 591 Air National Guard 5,267 1,399 6,666 Air Force Reserve 3,509 1,614 5,123 Total DoD 16,057 5,854 21,911 Coast Guard Reserve 184 96 280 Total Sel Res 16,241 5,950 22,191
* The Army National Guard does not report dual-military marriages. Source: DMDC Reserve Components Common Personnel Data System (September 2016)
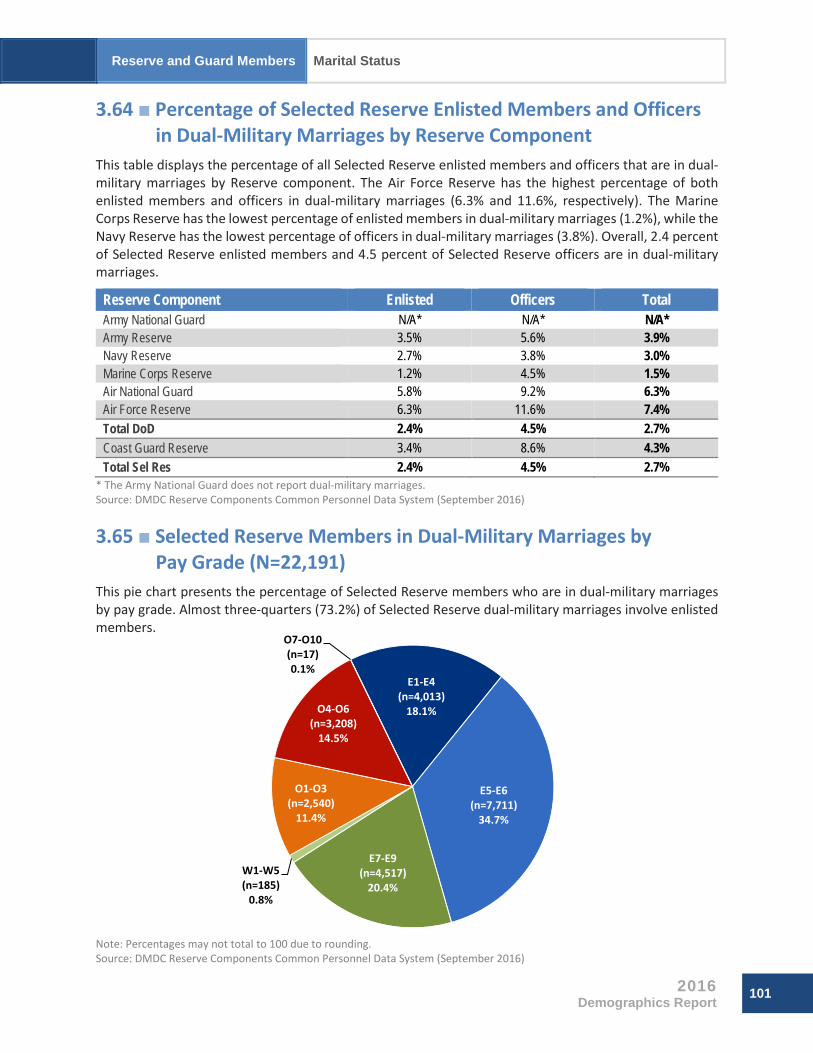
Reserve and Guard Members Marital Status
2016 Demographics Report
101
3.64 ■ Percentage of Selected Reserve Enlisted Members and Officers in Dual-Military Marriages by Reserve Component
This table displays the percentage of all Selected Reserve enlisted members and officers that are in dual-military marriages by Reserve component. The Air Force Reserve has the highest percentage of both enlisted members and officers in dual-military marriages (6.3% and 11.6%, respectively). The Marine Corps Reserve has the lowest percentage of enlisted members in dual-military marriages (1.2%), while the Navy Reserve has the lowest percentage of officers in dual-military marriages (3.8%). Overall, 2.4 percent of Selected Reserve enlisted members and 4.5 percent of Selected Reserve officers are in dual-military marriages.
Reserve Component Enlisted Officers Total Army National Guard N/A* N/A* N/A* Army Reserve 3.5% 5.6% 3.9% Navy Reserve 2.7% 3.8% 3.0% Marine Corps Reserve 1.2% 4.5% 1.5% Air National Guard 5.8% 9.2% 6.3% Air Force Reserve 6.3% 11.6% 7.4% Total DoD 2.4% 4.5% 2.7% Coast Guard Reserve 3.4% 8.6% 4.3% Total Sel Res 2.4% 4.5% 2.7%
* The Army National Guard does not report dual-military marriages. Source: DMDC Reserve Components Common Personnel Data System (September 2016)
3.65 ■ Selected Reserve Members in Dual-Military Marriages by Pay Grade (N=22,191)
This pie chart presents the percentage of Selected Reserve members who are in dual-military marriages by pay grade. Almost three-quarters (73.2%) of Selected Reserve dual-military marriages involve enlisted members.
Note: Percentages may not total to 100 due to rounding. Source: DMDC Reserve Components Common Personnel Data System (September 2016)
E1-E4 (n=4,013)
18.1%
E5-E6(n=7,711)
34.7%
E7-E9 (n=4,517)
20.4%W1-W5 (n=185)
0.8%
O1-O3 (n=2,540)
11.4%
O4-O6 (n=3,208)
14.5%
O7-O10 (n=17)0.1%

Marital Status Reserve and Guard Members
102 2016 Demographics Report
3.66 ■ Percentage of Selected Reserve Members in Dual-Military Marriages by Reserve Component and Gender (N=818,305)
This table presents the percentage of total Selected Reserve members who are in dual-military marriages by Reserve component and gender. Of the 818,305 Selected Reserve members, 2.7 percent are in dual-military marriages. In all Reserve components, a higher percentage of female military members are in dual-military marriages than male military members. The Air Force Reserve has the highest percentage (7.4%) of military members in dual-military marriages.
Gender of Sel Res Member
Army National Guard
Army Reserve
Navy Reserve
Marine Corps
Reserve
Air National Guard
Air Force
Reserve Total DoD
Coast Guard
Reserve Total
Sel Res Male N/A* 1.9% 1.3% 0.8% 3.7% 3.9% 1.4% 1.5% 1.4% Female N/A* 10.7% 8.7% 18.5% 16.5% 16.9% 8.3% 17.8% 8.3% Total N/A* 3.9% 3.0% 1.5% 6.3% 7.4% 2.7% 4.3% 2.7%
* The Army National Guard does not report dual-military marriages. Source: DMDC Reserve Components Common Personnel Data System (September 2016)
3.67 ■ Percentage of Married Selected Reserve Members in Dual-Military Marriages by Reserve Component and Gender (N=364,537)
This table presents the percentage of married Selected Reserve members who are in dual-military marriages by Reserve component and gender. Of the 364,537 Selected Reserve members who are married, 6.1 percent are in dual-military marriages. Almost half (48.2%) of Marine Corps Reserve women who are married are in dual-military marriages. Of the Selected Reserve members who are married, the Air Force Reserve has the highest percentage (13.6%) of members in dual-military marriages in 2016.
Gender of Sel Res Member
Army National Guard
Army Reserve
Navy Reserve
Marine Corps
Reserve
Air National Guard
Air Force
Reserve Total DoD
Coast Guard
Reserve Total
Sel Res Male N/A* 4.0% 2.2% 3.1% 6.4% 6.8% 2.9% 2.4% 2.9% Female N/A* 30.0% 20.3% 48.2% 36.9% 36.8% 23.6% 31.8% 23.7% Total N/A* 8.7% 5.3% 5.7% 11.4% 13.6% 6.1% 6.9% 6.1%
* The Army National Guard does not report dual-military marriages. Source: DMDC Reserve Components Common Personnel Data System (September 2016)

Reserve and Guard Members Marital Status
2016 Demographics Report
103
3.68 ■ Estimated Number and Percentage of Selected Reserve Enlisted Members and Officers who Divorced by Reserve Component
This table presents the number and percentage of Selected Reserve enlisted personnel and officers who divorced in 2016 by Reserve component. The DoD collects information on marital status year to year. The number of members who divorced in the past year is estimated by comparing the number of people who indicated that they were married in 2015, but no longer indicate a status of married in 2016. Consequently, the number of members who divorced in the past year displayed is a count of divorces that occurred in 2016, not a count of all military members who are divorced. The percentages are calculated by taking the count and dividing it by the number of people that were married in 2015. The Army Reserve has the highest divorce rate (3.0%) while the Air Force Reserve has the lowest divorce rate (1.9%).
Reserve Component
Enlisted Officers Total Married as
of Sept 2015
Divorced in 2016
Married as of Sept
2015 Divorced in
2016
Married as of Sept
2015 Divorced in
2016 N N % N N % N N %
Army National Guard 106,200 2,500 2.4% 29,573 589 2.0% 135,773 3,089 2.3% Army Reserve 66,659 2,206 3.3% 23,525 467 2.0% 90,184 2,673 3.0% Navy Reserve 21,532 774 3.6% 10,788 159 1.5% 32,320 933 2.9% Marine Corps Reserve 7,512 237 3.2% 3,029 44 1.5% 10,541 281 2.7% Air National Guard 47,091 994 2.1% 11,810 160 1.4% 58,901 1,154 2.0% Air Force Reserve 26,927 586 2.2% 10,584 126 1.2% 37,511 712 1.9% Total DoD 275,921 7,297 2.6% 89,309 1,545 1.7% 365,230 8,842 2.4%
Note: These figures include widowed cases. However, the number of people who were widowed between September 2015 and September 2016 is expected to be small and should not affect the reported percentages. Source: DMDC Reserve Components Common Personnel Data System (2015, 2016)
3.69 ■ Marriage Trends of Selected Reserve Members: 2000–2016 This graph presents the percentage of Selected Reserve members who were married from 2000 to 2016. The percentage of married Selected Reserve members has decreased 8.7 percent since 2000. In 2000, 53.2 percent of Selected Reserve members were married and in 2016, 44.5 percent were married. The percentages depicted in this graph are provided in Exhibit 3.70.
Note: Data are represented ONLY for the years indicated. Data for the years in between are NOT represented in this graph. Source: DMDC Reserve Components Common Personnel Data System (2000, 2005, 2010, 2015, 2016)
0%
20%
40%
60%
80%
2000 2005 2010 2015 2016
Selected Reserve (-8.7%)

Marital Status Reserve and Guard Members
104 2016 Demographics Report
3.70 ■ Percentage of Married Enlisted Members and Officers in the Selected Reserve Trends: 2000–2016
The percentages of married Selected Reserve enlisted personnel and officers out of the total Selected Reserve enlisted personnel and officers for 2000 through 2016 are presented below. The percentage of married Selected Reserve members has been decreasing for the past 16 years for both enlisted members (-9.5%) and officers (-5.8%).
Year Enlisted Officers Total 2000 49.4% 74.4% 53.2% 2005 47.4% 73.8% 51.4% 2010 44.2% 71.2% 48.2% 2015 40.2% 68.9% 44.7% 2016 39.9% 68.6% 44.5%
Source: DMDC Reserve Components Common Personnel Data System (2000, 2005, 2010, 2015, 2016)
3.71 ■ Percentage of Married Selected Reserve Members by Reserve Component Trends: 2000–2016
This table presents the trends of married Selected Reserve members as a percentage of all Selected Reserve members for each Reserve component. The percentage of married Selected Reserve members has decreased in the past 16 years across all DoD Reserve components; however, the percentage of married Coast Guard Reserve members has been increasing since 2010. The largest decrease in percentage of married Selected Reserve members between 2000 and 2016 occurred in the Army National Guard (-13.4%) followed by the Air Force Reserve (-11.6%).
Reserve Component 2000 2005 2010 2015 2016 Army National Guard 52.0% 49.2% 44.7% 38.8% 38.6% Army Reserve 46.4% 48.2% 45.9% 45.4% 45.4% Navy Reserve 62.8% 62.6% 58.2% 56.4% 55.7% Marine Corps Reserve 29.8% 31.2% 32.1% 27.1% 26.8% Air National Guard 62.2% 57.5% 57.4% 55.8% 55.2% Air Force Reserve 65.8% 59.4% 58.1% 54.8% 54.2% Total DoD 53.1% 51.4% 48.2% 44.6% 44.4% Coast Guard Reserve 62.7% 55.6% 55.4% 59.6% 61.9% Total Sel Res 53.2% 51.4% 48.2% 44.7% 44.5%
Source: DMDC Reserve Components Common Personnel Data System (2000, 2005, 2010, 2015, 2016)

Reserve and Guard Members Marital Status
2016 Demographics Report
105
3.72 ■ Marriage Trends by Reserve Component: 2000–2016 The percentage trends of married Selected Reserve members by Reserve component from 2000 through 2016 are presented below. Compared to 2000, the percentage of Selected Reserve members who are married in 2016 has decreased in all Reserve components, with the highest decrease in the Army National Guard (-13.4%) and the lowest decrease in the Coast Guard Reserve (-0.8%). The percentages depicted in this graph are provided in Exhibit 3.71.
Note: Data are represented ONLY for the years indicated. Data for the years in between are NOT represented in this graph. Source: DMDC Reserve Components Common Personnel Data System (2000, 2005, 2010, 2015, 2016)
3.73 ■ Average Age of Married Selected Reserve Enlisted Members by Reserve Component Trends: 2000–2016
The average age trends of married Selected Reserve enlisted personnel are presented below. The average age of married Selected Reserve enlisted members decreased from 2000 (37.3 years) to 2010 (36.0 years), but has increased to 36.1 years of age in 2016.
Reserve Component 2000 2005 2010 2015 2016 Army National Guard 37.0 36.5 35.4 35.6 35.7 Army Reserve 36.9 36.5 35.6 35.5 35.6 Navy Reserve 36.4 36.7 36.1 36.0 35.8 Marine Corps Reserve 30.2 29.1 28.9 29.7 30.0 Air National Guard 39.2 39.3 38.4 38.1 38.1 Air Force Reserve 39.1 39.4 38.0 37.4 37.4 Total DoD 37.3 37.0 36.0 36.1 36.1 Coast Guard Reserve 40.0 39.0 37.0 36.3 36.8 Total Sel Res 37.3 37.0 36.0 36.1 36.1
Source: DMDC Reserve Components Common Personnel Data System (2000, 2005, 2010, 2015, 2016)
0%
10%
20%
30%
40%
50%
60%
70%
80%
2000 2005 2010 2015 2016
Army National Guard (-13.4%) Army Reserve (-1.0%) Navy Reserve (-7.1%)Marine Corps Reserve (-3.0%) Air National Guard (-7.0%) Air Force Reserve (-11.6%)Coast Guard Reserve (-0.8%)

Marital Status Reserve and Guard Members
106 2016 Demographics Report
3.74 ■ Average Age of Married Selected Reserve Officers by Reserve Component Trends: 2000–2016
The average age trends of married Selected Reserve officers are presented below. The average age of married Selected Reserve officers increased from 40.3 years of age in 2000 to 41.6 years of age in 2010 but decreased to 41.1 years of age in 2016.
Reserve Component 2000 2005 2010 2015 2016 Army National Guard 38.9 40.3 40.0 40.1 40.1 Army Reserve 41.2 42.7 42.6 41.9 41.7 Navy Reserve 40.7 41.6 42.8 42.2 42.4 Marine Corps Reserve 39.1 40.4 40.1 38.8 38.8 Air National Guard 39.8 41.4 41.6 41.3 41.4 Air Force Reserve 41.1 42.3 42.5 41.6 41.6 Total DoD 40.3 41.6 41.6 41.1 41.1 Coast Guard Reserve 40.3 41.5 41.2 41.8 42.1 Total Sel Res 40.3 41.6 41.6 41.1 41.1
Source: DMDC Reserve Components Common Personnel Data System (2000, 2005, 2010, 2015, 2016)
3.75 ■ Percentage of Selected Reserve Enlisted Members and Officers in Dual-Military Marriages by Reserve Component Trends: 2000–2016
This table presents the percentage trends of Selected Reserve enlisted members and officers in dual-military marriages by Reserve component. The Air Force Reserve consistently has the highest percentage of members in dual-military marriages. The Marine Corps Reserve consistently has the lowest percentage of enlisted members in dual-military marriages, while the Navy Reserve consistently has the lowest percentage of officers in dual-military marriages.
Reserve Component 2000 2005 2010 2015 2016
Enlisted Officers Enlisted Officers Enlisted Officers Enlisted Officers Enlisted Officers Army National Guard N/A* N/A* N/A* N/A* N/A* N/A* N/A* N/A* N/A* N/A* Army Reserve 1.4% 2.1% 3.2% 4.6% 3.7% 5.0% 3.5% 5.5% 3.5% 5.6% Navy Reserve 1.9% 1.9% 2.0% 2.6% 2.3% 3.0% 2.6% 3.7% 2.7% 3.8% Marine Corps Reserve 1.2% 3.7% 1.3% 3.7% 1.8% 4.1% 1.2% 4.5% 1.2% 4.5% Air National Guard 5.2% 7.2% 5.7% 8.6% 5.6% 8.3% 5.8% 9.2% 5.8% 9.2% Air Force Reserve 6.8% 10.1% 6.5% 11.3% 6.6% 11.0% 6.4% 11.6% 6.3% 11.6% Total DoD 1.7% 3.1% 2.3% 4.3% 2.3% 4.1% 2.3% 4.4% 2.4% 4.5% Coast Guard Reserve 3.0% 4.8% 3.2% 5.9% 4.0% 8.3% 3.5% 8.6% 3.4% 8.6% Total Sel Res 1.7% 3.1% 2.3% 4.3% 2.4% 4.2% 2.3% 4.4% 2.4% 4.5%
* The Army National Guard does not report dual-military marriages. Source: DMDC Reserve Components Common Personnel Data System (2000, 2005, 2010, 2015, 2016)

Reserve and Guard Members Marital Status
2016 Demographics Report
107
3.76 ■ Estimated Percentage of Selected Reserve Enlisted Members and Officers who Divorced by Reserve Component Trends: 2000–2016
The divorce rate percentage trends for Selected Reserve enlisted personnel and officers within each Reserve component are presented below. The total estimated divorce rate for Selected Reserve enlisted members has increased from 2.4 percent in 2000 to 2.6 percent in 2016, but decreased from 2015 to 2016 (-0.7%). The total estimated divorce rate for Selected Reserve officers has increased from 1.6 percent in 2000 to 1.7 percent in 2016, with a decrease from 2015 to 2016 (-0.4%). The Navy Reserve has the highest estimated divorce rate in 2016 for enlisted members (3.6%) and the Army National Guard and Army Reserve have the highest estimated divorce rate in 2016 for officers (2.0% for both).
Reserve Component
2000 2005 2010 2015 2016 Enlisted Officers Enlisted Officers Enlisted Officers Enlisted Officers Enlisted Officers
Army National Guard 1.9% 1.7% 2.1% 1.7% 2.5% 1.7% 2.9% 2.1% 2.4% 2.0% Army Reserve 3.1% 1.7% 3.3% 1.8% 3.3% 1.8% 5.5% 3.1% 3.3% 2.0% Navy Reserve 2.6% 1.3% 3.7% 6.4% 3.7% 3.4% 3.3% 1.5% 3.6% 1.5% Marine Corps Reserve 2.9% 1.6% 2.6% 1.4% 3.5% 2.1% 2.9% 1.5% 3.2% 1.5% Air National Guard 2.6% 1.5% 2.0% 1.3% 2.7% 1.7% 2.3% 1.6% 2.1% 1.4% Air Force Reserve 2.4% 1.4% 1.9% 1.0% 2.6% 1.4% 2.4% 1.5% 2.2% 1.2% Total DoD 2.4% 1.6% 2.5% 2.3% 2.8% 1.9% 3.4% 2.1% 2.6% 1.7%
Note: These figures include widowed cases. However, the number of people who were widowed is expected to be small and should not affect the reported percentages. Source: DMDC Reserve Components Common Personnel Data System (2000, 2005, 2010, 2015, 2016)

Marital Status Reserve and Guard Members
108 2016 Demographics Report
3.77 ■ Estimated Percentage of Selected Reserve Members who Divorced by Reserve Component Trends: 2000–2016
This graph presents the estimated percentage of married Selected Reserve members who divorced during Fiscal Years 2000 to 2016 by Reserve component. The Navy Reserve had the greatest increase in its divorce rate from 2000 to 2016 (-0.6%).
Note: Data are represented ONLY for the years indicated. Data for the years in between are NOT represented in this graph. Note: These figures include widowed cases. However, the number of people who were widowed is expected to be small and should not affect the reported percentages. Source: DMDC Reserve Components Common Personnel Data System (2000, 2005, 2010, 2015, 2016)
0%
1%
2%
3%
4%
5%
2000 2005 2010 2015 2016
Army National Guard (+0.4%) Army Reserve (+0.4%) Navy Reserve (+0.6%)Marine Corps Reserve (+0.2%) Air National Guard (-0.4%) Air Force Reserve (-0.2%)
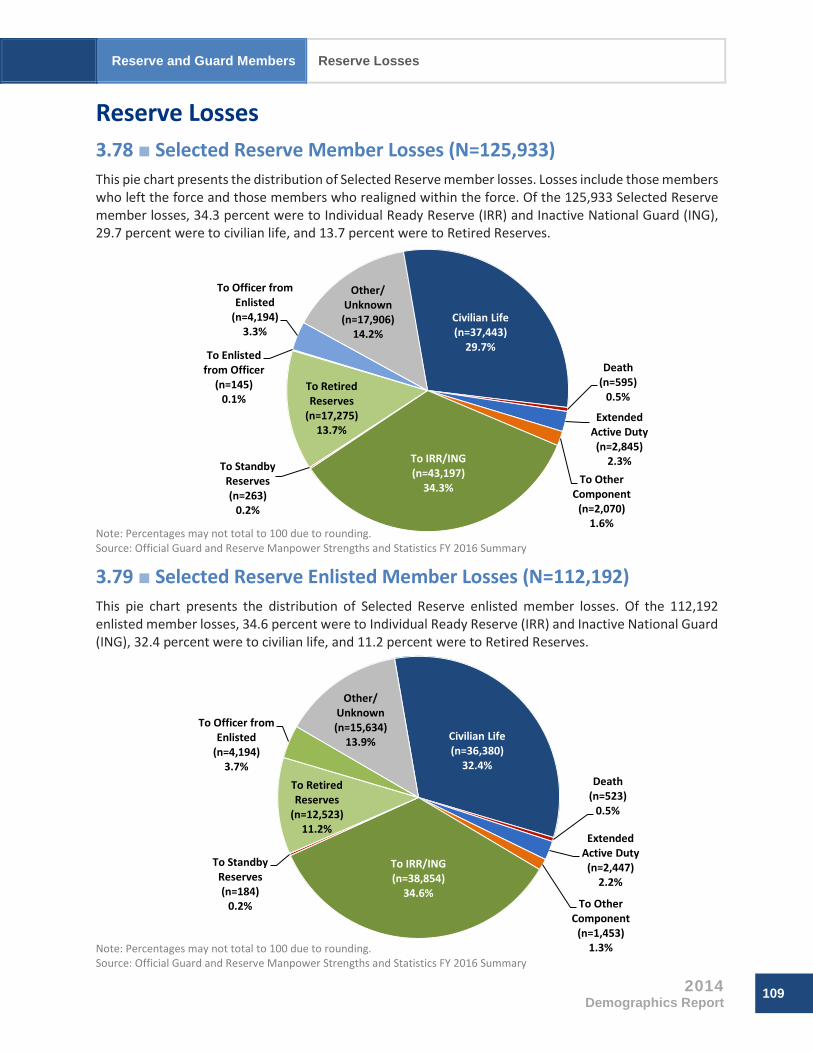
Reserve and Guard Members Reserve Losses
2014 Demographics Report
109
Reserve Losses 3.78 ■ Selected Reserve Member Losses (N=125,933) This pie chart presents the distribution of Selected Reserve member losses. Losses include those members who left the force and those members who realigned within the force. Of the 125,933 Selected Reserve member losses, 34.3 percent were to Individual Ready Reserve (IRR) and Inactive National Guard (ING), 29.7 percent were to civilian life, and 13.7 percent were to Retired Reserves.
Note: Percentages may not total to 100 due to rounding. Source: Official Guard and Reserve Manpower Strengths and Statistics FY 2016 Summary
3.79 ■ Selected Reserve Enlisted Member Losses (N=112,192) This pie chart presents the distribution of Selected Reserve enlisted member losses. Of the 112,192 enlisted member losses, 34.6 percent were to Individual Ready Reserve (IRR) and Inactive National Guard (ING), 32.4 percent were to civilian life, and 11.2 percent were to Retired Reserves.
Note: Percentages may not total to 100 due to rounding. Source: Official Guard and Reserve Manpower Strengths and Statistics FY 2016 Summary
Civilian Life (n=36,380)
32.4%Death
(n=523)0.5%
Extended Active Duty (n=2,447)
2.2%
To Other Component
(n=1,453)1.3%
To IRR/ING (n=38,854)
34.6%
To Standby Reserves (n=184)
0.2%
To Retired Reserves
(n=12,523)11.2%
To Officer from Enlisted
(n=4,194)3.7%
Other/Unknown (n=15,634)
13.9%
Civilian Life (n=37,443)
29.7%
Death (n=595)
0.5%
Extended Active Duty (n=2,845)
2.3%To Other
Component (n=2,070)
1.6%
To IRR/ING(n=43,197)
34.3%
To StandbyReserves(n=263)
0.2%
To Retired Reserves
(n=17,275)13.7%
To Enlisted from Officer
(n=145)0.1%
To Officer from Enlisted
(n=4,194)3.3%
Other/Unknown (n=17,906)
14.2%

Reserve Losses Reserve and Guard Members
110 2016 Demographics Report
3.80 ■ Selected Reserve Officer Losses (N=13,741) This pie chart presents the distribution of Selected Reserve officer losses. Of the 13,741 officer losses, 34.6 percent were to Retired Reserves and 31.6 percent were to Individual Ready Reserve (IRR) and Inactive National Guard (ING).
Note: Percentages may not total to 100 due to rounding. Source: Official Guard and Reserve Manpower Strengths and Statistics FY 2016 Summary
3.81 ■ Selected Reserve Member Losses by Reserve Component (N=125,933)
This pie chart presents the distribution of Selected Reserve member losses by Reserve component. Losses include those members who left the force and those members who realigned within the force. During 2016, 43.1 percent of the total Reserve losses came from the Army National Guard. These losses are relatively proportional to the size of the component, as the Army National Guard comprises over 40 percent of the Selected Reserve.
Note: Percentages may not total to 100 due to rounding. Source: Official Guard and Reserve Manpower Strengths and Statistics FY 2016 Summary
Civilian Life (n=1,063)
7.7%
Death (n=72)0.5%
Extended Active Duty
(n=398)2.9%
To Other Component
(n=617)4.5%To IRR/ING
(n=4,343)31.6%
To Standby Reserves
(n=79)0.6%
To Retired Reserves (n=4,752)
34.6%
To Enlisted from Officer (n=145)
1.1% Other/Unknown (n=2,272)
16.5%
Army National Guard
(n=54,268)43.1%
Army Reserve (n=31,413)
24.9%Navy
Reserve (n=11,371)
9.0%
Marine Corps Reserve
(n=9,972)7.9%
Air National Guard
(n=9,507)7.5%
Air Force Reserve (n=8,253)
6.6%
Coast Guard Reserve
(n=1,149)0.9%

Reserve and Guard Members Reserve Losses
2014 Demographics Report
111
3.82 ■ Number of Selected Reserve Enlisted Member and Officer Losses by Reserve Component
This table presents the number of Selected Reserve enlisted member and officer losses within each Reserve component. The highest number of Selected Reserve enlisted member and officer losses came from the Army National Guard, comprising over 40 percent of total Reserve losses.
Reserve Component Enlisted Officers Total Army National Guard 50,209 4,059 54,268 Army Reserve 27,255 4,158 31,413 Navy Reserve 9,590 1,781 11,371 Marine Corps Reserve 9,098 874 9,972 Air National Guard 8,353 1,154 9,507 Air Force Reserve 6,720 1,533 8,253 Total DoD 111,225 13,559 124,784 Coast Guard Reserve 967 182 1,149 Total Sel Res 112,192 13,741 125,933
Source: Official Guard and Reserve Manpower Strengths and Statistics FY 2016 Summary

Reserve Losses Reserve and Guard Members
112 2016 Demographics Report
3.83 ■ Number of Selected Reserve Enlisted Member and Officer Losses by Reserve Component and Type of Loss
This table presents the type of Selected Reserve losses for enlisted members and officers in each Reserve component. Of the 125,933 Selected Reserve losses in 2016, 112,192 were enlisted members and 13,741 were officers. Transfer to the Individual Ready Reserve (IRR) and Inactive National Guard (ING) was the most common type of loss for enlisted members, whereas transfer to Retired Reserves was the most common type of loss for officers.
Type of Loss
Army National Guard
(N=54,268) Army Reserve
(N=31,413) Navy Reserve
(N=11,371)
Marine Corps Reserve
(N=9,972)
Air National Guard
(N=9,507) Enlisted Officers Enlisted Officers Enlisted Officers Enlisted Officers Enlisted Officers
Civilian Life 18,548 471 8,744 290 2,291 113 2,878 29 2,323 61 Death 249 22 126 31 21 6 36 2 55 5 Extended Active Duty 1,144 51 562 82 447 44 155 54 82 2 To Other Component 384 244 5 52 0 0 1 0 356 203 To IRR/ING 19,250 1,151 6,987 1,232 3,198 954 5,484 632 1,458 80 To Standby Reserves 20 4 64 20 2 19 1 7 41 16 To Retired Reserves 4,433 1,122 2,748 1,622 508 373 177 144 3,056 714 To Enlisted from Officer N/A 134 N/A 6 N/A 0 N/A 0 N/A 3 To Officer from Enlisted 2,452 N/A 831 N/A 0 N/A 185 N/A 565 N/A Other/Unknown 3,729 860 7,188 823 3,123 272 181 6 417 70 Total 50,209 4,059 27,255 4,158 9,590 1,781 9,098 874 8,353 1,154
Type of Loss
Air Force Reserve (N=8,253)
Total DoD (N=124,784)
Coast Guard Reserve
(N=1,149) Total Sel Res (N=125,933)
Enlisted Officers Enlisted Officers Enlisted Officers Enlisted Officers Civilian Life 1,405 84 36,189 1,048 191 15 36,380 1,063 Death 32 6 519 72 4 0 523 72 Extended Active Duty 57 165 2,447 398 0 0 2,447 398 To Other Component 707 118 1,453 617 0 0 1,453 617 To IRR/ING 2,236 256 38,613 4,305 241 38 38,854 4,343 To Standby Reserves 3 7 131 73 53 6 184 79 To Retired Reserves 1,509 723 12,431 4,698 92 54 12,523 4,752 To Enlisted from Officer N/A 1 N/A 144 N/A 1 N/A 145 To Officer from Enlisted 159 N/A 4,192 N/A 2 N/A 4,194 N/A Other/Unknown 612 173 15,250 2,204 384 68 15,634 2,272 Total 6,720 1,533 111,225 13,559 967 182 112,192 13,741
Source: Official Guard and Reserve Manpower Strengths and Statistics FY 2016 Summary

Reserve and Guard Members Reserve Losses
2014 Demographics Report
113
3.84 ■ Number of Ready Reserve Enlisted Member and Officer Retirements by Reserve Component and Type of Retirement
This table presents the number of Ready Reserve officer and enlisted member retirements by Reserve component and type of retirement. Across all Reserve components (excluding Coast Guard Reserve), 508,691 enlisted members and 263,471 officers retired from the Ready Reserve (including Selected Reserve, Individual Ready Reserve, and Inactive National Guard). The Army National Guard and Army Reserve had the largest number of total retirements (420,891), followed by the Air National Guard and Air Force Reserve (208,110), the Navy Reserve (125,531), and the Marine Corps Reserve (17,630).
Type of Retirement
Army National Guard and Army
Reserve (N=420,891)
Navy Reserve (N=125,531)
Marine Corps Reserve
(N=17,630)
Air National Guard and Air Force Reserve
(N=208,110) Total DoD
(N=772,162) Enlisted Officer Enlisted Officer Enlisted Officer Enlisted Officer Enlisted Officer
NON-DISABILITY RETIREMENT TYPE Reserve Component Retirement with 20+ Years Active Service 9,475 25,121 16,522 4,833 1,293 1,013 8,352 15,772 35,642 46,739
Receiving Pay (Age 60 or Older) with 20+ Years Reserve Service 158,428 81,552 33,909 33,765 3,117 5,050 77,543 36,147 272,997 156,514
Not Receiving Pay (Under age 60) with 20+ Years Reserve Service 86,654 22,558 21,637 11,598 2,828 2,869 51,843 13,689 162,962 50,714
Total Non-Disability Retirements 254,557 129,231 72,068 50,196 7,238 8,932 137,738 65,608 471,601 253,967 DISABILITY RETIREMENT TYPE Reserve Component Retirement on Permanent Disability 29,894 6,164 2,224 894 963 369 2,745 1,879 35,826 9,306
Reserve Component Retirement on Temporary Disability 878 167 138 11 122 6 126 14 1,264 198
Total Disability Retirements 30,772 6,331 2,362 905 1,085 375 2,871 1,893 37,090 9,504 Total Reserve Retirements 285,329 135,562 74,430 51,101 8,323 9,307 140,609 67,501 508,691 263,471
Source: Official Guard and Reserve Manpower Strengths and Statistics FY 2016 Summary

Reserve Losses Reserve and Guard Members
114 2016 Demographics Report
3.85 ■ Selected Reserve Member Losses by Reserve Component Trends: 2000–2016
This graph depicts trends in the number of Selected Reserve losses by Reserve component for 2000 to 2016. The total number of Selected Reserve losses decreased between 2000 and 2016 for all Reserve components, with the greatest decrease in the Navy Reserve (-47.5%).
Note: Data are represented ONLY for the years indicated. Data for the years in between are NOT represented in this graph. Source: Official Guard and Reserve Manpower Strengths and Statistics FY 2000, 2005, 2010, 2015, & 2016 Summary
0
10,000
20,000
30,000
40,000
50,000
60,000
70,000
2000 2005 2010 2015 2016
Army National Guard (-5.8%) Army Reserve (-45.3%) Navy Reserve (-47.5%)Marine Corps Reserve (-11.1%) Air National Guard (-15.2%) Air Force Reserve (-10.9%)Coast Guard Reserve (-40.3%)

115
SECTION 4
Total Force Families This section contains information on total force family characteristics, which includes the families of both DoD Active Duty and Selected Reserve personnel. Each exhibit combines Active Duty and Reserve and Guard family data to display numbers for the families of the total military force. All of the data referring to dependents (spouses, children, and adult dependents) are extracted from the Defense Enrollment & Eligibility Reporting System (DEERS). Only eligible dependents who are registered in DEERS are included; therefore, the data are likely to be underreported.

116
This page is intentionally blank.
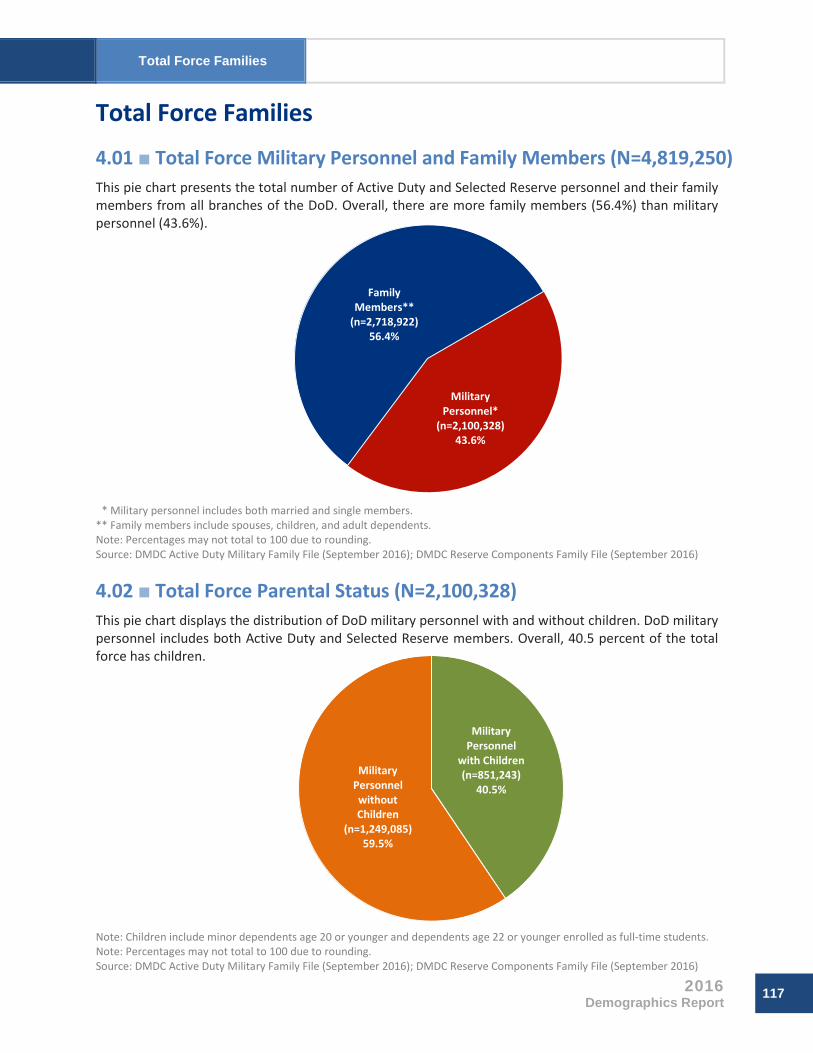
Total Force Families
2016 Demographics Report
117
Military Personnel*
(n=2,100,328)43.6%
Family Members**
(n=2,718,922)56.4%
Total Force Families
4.01 ■ Total Force Military Personnel and Family Members (N=4,819,250) This pie chart presents the total number of Active Duty and Selected Reserve personnel and their family members from all branches of the DoD. Overall, there are more family members (56.4%) than military personnel (43.6%).
** Military personnel includes both married and single members. ** Family members include spouses, children, and adult dependents. Note: Percentages may not total to 100 due to rounding. Source: DMDC Active Duty Military Family File (September 2016); DMDC Reserve Components Family File (September 2016)
4.02 ■ Total Force Parental Status (N=2,100,328) This pie chart displays the distribution of DoD military personnel with and without children. DoD military personnel includes both Active Duty and Selected Reserve members. Overall, 40.5 percent of the total force has children.
Note: Children include minor dependents age 20 or younger and dependents age 22 or younger enrolled as full-time students. Note: Percentages may not total to 100 due to rounding. Source: DMDC Active Duty Military Family File (September 2016); DMDC Reserve Components Family File (September 2016)
Military Personnel
with Children (n=851,243)
40.5%
Military Personnel without Children
(n=1,249,085)59.5%

Total Force Families
118 2016 Demographics Report
4.03 ■ Total Force Family Status (N=2,100,328) This pie chart depicts the distribution of the total DoD force by family status. Of all military personnel, 43.9 percent are single with no children, while 34.4 percent are married with children (32.1% are married to a civilian and have children, 2.2% are in a dual-military marriage, with children).
Note: Single includes annulled, divorced, and widowed. Children include minor dependents age 20 or younger and dependents age 22 or younger enrolled as full-time students. Note: Percentages may not total to 100 due to rounding. Source: DMDC Active Duty Military Family File (September 2016); DMDC Reserve Components Family File (September 2016)
4.04 ■ Number of Total Force Personnel in Dual-Military Marriages with Children by DoD Component and Pay Grade
This table presents the number of total force personnel in dual-military marriages with children by DoD component and pay grade. Of all DoD military personnel, 46,544 (2.2%) are in dual-military marriages with children. The Air Force has the largest reported number of members in dual-military marriages with children (22,304) followed by the Army (14,622).
Pay Grade Army Navy Marine Corps Air Force Total DoD E1-E4 2,398 1,297 471 1,869 6,035 E5-E6 5,244 3,346 947 9,960 19,497 E7-E9 3,195 1,290 449 5,689 10,623 W1-W5 659 70 84 N/A* 813 O1-O3 1,522 572 124 1,613 3,831 O4-O6 1,600 792 186 3,155 5,733 O7-O10 4 0 0 18 22 Total 14,622 7,367 2,261 22,304 46,554
* The Air Force does not have warrant officers. Note: Army includes Active Duty Army and Army Reserve (the Army National Guard does not report dual-military marriages). Navy includes Active Duty Navy and Navy Reserve. Marine Corps includes Active Duty Marine Corps and Marine Corps Reserve. Air Force includes Active Duty Air Force, Air National Guard, and Air Force Reserve. Source: DMDC Active Duty Military Family File (September 2016); DMDC Reserve Components Family File (September 2016)
Single, no children
(n=921,314)43.9%
Single, with children
(n=129,485)6.2%
Married to Civilian, no
children (n=267,861)
12.8%
Married to Civilian, with
children (n=675,204)
32.1%
Dual-military Marriage, no
children (n=59,910)
2.9%
Dual-military Marriage, with
children (n=46,554)
2.2%

Total Force Families
2016 Demographics Report
119
4.05 ■ Age of Military Spouses (N=991,687) This pie chart depicts the distribution of Active Duty and Selected Reserve spouses by age group. Across the DoD, there are 991,687 military spouses. One fifth (19.5%) of spouses are 25 years of age or younger; a similar percentage of spouses (20.0%) fall into the oldest age category and are 41 years or older.
Note: Data are presented for the total DoD military force; therefore, DHS Coast Guard Active Duty and DHS Coast Guard Reserve are not included. Note: Percentages may not total to 100 due to rounding. Source: DMDC Active Duty Military Family File (September 2016); DMDC Reserve Components Family File (September 2016)
4.06 ■ Age of Military Children (N=1,715,519) This pie chart depicts the distribution of Active Duty and Selected Reserve children by age group. Across the DoD, there are 1,715,519 military children. The largest percentage of children are between 0 and 5 years of age (37.8%), followed by 6 to 11 years of age (31.6%) and 12 to 18 years of age (23.8%). Only 6.8 percent of DoD military children registered as dependents are between 19 and 22 years of age.
Note: Children ages 21 to 22 must be enrolled as full-time students in order to qualify as dependents. Note: Data are presented for the total DoD military force; therefore, DHS Coast Guard Active Duty and DHS Coast Guard Reserve are not included. Note: Percentages may not total to 100 due to rounding. Source: DMDC Active Duty Military Family File (September 2016); DMDC Reserve Components Family File (September 2016)
25 Years or Younger
(n=193,832)19.5%
26 to 30 Years (n=232,575)
23.5%
31 to 35 Years (n=215,563)
21.7%
36 to 40 Years (n=151,811)
15.3%
41 Years or Older (n=197,906)
20.0%
0 to 5 Years (n=648,554)
37.8%
6 to 11 Years (n=541,274)
31.6%
12 to 18 Years (n=408,922)
23.8%
19 to 22 Years (n=116,769)
6.8%

Total Force Families
120 2016 Demographics Report
4.07 ■ Number and Percentage of Total Force Personnel by Family Status Trends: 2000–2016
This table presents the number and percentage of total force personnel by family status from 2000 to 2016. The total force personnel includes both DoD Active Duty and Selected Reserve personnel. The percentage of military personnel with children has decreased 3.2 percent in the past six years from 43.7 percent in 2010 to 40.5 percent in 2016.
2000* 2005 2010 2015 2016
N % N % N % N % N % Single, no children 917,764 41.0% 880,304 40.1% 903,615 39.9% 914,320 43.1% 921,314 43.9%
Single, with children 132,518 5.9% 141,982 6.5% 155,143 6.8% 133,555 6.3% 129,485 6.2%
Married to Civilian, no children
371,096 16.6% 301,205 13.7% 306,803 13.5% 274,296 12.9% 267,861 12.8%
Married to Civilian, with children
718,443 32.1% 754,549 34.4% 784,663 34.6% 693,056 32.7% 675,204 32.1%
Dual-military Marriage, no children
54,015 2.4% 65,710 3.0% 63,209 2.8% 58,005 2.7% 59,910 2.9%
Dual-military Marriage, with children
42,060 1.9% 50,602 2.3% 53,256 2.3% 47,273 2.2% 46,554 2.2%
Total 2,235,896 100.0% 2,194,352 100.0% 2,266,689 100.0% 2,120,505 100.0% 2,100,328 100.0% * An additional 24 cases were not reported in 2000. Note: Single includes annulled, divorced, and widowed. Children include minor dependents age 20 or younger and dependents age 22 or younger enrolled as full-time students. Note: Data are presented for the total DoD military force; therefore, DHS Coast Guard Active Duty and DHS Coast Guard Reserve are not included. Note: Percentages may not total to 100 due to rounding. Source: DMDC Active Duty Military Family File (September 2000, 2005, 2010, 2015, 2016); DMDC Reserve Components Family File (September 2000, 2005, 2010, 2015, 2016)

121
SECTION 5
Active Duty Families This section contains information on the family characteristics of Active Duty members, including spouses, children, and other dependents of Active Duty personnel. Special areas of emphasis include family status; spousal age, gender and employment status; and number and age of children and adult dependents. All of the data referring to dependents (spouses [except spouse employment status], children, and other dependents) are extracted from the Defense Enrollment & Eligibility Reporting System (DEERS). Dependents who are not registered in DEERS are excluded; therefore, the data are likely to be underreported.

122
This page is intentionally blank.

Active Duty Families Family Members
2016 Demographics Report
123
Active Duty Members*
(n=1,288,596)43.6%
Family Members**
(n=1,669,941)56.4%
Family Members
5.01 ■ Family Members and Active Duty Members (N=2,958,537) This pie chart depicts the number and percentage of family members and Active Duty members. Family members include spouses, children, and adult dependents of Active Duty members. There are more family members (56.4%) than Active Duty members (43.6%) in the DoD.
** Active Duty members refers to all Active Duty members, not only those with dependents registered in DEERS. ** Family members include spouses, children, and adult dependents. Note: Percentages may not total to 100 due to rounding. Source: DMDC Active Duty Military Family File (September 2016)
5.02 ■ Number, Percentage, and Ratio of Active Duty Members and Family Members by Service Branch
This table presents the number, percentage, and ratio of Active Duty members and family members by Service branch. The Army has the highest proportion of Active Duty members to family members (1 to 1.5) while the Marine Corps has the lowest proportion of Active Duty members to family members (1 to 0.9).
Service Branch
Active Duty Members*
Family Members** Total
Ratio of AD Members to
Family Members N % N % N % Army 471,271 40.1% 704,877 59.9% 1,176,148 100.0% 1 to 1.5 Navy 320,101 45.3% 386,694 54.7% 706,795 100.0% 1 to 1.2 Marine Corps 183,501 52.0% 169,396 48.0% 352,897 100.0% 1 to 0.9 Air Force 313,723 43.4% 408,974 56.6% 722,697 100.0% 1 to 1.3 Total DoD 1,288,596 43.6% 1,669,941 56.4% 2,958,537 100.0% 1 to 1.3
** Active Duty members refers to all Active Duty members, not only those with dependents registered in DEERS. ** Family members include spouses, children, and adult dependents. Note: Percentages may not total to 100 due to rounding. Source: DMDC Active Duty Military Family File (September 2016)

Family Members Active Duty Families
124 2016 Demographics Report
5.03 ■ Number and Percentage of Active Duty Enlisted Members and Officers with Spouses or Dependents by Service Branch
This table presents the number and percentage of Active Duty enlisted members and Active Duty officers with spouses or dependents by Service branch. Over half (54.7%) of Active Duty members have spouses and/or dependents. The Army has the largest percentage of members with spouses and/or dependents (60.8%), followed by the Air Force (55.9%), the Navy (51.9%), and the Marine Corps (41.6%).
Army Navy Marine Corps Air Force Total DoD N % N % N % N % N %
Enlisted 220,546 58.2% 130,052 48.9% 62,290 38.3% 133,966 53.0% 546,854 51.6% Officers 66,056 71.5% 36,138 66.4% 14,120 68.3% 41,445 68.0% 157,759 69.1% Total 286,602 60.8% 166,190 51.9% 76,410 41.6% 175,411 55.9% 704,613 54.7%
Note: Not all military members who are reported as married have a spouse listed as a dependent in DEERS. Source: DMDC Active Duty Military Family File (September 2016)
5.04 ■ Number and Percentage of Active Duty Family Members by Relationship to Member and Service Branch
This table presents the number and percentage of Active Duty family members by relationship to the member and Service branch. Family members include spouses, children, and adult dependents of Active Duty members. Over sixty percent (62.1%) of family members are children.
Service Branch
Spouses Children Adult Dependents* Total N % N % N % N %
Army 252,657 35.8% 446,667 63.4% 5,553 0.8% 704,877 100.0% Navy 147,578 38.2% 237,451 61.4% 1,665 0.4% 386,694 100.0% Marine Corps 71,374 42.1% 97,644 57.6% 378 0.2% 169,396 100.0% Air Force 152,372 37.3% 254,710 62.3% 1,892 0.5% 408,974 100.0% Total DoD 623,981 37.4% 1,036,472 62.1% 9,488 0.6% 1,669,941 100.0%
* Adult dependent refers to a parent, grandparent, former spouse, sibling, disabled older child, and any other individual over the age of 22 claimed as a dependent in the Defense Enrollment Eligibility Reporting System (DEERS).
Note: Not all military members who are reported as married have a spouse listed as a dependent in DEERS. Note: Percentages may not total to 100 due to rounding. Source: DMDC Active Duty Military Family File (September 2016)

Active Duty Families Family Members
2016 Demographics Report
125
5.05 ■ Number and Percentage of Family Members and Active Duty Members Trends: 2000–2016
This table presents the number and percentage of Active Duty members and family members from 2000 to 2016. Both the number and proportion of Active Duty members to family members has been increasing since 2010.
2000 2005 2010 2015 2016 N % N % N % N % N %
Active Duty Members* 1,370,678 41.5% 1,373,534 42.4% 1,417,370 41.7% 1,301,443 42.9% 1,288,596 43.6%
Family Members** 1,934,272 58.5% 1,865,058 57.6% 1,983,236 58.3% 1,728,710 57.1% 1,669,941 56.4%
Total 3,304,950 100.0% 3,238,592 100.0% 3,400,606 100.0% 3,030,153 100.0% 2,958,537 100.0% ** Active Duty members refers to all Active Duty members, not only those with dependents registered in DEERS. ** Family members include spouses, children, and adult dependents. Note: Percentages may not total to 100 due to rounding. Source: DMDC Active Duty Military Family File (September 2000, 2005, 2010, 2015, 2016)
5.06 ■ Percentage of Active Duty Enlisted Members and Officers with Spouses or Dependents Trends: 2000–2016
This chart depicts the percentage of Active Duty enlisted members and Active Duty officers with spouses and/or dependents from 2000 to 2016. The percentage of both Active Duty enlisted members and officers with spouses and/or dependents is the lowest in 2016 that it has been in the past 16 years.
Note: Data are represented ONLY for the years indicated. Data for the years in between are NOT represented in this graph. Note: Not all military members who are reported as married have a spouse listed as a dependent in DEERS. Source: DMDC Active Duty Military Family File (September 2000, 2005, 2010, 2015, 2016)
40%
50%
60%
70%
80%
2000 2005 2010 2015 2016
Enlisted Members (-1.9%) Officers (-2.3%)
0%
⁄⁄

Family Status Active Duty Families
126 2016 Demographics Report
Family Status 5.07 ■ Active Duty Member Parental Status (N=1,288,596) This pie chart displays the distribution of Active Duty members with and without children. Approximately 40 percent (39.9%) of Active Duty members have children.
Note: Children include minor dependents age 20 or younger and dependents age 22 or younger enrolled as full-time students. Note: Percentages may not total to 100 due to rounding. Source: DMDC Active Duty Military Family File (September 2016); DMDC Active Duty Military Personnel Master File (September 2016)
5.08 ■ Active Duty Member Family Status (N=1,288,596) This pie chart depicts the distribution of Active Duty members’ family status. The highest percentage of Active Duty members are single with no children (42.2%). Over half of Active Duty members (57.8%) are married and/or have a child.
Note: Single includes annulled, divorced, and widowed. Children include minor dependents age 20 or younger and dependents age 22 or younger enrolled as full-time students. Note: Percentages may not total to 100 due to rounding. Source: DMDC Active Duty Military Family File (September 2016); DMDC Active Duty Military Personnel Master File (September 2016)
Active Duty members
with children (n=514,021)
39.9%Active Duty members without children
(n=774,575)60.1%
Single, no children
(n=544,178)42.2%
Single, with children
(n=55,360)4.3%
Married to Civilian, no
children (n=179,328)
13.9%Married to
Civilian, with children
(n=425,177)33.0%
Dual-military Marriage, no
children (n=51,069)
4.0%
Dual-military Marriage, with
children (n=33,484)
2.6%

Active Duty Families Family Status
2016 Demographics Report
127
5.09 ■ Active Duty Enlisted Member Family Status by Pay Grade This chart presents the number of Active Duty enlisted personnel by family status and pay grade. The distribution of Active Duty enlisted member family status varies by rank. More junior enlisted members (E1-E4) are single with no children (68.0%), while more mid-level (E5-E6) and senior enlisted members (E7-E9) are married to civilians with children (46.1% and 67.1%, respectively).
Note: Single includes annulled, divorced, and widowed. Children include minor dependents age 20 or younger and dependents age 22 or younger enrolled as full-time students. Source: DMDC Active Duty Military Family File (September 2016)
384,912
87,465
8,74411,54825,069
11,414
80,662
54,588
10,345
63,455
170,083
84,104
20,907 16,6673,5194,524 14,839 7,296
0
50,000
100,000
150,000
200,000
250,000
300,000
350,000
400,000
450,000
E1-E4 (n=566,008) E5-E6 (n=368,711) E7-E9 (n=125,422)
Single,no childrenSingle,with childrenMarried to Civilian,no childrenMarried to Civilian,with childrenDual-military Marriage,no childrenDual-military Marriage,with children
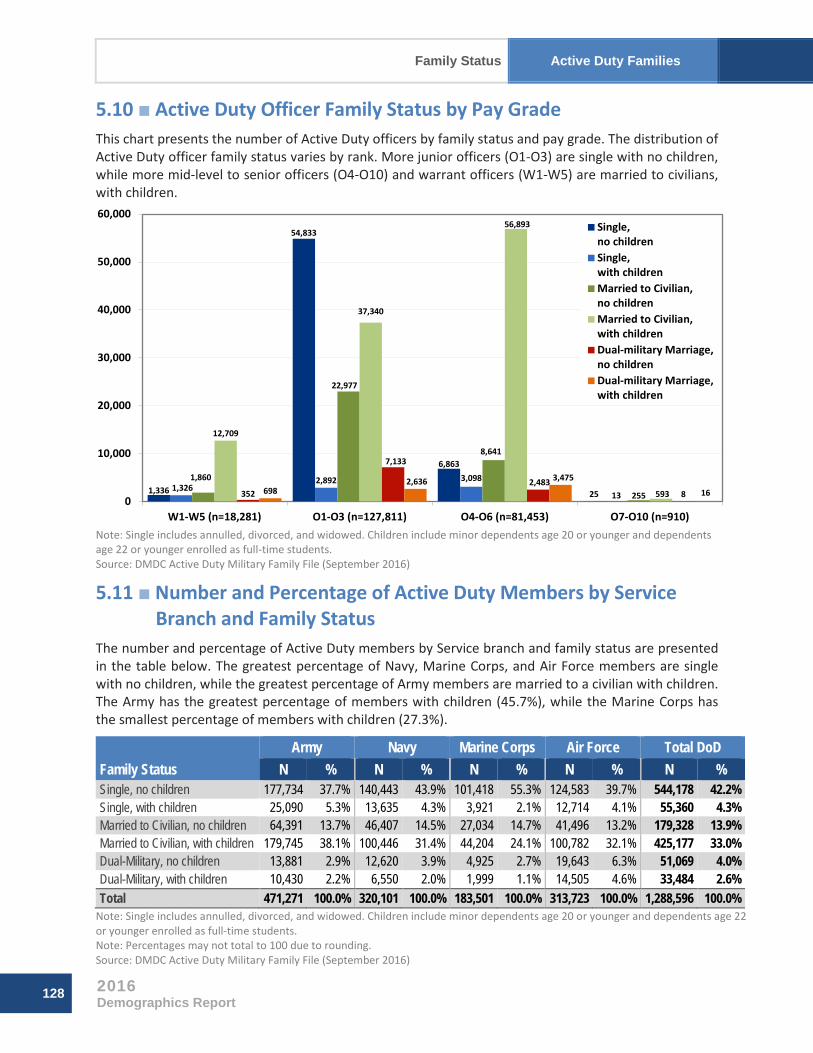
Family Status Active Duty Families
128 2016 Demographics Report
1,336
54,833
6,863
251,326
2,892 3,098
13
1,860
22,977
8,641
255
12,709
37,340
56,893
593352
7,133
2,4838698
2,636 3,475
160
10,000
20,000
30,000
40,000
50,000
60,000
W1-W5 (n=18,281) O1-O3 (n=127,811) O4-O6 (n=81,453) O7-O10 (n=910)
Single,no childrenSingle,with childrenMarried to Civilian,no childrenMarried to Civilian,with childrenDual-military Marriage,no childrenDual-military Marriage,with children
5.10 ■ Active Duty Officer Family Status by Pay Grade This chart presents the number of Active Duty officers by family status and pay grade. The distribution of Active Duty officer family status varies by rank. More junior officers (O1-O3) are single with no children, while more mid-level to senior officers (O4-O10) and warrant officers (W1-W5) are married to civilians, with children.
Note: Single includes annulled, divorced, and widowed. Children include minor dependents age 20 or younger and dependents age 22 or younger enrolled as full-time students. Source: DMDC Active Duty Military Family File (September 2016)
5.11 ■ Number and Percentage of Active Duty Members by Service Branch and Family Status
The number and percentage of Active Duty members by Service branch and family status are presented in the table below. The greatest percentage of Navy, Marine Corps, and Air Force members are single with no children, while the greatest percentage of Army members are married to a civilian with children. The Army has the greatest percentage of members with children (45.7%), while the Marine Corps has the smallest percentage of members with children (27.3%).
Family Status Army Navy Marine Corps Air Force Total DoD
N % N % N % N % N % Single, no children 177,734 37.7% 140,443 43.9% 101,418 55.3% 124,583 39.7% 544,178 42.2% Single, with children 25,090 5.3% 13,635 4.3% 3,921 2.1% 12,714 4.1% 55,360 4.3% Married to Civilian, no children 64,391 13.7% 46,407 14.5% 27,034 14.7% 41,496 13.2% 179,328 13.9% Married to Civilian, with children 179,745 38.1% 100,446 31.4% 44,204 24.1% 100,782 32.1% 425,177 33.0% Dual-Military, no children 13,881 2.9% 12,620 3.9% 4,925 2.7% 19,643 6.3% 51,069 4.0% Dual-Military, with children 10,430 2.2% 6,550 2.0% 1,999 1.1% 14,505 4.6% 33,484 2.6% Total 471,271 100.0% 320,101 100.0% 183,501 100.0% 313,723 100.0% 1,288,596 100.0%
Note: Single includes annulled, divorced, and widowed. Children include minor dependents age 20 or younger and dependents age 22 or younger enrolled as full-time students. Note: Percentages may not total to 100 due to rounding. Source: DMDC Active Duty Military Family File (September 2016)

Active Duty Families Family Status
2016 Demographics Report
129
5.12 ■ Number and Percentage of Active Duty Members by Family Status Trends: 2000–2016
This table presents the number and percentage of Active Duty members by family status from 2000 to 2016. The percentage of Active Duty members with children has been decreasing since 2010. The percentage of Active Duty members who are single decreased from 2000 to 2010 and has increased since 2010.
Family Status 2000* 2005 2010 2015 2016
N % N % N % N % N % Single, no children 559,138 40.8% 549,128 40.0% 542,495 38.3% 535,221 41.1% 544,178 42.2% Single, with children 85,552 6.2% 74,086 5.4% 75,954 5.4% 58,989 4.5% 55,360 4.3% Married to Civilian, no children 145,979 10.7% 176,065 12.8% 196,244 13.8% 182,534 14.0% 179,328 13.9%
Married to Civilian, with children 500,674 36.5% 479,068 34.9% 508,350 35.9% 441,090 33.9% 425,177 33.0%
Dual-military Marriage, no children 44,370 3.2% 55,695 4.1% 53,268 3.8% 49,131 3.8% 51,069 4.0%
Dual-military Marriage, with children 34,941 2.5% 39,492 2.9% 41,059 2.9% 34,478 2.6% 33,484 2.6%
Total 1,370,654 100.0% 1,373,534 100.0% 1,417,370 100.0% 1,301,443 100.00% 1,288,596 100.00% * An additional 24 cases were not reported in 2000. Note: Single includes annulled, divorced, and widowed. Children include minor dependents age 20 or younger and dependents age 22 or younger enrolled as full-time students. Note: Percentages may not total to 100 due to rounding. Source: DMDC Active Duty Military Family File (September 2000, 2005, 2010, 2015, 2016)

Spouses Active Duty Families
130 2016 Demographics Report
Spouses
5.13 ■ Number and Percentage of Active Duty Spouses by Service Branch and Spouse Gender
This table presents the number and percentage of Active Duty spouses by Service branch and spouse gender. Approximately 92 percent (91.9%) of the spouses of Active Duty members are female. The Marine Corps has the highest percentage of spouses who are female (97.0%), whereas the Air Force has the lowest percentage of spouses who are female (88.6%).
Gender of Spouse
Army Navy Marine Corps Air Force Total DoD N % N % N % N % N %
Male 18,034 7.1% 13,318 9.0% 2,133 3.0% 17,350 11.4% 50,835 8.1% Female 234,623 92.9% 134,260 91.0% 69,241 97.0% 135,022 88.6% 573,146 91.9% Total 252,657 100.0% 147,578 100.0% 71,374 100.0% 152,372 100.0% 623,981 100.0%
Note: Percentages may not total to 100 due to rounding. Source: DMDC Active Duty Military Family File (September 2016)
5.14 ■ Age of Spouses of Active Duty Members (N=623,981) This pie chart displays the number and percentage for the ages of Active Duty members’ spouses. There are 623,981 spouses of Active Duty members. Approximately half (50.4%) of the spouses are 30 years of age or younger, while the other half (49.6%) of the spouses are over 30 years of age.
Note: Percentages may not total to 100 due to rounding. Source: DMDC Active Duty Military Family File (September 2016)
25 Years or Younger
(n=156,904)25.1%
26 to 30 Years (n=157,769)
25.3%
31 to 35 Years (n=134,403)
21.5%
36 to 40 Years (n=89,181)
14.3%
41 Years or Older
(n=85,724)13.7%

Active Duty Families Spouses
2016 Demographics Report
131
5.15 ■ Number of Active Duty Enlisted Spouses and Officer Spouses by Service Branch and Spouse Age
This table presents the number of Active Duty enlisted member spouses and Active Duty officer spouses by Service branch and spouse age. Over half (58.0%, N=277,808) of the 478,963 spouses who are married to Active Duty enlisted members are 30 years of age or younger. Almost three-quarters (74.6%, N=108,153) of the 145,018 spouses who are married to Active Duty officers are 31 years of age or older.
Age Army Navy Marine Corps Air Force Total DoD
Enlisted Officers Enlisted Officers Enlisted Officers Enlisted Officers Enlisted Officers 25 Years or Younger 62,514 3,790 29,002 1,373 26,295 880 30,529 2,521 148,340 8,564 26 to 30 Years 50,307 11,243 32,812 5,745 14,437 3,035 31,912 8,278 129,468 28,301 31 to 35 Years 38,051 14,410 25,675 7,571 9,099 3,594 26,241 9,762 99,066 35,337 36 to 40 Years 22,802 12,454 15,575 7,199 4,906 2,824 15,708 7,713 58,991 30,190 41 Years or Older 19,635 17,451 10,870 11,756 3,201 3,103 9,392 10,316 43,098 42,626 Total 193,309 59,348 113,934 33,644 57,938 13,436 113,782 38,590 478,963 145,018
Source: DMDC Active Duty Military Family File (September 2016)
5.16 ■ Average Age of Active Duty Enlisted Spouses and Officer Spouses by Service Branch
This table presents the average age of spouses of Active Duty enlisted members and Active Duty officers by Service branch. The average age of Active Duty enlisted members’ spouses is 30.0 years, while the average age of Active Duty officers’ spouses is 36.5 years. The average age of Marine Corps spouses (29.2 years) is the youngest of all Service branches.
Army Navy Marine Corps Air Force Total DoD
Enlisted 30.1 30.7 27.8 30.4 30.0 Officers 36.4 37.6 35.2 35.9 36.5 Total 31.5 32.3 29.2 31.8 31.5
Source: DMDC Active Duty Military Family File (September 2016)
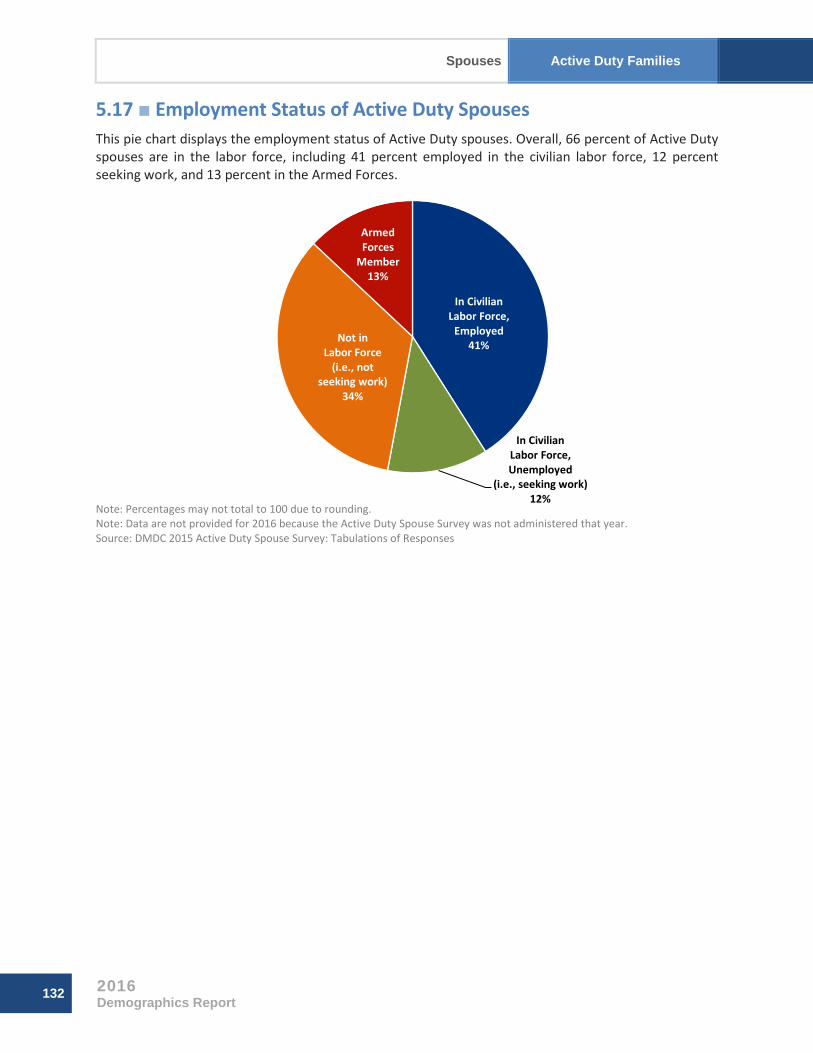
Spouses Active Duty Families
132 2016 Demographics Report
5.17 ■ Employment Status of Active Duty Spouses This pie chart displays the employment status of Active Duty spouses. Overall, 66 percent of Active Duty spouses are in the labor force, including 41 percent employed in the civilian labor force, 12 percent seeking work, and 13 percent in the Armed Forces.
Note: Percentages may not total to 100 due to rounding. Note: Data are not provided for 2016 because the Active Duty Spouse Survey was not administered that year. Source: DMDC 2015 Active Duty Spouse Survey: Tabulations of Responses
In Civilian Labor Force,
Employed41%
In Civilian Labor Force, Unemployed
(i.e., seeking work)12%
Not in Labor Force
(i.e., not seeking work)
34%
Armed Forces
Member 13%

Active Duty Families Spouses
2016 Demographics Report
133
5.18 ■ Percentage of Active Duty Enlisted Spouses and Officer Spouses by Employment Status
This table displays the employment status of spouses of Active Duty enlisted personnel and Active Duty officers. More spouses of enlisted members (66%) are in the labor force than spouses of officers (61%).
Enlisted Officer In Civilian Labor Force, Employed 40% 41% In Civilian Labor Force, Unemployed (i.e., seeking work) 13% 9% Not in the Labor Force (i.e., not seeking work) 33% 39% Armed Forces Member 13% 11%
Note: Percentages may not total to 100 due to rounding. Note: Data are not provided for 2016 because the Active Duty Spouse Survey was not administered that year. Source: DMDC 2015 Active Duty Spouse Survey: Tabulations of Responses
5.19 ■ Percentage of Active Duty Spouses by Service Branch and Employment Status
This table presents the percentage of Active Duty spouses by Service branch and employment status. Compared to the other Service branches, Navy and Marine Corps members have the highest percentage of spouses employed in the civilian labor force (45%), while Air Force members have the highest percentage of spouses who are also a Service member (20%).
Army Navy
Marine Corps
Air Force
Total DoD
In Civilian Labor Force, Employed 37% 45% 45% 40% 41% In Civilian Labor Force, Unemployed (i.e., seeking work) 14% 11% 13% 9% 12% Not in the Labor Force (i.e., not seeking work) 36% 36% 37% 30% 34% Armed Forces Member 12% 9% 5% 20% 13%
Note: Percentages may not total to 100 due to rounding. Note: Data are not provided for 2016 because the Active Duty Spouse Survey was not administered that year. Source: DMDC 2015 Active Duty Spouse Survey: Tabulations of Responses
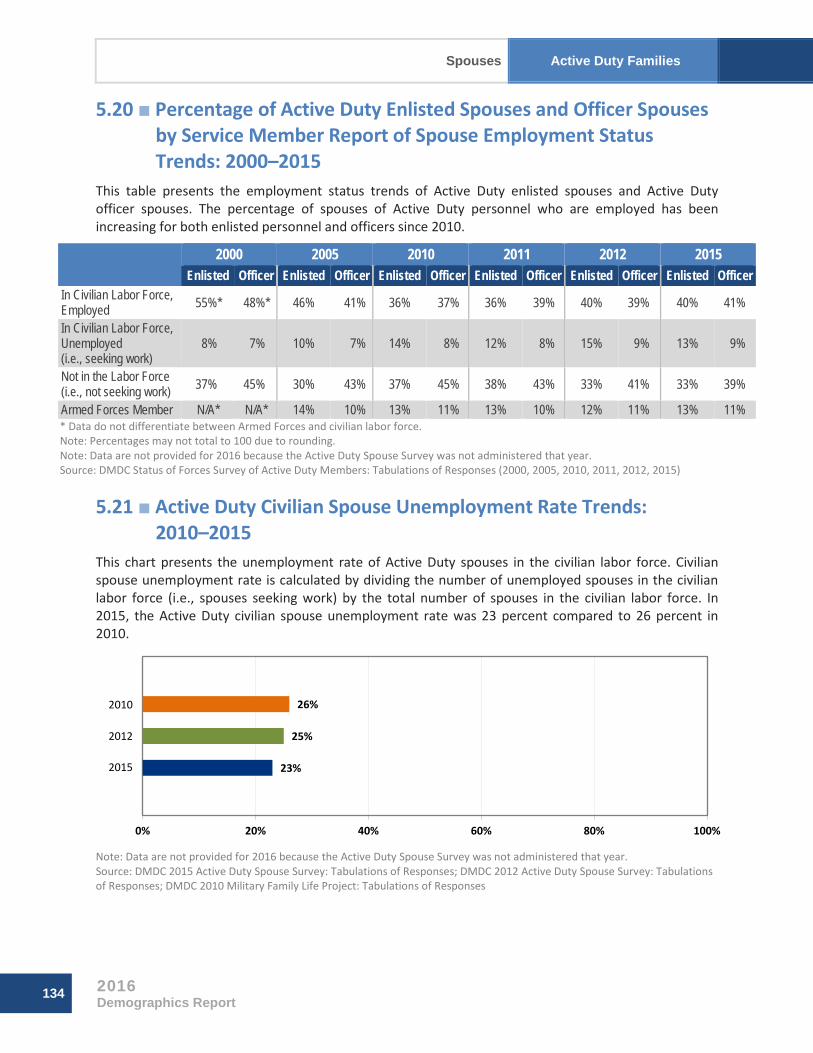
Spouses Active Duty Families
134 2016 Demographics Report
5.20 ■ Percentage of Active Duty Enlisted Spouses and Officer Spouses by Service Member Report of Spouse Employment Status Trends: 2000–2015
This table presents the employment status trends of Active Duty enlisted spouses and Active Duty officer spouses. The percentage of spouses of Active Duty personnel who are employed has been increasing for both enlisted personnel and officers since 2010.
2000 2005 2010 2011 2012 2015 Enlisted Officer Enlisted Officer Enlisted Officer Enlisted Officer Enlisted Officer Enlisted Officer
In Civilian Labor Force, Employed 55%* 48%* 46% 41% 36% 37% 36% 39% 40% 39% 40% 41%
In Civilian Labor Force, Unemployed (i.e., seeking work)
8% 7% 10% 7% 14% 8% 12% 8% 15% 9% 13% 9%
Not in the Labor Force (i.e., not seeking work) 37% 45% 30% 43% 37% 45% 38% 43% 33% 41% 33% 39%
Armed Forces Member N/A* N/A* 14% 10% 13% 11% 13% 10% 12% 11% 13% 11% * Data do not differentiate between Armed Forces and civilian labor force. Note: Percentages may not total to 100 due to rounding. Note: Data are not provided for 2016 because the Active Duty Spouse Survey was not administered that year. Source: DMDC Status of Forces Survey of Active Duty Members: Tabulations of Responses (2000, 2005, 2010, 2011, 2012, 2015)
5.21 ■ Active Duty Civilian Spouse Unemployment Rate Trends: 2010–2015
This chart presents the unemployment rate of Active Duty spouses in the civilian labor force. Civilian spouse unemployment rate is calculated by dividing the number of unemployed spouses in the civilian labor force (i.e., spouses seeking work) by the total number of spouses in the civilian labor force. In 2015, the Active Duty civilian spouse unemployment rate was 23 percent compared to 26 percent in 2010.
Note: Data are not provided for 2016 because the Active Duty Spouse Survey was not administered that year. Source: DMDC 2015 Active Duty Spouse Survey: Tabulations of Responses; DMDC 2012 Active Duty Spouse Survey: Tabulations of Responses; DMDC 2010 Military Family Life Project: Tabulations of Responses
23%
25%
26%
0% 20% 40% 60% 80% 100%
2010
2012
2015

Active Duty Families Dependents
2016 Demographics Report
135
Dependents 5.22 ■ Average Number of Children and Total Dependents of Active
Duty Members This table presents the average number of children and total dependents of Active Duty members. Of Active Duty members who have children, the average number of children is two (2.0). Of Active Duty members who have dependents, the average number of dependents is almost two and a half (2.4).
Number of Children*
Number of Total Dependents**
Average across all Active Duty 0.8 1.3 Average for Active Duty who have children 2.0 2.9 Average for Active Duty who have dependents 1.5 2.4
** Children include minor dependents age 20 or younger and dependents age 22 or younger enrolled as full-time students. ** Dependents include spouses, children, adult dependents, and other dependents under age 21 who are not spouses or children. Source: DMDC Active Duty Military Family File (September 2016)
5.23 ■ Number and Percentage of Active Duty Members with Children by Service Branch and Pay Grade
This table presents the number and percentage of Active Duty members with children by Service branch and pay grade. Across the DoD, pay grades E7-E9 (82.0%) and W1-W5 (80.6%) have the highest percentage of members with children.
Member Pay Grade
Army Navy Marine Corps Air Force Total DoD N % N % N % N % N %
E1-E4 43,067 20.5% 14,027 11.3% 7,575 6.9% 14,858 12.2% 79,527 14.1% E5-E6 78,910 66.3% 54,277 48.9% 20,299 51.2% 56,505 57.0% 209,991 57.0% E7-E9 41,029 83.0% 24,566 80.8% 11,492 84.6% 25,727 80.4% 102,814 82.0% W1-W5 11,599 79.6% 1,378 82.7% 1,756 86.1% N/A* N/A* 14,733 80.6% O1-O3 17,817 36.6% 10,594 33.0% 3,739 30.8% 10,718 30.7% 42,868 33.5% O4-O6 22,621 78.3% 15,653 76.8% 5,209 81.5% 19,983 77.4% 63,466 77.9% O7-O10 222 69.6% 136 65.4% 54 62.8% 210 70.7% 622 68.4% Total 215,265 45.7% 120,631 37.7% 50,124 27.3% 128,001 40.8% 514,021 39.9%
* The Air Force does not have warrant officers. Note: Children include minor dependents age 20 or younger and dependents age 22 or younger enrolled as full-time students. Source: DMDC Active Duty Military Family File (September 2016)
5.24 ■ Average Age of Active Duty Members at Birth of First Child by Service Branch
This table presents the average age of Active Duty members at the birth of their first child by Service branch. The average age of Active Duty members at the birth of their first child varies across the Service branches, with the Air Force having the highest average age (26.8 years) and the Marine Corps having the lowest average age (24.0 years).
Service Branch Average Years of Age Army 25.4 Navy 26.5 Marine Corps 24.0 Air Force 26.8 Total DoD 25.8
Source: DMDC Active Duty Military Family File (September 2016)

Dependents Active Duty Families
136 2016 Demographics Report
5.25 ■ Number of Active Duty Male and Female First-Time Parents by Service Branch and Age at Birth of First Child
This table presents the number of Active Duty male and female first-time parents by Service branch and age at the birth of their first child. The number of Active Duty members who had their first child in 2016 is 32,830. Almost half (49.4%) of the members were between the ages of 20 and 25 when they had their first child.
Age Army Navy Marine Corps Air Force Total DoD
Male Female Male Female Male Female Male Female Male Female 17 2 1 0 0 3 0 1 0 6 1 18 126 20 18 9 86 7 13 3 243 39 19 427 159 106 104 247 60 103 31 883 354 20 810 257 260 188 491 100 208 85 1,769 630 21 919 244 367 239 580 76 340 92 2,206 651 22 980 201 402 200 523 60 447 105 2,352 566 23 964 188 420 203 387 40 512 89 2,283 520 24 860 164 481 138 328 34 540 121 2,209 457 25 791 140 547 121 275 25 548 118 2,161 404 26 700 107 521 115 235 16 524 95 1,980 333 27 637 110 473 86 222 13 462 87 1,794 296 28 535 84 414 79 205 17 468 80 1,622 260 29 561 83 400 65 130 8 426 76 1,517 232 30 430 75 373 76 139 6 393 69 1,335 226 31 344 73 275 63 79 6 333 85 1,031 227 32 301 45 253 44 73 6 268 50 895 145 33 188 40 183 50 59 2 198 39 628 131 34 161 33 143 16 36 2 129 42 469 93 35 148 34 112 28 33 3 119 20 412 85 36 122 18 101 16 33 4 89 20 345 58 37 87 12 79 12 15 0 61 12 242 36 38 54 9 58 7 19 0 43 12 174 28 39 44 12 43 6 12 1 30 6 129 25 40 37 5 32 7 10 1 16 7 95 20 41 25 2 18 1 2 2 10 0 55 5 42 20 4 10 4 5 0 8 5 43 13 43 15 3 10 1 5 0 4 1 34 5 44 6 1 3 0 2 1 3 1 14 3 45 9 1 4 0 4 0 4 0 21 1 Over 45 21 2 8 0 2 1 5 0 36 3 Subtotal 10,324 2,127 6,114 1,878 4,240 491 6,305 1,351 26,983 5,847 Total 12,451 7,992 4,731 7,656 32,830
Source: DMDC Active Duty Military Family File (September 2016)

Active Duty Families Dependents
2016 Demographics Report
137
5.26 ■ Number of Active Duty Members in Dual-Military Marriages with Children by Service Branch and Pay Grade
This table presents the number of Active Duty members in dual-military marriages with children by Service branch and pay grade. Of all Active Duty members, 33,484 (2.6%) are married to another Active Duty member or to a Reserve or Guard member and have children. The Air Force has the highest number of members who are in dual-military marriages with children (14,505).
Pay Grade Army Navy Marine Corps Air Force Total DoD E1-E4 1,638 1,156 441 1,289 4,524 E5-E6 3,782 3,021 849 7,187 14,839 E7-E9 2,294 1,235 408 3,359 7,296 W1-W5 556 68 74 N/A* 698 O1-O3 986 504 99 1,047 2,636 O4-O6 1,170 566 128 1,611 3,475 O7-O10 4 0 0 12 16 Total 10,430 6,550 1,999 14,505 33,484
* The Air Force does not have warrant officers. Source: DMDC Active Duty Military Family File (September 2016)
5.27 ■ Number of Single Parents on Active Duty by Gender and Service Branch This table presents the number of single parent Active Duty members by gender and Service branch. Approximately four percent (4.3% or 55,360) of Active Duty members are single parents.
Service Branch Male Female Total Army 17,043 8,047 25,090 Navy 8,322 5,313 13,635 Marine Corps 3,010 911 3,921 Air Force 7,578 5,136 12,714 Total DoD 35,953 19,407 55,360
Note: A parent is a member who has a child registered in DEERS. Source: DMDC Active Duty Military Family File (September 2016)
5.28 ■ Percentage of Single Parents on Active Duty by Service Branch and Pay Grade (N=55,360)
This table presents the percentage of Active Duty members who are single parents by Service branch and pay grade. The Army has the highest percentage of single parent members (5.3%) while the Marine Corps has the lowest percentage (2.1%). Across Service branches, the E7-E9 pay grade has the highest percentage (9.1%) of single parent members, while the O7-O10 pay grade has the lowest percentage (1.4%) of single parent members.
Pay Grade Army Navy Marine Corps Air Force Total DoD E1-E4 3.4% 1.7% 0.6% 1.4% 2.0% E5-E6 7.6% 6.6% 4.4% 7.0% 6.8% E7-E9 10.2% 8.6% 7.6% 8.5% 9.1% W1-W5 7.3% 7.4% 6.5% N/A* 7.3% O1-O3 3.1% 2.3% 1.2% 1.5% 2.3% O4-O6 4.7% 3.6% 3.0% 3.1% 3.8% O7-O10 1.6% 1.4% 0.0% 1.7% 1.4% Total 5.3% 4.3% 2.1% 4.1% 4.3%
* The Air Force does not have warrant officers. Note: A parent is a member who has a child registered in DEERS. Source: DMDC Active Duty Military Family File (September 2016)

Dependents Active Duty Families
138 2016 Demographics Report
5.29 ■ Number of Children of Active Duty Members by Service Branch and Child Age
This table presents the number of Active Duty members’ children by Service branch and child’s age. Almost half (48.2%), or 499,575, of the 1,036,472 children of Active Duty members are six years of age or younger.
Age Army Navy Marine Corps Air Force Total DoD 0 30,404 17,341 8,834 18,446 75,025 1 32,542 18,438 9,033 19,740 79,753 2 31,109 17,565 8,114 19,154 75,942 3 29,426 16,179 7,474 18,171 71,250 4 28,909 15,458 6,933 17,516 68,816 5 27,788 15,021 6,638 16,846 66,293 6 26,213 14,393 6,091 15,799 62,496 7 25,318 13,919 5,632 14,822 59,691 8 24,180 13,101 5,202 14,398 56,881 9 23,499 12,812 4,914 13,888 55,113 10 21,376 11,687 4,292 12,499 49,854 11 20,124 10,430 3,646 11,312 45,512 12 17,486 9,649 3,561 10,740 41,436 13 17,242 8,923 3,107 9,276 38,548 14 16,155 7,927 2,744 8,438 35,264 15 15,000 7,007 2,481 7,433 31,921 16 14,058 6,475 2,282 6,543 29,358 17 12,600 5,700 1,948 5,657 25,905 18 11,231 5,038 1,623 4,917 22,809 19 9,273 4,377 1,393 3,846 18,889 20 8,029 3,655 1,069 3,063 15,816 21* 2,635 1,319 369 1,242 5,565 22* 2,070 1,037 264 964 4,335 Total 446,667 237,451 97,644 254,710 1,036,472
* Children ages 21 to 22 must be enrolled as full-time students in order to qualify as dependents. Source: DMDC Active Duty Military Family File (September 2016)

Active Duty Families Dependents
2016 Demographics Report
139
5.30 ■ Age of Children of Active Duty Members (N=1,036,472) This pie chart depicts the number and percentage of children of Active Duty members by child’s age. The largest percentage of minor dependents of Active Duty members is between birth and five years of age (42.2%) followed by children who are 6 to 11 years of age (31.8%).
Note: Children ages 21 to 22 must be enrolled as full-time students in order to qualify as dependents. Note: Percentages may not total to 100 due to rounding. Source: DMDC Active Duty Military Family File (September 2016)
5.31 ■ Number of Male and Female Children of Active Duty Members by Child Age and Member Pay Grade: Birth to Kindergarten
This table presents the number of birth to kindergarten-aged children (i.e., 0 to 5 years of age) of Active Duty members, characterized by the child’s age and gender and by the member’s pay grade. Of the 437,079 children in this age group, 52.8 percent are 2 or younger, while 47.2 percent are between 3 and 5 years of age.
Member Pay Grade Ages 0-2 Ages 3-5 Total
Male Female Male Female Male Female E1-E4 31,227 29,712 15,405 14,805 46,632 44,517 E5-E6 51,065 48,520 51,119 48,500 102,184 97,020 E7-E9 10,681 10,320 15,199 14,582 25,880 24,902 W1-W5 1,854 1,724 2,482 2,219 4,336 3,943 O1-O3 14,379 13,712 9,905 9,346 24,284 23,058 O4-O6 8,990 8,530 11,783 10,995 20,773 19,525 O7-O10 3 3 10 9 13 12 Subtotal 118,199 112,521 105,903 100,456 224,102 212,977 Total 230,720 206,359 437,079
Source: DMDC Active Duty Military Family File (September 2016)
0 to 5 Years (n=437,079)
42.2%
6 to 11 Years (n=329,547)
31.8%
12 to 18 Years (n=225,241)
21.7%
19 to 22 Years
(n=44,605)4.3%

Dependents Active Duty Families
140 2016 Demographics Report
5.32 ■ Number of Male and Female Children of Active Duty Members by Child Age and Member Pay Grade: Primary and Middle School
This table presents the number of primary and middle school-aged children (i.e., 6 to 14 years of age) of Active Duty members, characterized by the child’s age and gender and by the member’s pay grade. Of the 444,795 children in this age group, 74.1 percent are between 6 and 11 years of age, while 25.9 percent are between 12 and 14 years of age.
Member Pay Grade Ages 6-11 Ages 12-14 Total
Male Female Male Female Male Female E1-E4 10,944 11,078 1,556 1,639 12,500 12,717 E5-E6 73,892 71,469 19,862 19,000 93,754 90,469 E7-E9 39,919 38,499 20,321 19,692 60,240 58,191 W1-W5 5,718 5,383 2,553 2,523 8,271 7,906 O1-O3 11,662 10,980 3,432 3,340 15,094 14,320 O4 -O6 25,476 24,409 10,822 10,350 36,298 34,759 O7-O10 57 61 79 79 136 140 Subtotal 167,668 161,879 58,625 56,623 226,293 218,502 Total 329,547 115,248 444,795
Source: DMDC Active Duty Military Family File (September 2016)
5.33 ■ Number of Male and Female Children of Active Duty Members by Child Age and Sponsor Pay Grade: High School and Above
This table presents the number of children of Active Duty members who are high school age and above (i.e., 15 to 22 years of age), characterized by the child’s age and gender and by the member’s pay grade. Of the 154,598 children in this age group, 71.1 percent are between 15 and 18 years of age and 28.9 percent are between 19 and 22 years of age.
Member Pay Grade Ages 15-18 Ages 19-22 Total
Male Female Male Female Male Female E1-E4 1,079 1,083 277 282 1,356 1,365 E5-E6 14,650 14,411 4,015 4,247 18,665 18,658 E7-E9 22,757 22,010 9,072 9,639 31,829 31,649 W1-W5 3,020 2,972 1,347 1,403 4,367 4,375 O1-O3 3,045 2,966 1,112 1,142 4,157 4,108 O4-O6 10,906 10,737 5,691 5,946 16,597 16,683 O7-O10 163 194 206 226 369 420 Subtotal 55,620 54,373 21,720 22,885 77,340 77,258 Total 109,993 44,605 154,598
Note: Children ages 21 to 22 must be enrolled as full-time students in order to qualify as dependents. Source: DMDC Active Duty Military Family File (September 2016)

Active Duty Families Dependents
2016 Demographics Report
141
5.34 ■ Age of Adult Dependents of Active Duty Members (N=9,487) This pie chart presents the number and percentage of adult dependents of Active Duty members by age. Adult dependent refers to a parent, grandparent, former spouse, sibling, disabled older child, or any other individual claimed as a dependent in the Defense Enrollment Eligibility Reporting System (DEERS) that is over 22 years of age. Over 30 percent (32.3%) of adult dependents of Active Duty members are between 23 and 50 years of age, while almost 70 percent (67.7%) of the adult dependents are 51 years of age or older.
Note: Percentages may not total to 100 due to rounding. Note: Excludes 1 case where age was not reported. Source: DMDC Active Duty Military Family File (September 2016)
5.35 ■ Number of Male and Female Adult Dependents of Active Duty Members by Dependent Age and Sponsor Pay Grade
This table displays the number of male and female adult dependents of Active Duty members by dependent age and sponsor pay grade. Of the 9,487 adult dependents, over half (56.6%), or 5,367, are female and over 50 years of age.
Sponsor Pay Grade
Ages 23-40 Ages 41-50 Ages 51-62 Ages 63 and Older Total Male Female Male Female Male Female Male Female Male Female
E1-E4 1 13 21 154 99 320 39 94 160 581 E5-E6 78 88 13 228 200 1,378 211 690 502 2,384 E7-E9 325 421 1 12 56 599 139 706 521 1,738 W1-W5 83 108 0 7 14 132 33 146 130 393 O1-O3 47 59 4 22 50 318 85 286 186 685 O4-O6 591 667 0 3 17 166 111 530 719 1,366 O7-O10 52 68 0 0 0 0 0 2 52 70 Subtotal 1,177 1,424 39 426 436 2,913 618 2,454 2,270 7,217 Total 2,601 465 3,349 3,072 9,487
Note: Excludes 1 case where age was not reported. Source: DMDC Active Duty Military Family File (September 2016)
23 to 40 Years (n=2,601)
27.4%
41 to 50 Years (n=465)
4.9%
51 to 62 Years (n=3,349)
35.3%
63+ Years (n=3,072)
32.4%

Dependents Active Duty Families
142 2016 Demographics Report
5.36 ■ Number of Single Parents on Active Duty by Service Branch and Gender Trends: 2000–2016
This table presents the number of single parent Active Duty members by Service branch and gender from 2000 to 2016. The highest total number of single parent members occurred in 2000 with 85,552. The number of single male and female parent members has been decreasing since 2010.
Service Branch 2000 2005 2010 2015 2016
Male Female Male Female Male Female Male Female Male Female Army 25,821 10,010 23,902 9,610 26,898 11,112 18,977 8,793 17,043 8,047 Navy 20,526 6,135 12,757 6,175 10,260 5,848 8,710 5,317 8,322 5,313 Marine Corps 4,625 950 3,904 910 4,767 1,263 3,219 914 3,010 911 Air Force 11,735 5,750 10,445 6,383 9,566 6,240 7,744 5,315 7,578 5,136 Total DoD 62,707 22,845 51,008 23,078 51,491 24,463 38,650 20,339 35,953 19,407 Note: A parent is a member who has a child registered in DEERS. Source: DMDC Active Duty Military Family File (September 2000, 2005, 2010, 2015, 2016)
5.37 ■ Number and Percentage of Active Duty Children by Child Age Trends: 2000–2016
This table displays the number and percentage trends of children of Active Duty members by child’s age. The number of children across all age groups has been decreasing since 2010. The highest percentage of Active Duty children has consistently been ages 0 to 5 years over the past 16 years.
2000 2005 2010 2015 2016
N % N % N % N % N % 0 to 5 Years 478,180 38.9% 469,129 39.8% 527,670 42.3% 452,119 42.0% 437,079 42.2% 6 to 11 Years 414,899 33.8% 375,000 31.9% 382,823 30.7% 340,327 31.6% 329,547 31.8% 12 to 18 Years 291,955 23.8% 286,795 24.4% 284,658 22.8% 236,954 22.0% 225,241 21.7% 19 to 22 Years 44,214 3.6% 46,266 3.9% 52,723 4.2% 47,403 4.4% 44,605 4.3% Total 1,229,248 100.0% 1,177,190 100.0% 1,247,874 100.0% 1,076,803 100.0% 1,036,472 100.0% Note: Children ages 21 to 22 must be enrolled as full-time students in order to qualify as dependents. Note: Percentages may not total to 100 due to rounding. Source: DMDC Active Duty Military Family File (September 2000, 2005, 2010, 2015, 2016)
5.38 ■ Number and Percentage of Active Duty Adult Dependents by Dependent Age Trends: 2000–2016
This table presents the number and percentage trends of adult dependents of Active Duty members by dependent’s age. Although the majority of adult dependents across all years are 51 years or older, the percentage of adult dependents who are 23 to 50 years has grown from 10.8% in 2000 to 32.3% in 2016.
2000 2005 2010 2015 2016 N % N % N % N % N %
23 to 40 Years 47 0.5% 20 0.2% 417 4.4% 3,012 29.3% 2,601 27.4% 41 to 50 Years 984 10.3% 965 11.9% 937 9.9% 522 5.1% 465 4.9% 51 to 62 Years 4,235 44.3% 3,792 46.6% 4,545 47.9% 3,524 34.3% 3,349 35.3% 63+ Years 4,288 44.9% 3,353 41.2% 3,586 37.8% 3,210 31.3% 3,072 32.4% Total 9,554 100.0% 8,130 100.0% 9,485 100.0% 10,268 100.0% 9,487 100.0% Note: Percentages may not total to 100 due to rounding. Source: DMDC Active Duty Military Family File (September 2000, 2005, 2010, 2015, 2016)
143
SECTION 6
Reserve and Guard Families This section contains information on family characteristics of Selected Reserve members including the DoD Reserve and Guard components as well as the DHS Coast Guard Reserve. Special areas of interest include family status, spousal age and gender, and number and age of children and adult dependents. All of the data referring to dependents (spouses, children, and other dependents) are extracted from the Defense Enrollment & Eligibility Reporting System (DEERS). Dependents who are not registered in DEERS are excluded; therefore, the data are likely to be underreported.

144
This page is intentionally blank.

Reserve and Guard Families Family Members
2016 Demographics Report
145
Selected Reserve Members* (n=818,305)
43.6%
Family Members**
(n=1,059,220)56.4%
Family Members 6.01 ■ Family Members and Selected Reserve Members (N=1,877,525) This pie chart depicts the total number of Selected Reserve members and their family members. Family members include spouses, children, and/or other dependents of Selected Reserve members. Overall, there are more family members (56.4%) than Selected Reserve members (43.6%).
** Selected Reserve members refers to all Selected Reserve members, not only those with dependents registered in DEERS. ** Family members include spouses, children, adult dependents, and other dependents under age 21 who are not spouses or children. Note: Percentages may not total to 100 due to rounding. Source: DMDC Reserve Components Family File (September 2016)
6.02 ■ Number, Percentage, and Ratio of Selected Reserve Members and Family Members by Reserve Component
This table presents the number, percentage, and ratio of Selected Reserve members and family members for each Reserve component. The Air National Guard and Air Force Reserve have the highest proportion of Selected Reserve members to family members (1 to 1.6), while the Marine Corps Reserve has the lowest proportion of Selected Reserve members to family members (1 to 0.6).
Reserve Component
Selected Reserve Members* Family Members** Total
Ratio of Sel Res Members to
Family Members N % N % N % Army National Guard 341,589 45.6% 406,870 54.4% 748,459 100.0% 1 to 1.2 Army Reserve 198,395 43.9% 253,570 56.1% 451,965 100.0% 1 to 1.3 Navy Reserve 57,980 39.4% 89,262 60.6% 147,242 100.0% 1 to 1.5 Marine Corps Reserve 38,517 61.1% 24,570 38.9% 63,087 100.0% 1 to 0.6 Air National Guard 105,887 38.9% 166,464 61.1% 272,351 100.0% 1 to 1.6 Air Force Reserve 69,364 39.1% 108,245 60.9% 177,609 100.0% 1 to 1.6 Total DoD 811,732 43.6% 1,048,981 56.4% 1,860,713 100.0% 1 to 1.3 Coast Guard Reserve 6,573 39.1% 10,239 60.9% 16,812 100.0% 1 to 1.6 Total Sel Res 818,305 43.6% 1,059,220 56.4% 1,877,525 100.0% 1 to 1.3
** Selected Reserve members refers to all Selected Reserve members, not only those with dependents registered in DEERS. ** Family members include spouses, children, adult dependents, and other dependents under age 21 who are not spouses or children. Note: Percentages may not total to 100 due to rounding. Source: DMDC Reserve Components Family File (September 2016)

Family Members Reserve and Guard Families
146 2016 Demographics Report
6.03 ■ Number and Percentage of Selected Reserve Enlisted Members and Officers with Spouses or Dependents by Reserve Component
This table presents the number and percentage of Selected Reserve enlisted members and officers with spouses and/or dependents by Reserve component. Over half (53.4%) of the Selected Reserve have spouses and/or dependents. For every Reserve component, a higher percentage of Selected Reserve officers have spouses and/or dependents than Selected Reserve enlisted members.
Reserve Component Enlisted Officers Total
N % N % N % Army National Guard 134,580 45.5% 32,803 72.1% 167,383 49.0% Army Reserve 79,124 49.1% 26,049 69.7% 105,173 53.0% Navy Reserve 25,284 57.9% 11,172 78.1% 36,456 62.9% Marine Corps Reserve 7,270 21.3% 3,141 72.7% 10,411 27.0% Air National Guard 55,337 61.0% 12,843 84.3% 68,180 64.4% Air Force Reserve 33,683 60.7% 11,492 82.6% 45,175 65.1% Total DoD 335,278 49.2% 97,500 74.6% 432,778 53.3% Coast Guard Reserve 3,429 62.8% 910 82.0% 4,339 66.0% Total Sel Res 338,707 49.3% 98,410 74.7% 437,117 53.4%
Note: Not all military members who are reported as married have a spouse listed as a dependent in DEERS. Source: DMDC Reserve Components Family File (September 2016)
6.04 ■ Number and Percentage of Selected Reserve Family Members by Relationship to Member and Reserve Component
This table presents the number and percentage of Selected Reserve family members by relationship to member and Reserve component. Family members include spouses, children, and/or other dependents of Selected Reserve members. Over sixty percent (64.7%) of family members are children.
Reserve Component Spouses Children
Other Dependents* Total
N % N % N % N % Army National Guard 140,244 34.5% 265,982 65.4% 644 0.2% 406,870 100.0% Army Reserve 88,486 34.9% 164,171 64.7% 913 0.4% 253,570 100.0% Navy Reserve 30,969 34.7% 58,115 65.1% 178 0.2% 89,262 100.0% Marine Corps Reserve 9,474 38.6% 15,071 61.3% 25 0.1% 24,570 100.0% Air National Guard 59,796 35.9% 106,430 63.9% 238 0.1% 166,464 100.0% Air Force Reserve 38,737 35.8% 69,278 64.0% 230 0.2% 108,245 100.0% Total DoD 367,706 35.1% 679,047 64.7% 2,228 0.2% 1,048,981 100.0% Coast Guard Reserve 3,922 38.3% 6,297 61.5% 20 0.2% 10,239 100.0% Total Sel Res 371,628 35.1% 685,344 64.7% 2,248 0.2% 1,059,220 100.0%
* Other dependents include adult dependents and other dependents under age 21 who are not spouses or children. Note: Not all military members who are reported as married have a spouse listed as a dependent in DEERS. Note: Percentages may not total to 100 due to rounding. Source: DMDC Reserve Components Family File (September 2016)

Reserve and Guard Families Family Members
2016 Demographics Report
147
6.05 ■ Number and Percentage of Selected Reserve Members and Family Members Trends: 2000–2016
This table presents the number and percentage trends of Selected Reserve members and family members from 2000 to 2016. While the number of Selected Reserve members in 2016 is less than the number of Selected Reserve members in 2000, the number of family members is greater compared to 2000. In 2000, Selected Reserve members and family members each constituted about 50 percent of the population, but since 2005, Selected Reserve members constitute 42 to 44 percent of the population.
2000 2005 2010 2015 2016
N % N % N % N % N % Selected Reserve Members* 873,207 49.7% 829,005 42.1% 857,261 42.5% 826,106 43.7% 818,305 43.6%
Family Members** 883,272 50.3% 1,141,735 57.9% 1,161,631 57.5% 1,064,795 56.3% 1,059,220 56.4% Total 1,756,479 100.0% 1,970,740 100.0% 2,018,892 100.0% 1,890,901 100.0% 1,877,525 100.0%
** Selected Reserve members refers to all Selected Reserve members, not only those with dependents registered in DEERS. ** Family members include spouses, children, adult dependents, and other dependents under age 21 who are not spouses or children. Note: Percentages may not total to 100 due to rounding. Source: DMDC Reserve Components Family File (September 2000, 2005, 2010, 2015, 2016)
6.06 ■ Percentage of Selected Reserve Enlisted Members and Officers with Spouses or Dependents Trends: 2000–2016
This graph presents the percentage of Selected Reserve officers and enlisted members with spouses and/or dependents from 2000-2016. The percentage of enlisted members and officers with spouses and/or dependents has decreased since 2005.
Note: Data are represented ONLY for the years indicated. Data for the years in between are NOT represented in this graph. Note: Not all military members who are reported as married have a spouse listed as a dependent in DEERS. Source: DMDC Reserve Components Family File (September 2000, 2005, 2010, 2015, 2016)
0%
20%
40%
60%
80%
100%
2000 2005 2010 2015 2016
Enlisted Members (3.1%) Officers (8.1%)

Family Status Reserve and Guard Families
148 2016 Demographics Report
Family Status 6.07 ■ Selected Reserve Member Parental Status (N=818,305) This pie chart presents the distribution of Selected Reserve members with and without children. Overall, over 40 percent (41.6%) of Selected Reserve members have children.
Note: Children include minor dependents age 20 or younger and dependents age 22 or younger enrolled as full-time students. Note: Percentages may not total to 100 due to rounding. Source: DMDC Reserve Components Family File (September 2016); DMDC Reserve Components Common Personnel Data System (September 2016)
6.08 ■ Selected Reserve Member Family Status (N=818,305) This pie chart presents the distribution of Selected Reserve members by family status. Over 30 percent (30.9%) of Selected Reserve members are married to a civilian and have children, while over 45 percent (46.3%) are single with no children.
Note: Single includes annulled, divorced, and widowed. Children include minor dependents age 20 or younger and dependents age 22 or younger enrolled as full-time students. Note: Percentages may not total to 100 due to rounding. Source: DMDC Reserve Components Family File (September 2016); DMDC Reserve Components Common Personnel Data System (September 2016)
Selected Reserve
members with children (n=340,525)
41.6%
Selected Reserve
members without children
(n=477,780)58.4%
Single, no children
(n=379,185)46.3%
Single, with children
(n=74,583)9.1%
Married to Civilian, no
children (n=89,631)
11.0%
Married to Civilian, with
children (n=252,715)
30.9%
Dual-military Marriage, no
children (n=8,964)
1.1%
Dual-military Marriage, with
children (n=13,227)
1.6%

Reserve and Guard Families Family Status
2016 Demographics Report
149
6.09 ■ Selected Reserve Enlisted Member Family Status by Pay Grade This chart presents the distribution of Selected Reserve enlisted members’ family status by pay grade. More than 70 percent (74.3%) of junior enlisted members (E1-E4) report being single with no children, while the largest percentage of mid-level (E5-E6) and senior enlisted members (E7-E9) report being married to civilians with children (39.5% and 55.5%, respectively).
Note: Single includes annulled, divorced, and widowed. Children include minor dependents age 20 or younger and dependents age 22 or younger enrolled as full-time students. Source: DMDC Reserve Components Family File (September 2016); DMDC Reserve Components Common Personnel Data System (September 2016)
254,960
80,715
11,09222,22732,396
10,968
24,871 30,88414,672
36,916
99,097
51,521
2,491 3,000 1,1591,522 4,711 3,358
0
50,000
100,000
150,000
200,000
250,000
300,000
E1-E4 (n=342,987) E5-E6 (n=250,803) E7-E9 (n=92,770)
Single,no childrenSingle,with childrenMarried to Civilian,no childrenMarried to Civilian,with childrenDual-military Marriage,no childrenDual-military Marriage,with children

Family Status Reserve and Guard Families
150 2016 Demographics Report
6.10 ■ Selected Reserve Officer Family Status by Pay Grade This chart presents the distribution of Selected Reserve officer family status by pay grade. More than half of the Selected Reserve officers in W1-W5 (57.4%), O4-O6 (62.8%), and O7-O10 (54.7%) are married to civilians and have children. Over one-third (35.5%) of the Selected Reserve officers in O1-O3 are married to civilians with children, while over another third (38.7%) are single without children.
Note: Single includes annulled, divorced, and widowed. Children include minor dependents age 20 or younger and dependents age 22 or younger enrolled as full-time students. Source: DMDC Reserve Components Family File (September 2016); DMDC Reserve Components Common Personnel Data System (September 2016)
1,825
23,828
6,727
381,146
3,9783,856
12
2,141
9,404
7,428
231
7,123
21,868
35,830
360651,317
92111120 1,223
2,287
60
5,000
10,000
15,000
20,000
25,000
30,000
35,000
40,000
W1-W5 (n=12,420) O1-O3 (n=61,618) O4-O6 (n=57,049) O7-O10 (n=658)
Single,no childrenSingle,with childrenMarried to Civilian,no childrenMarried to Civilian,with childrenDual-military Marriage,no childrenDual-military Marriage,with children

Reserve and Guard Families Family Status
2016 Demographics Report
151
6.11 ■ Number and Percentage of Selected Reserve Members by Reserve Component and Family Status
The number and percentage of Selected Reserve members by Reserve component and family status are presented in the table below. Members of the Army National Guard, Army Reserve, Marine Corps Reserve, and Air Force Reserve are most likely to be single with no children, while members of the Navy Reserve, Air National Guard, and Coast Guard Reserve are most likely to be married to civilians with children. The Coast Guard has the largest percentage of members with children (50.3%), while the Marine Corps Reserve has the smallest percentage of members with children (19.8%).
Family Status
Army National Guard Army Reserve Navy Reserve
Marine Corps Reserve
Air National Guard
N % N % N % N % N % Single, no children 176,761 51.7% 90,234 45.5% 20,164 34.8% 27,109 70.4% 38,134 36.0% Single, with children 33,038 9.7% 18,135 9.1% 5,510 9.5% 1,077 2.8% 9,334 8.8% Married to Civilian, no children 32,742 9.6% 23,061 11.6% 8,041 13.9% 3,453 9.0% 13,089 12.4% Married to Civilian, with children 99,048 29.0% 59,150 29.8% 22,549 38.9% 6,287 16.3% 38,664 36.5% Dual-military, no children N/A* N/A* 3,623 1.8% 899 1.6% 329 0.9% 2,159 2.0% Dual-military, with children N/A* N/A* 4,192 2.1% 817 1.4% 262 0.7% 4,507 4.3% Total 341,589 100.0% 198,395 100.0% 57,980 100.0% 38,517 100.0% 105,887 100.0%
Family Status Air Force Reserve Total DoD
Coast Guard Reserve Total Sel Res
N % N % N % N % Single, no children 24,734 35.7% 377,136 46.5% 2,049 31.2% 379,185 46.3% Single, with children 7,031 10.1% 74,125 9.1% 458 7.0% 74,583 9.1% Married to Civilian, no children 8,147 11.7% 88,533 10.9% 1,098 16.7% 89,631 11.0% Married to Civilian, with children 24,329 35.1% 250,027 30.8% 2,688 40.9% 252,715 30.9%
Dual-military, no children 1,831 2.6% 8,841 1.1% 123 1.9% 8,964 1.1% Dual-military, with children 3,292 4.7% 13,070 1.6% 157 2.4% 13,227 1.6% Total 69,364 100.0% 811,732 100.0% 6,573 100.0% 818,305 100.0%
* The Army National Guard does not report dual-military marriages. Note: Single includes annulled, divorced, and widowed. Children include minor dependents age 20 or younger and dependents age 22 or younger enrolled as full-time students. Note: Percentages may not total to 100 due to rounding. Source: DMDC Reserve Components Family File (September 2016); DMDC Reserve Components Common Personnel Data System (September 2016)

Family Status Reserve and Guard Families
152 2016 Demographics Report
6.12 ■ Number and Percentage of Selected Reserve Members by Family Status Trends: 2000–2016
This table presents the number and percentage of Selected Reserve members by family status since 2000. The percentage of Selected Reserve members who are single has been increasing since 2000, while the percentage of Selected Reserve members with children peaked in 2010 (43.2%).
Family Status 2000 2005 2010 2015 2016
N % N % N % N % N % Single, no children 361,353 41.4% 334,475 40.3% 364,287 42.5% 381,469 46.2% 379,185 46.3% Single, with children 47,210 5.4% 68,233 8.2% 79,566 9.3% 75,043 9.1% 74,583 9.1% Married to Civilian, no children 228,060 26.1% 126,944 15.3% 112,079 13.1% 92,952 11.3% 89,631 11.0%
Married to Civilian, with children 219,560 25.1% 277,931 33.5% 278,818 32.5% 254,668 30.8% 252,715 30.9%
Dual-military Marriage, no children 9,859 1.1% 10,236 1.2% 10,195 1.2% 9,019 1.1% 8,964 1.1%
Dual-military Marriage, with children 7,165 0.8% 11,186 1.3% 12,316 1.4% 12,955 1.6% 13,227 1.6%
Total 873,207 100.0% 829,005 100.0% 857,261 100.0% 826,106 100.1% 818,305 100.0% Note: Single includes annulled, divorced, and widowed. Children include minor dependents age 20 or younger and dependents age 22 or younger enrolled as full-time students. Note: Percentages may not total to 100 due to rounding. Source: DMDC Reserve Components Family File (September 2000, 2005, 2010, 2015, 2016); DMDC Reserve Components Common Personnel Data System (September 2000, 2005, 2010, 2015, 2016)

Reserve and Guard Families Spouses
2016 Demographics Report
153
Spouses
6.13 ■ Number and Percentage of Selected Reserve Spouses by Spouse Gender and Reserve Component
This table presents the number and percentage of Selected Reserve spouses by gender and component. Of a total of 371,628 Selected Reserve spouses, the majority (86.9%) are female. The Marine Corps Reserve has the highest percentages of spouses who are female (96.4%), while the Air Force Reserve has the lowest percentage of spouse who are female (79.4%).
Reserve Component Male Female Total
N % N % N % Army National Guard 13,085 9.3% 127,159 90.7% 140,244 100.0% Army Reserve 13,501 15.3% 74,985 84.7% 88,486 100.0% Navy Reserve 4,633 15.0% 26,336 85.0% 30,969 100.0% Marine Corps Reserve 345 3.6% 9,129 96.4% 9,474 100.0% Air National Guard 8,807 14.7% 50,989 85.3% 59,796 100.0% Air Force Reserve 7,967 20.6% 30,770 79.4% 38,737 100.0% Total DoD 48,338 13.1% 319,368 86.9% 367,706 100.0% Coast Guard Reserve 450 11.5% 3,472 88.5% 3,922 100.0% Total Sel Res 48,788 13.1% 322,840 86.9% 371,628 100.0%
Note: Percentages may not total to 100 due to rounding. Source: DMDC Reserve Components Family File (September 2016)
6.14 ■ Age of Spouses of Selected Reserve Members (N=371,628) This pie chart shows the number and percentage of Selected Reserve spouses by age group. Of a total of 371,628 Selected Reserve spouses, almost one-third (30.5%) are over 41 years of age, and only 10 percent are 25 years of age or younger.
Note: Percentages may not total to 100 due to rounding. Source: DMDC Reserve Components Family File (September 2016)
25 Years or Younger
(n=37,046)10.0%
26 to 30 Years (n=75,529)
20.3%
31 to 35 Years (n=82,129)
22.1%
36 to 40 Years (n=63,443)
17.1%
41 Years or Older (n=113,481)
30.5%

Spouses Reserve and Guard Families
154 2016 Demographics Report
6.15 ■ Number of Selected Reserve Enlisted Spouses and Officer Spouses by Spouse Age and Reserve Component
This table presents the number of Selected Reserve enlisted spouses and officer spouses by spouse age and Reserve component. Two-thirds (66.0%, N=59,334) of the Selected Reserve officers’ spouses are 36 years of age or older, while only two-fifths (41.7%, N=117,590) of Selected Reserve enlisted members’ spouses are 36 years of age or older.
Reserve Component
25 Years or Younger 26 to 30 Years 31 to 35 Years 36 to 40 Years
41 Years or Older Total
Enlisted Officers Enlisted Officers Enlisted Officers Enlisted Officers Enlisted Officers Enlisted Officers Army National Guard 17,044 1,089 27,242 4,647 24,066 6,571 16,395 5,755 25,605 11,830 110,352 29,892 Army Reserve 8,560 490 15,645 2,457 14,416 4,462 9,923 4,282 16,691 11,560 65,235 23,251 Navy Reserve 1,884 31 4,524 601 5,045 2,099 3,893 2,411 5,221 5,260 20,567 10,402 Marine Corps Reserve 1,680 47 2,231 393 1,413 806 692 703 497 1,012 6,513 2,961 Air National Guard 3,696 110 9,364 1,023 10,917 2,601 8,219 2,858 15,649 5,359 47,845 11,951 Air Force Reserve 2,241 56 5,954 725 6,578 2,186 4,825 2,674 8,524 4,974 28,122 10,615 Total DoD 35,105 1,823 64,960 9,846 62,435 18,725 43,947 18,683 72,187 39,995 278,634 89,072 Coast Guard Reserve 116 2 686 37 837 132 620 193 836 463 3,095 827 Total Sel Res 35,221 1,825 65,646 9,883 63,272 18,857 44,567 18,876 73,023 40,458 281,729 89,899 Source: DMDC Reserve Components Family File (September 2016)
6.16 ■ Average Age of Selected Reserve Enlisted Spouses and Officer Spouses by Reserve Component
This table presents the average age of spouses of Selected Reserve enlisted members and officers by Reserve component. The average age of Selected Reserve enlisted members’ spouses is 35.2 years, while the average age of Selected Reserve officers’ spouses is 40.0 years. Spouses of Marine Corps enlisted members and officers are the youngest (30.1 and 37.9 years, respectively), on average, compared to spouses of enlisted members and officers from other Reserve components.
Reserve Component Enlisted Officers Total Army National Guard 34.3 38.6 35.2 Army Reserve 35.0 40.8 36.5 Navy Reserve 35.5 41.4 37.5 Marine Corps Reserve 30.1 37.9 32.5 Air National Guard 37.0 40.3 37.7 Air Force Reserve 36.5 40.8 37.7 Total DoD 35.1 40.0 36.3 Coast Guard Reserve 36.4 41.7 37.5 Total Sel Res 35.2 40.0 36.3
Source: DMDC Reserve Components Family File (September 2016)

Reserve and Guard Families Dependents
2016 Demographics Report
155
Dependents 6.17 ■ Average Number of Children and Total Dependents of Selected
Reserve Members This table presents the average number of children and average number of total dependents for Selected Reserve members. Selected Reserve members who have children have an average of two (2.0) children, while Selected Reserve members who have dependents have an average of nearly two and a half (2.4) dependents.
Number of Children*
Number of Total Dependents**
Average across all Selected Reserve 0.8 1.3 Average for Selected Reserve who have children 2.0 2.8 Average for Selected Reserve who have dependents 1.6 2.4
** Children include minor dependents age 20 or younger and dependents age 22 or younger enrolled as full-time students. ** Dependents include spouses of military members, children, and other dependents. Source: DMDC Reserve Components Family File (September 2016)
6.18 ■ Number and Percentage of Selected Reserve Members with Children by Reserve Component and Pay Grade
This table presents the number and percentage of Selected Reserve members with children by Reserve component and pay grade. The Coast Guard Reserve has the highest percentage of members with children (50.3%), while the Marine Corps Reserve has the lowest percentage (19.8%). Across Reserve components, the O4-O6 pay grade has the highest percentage of members with children (73.6%), while the E1-E4 pay grade has the lowest percentage of members with children (17.7%).
Member Pay Grade
Army National Guard Army Reserve Navy Reserve
Marine Corps Reserve
Air National Guard
N % N % N % N % N % E1-E4 28,698 17.4% 17,177 20.0% 3,418 23.1% 1,140 4.4% 5,595 18.3% E5-E6 55,680 55.1% 28,821 54.1% 13,031 54.4% 2,678 40.4% 21,343 55.2% E7-E9 21,954 74.0% 15,208 69.5% 3,475 70.6% 1,329 75.7% 15,092 70.3% W1-W5 5,799 67.7% 2,269 66.6% 63 75.0% 171 73.4% N/A* N/A* O1-O3 10,757 42.6% 7,961 40.6% 2,443 49.7% 619 33.8% 3,212 55.6% O4-O6 9,065 78.8% 9,980 70.2% 6,424 69.4% 1,681 74.9% 7,156 77.1% O7-O10 133 57.3% 61 54.5% 22 56.4% 8 61.5% 107 59.8% Total 132,086 38.7% 81,477 41.1% 28,876 49.8% 7,626 19.8% 52,505 49.6%
Member Pay Grade Air Force Reserve Total DoD Coast Guard Reserve Total Sel Res
N % N % N % N % E1-E4 4,252 22.3% 60,280 17.6% 385 26.6% 60,665 17.7% E5-E6 13,065 54.0% 134,618 54.4% 1,586 50.5% 136,204 54.3% E7-E9 8,194 67.2% 65,252 71.0% 595 68.2% 65,847 71.0% W1-W5 N/A* N/A* 8,302 67.5% 87 68.5% 8,389 67.5% O1-O3 1,789 47.4% 26,781 43.8% 288 59.6% 27,069 43.9% O4-O6 7,306 72.6% 41,612 73.6% 361 72.3% 41,973 73.6% O7-O10 46 56.1% 377 57.4% 1 100.0% 378 57.4% Total 34,652 50.0% 337,222 41.5% 3,303 50.3% 340,525 41.6%
* The Air National Guard and Air Force Reserve do not have warrant officers. Note: Children include minor dependents age 20 or younger and dependents age 22 or younger enrolled as full-time students. Source: DMDC Reserve Components Family File (September 2016)

Dependents Reserve and Guard Families
156 2016 Demographics Report
6.19 ■ Average Age of Selected Reserve Members at Birth of First Child by Reserve Component
This table presents the average age of Selected Reserve members at the birth of their first child by Reserve component. The average age is highest for the Navy Reserve (30.6 years) and lowest for the Marine Corps Reserve (26.9 years).
Reserve Component Average Years of Age Army National Guard 27.0 Army Reserve 28.1 Navy Reserve 30.6 Marine Corps Reserve 26.9 Air National Guard 29.2 Air Force Reserve 29.9 Total DoD 27.9 Coast Guard Reserve 31.1 Total Sel Res 28.0
Source: DMDC Reserve Components Family File (September 2016)

Reserve and Guard Families Dependents
2016 Demographics Report
157
6.20 ■ Number of Selected Reserve Male and Female First-Time Parents by Reserve Component and Age at Birth of First Child
This table presents the number of Selected Reserve members who became first-time parents in 2016 by Reserve component, gender, and age at the birth of their first child. The number of Selected Reserve members who had their first child in 2016 is 11,600. Half of Selected Reserve first-time parents in 2016 were age 27 years or younger (50.2%), while the other half of Selected Reserve first-time parents in 2016 were older than 27 years of age.
Age
Army National Guard
Army Reserve
Navy Reserve
Marine Corps
Reserve Air National
Guard Air Force Reserve Total DoD
Coast Guard
Reserve Total Sel
Res Male Female Male Female Male Female Male Female Male Female Male Female Male Female Male Female Male Female
17 4 2 1 0 0 0 0 0 0 0 0 0 5 2 0 0 5 2 18 38 6 8 3 1 0 2 0 3 0 0 0 52 9 0 0 52 9 19 92 38 15 20 4 1 2 0 13 4 3 0 129 63 0 0 129 63 20 143 94 38 44 12 9 18 0 19 10 5 7 235 164 0 0 235 164 21 202 106 63 48 21 3 20 1 33 20 8 11 347 189 0 0 347 189 22 254 87 81 52 19 8 29 2 36 25 12 11 431 185 1 0 432 185 23 288 77 92 48 22 14 48 2 40 18 25 16 515 175 1 1 516 176 24 324 68 132 54 30 12 41 0 62 27 32 19 621 180 4 1 625 181 25 342 57 143 57 22 12 32 3 103 31 35 17 677 177 4 1 681 178 26 306 66 146 33 32 14 31 2 99 27 47 17 661 159 3 1 664 160 27 326 54 114 47 35 11 31 1 107 32 53 18 666 163 4 1 670 164 28 300 58 113 30 41 17 20 0 112 29 61 18 647 152 12 3 659 155 29 239 38 106 24 43 14 26 1 118 28 55 20 587 125 12 1 599 126 30 249 30 133 45 38 12 16 0 87 18 50 13 573 118 8 5 581 123 31 196 31 96 19 35 11 17 0 110 20 45 18 499 99 10 5 509 104 32 198 29 104 15 38 5 10 2 99 24 41 15 490 90 4 3 494 93 33 153 25 87 21 39 7 13 0 76 11 43 13 411 77 9 0 420 77 34 119 13 58 11 40 11 12 1 74 13 38 15 341 64 4 1 345 65 35 90 9 42 10 36 11 7 0 56 12 26 8 257 50 4 1 261 51 36 78 8 46 10 35 11 3 0 41 13 22 6 225 48 3 0 228 48 37 45 13 35 6 22 7 4 0 26 6 26 8 158 40 4 1 162 41 38 35 5 17 8 20 5 4 0 19 3 15 7 110 28 2 0 112 28 39 22 4 20 3 16 4 2 0 16 1 13 1 89 13 1 0 90 13 40 22 4 16 5 9 3 2 0 18 6 10 1 77 19 2 0 79 19 41 15 2 16 1 10 1 3 0 6 0 5 2 55 6 4 0 59 6 42 11 0 11 1 7 1 3 0 10 1 8 2 50 5 0 0 50 5 43 11 1 6 0 5 1 3 1 8 0 3 0 36 3 1 0 37 3 44 8 0 9 0 7 0 1 0 4 1 2 0 31 1 0 0 31 1 45 11 0 9 0 4 0 1 0 3 0 2 0 30 0 0 0 30 0 Over 45 16 1 22 2 10 1 1 0 8 1 5 0 62 5 2 0 64 5 Subtotal 4,137 926 1,779 617 653 206 402 16 1,406 381 690 263 9,067 2,409 99 25 9,166 2,434 Total 5,063 2,396 859 418 1,787 953 11,476 124 11,600 Source: DMDC Reserve Components Family File (September 2016)

Dependents Reserve and Guard Families
158 2016 Demographics Report
6.21 ■ Number of Selected Reserve Members in Dual-Military Marriages with Children by Pay Grade and Reserve Component
This table presents the number of Selected Reserve members in dual-military marriages who have children by pay grade and Reserve component. Of all Selected Reserve members, 13,227 (1.6%) are in dual-military marriages with children. The Air National Guard has the highest number of members who are in dual-military marriages with children (4,507), followed by the Army Reserve (4,192) and the Air Force Reserve (3,292). Across Reserve components, the E5-E6 pay grade has the highest number of members who are in dual-military marriages with children (4,711), followed by E7-E9 (3,358), and O4-O6 (2,287).
Reserve Component E1-E4 E5-E6 E7-E9 W1-W5 O1-O3 O4-O6 O7-O10 Total Army National Guard** N/A N/A N/A N/A N/A N/A N/A N/A Army Reserve 760 1462 901 103 536 430 0 4,192 Navy Reserve 141 325 55 2 68 226 0 817 Marine Corps Reserve 30 98 41 10 25 58 0 262 Air National Guard 326 1,647 1,528 N/A* 340 661 5 4,507 Air Force Reserve 254 1,126 802 N/A* 226 883 1 3,292 Total DoD 1,511 4,658 3,327 115 1,195 2,258 6 13,070 Coast Guard Reserve 11 53 31 5 28 29 0 157 Total Sel Res 1,522 4,711 3,358 120 1,223 2,287 6 13,227
** The Air National Guard and Air Force Reserve do not have warrant officers. ** The Army National Guard does not report dual-military marriages. Source: DMDC Reserve Components Family File (September 2016)
6.22 ■ Number of Single Parent Selected Reserve Members by Gender and Reserve Component
This table presents the number of single parent Selected Reserve members by gender and Reserve component. Overall, almost 10 percent (9.1% or 74,583) of Selected Reserve members are single parents.
Reserve Component Male Female Total Army National Guard 24,434 8,604 33,038 Army Reserve 11,401 6,734 18,135 Navy Reserve 2,982 2,528 5,510 Marine Corps Reserve 945 132 1,077 Air National Guard 6,454 2,880 9,334 Air Force Reserve 4,249 2,782 7,031 Total DoD 50,465 23,660 74,125 Coast Guard Reserve 349 109 458 Total Sel Res 50,814 23,769 74,583
Note: A parent is a member who has a child registered in DEERS. Source: DMDC Reserve Components Family File (September 2016)

Reserve and Guard Families Dependents
2016 Demographics Report
159
6.23 ■ Percentage of Single Parent Selected Reserve Members by Reserve Component and Pay Grade (N=74,583)
This table presents the percentage of Selected Reserve members who are single parents by Reserve component and pay grade. The Air Force Reserve has the highest percentage of single parent members (10.1%), while the Marine Corps Reserve has the lowest percentage (2.8%) of single parent members. Across Reserve components, the E5-E6 pay grade has the highest percentage (12.9%) of single parent members, while the O7-O10 pay grade has the lowest percentage (1.8%) of single parent members.
Pay Grade
Army National Guard
Army Reserve
Navy Reserve
Marine Corps
Reserve
Air National Guard
Air Force Reserve
Total DoD
Coast Guard
Reserve Total Sel
Res E1-E4 7.2% 6.1% 9.0% 1.1% 6.0% 8.5% 6.5% 6.2% 6.5% E5-E6 14.2% 13.1% 12.1% 6.8% 11.5% 12.6% 13.0% 7.4% 12.9% E7-E9 12.0% 13.9% 10.7% 9.7% 9.9% 12.1% 11.9% 8.3% 11.8% W1-W5 8.8% 10.6% 11.9% 6.4% N/A* N/A* 9.3% 4.7% 9.2% O1-O3 6.5% 7.0% 6.0% 2.3% 6.0% 6.7% 6.5% 5.8% 6.5% O4-O6 7.6% 8.0% 5.0% 5.4% 6.4% 6.4% 6.8% 5.6% 6.8% O7-O10 2.6% 1.8% 0.0% 0.0% 1.1% 2.4% 1.8% 0.0% 1.8% Total 9.7% 9.1% 9.5% 2.8% 8.8% 10.1% 9.1% 7.0% 9.1%
* The Air National Guard and Air Force Reserve do not have warrant officers. Note: A parent is a member who has a child registered in DEERS. Source: DMDC Reserve Components Family File (September 2016)

Dependents Reserve and Guard Families
160 2016 Demographics Report
6.24 ■ Number of Children of Selected Reserve Members by Reserve Component and Child Age
This table presents the number of children of Selected Reserve members by Reserve component and child age. In total, Selected Reserve members have 685,344 children. Slightly over half of children (52.8% or 362,182) are 9 years of age or younger.
Age
Army National Guard
Army Reserve
Navy Reserve
Marine Corps
Reserve
Air National Guard
Air Force
Reserve Total DoD
Coast Guard
Reserve Total Sel
Res 0 9,987 5,445 2,344 939 4,003 2,360 25,078 262 25,340 1 14,150 7,387 2,927 1,118 5,104 3,159 33,845 375 34,220 2 15,033 8,366 3,144 1,191 5,497 3,501 36,732 403 37,135 3 15,620 8,835 3,320 1,191 5,766 3,746 38,478 384 38,862 4 15,476 8,981 3,150 1,147 5,890 3,771 38,415 392 38,807 5 15,823 8,997 3,346 1,017 5,795 3,949 38,927 411 39,338 6 15,014 8,848 3,243 1,001 5,820 3,756 37,682 352 38,034 7 15,001 8,729 3,186 902 5,614 3,724 37,156 372 37,528 8 14,425 8,828 3,115 832 5,667 3,800 36,667 356 37,023 9 13,761 8,799 3,066 758 5,432 3,744 35,560 335 35,895 10 12,701 8,159 3,000 709 5,306 3,578 33,453 349 33,802 11 11,743 7,688 2,751 612 4,978 3,437 31,209 296 31,505 12 11,107 7,308 2,635 555 4,888 3,367 29,860 271 30,131 13 10,987 7,085 2,566 517 4,612 3,078 28,845 264 29,109 14 10,450 6,919 2,356 442 4,330 2,821 27,318 236 27,554 15 9,973 6,580 2,222 434 4,227 2,768 26,204 238 26,442 16 9,705 6,462 2,224 377 4,177 2,607 25,552 187 25,739 17 9,207 6,024 1,955 336 3,893 2,460 23,875 172 24,047 18 8,367 5,829 1,843 286 3,486 2,216 22,027 147 22,174 19 7,754 5,147 1,644 224 3,312 2,060 20,141 129 20,270 20 7,121 4,963 1,555 206 3,086 1,968 18,899 139 19,038 21* 6,561 4,544 1,349 146 2,879 1,830 17,309 116 17,425 22* 6,016 4,248 1,174 131 2,668 1,578 15,815 111 15,926 Total 265,982 164,171 58,115 15,071 106,430 69,278 679,047 6,297 685,344
* Children ages 21 to 22 must be enrolled as full-time students in order to qualify as dependents. Source: DMDC Reserve Components Family File (September 2016)
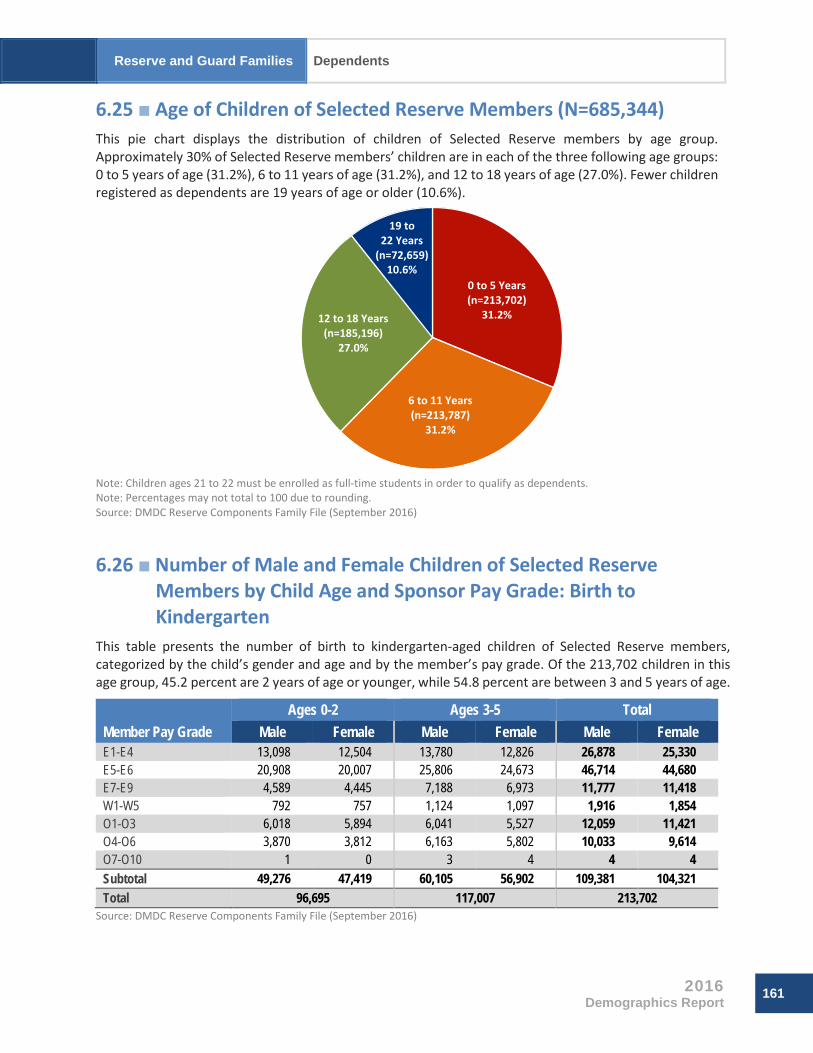
Reserve and Guard Families Dependents
2016 Demographics Report
161
6.25 ■ Age of Children of Selected Reserve Members (N=685,344) This pie chart displays the distribution of children of Selected Reserve members by age group. Approximately 30% of Selected Reserve members’ children are in each of the three following age groups: 0 to 5 years of age (31.2%), 6 to 11 years of age (31.2%), and 12 to 18 years of age (27.0%). Fewer children registered as dependents are 19 years of age or older (10.6%).
Note: Children ages 21 to 22 must be enrolled as full-time students in order to qualify as dependents. Note: Percentages may not total to 100 due to rounding. Source: DMDC Reserve Components Family File (September 2016)
6.26 ■ Number of Male and Female Children of Selected Reserve Members by Child Age and Sponsor Pay Grade: Birth to Kindergarten
This table presents the number of birth to kindergarten-aged children of Selected Reserve members, categorized by the child’s gender and age and by the member’s pay grade. Of the 213,702 children in this age group, 45.2 percent are 2 years of age or younger, while 54.8 percent are between 3 and 5 years of age.
Member Pay Grade Ages 0-2 Ages 3-5 Total
Male Female Male Female Male Female E1-E4 13,098 12,504 13,780 12,826 26,878 25,330 E5-E6 20,908 20,007 25,806 24,673 46,714 44,680 E7-E9 4,589 4,445 7,188 6,973 11,777 11,418 W1-W5 792 757 1,124 1,097 1,916 1,854 O1-O3 6,018 5,894 6,041 5,527 12,059 11,421 O4-O6 3,870 3,812 6,163 5,802 10,033 9,614 O7-O10 1 0 3 4 4 4 Subtotal 49,276 47,419 60,105 56,902 109,381 104,321 Total 96,695 117,007 213,702
Source: DMDC Reserve Components Family File (September 2016)
0 to 5 Years (n=213,702)
31.2%
6 to 11 Years (n=213,787)
31.2%
12 to 18 Years (n=185,196)
27.0%
19 to 22 Years
(n=72,659)10.6%

Dependents Reserve and Guard Families
162 2016 Demographics Report
6.27 ■ Number of Male and Female Children of Selected Reserve Members by Child Age and Member Pay Grade: Primary and Middle School
This table presents the number of primary and middle school-aged children of Selected Reserve members, categorized by the child’s gender and age and by the member’s pay grade. Of the 300,581 children in this age group, 71.1 percent are between 6 and 11 years of age, while 28.9 percent are between 12 and 14 years of age.
Member Pay Grade Ages 6-11 Ages 12-14 Total
Male Female Male Female Male Female E1-E4 16,731 15,982 3,936 3,681 20,667 19,663 E5-E6 46,561 44,919 17,392 16,844 63,953 61,763 E7-E9 19,710 18,957 11,123 10,652 30,833 29,609 W1-W5 2,529 2,408 1,300 1,263 3,829 3,671 O1-O3 8,615 8,283 2,938 2,878 11,553 11,161 O4-O6 14,779 14,248 7,454 7,241 22,233 21,489 O7-O10 31 34 54 37 85 71 Subtotal 108,956 104,831 44,197 42,596 153,153 147,427 Total 213,787 86,794* 300,581*
* Includes one child age 12-14 years whose gender is not reported. Source: DMDC Reserve Components Family File (September 2016)
6.28 ■ Number of Male and Female Children of Selected Reserve Members by Child Age and Member Pay Grade: High School and Above
This table presents the distribution of children of Selected Reserve members who are high school age and above, categorized by the child’s gender and age and by the member’s pay grade. Of the 171,061 children in this age group, 57.5 percent are between 15 and 18 years of age, while 42.5 percent are between 19 and 22 years of age.
Member Pay Grade Ages 15-18 Ages 19-22 Total
Male Female Male Female Male Female E1-E4 3,198 3,144 1,545 1,501 4,743 4,645 E5-E6 17,878 17,485 11,625 11,611 29,503 29,096 E7-E9 15,004 14,824 13,220 13,160 28,224 27,984 W1-W5 1,734 1,707 1,470 1,535 3,204 3,242 O1-O3 2,990 2,847 1,824 1,811 4,814 4,658 O4-O6 8,956 8,425 6,591 6,462 15,547 14,887 O7-O10 96 114 143 161 239 275 Subtotal 49,856 48,546 36,418 36,241 86,274 84,787 Total 98,402 72,659 171,061
Note: Children ages 21 to 22 must be enrolled as full-time students in order to qualify as dependents. Source: DMDC Reserve Components Family File (September 2016)

Reserve and Guard Families Dependents
2016 Demographics Report
163
6.29 ■ Age of Adult Dependents of Selected Reserve Members (N=1,662) This pie chart presents the distribution of adult dependents of Selected Reserve members by age group. “Adult Dependent” refers to a parent, grandparent, former spouse, sibling, disabled older child, and any other individual claimed as a dependent in the Defense Enrollment Eligibility Reporting System (DEERS) over the age of 22. Over half (56.8%) of adult dependents are 63 years of age or older.
Note: Percentages may not total to 100 due to rounding. Source: DMDC Reserve Components Family File (September 2016)
6.30 ■ Number of Male and Female Adult Dependents of Selected Reserve Members by Dependent Age and Member Pay Grade
This table displays the number of male and female adult dependents of Selected Reserve members by dependent age and member pay grade. The largest number of adult dependents are females ages 62 and older.
Member Pay Grade
Ages 23-40 Ages 41-50 Ages 51-62 Ages 63 and Older Total Male Female Male Female Male Female Male Female Male Female
E1-E4 2 1 2 16 19 65 13 34 36 116 E5-E6 19 24 3 17 27 204 54 213 103 458 E7-E9 36 38 2 3 11 85 54 252 103 378 W1-W5 1 0 0 0 0 8 6 34 7 42 O1-O3 3 4 0 3 6 56 21 67 30 130 O4-O6 8 14 1 0 5 35 33 161 47 210 O7-O10 0 0 0 0 0 0 0 2 0 2 Subtotal 69 81 8 39 68 453 181 763 326 1,336 Total 150 47 521 944 1,662
Source: DMDC Reserve Components Family File (September 2016)
23 to 40 Years (n=150)
9.0%
41 to 50 Years (n=47)2.8%
51 to 62 Years (n=521)31.3%
63+ Years (n=944)56.8%

Dependents Reserve and Guard Families
164 2016 Demographics Report
6.31 ■ Number of Single Parent Selected Reserve Members by Gender and Reserve Component Trends: 2000–2016
This table presents the number of single parent Selected Reserve members by gender and Reserve component from 2000 to 2016. The number of single parent members increased between 2000 and 2010, but has decreased since 2010 for both male and female members. Reserve Component
2000 2005 2010 2015 2016 Male Female Male Female Male Female Male Female Male Female
Army National Guard 11,538 3,529 20,912 6,106 26,067 8,859 24,567 8,751 24,434 8,604 Army Reserve 6,978 4,899 10,145 6,029 12,228 8,432 11,723 6,880 11,401 6,734 Navy Reserve 4,273 1,957 4,718 2,656 3,699 2,691 3,033 2,454 2,982 2,528 Marine Corps Reserve 844 139 1,062 159 1,181 176 972 151 945 132 Air National Guard 5,118 2,209 6,444 2,510 6,348 2,795 6,307 2,862 6,454 2,880 Air Force Reserve 3,371 1,687 4,658 2,497 4,017 2,696 4,118 2,747 4,249 2,782 Total DoD 32,122 14,420 47,939 19,957 53,540 25,649 50,720 23,845 50,465 23,660 Coast Guard Reserve 183 55 265 72 296 81 369 108 349 109 Total Sel Res 32,305 14,475 48,204 20,029 53,836 25,730 51,089 23,953 50,814 23,769
Note: A parent is a member who has a child registered in DEERS. Source: DMDC Reserve Components Family File (September 2000, 2005, 2010, 2015, 2016)
6.32 ■ Number and Percentage of Selected Reserve Children by Child Age Trends: 2005–2016
This table displays the number and percentage trends of children of Selected Reserve members by age. Since 2005, the percentage of children ages 0 to 5 years has increased, while the percentage of children ages 12 to 18 has decreased. The highest percentage of Selected Reserve children in 2005 and 2010 was aged 12 to 18 years, but the highest percentage of Selected Reserve children in 2015 and 2016 was aged 6 to 11 years.
Age 2005 2010 2015 2016
N % N % N % N % 0 to 5 Years 179,120 24.8% 208,123 27.9% 209,894 30.5% 213,702 31.2% 6 to 11 Years 226,185 31.3% 224,085 30.1% 212,634 30.9% 213,787 31.2% 12 to 18 Years 239,149 33.1% 225,937 30.3% 189,395 27.5% 185,196 27.0% 19 to 22 Years 78,840 10.9% 87,388 11.7% 75,973 11.0% 72,659 10.6% Total 723,294 100.0% 745,533 100.0% 687,896 100.0% 685,344 100.0%
Note: Children ages 21 to 22 must be enrolled as full-time students in order to qualify as dependents. Note: Percentages may not total to 100 due to rounding. Source: DMDC Reserve Components Family File (September 2005, 2010, 2015, 2016)
6.33 ■ Number and Percentage of Selected Reserve Adult Dependents by Dependent Age Trends: 2005–2016
This table presents the number and percentage trends of adult dependents of Selected Reserve members by age. The majority of adult dependents across all years are 51 years of age or older and the percentage of adult dependents in this age range has increased since 2005.
Age 2005 2010 2015 2016
N % N % N % N % 23 to 40 Years 252 14.3% 198 10.1% 162 9.5% 150 9.0% 41 to 50 Years 122 6.9% 105 5.4% 58 3.4% 47 2.8% 51 to 62 Years 522 29.6% 630 32.1% 548 32.1% 521 31.3% 63+ Years 866 49.1% 1028 52.4% 940 55.0% 944 56.8% Total 1,762 100.0% 1,961 100.0% 1,708 100.0% 1,662 100.0%
Note: Percentages may not total to 100 due to rounding. Source: DMDC Reserve Components Family File (September 2005, 2010, 2015, 2016)
165
SECTION 7
Reference Tables This section contains information on 2017 basic monthly pay and allowances, comparative pay grades and ranks, and United States and International base populations and locations. For all grades of military personnel, as defined in paragraph 25, Section 101 of U.S. Code title 37, Regular Military Compensation (RMC) includes the sum of basic pay, Basic Allowance for Housing, and Basic Allowance for Subsistence, and the federal tax advantage of the allowances as these are not subject to federal tax. For further information about military compensation, please refer to the Office of Secretary of Defense Military Compensation Policy, The Selected Military Compensation Tables Report (January 2017), available at http://militarypay.defense.gov/References/Greenbooks/.

166
This page is intentionally blank.

Reference Tables 2017 Basic Monthly Pay
2016 Demographics Report
167
2017 Basic Monthly Pay This table presents the basic monthly pay for Service members in 2017, which is determined based upon pay grade and cumulative years of service. While the other data in this report represent the status of the military in 2016, this table refers to 2017. These pay figures are the only 2017 data that are available in advance of the publication of this report.
Pay grades are administrative classifications used primarily to standardize compensation across the military services. The “E” in E1 stands for “enlisted” while the “1” indicates the pay grade for that position. The other pay categories are “W” for warrant officers and “O” for commissioned officers. Basic monthly pay for 2017 is rounded to the nearest dollar (e.g., $2905.20 is rounded to $2,905 and $2,839.80 is rounded to $2,840). If no dollar amount is listed, then a dollar figure is not established for that category.
Pay Grade
Cumulative Years of Service 2 or Less >2 >3 >4 >6 >8 >10 >12 >14 >16 >18 >20
Enlis
ted
Mem
bers
E1* $1,600 $1,600 $1,600 $1,600 $1,600 $1,600 $1,600 $1,600 $1,600 $1,600 $1,600 $1,600 E2 $1,793 $1,793 $1,793 $1,793 $1,793 $1,793 $1,793 $1,793 $1,793 $1,793 $1,793 $1,793 E3 $1,886 $2,004 $2,126 $2,126 $2,126 $2,126 $2,126 $2,126 $2,126 $2,126 $2,126 $2,126 E4 $2,089 $2,196 $2,315 $2,432 $2,536 $2,536 $2,536 $2,536 $2,536 $2,536 $2,536 $2,536 E5 $2,278 $2,432 $2,549 $2,669 $2,857 $3,053 $3,214 $3,233 $3,233 $3,233 $3,233 $3,233 E6 $2,487 $2,737 $2,857 $2,975 $3,097 $3,373 $3,480 $3,688 $3,752 $3,798 $3,852 $3,852 E7 $2,875 $3,138 $3,258 $3,417 $3,542 $3,755 $3,875 $4,089 $4,267 $4,388 $4,517 $4,567 E8 N/A N/A N/A N/A N/A $4,136 $4,319 $4,432 $4,568 $4,715 $4,980 $5,115 E9** N/A N/A N/A N/A N/A N/A $5,053 $5,167 $5,312 $5,481 $5,653 $5,927
War
rant
Offi
cers
W1 $2,966 $3,286 $3,371 $3,553 $3,767 $4,084 $4,231 $4,437 $4,640 $4,800 $4,947 $5,126 W2 $3,380 $3,699 $3,797 $3,865 $4,084 $4,425 $4,594 $4,760 $4,963 $5,122 $5,266 $5,438 W3 $3,819 $3,978 $4,142 $4,195 $4,366 $4,703 $5,053 $5,218 $5,409 $5,606 $5,959 $6,198 W4 $4,182 $4,499 $4,628 $4,755 $4,973 $5,190 $5,409 $5,739 $6,028 $6,303 $6,528 $6,748 W5 N/A N/A N/A N/A N/A N/A N/A N/A N/A N/A N/A $7,436
Com
miss
ione
d Of
ficer
s***
O1 $3,035 $3,159 $3,819 $3,819 $3,819 $3,819 $3,819 $3,819 $3,819 $3,819 $3,819 $3,819 O2 $3,497 $3,982 $4,586 $4,741 $4,839 $4,839 $4,839 $4,839 $4,839 $4,839 $4,839 $4,839 O3 $4,047 $4,587 $4,951 $5,398 $5,657 $5,941 $6,124 $6,426 $6,584 $6,584 $6,584 $6,584 O4 $4,603 $5,328 $5,684 $5,762 $6,092 $6,446 $6,887 $7,230 $7,469 $7,606 $7,685 $7,685 O5 $5,334 $6,009 $6,425 $6,503 $6,763 $6,918 $7,260 $7,511 $7,834 $8,330 $8,565 $8,798 O6 $6,399 $7,030 $7,491 $7,491 $7,520 $7,842 $7,885 $7,885 $8,333 $9,125 $9,590 $10,055 O7 $8,438 $8,830 $9,011 $9,156 $9,417 $9,675 $9,973 $10,270 $10,569 $11,506 $12,297 $12,297 O8 $10,155 $10,488 $10,709 $10,770 $11,046 $11,506 $11,613 $12,050 $12,175 $12,552 $13,097 $13,599 O9 N/A N/A N/A N/A N/A N/A N/A N/A N/A N/A N/A $14,352 O10*** N/A N/A N/A N/A N/A N/A N/A N/A N/A N/A N/A $15,583 O1E**** N/A N/A N/A $3,819 $4,078 $4,229 $4,382 $4,534 $4,741 $4,741 $4,741 $4,741 O2E**** N/A N/A N/A $4,741 $4,839 $4,993 $5,253 $5,454 $5,604 $5,604 $5,604 $5,604 O3E**** N/A N/A N/A $5,398 $5,657 $5,941 $6,124 $6,426 $6,681 $6,827 $7,026 $7,026
Note: Table is continued on next page.

2017 Basic Monthly Pay Reference Tables
168 2016 Demographics Report
(Continued)
Pay Grade Cumulative Years of Service
>22 >24 >26 >28 >30 >32 >34 >36 >38 >40
Enlis
ted
Mem
bers
E1* $1,600 $1,600 $1,600 $1,600 $1,600 $1,600 $1,600 $1,600 $1,600 $1,600 E2 $1,793 $1,793 $1,793 $1,793 $1,793 $1,793 $1,793 $1,793 $1,793 $1,793 E3 $2,126 $2,126 $2,126 $2,126 $2,126 $2,126 $2,126 $2,126 $2,126 $2,126 E4 $2,536 $2,536 $2,536 $2,536 $2,536 $2,536 $2,536 $2,536 $2,536 $2,536 E5 $3,233 $3,233 $3,233 $3,233 $3,233 $3,233 $3,233 $3,233 $3,233 $3,233 E6 $3,852 $3,852 $3,852 $3,852 $3,852 $3,852 $3,852 $3,852 $3,852 $3,852 E7 $4,735 $4,825 $5,168 $5,168 $5,168 $5,168 $5,168 $5,168 $5,168 $5,168 E8 $5,344 $5,471 $5,783 $5,783 $5,899 $5,899 $5,899 $5,899 $5,899 $5,899 E9** $6,159 $6,403 $6,776 $6,776 $7,115 $7,115 $7,471 $7,471 $7,845 $7,845
War
rant
Offi
cers
W1 $5,126 $5,126 $5,126 $5,126 $5,126 $5,126 $5,126 $5,126 $5,126 $5,126 W2 $5,551 $5,641 $5,641 $5,641 $5,641 $5,641 $5,641 $5,641 $5,641 $5,641 W3 $6,341 $6,493 $6,699 $6,699 $6,699 $6,699 $6,699 $6,699 $6,699 $6,699 W4 $7,070 $7,335 $7,637 $7,637 $7,790 $7,790 $7,790 $7,790 $7,790 $7,790 W5 $7,813 $8,094 $8,405 $8,405 $8,826 $8,826 $9,267 $9,267 $9,731 $9,731
Com
miss
ione
d Of
ficer
s***
O1 $3,819 $3,819 $3,819 $3,819 $3,819 $3,819 $3,819 $3,819 $3,819 $3,819 O2 $4,839 $4,839 $4,839 $4,839 $4,839 $4,839 $4,839 $4,839 $4,839 $4,839 O3 $6,584 $6,584 $6,584 $6,584 $6,584 $6,584 $6,584 $6,584 $6,584 $6,584 O4 $7,685 $7,685 $7,685 $7,685 $7,685 $7,685 $7,685 $7,685 $7,685 $7,685 O5 $9,063 $9,063 $9,063 $9,063 $9,063 $9,063 $9,063 $9,063 $9,063 $9,063 O6 $10,319 $10,587 $11,106 $11,106 $11,328 $11,328 $11,328 $11,328 $11,328 $11,328 O7 $12,297 $12,297 $12,360 $12,360 $12,607 $12,607 $12,607 $12,607 $12,607 $12,607 O8 $13,934 $13,934 $13,934 $13,934 $14,283 $14,283 $14,640 $14,640 $14,640 $14,640 O9 $14,559 $14,858 $15,379 $15,379 $15,583 $15,583 $15,583 $15,583 $15,583 $15,583 O10**** $15,583 $15,583 $15,583 $15,583 $15,583 $15,583 $15,583 $15,583 $15,583 $15,583 O1E***** $4,741 $4,741 $4,741 $4,741 $4,741 $4,741 $4,741 $4,741 $4,741 $4,741 O2E***** $5,604 $5,604 $5,604 $5,604 $5,604 $5,604 $5,604 $5,604 $5,604 $5,604 O3E***** $7,026 $7,026 $7,026 $7,026 $7,026 $7,026 $7,026 $7,026 $7,026 $7,026
***** Applicable to E1 with 4 months or more of Active Duty service. Basic pay for an E1 with less than 4 months of Active Duty service is $1,479.
***** For the Sergeant Major of the Army Master Chief Petty Officer of the Navy, Chief Master Sergeant of the Air Force, Sergeant Major of the Marine Corps, Master Chief Petty Officer of the Coast Guard, Senior Enlisted Advisor of the JCS, or Senior Enlisted Advisor to the Chief of the National Guard Bureau basic pay is $8,165.
***** Basic pay for an O7 to O10 is limited by Level II of the Executive Schedule, which is $15,583. This includes officers serving as Chairman or Vice Chairman of the Joint Chiefs of Staff (JCS), Chief of Staff of the Army, Chief of Naval Operations, Chief of Staff of the Air Force, Commandant of the Marine Corps, Commandant of the Coast Guard, Chief of the National Guard Bureau, or commander of a unified or specified combatant command. Basic pay for O6 and below is limited by Level V of the Executive Schedule in effect during 2017, which is $12,642. Combat Zone Tax Exclusion for O1 and above is based on this basic pay rate plus Hostile Fire Pay/Imminent Danger Pay which is $225.
***** Applicable to O1 to O3 with at least 4 years & 1 day of Active Duty service or more than 1,460 points as a warrant and/or enlisted member.
Note: Basic pay rate for Academy Cadets/Midshipmen and ROTC members/applicants is $1,062. Source: Defense Finance and Accounting Service (2017)
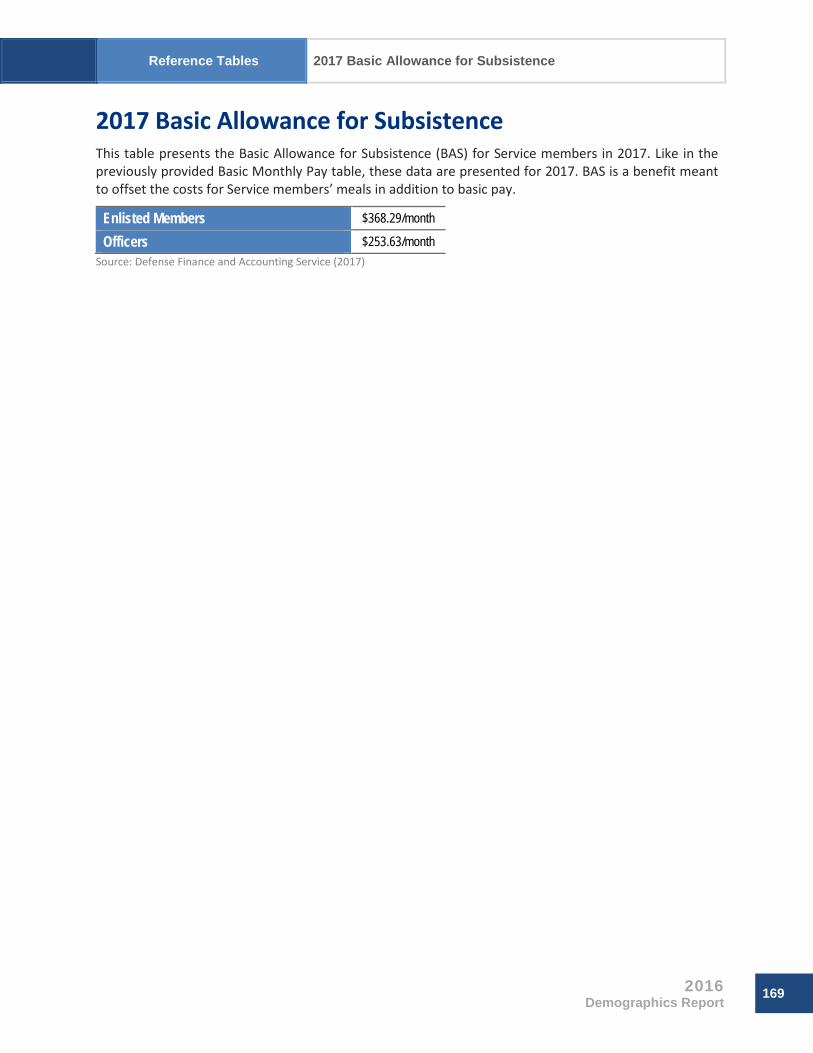
Reference Tables 2017 Basic Allowance for Subsistence
2016 Demographics Report
169
2017 Basic Allowance for Subsistence This table presents the Basic Allowance for Subsistence (BAS) for Service members in 2017. Like in the previously provided Basic Monthly Pay table, these data are presented for 2017. BAS is a benefit meant to offset the costs for Service members’ meals in addition to basic pay.
Enlisted Members $368.29/month
Officers $253.63/month Source: Defense Finance and Accounting Service (2017)

2017 Drill Pay for Enlisted Members Reference Tables
170 2016 Demographics Report
2017 Drill Pay for Enlisted Members This table presents the 2017 drill pay for enlisted members. Drill pay is the amount Reservists are reimbursed for training. One drill is at least three hours of training, and four drills normally represent one weekend of training (equaling 8 hours on Saturday and 8 hours on Sunday). If no dollar amount is listed, then a dollar figure is not established for that category. When an enlisted Reservist is called for Active Duty, the Service member is salaried for his/her equivalent pay grade at the Basic Monthly Pay amount.
Pay Grade
Cumulative Years of Service 2 or Less >2 >3 >4 >6 >8 >10 >12 >14 >16 >18 >20
E1<4 mos 1 Drill $49 N/A N/A N/A N/A N/A N/A N/A N/A N/A N/A N/A 4 Drills $197 N/A N/A N/A N/A N/A N/A N/A N/A N/A N/A N/A E1>4 mos 1 Drill $53 $53 $53 $53 $53 $53 $53 $53 $53 $53 $53 $53 4 Drills $213 $213 $213 $213 $213 $213 $213 $213 $213 $213 $213 $213 E2 1 Drill $60 $60 $60 $60 $60 $60 $60 $60 $60 $60 $60 $60 4 Drills $239 $239 $239 $239 $239 $239 $239 $239 $239 $239 $239 $239 E3 1 Drill $63 $67 $71 $71 $71 $71 $71 $71 $71 $71 $71 $71 4 Drills $251 $267 $283 $283 $283 $283 $283 $283 $283 $283 $283 $283 E4 1 Drill $70 $73 $77 $81 $85 $85 $85 $85 $85 $85 $85 $85 4 Drills $279 $293 $309 $324 $338 $338 $338 $338 $338 $338 $338 $338 E5 1 Drill $76 $81 $85 $89 $95 $102 $107 $108 $108 $108 $108 $108 4 Drills $304 $324 $340 $356 $381 $407 $428 $431 $431 $431 $431 $431 E6 1 Drill $83 $91 $95 $99 $103 $112 $116 $123 $125 $127 $128 $128 4 Drills $332 $365 $381 $397 $413 $450 $464 $492 $500 $506 $514 $514 E7 1 Drill $96 $105 $109 $114 $118 $125 $129 $136 $142 $146 $151 $152 4 Drills $383 $418 $434 $456 $472 $501 $517 $545 $569 $585 $602 $609 E8 1 Drill N/A N/A N/A N/A N/A $138 $144 $148 $152 $157 $166 $170 4 Drills N/A N/A N/A N/A N/A $551 $576 $591 $609 $629 $664 $682 E9 1 Drill N/A N/A N/A N/A N/A N/A $168 $172 $177 $183 $188 $198 4 Drills N/A N/A N/A N/A N/A N/A $674 $689 $708 $731 $754 $790
Note: Table is continued on next page.
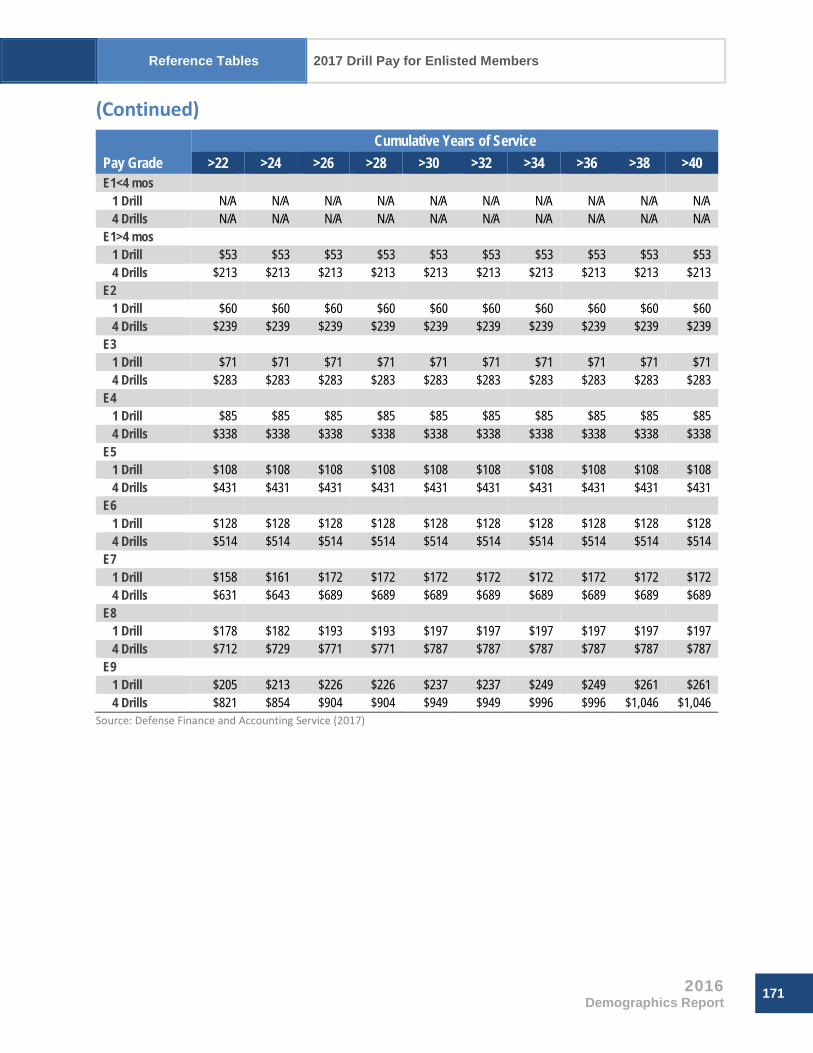
Reference Tables 2017 Drill Pay for Enlisted Members
2016 Demographics Report
171
(Continued)
Pay Grade Cumulative Years of Service
>22 >24 >26 >28 >30 >32 >34 >36 >38 >40 E1<4 mos 1 Drill N/A N/A N/A N/A N/A N/A N/A N/A N/A N/A 4 Drills N/A N/A N/A N/A N/A N/A N/A N/A N/A N/A E1>4 mos 1 Drill $53 $53 $53 $53 $53 $53 $53 $53 $53 $53 4 Drills $213 $213 $213 $213 $213 $213 $213 $213 $213 $213 E2 1 Drill $60 $60 $60 $60 $60 $60 $60 $60 $60 $60 4 Drills $239 $239 $239 $239 $239 $239 $239 $239 $239 $239 E3 1 Drill $71 $71 $71 $71 $71 $71 $71 $71 $71 $71 4 Drills $283 $283 $283 $283 $283 $283 $283 $283 $283 $283 E4 1 Drill $85 $85 $85 $85 $85 $85 $85 $85 $85 $85 4 Drills $338 $338 $338 $338 $338 $338 $338 $338 $338 $338 E5 1 Drill $108 $108 $108 $108 $108 $108 $108 $108 $108 $108 4 Drills $431 $431 $431 $431 $431 $431 $431 $431 $431 $431 E6 1 Drill $128 $128 $128 $128 $128 $128 $128 $128 $128 $128 4 Drills $514 $514 $514 $514 $514 $514 $514 $514 $514 $514 E7 1 Drill $158 $161 $172 $172 $172 $172 $172 $172 $172 $172 4 Drills $631 $643 $689 $689 $689 $689 $689 $689 $689 $689 E8 1 Drill $178 $182 $193 $193 $197 $197 $197 $197 $197 $197 4 Drills $712 $729 $771 $771 $787 $787 $787 $787 $787 $787 E9 1 Drill $205 $213 $226 $226 $237 $237 $249 $249 $261 $261 4 Drills $821 $854 $904 $904 $949 $949 $996 $996 $1,046 $1,046
Source: Defense Finance and Accounting Service (2017)

2017 Drill Pay for Officers Reference Tables
172 2016 Demographics Report
2017 Drill Pay for Officers This table presents the 2017 drill pay for officers. Drill pay is the amount Reservists are reimbursed for training. One drill is at least three hours of training, and four drills normally represent one weekend of training (equaling 8 hours on Saturday and 8 hours on Sunday). If no dollar amount is listed, then a dollar figure is not established for that category. When an officer from a Reserve component is called for Active Duty, the Service member is salaried for his/her equivalent pay grade at the Basic Monthly Pay amount.
Pay Grade
Cumulative Years of Service 2 or Less >2 >3 >4 >6 >8 >10 >12 >14 >16 >18 >20
WAR
RANT
OFF
ICER
S
W1 1 Drill $99 $110 $112 $118 $126 $136 $141 $148 $155 $160 $165 $171 4 Drills $396 $438 $450 $474 $502 $544 $564 $592 $619 $640 $660 $683 W2 1 Drill $113 $123 $127 $129 $136 $147 $153 $159 $165 $171 $176 $181 4 Drills $451 $493 $506 $515 $545 $590 $612 $635 $662 $683 $702 $725 W3 1 Drill $127 $133 $138 $140 $146 $157 $168 $174 $180 $187 $199 $207 4 Drills $509 $530 $552 $559 $582 $627 $674 $696 $721 $747 $795 $826 W4 1 Drill $139 $150 $154 $158 $166 $173 $180 $191 $201 $210 $218 $225 4 Drills $558 $600 $617 $634 $663 $692 $721 $765 $804 $840 $870 $900 W5 1 Drill N/A N/A N/A N/A N/A N/A N/A N/A N/A N/A N/A $248 4 Drills N/A N/A N/A N/A N/A N/A N/A N/A N/A N/A N/A $991
COMM
ISSI
ONED
OFF
ICER
S
O1 1 Drill $101 $105 $127 $127 $127 $127 $127 $127 $127 $127 $127 $127 4 Drills $405 $421 $509 $509 $509 $509 $509 $509 $509 $509 $509 $509 O2 1 Drill $117 $133 $153 $158 $161 $161 $161 $161 $161 $161 $161 $161 4 Drills $466 $531 $611 $632 $645 $645 $645 $645 $645 $645 $645 $645 O3 1 Drill $135 $153 $165 $180 $189 $198 $204 $214 $219 $219 $219 $219 4 Drills $540 $612 $660 $720 $754 $792 $817 $857 $878 $878 $878 $878 O4 1 Drill $153 $178 $189 $192 $203 $215 $230 $241 $249 $254 $256 $256 4 Drills $614 $710 $758 $768 $812 $860 $918 $964 $996 $1,014 $1,025 $1,025 O5 1 Drill $178 $200 $214 $217 $225 $231 $242 $250 $261 $278 $286 $293 4 Drills $711 $801 $857 $867 $902 $922 $968 $1,001 $1,045 $1,111 $1,142 $1,173 O6 1 Drill $213 $234 $250 $250 $251 $261 $263 $263 $278 $304 $320 $335 4 Drills $853 $937 $999 $999 $1,003 $1,046 $1,051 $1,051 $1,111 $1,217 $1,279 $1,341 O7 1 Drill $281 $294 $300 $305 $314 $322 $332 $342 $352 $384 $410 $410 4 Drills $1,125 $1,177 $1,202 $1,221 $1,256 $1,290 $1,330 $1,369 $1,409 $1,534 $1,640 $1,640 O1E* 1 Drill N/A N/A N/A $127 $136 $141 $146 $151 $158 $158 $158 $158 4 Drills N/A N/A N/A $509 $544 $564 $584 $604 $632 $632 $632 $632 O2E* 1 Drill N/A N/A N/A $158 $161 $166 $175 $182 $187 $187 $187 $187 4 Drills N/A N/A N/A $632 $645 $666 $700 $727 $747 $747 $747 $747 O3E* 1 Drill N/A N/A N/A $180 $189 $198 $204 $214 $223 $228 $234 $234 4 Drills N/A N/A N/A $720 $754 $792 $817 $857 $891 $910 $937 $937
Note: Table is continued on next page.
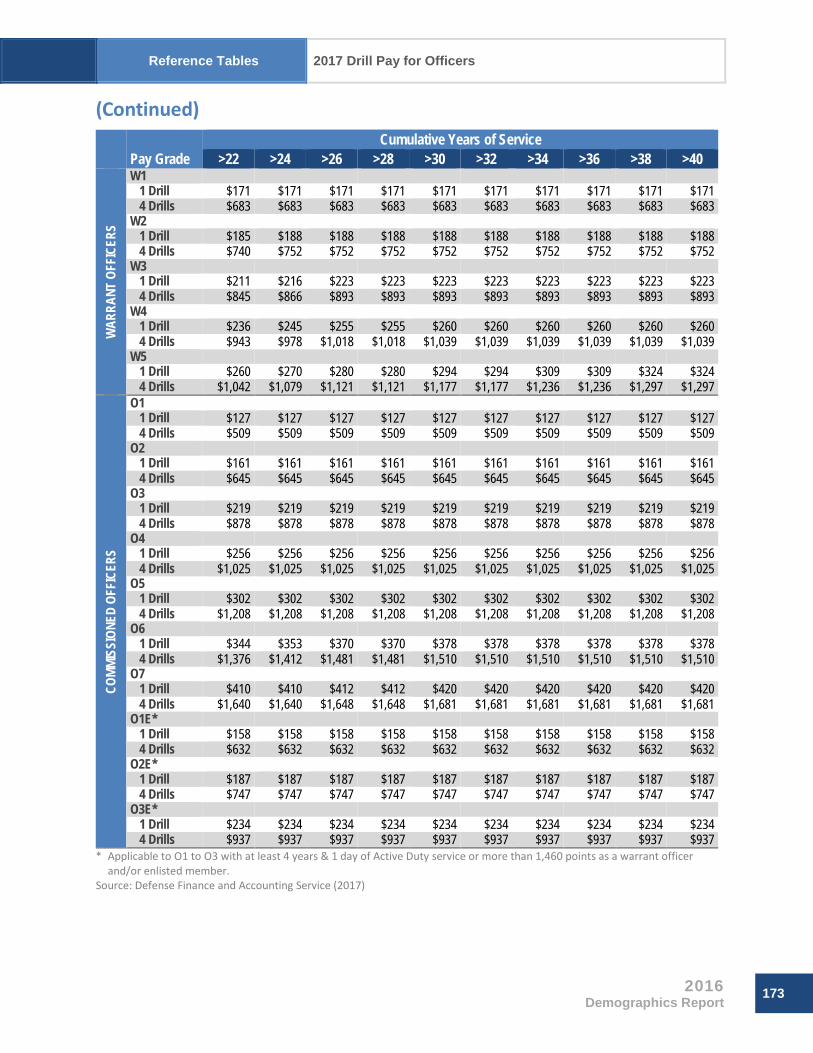
Reference Tables 2017 Drill Pay for Officers
2016 Demographics Report
173
(Continued)
Pay Grade Cumulative Years of Service
>22 >24 >26 >28 >30 >32 >34 >36 >38 >40
WAR
RANT
OFF
ICER
S
W1 1 Drill $171 $171 $171 $171 $171 $171 $171 $171 $171 $171 4 Drills $683 $683 $683 $683 $683 $683 $683 $683 $683 $683 W2 1 Drill $185 $188 $188 $188 $188 $188 $188 $188 $188 $188 4 Drills $740 $752 $752 $752 $752 $752 $752 $752 $752 $752 W3 1 Drill $211 $216 $223 $223 $223 $223 $223 $223 $223 $223 4 Drills $845 $866 $893 $893 $893 $893 $893 $893 $893 $893 W4 1 Drill $236 $245 $255 $255 $260 $260 $260 $260 $260 $260 4 Drills $943 $978 $1,018 $1,018 $1,039 $1,039 $1,039 $1,039 $1,039 $1,039 W5 1 Drill $260 $270 $280 $280 $294 $294 $309 $309 $324 $324 4 Drills $1,042 $1,079 $1,121 $1,121 $1,177 $1,177 $1,236 $1,236 $1,297 $1,297
COMM
ISSI
ONED
OFF
ICER
S
O1 1 Drill $127 $127 $127 $127 $127 $127 $127 $127 $127 $127 4 Drills $509 $509 $509 $509 $509 $509 $509 $509 $509 $509 O2 1 Drill $161 $161 $161 $161 $161 $161 $161 $161 $161 $161 4 Drills $645 $645 $645 $645 $645 $645 $645 $645 $645 $645 O3 1 Drill $219 $219 $219 $219 $219 $219 $219 $219 $219 $219 4 Drills $878 $878 $878 $878 $878 $878 $878 $878 $878 $878 O4 1 Drill $256 $256 $256 $256 $256 $256 $256 $256 $256 $256 4 Drills $1,025 $1,025 $1,025 $1,025 $1,025 $1,025 $1,025 $1,025 $1,025 $1,025 O5 1 Drill $302 $302 $302 $302 $302 $302 $302 $302 $302 $302 4 Drills $1,208 $1,208 $1,208 $1,208 $1,208 $1,208 $1,208 $1,208 $1,208 $1,208 O6 1 Drill $344 $353 $370 $370 $378 $378 $378 $378 $378 $378 4 Drills $1,376 $1,412 $1,481 $1,481 $1,510 $1,510 $1,510 $1,510 $1,510 $1,510 O7 1 Drill $410 $410 $412 $412 $420 $420 $420 $420 $420 $420 4 Drills $1,640 $1,640 $1,648 $1,648 $1,681 $1,681 $1,681 $1,681 $1,681 $1,681 O1E* 1 Drill $158 $158 $158 $158 $158 $158 $158 $158 $158 $158 4 Drills $632 $632 $632 $632 $632 $632 $632 $632 $632 $632 O2E* 1 Drill $187 $187 $187 $187 $187 $187 $187 $187 $187 $187 4 Drills $747 $747 $747 $747 $747 $747 $747 $747 $747 $747 O3E* 1 Drill $234 $234 $234 $234 $234 $234 $234 $234 $234 $234 4 Drills $937 $937 $937 $937 $937 $937 $937 $937 $937 $937
* Applicable to O1 to O3 with at least 4 years & 1 day of Active Duty service or more than 1,460 points as a warrant officer and/or enlisted member.
Source: Defense Finance and Accounting Service (2017)

Armed Forces Comparative Pay Grades and Ranks Reference Tables
174 2016 Demographics Report
Armed Forces Comparative Pay Grades and Ranks This table presents the list of Armed Forces ranks by Service branch and pay grade. While pay grades are administrative classifications used primarily to standardize compensation across the military services, ranks indicate a level of responsibility (for personnel, equipment, and mission), which grows with each increase in rank.
Pay Grades
Ranks by Branch of Service Army Navy Marine Corps Air Force* Coast Guard**
ENLI
STED
MEM
BERS
E1 Private Seaman Recruit Private Airman Basic Seaman Recruit E2 Private E-2 Seaman Apprentice Private First Class Airman Seaman Apprentice E3 Private First Class Seaman Lance Corporal Airman First Class Seaman
E4 Corporal
- or - Specialist
Petty Officer Third Class Corporal Sergeant Petty Officer Third Class
E5 Sergeant Petty Officer Second Class Sergeant Staff Sergeant Petty Officer Second Class
E6 Staff Sergeant Petty Officer First Class Staff Sergeant Technical Sergeant Petty Officer First Class
E7 Sergeant First Class Chief Petty Officer Gunnery Sergeant Master Sergeant
- or - First Sergeant
Chief Petty Officer
E8 First Sergeant
- or - Master Sergeant
Senior Chief Petty Officer First Sergeant
- or - Master Sergeant
Senior Master Sergeant
- or - First Sergeant
Senior Chief Petty Officer
E9 Sergeant Major
- or - Command Sergeant
Major
Master Chief Petty Officer - or -
Fleet/Command Master Chief Petty Officer
Sergeant Major - or -
Master Gunnery Sergeant
Chief Master Sergeant
- or - First Sergeant
Master Chief Petty Officer - or -
Fleet/Command Master Chief Petty Officer
WAR
RANT
OFF
ICER
S W1 Warrant Officer Warrant Officer Warrant Officer -- -- W2 Chief Warrant Officer Chief Warrant Officer Chief Warrant Officer -- Chief Warrant Officer W3 Chief Warrant Officer Chief Warrant Officer Chief Warrant Officer -- Chief Warrant Officer W4 Chief Warrant Officer Chief Warrant Officer Chief Warrant Officer -- Chief Warrant Officer
W5 Chief Warrant Officer Chief Warrant Officer Chief Warrant Officer -- --
COMM
ISSI
ONED
OFF
ICER
S O1 Second Lieutenant Ensign Second Lieutenant Second Lieutenant Ensign O2 First Lieutenant Lieutenant Junior Grade First Lieutenant First Lieutenant Lieutenant Junior Grade O3 Captain Lieutenant Captain Captain Lieutenant O4 Major Lieutenant Commander Major Major Lieutenant Commander O5 Lieutenant Colonel Commander Lieutenant Colonel Lieutenant Colonel Commander O6 Colonel Captain Colonel Colonel Captain O7 Brigadier General Rear Admiral (Lower) Brigadier General Brigadier General Rear Admiral (Lower) O8 Major General Rear Admiral (Upper) Major General Major General Rear Admiral (Upper) O9 Lieutenant General Vice Admiral Lieutenant General Lieutenant General Vice Admiral O10 General Admiral General General Admiral
** The Air Force does not have warrant officers. ** The Coast Guard does not use grades W1 or W5. Source: Defense Almanac

Reference Tables United States Installation Population by State
**** Bases with fewer than 100 Active Duty Sponsors are included in the Other category for their State. **** Nearest Metro City listed has population greater than 50,000. **** “NMC” stands for Nearest Metro City. **** United States Other includes personnel within the United States, but with unknown base and state. Note: The Sponsor column includes all Active Duty military personnel at each base. “C” refers to bases that have been closed. The number following “C” refers to the base realignment and closure (BRAC) round in which the base was closed.
2016 Demographics Report
175
United States Installation Population by State This table presents United States military bases organized by state. For each base, the zip code, nearest metro city, miles to nearest metro city, and total number of sponsors, dependents, and personnel are presented. The data in this table are based on the “duty locations” of the Sponsor only. There are instances where sponsors and dependents are co-located, but dependents may not be located at these installations.
Base* Service Branch
Zip Code
Nearest Metro City (NMC)**
Miles to NMC***
Total Sponsors
Total Dependents
Total Personnel
ALABAMA Fort Rucker Army 36362 Dothan 26 3,572 6,252 9,824 Maxwell AFB (Incl. Gunter) Air Force 36112 Montgomery 2 2,745 4,761 7,506 Redstone Arsenal Army 35898 Huntsville 1 660 1,679 2,339 Other 900 2,070 2,970 Alabama Total 7,877 14,762 22,639
ALASKA Eielson AFB Air Force 99702 Fairbanks 26 1,799 2,479 4,278 Elmendorf AFB Air Force 99506 Anchorage 2 5,509 7,633 13,142 Fort Jonathan Wainwright Army 99703 Fairbanks 1 7,199 9,560 16,759 Fort Richardson Army 99505 Anchorage 8 4,094 5,513 9,607 Other 100 253 353 Alaska Total 18,701 25,438 44,139
ARIZONA Davis-Monthan AFB Air Force 85707 Tucson 0 5,715 7,296 13,011 Fort Huachuca Army 85613 Tucson 75 3,635 5,209 8,844 Luke AFB Air Force 85309 Phoenix 20 3,368 4,445 7,813 Yuma MCAS Marine Corps 85369 Yuma 27 5,488 5,321 10,809 Yuma Proving Ground Army 85365 Yuma 30 128 354 482 Other 700 1,454 2,154 Arizona Total 19,034 24,079 43,113
ARKANSAS Little Rock AFB Air Force 72099 Little Rock 18 3,805 5,292 9,097 Other 127 295 422 Arkansas Total 3,932 5,587 9,519
CALIFORNIA 29 Palms MC Air/Ground Combat Center Marine Corps 92278 Palm Springs 60 9,412 6,915 16,327 Beale AFB Air Force 95903 Sacramento 35 3,955 4,796 8,751 Camp Pendleton Marine Corps 92055 San Diego 35 39,360 33,688 73,048 China Lake NAVWEAPCEN Navy 93555 Los Angeles 140 587 862 1,449 Coronado NAV AMPHIB Base Navy 92155 San Diego 5 5,302 6,960 12,262

United States Installation Population by State Reference Tables
**** Bases with fewer than 100 Active Duty Sponsors are included in the Other category for their State. **** Nearest Metro City listed has population greater than 50,000. **** “NMC” stands for Nearest Metro City. **** United States Other includes personnel within the United States, but with unknown base and state. Note: The Sponsor column includes all Active Duty military personnel at each base. “C” refers to bases that have been closed. The number following “C” refers to the base realignment and closure (BRAC) round in which the base was closed.
176 2016 Demographics Report
Base* Service Branch
Zip Code
Nearest Metro City (NMC)**
Miles to NMC***
Total Sponsors
Total Dependents
Total Personnel
Edwards AFB Air Force 93524 Los Angeles 95 2,082 2,885 4,967 El Centro NAF Navy 92243 El Centro 7 203 222 425 Fleet ASW Training Center Pacific Navy 92147 San Diego 7 1,434 2,380 3,814 Fort Irwin Army 92310 San Bernardino 70 3,960 6,234 10,194 Lemoore NAS Navy 93246 Fresno 40 4,127 4,901 9,028 Los Angeles AFB Air Force 90245 Los Angeles 10 1,352 2,054 3,406 March AFB Air Force 92518 San Bernardino 21 294 520 814 MCAS Miramar Marine Corps 92145 San Diego 10 7,814 7,624 15,438 Naval Medical Center San Diego Navy 92134 San Diego 0 3,597 4,657 8,254 Naval Postgraduate School Navy 93943 Monterey 0 758 1,288 2,046 North Island NAS Navy 92135 San Diego 4 7,439 9,649 17,088 Port Hueneme NCBC Navy 93043 Los Angeles 60 1,435 2,417 3,852 Presidio of Monterey Army 93944 Monterey 0 3,781 3,210 6,991 Pt Mugu NAS Navy 93042 Oxnard 7 904 1,279 2,183 San Diego MC Recruit Depot Marine Corps 92140 San Diego 2 6,205 2,398 8,603 San Diego NAVSTA Navy 92136 San Diego 0 31,089 33,230 64,319 San Diego NAVSUBBASE Navy 92106 San Diego 5 1,278 2,091 3,369 San Diego NSC Navy 92136 San Diego 0 280 465 745 Seal Beach NAVWEAPSTA Navy 90740 Long Beach 1 179 339 518 Travis AFB Air Force 94535 San Francisco 45 6,250 8,006 14,256 USMC Mountain Warfare Training Marine Corps 93517 Sacramento 100 210 311 521 Vandenberg AFB Air Force 93437 Santa Barbara 55 2,459 3,233 5,692 (C2) Sacramento Army Depot Army 95828 Sacramento 0 246 561 807 Other 3,232 6,206 9,438 California Total 149,224 159,381 308,605
COLORADO Buckley AFB Air Force 80011 Aurora 0 2,343 3,099 5,442 Fort Carson Army 80913 Colorado Springs 6 24,034 35,886 59,920 Peterson AFB Air Force 80914 Colorado Springs 6 3,684 6,442 10,126 Schriever AFB Air Force 80912 Colorado Springs 10 1,817 2,535 4,352 USAF Academy Air Force 80840 Colorado Springs 8 2,111 3,270 5,381 Other 827 1,677 2,504 Colorado Total 34,816 52,909 87,725
CONNECTICUT New London NAVSUBBASE Navy 06349 Hartford 50 6,292 7,597 13,889 Other 173 372 545 Connecticut Total 6,465 7,969 14,434

Reference Tables United States Installation Population by State
**** Bases with fewer than 100 Active Duty Sponsors are included in the Other category for their State. **** Nearest Metro City listed has population greater than 50,000. **** “NMC” stands for Nearest Metro City. **** United States Other includes personnel within the United States, but with unknown base and state. Note: The Sponsor column includes all Active Duty military personnel at each base. “C” refers to bases that have been closed. The number following “C” refers to the base realignment and closure (BRAC) round in which the base was closed.
2016 Demographics Report
177
Base* Service Branch
Zip Code
Nearest Metro City (NMC)**
Miles to NMC***
Total Sponsors
Total Dependents
Total Personnel
DELAWARE Dover AFB Air Force 19902 Dover 5 3,324 4,254 7,578 Other 28 70 98 Delaware Total 3,352 4,324 7,676
DISTRICT OF COLUMBIA Fort Lesley J McNair Army 20319 Washington D.C. 0 963 2,464 3,427 Joint Base Anacostia-Bolling DoD 20332 Washington D.C. 0 2,176 3,629 5,805 Marine Barracks, Washington, D.C. Marine Corps 20390 Washington D.C. 0 1,552 2,050 3,602 Walter Reed Army Medical Center Army 20307 Washington D.C. 0 308 635 943 Washington NAVDIST HQ Navy 20374 Washington D.C. 0 3,219 5,424 8,643 Other 797 1,513 2,310 District of Columbia Total 9,015 15,715 24,730
FLORIDA Blount Island Marine Corps 32226 Jacksonville 0 111 209 320 Corry Station NTTC Navy 32511 Pensacola 5 2,754 1,735 4,489 Eglin AFB Air Force 32542 Pensacola 40 7,804 11,735 19,539 Hurlburt Field Air Force 32544 Pensacola 35 7,640 10,462 18,102 Jacksonville NAS Navy 32212 Jacksonville 9 5,741 8,533 14,274 Key West NAS Navy 33040 Miami 150 761 1,066 1,827 Macdill AFB Air Force 33621 Tampa 5 5,505 10,201 15,706 Mayport NAVSTA Navy 32228 Jacksonville 10 9,242 12,803 22,045 Nav Coastal Systems Ctr Navy 32407 Panama City 0 512 774 1,286 Naval Hospital Pensacola Navy 32512 Pensacola 0 793 1,074 1,867 NSA Orlando Navy 32826 Orlando 0 158 328 486 Patrick AFB Air Force 32925 Orlando 45 1,462 2,339 3,801 Pensacola NAS Navy 32508 Pensacola 8 7,291 6,432 13,723 Southern Command Army 33172 Miami 0 737 1,488 2,225 Tyndall AFB Air Force 32403 Panama City 12 3,343 4,683 8,026 Whiting Field NAS Navy 32570 Pensacola 30 1,027 931 1,958 (C3) Homestead AFB Air Force 33039 Miami 30 352 615 967 Other 2,303 4,726 7,029 Florida Total 57,536 80,134 137,670
GEORGIA Albany MCLB Marine Corps 31704 Albany 3 315 644 959 Fort Benning Army 31905 Columbus 5 19,920 20,643 40,563 Fort Gordon Army 30905 Augusta 12 11,373 15,694 27,067 Fort Stewart Army 31314 Savannah 35 19,791 29,901 49,692 Kings Bay NAVSUBBASE Navy 31547 Jacksonville, FL 40 2,717 3,875 6,592

United States Installation Population by State Reference Tables
**** Bases with fewer than 100 Active Duty Sponsors are included in the Other category for their State. **** Nearest Metro City listed has population greater than 50,000. **** “NMC” stands for Nearest Metro City. **** United States Other includes personnel within the United States, but with unknown base and state. Note: The Sponsor column includes all Active Duty military personnel at each base. “C” refers to bases that have been closed. The number following “C” refers to the base realignment and closure (BRAC) round in which the base was closed.
178 2016 Demographics Report
Base* Service Branch
Zip Code
Nearest Metro City (NMC)**
Miles to NMC***
Total Sponsors
Total Dependents
Total Personnel
Moody AFB Air Force 31699 Valdosta 10 4,282 5,679 9,961 Robins AFB Air Force 31098 Macon 15 3,286 4,941 8,227 Other 1,323 2,876 4,199 Georgia Total 63,007 84,253 147,260
HAWAII Camp H. M. Smith Marine Corps 96861 Honolulu 10 1,233 2,522 3,755 Fort Shafter Army 96858 Honolulu 7 2,957 5,640 8,597 Hickam AFB Air Force 96853 Honolulu 9 5,242 7,562 12,804 MCBH Kaneohe Bay Marine Corps 96863 Honolulu 14 7,660 6,439 14,099 Naval Base Pearl Harbor Navy 96860 Honolulu 6 9,954 11,720 21,674 Navcams E. Pacific Navy 96786 Honolulu 21 636 671 1,307 Schofield Barracks Army 96857 Honolulu 20 16,754 23,231 39,985 Tripler Army Medical Center Army 96859 Honolulu 3 1,947 3,060 5,007 Other 520 882 1,402 Hawaii Total 46,903 61,727 108,630
IDAHO Mountain Home AFB Air Force 83648 Boise 50 3,207 3,858 7,065 Other 129 318 447 Idaho Total 3,336 4,176 7,512
ILLINOIS Naval Station Great Lakes Navy 60088 Chicago 30 10,267 6,033 16,300 Rock Island Arsenal Army 61201 Davenport, IA 4 408 989 1,397 Scott AFB Air Force 62225 St. Louis, MO 23 4,455 7,789 12,244 Other 700 1,548 2,248 Illinois Total 15,830 16,359 32,189
INDIANA DFAS Indianapolis Center DoD 46226 Indianapolis 14 132 282 414 (C2) Fort Benjamin Harrison Army 46216 Indianapolis 14 396 1,068 1,464 Other 365 790 1,155 Indiana Total 893 2,140 3,033
IOWA Other 210 493 703 Iowa Total 210 493 703

Reference Tables United States Installation Population by State
**** Bases with fewer than 100 Active Duty Sponsors are included in the Other category for their State. **** Nearest Metro City listed has population greater than 50,000. **** “NMC” stands for Nearest Metro City. **** United States Other includes personnel within the United States, but with unknown base and state. Note: The Sponsor column includes all Active Duty military personnel at each base. “C” refers to bases that have been closed. The number following “C” refers to the base realignment and closure (BRAC) round in which the base was closed.
2016 Demographics Report
179
Base* Service Branch
Zip Code
Nearest Metro City (NMC)**
Miles to NMC***
Total Sponsors
Total Dependents
Total Personnel
KANSAS Fort Leavenworth Army 66027 Kansas City 30 3,306 7,282 10,588 Fort Riley Army 66442 Topeka 50 15,865 23,003 38,868 McConnell AFB Air Force 67221 Wichita 6 2,933 3,769 6,702 Other 161 403 564 Kansas Total 22,265 34,457 56,722
KENTUCKY Fort Campbell Army 42223 Nashville 50 27,335 40,172 67,507 Fort Knox Army 40121 Louisville 25 4,772 6,841 11,613 Other 445 1,109 1,554 Kentucky Total 32,552 48,122 80,674
LOUISIANA Barksdale AFB Air Force 71110 Shreveport 1 5,078 6,997 12,075 Fort Polk Army 71459 Alexandria 60 7,611 10,894 18,505 New Orleans NAS JRB Navy 70143 New Orleans 0 414 666 1,080 Other 895 1,618 2,513 Louisiana Total 13,998 20,175 34,173
MAINE Other 276 456 732 Maine Total 276 456 732
MARYLAND Aberdeen Proving Ground Army 21005 Baltimore 23 1,078 2,289 3,367 Andrews AFB Air Force 20762 Washington D.C. 10 4,274 5,999 10,273 Annapolis NS (Incl. USNA) Navy 21402 Annapolis 0 1,220 1,879 3,099
Fort Detrick Army 21702 Baltimore/ Wash. D.C. 50
1,045 2,048 3,093 Fort George G. Meade Army 20755 Baltimore 15 10,845 15,745 26,590 Indian Head NAV ORD STA Navy 20640 Washington D.C. 25 690 880 1,570 NNMC Bethesda Navy 20889 Washington D.C. 1 3,857 5,476 9,333 Patuxent River NAS Navy 20670 Washington D.C. 65 2,359 4,436 6,795 (C4) White Oak NSWC Dahlgren Navy 20903 Washington D.C. 5 571 829 1,400 Other 1,083 1,911 2,994 Maryland Total 27,022 41,492 68,514
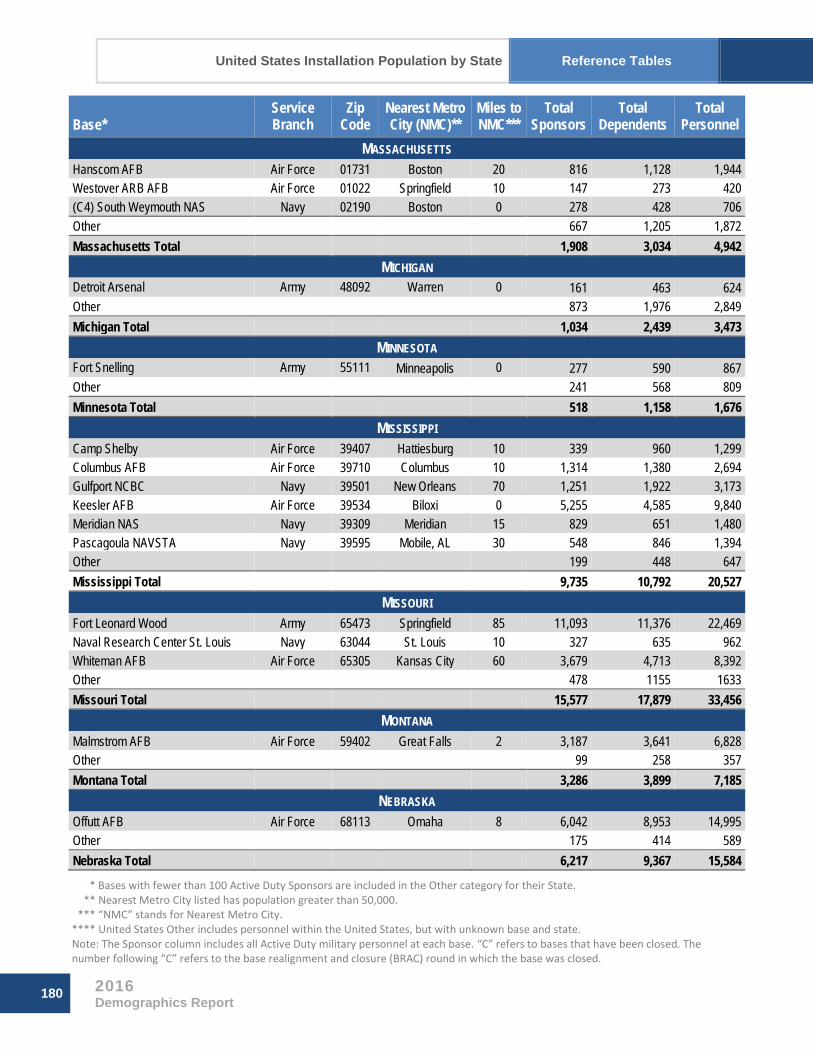
United States Installation Population by State Reference Tables
**** Bases with fewer than 100 Active Duty Sponsors are included in the Other category for their State. **** Nearest Metro City listed has population greater than 50,000. **** “NMC” stands for Nearest Metro City. **** United States Other includes personnel within the United States, but with unknown base and state. Note: The Sponsor column includes all Active Duty military personnel at each base. “C” refers to bases that have been closed. The number following “C” refers to the base realignment and closure (BRAC) round in which the base was closed.
180 2016 Demographics Report
Base* Service Branch
Zip Code
Nearest Metro City (NMC)**
Miles to NMC***
Total Sponsors
Total Dependents
Total Personnel
MASSACHUSETTS Hanscom AFB Air Force 01731 Boston 20 816 1,128 1,944 Westover ARB AFB Air Force 01022 Springfield 10 147 273 420 (C4) South Weymouth NAS Navy 02190 Boston 0 278 428 706 Other 667 1,205 1,872 Massachusetts Total 1,908 3,034 4,942
MICHIGAN Detroit Arsenal Army 48092 Warren 0 161 463 624 Other 873 1,976 2,849 Michigan Total 1,034 2,439 3,473
MINNESOTA Fort Snelling Army 55111 Minneapolis 0 277 590 867 Other 241 568 809 Minnesota Total 518 1,158 1,676
MISSISSIPPI Camp Shelby Air Force 39407 Hattiesburg 10 339 960 1,299 Columbus AFB Air Force 39710 Columbus 10 1,314 1,380 2,694 Gulfport NCBC Navy 39501 New Orleans 70 1,251 1,922 3,173 Keesler AFB Air Force 39534 Biloxi 0 5,255 4,585 9,840 Meridian NAS Navy 39309 Meridian 15 829 651 1,480 Pascagoula NAVSTA Navy 39595 Mobile, AL 30 548 846 1,394 Other 199 448 647 Mississippi Total 9,735 10,792 20,527
MISSOURI Fort Leonard Wood Army 65473 Springfield 85 11,093 11,376 22,469 Naval Research Center St. Louis Navy 63044 St. Louis 10 327 635 962 Whiteman AFB Air Force 65305 Kansas City 60 3,679 4,713 8,392 Other 478 1155 1633 Missouri Total 15,577 17,879 33,456
MONTANA Malmstrom AFB Air Force 59402 Great Falls 2 3,187 3,641 6,828 Other 99 258 357 Montana Total 3,286 3,899 7,185
NEBRASKA Offutt AFB Air Force 68113 Omaha 8 6,042 8,953 14,995 Other 175 414 589 Nebraska Total 6,217 9,367 15,584

Reference Tables United States Installation Population by State
**** Bases with fewer than 100 Active Duty Sponsors are included in the Other category for their State. **** Nearest Metro City listed has population greater than 50,000. **** “NMC” stands for Nearest Metro City. **** United States Other includes personnel within the United States, but with unknown base and state. Note: The Sponsor column includes all Active Duty military personnel at each base. “C” refers to bases that have been closed. The number following “C” refers to the base realignment and closure (BRAC) round in which the base was closed.
2016 Demographics Report
181
Base* Service Branch
Zip Code
Nearest Metro City (NMC)**
Miles to NMC***
Total Sponsors
Total Dependents
Total Personnel
NEVADA Fallon NAS Navy 89496 Reno 70 841 1,019 1,860 Nellis AFB Air Force 89191 Las Vegas 8 9,242 11,869 21,111 Other 181 399 580 Nevada Total 10,264 13,287 23,551
NEW HAMPSHIRE Pease AGB Air Force 03801 Portsmouth 0 121 200 321 Portsmouth Naval Shipyard Navy 03804 Portsmouth 0 1,152 1,471 2,623 Other 105 211 316 New Hampshire Total 1,378 1,882 3,260
NEW JERSEY Earle NAVWEAPSTA Navy 07722 Newark 50 251 436 687 Fort Dix Army 08640 Trenton 17 785 1,768 2,553 McGuire AFB Air Force 08641 Trenton 18 4,171 5,477 9,648 Picatinny Arsenal Army 07806 Newark 30 130 289 419 (C4) Lakehurst Naval Air Engineering Center Navy 08733 Philadelphia, PA 57 298 513 811 Other 249 482 731 New Jersey Total 5,884 8,965 14,849
NEW MEXICO Cannon AFB Air Force 88103 Clovis 7 4,701 5,169 9,870 Holloman AFB Air Force 88330 Las Cruces 50 3,725 4,573 8,298 Kirtland AFB Air Force 87117 Albuquerque 4 3,278 4,356 7,634 White Sands Missile Range Army 88002 El Paso, TX 45 338 566 904 Other 167 370 537 New Mexico Total 12,209 15,034 27,243
NEW YORK 1st Marine Corps District Marine Corps 11530 New York 25 387 683 1,070 Fort Drum Army 13602 Watertown 8 15,118 19,618 34,736 Fort Hamilton Army 11252 New York 0 179 406 585 Scotia Naval Admin Ballston Navy 12302 Schenectady 3 1,693 1,152 2,845 Stewart Newburgh USARC Army 12550 New York 60 247 323 570 Watervliet Arsenal Army 12189 Troy 1 128 286 414 West Point MILRES Army 10996 New York 50 1,516 2,917 4,433 Other 1,045 2,005 3,050 New York Total 20,313 27,390 47,703

United States Installation Population by State Reference Tables
**** Bases with fewer than 100 Active Duty Sponsors are included in the Other category for their State. **** Nearest Metro City listed has population greater than 50,000. **** “NMC” stands for Nearest Metro City. **** United States Other includes personnel within the United States, but with unknown base and state. Note: The Sponsor column includes all Active Duty military personnel at each base. “C” refers to bases that have been closed. The number following “C” refers to the base realignment and closure (BRAC) round in which the base was closed.
182 2016 Demographics Report
Base* Service Branch
Zip Code
Nearest Metro City (NMC)**
Miles to NMC***
Total Sponsors
Total Dependents
Total Personnel
NORTH CAROLINA Camp Lejeune MCB Marine Corps 28542 Jacksonville 3 36,005 32,786 68,791 Cherry Point MCAS Marine Corps 28533 Moorehead City 20 7,114 7,229 14,343 Cherry Point Naval Aviation Navy 28533 Moorehead City 20 374 502 876 Fort Bragg Army 28307 Fayetteville 10 45,153 68,473 113,626 New River MCAS Marine Corps 28545 Jacksonville 2 6,505 6,403 12,908 Pope AFB Air Force 28308 Fayetteville 12 1,594 2,378 3,972 Seymour Johnson AFB Air Force 27531 Raleigh 50 4,188 5,146 9,334 Other 1,068 2,353 3,421 North Carolina Total 102,001 125,270 227,271
NORTH DAKOTA Grand Forks AFB Air Force 58205 Grand Forks 15 1,590 1,954 3,544 Minot AFB Air Force 58705 Minot 13 5,512 5,693 11,205 Other 46 112 158 North Dakota Total 7,148 7,759 14,907
OHIO Columbus Def Depot Army 43216 Columbus 0 217 496 713 Wright-Patterson AFB Air Force 45433 Dayton 10 5,331 8,729 14,060 Other 875 2,019 2,894 Ohio Total 6,423 11,244 17,667
OKLAHOMA Altus AFB Air Force 73523 Oklahoma City 120 1,299 1,776 3,075 Fort Sill Army 73503 Oklahoma City 90 11,766 13,403 25,169 Tinker AFB Air Force 73145 Oklahoma City 12 5,689 7,922 13,611 Vance AFB Air Force 73705 Oklahoma City 90 1,217 1,272 2,489 Other 285 716 1,001 Oklahoma Total 20,256 25,089 45,345
OREGON Portland IAP AGS Air Force 97218 Portland 0 130 246 376 Other 393 765 1,158 Oregon Total 523 1,011 1,534
PENNSYLVANIA Carlisle Barracks Army 17013 Harrisburg 18 525 1,444 1,969 Defense Distribution Depot Susquehanna Army 17070 Philadelphia 60 282 642 924 Defense Supply Ctr Philadelphia DoD 19111 Philadelphia 0 341 675 1,016
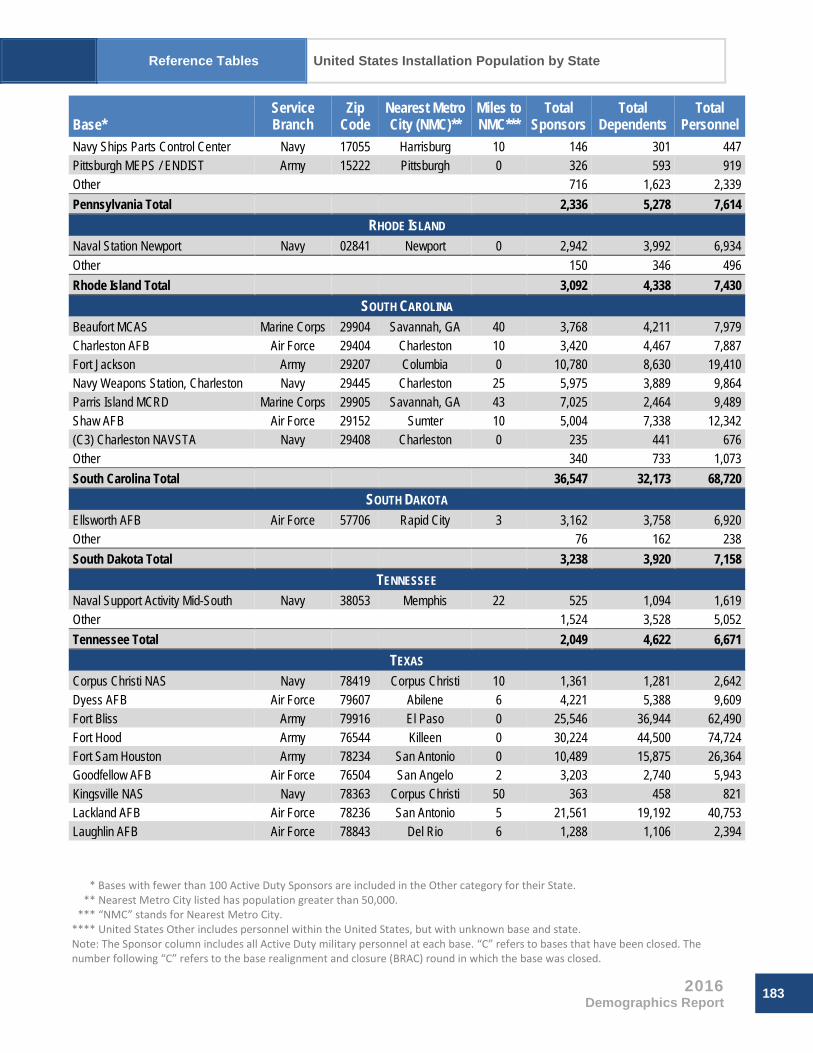
Reference Tables United States Installation Population by State
**** Bases with fewer than 100 Active Duty Sponsors are included in the Other category for their State. **** Nearest Metro City listed has population greater than 50,000. **** “NMC” stands for Nearest Metro City. **** United States Other includes personnel within the United States, but with unknown base and state. Note: The Sponsor column includes all Active Duty military personnel at each base. “C” refers to bases that have been closed. The number following “C” refers to the base realignment and closure (BRAC) round in which the base was closed.
2016 Demographics Report
183
Base* Service Branch
Zip Code
Nearest Metro City (NMC)**
Miles to NMC***
Total Sponsors
Total Dependents
Total Personnel
Navy Ships Parts Control Center Navy 17055 Harrisburg 10 146 301 447 Pittsburgh MEPS / ENDIST Army 15222 Pittsburgh 0 326 593 919 Other 716 1,623 2,339 Pennsylvania Total 2,336 5,278 7,614
RHODE ISLAND Naval Station Newport Navy 02841 Newport 0 2,942 3,992 6,934 Other 150 346 496 Rhode Island Total 3,092 4,338 7,430
SOUTH CAROLINA Beaufort MCAS Marine Corps 29904 Savannah, GA 40 3,768 4,211 7,979 Charleston AFB Air Force 29404 Charleston 10 3,420 4,467 7,887 Fort Jackson Army 29207 Columbia 0 10,780 8,630 19,410 Navy Weapons Station, Charleston Navy 29445 Charleston 25 5,975 3,889 9,864 Parris Island MCRD Marine Corps 29905 Savannah, GA 43 7,025 2,464 9,489 Shaw AFB Air Force 29152 Sumter 10 5,004 7,338 12,342 (C3) Charleston NAVSTA Navy 29408 Charleston 0 235 441 676 Other 340 733 1,073 South Carolina Total 36,547 32,173 68,720
SOUTH DAKOTA Ellsworth AFB Air Force 57706 Rapid City 3 3,162 3,758 6,920 Other 76 162 238 South Dakota Total 3,238 3,920 7,158
TENNESSEE Naval Support Activity Mid-South Navy 38053 Memphis 22 525 1,094 1,619 Other 1,524 3,528 5,052 Tennessee Total 2,049 4,622 6,671
TEXAS Corpus Christi NAS Navy 78419 Corpus Christi 10 1,361 1,281 2,642 Dyess AFB Air Force 79607 Abilene 6 4,221 5,388 9,609 Fort Bliss Army 79916 El Paso 0 25,546 36,944 62,490 Fort Hood Army 76544 Killeen 0 30,224 44,500 74,724 Fort Sam Houston Army 78234 San Antonio 0 10,489 15,875 26,364 Goodfellow AFB Air Force 76504 San Angelo 2 3,203 2,740 5,943 Kingsville NAS Navy 78363 Corpus Christi 50 363 458 821 Lackland AFB Air Force 78236 San Antonio 5 21,561 19,192 40,753 Laughlin AFB Air Force 78843 Del Rio 6 1,288 1,106 2,394
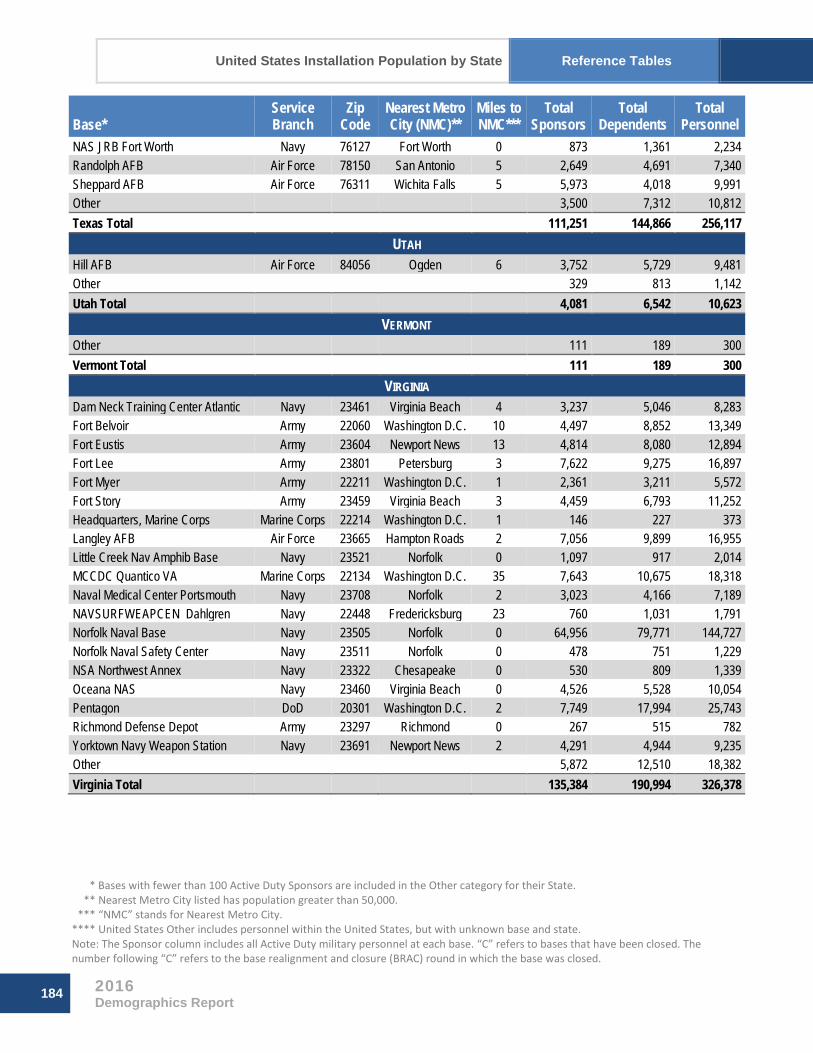
United States Installation Population by State Reference Tables
**** Bases with fewer than 100 Active Duty Sponsors are included in the Other category for their State. **** Nearest Metro City listed has population greater than 50,000. **** “NMC” stands for Nearest Metro City. **** United States Other includes personnel within the United States, but with unknown base and state. Note: The Sponsor column includes all Active Duty military personnel at each base. “C” refers to bases that have been closed. The number following “C” refers to the base realignment and closure (BRAC) round in which the base was closed.
184 2016 Demographics Report
Base* Service Branch
Zip Code
Nearest Metro City (NMC)**
Miles to NMC***
Total Sponsors
Total Dependents
Total Personnel
NAS JRB Fort Worth Navy 76127 Fort Worth 0 873 1,361 2,234 Randolph AFB Air Force 78150 San Antonio 5 2,649 4,691 7,340 Sheppard AFB Air Force 76311 Wichita Falls 5 5,973 4,018 9,991 Other 3,500 7,312 10,812 Texas Total 111,251 144,866 256,117
UTAH Hill AFB Air Force 84056 Ogden 6 3,752 5,729 9,481 Other 329 813 1,142 Utah Total 4,081 6,542 10,623
VERMONT Other 111 189 300 Vermont Total 111 189 300
VIRGINIA Dam Neck Training Center Atlantic Navy 23461 Virginia Beach 4 3,237 5,046 8,283 Fort Belvoir Army 22060 Washington D.C. 10 4,497 8,852 13,349 Fort Eustis Army 23604 Newport News 13 4,814 8,080 12,894 Fort Lee Army 23801 Petersburg 3 7,622 9,275 16,897 Fort Myer Army 22211 Washington D.C. 1 2,361 3,211 5,572 Fort Story Army 23459 Virginia Beach 3 4,459 6,793 11,252 Headquarters, Marine Corps Marine Corps 22214 Washington D.C. 1 146 227 373 Langley AFB Air Force 23665 Hampton Roads 2 7,056 9,899 16,955 Little Creek Nav Amphib Base Navy 23521 Norfolk 0 1,097 917 2,014 MCCDC Quantico VA Marine Corps 22134 Washington D.C. 35 7,643 10,675 18,318 Naval Medical Center Portsmouth Navy 23708 Norfolk 2 3,023 4,166 7,189 NAVSURFWEAPCEN Dahlgren Navy 22448 Fredericksburg 23 760 1,031 1,791 Norfolk Naval Base Navy 23505 Norfolk 0 64,956 79,771 144,727 Norfolk Naval Safety Center Navy 23511 Norfolk 0 478 751 1,229 NSA Northwest Annex Navy 23322 Chesapeake 0 530 809 1,339 Oceana NAS Navy 23460 Virginia Beach 0 4,526 5,528 10,054 Pentagon DoD 20301 Washington D.C. 2 7,749 17,994 25,743 Richmond Defense Depot Army 23297 Richmond 0 267 515 782 Yorktown Navy Weapon Station Navy 23691 Newport News 2 4,291 4,944 9,235 Other 5,872 12,510 18,382 Virginia Total 135,384 190,994 326,378

Reference Tables United States Installation Population by State
**** Bases with fewer than 100 Active Duty Sponsors are included in the Other category for their State. **** Nearest Metro City listed has population greater than 50,000. **** “NMC” stands for Nearest Metro City. **** United States Other includes personnel within the United States, but with unknown base and state. Note: The Sponsor column includes all Active Duty military personnel at each base. “C” refers to bases that have been closed. The number following “C” refers to the base realignment and closure (BRAC) round in which the base was closed.
2016 Demographics Report
185
Base* Service Branch
Zip Code
Nearest Metro City (NMC)**
Miles to NMC***
Total Sponsors
Total Dependents
Total Personnel
WASHINGTON Fairchild AFB Air Force 99011 Spokane 18 2,792 3,586 6,378 Fort Lewis Army 98433 Tacoma 12 27,649 41,222 68,871 McChord AFB Air Force 98438 Tacoma 9 2,881 3,744 6,625 Naval Base Kitsap-Bangor Navy 98315 Bremerton 16 5,546 7,327 12,873 Naval Base Kitsap-Bremerton Navy 98337 Bremerton 0 7,486 7,142 14,628 Naval Hospital Bremerton Navy 98312 Bremerton 1 684 912 1,596 Naval Station Everett Navy 98207 Seattle 25 1,743 2,273 4,016 Whidbey Island NAS Navy 98278 Seattle 80 5,800 7,176 12,976 Other 820 1,774 2,594 Washington Total 55,401 75,156 130,557
WEST VIRGINIA Other 116 257 373 West Virginia Total 116 257 373
WISCONSIN Fort McCoy Army 54656 La Crosse 43 245 646 891 Other 380 844 1,224 Wisconsin Total 625 1,490 2,115
WYOMING Francis E Warren AFB Air Force 82005 Cheyenne 0 2,954 3,479 6,433 Other 70 141 211 Wyoming Total 3,024 3,620 6,644
UNITED STATES United States Other**** 5,963 5,003 10,966 United States Total 1,124,136 1,468,095 2,592,231 Source: DMDC Active Duty Family Sponsors & Eligible Dependents Report by Base (September 2016)
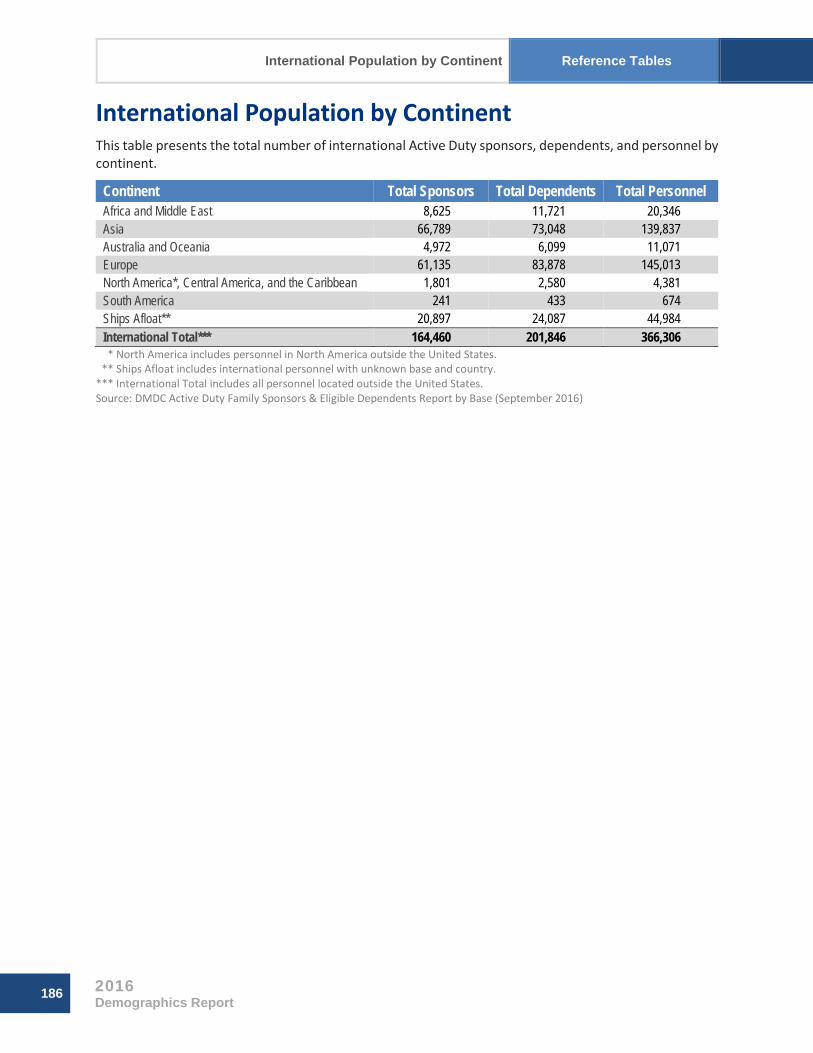
International Population by Continent Reference Tables
186 2016 Demographics Report
International Population by Continent This table presents the total number of international Active Duty sponsors, dependents, and personnel by continent.
Continent Total Sponsors Total Dependents Total Personnel Africa and Middle East 8,625 11,721 20,346 Asia 66,789 73,048 139,837 Australia and Oceania 4,972 6,099 11,071 Europe 61,135 83,878 145,013 North America*, Central America, and the Caribbean 1,801 2,580 4,381 South America 241 433 674 Ships Afloat** 20,897 24,087 44,984 International Total*** 164,460 201,846 366,306
*** North America includes personnel in North America outside the United States. *** Ships Afloat includes international personnel with unknown base and country. *** International Total includes all personnel located outside the United States. Source: DMDC Active Duty Family Sponsors & Eligible Dependents Report by Base (September 2016)

187
DATA SOURCES AND REFERENCES
The following presents a list of electronic data sources, publications, and documents used to create the 2016 Demographics Report.

188
This page is intentionally blank.

Data Sources and References
2016 Demographics Report
189
Data Sources and References The following is a list of electronic data sources, publications, and documents used to create the 2016 Demographics Report.
American Forces Information Service. (1953–2016). Defense Almanac. Alexandria, VA.
Bureau of Labor Statistics. (2016). Current Population Survey. Washington, DC.
Defense Finance and Accounting Service. (2017). Arlington, VA.
Defense Manpower Data Center (DMDC). Arlington, VA.
Active Duty Family Sponsors & Eligible Dependents Report by Base (September 2016)
Active Duty Military Personnel Master File (September 2000, 2005, 2010, 2015, 2016)
Active Duty Military Family File (September 2000, 2005, 2010, 2015, 2016)
Active Duty Personnel Transaction Files (September 2000, 2005, 2010, 2015, 2016)
DoD Appropriated Funds (APF) Civilian Master File (2016)
DoD Non-Appropriated Funds (NAF) Civilian File (2016)
Reserve Components Common Personnel Data System (September 2000, 2005, 2010, 2015, 2016)
Reserve Components Family File (September 2000, 2005, 2010, 2015, 2016)
Status of Forces Survey of Active-Duty Members: Tabulations of Responses (2000, 2005, 2010, 2015, 2016)
Department of Defense, Office of the Assistant Secretary of Defense (Reserve Affairs). (September 2016). Official Guard and Reserve Manpower Strengths and Statistics. Washington, DC.
Department of Defense Personnel. Correspondence with the Office of the Deputy Assistant Secretary of Defense for Military Community and Family Policy. The Pentagon, Arlington, VA.
U.S. Census Bureau. Washington, DC.
Educational Attainment in the United States (2016)
Washington Headquarters Service, Directorate for Information Operations and Reports (2000). Washington, DC.
