2016 customer service performance report · 2016 customer service performance report ... ngdcs. a...
TRANSCRIPT

2016 CUSTOMER SERVICE PERFORMANCE REPORTPENNSYLVANIA ELECTRIC & NATURAL GAS DISTRIBUTION COMPANIES
PENNSYLVANIA PUBLIC UTILITY COMMISSIONBUREAU OF CONSUMER SERVICES

Customer Service Performance Report 2016
August 2017
Published by:
Pennsylvania Public Utility Commission PO Box 3265
Harrisburg, PA 17105-3265 www.puc.pa.gov
Bureau of Consumer Services Alexis Bechtel, Director

i
Table of Contents Introduction ................................................................................................................. 1
I. Company-Reported Performance Data
A. Telephone Access 1. Busy-Out Rate ...................................................................................................................... 5 2. Call Abandonment Rate ........................................................................................................ 7 3. Percent of Calls Answered Within 30 Seconds ..................................................................... 8
B. Billing 1. Number and Percent of Residential Bills Not Rendered Once Every Billing Period ............ 11 2. Number and Percent of Bills to Small-Business Customers Not Rendered Once Every
Billing Period ....................................................................................................................... 12
C. Meter Reading 1. Number and Percent of Residential Meters Not Read by Company or Customers in Six
Months ................................................................................................................................ 14 2. Number and Percent of Residential Meters Not Read in 12 Months ................................... 15 3. Number and Percent of Residential Remote Meters Not Read in Five Years ..................... 17
D. Response to Disputes 1. Number of Residential Disputes That Did Not Receive a Response within 30 Days .......... 18 II. Customer Transaction Survey Results A. Reaching the Company .................................................................................... 21 B. Automated Phone Systems .............................................................................. 22 C. Company Representatives ............................................................................... 23 D. Overall Satisfaction .......................................................................................... 27 III. Conclusion ............................................................................................................. 29

ii
Appendix A Table 1A Electric Distribution Company (EDC) Survey Results 30 Table 1B EDC Survey Results (continued) 30 Table 2 Overall Satisfaction with Contact: EDC Credit/Collection Calls v. Other Calls 31 Table 3 Contacting an EDC 31 Table 4 Consumer Ratings of EDC Representatives ...................................................................................................................................... 32 Table 5A Premises Visit from an EDC Field Representative ........................................................................................................................................ 32 Table 5B Premises Visit (continued) 33 Table 6 Characteristics of 2015 EDC Survey Participants 33 Table 7 Average Number of EDC Residential Customers 34
Appendix B Table 1A Natural Gas Distribution Company (NGDC) Survey Results 35 Table 1B NGDC Survey Results (continued) 35 Table 2 Overall Satisfaction with Contact: NGDC Credit/Collection Calls v. Other Calls 36 Table 3 Contacting an NGDC 36 Table 4 Consumer Ratings of NGDC Representatives ...................................................................................................................................... 37 Table 5A Premises Visit from an NGDC Field Representative ........................................................................................................................................ 37 Table 5B Premises Visit (continued) 38 Table 6 Characteristics of 2015 NGDC Survey Participants 38

ii
Table 7 Average Number of NGDC Residential Customers 39

1
Introduction
This report1 by the Public Utility Commission (PUC or Commission) presents quality of service data for the major electric distribution companies2 (EDCs) and the major natural gas distribution companies3 (NGDCs). The Electricity Generation Customer Choice and Competition Act4 and the Natural Gas Choice and Competition Act5 require the EDCs and NGDCs to maintain, at a minimum, the levels of customer service that existed prior to the effective dates of the acts. In response, the Commission took steps to ensure the continued provision of high-quality customer service through the implementation of regulations that require the EDCs6 and the NGDCs7 to report statistics on important components of customer service, including: telephone access to the company; billing frequency; meter reading; timely response to customer disputes; and the level of customer satisfaction with the company’s handling of recent interactions with its customers.8
NGDCs that serve fewer than 100,000 residential accounts are not required to report the same statistics as the larger companies. The smaller NGDCs must perform mail surveys of customers who contact them and report the survey results to the Commission. The smaller NGDCs surveyed their customers in 2016 and sent the results in 2017. The Bureau of Consumer Services (BCS) has summarized the information supplied by the EDCs and NGDCs, as well as the survey data supplied by the survey company, into the charts and tables that appear on the following pages.
The reporting requirements9 include a provision that BCS is to report to the Commission various statistics associated with informal consumer complaints and payment agreement requests (PARs) filed with the Commission. BCS is to report a “justified consumer complaint rate,” a “justified PAR rate,” “the number of informally verified infractions of applicable statutes and regulations” and an “infraction rate” for the EDCs and NGDCs. A justified informal consumer complaint is a complaint where the BCS has determined that the utility did not follow Commission procedures or regulations. The justified informal consumer complaint rate is the number of justified, informal, residential consumer complaints per 1,000 residential customers, as determined by the BCS. A PAR is justified where a utility did not follow Commission negotiation procedures or regulations. The justified rate is the number of justified complaints or PARs, as determined by the BCS, from residential customers per 1,000 residential customers. An informally verified infraction is an apparent misapplication of Commission statutes or regulations as determined by the BCS through its examination of information obtained as part of its review of informal consumer complaints and PARs. The infraction rate is the number of informally
1 This report fulfills the requirements of 52 Pa. Code § 54.156 and 52 Pa. Code § 62.37 2 Duquesne Light Co. (Duquesne); PPL Electric Utilities Corporation (PPL); PECO Energy Co. (PECO); UGI Utilities Inc. (UGI-Electric); and the FirstEnergy companies –Metropolitan Edison Co. (Met-Ed), Pennsylvania Electric Co. (Penelec); Pennsylvania Power Co. (Penn Power) and West Penn Power Co. F.K.A. Allegheny Power Co. (West Penn)
3 Columbia Gas of Pennsylvania Inc. (Columbia); National Fuel Gas Co. (NFG); Peoples – Equitable Division (Peoples–Equitable); Peoples Natural Gas Co. (Peoples) (See page 5, Treatment of Peoples Companies); Philadelphia Gas Works (PGW); UGI Penn Natural; and UGI Utilities Inc. (UGI-Gas) (See page 5, Treatment of PECO Energy)
4 66 Pa. C.S. §§ 2801-2812 5 66 Pa. C.S. Chapter 22 6 Rulemaking on EDC Reporting Requirements for Quality of Service Benchmarks and Standards final on April 24, 1998 at Docket No. L-00970131. Reporting began in 1999.
7 Rulemaking on NGDC Reporting Requirements for Quality of Service Benchmarks and Standards Order entered January 14, 2000 at Docket No.L-00000147 final on January 12, 2000. Reporting began in 2001.
8 52 Pa Code §§ 54.151- 54.156 for EDCs and 52 Pa Code §§ 62.31-62.37 for NGDCs 9 52 Pa Code § 54.155 and 52 Pa Code § 62.36

2
verified infractions, as determined by BCS, per 1,000 residential customers. These statistics also are important indicators of service quality.
BCS has calculated and reported these rates for a number of years in the annual report, Utility Consumer Activities Report and Evaluation: Electric, Gas, Water and Telephone Utilities (UCARE). BCS will report the 2016 rates noted above in the 2016 UCARE report. The report offers detailed descriptions of each of these measures, as well as a comparison with performance statistics from the previous year. Access to the 2016 Utility Consumer Activities Report and Evaluation, and the 2016 Report on Pennsylvania’s Electric and Natural Gas Distribution Companies Customer Service Performance, is available on the Commission’s website, www.puc.pa.gov, under the link for filings and resources.

3
I. Company-Reported Performance
In accordance with Reporting Requirements for Quality of Service Benchmarks and Standards (quality of service reporting requirements), the EDCs and the NGDCs reported statistics for 2016 regarding telephone access, billing, meter reading and disputes not responded to within 30 days. For each of the required measures, the companies report data by month and include a 12-month average.
With the exception of the telephone access statistics and the small business bill information, the required statistics directly relate to the regulations in 52 Pa. Code Chapter 56 Standards and Billing Practices for Residential Utility Service.
Treatment of PECO Energy
Historically, the Customer Service Performance Report has presented PECO statistics with the EDCs, although PECO’s statistics include data for both the company’s electric and natural gas accounts. PECO has three categories of customers: electric only, gas only and those receiving both electric and gas service. The company is not able to separate and report the data by gas and electric accounts. For example, PECO’s gas and/or electric customers contact the same call center and receive only one bill per billing period. However, customers receiving electric and natural gas from PECO have two separate meters, and the company must read each one. Starting with 2004 data, the report presents PECO’s natural gas meter-reading statistics with the NGDCs separately from the company’s electric meter-reading statistics.
Treatment of the FirstEnergy Companies: West Penn Power, Met-Ed, Penelec, and Penn Power
With PUC approval on March 8, 2011, West Penn Power subsequently joined Metropolitan Edison (Met-Ed), Pennsylvania Electric (Penelec) and Penn Power as operating subsidiaries of FirstEnergy10.
This report treats the four FirstEnergy companies as separate companies, except for the telephone access section (pages 5 through 12). In that section, at the request of FirstEnergy, Met-Ed, Penelec and Penn Power data is presented as FirstEnergy because the companies use the same call center routing and reporting platform. West Penn Power transitioned to the FirstEnergy system in April 2012; however, due to the commitments made in the merger, FirstEnergy tracks and reports West Penn Power separately. Therefore, West Penn Power’s data in the telephone access section is presented separately from the other FirstEnergy companies.
Treatment of Peoples Natural Gas Companies
With PUC approval on November 17, 2013, Equitable Gas Company was merged into the Peoples Natural Gas Company11. Equitable is now a separate division of Peoples Natural Gas (Peoples – Equitable Division). Information herein is reported separately for the Peoples and Equitable Divisions.
In 2014 Peoples Natural Gas and Peoples-Equitable were two separate companies. When the companies merged in 2015, six months of reporting was for two separate call centers and six months of reporting was for one combined call center. By 2016, one call center was used for the full twelve months of reporting.
In 2016, the singular call center began handling calls for Peoples-TWP in addition to Peoples and Equitable division customers.
10 Docket Nos. A-2010-2176520 and A-2010-2176732 11 Docket Nos. A-2013-2353647, A-2013-2353649 and A-2013-2353651

4
Treatment of UGI Companies
Previously, the reporting information for UGI Gas, UGI Penn Natural Gas and UGI Electric also included data from UGI Central Penn Gas that was not reported separately. The UGI Central Penn Gas data positively affected the overall numbers by a de minimis amount.
A. Telephone Access
The quality of service reporting requirements for both the EDCs and the NGDCs include telephone access to a company because customers must be able to readily contact their EDC or NGDC with questions, complaints and requests for service, and to report service outages and other problems. Attempted contacts to a call center initially have one of two results: They are either “received” by the company, or they receive a busy signal and thus are not “received” by the company. Calls in the “busy-out rate” represent those attempted calls that received a busy signal or message; they were not “received” by the company because the company lines or trunks were at capacity.
For the calls that are “received” by the company, the caller has several options. One option is to choose to speak to a company representative. When a caller chooses this option, the caller enters a queue to begin a waiting period until a company representative is available to take the call. Once a call enters the queue, it can take one of three routes: it will either be abandoned (the caller chooses not to wait and disconnects the call); it will be answered within 30 seconds; or it will be answered in a time period that is greater than 30 seconds. The percent of those calls answered within 30 seconds is reported to the Commission.
In order to produce an accurate picture of telephone access, the companies must report three separate measures of telephone access: 1) average busy-out rate; 2) call abandonment rate; and 3) percent of calls answered within 30 seconds. Requiring three separate measures averts the possibility of masking telephone access problems by presenting only one or two parts of the total access picture. For example, a company could report that it answers every call in 30 seconds or less. If this were the only statistic available, one might conclude that the access to the company is very good. However, if there are only a few trunk lines into this company’s call distribution system, other callers attempting to contact the company will receive a busy signal once these trunks are at capacity. The callers that get through wait 30 seconds or less for someone to answer, but a large percentage of customers cannot get through to the company; thus, telephone access is not very good at all. Therefore, it is important to look at both percent of calls answered within 30 seconds and busy-out rates to get a clearer picture of the telephone access to the EDC or NGDC.
The third measurement, call abandonment rate, indicates how many customers drop out of the queue of customers waiting to talk to a company representative. A high call abandonment rate is most likely an indication that the length of the wait to speak to a company representative is too long. Statistics on call abandonment are often inversely related to statistics measuring calls answered within 30 seconds. For the most part, the companies answering a high percent of calls within 30 seconds have low call abandonment rates, and those answering a lower percent of calls within 30 seconds have higher call abandonment rates. The 2014-16 EDC figures presented later in this report conform to the inverse relationship. In addition, the 2014-16 data reported by the NGDCs, for the most part, conforms to this relationship.
This report presents the EDC and NGDC statistics on telephone access in the following three charts:

5
• Busy-Out Rate;
• Call Abandonment Rate; and
• Percent of Calls Answered Within 30 Seconds.
1. Busy-Out Rate
The Commission’s regulations12 require EDCs to report to the Commission the average busy-out rate for each call center or business office, as well as a 12-month cumulative average for the company. Similarly, NGDCs are required13 to report the average busy-out rate. Each regulation defines busy-out rate as the number of calls to a call center that receive a busy signal divided by the total number of calls received at a call center. For example, a company with a 10% average busy-out rate means that 10% of the customers who attempted to call the company received a busy signal (and thus did not gain access) while 90% of the customer calls were received by the company. If the company has more than one call center, it is to supply the busy-out rates for each center, as well as a combined statistic for the company as a whole.
The following chart presents the combined busy-out rate for each major EDC during the three year period 2014, 2015 and 2016. The second chart presents the combined busy-out rate for each major NGDC during 2014, 2015 and 2016.
EDCs Busy-Out Rate* 2014-16
*12-month average. If the 12-month average is less than 1 percent, it is shown on the chart as 0 percent. **Although the four FirstEnergy companies use the same call centers, only Met-Ed, Penelec and Penn Power are
combined under FirstEnergy; due to the commitments made in the PA Merger Settlement Agreement, West Penn’s telephone access data is tracked and reported separately for this report.
12 52 Pa Code § 54.153(b)(1)(ii) 13 52 Pa Code § 62.33(b)(1)(ii)
0%
1%
0%
1%
0%
1%
0%
1%
0% 0%
1% 1%
0% 0% 0% 0%
2%
3%
0%
1%
2%
3%
4%
Duquesne PECO PPL UGI-Electric FirstEnergy** West Penn**
2014 2015 2016

6
Three of the six EDCs (Duquesne, PPL and UGI-Electric) reported a 2016 busy-out rate that is equal to the 2015 rate. PECO reported a decrease from 2015 to 2016. FirstEnergy and West Penn, reported an increase. West Penn reported that its increase was due to higher than normal call volumes on two days in April 2016.
NGDCs Busy-Out Rate* 2014-16
*12-month average. If the 12-month average is less than 1 percent, it is shown on the chart as 0 percent. **The 2015 statistics reflect six months of data (Jan. through June) for Peoples combined with six months of data for
Peoples and Peoples-Equitable Division (Jul. through Dec.). See page 5 of this report for more information. ***The 2015 statistics reflect only six months of data from Jan. through June. Additional information is provided in Section
l (Company-Reported Performance Data) of this report. All NGDCs except PGW remained the same for 2016 compared to 2015. PGW attributes the increase in the company’s busy-out rate for 2016 to a system issue associated with the implementation of a new phone system in its call center. PGW reports that by the fall of 2016, the proper fixes were implemented and all outstanding issues surrounding the system were resolved.
0% 0% 0%
1% 1%
3%
0%0% 0% 0% 0% 0%
2%
0%0% 0% 0% 0% 0%
2%
3%
0%
1%
2%
3%
4%
Columbia Peoples** Peoples-Equitable***
UGI PennNatural
UGI-Gas NFG PGW
2014 2015 2016

7
2. Call Abandonment Rate
The EDCs and NGDCs are required to report to the Commission the average call abandonment rate for each call center, business office or both. The call abandonment rate14 is the number of calls to a company’s call center that were abandoned, divided by the total number of calls that the company received at its call center or business office. For example, an EDC with a 10% call abandonment rate means that 10% of the calls received were terminated by the customer prior to speaking to an EDC representative. As the time that customers spend “on hold” increases, they have a greater tendency to hang up, raising the call abandonment rates. If the EDC or NGDC has more than one call center, it is to supply the call abandonment rates for each center, as well as a combined statistic for the company as a whole.
EDCs Call Abandonment Rate* 2014-16
*12-month average. **Although the four FirstEnergy companies use the same call centers, only Met-Ed, Penelec and Penn Power are
combined under FirstEnergy; due to the commitments made in the PA Merger Settlement Agreement, West Penn’s telephone access data is tracked and reported separately for this report.
The above statistics show four of the EDCs (Duquesne, FirstEnergy, UGI Electric and West Penn) reported an improvement in their call abandonment rate from 2015-2016. PECO maintained its call abandonment rate and PPL reported a higher 12-month average which indicates a decline in this service measurement. PPL reports this increase was due to the introduction of their new call handling procedures. PPL reports they now have the ability to receive calls 24 hours a day, 7 days a week.
Duquesne credits its investment in “people, process and technology solutions” as the reason for the improvement in its call abandonment rate in 2016.
14 52 Pa Code § 54.152 and § 67.32
3%
4%
8%
4%
7%
4%
1%
4%
6%
5%
3%
10%
1%
3% 3%
4% 4%
7%
0%
2%
4%
6%
8%
10%
12%
PECO UGI-Electric West Penn** FirstEnergy** PPL Duquesne
2014 2015 2016

8
NGDCs Call Abandonment Rate* 2014-16
*12-month average. **The 2015 statistics reflect six months of data (Jan. through June) for Peoples combined with six months of data for
Peoples and Peoples-Equitable Division (Jul. through Dec.). Additional information is provided in Section I (Company-Reported Performance Data) of this report.
***The 2015 statistics reflect six months of data from Jan. through June. Additional information is provided in Section l (Company-Reported Performance Data) of this report.
.
Four of the NGDCs maintained their call abandonment rate from 2015 to 2016. (Columbia, NFG, Peoples and Peoples-Equitable). UGI-Gas and UGI Penn Natural experienced an improvement in this performance measure in 2016. PGW experienced a significant increase in the average call abandonment rate in 2016. PGW attributes this decrease in performance to system issues associated with the implementation of a new phone system installed in its call center earlier in 2016. According to PGW, by the fall of 2016, proper fixes were implemented.
3. Percent of Calls Answered Within 30 Seconds
Each EDC and major NGDC is to “take measures necessary and keep sufficient records” to report the percent of calls answered within 30 seconds or less at the company’s call center.15 The section specifies that “answered” means a company representative is ready to render assistance to the caller.
15 Pursuant to the quality of service reporting requirements at 52 PA Code § 54.153(b) and § 62.33(b)
2% 2%
7%
3%
4% 4%
13%
1%
2% 2% 2%
4% 4%
9%
1%
2% 2% 2%
3% 3%
20%
0%
5%
10%
15%
20%
25%
Peoples** Columbia NFG Peoples-Equitable***
UGI-Gas UGI PennNatural
PGW
2014 2015 2016

9
An acknowledgement that the consumer is on the line does not constitute an answer. If a company operates more than one call center (a center for handling billing disputes and a separate one for making payment agreements, for example), the company is to provide separate statistics for each call center and a statistic that combines performance for all the call centers.
EDCs Percent of Calls Answered Within 30 Seconds* 2014-16
*12-month average. **Although the four FirstEnergy companies use the same call centers, only Met-Ed, Penelec and Penn Power are
combined under FirstEnergy; due to the commitments made in the PA Merger Settlement Agreement, West Penn’s telephone access data is tracked and reported separately for this report.
The 2016 data shows improved access for five of the six EDCs. Duquesne maintained an 84 percent average from 2015 to 2016.
In 2016, all six of the EDCs reported averages in this measurement at or above 80 percent with a combined average of 85 percent. The average of the six EDCs for 2015 was 83 percent of calls answered within 30 seconds.
89%
74% 80
%
80%
80%
71%
91%
87%
84%
80%
80%
76%
92%
90%
84%
83%
81%
80%
0%
10%
20%
30%
40%
50%
60%
70%
80%
90%
100%
PECO PPL Duquesne UGI-Electric FirstEnergy** West Penn**
2014 2015 2016

10
NGDCs Percent of Calls Answered Within 30 Seconds* 2014-16 *12-month average. **The 2015 statistics reflect six months of data (Jan. through June) for Peoples combined with six months of data for
Peoples and Peoples-Equitable Division (Jul. through Dec.). By 2016 one call center was used for the full twelve months of reporting. Additional information is provided in Section I (Company-Reported Performance Data) of this report.
The percent of calls answered within 30 seconds varies depending on call volume and the number of employees available to take calls. The two UGI companies reported improved rates in 2016. The other four NGDCs reported a decrease in the 2016 average.
PGW reported a significant decrease in this metric, from 90 percent of calls answered within 30 seconds in 2015 to 74 percent in 2016. PGW attributes the decline “to system issues associated with the implementation of a new phone system in the call center earlier in the year”. PGW reports proper fixes were implemented by the fall of 2016 and all outstanding issues surrounding the system have been resolved.
Columbia reported a decrease from 84 percent to 78 percent in 2016.
In 2016 four of the NGDCs reported averages at or above 80 percent with a combined average of 81 percent. The average of the NGDCs for 2015 was 86 percent of calls answered within 30 seconds.
86%
85%
80%
80%
79%
77% 84
%88% 91
%
80%
80%
94%
84% 90
%
87%
87%
83%
83%
83%
78%
74%
0%
10%
20%
30%
40%
50%
60%
70%
80%
90%
100%
Peoples-Equitable**
Peoples ** UGI-Gas UGI PennNatural
NFG Columbia PGW
2014 2015 2016

11
B. Billing
A utility is to render a bill once every billing period to all customers.16 The customer bill is often the only communication between the company and its customer, thus underscoring the need to produce and send this fundamental statement to customers at regular intervals. When a customer does not receive a bill each month, it frequently generates complaints to the company and sometimes to the Commission. The failure of a company to render a bill once every billing period also adversely affects collections performance.
1. Number and Percent of Residential Bills Not Rendered Once Every Billing Period
The EDCs and major NGDCs shall report the number and percent of residential bills that the company failed to render.17 The following tables present the average monthly percent of residential bills that each major EDC and NGDC failed to render once every billing period during 2014, 2015 and 2016.
Number and Percent* of EDC Residential Bills Not Rendered Once Every Billing Period
Company 2014 2015 2016
Number Percent Number Percent Number Percent
Duquesne 22 .00% 190 .03% 455 .09%
Met-Ed 25 .01% 83 .02% 49 .01%
Penelec 28 .01% 94 .02% 46 .01%
Penn Power 5 .00% 7 .01% 5 .00%
PPL 206 .02% 1,058 .09% 235 .02%
PECO 103 .01% 119 .01% 69 .00%
UGI-Electric 2 .00% 4 .01% 2 .00%
West Penn 14 .00% 45 .01% 19 .00% *12-month average. Duquesne reported an increase in the number of Residential Bills not rendered. The remaining seven EDCs reported a decrease from 2015 to 2016.
Duquesne explains the data query it used for the 2015 report did not accurately capture the requested information, resulting in a higher number of unrendered bills in 2016. Duquesne points out that the percentage remains below one percent of the customer base.
PPL attributes the improvement in performance to the resolution of the technical issues that originated in 2015.
16 Pursuant to 66 Pa.C.S. § 1509 and Standards and Billing Practices for Residential Utility Service (52 Pa Code§ 56.11) 17 Pursuant to 52 Pa Code § 54.153(b)(2)(i) and § 62.33(b)(2)(i)

12
Number and Percent* of NGDC Residential Bills
Not Rendered Once Every Billing Period
Company
2014 2015 2016
Number Percent Number Percent Number Percent
Columbia 0 0% 0 0% 0 0%
NFG 2 .00% 1 .00% 15 .01%
Peoples-Equitable 1 .00% 0 0% 0 0%
Peoples 0 .00% 0 0% 0 0%
PGW 39 .01% 16 .00% 76 .01%
UGI-Gas 7 .00% 10 .00% 5 .00%
UGI Penn Natural 2 .00% 4 .00% 4 .00% *12-month average. Two of the NGDCs (NFG and PGW) reported an increase in the average number of residential bills not rendered. The other companies reported a slight decrease or remained the same from 2015 to 2016.
NFG attributes its increase in the number and percent of bills not rendered once every billing period to the major replacement of its Customer Information and Billing System.
PGW reports the increase in its average number of residential bills not rendered once every billing period was due to company error and they are looking for ways to improve.
2. Number and Percent of Bills to Small-Business Customers Not Rendered Once Every Billing Period
Quality of service reporting requirements for both the EDCs and the NGDCs require that companies report the number and percent of small-business bills the companies failed to render.18 The EDC regulations define19 a small-business customer as a person, sole proprietorship, partnership, corporation, association or other business that receives electric service under a small commercial, small industrial or small business rate classification, and whose maximum registered peak load was less than 25 kW within the last 12 months. The NGDC regulations define20 a small-business customer as a person, sole proprietorship, partnership, corporation, association or other business whose annual gas consumption does not exceed 300 thousand cubic feet (Mcf). The tables on the following page show the average number and percent of small-business customers the major EDCs and NGDCs did not bill according to statute.
18 66 Pa.C.S.§ 1509 19 52 Pa. Code § 54.152 20 52 Pa. Code § 62.32

13
Number and Percent* of EDC Bills to Small-Business Customers
Not Rendered Once Every Billing Period
Company 2014 2015 2016
Number Percent Number Percent Number Percent
Duquesne 1 .00% 16 .08% 362 .07%
Met-Ed 10 .02% 29 .04% 12 .02%
Penelec 13 .02% 28 .03% 12 .01%
Penn Power 2 .01% 7 .04% 2 .01%
PPL 54 .03% 259 .14% 58 .03%
PECO 93 .07% 129 .09% 90 .06%
UGI-Electric 0 .00% 2 .02% 0 .00%
West Penn 5 .01% 8 .01% 5 .01% *12-month average. Seven of the EDCs reported an improvement in this performance metric from 2015 to 2016. West Penn Power maintained the same percent in 2016 as in the two years prior. PPL reports the improvement in its performance was a result of resolving technical issues that originated in 2015.
Number and Percent* of NGDC Bills to Small-Business Customers Not Rendered Once Every Billing Period
Company 2014 2015 2016
Number Percent Number Percent Number Percent
Columbia 0 0% 0 0% 0 0%
NFG 0 .00% 0 .00% 1 .01%
Peoples -Equitable 0 .00% 0 0% 0 0%
Peoples 0 .00% 0 0% 0 0%
PGW 0 .00% 1 .01% 1 .01%
UGI-Gas 3 .02% 4 .01% 4 .01%
UGI Penn Natural 3 .02% 3 .02% 3 .02% *12-month average.
NFG reported a slight increase in the average number of bills not rendered to small-business customers. The average reported by the remaining five NGDCs did not change.

14
C. Meter Reading
Regular meter reading is important in order to produce accurate bills for customers who expect to receive bills based on the amount of electricity or natural gas they have used. Actual meter readings can be obtained by physically accessing and visually inspecting a meter, through devices that permit direct interrogation of the meter, or through (Automatic Meter Reader) AMR devices. The Commission’s experience is that the lack of actual meter readings generates complaints to companies, as well as to the Commission. The Commission has expressed concern that regular meter reading may be one of the customer service areas where EDCs and NGDCs might, under competition, reduce the level of service.21 The quality of service reporting requirements include three measures of meter-reading performances that correspond with the meter-reading requirements.22
1. Number and Percent of Residential Meters Not Read By Company or Customer in Six Months
A utility may estimate the bill of a residential customer if personnel are unable to gain access to obtain an actual meter reading.23 However, at least every six months, the utility must obtain an actual meter reading or customer-supplied reading to verify the accuracy of prior estimated bills. EDCs are required24 to report the number and percent of residential meters they have not read.
Number and Percent* of EDC Residential Meters Not Read by Company or Customer in Six Months
Company 2014 2015 2016
Number Percent Number Percent Number Percent
Duquesne 1 .00% 81 .00% 462 .08%
Met-Ed 881 .18% 131 .03% 71 .01%
Penelec 59 .01% 51 .01% 25 .01%
Penn Power 44 .03% 46 .03% 0 0%
PPL 55 .00% 86 .01% 44 .00%
PECO 144 .01% 370 .02% 138 .01%
UGI-Electric 2 .00% 1 .00% 1 .00%
West Penn 327 .05% 221 .04% 115 .02% *12-month average. As shown above, Met-Ed, Penn Power, PPL, PECO and West Penn reported improvement in this measurement. Penelec and UGI Electric maintained the same percent and Duquesne reported a decrease in performance. Duquesne reports the data query it used in 2015 was not accurately capturing the requested information, resulting in a higher number of unrendered bills from 2015 to 2016.
21 Final Rulemaking Orders establishing Reporting Requirements for Quality of Service Benchmarks and Standards (L-
00000147 and L-970131). 22 52 Pa Code § 56.12(4)(ii), § 56.12(4)(iii) and § 56.12(5)(i). 23 52 Pa Code § 56.12(4)(ii). 24 52 Pa Code § 54.153(b)(3)(i), 56.12(4)(ii).

15
Number and Percent*of NGDC Residential Meters Not Read
by Company or Customer in Six Months
Company 2014 2015 2016
Number Percent Number Percent Number Percent
Columbia 10 .00% 4 .00% 1 .00%
NFG 507 .26% 599 .31% ** **
Peoples-Equitable 0 0% 0 0% 0 0%
Peoples 420 .12% 498 .13% 518 .16%
PECO (Gas) 49 .01% 144 .03% 82 .02%
PGW 300 .06% 140 .03% 67 .01%
UGI-Gas 49 .02% 54 .02% 53 .02%
UGI Penn Natural 26 .02% 15 .01% 21 .01% *12-month average. **Waiver requested due to the company’s inability to provide the requested data. (Docket No. P-2017-2584586) The major NGDCs are required25 to report the number and percent of residential meters for which the company has failed to obtain an actual or customer-supplied meter reading within the past six months. The table above presents the data that the companies reported for 2014, 2015 and 2016. The report presents PECO’s natural gas meter-reading data separately from its electric meter-reading data.
Columbia, PECO Gas, PGW, and UGI-Gas reported improvement in this measure. Peoples and UGI Penn Natural reported increases in the number of residential meters not read in six months. Peoples-Equitable again reported zero meters not read in six months.
2. Number and Percent of Residential Meters Not Read in 12 Months
A company may estimate the bill of a residential customer if company personnel are unable to gain access to obtain an actual meter reading.26 However, at least once every 12 months, the company must obtain an actual meter reading to verify the accuracy of either the estimated or customer-supplied readings. The EDCs are required to report the number and percent of residential meters for which they failed to meet the requirements.27 The following table presents the statistics the EDCs submitted to the Commission for this measure.
25 § 62.33(b)(3)(i), § 56.12(4)(ii). 26 § 56.12(4)(iii) 27 § 54.153(b)(3)(ii)

16
Number and Percent* of EDC Residential Meters Not Read in 12 Months
Company 2014 2015 2016
Number Percent Number Percent Number Percent
Duquesne 0 0% 3 .00% 72 .01%
Met-Ed 139 .03% 23 .01% 1 0%
Penelec 3 .00% 2 .00% 0 0%
Penn Power 7 .01% 5 .00% 0 0%
PPL 6 .00% 22 .00% 6 0%
PECO 0 .00% 15 .00% 15 0%
UGI-Electric 2 .00% 1 .00% 0 0%
West Penn 52 .01% 23 .00% 6 .00% *12-month average. PPL, UGI Electric and all four FirstEnergy companies improved in this measure. PECO remained the same and Duquesne reported a greater number of meters not read according to the requirements of this section. Duquesne explains the difference in the number of meters not read from 2015 to 2016 is due to several factors. Duquesne reports that by the end of 2016, 350,000 smart meters had been deployed. This project increased the number of meters that were not being read. As full deployment occurs, Duquesne expects to see a decline in unread meters.
Number and Percent* of NGDC Residential Meters Not Read in 12 Months
Company 2014 2015 2016
Number Percent Number Percent Number Percent
Columbia 6 .00% 2 .00% 2 .00%
NFG 29 .01% 35 .02% ** **
Peoples-Equitable 0 0% 0 0% 0 0%
Peoples 72 .02% 76 .02% 69 .02%
PECO (Gas) 0 0% 3 .00% 20 .00%
PGW 71 .02% 36 .01% 1 0%
UGI-Gas 19 .01% 22 .01% 38 .01%
UGI Penn Natural 15 .01% 2 .00% 4 .00% *12-month average. ** Waiver requested due to the company’s inability to provide the requested data. (Docket No. P2017-2584586)

17
The major NGDCs are required to report the number and percent of residential meters for which the company failed to obtain an actual meter reading within the past 12 months.28 Two of the NGDCs reported improvement in the number of meters not read within 12 months, two maintained the same percentage and two NGDCs reported an increase in the average number of meters not read, according to this measure. NFG requested and was granted an exemption.
PECO Gas reports the increase in 12 month no-reads was due to replacing the old AMR communication system with new (Advanced Metering Infrastructure) AMI system.
3. Number and Percent of Residential Remote Meters Not Read in Five Years
A utility may render a bill on the basis of readings from a remote reading device.29 However, the utility must obtain an actual meter reading at least once every five years to verify the accuracy of the remote reading device. Each EDC and major NGDC must report30 to the Commission the number and percent of residential remote meters for which it failed to obtain an actual meter reading under the timeframe described in Chapter 56. The following tables show the data as reported by the major companies. However, the accuracy of the data in the tables regarding remote reading devices cannot be verified. Although the Commission has defined remote meter-reading devices and direct interrogation devices, there is still a question whether certain meters qualify as direct interrogation devices.
Number and Percent* of EDC Residential Remote Meters Not Read in Five Years
Company 2014 2015 2016
Number Percent Number Percent Number Percent
Duquesne 0 0% 0 0% 0 0%
Met-Ed 0 0% 0 0% 0 0%
Penelec 0 0% 0 0% 0 0%
UGI-Electric 0 0% 0 0% 0 0%
West Penn 0 0% 0 0% 0 0%
Penn Power** NA NA NA NA NA NA
PPL** NA NA NA NA NA NA
PECO** NA NA NA NA NA NA *12-month average. **No remotely read meters. The number of remote meters not read within five years was zero for each of the five companies with remote meter-reading capabilities in 2014, 2015 and 2016.31
28 52 Pa Code § 62.33(b)(3)(ii) 29 52 Pa Code § 56.12(5)(i) 30 52 Pa Code § 54.153(b)(3)(iii) and § 62.33(b)(3)(iii) 31 As required by 52 Pa Code § 56.12(5)(i)

18
Number and Percent* of NGDC Residential Remote Meters Not Read in Five Years
Company 2014 2015 2016
Number Percent Number Percent Number Percent
NFG 3 .35% 3 .39% *** ***
Peoples 0 0% 0 0% 0 0%
UGI-Gas 0 0% 0 0% 0 0%
Columbia** NA NA NA NA NA NA
Peoples-Equitable** NA NA NA NA NA NA
PECO (Gas)** NA NA NA NA NA NA
PGW** NA NA NA NA NA NA
UGI Penn Natural** NA NA NA NA NA NA *12-month average. **No remotely read meters. ***Waiver requested due to the company’s inability to provide the requested data. (Docket No. P2017-2584586) D. Response to Disputes
When a customer registers a dispute with a utility about any matter covered by Chapter 56 regulations, each utility covered by the regulations must issue its report to the complaining party within 30 days of the initiation of the dispute.32 A complaint or dispute filed with a company is not necessarily a negative indicator of service quality. However, a company’s failure to promptly respond to the customer’s complaint within 30 days is a potential infraction of the regulations33 and may also be an indication of poor service as well as a cause of complaints to the Commission.
1. Number of Residential Disputes that Did Not Receive a Response within 30 Days
Each EDC and major NGDC is required34 to report to the Commission the actual number of disputes for which the company did not provide a response within 30 days, as required under the Chapter 56 regulations. The following two tables present this information as reported by the companies.
32 52 Pa Code § 56.151(5) 33 52 Pa Code § 56.151(5) 34 52 Pa Code § 54.153(b)(4), § 62.33(b)(4)

19
Number of EDC Residential Disputes That Did Not Receive a Response Within 30 Days
Company 2014 2015 2016
Duquesne 39 56 57
Met-Ed 1,296 198 0
Penelec 874 128 0
Penn Power 100 26 0
PPL 72 100 55
PECO 132 1,853 1
UGI-Electric 0 0 0
West Penn 479 97 0 The FirstEnergy companies all reported zero disputes not responded to within 30 days in 2016. UGI-Electric also reported zero disputes not answered within 30 days in 2016, the same as in 2014 and 2015. PECO explains that the one dispute not responded to in the prescribed time frame in 2016 indicates a return to normal performance after an excess amount of high bill dispute resolutions that exceed the 30-day target in the first half of 2015. According to PECO, in the middle of 2015, it implemented “several mitigation actions which reduced the inflow and improved the outflow efficiency.”
Number of NGDC Residential Disputes That Did Not Receive a Response Within 30 Days
Company 2014 2015 2016
Columbia 0 1 0
NFG 5 10 *
Peoples-Equitable 0 0 0
Peoples 0 0 0
PGW 2 0 0
UGI-Gas 0 0 0
UGI Penn Natural 0 0 0 *Waiver requested due to the company’s inability to provide the requested data. (Docket No. P-2017-2584586)
Six of the NGDCs (except NFG noted by *) reported zero disputes not responded to within 30 days in 2016 due to the improvement of the two NGDCs that had reported an increase in 2015.
20
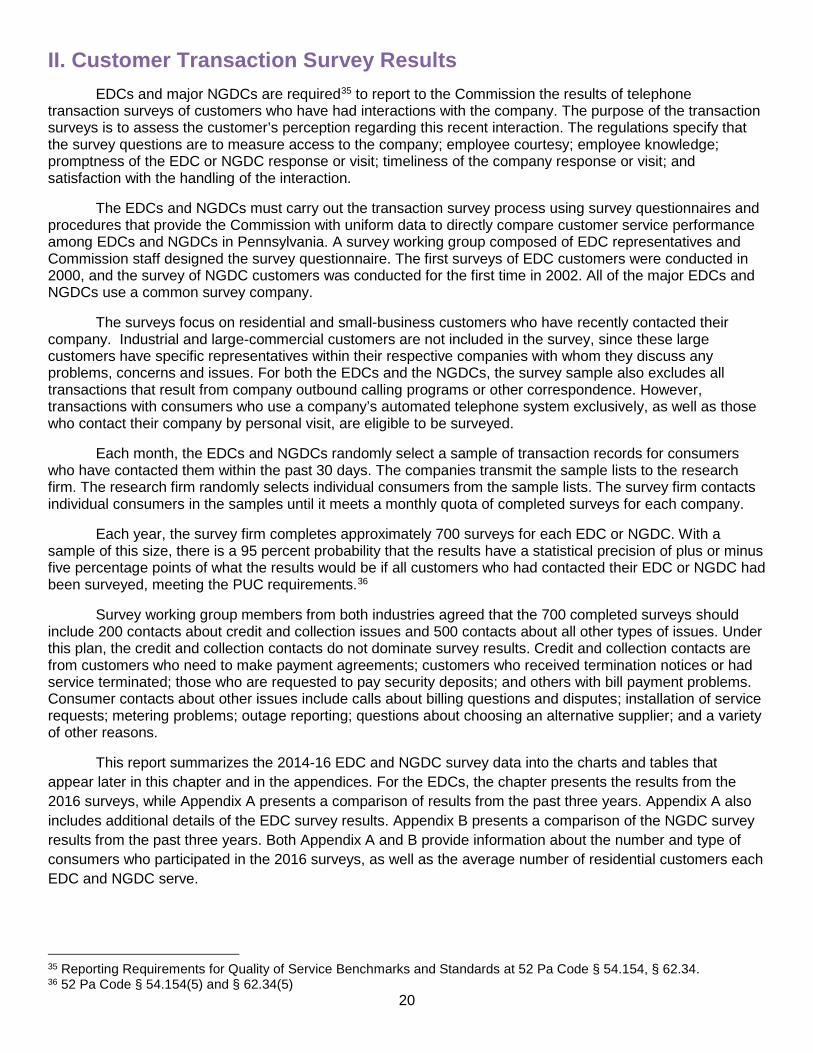
II. Customer Transaction Survey Results EDCs and major NGDCs are required35 to report to the Commission the results of telephone transaction surveys of customers who have had interactions with the company. The purpose of the transaction surveys is to assess the customer’s perception regarding this recent interaction. The regulations specify that the survey questions are to measure access to the company; employee courtesy; employee knowledge; promptness of the EDC or NGDC response or visit; timeliness of the company response or visit; and satisfaction with the handling of the interaction.
The EDCs and NGDCs must carry out the transaction survey process using survey questionnaires and procedures that provide the Commission with uniform data to directly compare customer service performance among EDCs and NGDCs in Pennsylvania. A survey working group composed of EDC representatives and Commission staff designed the survey questionnaire. The first surveys of EDC customers were conducted in 2000, and the survey of NGDC customers was conducted for the first time in 2002. All of the major EDCs and NGDCs use a common survey company.
The surveys focus on residential and small-business customers who have recently contacted their company. Industrial and large-commercial customers are not included in the survey, since these large customers have specific representatives within their respective companies with whom they discuss any problems, concerns and issues. For both the EDCs and the NGDCs, the survey sample also excludes all transactions that result from company outbound calling programs or other correspondence. However, transactions with consumers who use a company’s automated telephone system exclusively, as well as those who contact their company by personal visit, are eligible to be surveyed.
Each month, the EDCs and NGDCs randomly select a sample of transaction records for consumers who have contacted them within the past 30 days. The companies transmit the sample lists to the research firm. The research firm randomly selects individual consumers from the sample lists. The survey firm contacts individual consumers in the samples until it meets a monthly quota of completed surveys for each company.
Each year, the survey firm completes approximately 700 surveys for each EDC or NGDC. With a sample of this size, there is a 95 percent probability that the results have a statistical precision of plus or minus five percentage points of what the results would be if all customers who had contacted their EDC or NGDC had been surveyed, meeting the PUC requirements.36
Survey working group members from both industries agreed that the 700 completed surveys should include 200 contacts about credit and collection issues and 500 contacts about all other types of issues. Under this plan, the credit and collection contacts do not dominate survey results. Credit and collection contacts are from customers who need to make payment agreements; customers who received termination notices or had service terminated; those who are requested to pay security deposits; and others with bill payment problems. Consumer contacts about other issues include calls about billing questions and disputes; installation of service requests; metering problems; outage reporting; questions about choosing an alternative supplier; and a variety of other reasons.
This report summarizes the 2014-16 EDC and NGDC survey data into the charts and tables that appear later in this chapter and in the appendices. For the EDCs, the chapter presents the results from the 2016 surveys, while Appendix A presents a comparison of results from the past three years. Appendix A also includes additional details of the EDC survey results. Appendix B presents a comparison of the NGDC survey results from the past three years. Both Appendix A and B provide information about the number and type of consumers who participated in the 2016 surveys, as well as the average number of residential customers each EDC and NGDC serve.
35 Reporting Requirements for Quality of Service Benchmarks and Standards at 52 Pa Code § 54.154, § 62.34. 36 52 Pa Code § 54.154(5) and § 62.34(5)

21
A. Reaching the Company
One of the first survey questions in each of the surveys asks the consumer, “On a scale of 1-10, where 1 is very dissatisfied and 10 is very satisfied, how satisfied were you with the ease of reaching the EDC or the NGDC?” The bar charts that follow present the percent of consumers who indicated satisfaction with the initial stage of their contact with the company. For 2016, the average of the percentages of EDC customers who responded that they were either “satisfied” or “somewhat satisfied” with the ease of reaching the company is 83 percent. For NGDCs, the average of the percentages of NGDC consumers who responded that they were either “satisfied” or “somewhat satisfied” with the ease of reaching the company is 89 percent. Survey results from the 2015 and 2014 surveys are available in the appendices.
Satisfaction with Ease of Reaching EDC 2016
Satisfaction with Ease of Reaching NGDC 2016
58%
58%
59%
58%
61%
64%
69%
72%
21%
21%
20%
22%
20%
23%
20%
18%
0% 10% 20% 30% 40% 50% 60% 70% 80% 90% 100%
Duquesne
Met-Ed
PennPower
West Penn
Penelec
PECO
UGI-Electric
PPL
Very Satisfied Somewhat Satisfied
90%
89%
87%
81%
80%
79%
79%
79%
57%
68%
67%
70%
69%
71%
77%
24%
20%
22%
20%
22%
20%
16%
0% 10% 20% 30% 40% 50% 60% 70% 80% 90% 100%
PGW
Peoples-Equitable
UGI PennNatural
Peoples
UGI-Gas
Columbia
NFG
Very Satisfied Somewhat Satisfied
93%
91%
91%
90%
89%
88%
81%

22
B. Automated Phone Systems
Survey interviewers ask consumers other questions about the preliminary stages of their contact with the EDC or NGDC. All of the EDCs and NGDCs but one37 use an automated telephone system to filter calls and save time and money on consumer calls. The surveys ask consumers questions about their experience using the automated systems. On average, 76 percent of EDC consumers reported being either “very satisfied” or “somewhat satisfied” with the EDCs’ automated phone system. For the major NGDCs, an average of 82 percent of NGDC consumers reported satisfaction with using the automated systems. More details on how customers perceive using automated phone systems can be found in the appendices. The charts that follow present the level of satisfaction consumers expressed about using the EDC or NGDC automated telephone systems.
Satisfaction with Using EDC’s Automated Phone System 2016
Satisfaction with Using NGDC’s Automated Phone System 2016
37 NFG does not use an automated telephone system at its call center.
46%
47%
46%
45%
48%
54%
58%
60%
24%
24%
26%
28%
26%
26%
25%
24%
0% 10% 20% 30% 40% 50% 60% 70% 80% 90% 100%
Duquesne
Met-Ed
PennPower
West Penn
Penelec
PECO
UGI-Electric
PPL
Very Satisfied Somewhat Satisfied
84%
83%
80%
74%
73%
72%
71%
70%
55%
55%
55%
60%
58%
63%
24%
25%
25%
23%
25%
21%
0% 10% 20% 30% 40% 50% 60% 70% 80% 90% 100%
UGI PennNatural
Peoples-Equitable
Peoples
PGW
UGI-Gas
Columbia
Very Satisfied Somewhat Satisfied
84%
83%
83%
80%
80%
79%
23
C. Company Representatives
Consumers who indicated that they had spoken with a company representative were asked specifically how satisfied they were with that interaction. A consumer’s overall rating of satisfaction with the company representative’s handling of the contact may be influenced by several factors, including the courtesy and knowledge of the representatives.
In 2016, on average, 89 percent of EDC consumers indicated being either “somewhat satisfied” or “very satisfied” with the way the company representative handled the consumer contact. On average, 94 percent of NGDC consumers indicated they were either “somewhat satisfied” or “very satisfied” with the way the company representative handled the interaction.
Also, in 2016, on average, 94 percent of EDC consumers indicated the company person they spoke with was either “very courteous” or “somewhat courteous” with the majority indicating the representative was “very courteous.” An average of 91 percent rated the company representative as “very knowledgeable” or “somewhat knowledgeable.” The majority gave a “very knowledgeable” rating. On average, 96 percent of consumers rated NGDC representatives as either “very courteous” or “somewhat courteous.” In addition, 95 percent of NGDC consumers rated company representatives as either “very knowledgeable” or “somewhat knowledgeable.”
The following tables show the consumers’ level of satisfaction with this interaction. Additional information, including previous years’ results, is available in the appendices.

24
Satisfaction with EDC Representative’s Handling of the Contact 2016
Satisfaction with NGDC Representative’s Handling of the Contact 2016
73%
75%
73%
74%
76%
77%
83%
84%
14%
12%
14%
13%
13%
13%
10%
10%
0% 10% 20% 30% 40% 50% 60% 70% 80% 90% 100%
Met-Ed
Penelec
Penn Power
West Penn
Duquesne
PECO
UGI-Electric
PPL
Very Satisfied Somewhat Satisfied
94%
93%
90%
89%
87%
87%
87%
87%
85%
82%
78%
84%
82%
86%
83%
7%
10%
14%
10%
13%
9%
12%
0% 10% 20% 30% 40% 50% 60% 70% 80% 90% 100%
UGI Penn Natural
Columbia
PGW
Peoples-Equitable
UGI-Gas
Peoples
NFG
Very Satisfied Somewhat Satisfied
95%
95%
95%
94%
92%
92%
92%

25
Consumer Ratings of EDC Representatives 2016
80%
79%
85%
83%
84%
82%
81%
91%
10%
13%
8%
10%
10%
12%
13%
8%
0% 10% 20% 30% 40% 50% 60% 70% 80% 90% 100%
Met-Ed
PECO
UGI-Electric
West Penn
Penelec
Penn Power
Duquesne
PPL
Call Center Representative's Courtesy
Very Courteous Somewhat Courteous
99%
94%
94%
94%
93%
93%
92%
90%
75%
78%
77%
75%
77%
78%
83%
85%
12%
11%
13%
16%
14%
14%
12%
10%
0% 10% 20% 30% 40% 50% 60% 70% 80% 90% 100%
Met-Ed
Duquesne
PECO
Penn Power
West Penn
Penelec
PPL
UGI-Electric
Call Center Representative's Knowledge
Very Knowledgeable Somewhat Knowledgeable
95%
95%
92%
91%
91%
90%
89%
87%

26
Consumer Ratings of NGDC Representatives 2016
81%
89%
88%
88%
87%
88%
87%
12%
6%
8%
9%
10%
9%
10%
0% 10% 20% 30% 40% 50% 60% 70% 80% 90% 100%
PGW
UGI Penn Natural
Columbia
UGI-Gas
NFG
Peoples
Peoples-Equitable
Call Center Representative's Courtesy
Very Courteous Somewhat Courteous
97%
97%
97%
97%
96%
95%
93%
79%
85%
87%
87%
84%
84%
84%
14%
9%
8%
8%
12%
12%
12%
0% 10% 20% 30% 40% 50% 60% 70% 80% 90% 100%
PGW
Columbia
UGI Penn Natural
Peoples
UGI-Gas
NFG
Peoples-Equitable
Call Center Representative's Knowledge
Very Knowledgeable Somewhat Knowledgeable
96%
96%
96%
95%
95%
94%
93%

27
D. Overall Satisfaction
Consumers use a variety of factors to determine their overall level of satisfaction about a contact with a utility company. The ease of reaching the company may be the initial factor. Other factors include the use of the company’s automated telephone system; the wait to speak to a company representative; and the courtesy and knowledge of that representative. If a field visit is part of the interaction, this, too, would affect the consumer’s overall assessment. The tables that follow present the 2016 survey findings regarding overall satisfaction with EDC and NGDC quality of service during customer contacts.
The following chart presents the results of the responses to the question, “Considering all aspects of this recent contact with the company, and using the same 1 to 10 scale, how satisfied were you with the quality of service provided by the company?” In 2016, the EDC industry average shows that 87 percent of consumers were “satisfied” and 71 percent “very satisfied” with the overall quality of service they received from their EDCs. In 2016, the industry average for overall satisfaction with NGDC customer contacts is 92 percent with 78 percent being “very satisfied.” Additional information is available in the appendices.
As indicated in the introduction to the section on customer surveys, the companies and survey firm divided consumer contacts into credit and collection contacts, and contacts about other matters.
Members of both working groups had expressed concern that the satisfaction level of consumers who had contacted the companies about credit and collection issues would negatively influence the overall satisfaction ratings. However, the opposite proved true for all EDCs in the first two years the survey was conducted.
Customers of half of the eight EDCs rated their satisfaction higher on credit and collection contacts in 2016 than on other types of contacts. The average percentage of customers that were either “very satisfied” or “somewhat satisfied” was 87 percent. The average percentage of customers who were either “very satisfied” or “somewhat satisfied” with their non-credit and collection contacts with the EDCs is 86 percent. Appendix A, Table 2, presents the level of satisfaction by these two categories of contacts, as well as the overall satisfaction level for each of the EDCs for 2014-16.
In 2016, a slightly greater average percentage of customers who contacted the NGDCs about other issues (91 percent) responded that they were either “very satisfied” or “somewhat satisfied” than customers who contacted the NGDCs about credit and collection issues (92 percent). Appendix B, Table 2, presents the level of satisfaction by these two categories of contacts, as well as the overall satisfaction level for each of the NGDCs.

28
Overall Satisfaction with EDC’s Quality of Service during Recent Contact 2016
Overall Satisfaction with NGDC’s Quality of Service during Recent Contact 2016
68%
69%
65%
66%
67%
71%
80%
79%
15%
15%
19%
18%
18%
17%
12%
14%
0% 10% 20% 30% 40% 50% 60% 70% 80% 90% 100%
Penelec
Penn Power
Met-Ed
West Penn
Duquesne
PECO
UGI-Electric
PPL
Very Satisfied Somewhat Satisfied
93%
92%
88%
85%
84%
84%
84%
83%
70%
79%
76%
81%
79%
82%
79%
17%
14%
17%
12%
14%
12%
15%
0% 10% 20% 30% 40% 50% 60% 70% 80% 90% 100%
PGW
UGI Penn Natural
Peoples-Equitable
Columbia
UGI-Gas
NFG
Peoples
Very Satisfied Somewhat Satisfied
94%
94%
93%
93%
93%
93%
87%

29
III. Conclusion
This report fulfills the PUC’s responsibility to annually summarize the quality-of-service statistics that the EDCs and NGDCs report to the Commission. The telephone access, billing, meter-reading and dispute data is due to the Commission annually on Feb. 1. On April 1 of each year, the Commission is to receive the results of the customer surveys conducted during the previous year. The UCARE report will again provide statistics associated with 2016 consumer complaints and PARs filed with the Commission by the customers of the major EDCs and NGDCs.
The Commission uses three sources of data to obtain as complete a picture as possible of the quality of customer service experienced by customers of the major electric and gas companies. The first source is the company itself, reporting telephone access statistics. ; the number of bills not rendered monthly to residential and commercial customers; meters not read according to Chapter 56 regulations; and disputes not handled within 30 days. The Commission uses consumer complaints and PARs filed with the Commission by the customers of the EDCs and NGDCs as a second source of data. As noted in the introduction, 2016 data on informal complaints and PARs filed with the Commission will be reported in the Commission’s annual UCARE report. Finally, the Commission uses the results of the surveys of the companies’ customers who have had customer-initiated contacts with the companies. This latter source of information tells the Commission about the ease of contacting the companies; the consumers’ view of the knowledge and courtesy of the companies’ customer service representatives; as well as the consumers’ overall satisfaction with the way the company handled the contacts. This information allows the Commission to monitor the quality of EDCs’ and NGDCs’ customer-service performance.
The survey results show that, for the most part, customers are satisfied with the service they receive from their companies. Nevertheless, the company-reported performance data indicates there is room for improvement on the part of Pennsylvania’s major electric and gas companies. For example, the number of accounts not billed, meters not read and disputes not responded to within 30 days represent infractions of the Chapter 56 regulations. Although some companies have improved their telephone access statistics, access remains at a less-than-desirable level for others.
Customers who cannot reach their company contact the Commission to report access problems. The Commission closely monitors company performance on access measures not only through reported statistics, but also through customer reports to the BCS. Deficiencies in call center access are an even greater cause for concern since the 2004 passage of Act 201, which specifically forbids the Commission from accepting complaints from customers who have not first contacted the utility.38
The analysis provided by both the EDCs and the NGDCs regarding the company-reported statistics show that the various measures prescribed by the reporting requirements are interrelated. Often, the level of performance on one of the measures directly affects a company’s performance on one or more of the other measures. For example, if a company fails to obtain actual meter readings for long periods of time, it may underestimate the customers’ usage. When the company does get actual reads, the make-up bills may cause the customers to call the company, generating increased volumes of complaints. This may affect telephone access statistics. Further, as several companies have pointed out, an increased volume of complaints often leads to a company not being able to handle the disputes in a timely manner and the failure to issue reports to the disputes within the required 30-day timeframe. Later, such behavior may influence customer survey results and generate consumer complaints with the Commission. Finally, Commission review of the complaints may generate high justified consumer complaint rates, as well as high infraction rates. 38 52 Pa. Code § 56.166

30
Appendix A EDC Survey Results 2014-16
Table 1A
Company Satisfaction with Ease of Reaching the Company*
Satisfaction with Using EDC’s Automated Phone System*
2014 2015 2016 2014 2015 2016
Duquesne 85% 69% 79% 78% 64% 70% Met-Ed 79% 80% 79% 72% 75% 71% PECO 82% 84% 86% 77% 79% 80% Penelec 81% 81% 81% 75% 71% 74% Penn Power 82% 81% 79% 74% 71% 73% PPL 84% 87% 90% 80% 79% 84% UGI-Electric 86% 83% 88% 84% 76% 83% West Penn 76% 82% 80% 72% 71% 73% Average 82% 81% 83% 77% 73% 76%
*Percent of consumers who answered either “very satisfied” or “somewhat satisfied” when asked how satisfied they
were with this aspect of their recent contact with the EDC.
Table 1B
Company Satisfaction with EDC Representative’s
Handling of Contact* Overall Satisfaction with Quality of
Contact with EDC*
2014 2015 2016 2014 2015 2016
Duquesne 90% 87% 89% 86% 80% 85% Met-Ed 82% 87% 88% 80% 82% 84% PECO 88% 89% 90% 85% 86% 88% Penelec 87% 87% 87% 86% 84% 83% Penn Power 89% 87% 87% 90% 84% 84% PPL 92% 93% 94% 85% 91% 93% UGI-Electric 89% 91% 93% 88% 89% 92% West Penn 89% 89% 87% 81% 86% 84% Average 88% 89% 89% 85% 85% 87%
*Percent of consumers who answered either “very satisfied” or “somewhat satisfied” when asked how satisfied they
were with this aspect of their recent contact with the EDC.

31
Table 2 Overall Satisfaction with EDC Contact: Credit/Collection v. Other Calls* 2014-16
Company Credit/Collection Other Overall
2014 2015 2016 2014 2015 2016 2014 2015 2016
Duquesne 88% 83% 89% 85% 79% 83% 86% 80% 85% Met-Ed 80% 81% 83% 80% 83% 84% 80% 82% 84% PECO 86% 88% 86% 84% 86% 89% 85% 86% 88% Penelec 79% 86% 84% 86% 83% 83% 84% 84% 83% Penn Power 82% 82% 89% 87% 85% 82% 86% 84% 84% PPL 88% 90% 94% 85% 91% 92% 85% 91% 93% UGI-Electric 87% 90% 89% 89% 89% 92% 88% 89% 92% West Penn 80% 84% 81% 82% 86% 85% 82% 86% 84% Average 84% 85% 87% 85% 85% 86% 85% 85% 87%
*Other calls include all categories of contacts to an EDC other than those related to credit and collection. Other calls
include contacts about trouble or power outages, billing matters, connect/disconnect requests, customer choice, and miscellaneous issues such as requests for rate information or name and address changes.
Table 3
Contacting an EDC 2014-16
Company
Ease of Using EDC’s Automated Telephone
System*
Satisfaction with Choices Offered by Automated Telephone System**
Satisfaction with Wait to Speak to an EDC Representative**
2014 2015 2016 2014 2015 2016 2014 2015 2016
Duquesne 81% 65% 72% 81% 65% 69% 83% 66% 72% Met-Ed 73% 76% 72% 71% 76% 72% 70% 76% 76% PECO 77% 78% 79% 77% 80% 79% 77% 82% 81% Penelec 77% 72% 74% 75% 73% 75% 78% 77% 75% Penn Power 75% 73% 74% 74% 72% 74% 78% 75% 77% PPL 79% 79% 86% 79% 81% 84% 80% 84% 86% UGI-Electric 87% 77% 81% 85% 79% 82% 85% 79% 84% West Penn 72% 73% 72% 71% 72% 72% 72% 77% 75% Average 78% 74% 76% 77% 75% 76% 78% 77% 78%
*Percent of customers who answered “very easy to use” or “somewhat easy to use” when asked how easy it was to use
the EDC’s automated telephone system. **Percent of customers who answered either “very satisfied” or “somewhat satisfied” to questions about satisfaction with
how well the choices of the automated telephone system fit the nature of the customer’s call and how satisfied they were with the amount of time it took to speak to a company representative.

32
Table 4 Consumer Ratings of EDC Representatives 2014-16
Company Call Center Representative’s Courtesy* Call Center Representative’s
Knowledge*
2014 2015 2016 2014 2015 2016
Duquesne 94% 93% 94% 93% 89% 89% Met-Ed 91% 91% 90% 85% 90% 88% PECO 90% 91% 92% 91% 91% 91% Penelec 92% 92% 94% 89% 90% 92% Penn Power 94% 95% 94% 91% 89% 91% PPL 96% 96% 98% 94% 93% 95% UGI-Electric 91% 93% 93% 91% 93% 94% West Penn 93% 94% 92% 89% 91% 90% Average 93% 93% 93% 90% 91% 91%
*Percent of consumers who described the company representative as either “very courteous” or “somewhat courteous”
and “very knowledgeable” or “somewhat knowledgeable” when asked about their perception of these aspects of the call center representative.
Table 5A
Premises Visit from an EDC Field Representative 2014-16
Company
Overall Satisfaction with the Way
Premises Visit Handled* Satisfaction that Work Completed Promptly* Field Rep’s Courtesy**
2014 2015 2016 2014 2015 2016 2014 2015 2016
Duquesne 95% 88% 96% 84% 83% 84% 98% 93% 94% Met-Ed 85% 97% 85% 57% 78% 75% 79% 93% 86% PECO 89% 90% 83% 74% 81% 73% 96% 94% 94% Penelec 89% 91% 78% 78% 88% 79% 100% 100% 91% Penn Power 97% 100% 97% 89% 75% 92% 97% 100% 100% PPL 93% 88% 89% 82% 79% 92% 100% 97% 96% UGI-Electric 86% 93% 97% 75% 86% 81% 89% 100% 100% West Penn 94% 97% 86% 74% 84% 78% 95% 95% 100% Average 91% 93% 89% 77% 82% 82% 94% 97% 95%
*Percent of consumers who answered either “very satisfied” or “somewhat satisfied” when asked how satisfied they
were with this aspect of the field visit. For the purpose of the survey, “promptness” is the state or condition of acting or responding with speed or readiness to a customer’s question, complaint, dispute or request. An example of promptness might be the utility responding to a customer’s request for a premises visit with an appointment in five days rather than in five weeks.
**Percent of consumers who described the company field representative as “very courteous” or “somewhat courteous” when asked about their perceptions about various aspects of the field representative’s visit to the consumer’s home or property.

33
Table 5B Premises Visit from an EDC Field Representative 2014-16
Company Field Rep’s Knowledge*
Field Rep’s Respect for Property*
Satisfaction that Work Completed
in a Timely Manner**
2014 2015 2016 2014 2015 2016 2014 2015 2016
Duquesne 95% 96% 97% 97% 100% 100% 89% 87% 82% Met-Ed 87% 100% 86% 95% 100% 95% 57% 90% 87% PECO 100% 91% 100% 93% 92% 93% 89% 85% 65% Penelec 100% 95% 90% 98% 100% 94% 88% 90% 86% Penn Power 97% 100% 100% 100% 98% 97% 91% 90% 87% PPL 100% 96% 92% 98% 96% 97% 93% 94% 92% UGI-Electric 89% 100% 100% 93% 98% 97% 86% 85% 82% West Penn 89% 89% 94% 94% 97% 97% 85% 80% 78% Average 95% 96% 95% 96% 98% 96% 85% 88% 82%
*Percent of consumers who described the company field representative as “very knowledgeable” or “somewhat
knowledgeable” and “very respectful” or “somewhat respectful” when asked about their perceptions about various aspects of the field representative’s visit to the consumer’s home or property.
**Percent of consumers who answered either “very satisfied” or “somewhat satisfied” when asked how satisfied they were with this aspect of the field visit. For the purpose of the survey, “timeliness” is the state or condition of acting at the appropriate or correct time as previously determined or promised when responding to a customer’s question, complaint, dispute or request. An example of timeliness might be a utility representative arriving at the customer’s residence on the date and at the time previously agreed upon by the utility and the customer.
Table 6
Characteristics of 2016 EDC Survey Participants
Company Consumers Surveyed
% Residential Consumers
% Commercial Consumers
% Who Used EDC’s Automated
Phone System
% Who Spoke with a
Company Representative
% Who Needed a Premises
Visit
Duquesne 705 100% 0% 82% 83% 9% Met-Ed 706 99% 1% 80% 93% 7% PECO 704 99% 1% 77% 86% 5% Penelec 706 98% 2% 80% 95% 8% Penn Power 707 99% 1% 80% 92% 5% PPL 705 100% 0% 75% 72% 5% UGI-Electric 708 99% 1% 77% 96% 6% West Penn 706 99% 1% 78% 93% 6% Average 706 99% 1% 79% 89% 6%

34
Table 7 Average Number of EDC Residential Customers 2016
Company Average Number of Residential Customers
Duquesne 526,283
Met-Ed 495,698
PECO 1,466,107
Penelec 501,819
Penn Power 143,536
PPL 1,231,156
UGI-Electric 55,805
West Penn 623,830

35
Appendix B
NGDC Survey Results 2014-16
Table 1A
Company Satisfaction with Ease of Reaching the Company*
Satisfaction with Using NGDC’s Automated Phone System*
2014 2015 2016 2014 2015 2016
Columbia 90% 90% 91% 81% 85% 83% Peoples 88% 88% 90% 82% 84% 83% Peoples-Equitable 91% 88% 89% 83% 83% 79% NFG 94% 94% 93% NA NA NA PGW 75% 82% 80% 77% 77% 82% UGI-Gas 87% 89% 91% 80% 84% 84% UGI Penn Natural 88% 87% 89% 83% 79% 82% Average 88% 88% 89% 81% 82% 82%
*Percent of consumers who answered either “very satisfied” or “somewhat satisfied” when asked how satisfied they
were with this aspect of their recent contact with the NGDC.
Table 1B
Company Satisfaction with NGDC Representative’s
Handling of Contact* Overall Satisfaction with Quality of
Contact with NGDC*
2014 2015 2016 2014 2015 2016
Columbia 93% 92% 92% 92% 92% 93% Peoples 94% 93% 94% 92% 92% 94% Peoples-Equitable 91% 94% 94% 91% 92% 93% NFG 93% 93% 95% 92% 94% 94% PGW 82% 87% 92% 79% 86% 87% UGI-Gas 91% 93% 95% 88% 93% 92% UGI Penn Natural 92% 92% 92% 91% 91% 93% Average 91% 92% 93% 89% 91% 92%
*Percent of consumers who answered either “very satisfied” or “somewhat satisfied” when asked how satisfied they
were with this aspect of their recent contact with the NGDC.

36
Table 2 Overall Satisfaction with Contact: NGDC Credit/Collection v. Other Calls* 2014-16
Company Credit/Collection Other Overall
2014 2015 2016 2014 2015 2016 2014 2015 2016
Columbia 92% 94% 92% 92% 92% 84% 92% 92% 93% Peoples 94% 90% 95% 91% 93% 93% 92% 92% 94% Peoples-Equitable 92% 94% 91% 90% 92% 93% 91% 92% 93% NFG 91% 95% 92% 92% 95% 95% 92% 94% 94% PGW 78% 86% 91% 80% 86% 86% 79% 86% 91% UGI-Gas 84% 84% 88% 89% 92% 94% 89% 93% 92% UGI Penn Natural 89% 89% 93% 91% 91% 93% 91% 91% 93% Average 89% 91% 92% 89% 92% 91% 89% 91% 93%
*Other calls include all categories of contacts to an NGDC other than those related to credit and collection. Other calls
include contacts about reliability and safety, billing matters, connect/disconnect requests, customer choice, and miscellaneous issues such as requests for rate information or name and address changes.
Table 3 Contacting an NGDC 2014-16
Company
Ease of Using NGDC’s Automated Telephone
System*
Satisfaction with Choices Offered by Automated Telephone System**
Satisfaction with Wait to Speak to an NGDC Representative**
2014 2015 2016 2014 2015 2016 2014 2015 2016
Columbia 82% 83% 83% 83% 84% 84% 85% 87% 88% Peoples 83% 84% 81% 86% 82% 82% 84% 87% 84% Peoples-Equitable 84% 83% 80% 81% 82% 82% 87% 87% 84% NFG NA NA NA NA NA NA 93% 95% 93% PGW 79% 77% 83% 76% 75% 80% 71% 81% 76% UGI-Gas 82% 85% 83% 82% 85% 81% 85% 86% 89% UGI Penn Natural 80% 81% 79% 82% 79% 82% 86% 84% 86% Average 82% 82% 82% 82% 81% 82% 84% 87% 86%
*Percent of customers who answered “very easy to use” or “somewhat easy to use” when asked how easy it was to use the NGDC’s automated telephone system.
**Percent of customers who answered either “very satisfied” or “somewhat satisfied” to questions about satisfaction with how well the choices of the automated telephone system fit the nature of the customer’s call and how satisfied they were with the amount of time it took to speak to a company representative.
37
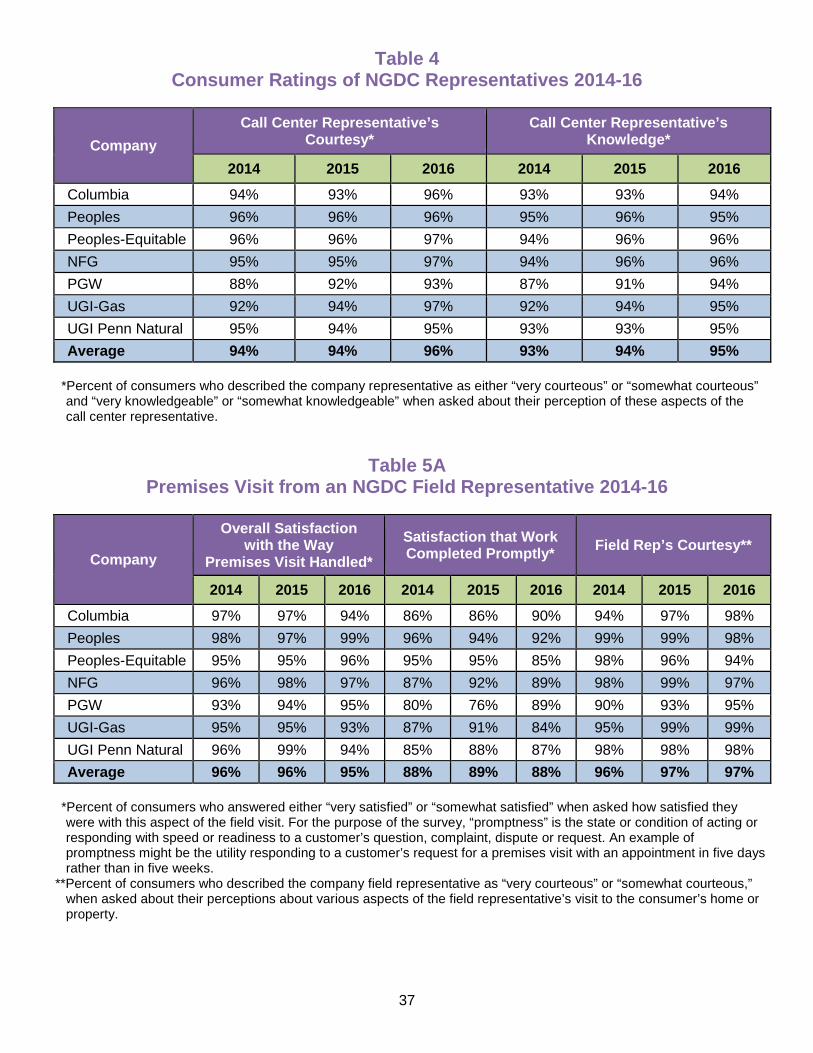
Table 4 Consumer Ratings of NGDC Representatives 2014-16
Company Call Center Representative’s
Courtesy* Call Center Representative’s
Knowledge*
2014 2015 2016 2014 2015 2016 Columbia 94% 93% 96% 93% 93% 94% Peoples 96% 96% 96% 95% 96% 95% Peoples-Equitable 96% 96% 97% 94% 96% 96% NFG 95% 95% 97% 94% 96% 96% PGW 88% 92% 93% 87% 91% 94% UGI-Gas 92% 94% 97% 92% 94% 95% UGI Penn Natural 95% 94% 95% 93% 93% 95% Average 94% 94% 96% 93% 94% 95%
*Percent of consumers who described the company representative as either “very courteous” or “somewhat courteous”
and “very knowledgeable” or “somewhat knowledgeable” when asked about their perception of these aspects of the call center representative.
Table 5A Premises Visit from an NGDC Field Representative 2014-16
Company Overall Satisfaction
with the Way Premises Visit Handled*
Satisfaction that Work Completed Promptly* Field Rep’s Courtesy**
2014 2015 2016 2014 2015 2016 2014 2015 2016 Columbia 97% 97% 94% 86% 86% 90% 94% 97% 98% Peoples 98% 97% 99% 96% 94% 92% 99% 99% 98% Peoples-Equitable 95% 95% 96% 95% 95% 85% 98% 96% 94% NFG 96% 98% 97% 87% 92% 89% 98% 99% 97% PGW 93% 94% 95% 80% 76% 89% 90% 93% 95% UGI-Gas 95% 95% 93% 87% 91% 84% 95% 99% 99% UGI Penn Natural 96% 99% 94% 85% 88% 87% 98% 98% 98% Average 96% 96% 95% 88% 89% 88% 96% 97% 97%
*Percent of consumers who answered either “very satisfied” or “somewhat satisfied” when asked how satisfied they
were with this aspect of the field visit. For the purpose of the survey, “promptness” is the state or condition of acting or responding with speed or readiness to a customer’s question, complaint, dispute or request. An example of promptness might be the utility responding to a customer’s request for a premises visit with an appointment in five days rather than in five weeks.
**Percent of consumers who described the company field representative as “very courteous” or “somewhat courteous,” when asked about their perceptions about various aspects of the field representative’s visit to the consumer’s home or property.

38
Table 5B Premises Visit from an NGDC Field Representative 2014-16
Company Field Rep’s Knowledge*
Field Rep’s Respect for Property*
Satisfaction that Work Completed
in a Timely Manner**
2014 2015 2016 2014 2015 2016 2014 2015 2016
Columbia 99% 95% 97% 98% 98% 98% 84% 88% 91% Peoples 100% 97% 98% 99% 99% 99% 92% 95% 89% Peoples-Equitable 96% 97% 96% 99% 96% 99% 95% 94% 90% NFG 96% 99% 97% 98% 99% 97% 88% 93% 89% PGW 93% 97% 93% 94% 96% 97% 86% 83% 90% UGI-Gas 95% 95% 97% 99% 97% 100% 91% 87% 82% UGI Penn Natural 98% 98% 98% 96% 100% 99% 90% 89% 87% Average 97% 97% 97% 98% 98% 98% 89% 90% 88%
*Percent of consumers who described the company field representative as “very knowledgeable” or “somewhat
knowledgeable” and “very respectful” or “somewhat respectful” when asked about their perceptions about various aspects of the field representative’s visit to the consumer’s home or property.
**Percent of consumers who answered either “very satisfied” or “somewhat satisfied” when asked how satisfied they were with this aspect of the field visit. For the purpose of the survey, “timeliness” is the state or condition of acting at the appropriate or correct time as previously determined or promised when responding to a customer’s question, complaint, dispute or request. An example of timeliness might be a utility representative arriving at the customer’s residence on the date and at the time previously agreed upon by the utility and the customer.
Table 6 Characteristics of 2016 NGDC Survey Participants
Company Consumers Surveyed
% Residential Consumers
% Commercial Consumers
% Who Used NGDC’s
Automated Phone System
% Who Spoke with a
Company Representative
% Who Needed a Premises
Visit
Columbia 706 99% 1% 75% 91% 16%
Peoples 706 99% 1% 79% 94% 12%
Peoples-Equitable 706 98% 2% 83% 93% 11%
NFG 711 99% 1% NA 97% 14%
PGW 706 98% 2% 72% 94% 11%
UGI-Gas 706 99% 1% 74% 98% 12%
UGI Penn Natural 706 99% 1% 81% 95% 10%
Average 707 99% 1% 77% 95% 12%

39
Table 7 Average Number of NGDC Residential Customers 2016
Company Average Number of Residential Customers
Columbia 390,394
NFG 197,992
Peoples 331,814
Peoples-Equitable 243,371
PGW 473,019
UGI-Gas 345,693
UGI Penn Natural 152,760
