2016 corporate governance best practices report corporate governance...this report details the...
TRANSCRIPT

2016 Corporate Governance Best Practices Report
In collaboration with:


3© Copyright 2016, Korn Ferry
Table of Contents
Executive Summary 5
Corporate governance overview 5
Corporate sustainability governance 5
Pay for performance governance and design 5
Enterprise risk management oversight and governance 5
Engagement by a governance team 5
Boardroom diversity 5
Effective Board and Committee operations 5
Introduction 6
The Canadian Society of Corporate Secretaries (CSCS) 6
Korn Ferry Hay Group 6
Our Approach 7
Methodology 7
Participant profile 8
Corporate Governance Overview 10
Top Board matters 11
Corporate governance legislation 12
Corporate Sustainability Governance 13
Sustainability policy 13
Environment 13
Pay for Performance Governance and Design 15
Executive compensation policy 15
Executive pay plan 15
Performance incentives 16

4© Copyright 2016, Korn Ferry
Enterprise Risk Management Oversight and Governance 18
Enterprise risk management accountability 18
Barriers to risk oversight 19
Disclosure 20
Ethics and risk 21
Compensation-related risk 21
Compensation clawback policy 23
Engagement by a Governance Team 25
Board interaction 25
Boardroom Diversity 27
Board diversity policy 27
Facts and figures within the Canadian Boardroom 27
Gender diversity 28
Visible minority diversity 28
Ethnic diversity 29
Board recruitment 29
Effective Board and Committee Operations 30
Board Committees 30
Board meetings 30
Board performance evaluation 31
Management performance evaluation 33
Director orientation and education 33
CEO succession planning 36
Appendix A 38

5© Copyright 2016, Korn Ferry
Executive Summary
This report details the prevailing corporate governance views and practices among organizations in Canada.
Corporate governance overview
The most significant corporate governance issue continues to be risk management and oversight. Operational, financial and cyber risk are the risks most commonly perceived as most critical by organizations. Strategic planning, risk management and succession planning are the top three issues facing Boards in 2016.
Corporate sustainability governance
The number of organizations with formal sustainability policies is increasing, year over year. Currently, one half of respondents have a formal sustainability policy. However, over three quarters of organizations have implemented several sustainability initiatives, with improving energy efficiency being the most common initiative.
Pay for performance governance and design
Organization business strategy and market practices are the most impactful factors for both the final design of the executive pay program and the Board’s decision on actual executive compensation. CEO pay for performance analysis is most commonly performed in 95% of publicly traded companies. The analysis is most commonly made available to the Board for internal use. Financial measures, such as profit, revenue and cash flow continue to have the largest impact on payout for short term incentives.
Enterprise risk management oversight and governance
72% of organizations have a fully implemented formal risk policy in place, a significant jump from 47% in 2015. The number of organizations who have implemented a formal whistleblower policy continues to grow to 94% in 2016, up 16% from 2015. 87% of publicly traded firms have a formal compensation clawback/withhold policy. 13% of non-publicly traded firms have such a policy. Of the organizations with a compensation clawback policy, CEOs are the most common employee group covered by the policy followed by CFOs.
Engagement by a governance team
The number of Boards who schedule a structured meeting or call with shareholders at least once per year remains consistent with the trend seen in 2015. Media and regulators continue to be the most common stakeholder groups that interact with organizations.
Boardroom diversity
The number of organizations with a formal Board diversity policy is continuing to grow, year over year. Currently, 43% of organizations and 79% of those publicly traded firms have a fully implemented formal Board diversity policy in place. Where a policy exists, gender policy is highly prevalent. 50% of publicly traded organizations have a policy for the target percentage of female directors. All organizations report having at least one female director on the Board.
Effective Board and Committee operations
When analyzed over the past four years, 2016 has the highest prevalence of organizations with a formal policy for Board performance evaluation. The most common Board performance evaluation methodology is conducting an individual peer-evaluation survey led by the corporate secretary or other in-house personnel. Almost half of respondents report the majority of their directors attending an education program in the past year. The most common education topics include industry specific topics, risk oversight and organization policies.

6© Copyright 2016, Korn Ferry
Introduction
Welcome to the 2016 Corporate Governance Best Practices Report, an annual report reflecting the trends of corporate governance in Canada since 2013. This year, Korn Ferry Hay Group, along with the Canadian Society of Corporate Secretaries (CSCS), conducted surveys with corporate secretaries and other governance professionals at 81 organizations across the country. This report highlights the key findings of our research, outlines the views shared by survey respondents and provides greater context on the current corporate governance landscape in Canada.
The Canadian Society of Corporate Secretaries (CSCS)
The CSCS is a leading resource for Corporate Secretaries and Corporate Governance professionals. It is recognized as being the most important professional organization for good corporate governance in Canada. Aside from striving to enhance the visibility and credibility of the office of the corporate secretary, it also offers a unified voice and proven tools for best practices in corporate governance.
Korn Ferry Hay Group
Korn Ferry Hay Group is a global management consulting firm that works with leaders to transform strategy into reality. We develop talent, organize people to be more effective and motivate them to perform at their best. As organizations strive to attract and retain top talent in the face of increased public and shareholder scrutiny, executive pay, succession, performance and competence are vital. Korn Ferry Hay Group’s consultants work with Boards as well as senior management across all sectors, from large global players to not-for-profit, helping them address these issues.

7© Copyright 2016, Korn Ferry
Our Approach
Korn Ferry Hay Group, in partnership with CSCS, conducted the 2016 Corporate Governance Practices Survey (Appendix A), which included 81 respondents from organizations of varying sizes, industries and structures. We sought perspectives on the following topics:
1. Corporate governance overview
2. Corporate sustainability governance
3. Pay for performance governance and design
4. Enterprise risk management oversight and governance
5. Engagement by a governance team
6. Boardroom diversity
7. Effective Board and Committee operations
The results from these areas have been summarized and presented in this report. Additionally, these results were used during the nomination process for the annual CSCS Excellence in Governance Awards. The categories for these awards are similar to those conducted via the online survey described above and include:
1. Best Sustainability Governance Team
2. Best Pay for Performance
3. Enterprise Risk Management
4. Best Engagement by a Governance Team
5. Best Practices to Enhance Boardroom Diversity
6. Best Approach to Achieving Effective Board and Committee Operations
7. Best Practices in Strategic Planning, Oversight and Value Creation by the Board
8. Best Overall Corporate Governance
Methodology
Several question formats are used in the survey, including multiple choice and rating options in order of preference. ‘Not applicable’ responses were excluded from the analysis.
It should be noted that findings illustrate trends for respondents. Additional comments have been provided where differences between data cuts, such as differences in ownership structure, have been identified.

8© Copyright 2016, Korn Ferry
Participant profile
The respondents spanned a range of seven industries in total; the industries with the most responses are the broader public sector and industrial sectors.
Broader Public Services
Professional Services
Technology
Life Science
Industrial
Financial
Consumer
Respondents by industry
5%
19%
24%
1%4%
6%
42%

9© Copyright 2016, Korn Ferry
In terms of ownership structure, the highest percentage of organizations is not-for-profit organizations. One in two respondents have 500 employees or fewer.
Other
Crown corporations
Privately held
Publicly traded
10,001 - 100,000
5,001 - 10,000
1,001 - 5,000
501 - 1000
0 - 500
Respondents by ownership structure
24%
12%
27%
11%
26%
Respondents by number of employees
53%
9%
15%
11%
12%
10© Copyright 2016, Korn Ferry
Corporate Governance Overview
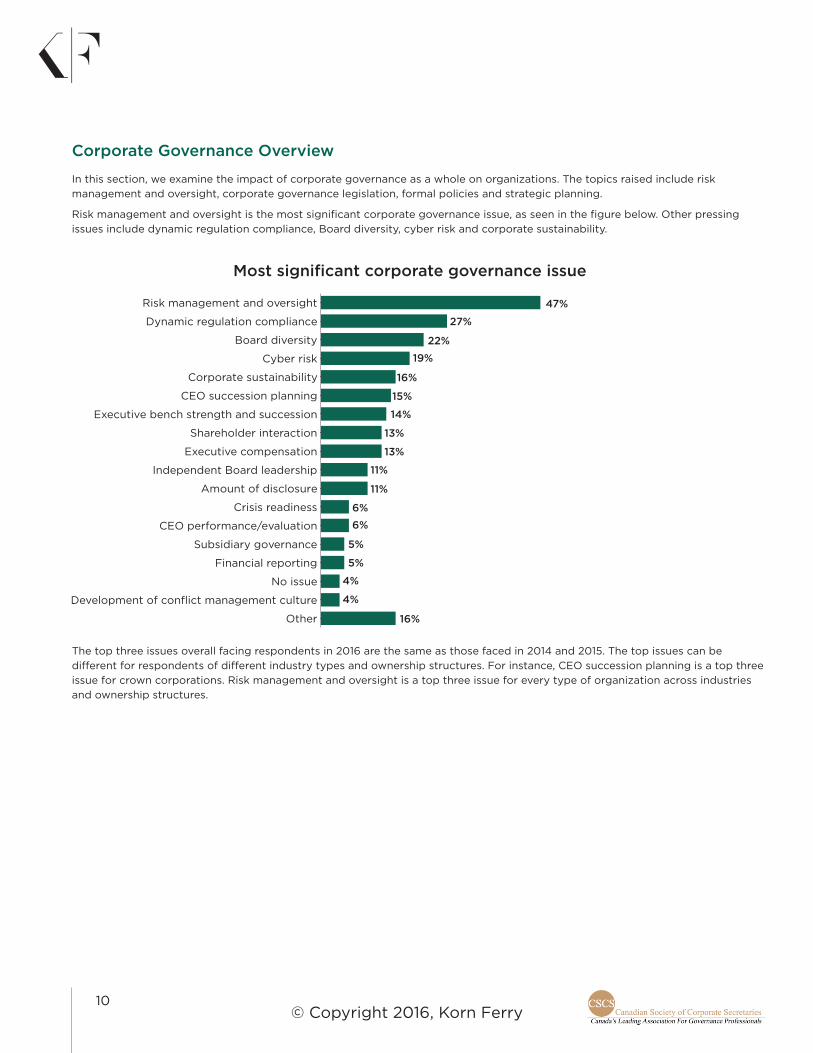
In this section, we examine the impact of corporate governance as a whole on organizations. The topics raised include risk management and oversight, corporate governance legislation, formal policies and strategic planning.
Risk management and oversight is the most significant corporate governance issue, as seen in the figure below. Other pressing issues include dynamic regulation compliance, Board diversity, cyber risk and corporate sustainability.
Other
No issue
Financial reporting
Subsidiary governance
CEO performance/evaluation
Crisis readiness
Amount of disclosure
Independent Board leadership
Executive compensation
Shareholder interaction
Executive bench strength and succession
CEO succession planning
Corporate sustainability
Cyber risk
Board diversity
Dynamic regulation compliance
Risk management and oversight
The top three issues overall facing respondents in 2016 are the same as those faced in 2014 and 2015. The top issues can be different for respondents of different industry types and ownership structures. For instance, CEO succession planning is a top three issue for crown corporations. Risk management and oversight is a top three issue for every type of organization across industries and ownership structures.
47%
27%
22%
19%
16%
15%
14%
13%
13%
11%
11%
6%
6%
5%
5%
4%
4%
16%
Most significant corporate governance issue

11© Copyright 2016, Korn Ferry
Operational and financial risks are the most common types of risk perceived as most critical to participating organizations. Compensation risk and financial reporting risks were reported the least often by organizations.
Other
Financial reporting risk
Compensation risk
Environmental risk
Governance risk
People risk
Compliance-related risk
Strategy risk
Reputational risk
Cyber/Technological/IT risk
Financial risk
Operational risk
Top Board matters
The top three issues for Boards in 2016 are strategic planning, risk management and succession planning. The percentage of respondents who ranked strategic planning as the top Board issue has increased from 20% in 2015 to 37% in 2016, has remained the same for risk management as the top Board issue.
Ranked 3
Ranked 2
Ranked 1
Crisis management / planning
Executive compensation
Developing human capital
Information technology issues
Regulatory compliance
Succession planning
Risk management
Strategic planning
54%
48%
44%
41%
26%
15%
6%
2%
11%
11%
11%
15%
67%
59%
53%
26%
25%
16%
18%
33%
37%
18%
14%
9%
7%
5%
4%
5%
Most critical types of risks
Top three board matters (1 being the most important)

12© Copyright 2016, Korn Ferry
Corporate governance legislation
Over half of respondents are of the opinion that corporate governance codes and legislation have had a neutral impact on Board operations. As shown in the figure below, the number of respondents who perceive the impact of corporate governance legislation to be positive has decreased since 2014.
0%
10%
20%
30%
40%
50%
60%Negative/Room for improvementNeutralPositive
2016201520142013
Impact of corporate governance codes and legislation
13© Copyright 2016, Korn Ferry
Corporate Sustainability Governance
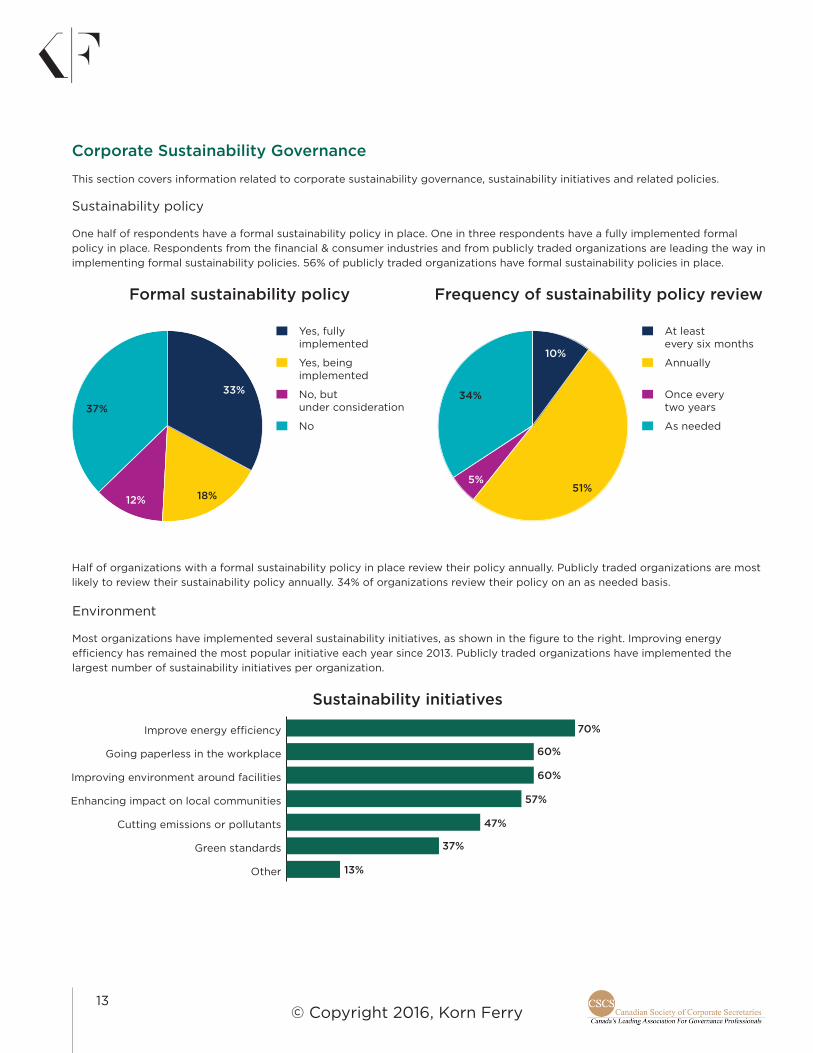
This section covers information related to corporate sustainability governance, sustainability initiatives and related policies.
Sustainability policy
One half of respondents have a formal sustainability policy in place. One in three respondents have a fully implemented formal policy in place. Respondents from the financial & consumer industries and from publicly traded organizations are leading the way in implementing formal sustainability policies. 56% of publicly traded organizations have formal sustainability policies in place.
Half of organizations with a formal sustainability policy in place review their policy annually. Publicly traded organizations are most likely to review their sustainability policy annually. 34% of organizations review their policy on an as needed basis.
No
No, but under consideration
Yes, being implemented
Yes, fully implemented
As needed
Once every two years
Annually
At least every six months
Environment
Most organizations have implemented several sustainability initiatives, as shown in the figure to the right. Improving energy efficiency has remained the most popular initiative each year since 2013. Publicly traded organizations have implemented the largest number of sustainability initiatives per organization.
Other
Green standards
Cutting emissions or pollutants
Enhancing impact on local communities
Improving environment around facilities
Going paperless in the workplace
Formal sustainability policy Frequency of sustainability policy review
33%
18%12%
37%
10%
51%5%
34%
70%
60%
60%
57%
47%
37%
13%
Sustainability initiatives

14© Copyright 2016, Korn Ferry
For over one third of organizations, the Board assesses management’s performance on sustainability initiatives on an annual basis. Crown corporations and organizations in the consumer industry assess management’s performance on sustainability initiatives most often, performing the evaluation at least once every six months.
Never
As needed
Once every two years (0%)
Annually
At least every six months
Management sustainability evaluation
38%
23%
28%
11%

15© Copyright 2016, Korn Ferry
Pay for Performance Governance and Design
Executive compensation policy
Organizations most commonly review their executive compensation policy once per year. This trend remains consistent since 2013. However, since 2013, there has been a 6% increase in organizations that review their executive compensation policy only if there is a specific development requiring them to do so.
At least every six months
We have never reviewed our executive compensation policy
Once every 2 years
Annually
Executive pay plan
The top three factors that have the most impact on the organization when designing the executive pay plan include organization business strategy, market practice and regulatory requirements, as seen in the chart below. Financial organizations unanimously ranked organization business strategy as ‘very important’. Crown corporations were the most common company type to answer ‘Other’. The most common ‘Other’ response by these types of organizations were based on government legislation and government mandated wage freezes.
It is important to note in this graph that 30% of participating organizations who responded to this question are publicly traded, meaning that proxy advisor policy and investor views are likely important to them.
Very important
Fairly important
Least important
Media/public opinion
Proxy advisor policy/investor views*
Corporate governance codes
Other
Stakeholder's needs
Regulatory requirements
Market practice
Organization business strategy
*30% of participating organizations who responded to this question are publicly traded.
61%
20%
13%
5%
2%
Executive pay plan
77%
70%
56%
56%
17%
44%
42%
48%

16© Copyright 2016, Korn Ferry
The same factors have the most impact over the Board’s decision on actual executive compensation, such as payout / grant as the impact on the final design of the program (shown in the graph above). Organizations from the consumer industry unanimously ranked organization business strategy as ‘very important’ when deciding actual executive compensation payouts. Publicly traded organizations were most likely to rank organization business strategy as ‘very important’.
*30% of participating organizations who responded to this question are publicly traded.
Almost one of every two organizations conduct an after-the-fact pay for performance analysis for their CEO/NEO compared to a performance metric(s), such as TSR and/or Earnings Growth. Of these organizations, 81% provide this analysis to their Board for internal use, 56% provide the analysis to management for internal use and 22% disclose the analysis results in their proxy.
This trend becomes even more notable in publicly traded organizations, where 75% perform this analysis. Of these organizations who conduct an after-the-fact pay for performance analysis for their CEO/NEO, 87% provide this analysis to their Board for internal use, 60% provide the analysis to management for internal use and 53% disclose the analysis results in their proxy.
Performance incentives
Respondents tend to measure performance in the following ways:
� Financial performance: Usually measured using financial metrics such as profits, revenue, cash flow, earnings per share, return on investment and economic value added, to name a few. Organizations in the consumer industry are most likely to rate financial performance as having a larger impact on short term incentive payout.
� Individual performance: Measured through the individual’s performance against established goals. Organizations from the consumer and professional services industries are most likely to rate individual performance as having a larger impact on short term incentive payout.
� Operational performance: Includes measuring unit cost, productivity, labour efficiency, product quality, speed of production, etc., to determine level of performance. Organizations from the financial and broader public sector industries are most likely to rate operational performance as having a larger impact on short term incentive payout.
� Customer feedback: Despite having a lower impact compared to the other three measures of performance, customer feedback is still used widely as indicated below. This includes measures of satisfaction, attraction and loyalty, and is obtained through surveys, questionnaires and other forms of market research. Organizations from the broader public sector are most likely to rate customer feedback as having a larger impact on short term incentive payout.

17© Copyright 2016, Korn Ferry
For organizations who have a long term incentive (e.g. PSU, RSU, Cash LTIP) plan, the factor that influences the actual grant size for individual executives varies by company type. For 75% of publicly traded organizations, the current year’s individual performance is the most important factor. For 64% of non-publicly traded organizations, the current year’s corporate performance is the most important factor.

18© Copyright 2016, Korn Ferry
Enterprise Risk Management Oversight and Governance
In 2016, 72% of organizations have a fully implemented formal risk policy in place that includes a risk governance model, segregated and distinct functional responsibilities for risk management and/or written goals and reports. This has significantly increased since 2015, where just 47% of organizations had a fully implemented formal risk policy in place. Financial and publicly traded organizations have the largest percentage of respondents with a fully implemented formal risk policy.
Enterprise risk management accountability
58% of organizations have a risk Committee (or equivalent) at the management level. Financial and publicly traded organizations were the organization types who were most likely to report having a management level risk Committee.
60% of organizations have a Chief Risk Officer or an equivalent senior risk officer role present. This is the highest number reported over the past four years of the survey, suggesting that more organizations have a Chief Risk Officer present than ever before. Survey results show that the financial sector is the most likely to have a Chief Risk Officer present, with 80% of financial organizations having a Chief Risk Officer.
Other than the full Board, organizations primarily rely on their Audit Committee to hold responsibility for risk oversight and governance. The finance industry is the industry that is most common to have a separate risk Committee, where two in three financial organizations have a separate risk Committee. The most common names of the separate Committees include Finance, Audit, and/or Risk Committee.

19© Copyright 2016, Korn Ferry
Within the Committee of the Board responsible for risk, other than the industry expert, 42% organizations have over one third of members with the requisite expertise in enterprise risk management. One in five organizations have five to ten percent of members with the requisite expertise in enterprise risk management. Requisite expertise for other Committee members is up to each individual organization to define, based on the requirements specific to each organization. However, some expertise to be considered would include:
a) Experience successfully managing significant risks; and
b) Organizational and leadership skills required to work with the Board and management to support sound risk management in the organization.
60% of organizations have their Board and standing Committees share the accountability for enterprise risk oversight and governance. 87% of organizations from the financial sector and 83% of privately held organizations have a Board and standing Committee(s) primarily accountable for risk oversight and governance.
At the Board / Committee level, the most common accountability for risk is overseeing the risk management infrastructure. Other commonly reported accountabilities include monitoring risks such as compliance, funding and capital risks and reviewing risk assessments in order to evaluate the organization’s risk exposure.
Barriers to risk oversight
The top three barriers in an organization’s risk oversight process include:
1. A gap in risk reporting, where there is a barrier in methodology, data and/or the tracking system;
2. A lack of understanding of risks by Board members; and
3. A lack of clarity, definition and agreement about the organization’s enterprise risk management philosophy.
Based on these results, it is possible that Board members require more education on enterprise risk management in order to better define the risk reporting regulations and enterprise risk management philosophy.

20© Copyright 2016, Korn Ferry
Interestingly, when these results are compared between publicly traded and non-publicly traded organizations, a lack of understanding of risks by Board members and a lack of clarity, definition and agreement about enterprise risk management philosophy become less commonly reported barriers within publicly traded organizations. The second and third most commonly reported barriers include:
1. Lack of understanding of risks by management; and
2. Misalignment of risk appetite framework between the Board and management.
This may suggest that publicly traded organizations have a more comprehensive definition in their risk management philosophy. The barrier occurs when the Board and management try to align on the issues. More communication between the Board and management may help to break down these barriers.
Disclosure
Nine in ten organizations discuss risk oversight and risk management in disclosure material. This number is even greater in publicly traded organizations (94%), reflecting the disclosure requirements for these organizations.
78% of organizations have a defined risk appetite and risk tolerance framework. Of these organizations, 60% review the framework annually. All organizations in the consumer, financial, life science and technology industries reported having a defined risk appetite and risk tolerance framework.

21© Copyright 2016, Korn Ferry
Ethics and risk
Almost all organizations have implemented a formal whistleblower policy (94%). All publicly traded organizations have implemented a formal whistleblower policy. Organizations from professional services and the broader public sector were the only groups to have some respondents report not having a formal whistleblower policy.
93% of organizations have an employee business conduct and ethics policy in place. Of these organizations, 77% require all employees to sign an agreement. All publicly traded organizations have an employee business conduct and ethics policy in place.
Over half of organizations have a Board-approved crisis management plan and written policy in place. 73% of financial sector organizations and 60% of publicly traded organizations reported having a Board-approved crisis management plan and written policy in place.
Compensation-related risk
79% of organizations require financial performance to meet a specified threshold level, before the incentive payouts are made for other metrics in the short term incentive program. 73% of publicly traded and 87% of financial sector organizations have a threshold financial performance level for their incentive program.

22© Copyright 2016, Korn Ferry
93% of organizations have a stated maximum (cap) payout opportunity for executives in their short term incentive plan. As seen in the graph to the right, publicly traded organizations were the organization type that were most likely to have a stated maximum (cap) payout opportunity. Not-for-profit organizations are the least likely.
44% of organizations decide on short term incentive awards using a formula for some metrics, qualitative evaluation for other metrics and a Board discretionary adjustment. This number increases to 67% within publicly traded organizations. One in four organizations base their short term incentive award entirely on formula.
Half of organizations use a deferred compensation or long term incentive (LTI) program for executives. All publicly traded organizations use a deferred compensation or long term incentive (LTI) program for executives. 80% of financial and industrial sector organizations use a deferred compensation or long term incentive (LTI) program for executives.
23© Copyright 2016, Korn Ferry
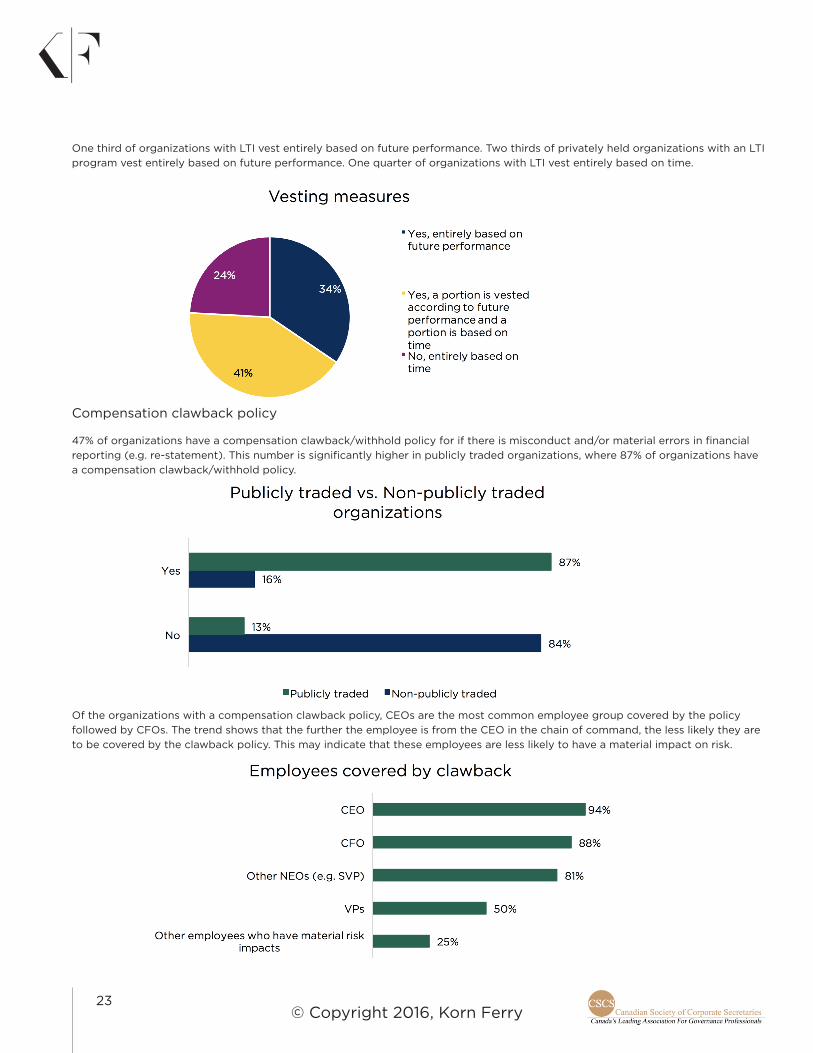
One third of organizations with LTI vest entirely based on future performance. Two thirds of privately held organizations with an LTI program vest entirely based on future performance. One quarter of organizations with LTI vest entirely based on time.
Compensation clawback policy
47% of organizations have a compensation clawback/withhold policy for if there is misconduct and/or material errors in financial reporting (e.g. re-statement). This number is significantly higher in publicly traded organizations, where 87% of organizations have a compensation clawback/withhold policy.
Of the organizations with a compensation clawback policy, CEOs are the most common employee group covered by the policy followed by CFOs. The trend shows that the further the employee is from the CEO in the chain of command, the less likely they are to be covered by the clawback policy. This may indicate that these employees are less likely to have a material impact on risk.
24© Copyright 2016, Korn Ferry
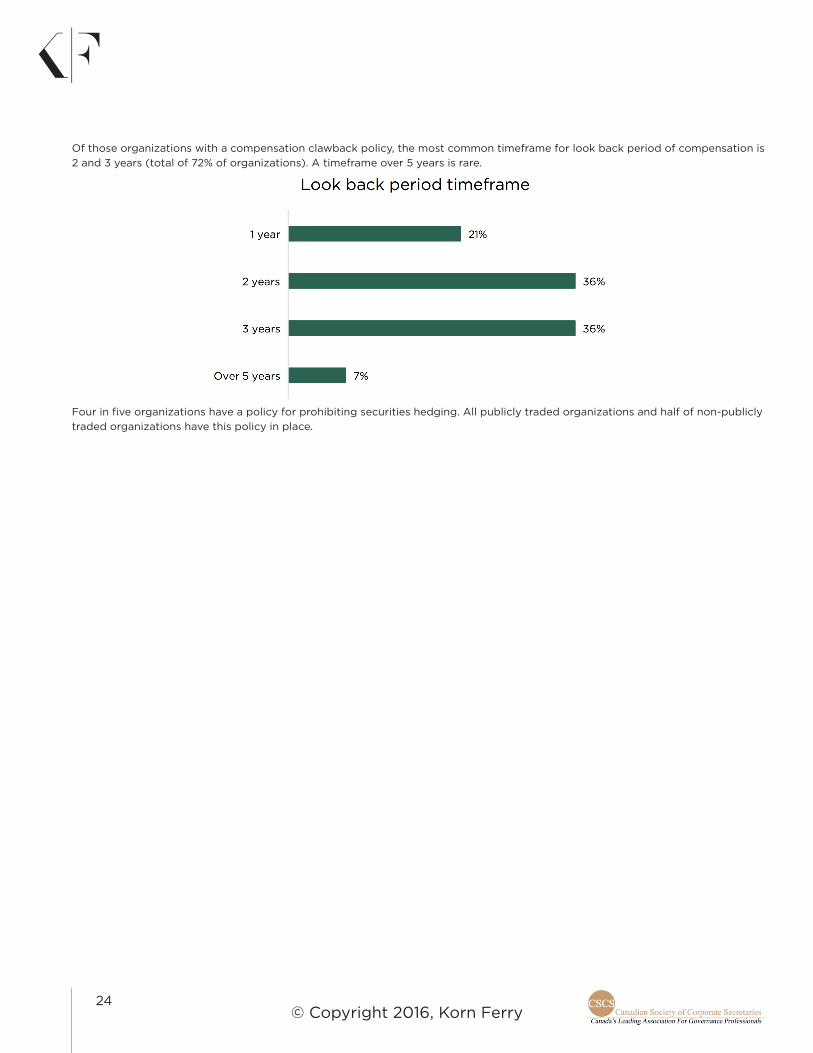
Of those organizations with a compensation clawback policy, the most common timeframe for look back period of compensation is 2 and 3 years (total of 72% of organizations). A timeframe over 5 years is rare.
Four in five organizations have a policy for prohibiting securities hedging. All publicly traded organizations and half of non-publicly traded organizations have this policy in place.

25© Copyright 2016, Korn Ferry
Engagement by a Governance Team
This section looks at who, how and how often respondents interact with stakeholders.
Board interaction
The chart below indicates how Boards approached their interactions with shareholders in the past year. 47% of Boards scheduled a structured meeting or call, while one third of Boards meet with shareholders only if asked. Most notably, only 25% of publicly traded organizations schedule a structured meeting or call with shareholders at least once per year. The majority of publicly traded organizations reported that they will meet with shareholders only if asked. Three in five non-publicly traded organizations schedule a structured meeting or call with shareholders at least once per year.
Almost half of organizations are communicating with stakeholders two times or less each year. When analyzed by company type, non-publicly traded organizations were most likely to report communicating with stakeholders seven or more times per year.
Respondents tend to interact most frequently with the media and regulators, a trend that has remained consistent over the past four years.

26© Copyright 2016, Korn Ferry
Most respondents selected either ‘Not Applicable’ or ‘Neutral’ to the questions concerning the Investor Relations Officer (“IRO”) shown in the graph below. Readers are cautioned that due to the small valid sample size, we anticipate the volatility of year-over-year changes over multiple survey periods.

27© Copyright 2016, Korn Ferry
Boardroom Diversity
This section covers perspectives on how Boards define ‘diversity’ and what measures they have put in place to achieve their diversity targets, if any.
Board diversity policy
43% of organizations have fully implemented a formal Board diversity policy covering gender, age, and/or ethnicity. This number has significantly increased from 2015, where 23% of organizations had a fully implemented formal Board diversity policy. The number of organizations with no formal Board diversity policy continues to decrease year over year, suggesting that more organizations are implementing a formal policy.
79% of publicly traded organizations have a fully implemented formal Board diversity policy. The remaining 21% of publicly traded organizations are implementing or considering implementing a formal Board diversity policy. This reflects the requirements in Canada for publicly traded organizations to work towards having a more diverse Board, where various minorities are represented.
Of the 43% of organizations with a formal Board diversity policy in place or being implemented, the most common topic that the policy addresses is gender, followed by ethnicity and age.
Facts and figures within the Canadian Boardroom
5 Average number of Committees
100% Boards with female representation
57% Boards with visible minority representation
36% Boards including non-Canadians
43 years Average age of the youngest director
57 years Average age of Board directors
70 years Average age of the oldest director
5+ years Typical tenure

28© Copyright 2016, Korn Ferry
Gender diversity
All participating organizations have at least one female director on the Board. Out of these organizations, 19% have one female, and 81% have two or more females. This has increased from previous years, where approximately 80% of organizations had at least one female on the Board. The trend is in alignment with the CSA diversity disclosure rule.
One in four organizations have adopted a written policy relating to the identification and nomination of female directors. While this number is still relatively low, it has increased from 2015, where 17% of organizations had this written policy in place.
24% of organizations have a policy relating to the target percentage of female directors on the Board. This has increased from 2015, where 11% of organizations had a target percentage (policy) for female directors on the Board. Of the organizations who reported having a policy relating to the target percentage of female directors on the Board, the target percentage policy ranged from 25% to 50%, with an average of 36%.
In publicly traded organizations, the number grows, with half of organizations having a target percentage policy and half of organizations without a target percentage policy. For those with a target percentage policy who do not currently meet the target, the number of organizations with a deadline to fulfill that policy has increased from 4% in 2015 to 8% in 2016. This number grows for publicly traded organizations, with 29% having a deadline to meet the target percentage of female directors.
Visible minority diversity
Almost three in five organizations have a member of a visible minority on the Board. This number has increased from 2015, by 20%. In addition, 2016 is the first year in which the majority of participating organizations have had a member of a visible minority on the Board, suggesting that Boards are becoming more diverse with visible minority representation. Of the Boards who have a director who is a member of a visible minority, the number of directors who belong to a visible minority ranges from one to six.

29© Copyright 2016, Korn Ferry
Ethnic diversity
One in three organizations have a director who is non-Canadian. This trend remains similar to statistics collected between 2013 and 2015. Of the Boards who have a non-Canadian director, the number of non-Canadian directors ranges from one to six.
Of the Boards who have a non-Canadian director, the most common location in which this director is from is the USA, followed by Europe.
Board recruitment
70% of organizations have a fully implemented formal Board recruitment policy in place, covering practices surrounding Director nomination and election. This number has increased by 18% since 2015. It is likely that some organizations with no formal Board recruitment policy have implemented a formal policy in the past year.
Only 11% of organizations have a formal restriction for the number of Boards on which a director can serve. This trend remains similar from 2014 to 2016.

30© Copyright 2016, Korn Ferry
Effective Board and Committee Operations
This section covers methods used to increase the effectiveness of Board operations via evaluation, education, assessment and succession planning.
Board Committees
Governance, audit and compensation/human resources remain the top three Board sub-committees from 2015 to 2016.
Board meetings
Over the last four years, the frequency of Board meetings (whether live or via teleconference) in the last full fiscal year has significantly increased for 7-10 times, where 50% of organizations hold Board meetings 7-10 times per fiscal year. The frequency of Board meetings has decreased for 0-2 times, 3-6 times and >10 times.
The most common method of distributing Board materials is through an internal or external Board portal, where in 2016, 80% of organizations distribute their materials using this method. This remains the most common method over the past four years. Distributing Board materials through secured email and in-person at Board meetings have seen a downward trend since 2013, suggesting these lower technology methods are becoming less common choices for distribution.

31© Copyright 2016, Korn Ferry
Board performance evaluation
80% of organizations have a formal policy for Board performance evaluation that includes written objectives, processes and reports. This has significantly increased since 2015, where 67% of organizations had a formal policy for Board performance evaluation. When analyzed over a four year trend, 2016 has the largest number of organizations with a formal policy for Board performance evaluation.
From 2013 to 2015, there was an upward trend in Board performance evaluations conducted for the full Board as a whole, reaching a peak of 96% of organizations. In 2016, this number has decreased to 75% of organizations conducting the Board performance evaluation for the full Board as a whole and increased to one in four organizations conducting the Board performance evaluation on an individual basis.

32© Copyright 2016, Korn Ferry
The graph below indicates that publicly traded organizations perform full Board performance evaluations less often than non-publicly traded organizations.
From 2013 to 2016, the most common frequency of Board evaluation continues to be once per year, with at least 80% of organizations reporting this frequency each year, from 2013 to 2016.
In 2016, the most common director performance evaluation methodology was conducting an individual peer-evaluation survey led by the corporate secretary or other in-house personnel. This is followed by conducting an individual peer-evaluation survey led by a third party facilitator. Performing one-on-one evaluations with a designated Board member has had a downward trend from 2013 to 2016, reflecting the complexities and costs of this evaluation methodology.
33© Copyright 2016, Korn Ferry
Notably, in publicly traded organizations, one-on-one evaluations with a designated Board member is the most common evaluation methodology. This suggests that company type could be a strong predictor of the approach Boards take to evaluate their Director’s performance.
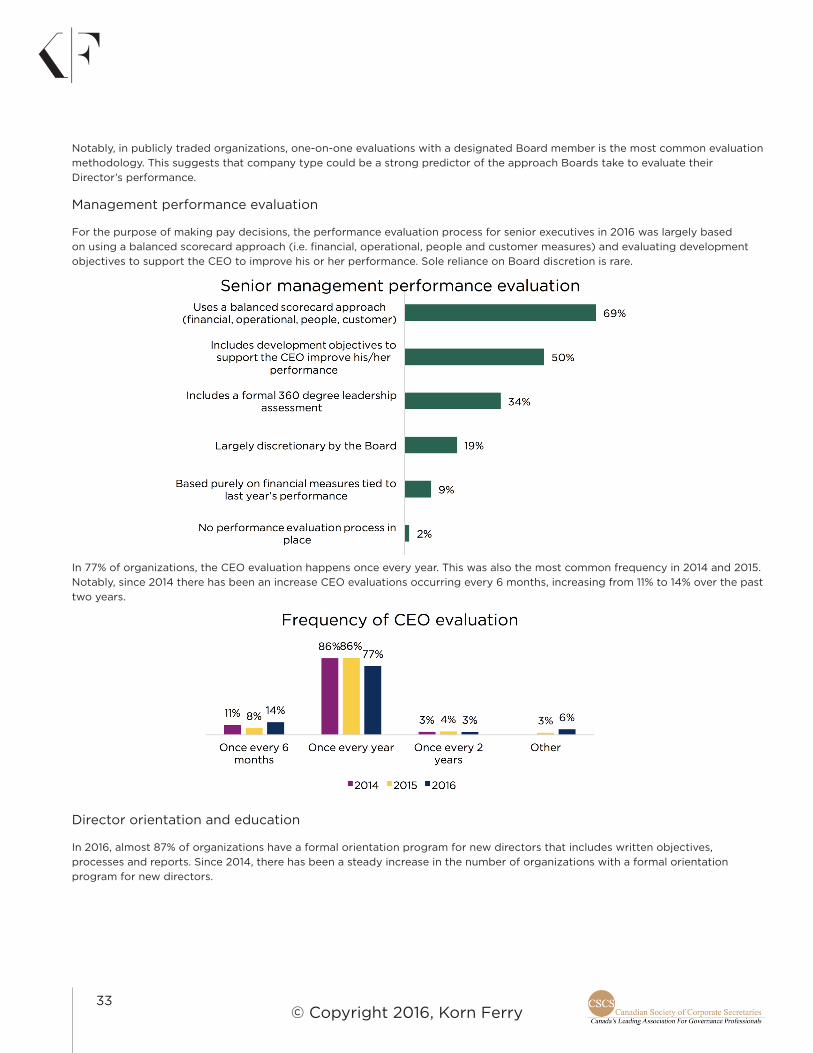
Management performance evaluation
For the purpose of making pay decisions, the performance evaluation process for senior executives in 2016 was largely based on using a balanced scorecard approach (i.e. financial, operational, people and customer measures) and evaluating development objectives to support the CEO to improve his or her performance. Sole reliance on Board discretion is rare.
In 77% of organizations, the CEO evaluation happens once every year. This was also the most common frequency in 2014 and 2015. Notably, since 2014 there has been an increase CEO evaluations occurring every 6 months, increasing from 11% to 14% over the past two years.
Director orientation and education
In 2016, almost 87% of organizations have a formal orientation program for new directors that includes written objectives, processes and reports. Since 2014, there has been a steady increase in the number of organizations with a formal orientation program for new directors.

34© Copyright 2016, Korn Ferry
59% of organizations have a fully implemented formal director education policy characterized by written objectives, processes and reports. This number has significantly increased since 2015, where just 35% of organizations had a formal director education policy in place. Organizations who responded either ‘No, but under consideration’ or ‘No’ has decreased from 54% in 2015 to 37% in 2016. Likely these organizations have implemented a formal director education policy in the last year.
From 2015 to 2016, the same top three methodologies have been used by organizations to educate their Board directors. These methodologies include in-house education by management, outside education by a third party director education program and directors attending sponsored public forums and/or peer group sessions. The least common selection remains in-house education by a third party. Common ‘Other’ responses include facility tours and guest speaker events.

35© Copyright 2016, Korn Ferry
44% of organizations have had over 75% of directors attend education programs over the past year. This number has significantly increased from 2014 and 2015, where just one in four organizations had over 75% of directors attend education programs.
This trend is more obvious when looking at responses in publicly traded versus non-publicly traded organizations. Seven of every ten publicly traded organization who responded to the survey have had over 75% of directors attend director education programs in the last year.
The most common Board education topics that are provided within organizations to new and existing directors include industry specific topics, risk oversight and organization policies.

36© Copyright 2016, Korn Ferry
When this trend is analyzed within publicly traded compared to non-publicly traded organizations, compensation replaces organizational policies as the third most common Board education topic for publicly traded organizations.
CEO succession planning
Today, 50% of organizations have implemented a formal CEO succession planning process, including a policy, written objectives and a report. Since 2013, there has been a significant upward trend in implementing a formal CEO succession planning process. Similarly, there has been a significant downward trend in the number of organizations with no formal CEO succession planning process, where in 2013, one in three organizations did not have a formal CEO succession planning process and in 2016, only one in ten organizations do not have a formal CEO succession planning process.
37© Copyright 2016, Korn Ferry
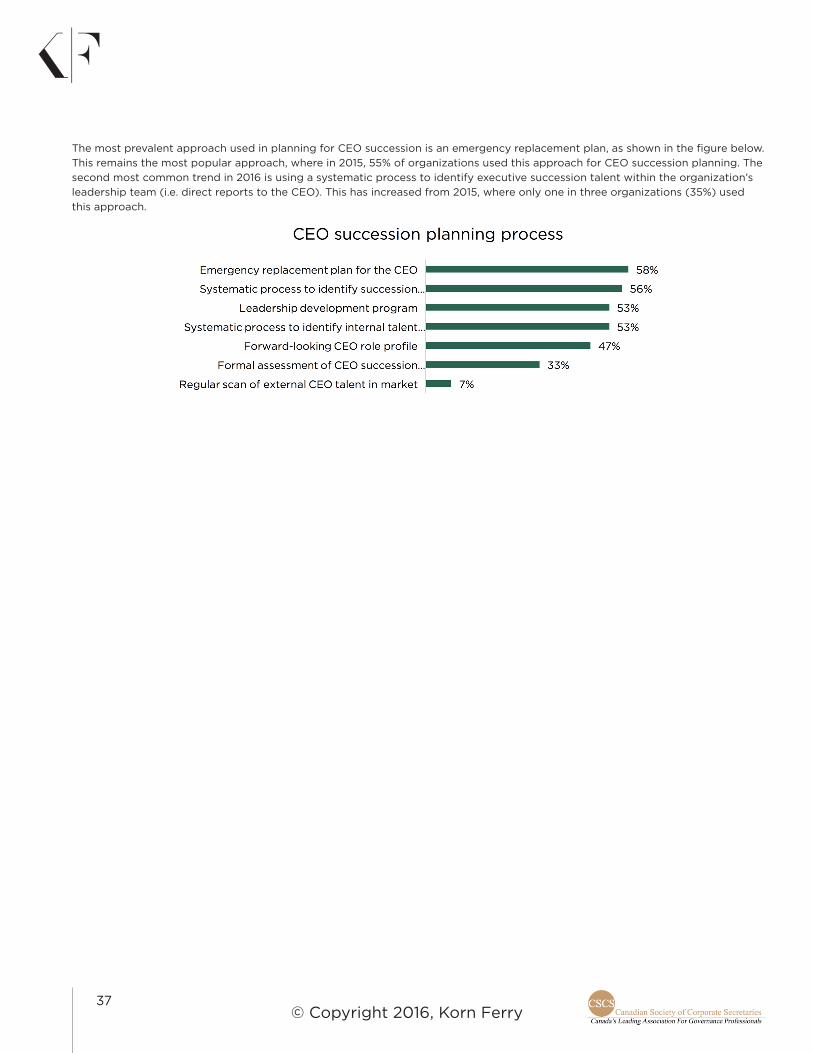
The most prevalent approach used in planning for CEO succession is an emergency replacement plan, as shown in the figure below. This remains the most popular approach, where in 2015, 55% of organizations used this approach for CEO succession planning. The second most common trend in 2016 is using a systematic process to identify executive succession talent within the organization’s leadership team (i.e. direct reports to the CEO). This has increased from 2015, where only one in three organizations (35%) used this approach.

38© Copyright 2016, Korn Ferry
Appendix A
Corporate Governance Best Practices Survey Questionnaire
I. Introduction
The Canadian Society of Corporate Secretaries (CSCS) and Hay Group thank you for taking the time to complete this survey. Your responses will help us in examining the current corporate governance landscape as well as provide insights on the leading practices implemented across organizations.
Additionally, it will serve as a tool in assessing entries in each of the categories for nominations in the CSCS Excellence in Governance Awards program. Winners of the awards will be announced at the CSCS Excellence in Governance Awards Gala at the Arcadian Court in Toronto on November 15th, 2016.
This survey should take about 25-35 minutes of your time. If at any point, you choose to leave the survey, your most recent pages of responses will be automatically saved. To return and view your responses, please click on the survey link on the invite sent to your email address.
Once the survey has closed and the data have been analyzed, all participants will receive the comprehensive ‘2016 Corporate Governance Best Practices Survey’ report, which will be published in August 2016, and complimentary registration to the following ‘2016 Corporate Governance Best Practices Survey’ webinar.
Please note that confidentiality is our priority. This survey is being administered by Hay Group using a survey system provided by a third party, SurveyMonkey. Any information you submit as part of this survey will be collected by SurveyMonkey and processed by Hay Group on behalf of CSCS. Please click here for the Privacy Policy of SurveyMonkey. By continuing with this survey, you consent to the transfer of your information to SurveyMonkey and Hay Group and the related privacy policies. For Hay Group’s privacy policy, please click here. Finally all responses will be submitted directly to Hay Group and no individual participant data will be presented in the report.
If you have any questions about the survey, please contact Abbey Goodine at [email protected].
39© Copyright 2016, Korn Ferry
II. Background
1. Contact Information:
� Name:
� Job Title:
� Company:
� Mailing Address:
� City:
� Province:
� Postal Code:
� Email Address:
� Phone Number:
2. Industry Sector: (Please select among the options)
� Consumer (e.g. FMCG, Retail, Hospitality)
� Financial (e.g. Bank, Investments, Insurance, Private Equity)
� Industrial (e.g. Manufacturing, Energy, Mining, Infrastructure, Utilities)
� Life Science (e.g. Biotech, Pharmaceutical)
� Technology (e.g. Software, Hardware)
� Professional Services (e.g. Legal Services, Accounting Services)
� Broader Public Services (e.g. Government, Not-for-Profit, Transit)
3. Company Type: (Please select among the options)
� Publicly traded
� Privately held
� Not-for-profit
� Crown Corporation
� Other (please specify)
4. Total number of employees: (Please select among the options)
� 0-500
� 501-1000
� 1001- 5,000
� 5,001-10,000
� 10,001-100,000
� Greater than 100,000

40© Copyright 2016, Korn Ferry
III. Corporate Governance Overview
1. In your opinion, what is the most significant corporate governance issue facing your organization right now? (Select up to 3 options that apply)
� Amount of disclosure
� Financial reporting
� Dynamic regulation compliance and its impact on business
� Board diversity
� CEO succession planning
� CEO performance/evaluation
� Executive bench strength and succession
� Independent Board leadership
� Executive compensation
� Shareholder interaction
� Crisis readiness
� Development of conflict management culture
� Risk management and oversight
� Subsidiary governance
� Corporate sustainability
� Cyber risk
� Other (please specify)
� No Issue
2. By level of importance, please rank the top 3 issues for your Board (with 1 being the highest):
� Crisis management / planning
� Developing human capital
� Executive compensation
� Information technology issues
� Regulatory compliance
� Risk management
� Strategic planning
� Succession planning
� Not applicable
3. How do you perceive the impact of corporate governance codes and legislation introduced over the past few years? (Select only one answer)
� Positive
� Negative / Room for improvement
� Neutral

41© Copyright 2016, Korn Ferry
4. Has the increased prevalence of corporate governance legislation resulted in an increased use of third-party consultants? (Select only one answer)
� Yes
� No
� Not applicable
5. How often does your Board review the continued viability of the organization’s strategy? (Select only one answer) (Strategy question #1)
� At every Board meeting
� At least six months
� Once per year
� Every two years
� Other (please specify)

42© Copyright 2016, Korn Ferry
IV. Corporate Sustainability Governance
1. Does your organization have a formal sustainability policy in place? (Select only one answer)
� Yes fully implemented
� Yes, being implemented
� No, but under consideration
� No
2. How often is your corporate sustainability policy reviewed? (Select only one answer)
� At least every six months
� Annually
� Once every two years
� As needed
� Never
� Not applicable
3. Choose the sustainability initiatives that have been implemented in your organization. (Select all that apply)
� Improving energy efficiency
� Cutting emissions or pollutants
� Improving environment around facilities
� Enhancing impact on local communities
� Going paperless in the workplace
� Green standards in product specification
� Other (please specify)
� Not applicable
4. How often does the Board assess management’s performance on sustainability initiatives? (Select only one answer)
� At least every six months
� Annually
� Once every two years
� As needed
� Never
� Not applicable

43© Copyright 2016, Korn Ferry
V. Pay for Performance Governance and Design
1. For the purpose of making pay decisions, how would you best describe the performance evaluation process for senior executives? (Select all that apply)
� Largely discretionary by the Board
� Based purely on financial measures tied to last year’s performance
� Uses a balanced scorecard approach (financial, operational, people, customer)
� Includes a formal 360 degree leadership assessment
� Includes development objectives to support the CEO improve his/her performance
� No performance evaluation process in place
2. How often does the CEO evaluation happen? (Select only one answer) (Strategy question #2)
� Once every 6 months
� Once every year
� Once every 2 years
� As needed
� Others (please specify)
3. Does your organization have a formal CEO succession planning process for leadership continuity; i.e., policy, written objectives and reports? (Select only one answer)
� Yes, fully implemented
� Yes, being implemented
� No, but under consideration
� No
� Not applicable
4. How would you describe your CEO succession planning process? (Select all that apply)
� Emergency replacement plan for the CEO
� Forward-looking CEO role profile aligned to the organization’s strategic direction
� Systematic process to identify internal CEO succession talent bench
� Systematic process to identify executive succession talent (direct reports to CEO)
� Regular scan of external CEO talent in the market/industry
� Formal, comprehensive assessment of CEO succession candidates
� Leadership development program to ensure leadership continuity
� Not applicable

44© Copyright 2016, Korn Ferry
5. When you design your executive pay program, such as an incentive plan, who and what has the most impact on the final design of the program? (Select all that apply and indicate their importance level)
� Organization business strategy
� Stakeholder’s needs
� Regulatory requirements
� Corporate governance codes
� Proxy advisor policy /investor views
� Media/public opinion
� Market practice
� Other (please specify)
6. How often does your organization review its executive compensation policy? (Select only one answer) (Strategy question #3)
� At least every 6 months
� Annually
� Once every 2 years
� Only if there is a specific development requiring to do so
� We have never reviewed our executive compensation policy
7. Which groups have the most impact over your Board’s decision on actual executive compensation, such as payout / grant? (Select all that apply and indicate their importance level)
� Organization business strategy
� Stakeholder’s needs
� Regulatory requirements
� Corporate governance codes
� Proxy advisor policy /investor views
� Media/public opinion
� Market practice
8. Does your organization conduct a pay for performance analysis (after-the-fact) for your CEO/NEOs? (Select all that apply)
� Yes, compared to a performance metric or metrics (e.g. TSR, Earnings Growth)
� Yes, compared to an external peer group
� No
9. If you answered yes to Question 8, who is privileged to the pay for performance analysis report? (Select all that apply)
� Management (internal use)
� Board (internal use)
� Proxy disclosure
� Not applicable

45© Copyright 2016, Korn Ferry
10. Please rate by impact on payout the following performance measures that are linked to your organization’s short term incentives. (Please rate all that apply by indicating No Impact / Little Impact / Some Impact / Large Impact / N/A)
� Financial Goals (e.g. Profit, revenue, cash flow)
� Individual Contribution (e.g. Individual goal achievement, employee satisfaction)
� Operational Goals (e.g. Unit cost control / Productivity)
� Customer Feedback (e.g. Satisfaction, loyalty)
11. If you use long term incentive (e.g. PSU, RSU, Cash LTIP), what factors influence the actual grant size for individual executives? (Select all that apply)
� Grant at target level, no variation (skip to next question)
� Current year’s corporate performance (financial, operational)
� Current year’s individual performance
� Individual retention need
� Not applicable
12. How effective has your executive compensation program been thus far in terms of motivating, retaining and achieving desired performance? (Select only one answer) (Strategy question #4)
� Very effective
� Mostly effective
� Somewhat effective
� Not effective
46© Copyright 2016, Korn Ferry
VI. Enterprise Risk Management Oversight and Governance
1. Does your organization have a formal risk policy in place (i.e. risk governance model, segregated and distinct functional responsibilities for risk management, written goals and reports)? (Select only one answer)
� Yes, fully implemented
� Yes, being implemented
� No, but under consideration
� No
2. Who is primarily accountable for enterprise risk oversight and governance? (Select only one answer)
� Board
� Board + Standing Committee(s)
� Management
3. Other than the full Board, do you have a separate Risk Committee (or equivalent) of the Board primarily responsible for risk oversight and governance? (Select only one answer)
� Yes, ___________Committee (e.g. Safety & Environment Committee)
� No, it is included in the Audit Committee
� No, it is under the full BoardAt the Board / Committee level, what are the accountabilities for risks? (Select all that apply)
� Oversee the risk management infrastructure
� Develop and advise risk strategy
� Develop risk appetite framework
� Monitor risks (e.g. compliance, funding, capital)
� Review risk assessments and evaluate risk exposures
� Coordinates with other standing Committees for risk oversight
� Direct and support management on risks
� Consult external risk experts in different work streams
� Other ______________________
� Not applicable
4. Within the Committee of the Board responsible for risk, other than the industry expert, what percentage of members have the requisite expertise in enterprise risk management? (Select only one answer)
� 5% to 10%
� 11% to 15%
� 16% to 20%
� 21% to 30%
� 31% +

47© Copyright 2016, Korn Ferry
5. What is the overall effectiveness of the Board’s risk oversight process? (Select only one answer)
� Highly effective
� Fairly Effective
� Needs some improvements
� Needs significant improvements
� Not effective at all
6. What are the top three barriers in your risk oversight process? (Select the top three that apply)
� Lack of understanding of risks by Board members
� Lack of understanding of risks by management
� Enterprise risk management is not perceived as valuable or as a priority
� Organization culture is not supportive
� Lack of clarity, definition and agreement about enterprise risk management philosophy
� Gap in risk reporting (e.g. methodologies, data, tracking system)
� Misalignment of risk appetite framework between the Board and management
� Other ____________________
7. Does your organization discuss risk oversight / management in disclosure material? (Select only one answer)
� Yes, in great details
� Yes, in high level only
� No, but under consideration
� No and not planning to disclose
� Not applicable (no disclosure is required)
8. Do you have a risk Committee (or equivalent) at the management level? (Select only one answer)
� Yes, one Committee for the overall enterprise
� Yes, various Committees for different major businesses
� No, but under consideration
� No
9. Is a Chief Risk Officer or an equivalent senior risk officer role present in your organization? (Select only one answer)
� Yes
� No
� Not applicable
10. Does your organization have a defined risk appetite and risk tolerance framework? (Select only one answer)
� Yes, reviewed annually
� Yes, reviewed biennially
� Yes, reviewed as needed
� No

48© Copyright 2016, Korn Ferry
11. Which of the following types of risks are perceived as most critical current to your organization? (Select the top 3 that apply)
� Governance risk
� Compensation risk
� Compliance-related risk
� Operational risk
� Reputational risk
� Strategy risk
� Financial risk
� Financial reporting risk
� People risk
� Cyber / Technological / IT risk
� Environmental risk
� Other (please specify)
� Not applicable How often does the Board/Committee receive the following types of information in the monitoring process? Please select the most appropriate for each type of information.
Information Quarterly Semi-Annual Annual Biennial Ad-hoc Not published
Report on top risks in the enterprise and business units (e.g. CRO report)
Summary of emerging risks and trends
Gap and effectiveness report (identified risks vs. actions on mitigation)
Scenario analysis / stress tests
12. Has your organization implemented a formal whistleblower policy? (Select only one answer)
� Yes
� No
� Not applicable
13. Do you have an employee business conduct and ethics policy in place? (Select only one answer)
� Yes, all employees must sign an agreement
� Yes, but no formal signed agreement by employees
� No, but under consideration
� No
14. Does your organization have a Board-approved crisis management plan and written policy in place? (Select only one answer)
� Yes
� No
� Not applicable

49© Copyright 2016, Korn Ferry
15. Does the Compensation Committee hold a joint meeting with any of the following Committees for handling various common issues? (Select all that apply)
� No joint meeting between Committees
� Yes, Risk Committee (or equivalent)
� Yes, Governance Committee
� Yes, Audit Committee
� Yes, other Committee ___________________
16. Does the Compensation Committee have any joint / overlap membership with any of the following Committees for handling various common issues? (Select all that apply)
� No joint membership between Committees
� Yes, Risk Committee (or equivalent)
� Yes, Governance Committee
� Yes, Audit Committee
� Yes, other Committee ___________________
17. Is the performance metric framework at the business unit (or division) level aligned with that at the enterprise (corporate) level? (Select only one answer)
� Yes, very coherent
� No, based on decentralized approaches
� Not applicable (i.e. no divisions)
18. Is there a threshold financial performance level required, before the incentive payouts are made for other metrics in the short term incentive program? (Select only one answer)
� Yes
� No
� Not applicable (i.e. no incentive plan)
19. Does your short term incentive plan have a stated maximum (cap) payout opportunity for executives? (Select only one answer)
� Yes
� No
� Not applicable (i.e. no incentive plan)
20. How would you best describe your decision-making process for awarding short term incentive to executives? (Select only one answer)
� Entirely based on formula
� Formula for some metrics + qualitative evaluation for other metrics
� Formula for some metrics, qualitative evaluation for other metrics + board discretionary adjustment
� Not applicable (no incentive plan)
50© Copyright 2016, Korn Ferry
21. Do you use deferred compensation or long term incentives (LTI) for executives? (Select only one answer)
� Yes, only one program for all executives in headquarters
� Yes, multiple programs for all executives in headquarters
� No long term incentive program
22. If LTI is used, is the vesting based on future performance, or just paid based on passage of time? (Select only one answer)
� Yes, entirely based on future performance
� Yes, a portion is vested according to future performance and a portion is based on time
� No, entirely based on time
� No long term incentive program
23. Does your organization have a compensation clawback/withhold policy if there are misconducts and/or material errors in financial reporting (e.g. re-statement)? (Select only one answer)
� Yes
� No
� Not applicable
24. If clawback is adopted, which employees are covered? (Select all that apply)
� CEO
� CFO
� Other NEOs (e.g. SVP)
� VPs
� Other employees who have material risk impacts
� Not applicable
25. If clawback is adopted, what is the timeframe for the look back period of compensation? (Select only one answer)
� 1 year
� 2 years
� 3 years
� 4 – 5 years
� Over 5 years
� Not applicable
26. Does your organization have a policy for prohibiting securities hedging? (Select only one answer)
� Yes
� No
� Not applicable
27. Does your organization provide golden parachutes, golden handshakes, or multiple year guaranteed bonuses for executives? (Select only one answer)
� Yes, frequently as part of executive employment contract
� Yes, occasionally when needed
� No, not at all

51© Copyright 2016, Korn Ferry
28. In addition to individual KPIs, are executives in control / oversight functions (e.g. audit, finance, compliance) measured independently of their business areas they oversee? (Select only one answer)
� Yes, all executives are in control/oversight functions are measured on enterprise KPIs
� Yes, a combination of enterprise KPIs and supervised business KPIs
� No, entirely based on supervised business KPIs
52© Copyright 2016, Korn Ferry
VII. Engagement by a Governance Team
1. Which stakeholder groups have interacted with your organization over the past year? (Select all that apply)
� Institutional investors
� Analysts
� Regulators
� Proxy advisory firms
� Media
� Retail shareholders
� Other (please specify)
2. How does your Board interact with shareholders? (Select only one answer)
� Our Board schedules a structured meeting or call with shareholders at least once per year
� Board members will meet with shareholders only if asked
� The Board does not interact directly with shareholders and relies on executives to do so
� Not applicable
3. How many times has your Board participated in communicating substantive issues to various stakeholders such as shareholders, analysts etc. in the past year? (Select only one answer)
� 0-2 times
� 3-6 times
� 7+ times
� Not applicable
4. How effective is your communication with institutional shareholders (electronic filing and voting etc.)? (Select only one answer)
� Very effective, we have zero complaints
� Effective, we get few complaints
� Could be improved, we have considerable complaints
� Significant improvement needed, unmanageable number of complaints
� Not applicable
5. Has the role of the Investor Relations Officer (IRO) become more important due to changing rules and regulations? (Select only one answer)
� Completely Agree
� Neutral
� Completely Disagree
6. Is the Board completely cognizant of the roles and responsibilities of the Investor Relations Officer and does it seek the IRO’s advice on related matters? (Select only one answer)
� Completely Agree
� Neutral
� Completely Disagree

53© Copyright 2016, Korn Ferry
VIII. Boardroom Diversity
1. Does your organization have a formal Board diversity (i.e. gender, age, and ethnicity) policy in place? (Select only one answer)
� Yes, fully implemented
� Yes, being implemented
� No, but under consideration
� No
2. If you answered yes to Question 1, which of the following topics does your organization address in their formal diversity policy? (Select all that apply)
� Gender
� Age
� Ethnicity
� No formal Board diversity policy
3. Does your organization have a formal Board recruitment (nomination and election) policy in place? (Select only one answer)
� Yes, fully implemented
� Yes, being implemented
� No, but under consideration
� No
4. Has your organization adopted a written policy relating to the identification and nomination of women directors? (Select only one answer)
� Yes
� No
5. Do you currently have any women directors in your Board? (Select only one answer)
� Yes: Please indicate number of women directors ______
� No
6. Do you have a target percentage (policy) of women directors in your Board? (Select only one answer)
� Yes: Target % _______
� No, however a policy is currently being developed
� No
7. If target percentage of women is not currently met, do you have a deadline (in years) to fulfill the target percentage? (Select only one answer)
� We already meet the target
� Yes we have set a deadline: Please indicate number of years ___
� No: policy is currently being developed
� No

54© Copyright 2016, Korn Ferry
8. Do you currently have directors who are non-Canadian? (Select only one answer)
� Yes: Please indicate number of non-Canadian directors ______
� No
9. If you answered yes to Question 8, where are they from? (Select all that apply)
� USA
� North or South America (not including USA or Canada)
� Europe
� Asia
� Australia/New Zealand
� Africa
� No non-Canadian directors within our organization
10. Are there members of a visible minority on your Board? (Select only one answer)
� Yes: Please indicate number of visible minorities ______
� No
11. What are the ages of your directors?
� Youngest: Age ______
� Oldest: Age ______
� Average: Age ______
12. Do you have policy of a maximum term for directors? (Select only one answer)
� Yes: Please indicate number of years ____
� No: policy is currently developed
� No
13. What is the typical tenure of your Board members? (Select only one answer)
� Less than 3 years
� 3-5 years
� 5-7 years
� Over 7 years
� Not available
14. Does your organization have formal restrictions for the number of Boards on which a director can serve? (Select only one answer)
� Yes: Please indicate number of Boards _______
� No

55© Copyright 2016, Korn Ferry
15. Please indicate the number of other Boards each of your directors serve on (on average). (Select only one answer)
� 0
� 1
� 2-3
� 4-5
� Over 5

56© Copyright 2016, Korn Ferry
IX. Effective Board and Committee Operations
1. How many Board Committees do you have? Please indicate number of Committees.
2. Please select the topics your Board Committees focus on. (Select all that apply)
� Audit
� Finance
� Compensation / Human Resource
� Nomination
� Governance
� Risk
� Social Responsibility / Sustainability (may include Environment)
� Safety / Health / Reliability (may include Environment)
� Reserve
� Pension
� Investment
� Other
3. What was the frequency of Board meetings (whether live or via teleconference) in the last full fiscal year? (Select only one answer)
� 0-2 times
� 3-6 times
� 7-10 times
� >10 times
4. Please specify how your organization distributes Board materials. (Select all that apply)
� Through mailing of hardcopies
� In-person at Board meetings
� Through secured email
� Through an internal or external Board portal
� Using tablet devices/other wireless communication devices
5. Does your organization have a formal (i.e. written objectives, process and reports) policy for Board performance evaluation? (Select only one answer)
� Yes
� No
6. Is the Board performance evaluation conducted for the full Board as a whole or on an individual basis? (Select only one answer)
� Full Board
� Individual basis
� Not applicable
57© Copyright 2016, Korn Ferry
7. How often does the Board evaluation take place? (Select only one answer)
� Once every 6 months
� Once every year
� Once every 2 years
� Not applicable
8. Have you had a third party agency evaluate the Board’s effectiveness in the last three years? (Select only one answer)
� Yes
� No
9. How are your directors evaluated? (Select only one answer)
� Individual peer-evaluation survey led by corporate secretary or other in-house personnel
� Individual peer-evaluation survey led by a third party facilitator
� One-on-one with a designated Board member
� Others (please specify)
� Not applicable
10. Is there a formal orientation program (i.e. written objectives, process and reports) for new directors? (Select only one answer)
� Yes
� No
11. Does your organization have a formal (i.e. written objectives, process and reports) director education policy? (Select only one answer)
� Yes, fully implemented
� Yes, being implemented
� No, but under consideration
� No
12. What methods are used within your organization to educate Board directors? (Select all that apply)
� In-house (by management)
� In-house (by a third party)
� Outside (3rd party director education programs)
� Sponsored for public forums or peer group sessions attended
� Other (please specify)
� Not applicable
13. What percentage of directors have attended education programs over the past year? (Select only one answer)
� Below 25%
� Between 25% and 50%
� Between 51% and 75%
� Above 75%
58© Copyright 2016, Korn Ferry
14. Have the presence of director education programs resulted in better decision-making in the Boardroom? (Select only one answer)
� Yes
� No
15. Which of the Board education topics are provided by your organization for your new and existing directors? (Select all that apply)
� Industry specific topics
� Insider trading
� Organization policies
� Risk oversight
� Compensation
� Regulatory issues
� Ethics
� Financial and liquidity risk
� Anti-corruption policies
� Market risk
� Political contributions
� Other (please specify)
� Not applicable
16. What changes do your foresee with regard to corporate governance best practices for 2016?
17. Additional comments/input:
We thank you for participating and look forward to your continued support! Please contact Abbey Goodine at [email protected] for further information.


© Korn Ferry 2016. All rights reserved.
About Korn FerryKorn Ferry is the preeminent global people and
organizational advisory firm. We help leaders, organizations, and societies succeed by releasing the full power and potential of people. Our nearly 7,000 colleagues deliver services through our Executive Search, Hay Group, and Futurestep divisions. Visit kornferry.com for more information.