CONFRONTING THE ILLUSION: DEVELOPING A METHOD TO IDENTIFY FOOD MIRAGES AND FOOD DESERTS IN WINNIPEG
Presenter
Presentation Notes
This presentation is a quick overview of our research to show; 1.why we began working on this topic; 2. why we believe it is necessary work; and 3. what the findings tells us about the current state of food security in Winnipeg.
WHY DOES WINNIPEG NEEDS ITS FOOD ENVIRONMENTS MAPPED?
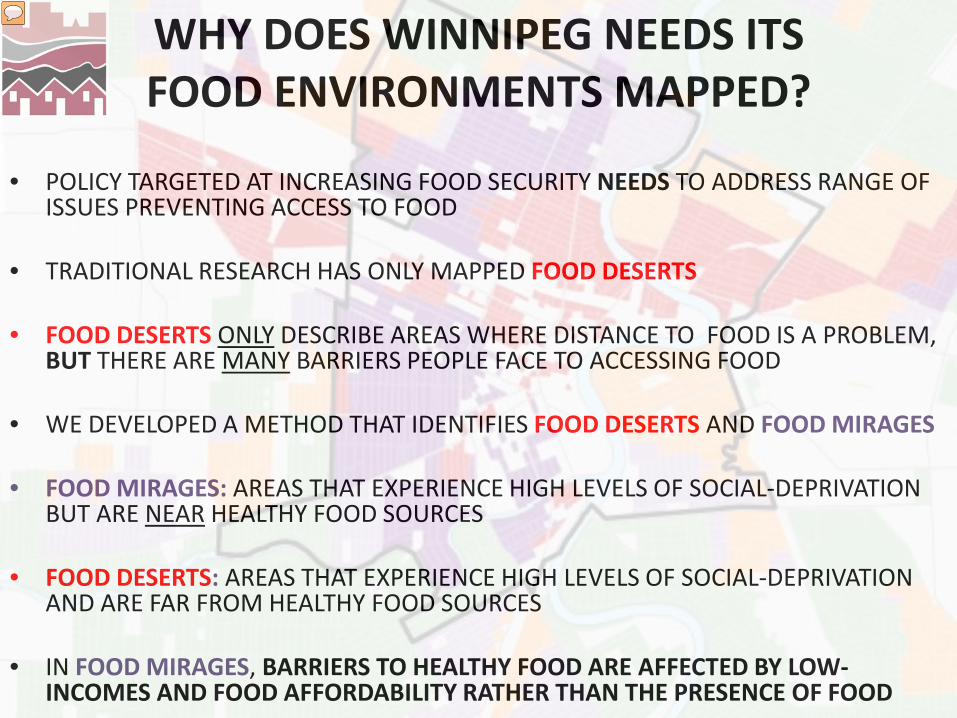
• POLICY TARGETED AT INCREASING FOOD SECURITY NEEDS TO ADDRESS RANGE OF ISSUES PREVENTING ACCESS TO FOOD
• TRADITIONAL RESEARCH HAS ONLY MAPPED FOOD DESERTS • FOOD DESERTS ONLY DESCRIBE AREAS WHERE DISTANCE TO FOOD IS A PROBLEM,
BUT THERE ARE MANY BARRIERS PEOPLE FACE TO ACCESSING FOOD
• WE DEVELOPED A METHOD THAT IDENTIFIES FOOD DESERTS AND FOOD MIRAGES
• FOOD MIRAGES: AREAS THAT EXPERIENCE HIGH LEVELS OF SOCIAL-DEPRIVATION BUT ARE NEAR HEALTHY FOOD SOURCES
• FOOD DESERTS: AREAS THAT EXPERIENCE HIGH LEVELS OF SOCIAL-DEPRIVATION AND ARE FAR FROM HEALTHY FOOD SOURCES
• IN FOOD MIRAGES, BARRIERS TO HEALTHY FOOD ARE AFFECTED BY LOW-INCOMES AND FOOD AFFORDABILITY RATHER THAN THE PRESENCE OF FOOD
Presenter
Presentation Notes
So why does Winnipeg needs its food environments mapped? Policies targeted at increasing food security need to be rooted in the understanding that there are many barriers people face to accessing food Current food mapping research, however, has been primarily concerned with mapping food deserts. Traditionally in Winnipeg and across Canada, identifying food deserts is done by mapping low-income areas that are far away from healthy food sources. The idea being that if you can’t get to healthy food, you can’t eat it. However, What arises from a food desert analysis is an outcome that ONLY portrays low-income individuals who are FAR from healthy food sources as the ones facing difficulties accessing food. Therefore, food deserts alone take on a very singular narrative of describing barriers to food This is problematic since there are MANY barriers people face, and distance, although important, it is ONLY one of them In order to present a more detailed account of the range of issues people face to accessing food, we developed a method that not only identifies food deserts, but also identifies what we refer to as food mirages. Food mirages are areas that experience high levels of social-deprivation but are CLOSE to healthy food sources. These areas have been previously unaccounted for in food desert research because their proximity to food provides the illusion of access. Hence, in food mirages, barriers to healthy food are primarily affected by low-incomes and food affordability, rather than the presence of food in the area. - By classifying and identifying food mirages, our method aims to bring this population into the conversation about food security, and recognize their spatial distribution in the city
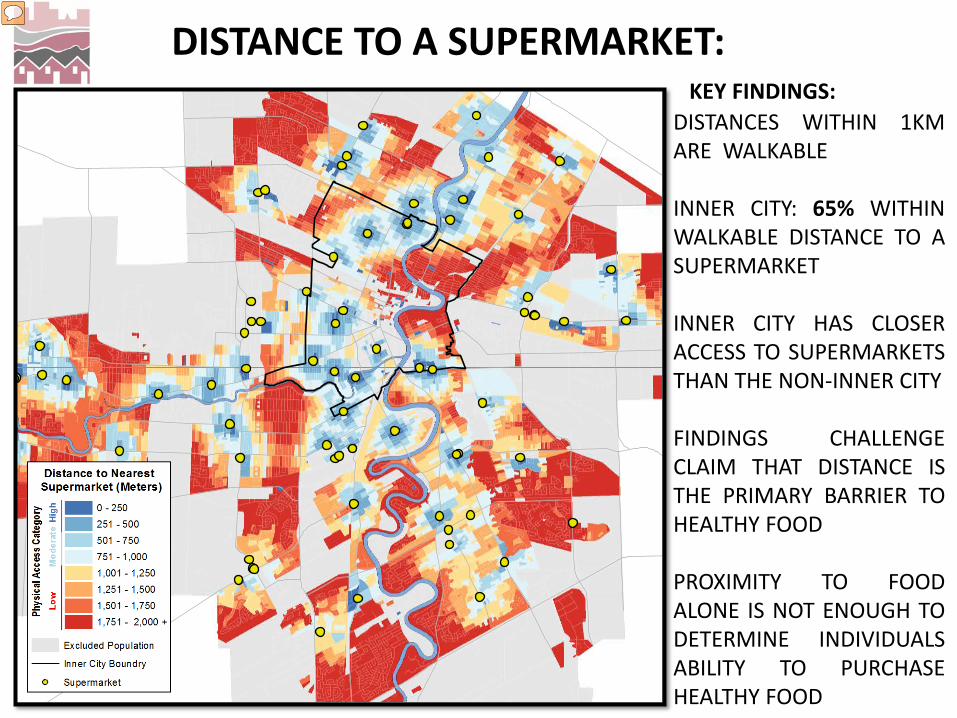
DISTANCE TO A SUPERMARKET: KEY FINDINGS:
DISTANCES WITHIN 1KM ARE WALKABLE INNER CITY: 65% WITHIN WALKABLE DISTANCE TO A SUPERMARKET INNER CITY HAS CLOSER ACCESS TO SUPERMARKETS THAN THE NON-INNER CITY FINDINGS CHALLENGE CLAIM THAT DISTANCE IS THE PRIMARY BARRIER TO HEALTHY FOOD PROXIMITY TO FOOD ALONE IS NOT ENOUGH TO DETERMINE INDIVIDUALS ABILITY TO PURCHASE HEALTHY FOOD
Presenter
Presentation Notes
In order to identify unsupportive food environments, which are either food deserts or food mirages , we began by identifying healthy food sources across the city. We then calculated each areas distance to the nearest supermarket. On the map, the yellow dots are supermarkets. The dark blue areas are within 500 meters of a supermarket, light blue are within 1 km of a supermarket, and the yellow and red areas are beyond 1km of a supermarket. Anything within 1km was considered to be within walkable distance to a supermarket. A network analysis was used to calculate distance. On average the inner city has closer access to supermarkets than the non-inner city. About 65% of the inner city was within walkable distance. This finding challenges the often-touted claim that distance is the primary barrier to healthy food in the inner-city If you look to the periphery of the city, and the more suburban areas, they are unsurprisingly less likely to be within walking distance to a supermarket. However, proximity to a supermarket alone is not substantive enough to determine if an individual is able to purchase healthy food, since different socio-economic groups are able to navigate and overcome spatial barriers differently. - Because of this we included a measure of social deprivation in our analysis
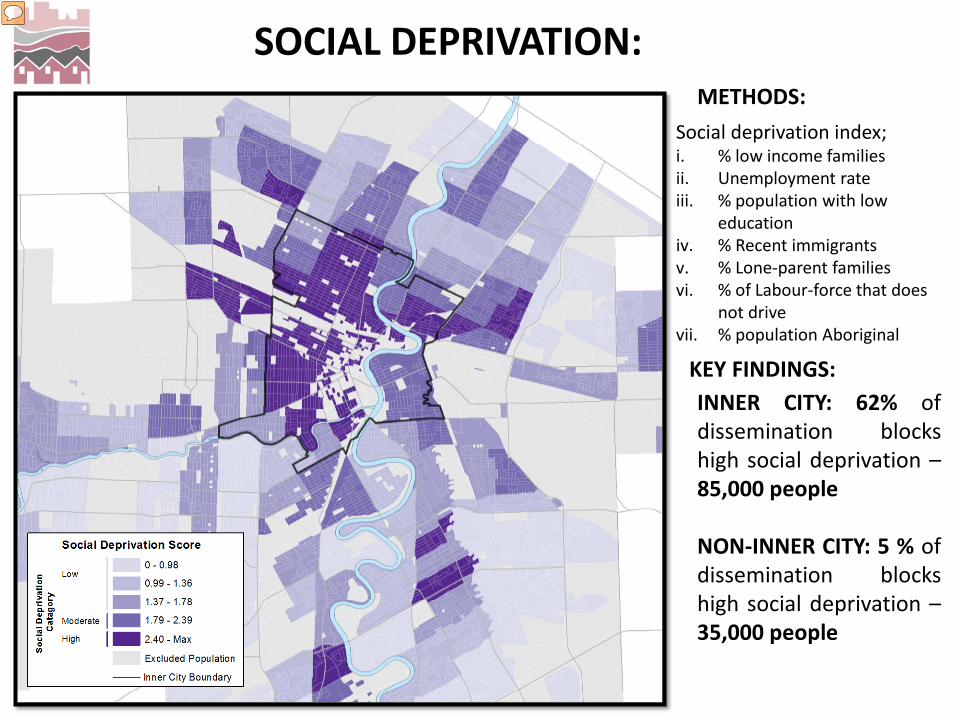
SOCIAL DEPRIVATION: METHODS:
Social deprivation index; i. % low income families ii. Unemployment rate iii. % population with low
education iv. % Recent immigrants v. % Lone-parent families vi. % of Labour-force that does
not drive vii. % population Aboriginal
INNER CITY: 62% of dissemination blocks high social deprivation – 85,000 people NON-INNER CITY: 5 % of dissemination blocks high social deprivation – 35,000 people
KEY FINDINGS:
Presenter
Presentation Notes
To represent social deprivation we developed a social deprivation index, which was based off of seven distinct variables associated with mobility and poverty. The variables included in the index were the; % low income families Unemployment rate % population with low education % Recent immigrants % Lone-parent families % Labor force that does not drive % population that was Aboriginal By using an index we expanded our understanding of social deprivation beyond just income, and acknowledged multiple factors contribute to individuals ability to travel to and purchase healthy food. On the map the darker purple is the most socially deprived areas, and as it is lighter there is les social deprivation. As you see on the map our findings show that the most socially deprived areas are in the Inner city. In total, 62% of dissemination blocks in the inner-city have the highest social deprivation – which accounts for 85,000 people. - However, we also discovered that large pockets of severely socially deprived areas exist outside the inner-city. In total 35,000 people live in these areas outside the inner city.
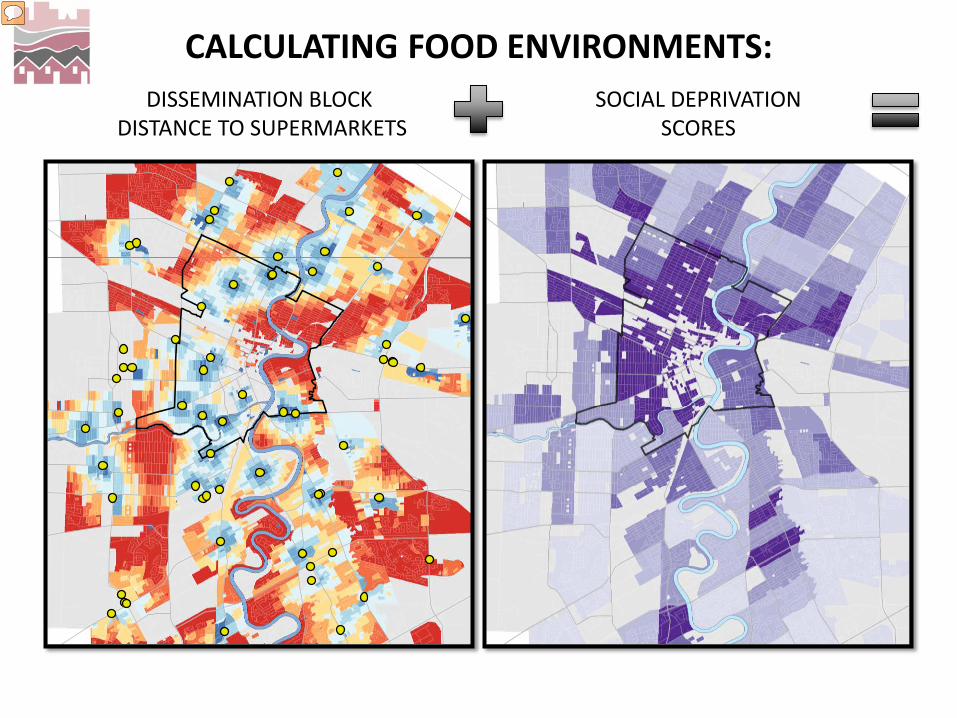
DISSEMINATION BLOCK DISTANCE TO SUPERMARKETS
SOCIAL DEPRIVATION SCORES
CALCULATING FOOD ENVIRONMENTS:
Presenter
Presentation Notes
In order to use distance and social deprivation together to identify food environments, we gave both variables values and linked their scores together. We then identified food environments based off of varied combinations of distance and social deprivation - By combining distance and social deprivation we created food environment categories representing different barriers, and were able to map where they occurred in the city.
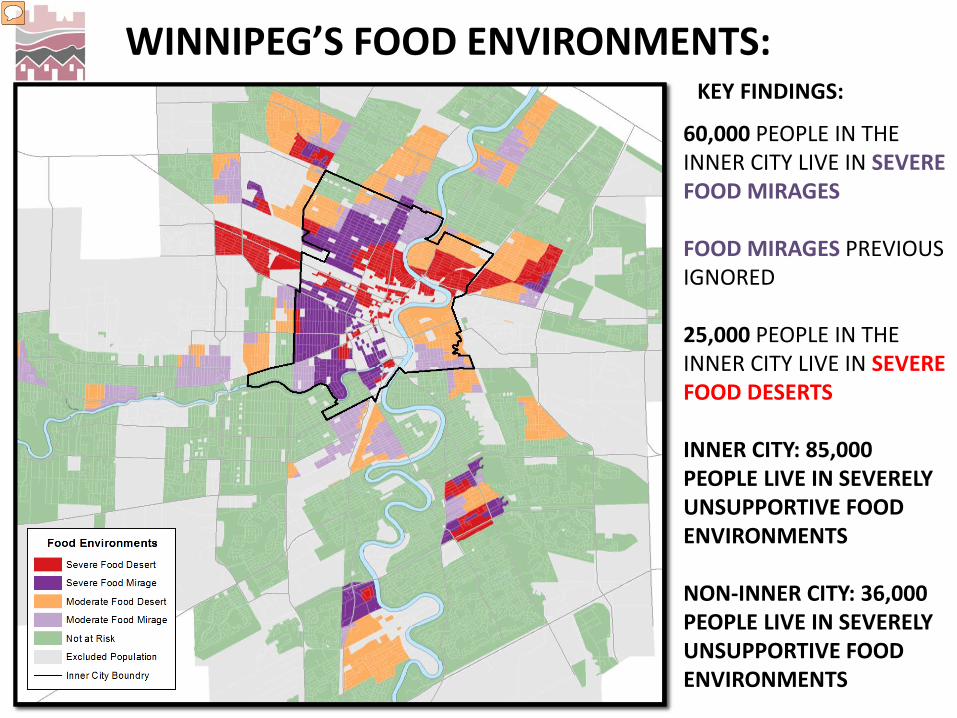
WINNIPEG’S FOOD ENVIRONMENTS: KEY FINDINGS:
• 60,000 PEOPLE IN THE INNER CITY LIVE IN SEVERE FOOD MIRAGES
• FOOD MIRAGES PREVIOUS IGNORED
• 25,000 PEOPLE IN THE INNER CITY LIVE IN SEVERE FOOD DESERTS
• INNER CITY: 85,000 PEOPLE LIVE IN SEVERELY UNSUPPORTIVE FOOD ENVIRONMENTS
• NON-INNER CITY: 36,000 PEOPLE LIVE IN SEVERELY UNSUPPORTIVE FOOD ENVIRONMENTS
Presenter
Presentation Notes
Food Mirages – areas within walking distance to a supermarket where there are high levels of social deprivation. You can see food, but potentially can’t afford the food inside to have a healthy diet (Dark Purple) Food Deserts – areas far from supermarkets where there are high levels of social deprivation. No food around and can’t afford to overcome the barriers to distance. (Dark Red) We were also able to eliminate areas, or label them as ‘no risk environments’, where incomes were high, regardless of distance. The idea being high incomes could overcome barriers to access. We found that 60,000 People in the Inner-City live in Severe Food Mirages – meaning they live near healthy food but lack the resources to buy it. This is important to highlight as this population has been previously ignored in food mapping research, despite the fact that they face significant challenges to food security. We also found that, 25,000 people in the Inner City live in severe food deserts. In total, this means that 85,000 people in the inner city live in severely unsupportive food environments. Furthermore, 36,000 people outside of the inner city live in severely unsupportive food environments. This find highlights the fact that FOOD SECURITY IS A CITY-WIDE ISSUE, NOT JUST ONE THAT PLAGUES THE INNER CITY. It should be noted though that not all individuals living in these areas will experience barriers equally, rather it is a larger characterization of the neighborhood. What is important is that Future policy needs to target the affordability of healthy food and the income of individuals rather than focusing solely on Supermarket locations – (although food deserts also require food sources in them) What we hoped to accomplish with this research was to advance the discussion about food security in the city by developing a method that recognizes there are multiple barriers prohibiting food security for many Winnipeggers, and furthermore, that future policy needs to account for these individuals. The food desert concept alone was unable to achieve this. By using a more comprehensive set of socio-economic variables, our findings show that while distance remains an issue in certain areas, income and affordability present a bigger obstacle to households purchasing healthy food, especially in the inner-city. The Full report is available online at: http://uwinnipeg.ca/ius/docs/reports/2016-06-22-food-security-in-brief.pdf
THANKS TO: Jino Distasio, Scott McCullough, Ryan Shirtliffe, Adrian Werner, Sarah Zell & Richard Shearmur