2016 ccm workshop - europaccm.jrc.ec.europa.eu › documents › workshop2016 › 2016_ccm... ·...
TRANSCRIPT
1 Software Tools
The two presented software tools were RivTool and
TerraHidro. RivTool takes CCM or elsewise connected
hydrographic data as input in csv or txt format and computes
network derivable parameters. The tool is built upon a
Windows NET environment and can be installed as a small
windows application. The current version computes, for
example, the distance between segments, the distance to the
river mouth, the distance to the source, the relative distance and
the total source segments in addition to the already existing
CCM2 attributes.
The tool functions fast and it would be logic to add access to
the tool from the CCM website. The tool was developed to
fulfil requirements for a thesis on migratory fish species and as
such, the main user and developer are interested to enhance the
tool also to a wider community. In addition, more parameters
could be of interest such as the Otto Pfafstetter coding system.
TerraHidro is a tool to compute a hydrological network from a
digital elevation model. The tool is used to compute a network
for the whole world below 60 degrees, the area covered by the
STRM elevation model. A resolution of nominal 30 by 30
meters is available. The TerraHidro team had to resolve the
STRM void issue using their own optimizations. TerraHidro is
a C++ application that can be freely installed on a windows PC.
In TerraHidro also performance issues were addressed
making the tools suited to iterate over various DTM’s quickly.
The presentation compared an analysis of TerraHidro based
on SRTM 30 and 90 meter with CCM (on SRTM 90). The
TerraHidro displayed correct results but in the plains, CCM
was better due to its feature to follow ancillary data, if provided.
TerraHidro further has a feature called ‘HAND’, which can be
used to quickly, identify areas prone to flooding. The various
results on South America and Africa are complementary to
CCM and of great interest for the Hydrologic community.
2 Applications
An application to use CCM and ECRINS in Macedonia was
displayed. Apart from some confusion on which dataset to take,
CCM could cater for various map requests especially for
making people in Macedonia aware on the possibilities and
value of such a system. Subsequently a project was started to
generate a higher resolution catchments system since a high
resolution DEM of the country was available to the project.
This project resulted is maps that were problematic on the
country border, especially for a catchment that exits the country
and re-enters further downstream. The project made a strong
request for a higher quality or higher resolution version of
CCM especially for the cross-border areas.
The next application was less affected by operational errors,
in an application describing the hydrology of Romania.
Overview maps of the country were displayed, giving insight
in ecologically vulnerable regions. In addition, a poster with the
results of a characterization of the climate in Bulgaria was
displaying that at country level CCM can give adequate insight
in the ecological characterization.
The last presentation described catchments and river
segments in Turkey and notified significant errors in the border
region with west Syria. The errors were significant; a river went
into a wrong valley and made it more difficult for the project to
create credibility for the displayed data. The Turkish presenters
in analogy to the Macedonian presenter are in a consistent need
of an improved version of CCM even at the same resolution of
100 meters. For the Romanian presenter a more enriched CCM
would be beneficial.
Findings of the CCM pre-conference workshop at AGILE Helsinki 2016
Alfred de Jager
Joint Research Centre
Via Fermi
Ispra, Italy
Abstract
During the workshop, five presentations demonstrated software to process structured hydrographic data and to create updates of CCM.
Three other presentations and a poster discussed use cases of CCM in which catchments where characterized in order to gain more insight in hydrological planning processes. The presentations covering parts of Macedonia and parts of Turkey revealed interesting errors in the dataset.
The discussion that followed the presentations addressed mainly the importance of CCM and how a better version could be made in the near future. Important aspects are to create an internet community to process the new data as well as the availability of new, higher detailed data,
such as SRTM of 30 meters.
.
AGILE 2016 – Helsinki, June 14-17, 2016
2.1 Storing more derived data
The RivTool application and the three end user applications
clearly showed a need to make CCM data intersection results
more readily available. Some data are already available in
CCM, but a new version of CORINE Land cover and various
climate assessments and meteorological data would be of great
use if made directly available at the primary catchment and
river segment level. In addition, also a platform where users
could upload their own results would be appreciated to enhance
the discussion and debate on hydrologic issues. To avoid the
download of too many and unrelated attributes it was suggested
to define groups of data.
In addition to this issue, also a mention of an improved
description of the existing attributes in the CCM geodatabase
could be of use. Some terms are not directly clear due to
abbreviations and the articles that describe them might be too
long and cumbersome to go through for a simple application.
.
2.2 Errors in Macedonia and Turkey
The errors in Macedonia and Turkey can be explained by the
fact that the CCM team in 2005 had no experts in those areas.
In addition, reference data, taken from submissions of the
Water Framework directive, were not available. CCM used
three additional reference data sets in conjunction with the
SRTM 90 meter elevation model. The first one is an image with
the number of contributing pixels in order to start surface flow.
This dataset is made using soil and land cover maps and can be
enhanced if better data is available for example in karstic
regions. The second one is a map containing the rivers and
canalized rivers to follow in areas were the drainage is not
following the lowest point. Such areas can be found especially
in lowlands or in narrow valleys and close to reservoirs. This
map also contains the lakes, in which CCM computed a
centreline to be used as reference to connect the various rivers
that flow into a lake.
The third map is a map containing the so-called pits, which
are the endorheic reservoirs such as Lake Trasimeno, Lake Tuz
and the Dead Sea. If these maps can be made with more detail
for the accession countries CCM could be rerun and improved
for such specific processing windows.
.
2.3 Next Steps
The workshop and the usage statistics of CCM demonstrate a
stable interest for CCM like data for applications regarding
flood control, ecological assessments, impact of dams and
fauna protection. In the nearby future, in which the pressure on
the hydrologic environment is expected to grow due to climate-
change, economic and population pressure, the interest in CCM
like products will increase as well. In addition, easier the access
to GIS systems will create an increasing demand for high
quality and topological intelligent data. Open Data initiatives
such as Open StreetMap are not addressing hydrological
challenges. However, such initiatives could provide
information on dams, rivers, ponds and lakes at very high detail
thanks to direct contribution of the users living in a specific
area.
Since an improvement of CCM requires detailed local
hydrological knowledge, it would make sense to create an
internet community improving in controlled steps the model
output by allowing users to adjust the input layers in order to
make a new run of the model for a selected hydrological region.
Table 1: CCM input layers.
Source Current
Resolution
Improvement
Digital Elevation
Model
100 m 30 m National
DEMS
# Contributing
Pixel
Divers,
Soil
maps
Local
Knowledge
Soil
Texture
maps
Reference Rivers 1:25.000
WFD
countries
in 2005,
Image
2000 data
Open
Street map
Official
Topo
maps
Reference Lakes 25 m
Only
Image
2000 area
Open
Street map
Water
surface
detection
Pits 100 m
In table 1, the five input layers for CCM as shortly listed. In
order to make a system better than just classical GIS generated
drainage systems from a DEM, a tool should be developed to
accommodate such functionality. TerraHidro might be such a
tool although at this moment TerraHidro only takes the #
Contribution Pixels as correction factor, which is then applied
to the entire watershed. The tool therefore has to be adapted to
take into account the other four input layers and in addition a
web tool could be developed, allowing users to upload
corrected data for the 5 input layers. In this case, the user
submits the five new layers, runs the software and checks
whether the new output is an improvement to be uploaded to
the full system.
This web platform can be started with an effort to make the
CCM website more interactive and to adapt TerraHidro to
additional input layers.
In addition the CCM website can be enriched with more map
examples of what can be done with CCM, for example with
links to projects using the data and with facilities to download
topological derivable attributes and intersected attributes from
valuable scientific databases. Crucial to recomputing CCM is
to adapt TerraHidro or a similar tool since the software used to
build CCM in 2005 is outdated (partly build on LISP and
AML).
The request for delivering more derived attributes and
intersected attributes can be fulfilled in a shorter time span
since no new software development is needed. The participants
from the CCM workshop could give hints to which data to
intersect whilst the RivTool software could be used to generate
(and store) more derivable data.

AGILE 2016 – Helsinki, June 14-17, 2016
Figure 1: Example of topological derived attributes, Strahler
order.
2.4 Short term Action Points
As a follow-up of the workshop the following short-term
actions have been proposed:
• Creation of a Google User group to enable short
discussions with colleagues on the net.
• Locations and descriptions of errors in CCM2 could be
geotagged on a simple MapViewer
• Introduction of links to TerraHidro and RivTool on the
CCM web site and other projects that relate to CCM.
• Further developing TerraHidro using # contributing
pixels test data in tiff image format. After such adaption,
studying in how far also the three other CCM reference
data sets can be integrated in the TerraHidro algorithm.
• Addition of Otto Pfaffstetter coding to RivTool by
integrating the respective JRC software library.
2.5 Participants to the Workshop
The following participants contributed with presentations and
short articles to the workshop:
• Duarte Gonçalo, Oliveira Tiago, University of Lisbon,
Forest Research Centre, Lisbon (PT),
• de Freitas Oliveira João Ricardo, National Institute for
Space Research INPE, São Jose dos Campos (BR)
• Baudry François, Rhine-Meuse Water Agency, Metz
(FR),
• Bodescu Florian, Romanian Space Agency, Bucharest
(RO),
• Gül Ali, Dokuz Eylul University, Izmir (TR).
The short papers are bundled in this set of articles, with the two
software package descriptions first, and followed by the three
applications.
Notabene, during the AGILE conference a presentation was
given of CyberGIS (Wang) in which hydrologists of the United
States collaborate for generating stream and watershed models
for the territories of their country.

AGILE 2016 – Helsinki, June 14-17, 2016
1 Framework
Covering only 0.8% of the Earth’s surface and representing
merely 0.01% of the world’s water, fresh water supports almost
6% of all known species [1]. Because they provide valuable
ecosystems services, inland waters and their biodiversity are
crucial natural resources for Humankind [1]. Even considering
the ongoing biodiversity crisis [2, 3] freshwater ecosystems are
amongst the most endangered environments worldwide [1, 4].
These environments have been deteriorating [5], suffering
population declines and biodiversity loss [1], mainly as the
result of threats and stressors such as resources
overexploitation, land-use changes, pollution, water
abstraction, loss of longitudinal connectivity, habitat
destruction and degradation, climate change and invasive
species [1, 5, 6]. Most of these threats are anthropogenic in
nature, meaning that they will not cease or decrease in the near
future. Because many of these threats are acting at a global
scale, there is an urgent need to develop and standardize tools
that deal with large trans-national river network databases. This
River Network Toolkit (RivTool) – A new software for river networks
Gonçalo Duarte
University of Lisbon/School
of Agriculture – Forest
Research Centre
Tapada da Ajuda, 1349-017
Lisbon, Portugal
Tiago Oliveira
Lisbon,
Portugal
Pedro Segurado
University of
Lisbon/School of Agriculture
– Forest Research Centre
Tapada da Ajuda, 1349-017
Lisbon, Portugal
Paulo Branco
University of
Lisbon/School of
Agriculture – Forest
Research Centre
Tapada da Ajuda,
1349-017
Lisbon, Portugal
Gertrud Haidvogl
Institute of Hydrobiology
and Aquatic Ecosystem
Management, University of
Natural Resources and Life
Sciences Vienna (BOKU)
Didier Pont
National
Research Institute
of Sciences and
Technology for
Environment and
Agriculture
(IRSTEA)
Maria Teresa Ferreira
University of
Lisbon/School of Agriculture
– Forest Research Centre
Tapada da Ajuda, 1349-017
Lisbon, Portugal
Abstract
Studying freshwater environments at broad spatial scales using detailed river network information is a challenging task. Acquiring and relating biological, environmental, hydraulic and hydrological data along a river and then perform calculations taking into consideration the network
nature of such systems is difficult and computationally complex.
Here we present an innovative software, the River Network Toolkit, which has the ability to use different types of data linked to a river
network to obtain information about the river network basic features and generate new variables by conducting complex computations that
take into account topological relationships among river segments. Though its use is not restricted to a specific network, it was implemented
and tested using the version 2.1 of the River and Catchment Database from the Catchment Characterisation and Modelling (CCM2). Besides
specific functions (e.g., stream power, relative distance) and functions to obtain variables from the topological nature of the river network
(e.g., source ID, sub-basin ID, mouth ID), the program allows calculations to be performed for a group or for all segments of one or several
river networks, in 2 directions (upstream and downstream), in 2 different ways (path and relatives) and using any variable that has been uploaded. The output tables can be visualized in the program and/or exported into one or several .csv files that can easily be imported to a
GIS environment.
This software has the advantage of grouping a comprehensive set of functions, while adding specific functionalities and giving the possibility
of creating personalised calculations. It is able to work with large datasets, such as the CCM2 dataset (1.4 million plus segments), and
nevertheless have a swift performance (e.g., it calculates the distance to the river source in 3 seconds and the upstream drainage area in less
than 3 minutes for all the CCM2 dataset segments). This software not only facilitates the spatial characterisation of a river network but also allows the computation of variables taking into
consideration the network nature of the river. Regardless of the extension and/or complexity of a freshwater network system, the River
Network Toolkit is a useful tool that enhances the use of environmental (e.g., climate, land-use), hydraulic and hydrologic information.

AGILE 2016 – Helsinki, June 14-17, 2016
is a crucial step to generate new knowledge on large-scale
patterns and processes in rivers.
Ward [7] has conceptualised the dynamic and hierarchical
nature of river systems in a four-dimensional framework.
Linkages and interactions in the upstream-downstream
direction establish the longitudinal dimension [7, 8]. The lateral
dimension is constituted by the exchanges of matter and energy
between the channel and the riparian/floodplain system [7].
Interactions between the channel and contiguous groundwater
are considered the third (vertical) dimension and, the fourth
dimension is the temporal scale, i.e., the overlaying of a
temporal hierarchy on the other three dimensions [7]. This
conceptualisation provides a synthetic framework for lotic
ecology that may be helpful to understand the dynamics of river
ecosystems and better comprehend the anthropogenic effects
on these pathways [7]. Rivers are also functions of other
attributes (e.g., geology, vegetation, land cover, human
activities, etc.); the effects of these features can be linked to
hierarchical spatial units (basin, sub-basin, river segment) that
characterise freshwater systems.
Successful river management requires an understanding of
processes that operate at different spatial and temporal scales,
while also comprehending the spatial and hierarchical
relationships between land and water [9, 10]. International
cooperation is an additional requirement for a correct
management of large-scale resources [11]. This is particularly
relevant for freshwater international basins. Dudgeon,
Arthington [1] state that in many parts of the globe inventories
of freshwater biodiversity are incomplete. Thus, cooperation
and international efforts are required to suppress this lack of
knowledge. Conscious of these challenges, the European
Commission’s Joint Research Centre (JRC) has developed a
River and Catchment Database for Europe (CCM – Catchment
Characterisation and Modelling). This is the first all-inclusive
database of river networks and catchments available for the
pan-European continent that is hierarchically structured and a
fully integrated system [10]. The hierarchical structure from
segment drainage catchment to large river basins, along with
the link between river and drained area enables numerous
research possibilities at a variety of scales and independently of
political or administrative boundaries [10]. Considering it was
developed to fulfil the requirements of European institutions
but also of the scientific community, this unique database is
pivotal for modelling activities, studying freshwater
environmental processes, analysis of environmental impacts of
different policy scenarios, development of environmental
indicators and analysis of pressures and impacts [10].
Moreover, CCM data ranges from the Mediterranean –
including Turkey – to the north of Scandinavia, from the Urals
to the Atlantic – large and small islands included –, thus
complying with the spatial requirements of the Environmental
European Agency (EEA), which are wider than those of the
European Union (EU) [10].
2 The River Network toolkit
In freshwater ecological research, connecting and integrating
a hierarchically structured river database with environmental or
landscape data may help to predict and comprehend the effects
of threats and stressors on freshwater ecosystems. Adding to
this, studies often require obtaining data along a river network
taking into consideration precisely its network nature, e.g.,
upstream drainage area [12], relative distance to mouth [13,
14], cumulative length [15], upstream and downstream average
slope [16] and Stream Power [17, 18]. This type of information
is not mathematically complex to obtain but can be time-
consuming when working at a national or continental scale and
using small resolution units. General-purpose geographic
information systems (GIS) software and related river network
toolsets contain some tools to cope with these necessities.
Nevertheless, these applications have limitations: most are
focused on creating river networks based on digital elevation
models, delineate and characterise watersheds, topologically
manage and improve a river network and assigning key
identifiers and attributes to a hierarchical river network. If
one’s objective is to preform calculations considering routes or
flow directions of freshwater networks connected to
environmental data, then most of these applications are either
useless or very limited. These type of calculations fall within
the field of network analysis, and though some programs have
specific modules or toolsets for this purpose, they are inevitable
more orientated to solve problems for the transport industry.
Here we present a novel software, the River Network Toolkit
that integrates river networks and environmental data.
Designed to be a straightforward and user-friendly application,
it facilitates: (1) obtaining information that characterises the
network based only on its topographic nature; and (2) by
linking environmental data to freshwater networks, acquiring
new data through mathematical calculations that account for
the hierarchical nature of these systems. This program is table-
driven and was developed to work with two distinct basic units:
segment and sub-basin. The output tables can be exported and
used in other software (e.g., geographical Information systems,
statistical software).
After opening the application, the first window (Figure 1)
deals with choosing the river network map file, allowing the
user to search for one in the program’s libraries or create it from
a file to be provided by the user. The network map is the pivot
file for RivTool thus, if users intend to use a specific freshwater
network, they should create an adequate csv file to characterise
their network (please check the templates information in the
RivTool Manual for more details). With this file the program
creates a network map. Also in the first window, the user can
optionally link environmental data to the selected network.
Again, libraries with environmental data or a user’s custom file
(check templates information for more details) can be added.
The second window (Figure 1) allows the user to choose the
calculations to be performed. These are divided into
Topological (e.g., Main River, Source ID, Distance between
Segments), Mathematical (e.g., Average, Sum, Range) and
Conditional (e.g., Conditional sub-basin, Sum if). For some of
the operations of the Mathematical and Conditional
calculations the user will be able to choose the Direction,
upstream or downstream, and the Mode, path or parents (check
the RivTool manual for more detailed information). Finally, the
third window (Figure 1) will show the results of the chosen
calculations.

AGILE 2016 – Helsinki, June 14-17, 2016
2.1 Why is Rivtool relevant?
Research about freshwater systems will inevitably have to
link basin information with biotic data. Considering that
freshwater systems are amongst the most threatened
ecosystems [1, 4], obtaining detailed and accurate information
about rivers is essential [10]. The river continuum concept [7,
8] shows that inputs in headwaters affect all downstream river
segments. Conversely, from an anadromous species point of
view, inputs in river reaches closer to the mouth may affect
these animals as they navigate upstream. The River Network
Toolkit is a software that integrates river network information
and environmental data. Depending on provided files the user
has the possibility of obtaining information to characterise the
river network based solely on its topological features or
perform a network analysis that uses network and
environmental data (e.g., for a given segment a user can
calculate the maximum channel slope towards the mouth or
compute the average temperature associated with the upstream
drainage area).
2.2 Rivtool advantages
It is obvious that other software, such as GIS orientated
applications, have a plethora of other functions relevant for
researchers working with freshwater networks and water
resources. Nonetheless, RivTool provides unique features to
take full advantage of hierarchical river networks, such as a set
of comprehensive specific designed functions for calculations
in river network analysis. Able to deal with large datasets while
maintaining fast computations (e.g., calculating upstream
drainage basin for 1.4 million segments takes less than 30
seconds), it is significantly faster than common GIS
applications since it only uses tables to compute functions. This
characteristic encompasses another attribute that adequately
used can be advantageous: there are no topological restrictions
or issues when performing a network calculation.
Contrastingly, some general-purpose GIS programs, although
allowing the user to perform network analysis, the network has
to be completely free of topological errors. For example, when
Figure 1 – Snapshots of the River Network Toolkit interface. From top to bottom: first, second and third window.
AGILE 2016 – Helsinki, June 14-17, 2016
trying to perform a network analysis of the Volga basin (164
506 segments), having just one segment that is not integrally
connected to the next closest segment is a problem that
artificially introduces an inexistent disconnectivity. Initially
implemented to be used only with the CCM database, it has
now a universal applicability because it allows a user to
introduce a custom network. Moreover, besides networks that
have segments as the unit of resolution, it is possible to use a
network of sub-basins. Finally, it is a user-friendly software
with a straightforward implementation that also provides some
ready-to-use libraries with processed environmental data (e.g.,
climate data) and river network maps.
3 Final Remarks
RivTool is a unique software that uses the connection
between drainage basins and river segments provided by a river
network and integrates it with environmental data. It gives
users the possibility of calculating new information via network
analysis. This application has numerous advantages (Error!
Reference source not found.) and, when compared with
network analysis modules of general-purpose GIS programs,
tends to be more efficient. This freshwater related software can
be a powerful tool for researchers, policymakers and
environmental assessment companies.
Figure 2 – Advantages of the River Network Toolkit
References
1. Dudgeon, D., et al., Freshwater biodiversity: importance,
threats, status and conservation challenges. Biological
Reviews, 2006. 81(2): p. 163-182.
2. Hoekstra, J.M., et al., Confronting a biome crisis: global
disparities of habitat loss and protection. Ecology Letters,
2005. 8(1): p. 23-29.
3. Chapin III, F.S., et al., Consequences of changing
biodiversity. Nature, 2000. 405 (6783): p. 234-242.
4. Ricciardi, A. and J.B. Rasmussen, Extinction Rates of
North American Freshwater Fauna. Conservation
Biology, 1999. 13(5): p. 1220-1222.
5. Nel, J.L., et al., Progress and challenges in freshwater
conservation planning. Aquatic Conservation: Marine and
Freshwater Ecosystems, 2009. 19(4): p. 474-485.
6. Sala, O.E., Global Biodiversity Scenarios for the Year
2100. Science, 2000. 287 (5459): p. 1770-1774.
7. Ward, J.V., The Four-Dimensional Nature of Lotic
Ecosystems. The North American Benthological Society,
1989. 8(1): p. 2-8.
8. Vannote, R.L., et al., The River Continuum Concept.
Canadian Journal of Fisheries and Aquatic Sciences,
1980. 37(1): p. 130-137.
9. Johnson, B.L., W.B. Richardson, and T.J. Naimo, Past,
Present, and Future Concepts in Large River Ecology:
How rivers function and how human activities influence
river processes. BioScience, 1995. 45(3): p. 134-141.
10. Vogt, J., et al., A pan-European River and Catchment
Database. 2007, European Commission - Joint Research
Centre - Institute for Environment and Sustainability:
Luxembourg. p. 120.
11. Ostrom, E., Revisiting the Commons: Local Lessons,
Global Challenges. Science, 1999. 284 (5412): p. 278-
282.
12. Filipe, A.F., et al., Forecasting fish distribution along
stream networks: brown trout (Salmo trutta) in Europe.
Diversity and Distributions, 2013. 19(8): p. 1059-1071.
13. Clavero, M. and V. Hermoso, Historical data to plan the
recovery of the European eel. Journal of Applied Ecology,
2015. 52(4): p. 960-968.
14. Imbert, H., et al., Evaluation of relative distance as new
descriptor of yellow European eel spatial distribution.
Ecology of Freshwater Fish, 2008. 17(4): p. 520-527.
15. Markovic, D., J. Freyhof, and C. Wolter, Where Are All
the Fish: Potential of Biogeographical Maps to Project
Current and Future Distribution Patterns of Freshwater
Species. PLoS ONE, 2012. 7(7): p. e40530.
16. Leathwick, J.R., et al., Using multivariate adaptive
regression splines to predict the distributions of New
Zealand's freshwater diadromous fish. Freshwater
Biology, 2005. 50 (12): p. 2034-2052.
17. Béguer, M., L. Beaulaton, and E. Rochard, Distribution
and richness of diadromous fish assemblages in Western
Europe: large-scale explanatory factors. Ecology of
Freshwater Fish, 2007. 16(2): p. 221-237.
18. Logez, M., P. Bady, and D. Pont, Modelling the habitat
requirement of riverine fish species at the European scale:
sensitivity to temperature and precipitation and associated
uncertainty. Ecology of Freshwater Fish, 2012. 21(2): p.
266-282.
Advantages:
• Takes full advantage of a river network
database like the CCM
• Enables a straightforward linkage between
environmental and a river network data
• Extensive set of functions, all in one program
• Functions can use both network and
environmental data
• No topological restrictions as it is database
driven
• Fast performance even with large datasets
• Universal applicability
• Works with segment or sub-basin as a basic
analysis unit
• A set of ready-to-use libraries
• Easy & simple to use with straightforward
implementation

AGILE 2016 – Helsinki, June 14-17, 2016
1 Introduction
Digital elevation model (DEM) is useful and important. It is
used in several applications such as slope calculation for
landslide occurrences, flood alerts, drainage network and
watershed delimitation, hydrological models, agricultural
studies, protected geographical areas, among others. High-
resolution altimetry data sets are expensive.
This data is obtained only for small regions. In countries like
Brazil, with continental dimensions, it is time consuming to
analyse large areas using high-resolution data sets. The
common solution is to use the datasets available as SRTM [1]
with horizontal resolution of 90 meters (SRTM-90) and 30
meters (SRTM-30), and Aster GDEM [2] with 30-meter
resolution. These data sets are freely available for the entire
Earth surface for latitudes lower than 60o.
The main limitation of using these data is that in a dense
forest they represent the tree canopy surface, and not the terrain
surface. If in a satellite collected image a forest parcel was cut,
the altimetry values on the parcel are different from those in its
neighbourhood, leading to some errors in the extracted
drainage.
Another problem related to Aster GDEM data set images of
different dates used for composing the stereoscopy mosaic, is
that they do not usually have the same spectral response.
SRTM data set presents another problem: large aquatic areas,
such as large rivers and lakes are represented by flat levels. Flat
areas must be properly treated to assure a correct water flow
path determination.
The SRTM-30 data was recently made available, but it does
not have valid values at all grid positions. These positions,
called voids, are marked with the value -32767, and it must be
substituted by some estimated altimetry data. TerraHidro
system [3], which is a software system for hydrological studies,
was employed to perform this task. A linear interpolator was
implemented in TerraHidro: it uses the four nearest values from
the void position taken from a lower resolution grid of the same
area, usually an SRTM-90 data grid.
This work shows qualitatively the precision of drainages
extracted by the TerraHidro system, using SRTM-90 and
SRTM-30 data sets, in comparison with the pan-European
Catchment Characterization and Modelling version 2.1
(CCM2), river and catchment database [4] developed and
generated by the JRC [5].
The paper is organized as follows: Section 2 briefly presents
the TerraHidro system and the geographic region used in this
work, and Section 3 shows the results and some comparison.
2 Materials and methods
The United Kingdom was the geographic region used in the
development of this work. Although it is not a significantly
large area, it is an isolated area, bordered only by the ocean.
Assessment of the drainage network extracted by the TerraHidro system
using the CCM2 drainage as a reference data
João Ricardo de Freitas Oliveira, Sergio Rosim, Alexandre Copertino
Jardim
National Institute for Space Research - INPE
Av. Dos Astronautas, 1758
São José dos Campos, Brazil
{joao, sergio, alexandre}@dpi.inpe.br
Abstract
The objective of this study is to compare the drainage networks extracted by the TerraHidro system, developed in the Image Processing
Division (DPI) of the National Institute for Space Research (INPE), using SRTM data with resolutions of 30 and 90 meters, with the existing
drainages in the pan-European drainage network database, called Catchment Characterization and Modelling version 2.1 (CCM2), river and
catchment database developed at the Institute for Environment and Sustainability (IES) of the Joint Research Centre (JRC). In other words,
CCM2 data set was used as the reference data for qualitative analysis of the extracted drainages by TerraHidro. The SRTM 30m data contains altimetry points with value -32767, called void points, that must be substituted by some estimated altimetry data. TerraHidro automatically
performs these corrections using any available altimetry data set grid as an alternative value grid. In this work, we used the SRTM 90m as the
alternative grid. To do so, TerraHidro uses a bilinear interpolator, which performs a linear interpolation weighting by the inverse of the
distance using the four nearest values. A conversion process of these drainages, called upscaling, was executed in order to adapt them to lower
resolutions, in this case 900m. Again, this new set of drainage was compared with the reference data. Finally, a procedure called HAND was
executed and the result is displayed indicating areas with varying levels of flooding potential. The data used in this work are the SRTM 90m
and SRTM 30m from the UK. The basic TerraHidro features have also been described.
Keywords: TerraHidro, drainage network, SRTM, HAND, upscaling.
AGILE 2016 – Helsinki, June 14-17, 2016
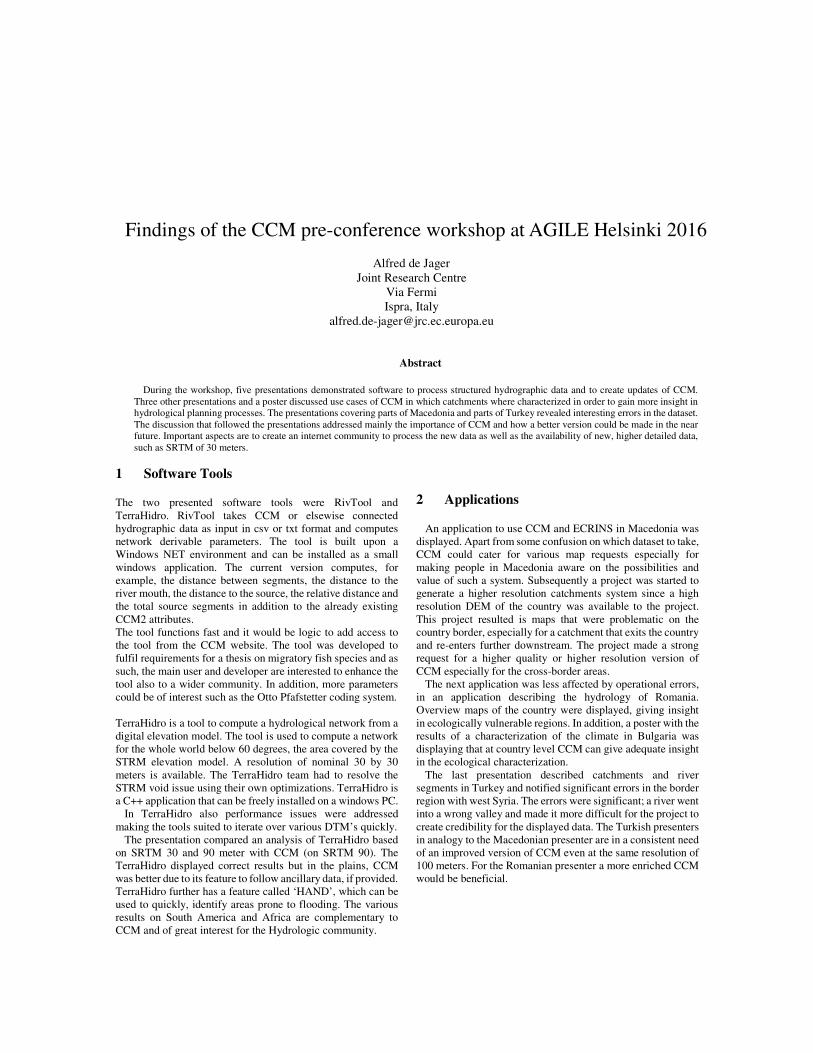
The SRTM-90 and SRTM-30 data of this region were used.
Figure 1 shows in grey levels the SRTM-30 data set.
Figure 1: SRTM-30 data for the United Kingdom.
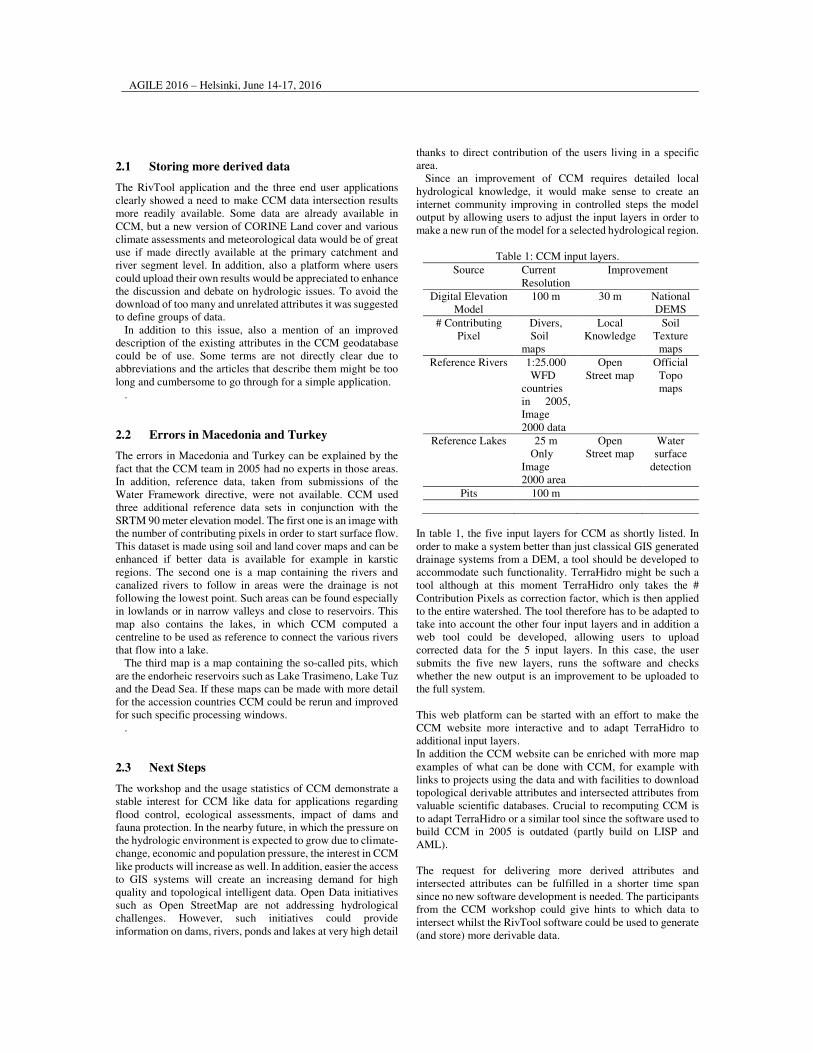
The drainage information of the CCM2 database was used as
reference information in this work. The CCM2 database was
designed, developed and implemented by the JRC in
accordance with the European Water Framework Directive
(WFD, 2000/60/EC). CCM2 used an Otto Pfafstetter [6]
codification extension to code drainages and watersheds
extracted from a digital elevation model at 100-meter spatial
resolution, regarding a scale of at least 1:500,000. Figure 2
shows the SRTM-90 and the CCM2 drainages of United
Kingdom.
Figure 2: SRTM-90 and CCM2 drainage (in yellow)
for the United Kingdom.
TerraHidro system was used to process these data sets. It has
been developed at the Digital Image Processing Division of the
National Institute for Space Research (DPI-INPE), situated in
São José dos Campos, Brazil. It’s free for download under the
GNU (GPL) license, as published by Free Software
Foundation. TerraHidro has functions to perform: local drain
direction determination, contributing area grid calculation,
drainage definition using an arbitrary threshold value, drainage
segmentation, watershed delineation by segments and isolated
points, vectorised drainage and watershed, drainage upscaling,
Height Above the Nearest Drainage (HAND) [7] that computes
the difference between the altimetry grid value of each point
and the closest drainage value reached by following the local
drain directions, among others.
TerraHidro is, in fact, a plugin of the geographic viewer
TerraView that loads and stores data in a geographical library
called TerraLib [8], an open source geographical library
implemented in C++ language that has also been developed at
DPI-INPE. TerraLib is an open source Geographical
Information System (GIS) software library. TerraLib supports
coding of geographical applications using spatial databases,
and stores data in different database management system
(DBMS) including MySQL, PostgreSQL and others. Some
TerraHidro functions are described below.
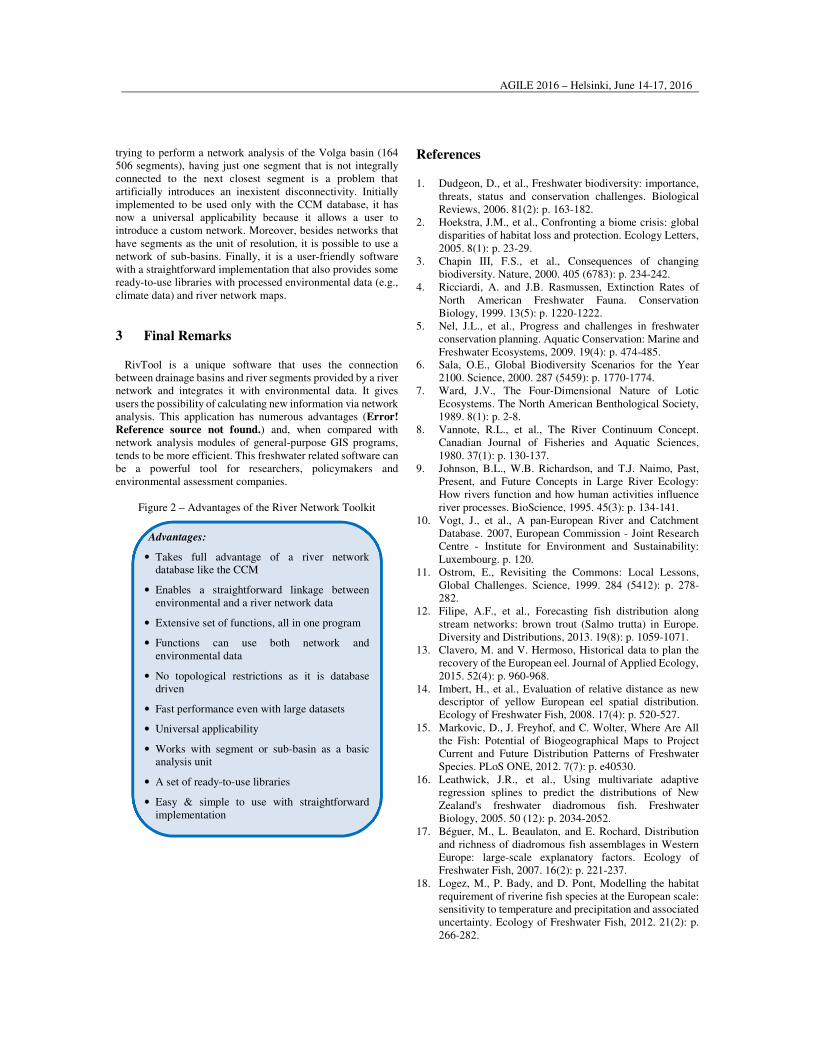
2.1 Local Flow Determination
The Local Drain Direction (LDD) grid gives the local water
flow [9]. For each DEM grid cell, the LDD was calculated
considering the steepest downstream regarding the 8-neighbour
grid cells. At the end of the task, a new grid was created with
the same number of columns and rows as the original DEM.
Each grid cell receives a code indicating the water flow
direction from this cell. Figure 3 shows LDD construction.
Figure 3: Local Drain Directions creation process.
The drainage extracted from TerraHidro is unidirectional, but
the codification expressed in power of two will allow using
multipath local flows.
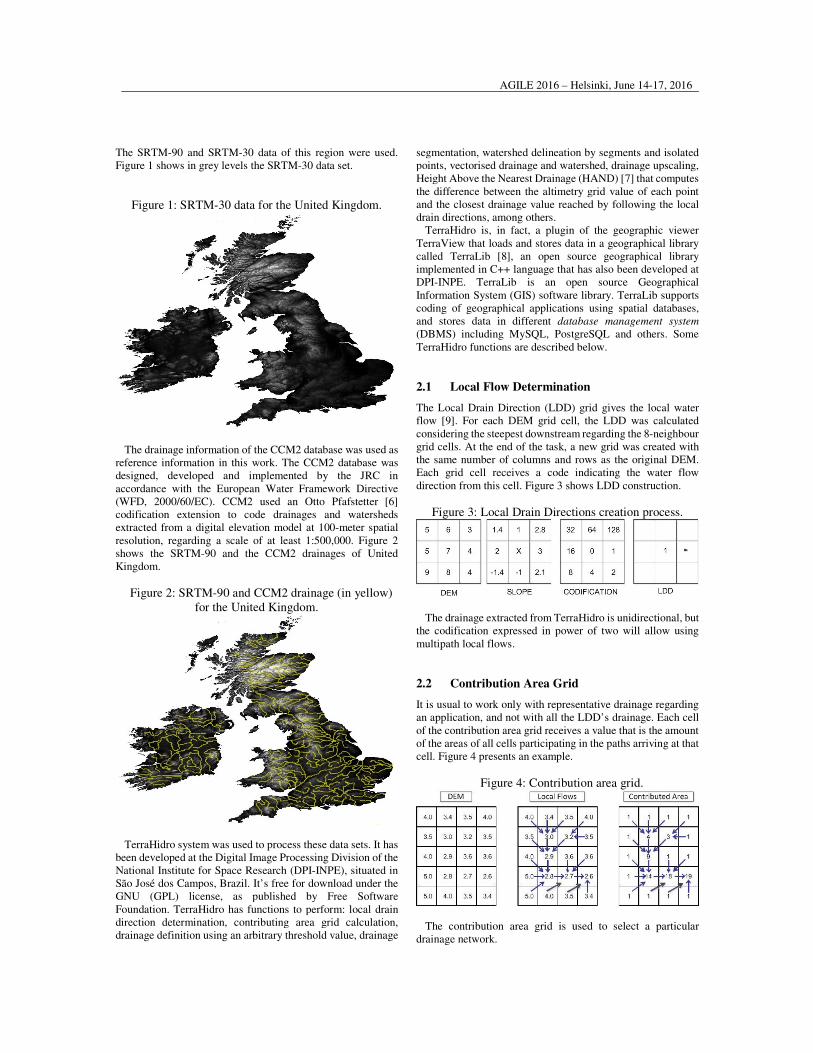
2.2 Contribution Area Grid
It is usual to work only with representative drainage regarding
an application, and not with all the LDD’s drainage. Each cell
of the contribution area grid receives a value that is the amount
of the areas of all cells participating in the paths arriving at that
cell. Figure 4 presents an example.
Figure 4: Contribution area grid.
The contribution area grid is used to select a particular
drainage network.
AGILE 2016 – Helsinki, June 14-17, 2016
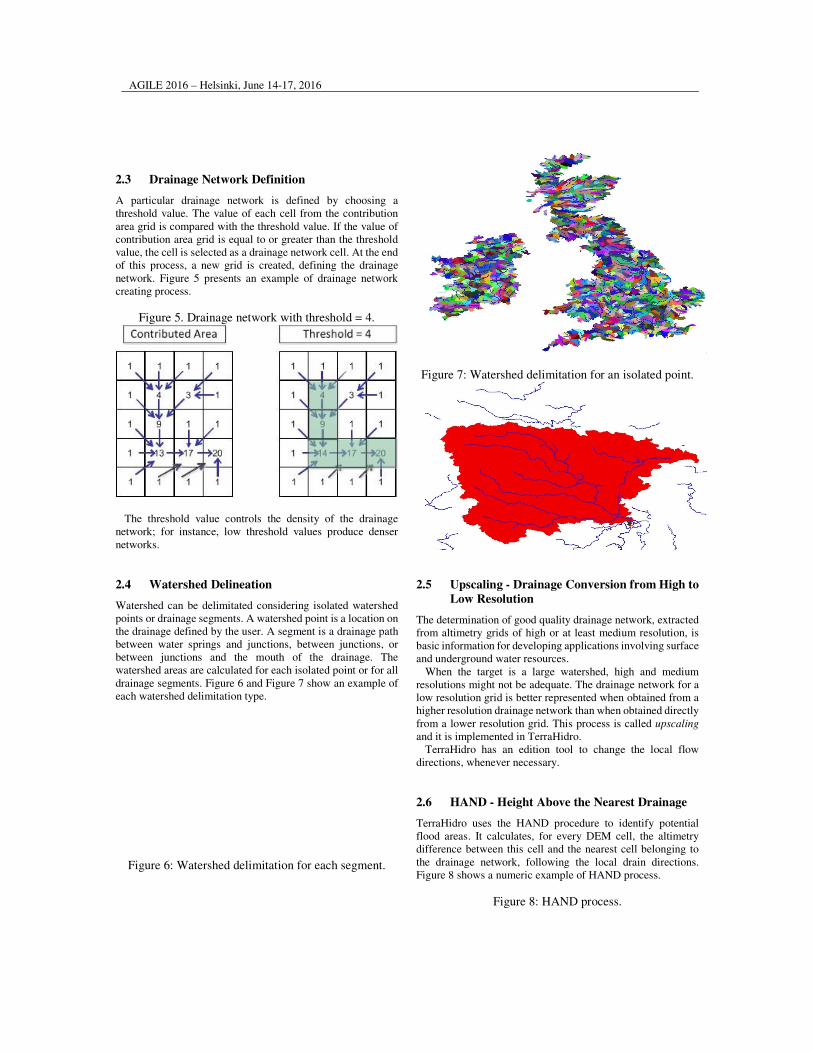
2.3 Drainage Network Definition
A particular drainage network is defined by choosing a
threshold value. The value of each cell from the contribution
area grid is compared with the threshold value. If the value of
contribution area grid is equal to or greater than the threshold
value, the cell is selected as a drainage network cell. At the end
of this process, a new grid is created, defining the drainage
network. Figure 5 presents an example of drainage network
creating process.
Figure 5. Drainage network with threshold = 4.
The threshold value controls the density of the drainage
network; for instance, low threshold values produce denser
networks.
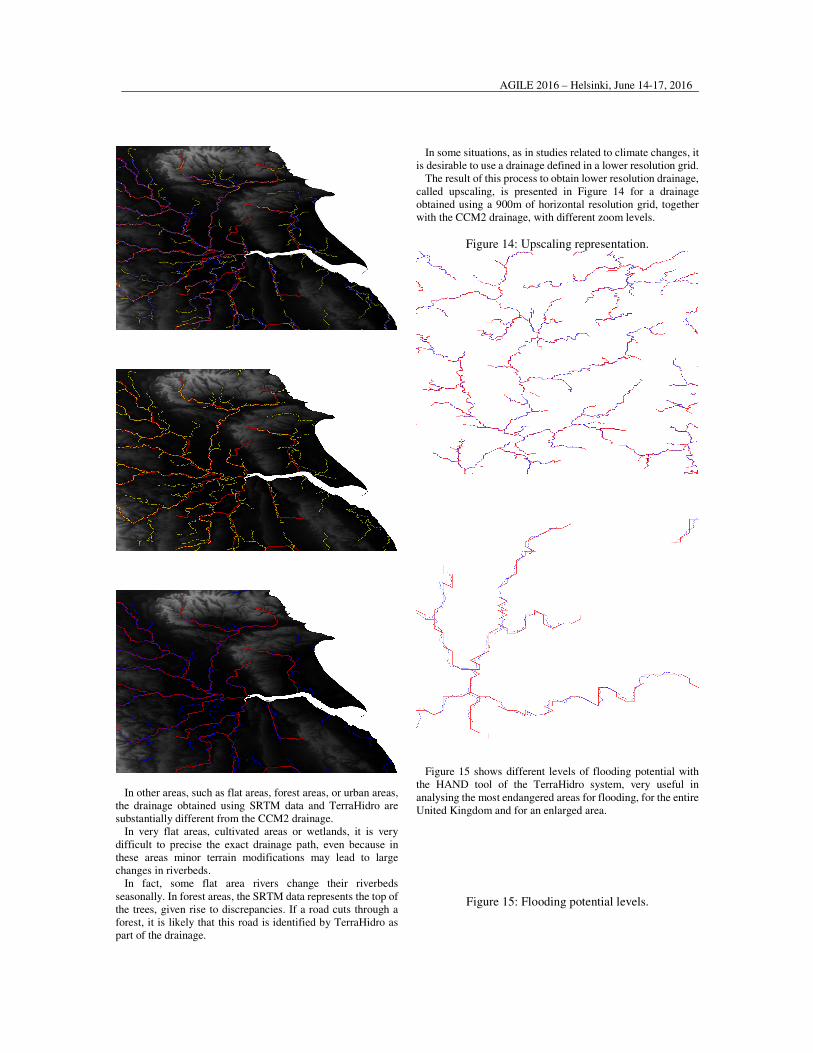
2.4 Watershed Delineation
Watershed can be delimitated considering isolated watershed
points or drainage segments. A watershed point is a location on
the drainage defined by the user. A segment is a drainage path
between water springs and junctions, between junctions, or
between junctions and the mouth of the drainage. The
watershed areas are calculated for each isolated point or for all
drainage segments. Figure 6 and Figure 7 show an example of
each watershed delimitation type.
Figure 6: Watershed delimitation for each segment.
Figure 7: Watershed delimitation for an isolated point.
2.5 Upscaling - Drainage Conversion from High to
Low Resolution
The determination of good quality drainage network, extracted
from altimetry grids of high or at least medium resolution, is
basic information for developing applications involving surface
and underground water resources.
When the target is a large watershed, high and medium
resolutions might not be adequate. The drainage network for a
low resolution grid is better represented when obtained from a
higher resolution drainage network than when obtained directly
from a lower resolution grid. This process is called upscaling
and it is implemented in TerraHidro.
TerraHidro has an edition tool to change the local flow
directions, whenever necessary.
2.6 HAND - Height Above the Nearest Drainage
TerraHidro uses the HAND procedure to identify potential
flood areas. It calculates, for every DEM cell, the altimetry
difference between this cell and the nearest cell belonging to
the drainage network, following the local drain directions.
Figure 8 shows a numeric example of HAND process.
Figure 8: HAND process.

AGILE 2016 – Helsinki, June 14-17, 2016
HAND process can only identify areas with potential for
flooding. This information allows the water resource manager
to focus his efforts on the most susceptible areas regarding the
occurrence of extreme events involving water. For a more
precise study, hydrological models must be used.
3 Results and Comparison
TerraHidro generated the results of this work for the UK region
using SRTM-90 and SRTM-30 data. A threshold value was
used to provide a reasonable drainage density, considering the
study area. Figure 9 shows the SRTM-90 and the SRTM-30
drainages over the CCM2 drainage.
Figure 9: CCM2, SRTM-90 and SRTM-30 drainage
networks.
In the following pictures, enlarged remarkable areas are
shown from Figure 9 providing a more detailed analysis. Four
remarkable areas were analysed: two areas that the drainages
match well in large extensions (Figure 10 and Figure 11), and
two areas that present important discrepancies (Figure 12 and
Figure 13).
For each enlarged area, three scenes are presented: the first
scene shows a combination of the drainages using SRTM-90
data (green), SRTM-30 data (blue), and CCM2 database (red);
the second scene, SRTM-90 and CCM2; and the third scene,
SRTM-30 and CCM2.
Figure 10: First area with good drainage representation.
Figure 11: Second area with good drainage
representation.

AGILE 2016 – Helsinki, June 14-17, 2016
It is noted that in rugged areas TerraHidro, using SRTM data,
extracts the drainage with good precision, largely agreeing with
the CCM2 drainage.
Figure 12: First area with drainage discrepancies.
Figure 13: Second area with drainage discrepancies.
AGILE 2016 – Helsinki, June 14-17, 2016
In other areas, such as flat areas, forest areas, or urban areas,
the drainage obtained using SRTM data and TerraHidro are
substantially different from the CCM2 drainage.
In very flat areas, cultivated areas or wetlands, it is very
difficult to precise the exact drainage path, even because in
these areas minor terrain modifications may lead to large
changes in riverbeds.
In fact, some flat area rivers change their riverbeds
seasonally. In forest areas, the SRTM data represents the top of
the trees, given rise to discrepancies. If a road cuts through a
forest, it is likely that this road is identified by TerraHidro as
part of the drainage.
In some situations, as in studies related to climate changes, it
is desirable to use a drainage defined in a lower resolution grid.
The result of this process to obtain lower resolution drainage,
called upscaling, is presented in Figure 14 for a drainage
obtained using a 900m of horizontal resolution grid, together
with the CCM2 drainage, with different zoom levels.
Figure 14: Upscaling representation.
Figure 15 shows different levels of flooding potential with
the HAND tool of the TerraHidro system, very useful in
analysing the most endangered areas for flooding, for the entire
United Kingdom and for an enlarged area.
Figure 15: Flooding potential levels.

AGILE 2016 – Helsinki, June 14-17, 2016
TerraHidro system showed good capability of representing
the drainages in the studied area using SRTM-90 and SRTM-
30 data, providing good results despite some few errors, which
needed little processing time and few resources.
A more detailed study of the drainage discrepancies found in
this work would be very interesting, possibly using satellite
images or fieldwork data, to better understand these results.
4 References
[1] E. Rodriguez, C. S. Morris, J. E. Chapin, J. M. Martin and
W. Daffer, S. Hensley. An assessment of the SRTM
topographic products. Technical Report JPL D-31639, Jet
Propulsion Laboratory, Pasadena, California, 143 pages,
2005.
[2] D. J. Meyer, T. Tachikawa, M. Abrams, R. Crippen, T.
Krieger, D. Gesch and C. Carabajal. Summary of the
validation of the second version of the ASTER GDEM.
International Archives of the Photogrammetry, Remote
Sensing and Spatial Information Sciences, V. XXXIX-B4,
2012 XXII ISPRS Congress, 25 August – 01 September
2012, Melbourne, Australia, 2012.
[3] S. Rosim, J. R. F. Oliveira, J. O. Ortiz, M. Z. Cuellar and
A. C. Jardim. Drainage network extraction of Brazilian
semiarid region with potential flood indication áreas.
Proc. SPIE 9239, Remote Sensing for Agriculture,
Ecosystems, and Hydrology XVI, 923919 (21 October
2014); doi:10.1117/12.2066906, 2014.
[4] CCM2, CCM River and Catchment Database, version 2.1.
Institute for Environment and Sustainability (IES) of Joint
Research Centre (JRC) site, http://ccm.jrc.ec.europa.eu ,
download in May, 03, 2016.
[5] A. L. Jager and J. V. Vogt. Development and
demonstration of a structured hydrological feature coding
system for Europe, Hydrological Sciences Journal, 55, 5,
661, ISSN: 0262-6667 (Print) 2150-3435 (Online), Taylor
and Francis,
http://dx.doi.org/10.1080/02626667.2010.490786., 2010.
[6] O. Pfafstetter. Classificação de bacias hidrográficas.
Manuscript not published. Departamento Nacional de
Obras de Saneamento. In portuguese. 1989.
[7] C. D. Rennó, A. D. Nobre, L. A. Cuartas, J. V. Soares, M.
G. Hodnett, J. Tomasella and M. J. Waterloo. HAND, a
new terrain descriptor using SRTM-DEM: Mapping terra-
firme rainforest environments in Amazonia. Remote
Sensing of Environment 112 3469–3481, 2008.
[8] G. Câmara, L. Vinhas, K. R. Ferreira, G. G. R. Queiroz,
R. C. M. Souza, A. M. V. Monteiro, M. T. Carvalho, M.
A. Casanova and U. M. Freitas. TerraLib: An open source
GIS library for large-scale environmental and socio-
economic applications. Open Source Approaches to
Spatial Data Handling, Berlin, Springer-Verlag, 2008.
[9] P. A. Burrough and R. A. MacDonnell. Principles of
Geographical Information Systems. New York: Oxford
University Press, 1998.

AGILE 2016 – Helsinki, June 14-17, 2016
1. WFD objectives achievement and Water
Body delineation
The Water Framework Directive (WFD) [1] requires
delineating surface and ground water bodies and characterizing
them. During the process of development of the River Basin
Management Plan (RBMP), environmental objectives have to
be set on water bodies (WB). Natural conditions, technical
difficulties or disproportionate costs may be advocated by each
E.U. Member State to postpone the deadline of objective
achievement to 2021 or 2027. Even less stringent objectives
may be set, under particular circumstances. The impact of
anthropogenic pressures and the resulting expected status of
the water bodies have to be taken into account in the WB
delineation process. Achieving the WB environmental
objectives is an important commitment of the Member States.
The WB delineation process is therefore, the basis on
which is constructed many WFD elements: the delineated
water bodies are the foundation bricks of WFD processes, as
explained in the guidance document on water bodies [2].
Hence, the selection of the GIS file sources to be used for
delineating has far-reaching and strategic implications.
2 GIS files available for delineation
Delineating the surface water bodies includes the production
of sufficiently accurate Geographical Information System
(GIS) files of the water bodies (usually shape files). In this
regard, the availability and quality of the existing GIS files of
the rivers network and their catchments are critical.
To represent the WFD International River Basin Districts on
maps, it is necessary to put together GIS files of the rivers
network of several riparian countries. In each of the States,
Universities, Institutions or Projects have developed Digital
Elevation Model (DEM). These are usually produced and
regularly updated by using aerial photos, satellite imagery,
Google or OpenStreetMap and other sources, such as 1/25000
topographic maps.
The derived DEM GIS files, which are useful for WFD,
include Rivers segments, Lake Polygons, Nodes of rivers
confluences and the boundaries of rivers and streams drainage
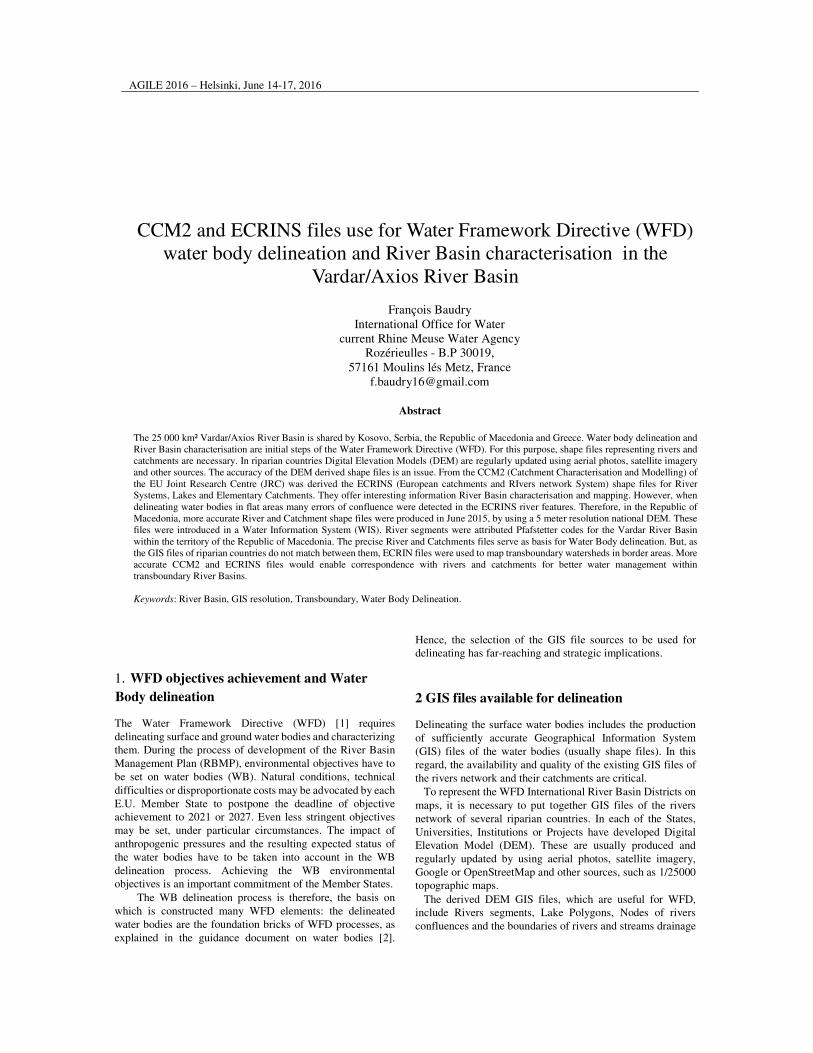
CCM2 and ECRINS files use for Water Framework Directive (WFD)
water body delineation and River Basin characterisation in the
Vardar/Axios River Basin
François Baudry
International Office for Water
current Rhine Meuse Water Agency
Rozérieulles - B.P 30019,
57161 Moulins lés Metz, France
Abstract
The 25 000 km² Vardar/Axios River Basin is shared by Kosovo, Serbia, the Republic of Macedonia and Greece. Water body delineation and
River Basin characterisation are initial steps of the Water Framework Directive (WFD). For this purpose, shape files representing rivers and
catchments are necessary. In riparian countries Digital Elevation Models (DEM) are regularly updated using aerial photos, satellite imagery
and other sources. The accuracy of the DEM derived shape files is an issue. From the CCM2 (Catchment Characterisation and Modelling) of
the EU Joint Research Centre (JRC) was derived the ECRINS (European catchments and RIvers network System) shape files for River Systems, Lakes and Elementary Catchments. They offer interesting information River Basin characterisation and mapping. However, when
delineating water bodies in flat areas many errors of confluence were detected in the ECRINS river features. Therefore, in the Republic of
Macedonia, more accurate River and Catchment shape files were produced in June 2015, by using a 5 meter resolution national DEM. These
files were introduced in a Water Information System (WIS). River segments were attributed Pfafstetter codes for the Vardar River Basin
within the territory of the Republic of Macedonia. The precise River and Catchments files serve as basis for Water Body delineation. But, as
the GIS files of riparian countries do not match between them, ECRIN files were used to map transboundary watersheds in border areas. More
accurate CCM2 and ECRINS files would enable correspondence with rivers and catchments for better water management within
transboundary River Basins.
Keywords: River Basin, GIS resolution, Transboundary, Water Body Delineation.
AGILE 2016 – Helsinki, June 14-17, 2016
basin (catchment). Each State uses country specific
geographical projections and DEM.
Since the resolution of the DEM and their accuracy vary, the
GIS files derived from them vary also. As a result, it is not
easy to put together riparian Rivers and Catchments files to
produce a common GIS file for a whole International River
Basin District. Moreover, as far as River Basin Management
(RBM) data are concerned, depending on the riparian country,
the tables of attributes of the Rivers and Catchments GIS files
are more or less rich in characterisation data.
3 Files covering international River Basin in
Europe: CCM2 and ECRIN files
The EU Joint Research Centre (JRC) produced files on rivers
systems in the frame of the Catchment Characterisation and
Modelling Project (CCM2). Under the European Catchments
and Rivers Network System (ECRINS) Project, GIS shape
files were derived from the CCM2 and other sources to
facilitate the use of the information for WFD implementation.
The CCM2 and ECRINS files cover an area larger than
Europe.
The CCM2 shape files are freely downloadable on the web
(http://ccm.jrc.ec.europa.eu/ and the ECRINS files on the
European Environmental Agency website (EEA). They can
be used with, for instance, the free OpenSourceSoftware
QGIS. Hence, without any payment, maps can be easily
produced by non-specialists to represent hydrological
features such as river network systems for various Strahler
number, lakes or ‘mosaics’ of Functional Elementary
Catchments (FEC) for particular areas.
The CCM2 and ECRINS shape files are particularly
interesting to map water related information for International
River Basins. They cover many countries and along border
areas, by using them, there is no need to put together
heterogeneous GIS files from different countries to represent
Transboundary Rivers, Lakes and their watersheds.
The methodology and the attribute tables of CCM2 and
ECRIN GIS files are described in a report prepared by the EU
Joint Research Centre (JRC) [3]. The descriptors in the fields
in these attribute tables are relevant for River Basin
characterisation, as described in section 5.
However, the features of the ECRINS shape files
representing River Network and Catchment do not have a
resolution better than 100 m. In 2014, while attempting to
delineate Surface Water Bodies in the Vardar sub-basins,
errors of representation of the River Network System were
identified. Consequently, the accuracy of the ECRIN shape
was considered as an issue in flat areas, as described in the
section 6.
4 The international Vardar/Axios River Basin
The Republic of Macedonia is aiming at accessing to the
European Union. In this connection, the EU funds projects to
assist the Ministry of Environment and Physical Planning
(MoEPP) and other water institutions to implement the WFD.
The Project entitled “Technical assistance for strengthening
the institutional capacities for approximation and
implementation of the environmental legislation in the area of
water management in Macedonia” (EuropAid132/08/D/SER)
was implemented jointly by Ramboll (Denmark), and the
Office International for Water (France) from January 2014 to
December 2015.
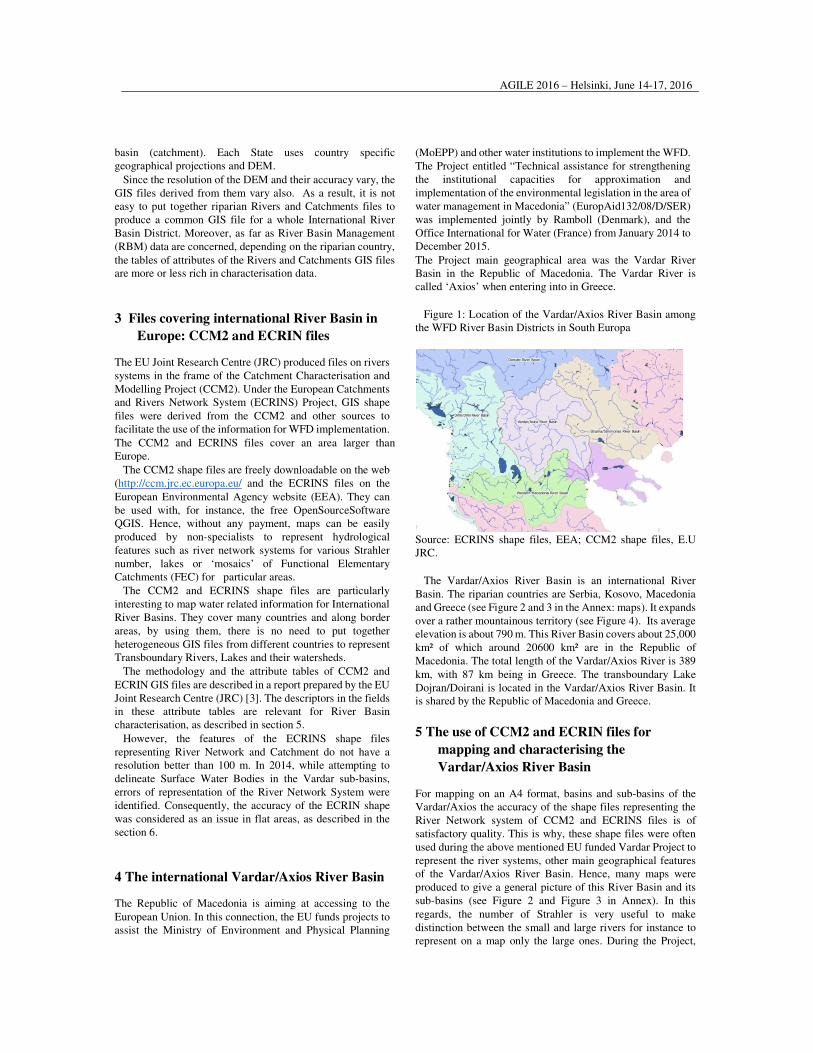
The Project main geographical area was the Vardar River
Basin in the Republic of Macedonia. The Vardar River is
called ‘Axios’ when entering into in Greece.
Figure 1: Location of the Vardar/Axios River Basin among
the WFD River Basin Districts in South Europa
Source: ECRINS shape files, EEA; CCM2 shape files, E.U
JRC.
The Vardar/Axios River Basin is an international River
Basin. The riparian countries are Serbia, Kosovo, Macedonia
and Greece (see Figure 2 and 3 in the Annex: maps). It expands
over a rather mountainous territory (see Figure 4). Its average
elevation is about 790 m. This River Basin covers about 25,000
km² of which around 20600 km² are in the Republic of
Macedonia. The total length of the Vardar/Axios River is 389
km, with 87 km being in Greece. The transboundary Lake
Dojran/Doirani is located in the Vardar/Axios River Basin. It
is shared by the Republic of Macedonia and Greece.
5 The use of CCM2 and ECRIN files for
mapping and characterising the
Vardar/Axios River Basin
For mapping on an A4 format, basins and sub-basins of the
Vardar/Axios the accuracy of the shape files representing the
River Network system of CCM2 and ECRINS files is of
satisfactory quality. This is why, these shape files were often
used during the above mentioned EU funded Vardar Project to
represent the river systems, other main geographical features
of the Vardar/Axios River Basin. Hence, many maps were
produced to give a general picture of this River Basin and its
sub-basins (see Figure 2 and Figure 3 in Annex). In this
regards, the number of Strahler is very useful to make
distinction between the small and large rivers for instance to
represent on a map only the large ones. During the Project,

AGILE 2016 – Helsinki, June 14-17, 2016
when accuracy was not an issue, thematic maps of the basins
and sub-basins, were produced using particular ECRINS and
CCM2 descriptors for pedagogical and communication
purpose (Figures 2, 3, 4, 5).
The CCM2 shape files included indicators such as the slope,
the altitude, the rainfalls and Pfafstetter code. They are relevant
for the description of surface water bodies. Classes of slope
and classes of rainfalls were mapped for the Vardar River
Basin (see Figures 4 and 5).
Figure 4: Classes of slope using CCM2 data
Source, CCM2, EU –JRC, EU ‘Vardar Project 2014-2015’
Figure 5: Classes of Rainfall, using CCM2 data
Source: CCM2, JRC, EU ‘Vardar Project 2014-2015’
One of the WFD steps for characterising Surface Water
Bodies is to define a typology [2], [4]. As per WFD, under
system A and B, various descriptors have to be utilised, these
are: altitude, geology, size of the river basin and the WFD
ecoregions.
The tables of attributes of the ECRINS shape files include
fields that appeared interesting also to map and characterise the
surface water bodies. The fields regarding ‘surface’ and
‘altitude” of the ECRINS files Functional Elementary
Catchment (FEC) enable to characterise the River Basin by
classes of size and altitude (Figure 6). During the above
mentioned EU funded Vardar Project 2014-2015, the ECRIN
shape file were used also to explain the delineation
methodology to the staff of the Macedonian water institutions
(see Figures 6 and 7).
Figure 6: Use of the field size of the River Basin of the
ECRINS Catchment GIS files
Source: ECRINS files, working map of EU ‘Vardar Project
2014-2015’ (Legend: over 1000 km² below 10 000 km², above
10 000 km² green-yellow, blue Large River, red small rivers).
A first water body delineation test was performed in July
2015 by using the ECRINS GIS files for the sub-basin Treska.
As this basin is mountainous, the FEC seemed appropriate to
delineate water body catchment by merging the FEC, where
appropriate.
Figure 7: First delineation of water bodies by merging
elementary unit FEC (called hydrozones in the map).
AGILE 2016 – Helsinki, June 14-17, 2016
Source: ECRINS file, (EEA), EU ‘Vardar River Basin 2014
-2015’
But, when checking the location where the Treska River
merges with the Vardar River, it became apparent that the
geometry of ECRINS River network shape file need to be
corrected. In plains, the ECRINS shape file appeared of
insufficient accuracy to be used for the Surface Water Body
delineation (see Figure 8). This was explained in a first report
on delineation submitted to the Macedonian Authorities [4].
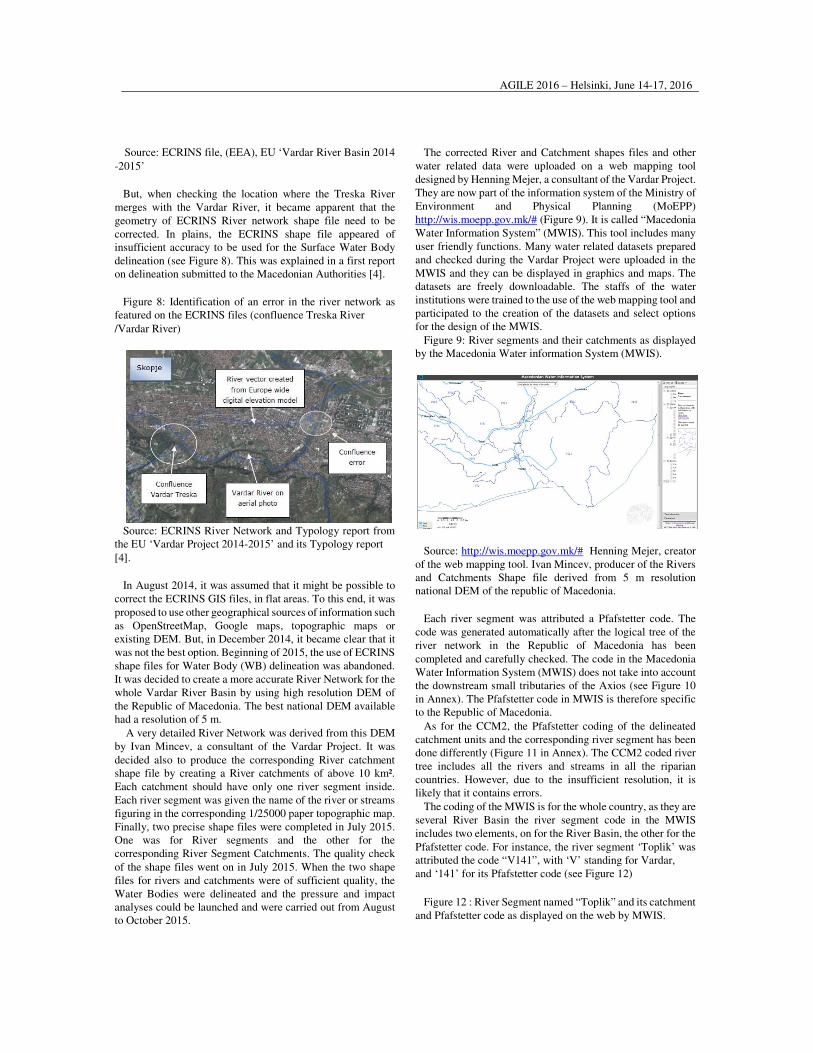
Figure 8: Identification of an error in the river network as
featured on the ECRINS files (confluence Treska River
/Vardar River)
Source: ECRINS River Network and Typology report from
the EU ‘Vardar Project 2014-2015’ and its Typology report
[4].
In August 2014, it was assumed that it might be possible to
correct the ECRINS GIS files, in flat areas. To this end, it was
proposed to use other geographical sources of information such
as OpenStreetMap, Google maps, topographic maps or
existing DEM. But, in December 2014, it became clear that it
was not the best option. Beginning of 2015, the use of ECRINS
shape files for Water Body (WB) delineation was abandoned.
It was decided to create a more accurate River Network for the
whole Vardar River Basin by using high resolution DEM of
the Republic of Macedonia. The best national DEM available
had a resolution of 5 m.
A very detailed River Network was derived from this DEM
by Ivan Mincev, a consultant of the Vardar Project. It was
decided also to produce the corresponding River catchment
shape file by creating a River catchments of above 10 km².
Each catchment should have only one river segment inside.
Each river segment was given the name of the river or streams
figuring in the corresponding 1/25000 paper topographic map.
Finally, two precise shape files were completed in July 2015.
One was for River segments and the other for the
corresponding River Segment Catchments. The quality check
of the shape files went on in July 2015. When the two shape
files for rivers and catchments were of sufficient quality, the
Water Bodies were delineated and the pressure and impact
analyses could be launched and were carried out from August
to October 2015.
The corrected River and Catchment shapes files and other
water related data were uploaded on a web mapping tool
designed by Henning Mejer, a consultant of the Vardar Project.
They are now part of the information system of the Ministry of
Environment and Physical Planning (MoEPP)
http://wis.moepp.gov.mk/# (Figure 9). It is called “Macedonia
Water Information System” (MWIS). This tool includes many
user friendly functions. Many water related datasets prepared
and checked during the Vardar Project were uploaded in the
MWIS and they can be displayed in graphics and maps. The
datasets are freely downloadable. The staffs of the water
institutions were trained to the use of the web mapping tool and
participated to the creation of the datasets and select options
for the design of the MWIS.
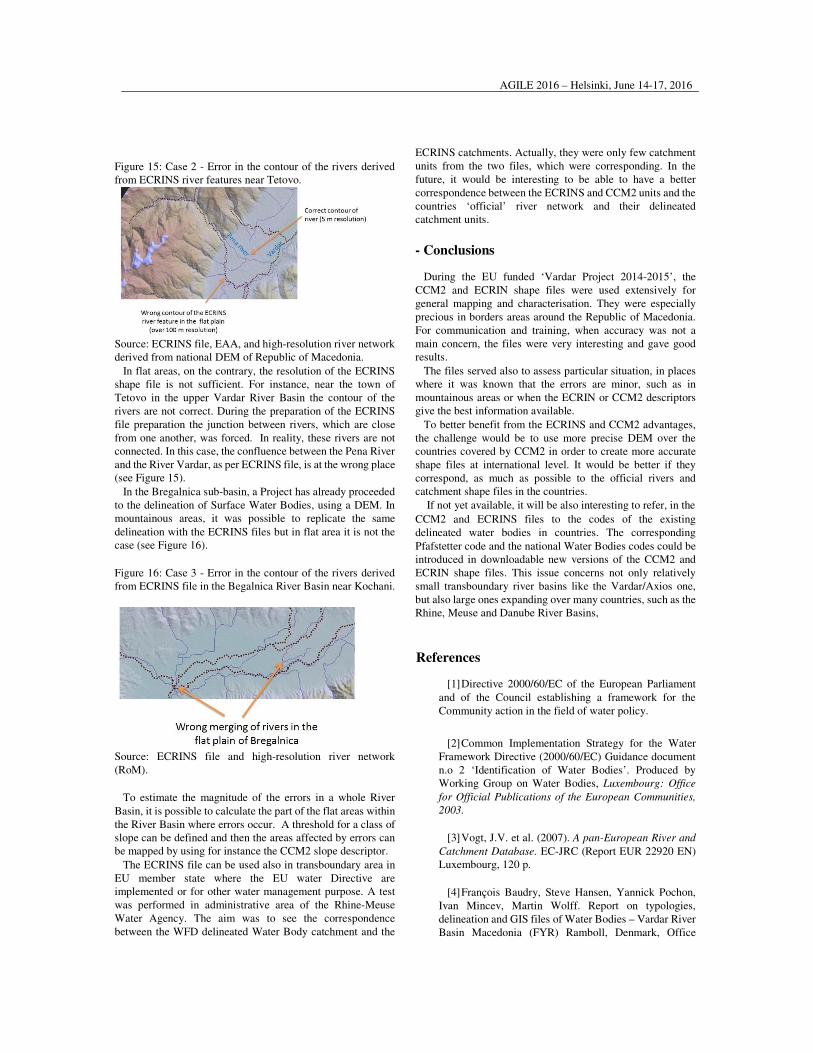
Figure 9: River segments and their catchments as displayed
by the Macedonia Water information System (MWIS).
Source: http://wis.moepp.gov.mk/# Henning Mejer, creator
of the web mapping tool. Ivan Mincev, producer of the Rivers
and Catchments Shape file derived from 5 m resolution
national DEM of the republic of Macedonia.
Each river segment was attributed a Pfafstetter code. The
code was generated automatically after the logical tree of the
river network in the Republic of Macedonia has been
completed and carefully checked. The code in the Macedonia
Water Information System (MWIS) does not take into account
the downstream small tributaries of the Axios (see Figure 10
in Annex). The Pfafstetter code in MWIS is therefore specific
to the Republic of Macedonia.
As for the CCM2, the Pfafstetter coding of the delineated
catchment units and the corresponding river segment has been
done differently (Figure 11 in Annex). The CCM2 coded river
tree includes all the rivers and streams in all the riparian
countries. However, due to the insufficient resolution, it is
likely that it contains errors.
The coding of the MWIS is for the whole country, as they are
several River Basin the river segment code in the MWIS
includes two elements, on for the River Basin, the other for the
Pfafstetter code. For instance, the river segment ‘Toplik’ was
attributed the code “V141”, with ‘V’ standing for Vardar,
and ‘141’ for its Pfafstetter code (see Figure 12)
Figure 12 : River Segment named “Toplik” and its catchment
and Pfafstetter code as displayed on the web by MWIS.

AGILE 2016 – Helsinki, June 14-17, 2016
Source: http://wis.moepp.gov.mk/# , designer and producer
of the web mapping tool Henning Mejer. Shape file produced
with the Rep of Macedonia DEM by Ivan Mincev in 2015.
In the borders areas, a country specific high resolution DEM
does not enable a full representation of Transboundary Rivers
and their Catchments. To be able to do so, it is necessary that
GIS data be shared between riparian countries. Transboundary
cooperation has to be organised in order to facilitate such
exchange of GIS files. This can be a long process.
Therefore, for the WFD related maps in transboundary areas,
GIS files covering Greece and the Republic of Macedonia were
needed. In this connection, the ECRINS files were useful for
mapping in the border areas. In these areas, two GIS shape
files, one being ECRN files , the other the high resolution DEM
derived GIS files were superposed to create maps representing
transboundary Rivers and Lakes as well their entire catchments
(see Figure 13 and Figure 14 and 15 in the Annex : maps). This
representation is not completely satisfactory as the vectors of
the two shape files do not correspond exactly. It would be
better to have accurate shape files, with the same geographic
projection over border areas.
Figure 13: Coverage by ECRINS Rivers and Catchment files
of transboundary areas.
Source: ECRINS River and Catchment files and high
Resolution River and Catchment Files of the Rep. of
Macedonia.
For calculating the surface of the transboundary catchments,
the ECRINS field ‘surface’ of the FEC file was used. For each
transboundary sub-basin of the Vardar/Axios Basin was
distinguished (see table 1):
- the surface of the sub-basin within the Republic of
Macedonia,
- the surface of the whole sub-basin including the
surface in riparian countries.
Table 1: Estimation of Sub-basins surface with ECRIN file and
with the high resolution DEM of the Rep. of Macedonia
Sub-basins of
Vardar/Axios
River Basin
Surface for the
sub-basins
within the Rep.
Maced. (km²)
Surface for the
whole
subbasin (km²)
Upper Vardar 1616 1629
Middle Vardar 2570 2577
Vardar downstream 2822 3122
Bregalnica 4320 4322
Crna Reka 5044 5180
Pcinja 2058 2878
Treska 2071 2071
Lepenec 133 831
Total 20634 22608
Source: ECRINS (EEA) and 5m resolution DEM derived GIS
files from the Rep. of Macedonia.
6 Insufficient accuracy for delineating Surface
Water Body in flat areas
In mountainous areas, the ECRINS shape file contours
correspond to the more detailed one deriving from a 5 meter
resolution DEM (see Figure 16).
Figure 16: Case 1 - satisfactory corespondance between the
ECRIN files and the rivers contours in Treska sub-basin.
Source: ECRINS file, EAA, and high resolution river network
derived from national DEM of Republic of Macedonia.
AGILE 2016 – Helsinki, June 14-17, 2016
Figure 15: Case 2 - Error in the contour of the rivers derived
from ECRINS river features near Tetovo.
Source: ECRINS file, EAA, and high-resolution river network
derived from national DEM of Republic of Macedonia.
In flat areas, on the contrary, the resolution of the ECRINS
shape file is not sufficient. For instance, near the town of
Tetovo in the upper Vardar River Basin the contour of the
rivers are not correct. During the preparation of the ECRINS
file preparation the junction between rivers, which are close
from one another, was forced. In reality, these rivers are not
connected. In this case, the confluence between the Pena River
and the River Vardar, as per ECRINS file, is at the wrong place
(see Figure 15).
In the Bregalnica sub-basin, a Project has already proceeded
to the delineation of Surface Water Bodies, using a DEM. In
mountainous areas, it was possible to replicate the same
delineation with the ECRINS files but in flat area it is not the
case (see Figure 16).
Figure 16: Case 3 - Error in the contour of the rivers derived
from ECRINS file in the Begalnica River Basin near Kochani.
Source: ECRINS file and high-resolution river network
(RoM).
To estimate the magnitude of the errors in a whole River
Basin, it is possible to calculate the part of the flat areas within
the River Basin where errors occur. A threshold for a class of
slope can be defined and then the areas affected by errors can
be mapped by using for instance the CCM2 slope descriptor.
The ECRINS file can be used also in transboundary area in
EU member state where the EU water Directive are
implemented or for other water management purpose. A test
was performed in administrative area of the Rhine-Meuse
Water Agency. The aim was to see the correspondence
between the WFD delineated Water Body catchment and the
ECRINS catchments. Actually, they were only few catchment
units from the two files, which were corresponding. In the
future, it would be interesting to be able to have a better
correspondence between the ECRINS and CCM2 units and the
countries ‘official’ river network and their delineated
catchment units.
- Conclusions
During the EU funded ‘Vardar Project 2014-2015’, the
CCM2 and ECRIN shape files were used extensively for
general mapping and characterisation. They were especially
precious in borders areas around the Republic of Macedonia.
For communication and training, when accuracy was not a
main concern, the files were very interesting and gave good
results.
The files served also to assess particular situation, in places
where it was known that the errors are minor, such as in
mountainous areas or when the ECRIN or CCM2 descriptors
give the best information available.
To better benefit from the ECRINS and CCM2 advantages,
the challenge would be to use more precise DEM over the
countries covered by CCM2 in order to create more accurate
shape files at international level. It would be better if they
correspond, as much as possible to the official rivers and
catchment shape files in the countries.
If not yet available, it will be also interesting to refer, in the
CCM2 and ECRINS files to the codes of the existing
delineated water bodies in countries. The corresponding
Pfafstetter code and the national Water Bodies codes could be
introduced in downloadable new versions of the CCM2 and
ECRIN shape files. This issue concerns not only relatively
small transboundary river basins like the Vardar/Axios one,
but also large ones expanding over many countries, such as the
Rhine, Meuse and Danube River Basins,
References
[1] Directive 2000/60/EC of the European Parliament
and of the Council establishing a framework for the
Community action in the field of water policy.
[2] Common Implementation Strategy for the Water
Framework Directive (2000/60/EC) Guidance document
n.o 2 ‘Identification of Water Bodies’. Produced by
Working Group on Water Bodies, Luxembourg: Office
for Official Publications of the European Communities,
2003.
[3] Vogt, J.V. et al. (2007). A pan-European River and
Catchment Database. EC-JRC (Report EUR 22920 EN)
Luxembourg, 120 p.
[4] François Baudry, Steve Hansen, Yannick Pochon,
Ivan Mincev, Martin Wolff. Report on typologies,
delineation and GIS files of Water Bodies – Vardar River
Basin Macedonia (FYR) Ramboll, Denmark, Office

AGILE 2016 – Helsinki, June 14-17, 2016
International for Water, October 2015. EU funded Project
EuropeAid/132108/D/SER/MK for the Ministry of
Environment and Physical Planning of the Republic of
Macedonia .
[5] Jürgen Vogt, Roberto Colombo, Maria Luisa
Paracchini, Alfred de Jager, Pierre Soille, ‘CCM2 River
and Catchment Database Version 1.0’, in Hydrological
Sciences Journal 2003.
[6] de Jager, A. L. and Vogt, J. V.(2010) 'Development
and demonstration of a structured hydrological feature
coding system for Europe', in Hydrological Sciences
Journal, 55: 5, 661 — 6751].

AGILE 2016 – Helsinki, June 14-17, 2016
1 Introduction
Since the evaluation of Millennium Ecosystem Assessment
(MEA) scenarios of socio-ecological systems, sustainable
development was generally perceived only to be possible after
identifying and characterizing the diversity of structural and
functional ecological systems [1], which means quantification
of ecosystem services for accurate dimensioning the level of
their use by human societies. In line with current initiatives, we
intend to quantify countrywide specific ecosystem services on
implementing the Mapping and Assessment of Ecosystems and
their Services (MAES) [5] [6] process. The activities will focus
on specific aquatic ecosystems, using the proposed
methodology of MAES [7] and ARIES [2], based on data
structures developed under European programs, like
COPERNICUS and CORINE Land Cover, but also on other
high quality products provided by JRC (CCM21) [3][4].
Comparative analysis of our results with Habitat directive
report and Water Framework directive report [11] will show us
the level of interdependence of those assessments [10].
2 Material and methods
The activities are in compliance with the methodology of
assessing water balance at the catchment level [8] as presented
in the guidance document on the application of water balances
for supporting the implementation of WFD [11] [4] to quantify
on a regional scale the Common International Classification of
Ecosystem Services (CICES) for freshwater ecosystems, from
provisioning of water supplies to maintain and support the
hydrological cycle and water flow maintenance.
We have adapted the input value, related to CCM21
catchments distribution, based on zonal statistics of each
catchment on MODIS evapotranspiration (ET) and CLC2012
land cover classes, to model water availability at the catchment
level. For the water infiltration model, we used the estimated
average percentage from 0.001% to 20% based on slope and
soil type aggregation [12]. For evapotranspiration, we used the
MODIS assessment MOD16 program. This assessment is
based on annual average values to predict water availability for
each catchment related to water use model like proposed by
Villa et all [9], but implemented in a simple way ARCGIS add-
in.
2.1 CICES
Common International Classification of Ecosystem Services
(CICES) was selected for Romanian assessment of the MAES
process. In this respect, the assessment of aquatic ecosystems
services was focused on surface and subsurface water
availability extracted from general water balance equation to
characterize the provisioning services of freshwater
ecosystems.
In case of regulation and maintenance services, we focus on
freshwater ecosystems on flow regulation based on results of
the ratio of available water and water used.
2.2 CCM21
CCM21 represent the main derived tool for hydrological
structure assessment and is based on topology of rivers, lakes
and catchments [3]. The derived data from geomorphological
structure at the regional level is an important source for
Assessment of aquatic ecosystems state based on their main services
Florian Bodescu
Romanian Space Agency
Mendeleev 21-25,
Bucharest, Romania
Cristian Moise
Romanian Space Agency
Mendeleev 21-25,
Bucharest, Romania
Alexandru Badea
Romanian Space Agency
Mendeleev 21-25,
Bucharest, Romania
Abstract
European legislative framework like WFD, HD, BD, INSPIRE demonstrates a unified approach to characterize the state of the environment.
Extensive spatial datasets to quantify mechanisms and processes at regional level can be used by processing data such as those provided by
CCM21 (rivers and catchments database) closely related to the CLC 2012 dataset, allowing a quantitative assessment of ecosystem services
such as surface water resources and ground water resources. The approach of ecological systems and mass flow at catchment level are important steps in the functional use of structural models to quantify the nonlinear dynamics of ecosystems. Quantification of reference values
for ecosystem services at a regional level by a deterministic mathematical model is the goal to estimate the degree of transformation from a
reference state. Comparative analysis of habitats and species distributions (article 17 report from HD) with the state of aquatic ecosystems
will reflect the correspondence between these two assessments.
Keywords: MAES process, WFD, HD, CCM21 and COPERNICUS.

AGILE 2016 – Helsinki, June 14-17, 2016
mathematical modelling and for regional assessment of
complex hydrological structures. We have used this structural
model at the Danube catchment level to extract the sub-
catchments covering all national territories. We have selected
30860 catchments grouped in 25 basins from Danube
tributaries. We have used the data attributes of each catchment,
like average precipitation, average slope and average altitude
in relation with soil type distribution for water infiltration or
land cover/land use classes for water use
Figure 1: CCM21 extraction to cover Romania.
Figure 2: CCM21 average precipitation.
2.3 CLC2012
The project activities have benefited from the use of the pan-
European CORINE Land Cover 2012 products. The repartition
of land cover/land use classes allows us to have a general
picture on the spatial dimension of land distribution for
different types of management (agricultural, forestry, industrial
or residential). It is clear that these types of management have
impact in water use based on quantity of water abstractions for
production or functioning processes. In addition, at regional
level, these different types of LC/LU classes also have
influence on water percolation and water runoff process.
Considering the annual water balance, this influence can be
considered negligible.
2.4 MODIS – MOD16
The MOD16 dataset is based on the Penman-Monteith
equation and developed on estimation used by improved
algorithm of ET by Mu et al [13]. The ET from MOD16
distribution at 1 km resolution was extracted for each
catchment based on zonal statistics and reflected by ET mean
from 2000 to 2013.
Figure 3: CCM21 – MOD16 annual average ET
Figure 4: Infiltration estimation based on slope and soil type
2.5 HD art 17 report
The HD report was developed based on in field monitoring
of aquatic habitats and assessment of their state based on four
parameters habitat distribution, species composition, structure
and functioning synthesis and pressures and aggressions
presence. In figure 5 we have presented the spatial distribution
of aquatic habitats and their state assessed by 4 classes: 1.
unknown (gray) – where we don’t have enough information; 2.
Favorable state (green); 3. Unfavorable state (yellow); 4. Total
unfavorable state (red).
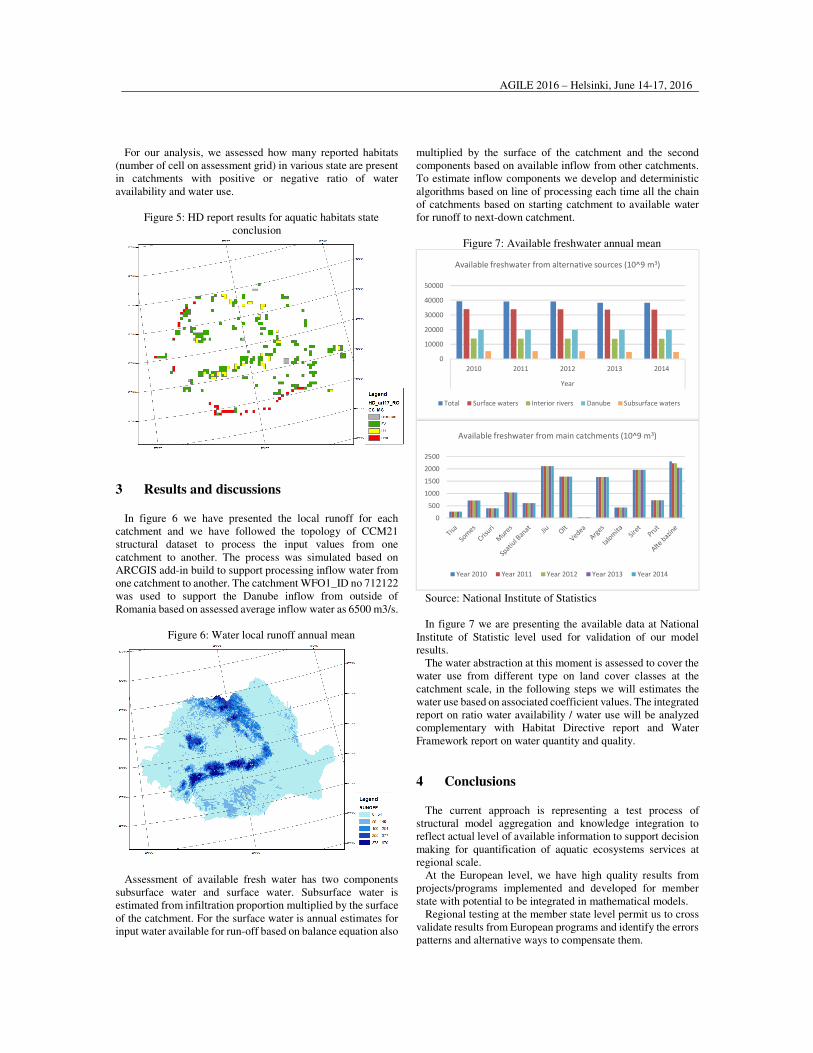
AGILE 2016 – Helsinki, June 14-17, 2016
For our analysis, we assessed how many reported habitats
(number of cell on assessment grid) in various state are present
in catchments with positive or negative ratio of water
availability and water use.
Figure 5: HD report results for aquatic habitats state
conclusion
3 Results and discussions
In figure 6 we have presented the local runoff for each
catchment and we have followed the topology of CCM21
structural dataset to process the input values from one
catchment to another. The process was simulated based on
ARCGIS add-in build to support processing inflow water from
one catchment to another. The catchment WFO1_ID no 712122
was used to support the Danube inflow from outside of
Romania based on assessed average inflow water as 6500 m3/s.
Figure 6: Water local runoff annual mean
Assessment of available fresh water has two components
subsurface water and surface water. Subsurface water is
estimated from infiltration proportion multiplied by the surface
of the catchment. For the surface water is annual estimates for
input water available for run-off based on balance equation also
multiplied by the surface of the catchment and the second
components based on available inflow from other catchments.
To estimate inflow components we develop and deterministic
algorithms based on line of processing each time all the chain
of catchments based on starting catchment to available water
for runoff to next-down catchment.
Figure 7: Available freshwater annual mean
Source: National Institute of Statistics
In figure 7 we are presenting the available data at National
Institute of Statistic level used for validation of our model
results.
The water abstraction at this moment is assessed to cover the
water use from different type on land cover classes at the
catchment scale, in the following steps we will estimates the
water use based on associated coefficient values. The integrated
report on ratio water availability / water use will be analyzed
complementary with Habitat Directive report and Water
Framework report on water quantity and quality.
4 Conclusions
The current approach is representing a test process of
structural model aggregation and knowledge integration to
reflect actual level of available information to support decision
making for quantification of aquatic ecosystems services at
regional scale.
At the European level, we have high quality results from
projects/programs implemented and developed for member
state with potential to be integrated in mathematical models.
Regional testing at the member state level permit us to cross
validate results from European programs and identify the errors
patterns and alternative ways to compensate them.
0
10000
20000
30000
40000
50000
2010 2011 2012 2013 2014
Year
Available freshwater from alternative sources (10^9 m3)
Total Surface waters Interior rivers Danube Subsurface waters
0
500
1000
1500
2000
2500
Available freshwater from main catchments (10^9 m3)
Year 2010 Year 2011 Year 2012 Year 2013 Year 2014
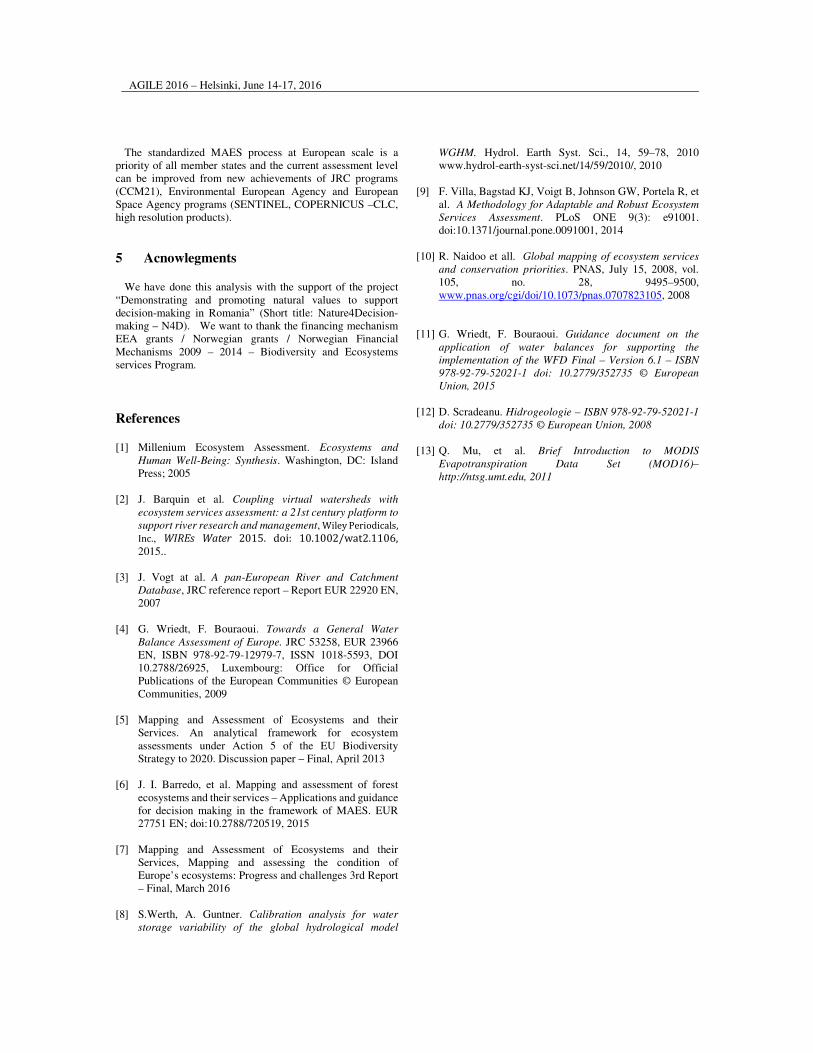
AGILE 2016 – Helsinki, June 14-17, 2016
The standardized MAES process at European scale is a
priority of all member states and the current assessment level
can be improved from new achievements of JRC programs
(CCM21), Environmental European Agency and European
Space Agency programs (SENTINEL, COPERNICUS –CLC,
high resolution products).
5 Acnowlegments
We have done this analysis with the support of the project
“Demonstrating and promoting natural values to support
decision-making in Romania” (Short title: Nature4Decision-
making – N4D). We want to thank the financing mechanism
EEA grants / Norwegian grants / Norwegian Financial
Mechanisms 2009 – 2014 – Biodiversity and Ecosystems
services Program.
References
[1] Millenium Ecosystem Assessment. Ecosystems and
Human Well-Being: Synthesis. Washington, DC: Island
Press; 2005
[2] J. Barquin et al. Coupling virtual watersheds with
ecosystem services assessment: a 21st century platform to
support river research and management, Wiley Periodicals,
Inc., WIREs Water 2015. doi: 10.1002/wat2.1106,
2015..
[3] J. Vogt at al. A pan-European River and Catchment
Database, JRC reference report – Report EUR 22920 EN,
2007
[4] G. Wriedt, F. Bouraoui. Towards a General Water
Balance Assessment of Europe. JRC 53258, EUR 23966
EN, ISBN 978-92-79-12979-7, ISSN 1018-5593, DOI
10.2788/26925, Luxembourg: Office for Official
Publications of the European Communities © European
Communities, 2009
[5] Mapping and Assessment of Ecosystems and their
Services. An analytical framework for ecosystem
assessments under Action 5 of the EU Biodiversity
Strategy to 2020. Discussion paper – Final, April 2013
[6] J. I. Barredo, et al. Mapping and assessment of forest
ecosystems and their services – Applications and guidance
for decision making in the framework of MAES. EUR
27751 EN; doi:10.2788/720519, 2015
[7] Mapping and Assessment of Ecosystems and their
Services, Mapping and assessing the condition of
Europe’s ecosystems: Progress and challenges 3rd Report
– Final, March 2016
[8] S.Werth, A. Guntner. Calibration analysis for water
storage variability of the global hydrological model
WGHM. Hydrol. Earth Syst. Sci., 14, 59–78, 2010
www.hydrol-earth-syst-sci.net/14/59/2010/, 2010
[9] F. Villa, Bagstad KJ, Voigt B, Johnson GW, Portela R, et
al. A Methodology for Adaptable and Robust Ecosystem
Services Assessment. PLoS ONE 9(3): e91001.
doi:10.1371/journal.pone.0091001, 2014
[10] R. Naidoo et all. Global mapping of ecosystem services
and conservation priorities. PNAS, July 15, 2008, vol.
105, no. 28, 9495–9500,
www.pnas.org/cgi/doi/10.1073/pnas.0707823105, 2008
[11] G. Wriedt, F. Bouraoui. Guidance document on the
application of water balances for supporting the
implementation of the WFD Final – Version 6.1 – ISBN
978-92-79-52021-1 doi: 10.2779/352735 © European
Union, 2015
[12] D. Scradeanu. Hidrogeologie – ISBN 978-92-79-52021-1
doi: 10.2779/352735 © European Union, 2008
[13] Q. Mu, et al. Brief Introduction to MODIS
Evapotranspiration Data Set (MOD16)–
http://ntsg.umt.edu, 2011

AGILE 2016 – Helsinki, June 14-17, 2016
1 Introduction
Floods are still considered among the most common natural
disasters in Europe and the adverse impacts associated with
floods are widely estimated to diversify and intensify due to
changing climatic conditions. Flood maps are generally used by
many stakeholders for spatial planning to prevent the build-up
of new risks, reduce existing risks and adapt to changing risk
factors (due to changes in ambient conditions and climate) [1].
Maps prepared in forms of event-, risk- or potential-based
views effectively address priority locations that require further
examination and necessary measures for flood preparedness,
control, mitigation and recovery. For similar needs appearing
in Turkey, the Disaster and Emergency Management
Presidency operating under the Turkish Prime Ministry
published a comprehensive report from the records of disaster
events experienced in the period 1955–2008, where a number
of flood maps are provided for administrative units as well as
major river basins [2]. Right along with the event maps, another
basic type of flood mapping is the flood potential map where a
spatial characterization for floods is depicted through certain
flood related variables (topographic, meteorological,
hydrologic, etc.) by taking no account of most features relevant
to flood hydraulics (runoff depths, velocities, etc.) or flood
event probabilities.
Due to estimated impacts of global warming and the resulting
climate change, intensification and frequency increases for
future floods are greatly foreseen as a primary factor that
governs flood management strategies and orients research
initiatives in the world. This poses new challenges to
researchers, water managers and policy makers at different
scales [3] while requiring thorough understanding and common
consideration of climate change estimations and flood risk
assessments.
The presented study aims at providing a spatial basis for flood
policy orientation in Turkey and is based on a relative
assessment of a number of topographic, hydrologic and
meteorological factors over the catchment units constituting
river basin systems. A typology based on a spatial and multi-
criteria characterization for micro-catchments is revealed with
different flood potentials, which eventually help spatially
exhibit primary areas with notable flood potentials.
2 Data requirements and sources
Generating catchment typologies on river basin systems in Turkey for
setting priorities in flood mitigation
Gülay Onuşluel Gül
Dokuz Eylül University,
Dept. of Civil Eng.,
Buca
Izmir, Turkey
Ali Gül
Dokuz Eylül University,
Dept. of Civil Eng.,
Buca
Izmir, Turkey
Abstract
Floods are still considered among the most common natural disasters in Europe and the adverse impacts associated with floods are widely
estimated to diversify and intensify due to changing climatic conditions. Flood maps effectively address priority locations for further examination
toward flood preparedness, control, mitigation and recovery. They principally help scientific communities in orienting research interests by
allowing case-study selections from threatened areas as well as the involved authorities in making/ implementing flood policies, taking necessary decisions and accomplishing relevant measures for an effective flood mitigation strategy. Flood mapping substantially relies on the availability
of spatial data sources on different components involved in flooding process as well as the accuracy and precision of the data itself. Flood
research in Turkey that mostly concentrates on local case-studies needs upscaling toward geographically wider assessments. This necessitates
generation and use of larger-scale geographic datasets and expanded repositories on topographic, hydrologic, hydromorphologic, hydrographic
and meteorological information. The presented study involves endeavours for obtaining a spatial typology for river basin systems in Turkey for
depicting the ranked priorities in flood assessments. The geodatabase resulted from the CCM initiative by JRC is used as the main spatial object
basis to this end. Despite the analytical strength of the database and concordance with the historically recorded national datasets, spatial
incompatibilities (e.g. faulty hydrologic connections, insufficient bifurcation) in the database for different parts of the river basins are also
discussed. In the very general sense, however, strong needs for continuous improvements in such sources of spatial information are emphasized through recommendations for integrating precise datasets at sub-national and/or national scales.
Keywords: Flood mapping, catchment typology, CCM2 dataset, micro-catchments.

AGILE 2016 – Helsinki, June 14-17, 2016
The CCM2 geodatabase resulted from the Catchment
Characterisation and Modelling (CCM) initiative by JRC [4]
was used as the main spatial object basis in the presented study.
The database holds detailed information on hydrographic
features in European river basin systems starting from the
smallest hydrological units up to larger-scaled agglomerations,
which form parts of bigger river systems and corresponding
drainage catchments. In the study, the smallest possible
catchment units, so-called micro-catchments, were considered
in the analyses with the use of complementary attribute
information such as unit catchment areas, stream ordering and
downstream drainage identification between neighbouring
units.
Information on land use or land cover as proxy to land use
was obtained from the Corine Land Cover (CLC) data sets
generated for the years 2000 and 2006 in Turkey. The required
climatic variables for characterizing catchments were mainly
adapted from two sources. Rainfall depths for standard and
relatively shorter time periods (from less than an hour up to 24
h) were obtained from the Frequency Atlas of Maximum
Precipitation in Turkey [5]. Long-term annual averages of
climate variables, on the other hand, were computed from the
data outputs of a national research project implemented for
contribution to the climate change assessments of Turkish State
Meteorological Service (DMI) [6] (Fig. 1).
Figure 1: Mean annual precipitation based on NCEP/NCAR
reanalysis data in the period 1961-1990.
All dams built with flood mitigation purposes in various
reservoir capacities were extracted from the national database
of the State Hydraulic Works as well as the international
sources of ICOLD (International Commission on Large Dams).
3 Methodology
Priority ranking between catchment units with the final
objective of performing a characterization based on flood
assessment priorities was conducted in the study through a set
of spatial indices derived from topographic, hydrologic,
meteorological and land use-related phenomena.
3.1 Index-based characterization based on relative
catchment characteristics
The indices included the average slope index (S) computed for
individual micro-catchments to represent average terrain slopes
within the corresponding drainage areas, the open spaces (OS)
index expected to represent relative share of non-vegetated and
impervious surfaces which trigger flood occurrence within
catchment units, four other indices (PR, TR, PS, and TR)
representing precipitation and temperature conditions in the
reference period 1961-1990 and the selected scenario period
2010-2039 (Fig. 2), high altitudes share (HA) and temperature
change in high altitudes (TCHA) indices to approximate snow
melting impact on flood conditions in catchments (Fig. 3),
forest cover index (FC) for representing the positive aspect of
flood cover on flooding, reservoir storage index (RES) to
involve the positive contribution of storage reservoirs to flood
mitigation due to their operations, and a separate index (DPR)
for taking account of the rainfall depths for standard durations
(5, 10, 15, 30 min and 1, 2, 3, 4, 5, 6, 8, 12, 18, 24 hrs), which
are estimated to have considerable significance on flood
occurrence due to higher intensities.
Figure 2: Spatial distribution of the reference period
precipitation index at the micro-catchments level.
Figure 3: TCHA index generated for micro-catchments from
the temperature increases estimated at higher altitudes.
3.2 Thematic combination of catchment indices for
spatial characterization
Separate indices generated for the micro-catchments belonging
to larger river basin systems are mainly designed for a generic
typology of the basin systems to reflect the priorities for a more
targeted orientation of potential flood studies in the future.
Each index gives an insight into the local/regional classification
with respect to the specific issue of concern, but individually is
somehow insufficient to reflect the general view especially
when the flood phenomenon with its multi-criteria nature is
considered. To this end, all spatial indices were transferred into
spatial index groups to acquire thematic compositions with
more rational indications on flood priorities (Fig. 4).
As the index components considered in generating the final
distribution of priority catchments were primarily employed to
represent average conditions for various physical, hydrologic,
topographic and meteorological factors in the associated
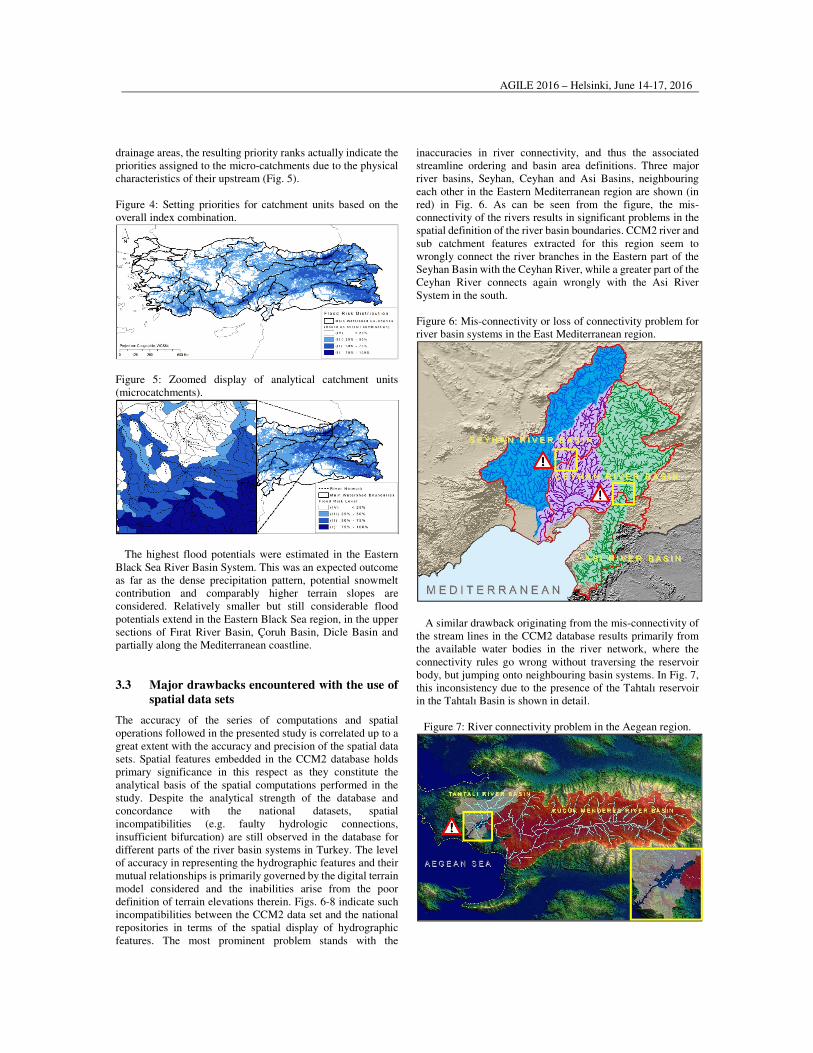
AGILE 2016 – Helsinki, June 14-17, 2016
drainage areas, the resulting priority ranks actually indicate the
priorities assigned to the micro-catchments due to the physical
characteristics of their upstream (Fig. 5).
Figure 4: Setting priorities for catchment units based on the
overall index combination.
Figure 5: Zoomed display of analytical catchment units
(microcatchments).
The highest flood potentials were estimated in the Eastern
Black Sea River Basin System. This was an expected outcome
as far as the dense precipitation pattern, potential snowmelt
contribution and comparably higher terrain slopes are
considered. Relatively smaller but still considerable flood
potentials extend in the Eastern Black Sea region, in the upper
sections of Fırat River Basin, Çoruh Basin, Dicle Basin and
partially along the Mediterranean coastline.
3.3 Major drawbacks encountered with the use of
spatial data sets
The accuracy of the series of computations and spatial
operations followed in the presented study is correlated up to a
great extent with the accuracy and precision of the spatial data
sets. Spatial features embedded in the CCM2 database holds
primary significance in this respect as they constitute the
analytical basis of the spatial computations performed in the
study. Despite the analytical strength of the database and
concordance with the national datasets, spatial
incompatibilities (e.g. faulty hydrologic connections,
insufficient bifurcation) are still observed in the database for
different parts of the river basin systems in Turkey. The level
of accuracy in representing the hydrographic features and their
mutual relationships is primarily governed by the digital terrain
model considered and the inabilities arise from the poor
definition of terrain elevations therein. Figs. 6-8 indicate such
incompatibilities between the CCM2 data set and the national
repositories in terms of the spatial display of hydrographic
features. The most prominent problem stands with the
inaccuracies in river connectivity, and thus the associated
streamline ordering and basin area definitions. Three major
river basins, Seyhan, Ceyhan and Asi Basins, neighbouring
each other in the Eastern Mediterranean region are shown (in
red) in Fig. 6. As can be seen from the figure, the mis-
connectivity of the rivers results in significant problems in the
spatial definition of the river basin boundaries. CCM2 river and
sub catchment features extracted for this region seem to
wrongly connect the river branches in the Eastern part of the
Seyhan Basin with the Ceyhan River, while a greater part of the
Ceyhan River connects again wrongly with the Asi River
System in the south.
Figure 6: Mis-connectivity or loss of connectivity problem for
river basin systems in the East Mediterranean region.
A similar drawback originating from the mis-connectivity of
the stream lines in the CCM2 database results primarily from
the available water bodies in the river network, where the
connectivity rules go wrong without traversing the reservoir
body, but jumping onto neighbouring basin systems. In Fig. 7,
this inconsistency due to the presence of the Tahtalı reservoir
in the Tahtalı Basin is shown in detail.
Figure 7: River connectivity problem in the Aegean region.
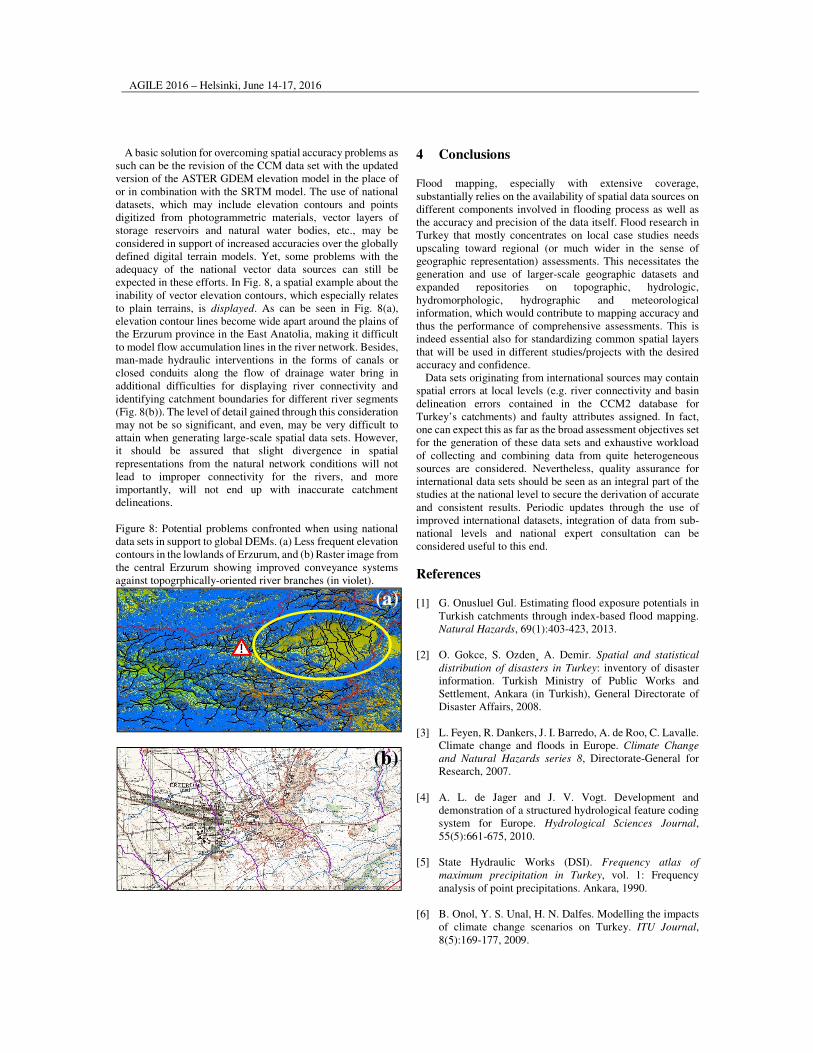
AGILE 2016 – Helsinki, June 14-17, 2016
A basic solution for overcoming spatial accuracy problems as
such can be the revision of the CCM data set with the updated
version of the ASTER GDEM elevation model in the place of
or in combination with the SRTM model. The use of national
datasets, which may include elevation contours and points
digitized from photogrammetric materials, vector layers of
storage reservoirs and natural water bodies, etc., may be
considered in support of increased accuracies over the globally
defined digital terrain models. Yet, some problems with the
adequacy of the national vector data sources can still be
expected in these efforts. In Fig. 8, a spatial example about the
inability of vector elevation contours, which especially relates
to plain terrains, is displayed. As can be seen in Fig. 8(a),
elevation contour lines become wide apart around the plains of
the Erzurum province in the East Anatolia, making it difficult
to model flow accumulation lines in the river network. Besides,
man-made hydraulic interventions in the forms of canals or
closed conduits along the flow of drainage water bring in
additional difficulties for displaying river connectivity and
identifying catchment boundaries for different river segments
(Fig. 8(b)). The level of detail gained through this consideration
may not be so significant, and even, may be very difficult to
attain when generating large-scale spatial data sets. However,
it should be assured that slight divergence in spatial
representations from the natural network conditions will not
lead to improper connectivity for the rivers, and more
importantly, will not end up with inaccurate catchment
delineations.
Figure 8: Potential problems confronted when using national
data sets in support to global DEMs. (a) Less frequent elevation
contours in the lowlands of Erzurum, and (b) Raster image from
the central Erzurum showing improved conveyance systems
against topogrphically-oriented river branches (in violet).
4 Conclusions
Flood mapping, especially with extensive coverage,
substantially relies on the availability of spatial data sources on
different components involved in flooding process as well as
the accuracy and precision of the data itself. Flood research in
Turkey that mostly concentrates on local case studies needs
upscaling toward regional (or much wider in the sense of
geographic representation) assessments. This necessitates the
generation and use of larger-scale geographic datasets and
expanded repositories on topographic, hydrologic,
hydromorphologic, hydrographic and meteorological
information, which would contribute to mapping accuracy and
thus the performance of comprehensive assessments. This is
indeed essential also for standardizing common spatial layers
that will be used in different studies/projects with the desired
accuracy and confidence.
Data sets originating from international sources may contain
spatial errors at local levels (e.g. river connectivity and basin
delineation errors contained in the CCM2 database for
Turkey’s catchments) and faulty attributes assigned. In fact,
one can expect this as far as the broad assessment objectives set
for the generation of these data sets and exhaustive workload
of collecting and combining data from quite heterogeneous
sources are considered. Nevertheless, quality assurance for
international data sets should be seen as an integral part of the
studies at the national level to secure the derivation of accurate
and consistent results. Periodic updates through the use of
improved international datasets, integration of data from sub-
national levels and national expert consultation can be
considered useful to this end.
References
[1] G. Onusluel Gul. Estimating flood exposure potentials in
Turkish catchments through index-based flood mapping.
Natural Hazards, 69(1):403-423, 2013.
[2] O. Gokce, S. Ozden¸ A. Demir. Spatial and statistical
distribution of disasters in Turkey: inventory of disaster
information. Turkish Ministry of Public Works and
Settlement, Ankara (in Turkish), General Directorate of
Disaster Affairs, 2008.
[3] L. Feyen, R. Dankers, J. I. Barredo, A. de Roo, C. Lavalle.
Climate change and floods in Europe. Climate Change
and Natural Hazards series 8, Directorate-General for
Research, 2007.
[4] A. L. de Jager and J. V. Vogt. Development and
demonstration of a structured hydrological feature coding
system for Europe. Hydrological Sciences Journal,
55(5):661-675, 2010.
[5] State Hydraulic Works (DSI). Frequency atlas of
maximum precipitation in Turkey, vol. 1: Frequency
analysis of point precipitations. Ankara, 1990.
[6] B. Onol, Y. S. Unal, H. N. Dalfes. Modelling the impacts
of climate change scenarios on Turkey. ITU Journal,
8(5):169-177, 2009.
(a)
(b)

AGILE 2016 – Helsinki, June 14-17, 2016