2016 benezette township stp wastewater treatment evaluation
TRANSCRIPT

WASTEWATER TREATMENT SITE EVALUATION BENEZETTE TOWNSHIP STP
BENEZETTE TOWNSHIP, ELK COUNTY, PA NPDES #PA0263711
Bureau of Clean Water
June 2016

Benzette Township STP, Elk County Wastewater Treatment Evaluation
PA Dept. of Environmental Protection 1 Bureau of Clean Water
Executive Summary Benezette Township, Elk County, owns and operates a 40,000 gallon per day (gpd) package wastewater treatment facility consisting primarily of Purestream EA activated sludge treatment units that were modified for biological nitrogen reduction. The treatment facility and its collection system were constructed between 2011 and 2013, funded chiefly through the United States Department of Agriculture (USDA) Rural Development which oversaw the development of engineering plans created by Northwest Engineering, Tidioute, PA, which has since been acquired by Stiffler McGraw Engineers. Since its commissioning in 2013, various operational difficulties had come to the attention of the Pennsylvania Department of Environmental Protection (PA DEP,) and violations of the facility’s effluent discharge (NPDES) permit have aroused interest of US Environmental Protection Agency, Region III. Following consultations among DEP regulatory staff and the wastewater technical assistance program (WWTAP,) DEP Operations Outreach Staff evaluated the facility in 2015 and expressed concern regarding operation and maintenance of the facility, noting that during the winter months the facility appears to be under-loaded and then is insufficiently prepared for moderate loading during tourist season that begins in the late Spring and extends through early Fall. DEP Staff referred the facility for in-depth evaluation and process optimization using WWTAP’s specialised monitoring equipment to confirm the conditions he discovered during his initial consultation.
During an instrument-based evaluation of the facility performed by DEP during March and April of 2016, the following operational issues became readily apparent:
During the tourist off-season, approximately from November through April, thetreatment facility is severely under-loaded, as most of the 156 connected usersare not in residence in this mostly seasonal community. This under-loadingcauses the biological treatment system to become inefficient at treatingcarbonaceous and nitrogenous wastes. In addition, sewage remaining un-flushed from the collection system begins to anaerobically decompose, creatinghigh levels of ammonia that increases the treatment burden at the facility.
Underloading of BOD5 and nutrients results in inadequate treatment ofwastewater, with no nitrification occurring and, consequently, little denitrificationeither, as well as potentially excessive nutrient loading to the receiving streamfrom this facility.
During the tourist high-season, approximately from August through October, theBenezette treatment facility experiences peak loading and occasional plantupsets that may result from introduction of septage at local campgrounds, as wellas biomass suppression owing to the dumping of holding tank wastes fromrecreational vehicles and camp-trailers. Although there is an adequately-sizedsurge tank to provide flow equalization and load attenuation, the aerationcapacity of existing equipment is reportedly insufficient to sustain a viablebiomass under high loading conditions. This will be investigated later in 2016.
The small volume of aeration tanks in the treatment train known as B-side maycontribute to a problem of combined floc-shearing due to turbulence whileinadequate oxygenation of the biomass occurs simultaneously. It may be thatthe diffuser system is inadequate of the wide range of facility loadings observed,

Benezette Township STP, Elk County Wastewater Treatment Evaluation
PA Dept. of Environmental Protection 2 Bureau of Clean Water
and more efficient soluble oxygen transfer technology is needed to assure adequate treatment.
The use of air-lift pumps and above-surface discharges for the transfer of return-activated sludge to the designated anoxic mixing zones of the two treatment trains introduces unnecessary turbulence and oxygen to a process which must, by definition, be without residual oxygen in order to function properly. Denitrification of oxidized nitrogenous waste products will not occur under aerobic conditions. It is highly recommended that these air lift pumps be deprecated in favor of motorised electrical sludge transfer pumps supplied with subsurface discharge lines (having appropriate check valves to prevent backflow.) This will assure that RAS remains sufficiently deoxygenated for facultative anaerobic bacteria to denitrify nitrate-nitrogen in the presence of an adequate carbon source.
Likewise, the introduction of raw wastewater to the anoxic treatment zones, that includes an open-ended pipe from the influent splitter box, introduces unnecessary oxygenation to the anoxic zone. The discharge lines from the influent splitter box should occur submerged in the anoxic zone tank, with adequate backflow prevention. (Aeration of the raw wastewater in the surge tank should be sufficient to freshen and mix the contents, but not sufficient enough so as to engender biological activity there and cause malodours.)
High ammonia-nitrogen concentration in raw wastewater may be the result of wastewater decay in the collection system. Benezette Township’s three-year-old collection system is very tight, having virtually no inflow/infiltration. As a result, under hydraulic low-loading conditions, the collection system may have areas where flow is insufficient to move all waste to the treatment plant. Evidence of this may be seen when ammonia-nitrogen accounts for 80% or greater of total Kjeldahl nitrogen.1
The use of erosion chlorinators with calcium hypochlorite in tablet form risks insufficient or excessive chlorination of the effluent, and DEP has suggested replacing this system with a flow-paced sodium hypochlorite pumping system. During the evaluation, staff discovered high chlorine residual during a time of low flow where extra tablets were loose inside the chlorinator box, increasing the exposure of water to the the hypochlorite tablets. Several tablets were manually removed, and additional sulfite tablets were added to the dechlorination stage. Ideally, contents of the chlorine contact tank should have also been pumped over to the surge tank at the head of the plant in order to minimize risk of downstream exposure to a slug of over-chlorinated water.
Potential Remedies:
Chief among the proposals for remedies to underloading is the need to establish an additional source of carbon to maintain the biomass. During the WTE, staff experimented with the addition of simple sugars to the raw wastewater. This was done as a once-daily, bulk loading of about five gallons of neat molasses or ten-
1 Total Kjeldahl Nitrogen (TKN)—a measure of organic nitrogen and ammonia-nitrogen, where the latter usually accounts 30%-50% of TKN.

Benezette Township STP, Elk County Wastewater Treatment Evaluation
PA Dept. of Environmental Protection 3 Bureau of Clean Water
to-twenty pounds of granulated sugar that produced an initial spike in BOD5 loading that attenuated to an average daily additional load of about ten pounds. A long-term, permanent way to introduce the supplemental BOD5 to the system would be to dilute the material into storage vats similar to the un-used phosphorus treatment system and slowly, continuously add it over the course of the day, using metering pumps.
During periods of low flow conditions, such as occur during the tourist off-season, it may be possible to reduce the treatment footprint on B-side from two oxic zones and clarifiers to just one. If each treatment train can independently accommodate up to 20,000 gpd of flow, and B-side can be modified to isolate flow to just one oxic zone / clarifier tank while reducing the volume of the anoxic zone tank, then it may be possible to adequately treat influent flow in just one quarter of the current treatment facility from November through April. To accomplish this, a portable baffle wall should be fabricated so that the volume of the anoxic zone is effectively halved, and isolation valves need be added to process tanks to assure that ¼ of the facility may be operated under these low-flow/low-load conditions.
Provide more robust process monitoring and preventative maintenance programs to improve process control.
Evaluate existing air-lift pumps in use at facility and examine alternatives that will not introduce oxygen into the anoxic zones when transferring material.
Provide facilities for proper introduction of water treatment chemicals and supplemental carbon.
Periodic flushing of parts of the collection system, using water from tank-trucks, will help reduce the occurrence of high ammonia-nitrogen within the sewer lines.
Replace the method of disinfection with a more reliable, flow-paced system. The facility engineer should be asked to evaluate the existing aeration system to
propose enhancements that will o Evaluate improvements to the aeration system to ensure nitrification, o Improve anoxic mixing where denitrification is necessary o Provide for permanent addition of supplemental carbon, o Evaluate the safety and efficacy of the current method of disinfection and
dechlorination These enhancements may entail upgrades to existing equipment to render it more responsive to the disparate range of loading the facility encounters.
Additional observations and recommendations are listed in Attachment D, following. This has been the first part of a two-part study of the existing treatment system. A study of the peak-tourist-season loading and its effects on the treatment facility will occur later this year.

Benezette Township STP, Elk County Wastewater Treatment Evaluation
PA Dept. of Environmental Protection 4 Bureau of Clean Water
Wastewater Treatment Evaluation, March-April 2016: Benezette Township’s wastewater treatment plant is a minor facility which discharges to a stream known locally as Trout Run, located within the Watershed 8-A and designated as a cold-water fishery. The area surrounding Benezette is primarily forested hill country and former strip mines now being reclaimed and rehabilitated. As a consequence of this latter use, the groundwater quality for water well users is quite variable but tends to be non-potable in many areas. What groundwater is mined for householder use does tend to affect the chemical quality of wastewater generated within the collection system; however, the project mission did not include assessments of groundwater samples. Local residents noted that Trout Run water quality had improved significantly since being rehabilitated by the Commonwealth and that it had been polluted with mine drainage for many years. Benezette’s collection system extends through the village of Benezette and includes the Elk County Visitor Center, camp grounds for recreational vehicles, and commercial establishments including restaurants, tourist hotels, a vintner, and a distillery. Of 152 sewer accounts, though, most are for seasonal occupancies. Many of these houses and cabins produce no wastewater during the tourist off-season. Thus, the treatment facility loading varies from about 6 lb./day in late winter to 70 lb./day or more at peak-season, in early September. The STP flow consists of the following unit processes:
Liquid Stream Solids Stream
Coarse Screening
Flow Equalization
Oxic Zone (3)
Anoxic Zone (2)
Integral Clarifier (3)
Erosion Disinfection
Disinfection Contact Tank
Erosion Dechlorination
Sludge Holding Tank
Reed Beds
(Ridgeway STP, alternative)
Municipal Landfill
Volumes of Tanks, gallons: Tank: Train A Train B
Aer1 8,890 4,245Anox 10,252 10,252Aer2 0 4,245
total 19,142 19,142EQT 9,990 0SluHolding 0 7,674Clarifier: 5,185 5,185Contact 0 833De-CCT 0 417

Benezette Township STP, Elk County Wastewater Treatment Evaluation
PA Dept. of Environmental Protection 5 Bureau of Clean Water
Each train has a capacity of 20,000 gpd flow and 34 lb./day BOD5 loading; however, the capacities in Train B are divided across two aeration tanks with upflow, integral clarifiers. This modification permitted the arrangement of flow equalization on Train A and of Sludge Holding and Disinfection processes on Train B. The distribution of aeration (or oxic) zones in Train B will have significance later in this report. A Process Flow diagram in the attachments shows alternate placement of the WTE probes during the evaluation. Initially, the probes were placed in the B-Train processes, while the A-Train was off-line but not out-of-service. In the B-Train, each aeration tank holds 4,200 gallons of mixed liquor typically maintained at MLSS concentration of about 2,000 mg/L.
Figure 1: Benezette STP Process Flow Map
The facility experiences vast loading differences between the tourist season months from June through October and the remainder of the year, when most of the 152 collection system customers’ seasonal residences are vacant. Although designed for an annual average BOD5 loading of 68 lb./day during high tourist season in 2050, during the off-season, when this WTE took place, the average loading was on the order of 7 lb./day. Hydraulic flow changes considerably, also: winter averages were typically 7,000 gpd compared to the 40,000 gpd annual average daily flow envisioned by the designers. The wide differences mean that the facility must have the flexibility to be operated across the entire span of its design and realized loadings. This is presently not the case, as certain inflexibilities hinder the operators’ options and strategies for maintaining effluent permit compliance. Present Conditions: During March and April, actual daily flow average is approximately 6,000 gpd. Organic load from the collection system averages about 10 lb./day. These values are 18% and 16% of design flow and loading. The STP is also designed to remove ammonia-

Benezette Township STP, Elk County Wastewater Treatment Evaluation
PA Dept. of Environmental Protection 6 Bureau of Clean Water
nitrogen, and to biologically reduce nutrients. Nitrate-nitrogen is ultimately reduced to molecular nitrogen, and oxidized phosphorus is typically treated with chemical salts and flocculants to be removed in the solids waste stream. Waste activated sludge is removed from the liquid process to nearby reed beds to serve as growth media. When the reed beds have been established for a long time, oxidized biosolids are removed from the reed beds, along with roots, and sent to landfill for ultimate disposal and burial. At the time of the initial site visit, the operators reported having recently taken part of the process out of service. The secondary treatment process designated “A-side” had been consolidated and wasted to the reed bed. The working treatment train consisted of “B- side,” wherein two aeration zones and integral secondary clarifiers were operating, as was a single anoxic treatment zone. Built in 2012 and 2013, the wastewater treatment facility included a new collection system in the village of Benezette. Inflow/Infiltration is not expected to be a problem; if anything, the new collection system may actually be promoting anaerobic decay due to long retention time inside the very tight sewer lines. To remedy this, it is recommended that the distant parts of the collection system be periodically flushed in order to move detained organic waste to the treatment plant. The facility slowly became active during late spring of 2013, with 2014 being the first year that useful operating data could be collected and analyzed.
Benezette Twp STP: "Immediate" effect of adding 16# sucrose to the aeration tanks: Biological activity increased with concurrent rise in oxygen demand, as seen by depression of the dissolved oxygen residual in Tank B-1.

Benezette Township STP, Elk County Wastewater Treatment Evaluation
PA Dept. of Environmental Protection 7 Bureau of Clean Water
Benezette Twp STP: "Immediate" effect of adding 16# sucrose to aeration tanks. Sugar added to Tanks B-1 and B-2 at about 1310 hrs on March 22. Poor ORP readings reversed almost immediately, with the aeration tank becoming electropositive while the anoxic zone became electronegative. This reversal indicated that (1) nitrification began occurring in the aeration tanks, and (2), denitrification, in the presence of a carbon source, began occurring in the anoxic zone. (Note: for a definitively nitrified mixed liquor, the aerobic ORP should be between +100 and +300 mV. Denitrification under anoxic conditions is ideal at ORP approaching -100 mV but not exceeding -150 mV.)
The most significant finding of the evaluation is that the facility is severely underloaded at this time of the year. The chart below displays the raw wastewater organic loading, expressed in pounds per day of BOD5, for March and April.
Figure : Comparison of March (no Sugar) to April (Sugar) Influent BOD5 Loadings at Benezette Twp.
Measurements of BOD5 included a combination of test results from compliance testing in early March, with data generated through use of a continuous-immersion probe calibrated to BOD5 concentration. During March, the average BOD5 concentration had been 184 mg/L, or 11 lb./day. In April, when operators began adding supplemental

Benezette Township STP, Elk County Wastewater Treatment Evaluation
PA Dept. of Environmental Protection 8 Bureau of Clean Water
organic loading in the form of table sugar and molasses, the average daily concentration rose to 290 mg/L, or 18 lb./day. The minimum average loading necessary to operate one of two aeration trains was calculated at 25 lb./day, based on design data and the 2014 Chapter 94 report.2 The chart shows a design loading range that had not been approached until the supplemental sugars were added to the raw wastewater. Chronic underloading has a number of adverse consequences for an activated sludge treatment system:
The bacteria that perform most of the work of oxidizing wastewater become inefficient at treating what organic waste is available;
The biomass is subject to dominance by filamentous growths, including fungi. The biomass digests itself during a dearth of external organic loading. Nitrifying bacteria do not reproduce in numbers sufficient to treat ammonia waste; Inadequate treatment of wastewater results in passage of untreated organic and
colloidal material to the disinfection tank, interfering with destruction of fecal coliform bacteria there;
Nutrients are not biologically processed; Effluent clarity becomes degraded.
In layman’s terms, the treatment process becomes a large aerobic digester, incapable of treating any new loading. The evaluation discovered many secondary contributors to the inefficient processing of wastewater at this facility:
1. The present aeration system configuration is not flexible enough for operators to transfer compressed air to where it is needed:
a. Aeration headers for both trains should be joined together to allow for more diverse use of the blower capacity;
b. Gate valves are difficult to regulate in a precise manner; in these cases, ball valves may provide the operators with finer control;
c. The use of timers for blower control does not account for variability of organic loading and consequent oxygen demand.
d. Ideally, to enhance BNR, the aeration system would employ continuously-monitoring dissolved oxygen probes to control the output of the blowers, providing both adequate oxygen for nitrification but pacing the output so as to save energy.
2. Use of air-lift pumps to transfer material to an Anoxic treatment zone is counter-productive:
a. Return Activated Sludge (RAS) and Clarifier Surface Scum are both pumped to the Anoxic Zone tank using air lift pumps that introduce oxygen into mixed liquor biomass, hindering the conditions necessary for
2 The design loading at build-out year 2050 is 68 lb./day. The average monthly organic loading in 2014 had been 23 lb./day, and since then, 8 additional EDU were added.

Benezette Township STP, Elk County Wastewater Treatment Evaluation
PA Dept. of Environmental Protection 9 Bureau of Clean Water
facultative bacteria to oxidize ammonia to nitrate in the presence of adequate alkalinity and carbon;
b. Air lift pumps cannot be adequately controlled. There are no fine-tuning scales or gauges on the gate valves to allow operators to set fixed positions. Use of ball valves may be more reliable, but the ideal solution is to replace the air-lift pumps with electric-motor pumps whose output may be controlled using either manual or actuated valves.
3. Any fluids falling through open air into the Anoxic Zone tank will create splashing, thus oxygenating what should be anoxic (oxygen-free) solution:
a. The influent wastewater line to the Anoxic Zone allows water to fall into the tank when it should discharge below the tank surface;
b. Water and scum from the clarifier surfaces fall likewise cascade into the Anoxic Zone tank;
c. Clarifier scuppers on telescoping pipes have been irregularly adjusted, allowing excessive recycling of supernate from the clarifier to return to the first tank in the treatment process, the Anoxic Zone.
4. Aeration diffusers in the Oxic Zone tanks, especially on B-side, may be inadequate for efficient transfer of oxygen while promoting excessive turbulence that promotes floc-shear and settleability problems. A-side’s oxic tank has 50% more diffusers than the combined oxic tanks on B-side. At the MLSS concentration of about 2,400 mg/L, the two aeration tanks in B-side appeared to have good mixing, with heavy roll, but insufficient dissolved oxygen residual when BOD5 load was anywhere from 6 to 18 lb./day. This also suggested that the aeration would be insufficient at design average and peak loads.
5. Sludge Wasting has been inadequate, in that TSS concentration continued to build over the course of the evaluation. There is really no reliable way to account for the amount of sludge wasted from the facility, as there exist neither flow metering for internal processes nor accessible points for gross examination of process flows.3 Process monitoring tests by the evaluator suggested F/M ratio regularly at 0.01, below the averages for extended aeration, with a West Sludge Age of 12 to 15 days when wasting occurs.
a. Sludge wasting was not done every day; b. Operators use an electronic TSS meter to check solids concentrations in
all processes, but they have not regularly recorded this data on the meter or in tabular form where it could be compared using trending analysis;
c. Wasting should be consistent and at least a little every day, as the biomass can age considerably over a 24-hour period;
d. The reed bed may become overloaded with wasted solids during its dormant season, leading to detectable malodors offsite.
6. Process Monitoring has been relatively light at this facility: a. Operators routinely test for Effluent TRC, pH/Temperature, and DO;
Sludge settleability, TSS, and DO in process tanks; Effluent compliance testing for nutrients, organics, and TSS as required by permit;
b. Operators do not appear to have records showing other process monitoring tests such as gravimetric solids for calibrating the TSS probe,
3 Id est, “bucket and stopwatch” method of measuring flows

Benezette Township STP, Elk County Wastewater Treatment Evaluation
PA Dept. of Environmental Protection 10 Bureau of Clean Water
microscopy, oxygen uptake rate, or spot checking for ammonia, nitrate, mixed liquor pH, alkalinity, or other nutrients.
c. Without regular testing, it is not possible to track standardized measures of treatment performance such as Sludge Age, Mean Cell Residence Time, or Food-to-Mass Ratio, which make possible process optimization and treatment efficiency.
7. When idling and restarting one of the two process tanks (A-side or B-side,) good management practice suggests that the idle tank be emptied eventually of its biosolids and that those biosolids be properly disposed.
a. The idled tank’s mixed liquor should be permitted to auto-digest itself for a few days, followed by deaeration and then decanting of supernate.
b. Decanted supernate should be returned to the head of the plant for treatment.
c. The idle tank, when empty, should be cleaned and inspected first, then refilled with treated effluent to at least cover the air diffusers that should be aerating at a reduced rate to provide mixing and freshening. The tanks should be filled no more than 70% of capacity.
d. When the idle side is returned to service, it should be progressively seeded using activated sludge from the active treatment unit, and the wastewater flow should be restarted gradually and at an increasing rate as the activated sludge concentration rises to its preferred set-point.
e. In no circumstances should inadequately-treated effluent from the idle-then-restarting process be directly discharged to the disinfection tank; rather, it should be further processed through the other process tanks or returned to the head of the plant. (see Chart 13 in Attachment H for a reason not to simply discharge water as effluent from a long-idle treatment train.)
Maintenance of Facility
1. Because the main treatment processes at Benezette Township STP are steel tanks, additional maintenance tasks are needed to preserve functionality. The tanks appear to have epoxy coating to protect against corrosion; however, small places where the finishes have become worn or impacted are developing corrosion. The galvanized railings and walkways also are becoming corroded in spots. These will require grinding, sand-blasting, and refinishing.
2. Each train has several grounding wires attached, but some connections have broken due to wear or impacts and should be repaired.
3. Loose fittings on electrical conduit or junction boxes should be repaired. 4. Waste oil should not be permitted to overflow containment onto surrounding soil.
The waste oil collection and storage area should be improved by providing protective cover over waste containers, along with spill protection. Oil containment and spill remediation kits should be available nearby the collection station.

Benezette Township STP, Elk County Wastewater Treatment Evaluation
PA Dept. of Environmental Protection 11 Bureau of Clean Water
5. Air compressors and pumps appeared to be in working order, but the aeration output was insufficient to nitrify ammonia, and this could be due to accumulation of debris around the diffusers.
6. The screening of raw wastewater entering the treatment process at the Surge Tank could be improved by using a finer screen than what presently exists, as trash and detritus will accumulate downstream, damaging or clogging pumps, diffusers, valves, and mixers. Some non-natural detritus had been observed on the stream bank beneath the facility outfall.
7. Occasionally, the surge tank may be a source of malodours, especially during warm, stagnant weather. If malodours off-site rise to the level of public nuisance, it may be beneficial to cover the surge tank and (possibly also) filter the air leaving the tank.
8. The reed bed was dormant in March and April; however, operators continued to load it with wasted sludge, so that when the weather became warmer, odors emanated from the bed. The reeds did not begin growing until late April or early May.
9. The use of framed plywood covers to preserve heat in the active treatment train during winter has been successful. Operators may wish to build upon this by creating more permanent covers for the tanks, to be used only during winter months. For the remainder of the year, addition of bird netting will help prevent birds from becoming entrapped in the oxic and anoxic treatment zones. Drowned birds can temporarily obstruct the air lift pumps.
10. Yard lighting was not working after dark. Photocell controls were malfunctioning, and there are no manual controls. The operator reported that these had not been functional for awhile.
11. A preventative maintenance plan and an asset management plan (which also encompasses financial planning for equipment replacement) is highly recommended for this facility. The original equipment manufacturer (OEM) manuals provide the basis of a preventative maintenance program, but the tasks associated with them should be posted on a calendar schedule and rigorously observed by the operators and township staff. Many asset management and planning tools are available through US EPA, PA DEP, PRWA, engineering consultants, and the commercial market.
Additional observations and recommendations are listed in Attachment D, following. The overall recommendation of this study is that the owner of the facility should engage its consulting engineer to evaluate improvements to the aeration system to ensure nitrification, improve anoxic mixing where denitrification is necessary, provide for permanent addition of supplemental carbon, and evaluate the safety and efficacy of the current method of disinfection and dechlorination. This has been the first part of a two-part study of the existing treatment system. A shorter study of the peak-tourist-season loading and its effects on the treatment facility will occur later this year, in late September through mid-October.

Benezette Township STP, Elk County Wastewater Treatment Evaluation
PA Dept. of Environmental Protection 12 Bureau of Clean Water
Discussion of issues found during WTE:
During the tourist off-season, the facility is seriously under-loaded. Lack ofconstant influent BOD5 and micronutrients results in deterioration and death ofthe activated sludge biomass, turning the facility into a large aerobic digester,resulting in operational problems when there is insufficient healthy biomass toprocess the waste that is generated in the community.
Supplemental sources of biodegradable carbon will have to be found in order tomaintain the activated sludge microbiology during periods when the collectionsystem’s waste stream is inadequate. We have recommended sourcing simplefood-manufacturing wastes as a possible source for providing the extra organicloading that is needed. Operators should have at least one active source andone alternate source of supplemental carbon.
As presently configured, the operators are unable to maintain an adequatedissolved oxygen residual in the aeration tanks during periods of normal and highBOD5 loading. The recommended range for DO residual for activated sludge, inoxic conditions, is from 1.5 mg/L to 4.0 mg/L oxygen. Anything above 4.0represents wasted electrical energy, and below 1.5, there is insufficient oxygen todrive the treatment process, maintain life, and nitrify ammonia wastes. Ideally,the PD blowers would be controlled by in-line DO probes providing feedback tovariable speed drives.
The high ammonia-nitrogen in the wastewater suggests that anaerobic biologicaldecay of the wastewater is occurring within parts of the collection system. This isprobably due to the new, tight condition of the recently constructed pipes. Sincethere are no available sampling and test results for ammonia-nitrogen and TotalKjeldahl Nitrogen for the raw wastewater, we are unable to confirm this; however,if samples were to be tested, an indication of such decay would be that theammonia-nitrogen value is very close (above 77%) of the TN value. This wouldindicate that periodic flushing of problem areas in the collection system should beperformed, to send decaying waste to the treatment facility for proper disposal.
Residents in the community have told DEP Staff that during the tourist season (summer/autumn,) malodors are an occasional nuisance in the village. Although during the winter off-season, malodors were not readily apparent, such malodors could have their source in the aerated surge tank at the treatment facility. Further investigation would have to be completed in order to validate these claims. Were malodors a common problem, one recommendation for remedy would be to cover the equalization tank and filter the air coming from the tank. The Township’s engineer would likely need to study this problem and develop a solution.
Overloading of the reed bed may be another likely source of malodors. Duringwinter and early Spring, when the reed bed is dormant, only a limited amount ofbiosolids may be disposed there. Biosolids stored in the reed bed when thereeds are dormant will begin to smell bad once the warmer weather arrives. Thefacility operators should have at least one alternative place to dispose ofbiosolids during the tourist off-season, preferably a neighboring facility, but theywill need the necessary budgeting and funding to do so.

Benezette Township STP, Elk County Wastewater Treatment Evaluation
PA Dept. of Environmental Protection 13 Bureau of Clean Water
When supplemental carbon was provided to the treatment facility during the evaluation, in the form of sucrose or molasses, the biological activity in the plant improved, although nitrification was still insufficient. One reason for this was that, with the plant receiving adequate BOD5, the DO residual in the aeration tanks remained below 1.5 mg/L for much of the time. This meant that the biomass could not sufficiently metabolize some of the carbon, and most of the ammonia-nitrogen, into benign waste products. The operators noted that they could explore modifications to the existing PPD blowers, such as adding a cross connection to permit using more than two blowers for the operational train, adding more or fine-bubble diffusers to the oxic zones, or changing the pulleys and shims on the blowers.
pH and alkalinity of the activated sludge biomass appeared to be adequate for biological nutrient removal; however, during the winter months, nitrification typically fails due to low water temperatures. The operators successfully covered the reactor tanks during the last winter, preserving much of the water temperature and preventing excessive freezing, but during March and early April, the water temperature in the reactor tanks remained blow the critical 10-degrees Celsius (50 F,) so nitrification likely remained inhibited. We commend the operators on covering the process tanks to maintain water temperature.
During the course of the evaluation, it became apparent that the operators do not routinely perform the full battery of process monitoring tests available to them, thereby missing opportunities to proactively employ process control measures to avoid facility upsets and permit excursions. The operators routinely perform the required compliance tests: daily pH, DO, and chlorine residual testing of the effluent. They also routinely perform 30-minute settleability tests, dissolved oxygen and suspended solids monitoring by probe and meter. However, there is no apparent record of calibration of the solids probe against the “gold standard” mixed-liquor suspended solids (MLSS) gravimetric test. While it has been reported that the probe and meter have been compared favorably in use at other facilities, without records of calibration, the numbers generated are only partially reliable.
The operators do not track the facility’s solids inventory. Solids inventory is a measure of the total amount of biologic solids at work within the treatment tanks, combined with analytical measure of the amount of solids wasted from the facility on a regular basis. Because of the presence of the reed bed, operators do not have to routinely report biosolids removed off-site. However, this leads to a bad operational habit of reporting only the time (in minutes) that wasting occurred, with a concurrent estimate of the liquid volume. The operators cannot definitively match their solids production with solids disposal to the satisfaction of the regulatory agency. A better method requires determining the waste solids by volume or by weight, developing a process control strategy based on Mean Cell Residence Time (MCRT,) solids retention time (SRT,) or Food-to-Mass ratio (F/M,) where records are maintained for the amount of solids in treatment, the amount of solids wasted regularly from treatment, the amount of solids sent to the reed bed after digestion/holding/decanting. The facility’s Municipal Wasteload Management (Chapter 94) Report notes that only 33% of the solids

Benezette Township STP, Elk County Wastewater Treatment Evaluation
PA Dept. of Environmental Protection 14 Bureau of Clean Water
projected to be generated, based on the loadings reported for the year just ended, are accounted for. The regulatory agency can only guess what the solids generation is at this facility, and such guesswork leads inevitably to suspicions about “missing solids” or solids lost to the receiving stream from malfunctioning secondary clarifiers.
Occasionally, the operators employ the use of granulated polymers as settling aids in the secondary clarifiers. However, during the evaluation, it had been observed that the polymer is simply being sprinkled into the reaction vessels without first wetting it and allowing it to “age” prior to use. The end result of this is that the polymer’s efficiency is greatly reduced and much of it is wasted. Dry polymer is best wetted, diluted, mixed, and aged overnight before it is ready to distribute within the reactor tanks. The polymer chains must be given a chance to unwind in order to expose the charged parts of the molecules to the activated sludge bacteria to help it to coagulate and settle. The very common mistake of operators statewide is to fail to follow the manufacturer’s directions for use.
Wastewater Treatment Evaluation
Department of Environmental Protection Bureau of Water Standards and Facility Regulation
Attachments
Attachment A—Program Description .............................................................................. A-1 Attachment B—WTE Team ............................................................................................ B-1 Attachment C—Plant Description and Treatment Schematic ......................................... C-1 Attachment D—On-site Process Monitoring and Control ............................................... D-1 Attachment E—Equipment Deployed ............................................................................. E-1 Attachment F—Equipment Placement Photos ............................................................... F-1 Attachment G—Trending Charts .................................................................................... G-1 Attachment H—Continuous Digital Monitoring Charts (Examples) ................................. H-1 Attachment I—Example Process Monitoring Data / Charts .............................................. I-1 Attachment J—NPDES Permit Limits .............................................................................. J-1 Attachment K—Recommended Process Control Tests, Observations, Calculations ..... K-1 Attachment L—Anoxic Tank Baffle Wall .......................................................................... L-1

Wastewater Treatment Evaluation
Department of Environmental Protection A-1 Bureau of Clean Water
Attachment A—Program Description
Description and Goals: As part of an EPA-sponsored grant, the DEP has created a Wastewater Technical Assistance Program (WWTAP) to enhance surface water quality by improving sewage treatment plant performance beyond that expected by existing limits of the plants’ National Pollutant Discharge Elimination System (NPDES) Permits. The goal of this program is to encourage wastewater treatment facilities to voluntarily produce higher-quality effluent than mandated by the limits set in their NPDES permits and to optimize treatment in such a way that reduces nutrients entering surface waters to impact water uses downstream. DEP will conduct Wastewater Technical Evaluations (WTEs) to assist municipal wastewater systems in optimizing their wastewater treatment plant processes as part of the WWTAP. Each evaluation is expected to last up to 2 months. Process Optimization:
Purpose of Optimization: Set production goals as if running the process were an industry that makes a product: clean water and usable biomass.
Goal-Setting: Voluntary meeting of limits that are better than the minimum required limits in the permit in order to reduce nutrient loading to downstream water uses.
Action Items: Break down optimization tasks into various activities or adjustments that should be done to improve routine operation.
This program is not part of the Field Operations, Monitoring, and Compliance Section. Sample collection methods utilized during this evaluation generally do not conform with 40 CFR Part 136, therefore the data collected will not be used, and in some cases is not permitted to be used for determining compliance with a facility’s effluent limits established in its NPDES permit. Data collection is for programmatic uses only. Wastewater Technical Evaluation:
Department staff will consult with the plant operators to explain the program, the goals, the equipment used, and the expectations for participation.
Upon arrival at the wastewater plant, Department staff will set up equipment, including meters capable of continuous, in-line monitoring for pH, Oxidation-Reduction Potential, Ammonia, Nitrates, Dissolved Oxygen, and other parameters.
The Department will utilize the equipment to gather data on system performance, show the operator how to gather similar data, and explain the value of gathering the data. We’ll also explain how operators could choose to modify their treatment processes based on interpretation of the data collected.
Although the Department may show operators how to achieve effective process control by using these process monitoring tools, the operators will continue to

Wastewater Treatment Evaluation
Department of Environmental Protection A-2 Bureau of Clean Water
make all process control decisions, in conformance to their licensing requirements, and retain responsibility for those changes.
The Department will also lend the facility additional laboratory equipment which will remain on site during the WTE to assist in data collection and interpretation.
During this time, the operator may need to spend more time performing routine testing at the treatment plant than was done previously. This will allow correlations to be made between process modifications and the process response.
One major goal of the program is to provide the operator with the process monitoring knowledge and experience necessary to gather useful data and utilize it to make beneficial changes in the treatment process and the receiving stream long after the Department and its equipment have been removed.
There is no charge for the Department’s review of the treatment process, setup of all equipment, the process control monitoring that will take place, lending meters to the plant during the WTE, data collection and explanation of potential effects that process modifications can have on the treatment process.
The municipality will be responsible for providing laboratory bench space and 120 VAC / 20 amp power for the instrumentation. Any costs associated with process modifications (such as equipment upgrades, chemical purchases, etc.) that the municipality deems appropriate and beneficial as a result of the WTE remain the responsibility of the municipality.
The Department and the participating municipality reserves the right to cease participation in the WTE at any time.
Following the equipment set-up, the Department will observe the facilities and review operational practices, treatment processes, chemical treatment, operational data currently collected, and overall system performance.
During the evaluation, the Department will review monitoring records, laboratory sheets, operations log sheets, and any drawings and specifications for the treatment facility. Also of interest is data currently collected and how it is utilized for daily process modifications. This information is usually available from existing reports.
Program evaluation team will consist of 1 to 2 people: Water Program Specialists that have been PA licensed as wastewater plant operators, with operations and compliance assistance experience. Potential Benefits:
Use of online process control monitoring equipment during the WTE, use of hand held meters and portable lab equipment during the WTE, and furthering the operators’ knowledge of process control strategies and monitoring techniques,
Producing a cleaner effluent discharge which minimizes impacts to the environment and downstream water users, and possible identification of process modifications that could result in real cost savings.
Where the optimization goals may be more stringent than current requirements of your NPDES permit, they are completely voluntary. The WTE objective is to optimize wastewater treatment plant performance in order to enhance surface water quality, minimizing the effects of nutrient loading to downstream water uses.

Wastewater Treatment Evaluation
Department of Environmental Protection A-3 Bureau of Clean Water
Furthermore, pursuit of a good report by the WTE program may place the wastewater system in a better position to meet more stringent regulatory requirements in the future, should they occur. For example, regulatory changes over the last ten years have reduced the final effluent Total Chlorine Residual limits requiring dechlorination or optimization of treatment processes to reduce the levels of chlorine added to the process for disinfection. Facilities who have voluntarily maintained lower residuals than listed in their permit have found it easier to comply with the updated regulations.
Potential Obstructions to Success Many factors may present obstructions to a successful plant optimization. Some of these are listed below:
Inadequate use or interpretation of regular process monitoring test results Inadequate funding of facility operating expenses, including staff training, chemical
and energy usage, equipment maintenance Miscommunication as to program goals and methodologies Obsolete, inadequate, or outdated treatment equipment and methods

Wastewater Treatment Evaluation
Department of Environmental Protection B-1 Bureau of Clean Water
Attachment B—WTE Team
WTE Team
Marc Neville, Water Program SpecialistDEP- RCSOB 400 Market St Harrisburg, PA 17105 717-772-4019 eml: [email protected]
Thomas Brown, Water Program SpecialistDEP – Cambria Office 286 Industrial Park Rd Ebensburg, PA 15931 814-472-1819 eml: [email protected]
Wastewater Treatment Plant Representatives, PA0263711
Wes Lape, Operator, 268880 Benezette Township 105 Schoolhouse Road PO Box 10 Benezette, PA 15821
Tel: 814-787-4723 Fax: 814-787-8811 Eml: [email protected]

Wastewater Treatment Evaluation
Department of Environmental Protection C-1 Bureau of Clean Water
Attachment C—Plant Description and Treatment Schematic

Wastewater Treatment Evaluation
Department of Environmental Protection C-2 Bureau of Clean Water

Wastewater Treatment Evaluation
Department of Environmental Protection C-3 Bureau of Clean Water
Notes:
1. The facility is composed of two (2) PureStream model PES-20, twenty-thousand gallon per day (20,000 gpd,) prefabricated and partitioned steel treatment tanks (trains,) configured to accommodate a 7,674-gallon flow equalization (surge) tank in Train A and an 833-gallon disinfection contact tank in Train B. The
2. Submersible pumps located in the surge tank drive wastewater flow to an inflow splitter box where flow distributes to to the anoxic zones of each train. These anoxic zones are located centrally in each train.
3. The aeration tanks (oxic zones) of each train accommodate approximately 8,900 gallons of activated sludge. The anoxic mixing tanks are each 10,252 gallons of capacity. The integral upflow clarifiers in each oxic zone tank hold approximately 5,190 gallons per train.
4. A-train consists of a single oxic/clarifier tank. B-train has two each oxic/clarifier tank, each having capacity of 4,445 gal. / 2,600 gal.
5. Aeration is provided by four positive displacement blowers. 6. Return and Waste Sludge flows are driven by air lift pumps that are manually
adjusted using gate valves. 7. Return sludge from clarifiers re-enters each train at the anoxic tank, through the
use of air-lift pumps. 8. Waste sludge is sequestered in a sludge holding tank located in B-train, after
which it is pumped to a nearby reed bed. The reed bed has not yet reached capacity where it would have to be cleaned out. (Ultimate destination following clean-out would be to sanitary landfill.)
9. Effluent is disinfected using erosion tablets of calcium hypochlorite and detained in an 830-gallon contact tank prior to dechlorination using sulfite tablets.
10. The outfall is external to a site perimeter fence and enters Trout Run, located in State Water Plan watershed 8-A, classified for Cold Water Fishes, aquatic life, water supply and recreation. It is located beside a pedestrian bridge near the state road.
11. The ultimate fate of discharged effluent is to enter the Susquehanna River Basin, making the facility subject to Chesapeake Bay Nutrient Management Program. Facility production limits are noted in Appendix L.

Wastewater Treatment Evaluation
Department of Environmental Protection D-1 Bureau of Clean Water
Attachment D—On-site Process Monitoring and Control
Benezette Township owns and operates a small-flow nutrient-reducing aeration package wastewater treatment plant servicing the village of Benezette and businesses and a campground immediately nearby in the township. The facility is currently rated for 0.040 MGD and became operational in midyear 2013.
Outfall 001 discharges to Trout Run, located within state watershed plan 8-A, part of the West Branch Susquehanna River. Flow subsequently enters the Chesapeake Bay.
Performance Evaluation: In March, upon referral from DEP regional and Central Office staff, the Wastewater Technical Assistance Program (WWTAP) arrived on site and set up equipment for continuous monitoring of various qualities of the mixed liquor in one of the two treatment trains. Probes were placed in Train B and included the materials listed in Attachment E. The data generated by those probes is graphically represented in Attachment G.
A portable wastewater lab was established inside the office and maintenance building that also contains a small laboratory bench. This lab equipment was lent to the facility’s operators for their use during the on-site activities period and was also used by DEP staff to calibrate the in situ probes and supplement data to characterize the facility’s operations and efficiency. Examples of bench testing data are included in Attachment I.
Standard sample points included the following: Raw Wastewater (INF) sampled at the inflow splitter box downstream of the surge tank and bar rack, Mixed Liquor from the two treatment trains, the Return/Waste Sludge from the clarifier floor, and the Clarifier Supernatant, taken prior to disinfection, and Final Effluent (EFF) as discharged to the plant outfall. Test data from these sampling points provided a baseline operational diagnosis and then also assessed any improvements due to minor process changes and adjustments.
Evaluation Notes: On January 22, 2016, DEP regional inspector and central office outreach staff recommended that the Benezette Township’s new wastewater treatment plant be referred to the Wastewater Technical Assistance Program (WWTAP) for evaluation and for possible training of the operator. The facility has been in operation since April 2013 and was recently built along with its collection system that serves a population of approximately 207 people living in one of the more remote counties of the Commonwealth. Benezette is a 40,000 gallon per day (gpd) extended aeration activated sludge facility operated as a set of dual-train, 20,000 gpd each, Purestream EA package plants which are self-contained extended aeration units modified for denitrification using the MLE process. On March 1, 2016, DEP stff met with owners, operators, and inspector at the Benezette STP and proposed a six-week study to evaluate the operation and to consider possible

Wastewater Treatment Evaluation
Department of Environmental Protection D-2 Bureau of Clean Water
remedies for the chronic underloading and its effects on performance and permit compliance. He was accompanied by the regional DEP facilities inspector for Elk County.
An initial survey of the facility, employing dissolved oxygen (DO,) Oxygen Uptake Rate (OUR,) and microscopy confirmed the effects of chronic underloading, where biological activity was severely compromised by lack of food and the activated sludge biomass had been digesting itself. Evidence of pronounced lack of indicator organisms and flat oxygen uptake rate of the biomass, supplemented by nominal chemical oxygen demand concentration of the raw wastewater, confirmed the initial diagnosis.
DEP staff returned to the site on March 8 and 9 to install continuously-monitoring equipment in the form of a mini-SCADA with eight digital ion probes. The mini-SCADA became operational on March 9 and established background data for what is termed the “off-season low loading conditions.” Over the course of the following seven weeks, DEP Staff visited the site two days per week while suggesting adjustments and compensations to the existing system, in an effort to improve effluent quality. The chief improvement for the under-loaded facility was the addition of molasses sugar and/or sucrose to the raw wastewater influent, which boosted the BOD5 strength from an average of 190 mg/L to approximately 300 mg/L and increasing daily loading from about 7.5 lb./day to 23 lb./day, sufficient for operating one of the two treatment trains. Additional recommendations centered on improving aeration capacity at the oxic treatment zones, reducing oxygen introduction into the anoxic treatment zones, and improving the quality of process monitoring testing so as to develop hard data on wasting rates, sludge production, and treatment strategies.
DEP deployed a set of process monitoring and probe calibration laboratory equipment with its SCADA installation. Facility staff were encouraged to make use of the lab while it was available in order to see for themselves the benefits of performing increased process monitoring.1 The components of the portable lab were listed in Attachment E, with a justification for testing included with a minimum recommended schedule in Attachment K. It should be noted that when an activated sludge process is in upset or recovery from upset, and if major adjustments are made to the process, the frequency of process monitoring increases. For example, increased surveillance would be necessary when the process shifted from B-side to A-side in mid-April.
DEP staff visited the site two shifts per week through April 27. One of those days was usually dedicated to performance of process monitoring tests; the other, to instrument maintenance and calibrations, if necessary. A sample of test results is displayed in Attachment I, with some of the time trends displayed in Attachment G. Full tests were performed on 3/23, 3/30, 4/11, 4/12, 4/19, and 4/26. Spot checks of DO, Temp, pH,
1 WWTAP differentiates between Compliance Testing, which generally applies to sampling and testing of effluent for the purpose of NPDES Permit compliance, and Process Monitoring, which includes a wider universe of tests used to monitor the relative health and efficiency of the activated sludge biomass and to survey effluent production quality beyond that which is required in the permit (for example, total phosphorus testing; mixed liquor suspended solids; etc.)

Wastewater Treatment Evaluation
Department of Environmental Protection D-3 Bureau of Clean Water
solids by meter, TRC, and sludge bulking (triple-settleometer) were performed additional times as necessary. No sampling or sample splitting was performed for the purposes of compliance testing. Therefore, the WTE study protocol did not examine effluent quality quantitatively beyond spot-checking chlorine and nutrient parameters relative to probe performance. Qualitative checks of effluent quality were made every time DEP was on site, including examination for DO residual, pH, alkalinity as CaCO3, color, and/or turbidity. On one occasion, when the facility had experienced sustained low flow, high TRC was discovered and reported to the operator for further testing and management. Approximately five additional chlorine tablets were discovered to be “loose” in the erosion/contact chamber, and plant staff removed them and also replenished the dechlorinator. It is believed that replacing the erosion chlorinator with a metered sodium hypochlorite solution, already in the proposal stage with the Township, will prevent recurrence of this particular type of event. The WTE also included checks of the actual outfall at the receiving stream. This outfall is located beside a pedestrian walkway bridge, closer to the road frontage of the township property (old schoolhouse) than to the final internal sampling point in the wastewater treatment facility. The long run of gravity outfall line may hinder the retention of dissolved oxygen in the effluent; however, at the present flow rate, impacts on the receiving stream were nil. At the receiving stream, a small amount of non-degradable detritus was observed below the outfall pipe. (Photos 17 & 18, Attachment F) It is believed that improved screening of the raw wastewater entering the surge tank at the plant will prevent this material from passing through the treatment process. The time trends in Attachment H show some of the parameters monitored through continuous immersion probes. Chart 6 displays the dissolved oxygen residual during March, where between 3/16 and 3/20, two aeration blowers were in service, one running constantly and the other on timed intervals, creating a jagged pattern. DO residual is best maintained within a range of 1.5 mg/L through 3.5 mg/L: any measurement below 1.5 suggests insufficient oxygenation of the biomass, and any measurement above 3.5 essentially represents wasted energy. After 3/20, the DO residual settled into a slump at or below the 1.5 threshold, where nitrification of ammonium waste was not likely to occur. This is supported by evidence from the ammonia probe in the clarifier, chart 5, where the residual ammonium concentration was about 20 mg/L to 30 mg/L on a consistent basis. An ultraviolet spectrophotometric probe was placed in the influent splitter box to measure the organic concentration of the raw wastewater. During March and early April, the average BOD concentration was 184 mg/L (c. 11 lb./day,) prior to the addition of supplemental sugars. After supplementation began, the average concentration jumped to 290 mg/L (18 lb./day) with average flow rate of 7,300 gal./day. Flow is shown in Chart 1, Attachment H, for January through April. A daily maximum of almost 30,000 gpd occurred in January that may be related to draining one of the process

Wastewater Treatment Evaluation
Department of Environmental Protection D-4 Bureau of Clean Water
tanks; however, for the period, the average flow was only 7,800 gpd where twelve days had flows under 5,000 gpd, and the next highest maximum occurred in April, at 15,600 gpd. The operators commented that low flow, relative to the design flow of 40,000 gpd, was due to the high off-season vacancy rate, combined with a general reluctance of the permanent population to use their well water. Once operators began adding sugar and molasses to the surge tank, the demand on the activated sludge improved. Chart 7 in Attachment G shows the effect of improved BOD loading on the oxidation/reduction potential of the biomass in the oxic and anoxic zones. Prior to sugar addition on March 22, the ORP of the oxic tank was actually lower than that of the anoxic tank. Although both tanks showed ORP below the ideal oxic range of +150 mV, oxic ORP should be higher than anoxic ORP. The ideal limits for this parameter are: Oxic over +100 mV, anoxic between +100 mV and -100 mV, and anaerobic from -150 mV to -300 mV. The improvement meant that the anoxic zone could actually function to denitrify the nitrates in the water; however, lack of sufficient oxygen in the oxic zone meant that nitrification of ammonia could not effectively occur. pH as reported by the operators and measured during the study averaged 7.7 s.u., with a minimum effluent near 6.5 and a maximum of 8.2. For effective biological nutrient control, it is recommended that pH be maintained within the 7.5 to 8.0 range. A twelve-day period in March occurred where pH had been below 7.0 s.u. To maintain pH within an effective BNR range, operators typically add alkalinity to assist in nitrate formation. Most common is the use of powdered lime or quicklime. Alkalinity may be improved by using liquid magnesium hydroxide, which can be metered at a constant minimum feed rate to assure that proper alkalinity is maintained while attenuating any pH variations. Chart 14 displays the biomass concentration, measured as total suspended solids, for April. While B-side was in service, the solids gradually rose to 2,400 mg/L in response to the supplemental carbon addition; however, sludge wasting did not keep up. Solids are typically maintained at a higher concentration during the winter months, because cold temperatures inhibit treatment. The target value had been 2,200 mg/L. The operator suggested a concentration of 1,700 mg/L for late Spring and Summer. The wasting of sludge appeared to be limited by the capacity of the sludge holding tank and the reed bed. Hauling sludge offsite for further treatment had been limited by budget concerns. Unfortunately, by late April, it appeared that the reed bed was becoming overloaded, with malodors being the consequence. By mid-April, sludge settleability was deteriorating, and effluent quality was suffering, so the decision was taken to restart A-side and shut down B-side. The digested solids in A-side were supplemented with living biomass from B, attaining a concentration of 1,700 mg/L toward the end of the evaluation. Chart 13 shows a large spike in effluent nitrate around 4/20. This was the result of flushing digested supernate from A-side to the effluent outfall during the restarting of A-side. Usually, the nitrate concentration at Benezette was at or under 5 mg/L. This was because nitrification was not occurring, not because the biomass was denitrifying. Conventional treatment plants typically produce effluent nitrate concentrations of 30-35

Wastewater Treatment Evaluation
Department of Environmental Protection D-5 Bureau of Clean Water
mg/L following thorough nitrification. Facilities having effective BNR denitrification have nitrate residuals under 5 mg/L. During the final week of the evaluation, the operators decided that, based on the evidence that aeration and nitrification had not improved during the previous month, A-side should be restarted and B-side idled. One of the reasons for this is that the aeration tank on A-side contains 50% more diffuser capacity. A-side had been taken off line in early March, and during the evaluation, it operated as an aerobic digester and sludge holding tank. Some solids had been wasted to the reed bed, but most of the material that remained had become inert. On restarting A-side, the operators and DEP staff transferred sufficient solids from B-side to bring MLSS to a proposed target concentration of 1,700 mg/L, seeding the process. Raw wastewater addition overnight began to displace the “digester supernate” from the clarifier, and this slug of water passed through the disinfection treatment and to the receiving stream. Testing and chart 13, described above, showed that nitrate concentration was high while ammonia levels had been reduced. The evaluation ended before the biomass became stabilized on A-side, but the early indications were that nitrification would not improve until the aeration deficiencies were resolved. Under more ideal conditions, it is recommended that deactivation / reactivation of one of the treatment trains be better managed. Following are some suggestions for future reference:
1. When deactivating one of the two treatment trains, the idle process units should be aerated for a few days to encourage autodigestion of the existing biomass;
2. Following a short digestion period, the idle side should be deaerated and solids be permitted to settle overnight;
3. After settling, most of the solids should be transferred to sludge holding or to the reed beds, should capacity allow, or removed from the site by transfer to another facility for treatment and disposal;
4. Supernate remaining in the idle process unit should be pumped to the surge tank as space permits, and the water treated through the working treatment train;
5. When the idle train is emptied, it should be rinsed to remove any remaining scum or solids, with this material being returned to the surge tank;
6. Inspect and repair the idle train, as necessary; 7. Over the next several days, the idle train should be refilled with treated effluent
from the working train: disinfection is not necessary at this point, and if the facility is not discharging at all during the refilling of the idle side, and there is no effluent at the facility outfall, the disinfection process may be temporarily shut down;
8. When the idle train has been refilled to about 70% capacity with treated effluent, the aerators and mixers may be energized at near-minimum output to keep the water fresh.

Wastewater Treatment Evaluation
Department of Environmental Protection D-6 Bureau of Clean Water
When restarting the idle train after it had been out of service for awhile, it will be necessary to seed the process with active biomass from the other train. This should be done for a few hours before introducing raw wastewater from the surge tank/influent splitter box. At the operators’ discretion, MLSS concentration should be allowed to reach a minimum working level before discharging effluent to the disinfection process. The chlorinator and sulfonator should be restarted once the facility is producing forward flow through the chlorine contact tank. (If the active train is continuing to produce effluent, of course, disinfection processes would not be interrupted.) The WTE data collection phase ended with removal of the equipment on April 27. At this time, process monitoring tests performed on 4/26 indicated that the biomass in A-side was improving, with young sludge characteristics of mostly free swimming and stalked ciliates being seen during microexam. On April 27, representatives of the successor to the design engineer met with plant staff and the evaluator. Many of the preliminary findings of this study were discussed, and it was agreed by all that the facility as built (“turn-key”) had to account for limitations in funding that may be the cause of some of the treatment inefficiencies that were discovered. Ultimately, additional investment may be required in order to remedy existing problems and optimize plant performance. Additional loans or grants may be available through PennVest and other programs to aid rural or underfinanced utilities in financing system improvements. It was determined at the final meeting for this WTE that DEP staff would return to the site during high-tourist season (September or October) to briefly evaluate operations at the facility during peak loading, as a supplement to this study. Operational Issues: Chief among the findings are the need to improve the aeration system to achieve nitrification of ammonium waste. The facility owner and the consulting engineer should discuss ways to improve the aeration system at Benezette Township STP:
1. Assure that the existing diffuser system is not obstructed with detritus and debris accumulation;
2. Consider upgrading the diffuser type to improve SOTR; 3. Ensure that changes to the diffusers are accommodated by adjustments to the
aeration system blowers; 4. Presently, each train has its own isolated set of blowers; consider installing a
bridge connection on the aeration headers to permit more flexibility in the use of the blower output;
5. Use continuous-monitoring immersion DO probes to interface with controllers for the aeration blowers, thereby optimizing aeration and improving energy consumption;
6. Install hour-meters at the motor controls for all blowers and begin monitoring run-times as part of a preventative maintenance program.2
2 Hour meters should be used on all major electrical motors, including blowers, pumps, and subsurface mixers.)

Wastewater Treatment Evaluation
Department of Environmental Protection D-7 Bureau of Clean Water
Other findings include: 1. Flows entering the anoxic zone tanks where denitrification is to occur must be
adjusted so as to remove any splashing or water-fall effects that introduce oxygen into what ought be an oxygen-free zone; pipes should discharge subsurface and have backflow prevention installed;
2. Improvement of sludge transfer and clarifier scum returns by use of electrically powered pumps instead of air-lift pumps;
3. Addition of facilities to provide supplemental carbon both during times of insufficient flow and loading and also for aiding the denitrification process continuously;
4. Consider installing a fabricated, removable aluminum or PVC partition in B-train anoxic tank to reduce active capacity in event that only 25% of treatment capacity is to be used during times of very low BOD loading (tourist off-season, winter,) as discussed during WTE.
5. Whenever chemicals are used to amend the treatment process, attenuated dosing is the preferred method of delivery: supplemental carbon, alkalinity enhancement, chlorination/dechlorination, phosphorus precipitants all should be dosed by metering pumps over 24 hours per day rather than being dumped as slug loads;
a. If adding lime for alkalinity, it should be pre-mixed with effluent water to make a slurry, then added to the process tanks in small doses over the course of the work shift;
b. If adding powdered polymer (polyacrylamide or polysaccharides,) the material must be dissolved in make-up water (preferably potable or clean well water) by wetting it through a mixing eductor (e.g. Novatech PE1) and allowed to age overnight in a mixing tank before adding it clarifier inflow; failing to do this simply wastes polymer as it must first unwind through the wetting and aging process; an eductor and funnel cost about $300; a tank mixer costs about $400; a 90 to 150 gallon day tank costs between $340 and $500. A feed scale costs about $40.
6. Telescoping scum scuppers in the three clarifiers should be adjusted properly to prevent excessive recycling of water through the anoxic zone, where such flows had been observed to interfere with the denitrification process by shortening detention times; furthermore, it is suggested that the scuppers be used to draw off floating material only when staff are on-site to assure the proper adjustments; (The DO chart in Attachment H shows a spike in DO in the B-side anoxic zone during an instance of flooding caused by excessive clarifier water recycling through the scum scupper.)
7. The facility operation would benefit from a more robust process monitoring program, including the following:
a. Use of Process Control endpoints, such as MCRT, SRT, F/M, West Sludge AGE, e.g., to guide process control decisions;
b. Maintain records of daily DO monitoring of various process tanks, organized by month, along with recording process pH, solids concentration, and other recommended process monitoring test data;

Wastewater Treatment Evaluation
Department of Environmental Protection D-8 Bureau of Clean Water
c. Provide for daily flow to be recorded at a consistent time every day: use proportional algorithm to normalize daily flow to a specific time, e.g., 9 A.M., to prevent misinterpretation of hydraulic flow at the facility;
d. Determine more adequate and consistent ways to measure and record waste sludge flow and loading, so that process performance may be better understood and managed.
Maintenance Issues: The evaluation included routine checking of plant maintenance that is required by Part B.1.e.2 of the NPDES Permit, relating to Operation and Maintenance. With steel process tanks, corrosion can become a significant problem, and regular maintenance of the finish is necessary to avoid corrosion. Preventative maintenance is often less costly than reactive maintenance. Some of the maintenance issues discovered are listed below:
1. Corrosion on PureStream tanks should be treated by grinding or sanding the metal, followed by touch-up painting with durable epoxy finishes.
2. Catwalks and hand rails constructed of galvanized steel showed corrosion that could be avoided by regular maintenance and refinishing.
3. Some grounding wires along the perimeters of the treatment tanks were broken. These wires provide protection to personnel should there be electrical faults that could energize the tank surfaces. It is important that the grounding wires be repaired.
4. The main yard lights have not been functional. The assistant operator reported that the lights are activated by photocells that are malfunctioning and that there are no bypass switches that allow manual operation. The yard lights should be made operational again, and there should be a manual control available should the automatic ones fail
5. The reed bed was dormant during winter; however, operators continued to add wasted sludge to the bed. This could become a nuisance during warmer weather, prior to the reeds’ regrowth, and supernatant water leaking from bed entries should be discouraged.
6. Once per year when one of the two PureStream tanks is removed from service, it should be drained of sludge and supernatant so that it may be inspected and serviced.
a. Decanted water should be processed as raw wastewater, beginning at the surge tank and passing through the working train;
b. Thickened solids should be disposed in the reed bed only if nascent odors can be averted… it may be best to wait until reed growth is re-established before doing this; otherwise, the solids could be disposed of off-site, although doing so will be costly;
c. Pressure-wash the tanks, clean and inspect diffusers, pumps, and mixers; d. Corrosion on the tanks and catwalks should be aggressively dealt with:
sand-blast and / or grind rust spots, then refinish with high-quality base coat and epoxy finish, as specified in OEM O&M documents for this model package plant.

Wastewater Treatment Evaluation
Department of Environmental Protection D-9 Bureau of Clean Water
e. Exercise all valves if keeping them; otherwise, consider replacing key gate valves with stainless steel ball valves, which are easier to control.
f. If the tank is to remain idle following maintenance, it should be refilled with clean effluent water and maintained in such manner that biological growth in the idle tank is discouraged through the use of occasional chlorination.
g. When a process is restarted, active biosolids and raw wastewater should be diluted into the tanks, gradually displacing the existing volume of water.
7. A preventative maintenance schedule for the facility should be drafted and posted on-site, where planned maintenance of pumps, blowers, tanks, etc., can be programmed as regular activities. When possible, hour meters should be added to blower and pump control circuits, so that run times may be monitored and maintenance can be more effectively scheduled.
8. Waste oil should be properly contained and stored. When oil spills and stains the ground, the spill should be cleaned using absorbent materials and stained soil should be removed and replaced.
9. Install bird netting over the process tanks to prevent birds from becoming entrapped in the mixed liquor. (Bird carcasses may interfere with pump intakes)
10. Process covers during winter have been successful at reducing freezing and excessively low water temperatures. These should be adapted for permanent use.
11. Consider installing PVC-piped sprayer system in treatment trains to direct water spray at surface foam and scum in tanks, using service water.
12. Consider adding cover to surge tank if odors become problematic, adding odor control sprays or air filters to deodorize air.
13. Consider enhanced site security by enclosing and securing treatment controls (close the open lean-to shed;) also consider addition of better perimeter and office/lab/garage security, especially adding bay door locking mechanism.
14. Spare keys should be stored in a locking (key or combination) key safe rather than left hanging on a nail or loose in an unsecured desk drawer.
Administrative Issues: Benezette Township’s facility is only a few years old. The maintenance garage/office/lab building was erected after the facility itself had been built. Since the office/lab appears to have replaced the chemical building as the hub of operator activity, some administrative adjustments are in order:
1. A copy of the current NPDES Permit and any occupancy permits should be maintained in the office/lab;
2. A copy of the wastewater treatment license for the Operator-in-reasonable-charge of the facility should be framed and hung in the office/lab;
3. Up to five years of operational and laboratory testing records should be maintained in this office, as the township offices and the township clerk are not always available when water quality inspector or others visit the site;
4. A copy of the Facility Operations & Maintenance Manual should be maintained in the office/lab. Note that this is not merely a collection of the OEM Catalog or Equipment Specifications: The facility O&M manual should contain guidance on

Wastewater Treatment Evaluation
Department of Environmental Protection D-10 Bureau of Clean Water
managing the operation, routine maintenance, performing lab tests, and other related activities;
5. Pursuant to the Operator Certification Act, there should be a collection of written operations procedures, signed by the Operator-in-Charge, instructing subordinates and non-licensed personnel in proper operational procedure should the lead operator be unavailable to make process-control decisions;
6. The owner of the treatment facility should notify the DEP in writing, of any changes in personnel designated as the operator empowered to make process control decisions on its behalf. A check of the records showed that this has not yet been updated;
7. While not specifically enumerated in the facility permits, it is recommended that the operators maintain records of sludge wasting in addition to any reports of sludge removed off-site for processing or disposal. Presently, this facility reports sludge disposal on form 3800-FM-BPNPS0438 which accounts for sludge removed to Ridgeway. By itself, however, this is an incomplete record: Most of the year, the facility employs its on-site reed bed to dispose of wasted biosolids. There should be a record of the volume and percent-solids of sludge wasted to the on-site sludge holding tank, records of gallons of supernate decanted from this tank (and returned to the head of the plant,) percent solids of consolidated sludge fed to the reed bed, as well as volume of sludge transferred to the reed bed. Biosolids sent offsite to Ridgeway, and reed bed consolidated solids that may be removed to landfill, should be monitored and reported on the Supplemental Report form.
8. Laboratory testing and calibration records should be maintained for any compliance testing such as effluent pH, residual chlorine, and dissolved oxygen. Calibration records should include date/time, operator/technician name or initials, calibration method, (calibration), (temperature), (slope.)* (*where applicable) While this is not an absolute requirement for the solids probe, it is a recommended quality assurance practice to maintain a calibration record for this instrument.
9. Continuing education requirements for license retention: While employment and retention policies vary from facility to facility, it is recommended that the facility owner assure that the licensed operations staff is able to maintain the continuing education requirements of their licenses. This could be a simple as allowing operators leave to attend professional development classes, or it may at its discretion reimburse operator continuing education costs as part of its budgetary planning.
10. Preventative maintenance planning may be extended from simply mapping equipment service dates to use of electronic planning tools for asset management, and it is highly recommended that owners of a new treatment facility employ an asset management program to plan for maintenance and replacement costs for the new equipment. Both commercial and agency-sponsored asset management software is available for use in tracking and planning financial expenses. DEP staff has offered some assistance with setting up an asset management program at Benezette. Keep in mind that most of the work involved is in setting up the asset database; however, it is suggested to start with critical equipment first and then add to it as time and staffing permit.

Wastewater Treatment Evaluation
Department of Environmental Protection D-11 Bureau of Clean Water
11. Post signage at the facility outfall indicating that it is “Outfall 001” of the “BenezetteTownship Wastewater Treatment Facility, NPDES #PA0263711” to inform thepublic and recreational users of the creek. Doing this is not mandatory, except for30-day public comment period at time of permit renewal, but it is considered agood management practice.
Recommended Process Monitoring Laboratory Equipment Attachment K lists recommended process monitoring for activated sludge processes, including a minimum schedule and brief descriptions of all testing. At present, the operators employ some basic process monitoring tests; however, this limited testing is not always effectively providing the best information for making process control decisions.
The current routine tests include: Dissolved oxygen by immersion probe Total residual chlorine by colorimetry (required for permit compliance) pH/temperature by immersion probe (required for permit compliance) Suspended solids by immersion probe 30-minute Settleability / Settled Sludge Volume
Although some of the meters have recording capability, locations are not defined and metrics are not usually recorded. There are no standardized lab forms in use, although important information is recorded in the Daily Logbook.
It is recommended that a more formal program for process monitoring be enacted and that process monitoring tests recorded for midterm and long-term process trending. DEP staff demonstrated the rudiments of such a program during the course of this WTE; however, some investment in monitoring lab equipment may become necessary:
1. Bulk composite sampler, with 2.5 gal. polypropylene sample carboy, for rawwastewater; may be portable to be useful elsewhere as in collection system, ISCOor Sigma, for obtaining 24-hr. automatic timed or flow-proportioned samples of rawwastewater. Estimated cost $3,000
2. Suspended solids testing: While the probe and meter presently in use may beadequate most of the time, there are no calibration records, so the operatorscannot be certain that the meter readings are accurate or precise. The facility didacquire some equipment for gravimetric solids (a drying oven, a muffle furnace) butdo not have vacuum filtration equipment available. Alternatively, samples may besent off-site to a laboratory for gravimetric testing once or twice a month to use testresults for calibrating the solids probe.
A recommended test method that substitutes for the gravimetric suspended solids test is the solids-by-volume test, whereby 13 ml. of sample is spun in a centrifuge for fifteen minutes, and the suspended solids are recorded in percent solids by volume. This centrifuge and tubes allows an operator to determine suspended solids quickly (compared to the 2-hour gravimetric test.) A calibration may be made by comparing standard sample results tested gravimetrically to the

Wastewater Treatment Evaluation
Department of Environmental Protection D-12 Bureau of Clean Water
volumetric percent to obtain a Weight-to-Concentration ratio that may be updated once or twice a month. Approximate cost $1,300
3. Oxygen Uptake Rate / Respiration Rate Test would require purchase of a BOD probe for the dissolved oxygen meter or a magnetic stirrer platform for testing with a standard DO probe. Approximate cost $900
4. Portable Colorimeters for Ammonia, Nitrate, Nitrite, and Phosphorus. Approximate cost $500-600 each; Reagents/test phials, c. $40-80 -or- DR1900 Spectrophotometer or similar, approximate cost $3,200; TNT test kits, c. $40-70 per 24 tests
5. Core Sampler: used in developing solids inventory, cost $ 111 6. Triple Settleometer set: used to diagnose sludge bulking vs. filamentous
organisms, three needed, including individual paddles, if available---(The settleometers are available in 1.4 liter {Benezette already has one,} or 2.0 liter {wider, more like a clarifier in most plants} and made of high-strength, clear plastic---Raven Environmental or equivalent, see Blue Book or similar) c. $60 ea./ $180 set.
7. Microscope, intermediate-quality: used for assessing biomass. Include glass slides and cover slips, lens tissue & brushes, and dust cover. Polarizing light microscope (a step up) is even better for identifying filamentous organisms. Cost c. $500-1200
8. 0.1-to-1.0 ml. and 1-to-10 ml. automatic pipettors, with disposable tips, for setting up nutrient tests. Cost c. $300
9. Laboratory wipes (Kimwipes or equivalent) 10. 2-liter Nalgene sample bottles, for conveying activated sludge samples 11. Safety shield or goggles for use by staff handling anything they would be wearing
latex or rubber gloves 12. [Optional] Updated dissolved oxygen / pH probe combination, with probes,
charger, carrying case. Cost c. 1,500.

Wastewater Treatment Evaluation
Department of Environmental Protection E-1 Bureau of Clean Water
Attachment E—Equipment Deployed
DEP staff visited the site on March 8 and 9, 2016, to set up equipment. Digital sensing probes were staged at the B-1 Oxic and B Anoxic zones of treatment train #B, which is a prefabricated steel tank divided into two equal combination aeration tank & integral upflow clarifier zones and a centrally located anoxic mixing zone, where raw wastewater contacts clarifier return activated sludge to provide carbon for denitrification. Nutrient sensing probes were placed in the clarifier “clear” zone and in the discharge end of the chlorine contact tank. Power was tapped from the facility’s utility convenience circuits. The data recording computer and laboratory equipment were placed in the office/lab area of the maintenance building.
Digital, Continuously Monitoring Probes: 1 — Notebook computer with signal converter 2 — SC1000 SCADA Base Unit 2 — LDO probe 1 — pH probe 2 — ORP probe 1 — AISE probe w/Cleaning System 1 — Nitratax probe 1 — Solitax probe 1 — UVAS BOD probe Laboratory Equipment On-loan: 1 — Hach HQ40d handheld pH and LDO meter 1 — LBOD probe 1 — DR2800 spectrophotometer 1 — Wastewater Field Laboratory Kit 1 — Raven centrifuge with 6 sample tubes 1 — Raven Core Taker sampler 3 — Raven settleometers 1 — Hach DRB-200 Heater Block 1 — 1,000-ml sampling cup

Wastewater Treatment Evaluation
Department of Environmental Protection F-1 Bureau of Clean Water
Attachment F—Equipment Placement Photos
Photo 1: Purestream EA Tanks—Trains A (left) & B (right) Photo 2: Surge Tank with Bar Rack
Photo 3: Influent Splitter Box with Overflow Photo 4: Influent Transfer Pipe to Anoxic Tank B
Photo 5: Probes staged in Oxic Zone B-1 Photo 6: Subsurface air turbulence in Anoxic Tank, Train B

Wastewater Treatment Evaluation
Department of Environmental Protection F-2 Bureau of Clean Water
Photo 7: Nitrate Probe in Chlorine Contact Tank, Train B Photo 8: Erosion-type Chlorinator (near) & Sulfonator (far)
Photo 9: PD Blowers, individually piped Photo 10: Aeration Rotometer & Relief Valve
Photo 11: Unused Phosphorus Control System Photo 12: Dormant Reed Bed, source of odors?

Wastewater Treatment Evaluation
Department of Environmental Protection F-3 Bureau of Clean Water
Photo 13: SC1000 with Display Photo 14: Notebook for logging data automatically
Photo 15: Unadjusted scupper / flooded clarifier Photo 16: Adjusted scupper / clarifier quieted
Photo 17: Effluent Outfall 001 Photo 18: Detritus visible below outfall
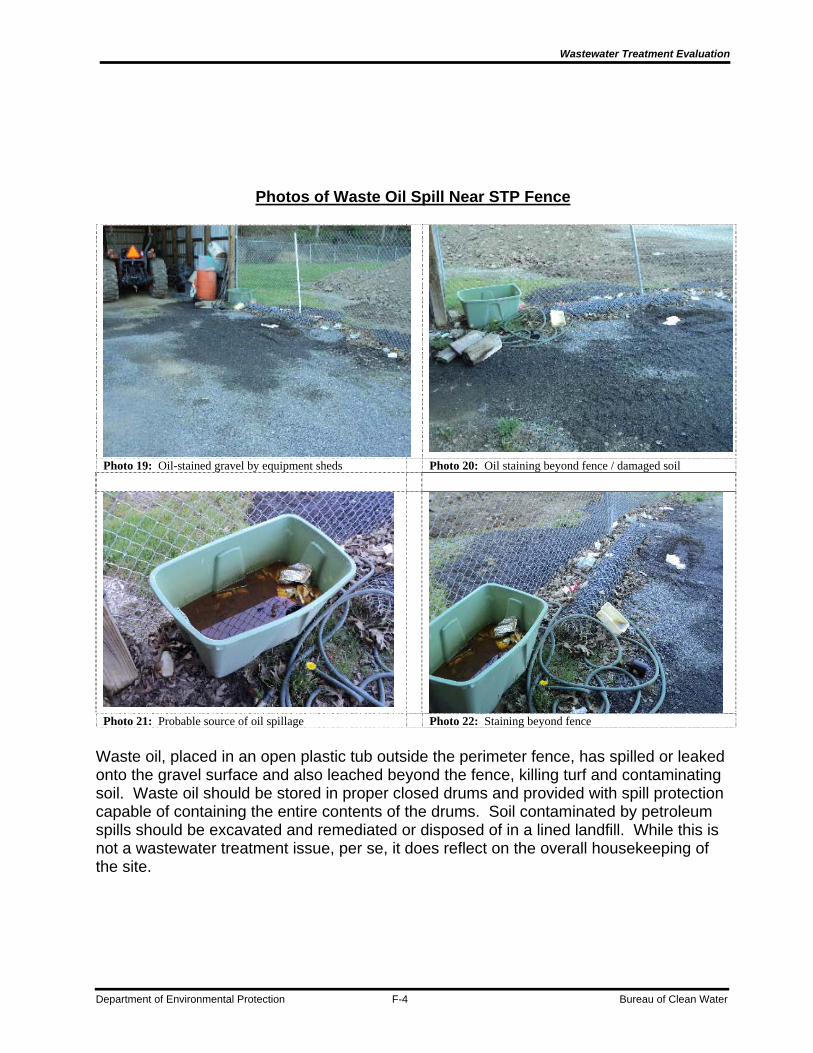
Wastewater Treatment Evaluation
Department of Environmental Protection F-4 Bureau of Clean Water
Photos of Waste Oil Spill Near STP Fence
Photo 19: Oil-stained gravel by equipment sheds Photo 20: Oil staining beyond fence / damaged soil
Photo 21: Probable source of oil spillage Photo 22: Staining beyond fence
Waste oil, placed in an open plastic tub outside the perimeter fence, has spilled or leaked onto the gravel surface and also leached beyond the fence, killing turf and contaminating soil. Waste oil should be stored in proper closed drums and provided with spill protection capable of containing the entire contents of the drums. Soil contaminated by petroleum spills should be excavated and remediated or disposed of in a lined landfill. While this is not a wastewater treatment issue, per se, it does reflect on the overall housekeeping of the site.

Wastewater Treatment Evaluation
Department of Environmental Protection G-1 Bureau of Clean Water
Attachment G—Trending Charts
West Sludge Age & F/M Ratio: Based on reported waste rate volume, which cannot be determined electronically, the sludge age for B-side averaged about 13 days in March and 16 days in April; the F/M ratio was uncommonly low, at c.0.01 prior to addition of supplemental carbon, afterward rising to about 0.05
SSV trends showed diminishing settleability on B-side, primarily due to wasting periods becoming insufficient as water temperature increased and food loads were supplemented. Lack of winter/spring capacity in the reed bed may have contributed to decisions to curtail wasting.
0.00
0.01
0.02
0.03
0.04
0.05
0.06
0
5
10
15
20
25
F/M
West Sludge
AGE, days
Benezette Twp. Sludge Age & Food/Mass Ratio
West AGE F/M
0
100
200
300
400
500
600
700
800
900
SSV30, cc/ml
Benezette Twp. 30‐minute Settleability
ATB1 ATB2 ATA

Wastewater Treatment Evaluation
Department of Environmental Protection G-2 Bureau of Clean Water
Oxygen Uptake Rate testing prior to supplemental carbon addtion were generally flat, averaging about 11 mgO2/hr. Corresponding Respiration Rate, which accounts OUR per gram of VSS, was calculated to be approximately ½ of OUR, based on VSS as 75% of MLSS as determined using the TSS probe data. In a healthier condition, one might expect OUR to be approximately 25 to 30 mgO2/hr, with RR approximating the blue (upper) line seen here. Many things contribute to suppressed biological activity, not the least of which have been insufficient organic loading and insuffient soluble oxygen transfer.
SVI being a function of SSV, the values trended here indicate rising sludge bulking on B-side which led to the operators’ decision to revert treatment to A-side, where initial SVI was at the top end of favorable. Filamentous growths were never seen; bulking was likely due to insufficient wasting.
0
5
10
15
20
25
30
2/29 3/7 3/14 3/21 3/28 4/4 4/11 4/18 4/25
OUR, m
gO2/hr
Benezette Twp. Mixed Liquor OUR Test
OUR RR
0
50
100
150
200
250
SVI
Benezette Twp. Sludge Volume Index
ATB1 ATB2 ATA

Wastewater Treatment Evaluation
Department of Environmental Protection H-1 Bureau of Clean Water
Attachment H—Continuous Digital Monitoring Charts (Examples)
Chart 1: Flow records for the first four months of CY 2016
Chart 2: Effluent pH as reported in eDMR for Jan-Apr, 2016
0.000
0.005
0.010
0.015
0.020
Jan Feb Mar Apr
Q, M
GD
Benezette Twp. STP Effluent Flow
Q Average
5.5
6.0
6.5
7.0
7.5
8.0
8.5
9.0
9.5
Jan Feb Mar Apr
pH, s.u.
Benezette Twp. STP Effluent pH
pH Min Max

Wastewater Treatment Evaluation
Department of Environmental Protection H-2 Bureau of Clean Water
Chart 3: Effluent Total Suspended Solids & cBOD5 loads as reported in eDMR for Jan-Apr, 2016
Chart 4: Effluent Total Residual Chlorine, post-sulfonation, as reported in eDMR for Jan-Apr, 2016. The spike noted in late April was due to a combination of extra calcium hypochlorite tablets spilled inside the chlorinator and a sustained period of non-discharging effluent. This event was remediated by cleaning out the chlorinator containment and by the addition of extra sulfide tablets to the post-disinfection containment.
0
2
4
6
8
10
12
Jan Feb Mar Apr
Load
, lb./day
Benezette Twp. STP Effluent Loadings
TSS load CBOD load TSS Limit CBOD Limit
0.0
0.2
0.4
0.6
0.8
1.0
1.2
1.4
Jan Feb Mar Apr
Q, M
GD
Benezette Twp. STP Effluent TRC
TRC TRC Limit imax TRC Limit avg mo TRC Average

Wastewater Treatment Evaluation
Department of Environmental Protection H-3 Bureau of Clean Water
Second half of March 2016 trends charts:
Chart 5: March NH3-N & NO3-N concentrations in treated effluent: note that NH3-N has not been nitrified to begin with, meaning that NO3-N has not been present to be denitrified to N2 gas. In a fully operational BNR process, concentrations of each species of nitrogen ion would range from 0.2 mg/L to 3.0 mg/L.
Chart 6: March Oxic DO residual: Days 16-19 had two blowers running; one on manual, the other on timer, yielding excessive residual. Days 20-31 show that DO was not present in sufficient concentrations to nitrify the ammonia in the wastewater, as proven in Chart 5.
0.0
5.0
10.0
15.0
20.0
25.0
30.0
35.0
16 17 18 19 20 21 22 23 24 25 26 27 28 29 30 31
x‐N, m
g/L
Effluent Ammonium‐N & Nitrate‐N Conc.
NH3‐N Clarifier B1 NO3‐N Effluent
0.0
1.0
2.0
3.0
4.0
5.0
6.0
7.0
8.0
9.0
16 17 18 19 20 21 22 23 24 25 26 27 28 29 30 31
DO, m
g/L
Dissolved Oxygen Concentration of Mixed Liquor
DO Train B1 Aer DO Train 2 Anox DO‐low DO‐high

Wastewater Treatment Evaluation
Department of Environmental Protection H-4 Bureau of Clean Water
Chart 7: March ORP in oxic and anoxic zones “flipped” on March 22 when anoxic tank surface splashing was reduced; however, oxic ORP should be greater than +100 mV to be effective for nitrification. ORP in anoxic tank actually dropped into the anaerobic zone, due to lack of DO in the oxic tank. (see Chart 6)
Chart 8: April Raw Wastewater BOD5 in April, showing “spikes” representing molasses addtion
‐300
‐250
‐200
‐150
‐100
‐50
0
50
100
150
16 17 18 19 20 21 22 23 24 25 26 27 28 29 30 31
ORP, +/‐mV
Oxidation / Reduction Potential of Mixed Liquor
ORP B‐Anox ORP Train B1 Aer ORPanaer ORPaerobic

Wastewater Treatment Evaluation
Department of Environmental Protection H-5 Bureau of Clean Water
Chart 9: April Oxidation/Reduction Potential for April 2016: Note prior to switching trains, “oxic” was in anoxic range and “anoxic” was in anaerobic range, further indication that DO residual never improved.
Chart 10: April DO residuals rarely rose above lower limit, meaning that no nitrification would occur. Frustrated, the operator switched flow to A-train and placed all blowers into service (one manual, other timed.)

Wastewater Treatment Evaluation
Department of Environmental Protection H-6 Bureau of Clean Water
Chart 11: pH remained fairly constant, albeit mostly just below the range for optimal nitrification to NO3-N
Chart 12: Without aeration improvements, requiring financing, NH3-N never nitrified at the facility.
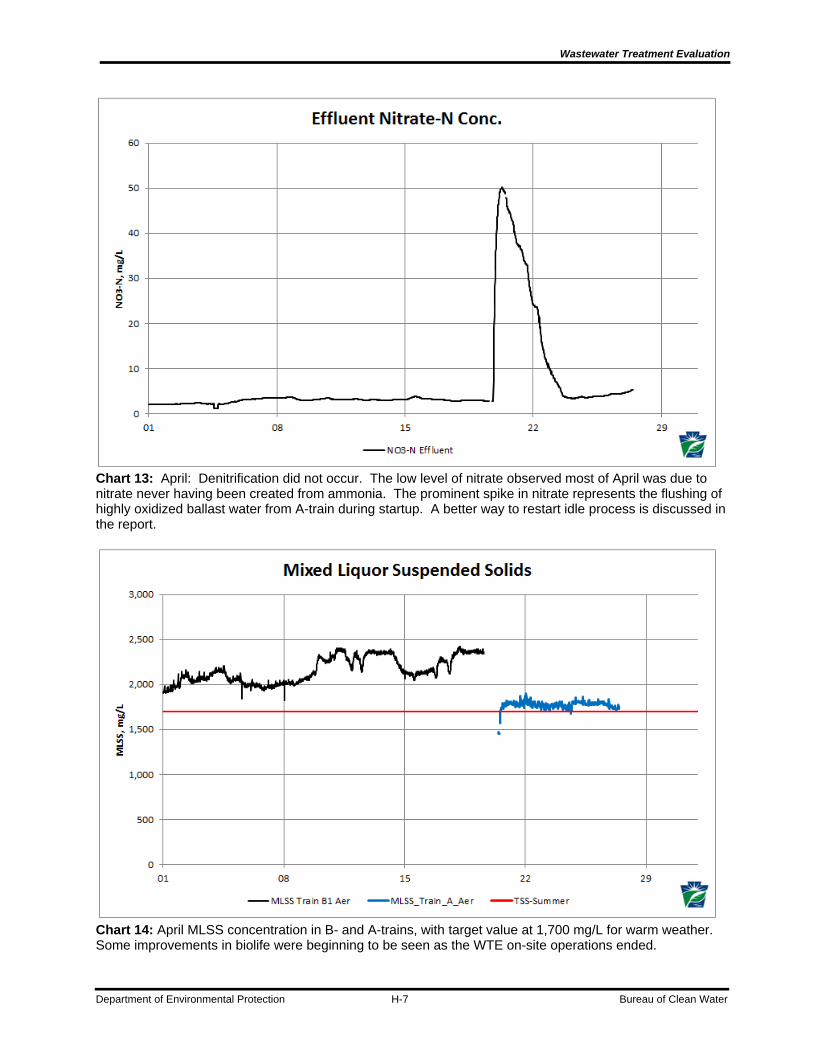
Wastewater Treatment Evaluation
Department of Environmental Protection H-7 Bureau of Clean Water
Chart 13: April: Denitrification did not occur. The low level of nitrate observed most of April was due to nitrate never having been created from ammonia. The prominent spike in nitrate represents the flushing of highly oxidized ballast water from A-train during startup. A better way to restart idle process is discussed in the report.
Chart 14: April MLSS concentration in B- and A-trains, with target value at 1,700 mg/L for warm weather. Some improvements in biolife were beginning to be seen as the WTE on-site operations ended.

Wastewater Treatment Evaluation
Department of Environmental Protection I-1 Bureau of Clean Water
Attachment I—Example Process Monitoring Data / Charts
Example WTE Daily / Weekly Bench Data
Following are examples of the Example Bench Test Reports for Daily or Weekly Process Monitoring tests. The testing conducted while on-site during the WTE consisted of three basic activated sludge test protocols, plus any other testing that was specific to the extended aeration / BNR mode of wastewater treatment.
Effluent Nutrients: Dilution Tube Under/Over
PO4-P 843 1.84 mg/L P 1:1 HR
NH4‐N 22.60 mg/L N ↑ LR
NO3‐N 2.96 mg/L N 1:1 HR
NO2-N N/A mg/L N ↑ LRunder at .123
TN 27.6 mg/L N 1:1 --
ALKALINITY 180
mg/L ALK ↑ sticks
TRC N/A mg/L ↑ ---

Wastewater Treatment Evaluation
Department of Environmental Protection I-2 Bureau of Clean Water
Example of SSV and OUR Test Data:
Settleability NEAR SIDE FAR
Location ATB1 ATB2 ATA
0 1000 1000
5 980 990
10 960 960
15 940 940
20 900 870
25 830 810
30 760 740
35 715 690
40 670 640
45 620 595
50 570 550
55 545 530
60 520 510
Oxygen Uptake Rate:
Location ATB1 ATB2 ATA
0.0 7.63 8.06
1.0 7.26 7.71
2.0 6.93 7.36
3.0 6.61 7.01
4.0 6.27 6.65
5.0 5.95 6.30
6.0 5.60 5.96
7.0 5.29 5.63
8.0 4.95 5.25
9.0 4.60 4.89
10.0 4.23 4.54 OUR,
mgO2/hr 20.4 21.1 0.0 RR, mgO2‐gVSS/hr 7.1 7.5 0.0
slope, ‐x/y 0.340 0.352 0.000
0
100
200
300
400
500
600
700
800
900
1000
0 5 10 15 20 25 30 35 40 45 50 55 60
Settled Sludge Volume
ATB1 ATB2 ATA
y = ‐0.3515x + 8.4142R² = 0.9999
0
1
2
3
4
5
6
7
8
9
10
0.0 1.0 2.0 3.0 4.0 5.0 6.0 7.0 8.0 9.0 10.0
Oxygen Uptake Rate:
ATB1 ATB2 ATA Linear (ATB2)

Wastewater Treatment Evaluation
Department of Environmental Protection I-3 Bureau of Clean Water
Settled Sludge Concentration
SSC ATB1 ATB2 ATA
min. reading reading reading
0 3.6 4.4
5 3.7 4.4
10 3.8 4.6
15 3.8 4.7
20 4.0 5.1
25 4.3 5.4
30 4.7 5.9
35 5.0 6.4
40 5.4 6.9
45 5.8 7.4
50 6.3 8.0
55 6.6 8.3
60 6.9 8.6
Sludge Volume Index
SVI ATB1 ATB2 ATA
min. reading reading reading
0 278 227
5 272 225
10 267 218
15 261 214
20 250 198
25 231 184
30 211 168
35 199 157
40 186 145
45 172 135
50 158 125
55 151 120
60 144 116
0123456789
10
0 5 10 15 20 25 30 35 40 45 50 55 60
SV
I
time (minutes)
SSC: Settled Sludge Concentration
ATB1 ATB2
0
50
100
150
200
250
300
0 5 10 15 20 25 30 35 40 45 50 55 60
SV
I
time (minutes)
SVI: Sludge Volume Index
ATB1 ATB2

Wastewater Treatment Evaluation
Department of Environmental Protection J-1 Bureau of Clean Water
Attachment J—NPDES Permit Limits
PA0263711 – Amendment No. 1, Sewage, NAICS Code 221320, Benezette Township, P.O. Box 10, Benezette, PA 15821. Facility Name: Benezette WWTP. This facility is located in Benezette Township, Elk County. Description of Activity: The NPDES permit for discharge of treated sewage. The amendment added total residual chlorine effluent limits to the permit. The receiving stream(s), Trout Run, is located in State Water Plan watershed 8-A and is classified for Cold Water Fishes, aquatic life, water supply and recreation. The discharge is not expected to affect public water supplies. The proposed effluent limits for Outfall 001 are based on a design flow of 0.040 MGD. Mass (lb/day) Concentration (mg/l)
Parameters Average Monthly
Weekly Average Minimum
Average Monthly
Weekly Average
Instant.Maximum
Flow (MGD) Report Report XXX XXX XXX XXX pH (S.U.) XXX XXX 6.0 XXX XXX 9.0 Total Residual Chlorine XXX XXX XXX 0.5 XX 1.2 CBOD5 8.0 13 XXX 25 40 50 Total Suspended Solids 10 15 XXX 30 45 60 Fecal Coliform (CFU/100 ml) May 1 - Sep 30 XXX XXX XXX
200 Geo Mean XXX XXX
Fecal Coliform (CFU/100 ml) Oct 1 - Apr 30 XXX XXX XXX
2000 Geo Mean XXX XXX
Ammonia-Nitrogen XXX XXX XXX Report XXX XXX Total Phosphorus XXX XXX XXX Report XXX XXX The proposed monitoring requirements and, where appropriate, effluent limits for implementation of the Chesapeake Bay Tributary Strategy are as follows for Outfall 001. Mass (lbs) Concentration (mg/l)
Parameters Monthly Annual Minimum Monthly Average Maximum
Ammonia---N Report Report** Report Kjeldahl---N Report Report Nitrate-Nitrite as N Report Report Total Nitrogen Report Report Report Total Phosphorus Report Report Report Net Total Nitrogen Report 0*1 Net Total Phosphorus Report 0* * This permit contains conditions which authorize the permittee to apply nutrient reduction credits to meet the Net Total Nitrogen and the Net Total Phosphorus effluent mass limits, under the Department’s Trading of Nutrients and Sediment Reduction Credits Policy and Guidelines (Document #392-0900-001, December 30, 2006). The condition includes the requirement to report the application of these credits in Supplemental Discharge Monitoring Reports (DMRs) submitted to the Department. * The compliance date for Net Total Nitrogen and Net Total Phosphorus will begin on October 1, 2010. Since these reporting requirements are annual loads, the reporting on compliance with the annual limitations will be required to be reported on the Supplemental DMR – Annual Nutrient Summary by November 28, 2011. This facility is required to monitor and report for Net Total Nitrogen and Net Total Phosphorus from the effective date of the permit until September 30, 2010. ** Total Annual Ammonia Load will be required to be reported on the Supplemental DMR – Annual Nutrient Summary by November 28, 2011. 1 -- The permittee can reduce this number 3,500 pounds (which is an offset from retirement of a 140 EDUs onlot systems) from their total discharge mass load. The offset can’t be used to sell credits if total discharge mass load is less than the offset mass load allowance.

Wastewater Treatment Evaluation
Department of Environmental Protection K-1 Bureau of Clean Water
Attachment K—Recommended Process Control Tests, Observations, Calculations
Table M-1: Suggested sampling frequencies
Discussion of Process Monitoring and Control: For this size of a treatment plant, though, we suggest that the battery of process monitoring tests be performed more frequently than once per week. Ideally, tests are done three times per week (Settleometry, Centrifuge, Water Chemistry, and Microscopy) at least until the operators have a 4-season set of reference data to which they may refer in future years. Whenever process or treatment methods change, the test data set would need to be reproduced. Also, whenever the facility experiences plant upset conditions, we recommend more frequent process-monitoring and control testing be performed by the operators. This testing is not the same as those performed by contract laboratories. Those tests are considered “compliance testing” and refer only to the need for the facility to report parameters required by the NPDES permit. Over the years, many small treatment facilities began to contract compliance testing to certified environmental laboratories. This eased the burden on operators, and it saved the facility owner the cost of maintaining certification of its own laboratory. However, over time, many facilities ceased to perform regular process monitoring tests, as well. Our position has been that it is
Operator Sample collection guidelines Plant Flow: Less than 1.0 MGD
Sample Parameter Sample Location Sample Type 3/Week 1/Week 2/MonthRaw Influent *BOD5 and TSS Influent Grab xAlkalinity Influent Grab xCOD Influent Grab xNH3-N Influent Grab xpH Influent Grab xFlow As permitted Totalizer Daily* Frequency of sampling may need to be increased or decreased depending on plant size or conditions
Aeration BasinMLSS / MLVSS Aeration Tank Grab xCentrifuge Testing Aeration Tank Grab xDissolved Oxygen Aeration Tank In Situ xSettleability (SV30) Aeration Tank Grab xpH Aeration Tank Grab xMicroscopic Evaluation Aeration Tank Grab xReturn Activated Sludge, SS RAS line Grab xComputation of SVI, F/M, sludge age, - -and/or MCRT
Secondary ClarifierSludge blanket depth As appropriate In situ xWaste Activated Sludge, SS and VSS Waste Line Grab X
Final EffluentAlkalinity Effluent Grab xParameters, sample types, and frequencies required by permitModified from its original versionReference: Texas Commission on Environmental Quality, Guidance Document RG-002(Revised), October 2002
As data collected

Wastewater Treatment Evaluation
Department of Environmental Protection K-2 Bureau of Clean Water
important for operators to know the condition of their facilities and where and what are the qualities of the treatment solids (quality and quantity of “bugs.”) Thus we have adopted the process monitoring tests recommended by US-EPA and the professional trade organization, Water Environment Federation (WEF.) These tests include the following: Solids Inventory:
Centrifuge solids test: percent volume/volume measurement of activated sludge solids for activated sludge-type plants: Calculations stemming from this data include solids inventory (expressed as “sludge units” (SLU).)
Clarifier blanket level: a core-sampling of the clarifier contents provides a proportional quantity of mixed liquor and supernatant that can be used for developing awareness of how much mixed liquor is detained in the effluent clarifier, representing part of the overall sludge inventory.
Settleometry test: 30- and 60- minute activated sludge settling rates in wide half-gallon or 1-liter, calibrated vessels: Settled sludge volume (SSV) is expressed in standard 30-minute intervals and used to calculate Settled Sludge Concentration (SSC) which is a qualitative measure of how well the activated sludge settles in the clarifier, mimicking clarifier performance in terms of supernatant quality as well.
Oxygen Uptake Rate (a.k.a. Soluble Oxygen Uptake Rate): By measuring the rate of dissolved oxygen depletion in a sample of mixed liquor, one may demonstrate the relative effect of BOD loading on the biomass, how quickly this material will be metabolized by the activated sludge organisms. Expressed in “milligrams Oxygen per hour,” when mixed liquor volatile suspended solids concentration is known or can be extrapolated, then one may determine the actual Respiration Rate, in mg. Oxygen per hour per gram of activated sludge. OUR and RR are also useful for comparing the relative health of the biomass under toxic conditions, should there be undesirable contaminants in the raw wastewater, or anoxic conditions, should the aeration be insufficient to treat the incoming waste load using the available amount of oxygen.
Raw Wastewater and Effluent Chemical Oxygen Demand (COD): an analog of the 5-day Biochemical Oxygen Demand test, COD can be determined in about three hours and give operators a quick assessment of relative strength of wastewater and/or the amount of material remaining in treated effluent, thereby providing an analog of treatment efficiency.
Nutrient Tests: A portable wastewater laboratory provided during the WTE consists of materials for conducting various colorimetric analyses for nutrients such as ammonia-nitrogen, nitrite, nitrate, Kjeldahl nitrogen, phosphorus, etc. to determine whether the facility is removing or treating nutrients.
Various other tests included in the portable wastewater laboratory include alkalinity testing (the buffering capacity of the mixed liquor or the clarified supernatant,) chlorides, sulfides, halogens such as Total Residual Chlorine and Free Chlorine, and metals including aluminum and iron, known contaminants to downstream aquatic life.

Wastewater Treatment Evaluation
Department of Environmental Protection K-3 Bureau of Clean Water
The objective of all this testing is to develop a unique profile for the facility useful in developing operations trends, showing conditions that become predictive of how the facility responds to various beneficial or adverse conditions that could affect effluent quality and treatment efficiency. Once there exist sufficient data, operators should develop a cogent understanding of how the facility responds and what they must do to maintain it in good condition. Typically, operators should determine an overall treatment strategy for their facility, using standard industry calculations for:
Food to Mass Ratio (F/M) Mean Cell Residence Time (MCRT) Sludge Age or Dynamic Sludge Age
These values can be determined using the equipment described above. These calculations provide set-points unique to the facility that can be adjusted either through changes in sludge wasting rates or aeration capacity, assuming that the concentration of waste in the wastewater is a variable that operators cannot control. More complete understanding of the Process Monitoring and Control tests may be found in Activated Sludge Manual of Practice OM-9, Water Pollution Control Federation 1986 or in the freely downloadable (from EPA) Albert West series “Operational Control for the Activated Sludge Process,” Parts I through V. These publications, while dated, broadly cover the basic process monitoring tests and calculations required for determining operational set-points.
Wastewater Treatment Evaluation
Department of Environmental Protection L-1 Bureau of Clean Water
Attachment L—Anoxic Tank Baffle Wall
In proposing to operate the facility at 25% of capacity during low-load conditions, the evaluator and operators discussed reducing the volume of the anoxic zone tank on B-side so as to provide the correct proportional relationship between oxic (aerated) and anoxic zones for successful denitrification of nitrate. The existing anoxic tank is 10,252 gallons in capacity. Halving that capacity through the use of a portable baffle wall would provide a 5,126 gallon space in which to denitrify mixed liquor transferred from only one of the two oxic zones on B-side.
Practical considerations in fabricating such a barrier must include three things: The logistics required by operators and township staff to install and remove the
barrier as needed; Materials that are light enough but rigid and durable enough to accommodate the
intended use; and, Plumbing, valves, and subsuface mixer configuration
The evaluator envisions a three-panel, interlocking wall constructed of aluminum and durable ¾”-thick polymer/resin board, similar to that used in highly-corrosive chemical environments. The barrier would be held in place by filling the un-used portion of the anoxic tank with ballast water (most likely treated effluent,) which would provide sufficient back-pressure to maintain the wall in its aluminum channel. The barrier inself is constructed of aluminum studs sandwiched between two sheets of the polymer/resin panels. Overlapping ends of the panels could be temporarily sealed using strips of gasketing material, but it is not necessary to assure that no leakage occurs between the smaller anoxic space and the ballast water: when no longer needed, the ballast water is to be returned to the surge tank for processing.
The proposed panels should be wieldy enough for township staff to insert and remove them using the township’s backhoe and come-alongs.
It was noted during discussion with the operators that the B-side anoxic tank is configured such that it is open to both oxic zones. Plumbing changes and other modifications would be necessary to provide true isolation of the working oxic zone from the idle one.
Actual execution of the baffle wall would be supervised by the facility engineer.
If the use of a temporary baffle wall to allow the operators to isolate 25% of the facility’s treatment capacity were to become normalised operation, the facility owner would have to submit the modifications to PA DEP for approval through an NPDES Part II Permit Amendment.