2016 annual report - ag researchagresearch.montana.edu/carc/reports-pdf/annualreport_final... · a...
TRANSCRIPT

2016 ANNUAL REPORT Central Agricultural Research Center, Moccasin, MT
Fordyce, S.I.;Briar, S.S.;Fryer, H.K.;and Carr, P.M.

Acknowledgments This research report is a combination of active and completed research projects at the MSU Central Agricultural Research Center (CARC). Our projects were made possible by the Montana Fertilizer Tax Fund, as well as Pulse USA, the Montana Wheat and Barley Committee, Moore Farmers Oil, First Creek Seeds, Montech, and many others. We are particularly grateful for the financial support provided by the 2015 Montana Legislature through the Montana Research and Development Initiative (MREDI) to the MSUS, a portion of which was used to conduct research at CARC in 2016.
A special thanks is extended to farmer-cooperators who provided land on their own farms for CARC-led field experiments. Many of these cooperators have provided land for several consecutive years, in spite of the inconveniences small-plot trials can create for them. We are grateful for their willingness to work with us. In 2016, cooperators included: Richard Barber (Denton), Charlie Bumgarner (Belt/Great Falls), Chuck Davis (Geraldine), Paul Dostal (Geraldine), Andy Long (Highwood), and Bruce Udelhoven (Winifred).
Lastly, we extend a sincere thank you to members of the CARC advisory board for the counsel, encouragement, and time each of them dedicates to the research center. Their ideas and suggestions are invaluable to the development and implementation of research programs at CARC. Board members include: Janelle Bergum (Garneill), Dale Cederberg (Hobson), Terry Econom (Winifred), Mike Huber (Great Falls), Rod Linhart (Moccasin), State Advisory Delegate Pam Linker (Coffee Creek), Bryan Mauws (Judith Gap), Kelly Mikkelson (Moccasin), Rex Reilly (Stanford), Lyle Shammel (Hilger), Shane Slivka (Winifred), Kent Squires (Geraldine), Toby Stahl (Roundup), and Keith Weinheimer (Moore).
_____________________________________________________________________________________
Disclaimer: The information given herein is supplied with the understanding that no discrimination is intended and no endorsement by the Montana Agricultural Experiment Station is implied. The results of data and studies are considered to be of a PRELIMINARY nature and should NOT be considered as a product endorsement or recommendation for commercial use.
_____________________________________________________________________________________

Table of Contents 1.0 Introduction ............................................................................................................................................ 1
2.0 Useful Statistical Terms and Definitions ................................................................................................. 2
3.0 Weather .................................................................................................................................................. 4
3.1 Growing Season .................................................................................................................................. 4
3.2 Crop Year ............................................................................................................................................. 6
3.3 Calendar Year ...................................................................................................................................... 7
4.0 Climate .................................................................................................................................................... 8
4.1 Long-Term Air Temperature ............................................................................................................... 8
5.0 Variety Trial Results ................................................................................................................................ 9
5.1 Cereals ................................................................................................................................................. 9
5.1.1 Winter Wheat .............................................................................................................................. 9
5.1.2 Spring Wheat.............................................................................................................................. 13
5.1.3 Barley ......................................................................................................................................... 16
5.2 Pulses ................................................................................................................................................ 19
5.2.1 Spring Pea .................................................................................................................................. 19
5.2.2 Winter Pea ................................................................................................................................. 20
5.2.3 Spring Lentil ............................................................................................................................... 22
5.2.4 Winter Lentil .............................................................................................................................. 22
5.3 Other ................................................................................................................................................. 23
5.3.1 Safflower .................................................................................................................................... 23
5.3.2 Sorghum ..................................................................................................................................... 27
6.0 Cover Crop Trial Results ........................................................................................................................ 28
7.0 Cereal Forage Trial Results .................................................................................................................... 31
8.0 Application Trial Results ........................................................................................................................ 33
8.1 Fertilizer ............................................................................................................................................ 33
8.2 Inoculant ........................................................................................................................................... 35
8.3 Herbicide ........................................................................................................................................... 36

List of Tables
Table 1. Hypothetical experiment testing effects of seeding date and variety on crop performance. ........ 2 Table 2. Guidelines for P-Value interpretation. ............................................................................................ 3 Table 3. Observed precipitation and air temperature with long term averages, 2016 growing season ...... 4 Table 4. Summary of meteorological variables by month, 2016 calendar year. .......................................... 5 Table 5. Observed precipitation and air temperature by month with long-term averages, 2016 crop year. ...................................................................................................................................................................... 6 Table 6. Frost and min\max temperature summary, 2016 crop year. ......................................................... 6 Table 7. Observed precipitation and air temperature by month with long term averages, 2016 calendar year. .............................................................................................................................................................. 7 Table 8. Winter wheat variety trial, Moccasin, MT, 2016. ............................................................................ 9 Table 9. Winter wheat variety trial, Geraldine, Montana, 2016. ................................................................ 10 Table 10. Winter wheat variety trial, Highwood, MT, 2016. ...................................................................... 11 Table 11. Winter wheat variety trial, Winifred, MT, 2016. ......................................................................... 12 Table 12. Spring wheat variety trial, Moccasin, MT, 2016. ......................................................................... 13 Table 13. Spring wheat variety trial, Geraldine, MT, 2016. ........................................................................ 14 Table 14. Spring wheat variety trial, acidic soils, Highwood, MT, 2016. .................................................... 15 Table 15. Barley variety trial, Moccasin, MT, 2016. .................................................................................... 16 Table 16. Barley variety trial, Geraldine, MT, 2016. ................................................................................... 17 Table 17. Barley variety trial, acidic soils, Highwood, MT, 2016. ............................................................... 18 Table 18. Spring pea variety trial, Moccasin, MT, 2016. ............................................................................. 19 Table 19. Winter pea variety trial #1, Moccasin, MT, 2016. ....................................................................... 20 Table 20. Winter pea variety trial #2, Moccasin, MT, 2016. ....................................................................... 21 Table 21. Spring lentil variety trial, Moccasin, MT, 2016. ........................................................................... 22 Table 22. Winter lentil variety trial, Moccasin, MT, 2016. .......................................................................... 22 Table 23. Spineless safflower variety trial, Moccasin, MT, 2016. ............................................................... 23 Table 24. Spineless safflower variety trial, Geraldine, MT, 2016. .............................................................. 24 Table 25. Safflower statewide variety trial, Moccasin, MT, 2016. .............................................................. 25 Table 26. Safflower statewide variety trial, Geraldine, MT, 2016. ............................................................. 26 Table 27. Sorghum variety trial, Moccasin, MT, 2016. ............................................................................... 27 Table 28. Cover crop comparison study, Moccasin, MT, 2016. .................................................................. 28 Table 29. 2014 and 2016 cover crop performance with winter wheat and barley responses, Moccasin, MT, 2016. .................................................................................................................................................... 29 Table 30. Cover crop sequence study, Moccasin, MT, 2016....................................................................... 30 Table 31. Winter cereal forage performance in conventional-and no-till systems, Moccasin, MT, 2016. 31 Table 32. Spring cereal forage performance, Moccasin, MT, 2016. ........................................................... 32 Table 33. Responses of three barley varieties to varied rates of nitrogen and sulfur fertilizers Moccasin, MT, 2016. .................................................................................................................................................... 33 Table 34. Alfalfa responses to 15 fertilizer treatments, Moccasin, MT, 2016. ........................................... 34 Table 35. Spring pea inoculant trial, Moccasin, MT, 2016. ......................................................................... 35 Table 36. Spring lentil inoculant trial, Moccasin, MT, 2016. ....................................................................... 35 Table 37. Spring pea, spring lentil, and spring chickpea responses to varied rates of 8 different herbicide treatments applied in spring, Moccasin, MT, 2016. ................................................................................... 36

1
1.0 Introduction For many years, the MSU Central Agricultural Research Center (CARC) published an annual report which provided summary data and analyses of the many field experiments and other research projects that had been completed or were on-going that year. After a several-year hiatus, we are attempting to resurrect the publishing of an annual report at CARC. The 2016 version is our first attempt to do so.
Admittedly, the 2016 CARC Annual Report is not as inclusive in summarizing the research conducted at CARC the past year as future reports will be. The department head has provided some good suggestions for formatting changes that will be included in future versions. Still, I wanted a 2016 CARC Annual Report to be completed and available, and already we are late in getting it out.
There are many people who deserve a sincere thanks for the work they did so that this report could be prepared. I can only thank a few of them here because of space limitations.
Simon Fordyce, research associate in cropping systems at CARC, is the lead author of the annual report and wrote most of what is included in it. He also created many of the tables and figures that are included and improved the readability of several others. Dr. Shabeg Briar, research associate in cereal crops and soil microbiology, generated the tables that summarize the small-grain crop variety trials at CARC and associated on-farm sites. Heather Fryer, a research assistant III at CARC, helped compile information for the report and also uploaded it onto the CARC web site. Lorrie Linhart, administrative Associate III, arranged for the printing of the annual report.
Sally Dahlhausen, research assistant III in the CARC cropping systems program, and Sherry Bishop, a research assistant III with major responsibilities in grain/seed/forage processing, contributed to the annual report through their work in the field and lab, and in compiling much of the data that were used to generate the tables and figures. Darryl Grove, CARC farm manager, and Tim Bishop, CARC farm mechanic, provided assistance to research staff on several occasions when their help was requested.
A special thanks is extended to Dr. Barry Jacobsen, Head of the Department of Research Centers and Associate Director of MAES, for his direction and support of research originating at CARC, and to Dr. Charlie Boyer, Dean of the College of Agriculture and Director of MAES, for providing overall leadership of MSU-directed research conducted at CARC and across the state.
Finally, Dave Wichman is thanked for his many years of service as CARC superintendent and research agronomist. Much of the research summarized in the 2016 CARC Annual Report was directed by Dave until his retirement in July, 2016. He will be missed!
I hope you find this report useful as a source of information for some of the research conducted at CARC during the 2015-16 growing season. Feel free to call, send an email, or let me know face-to-face what you think about it. You are always welcome at the MSU Central Agricultural Research Center!
Patrick Carr, Superintendent and Associate Professor/Cropping Systems Office Phone 406.423.5421 (ext 113); email: [email protected]

2
2.0 Useful Statistical Terms and Definitions Observation: The measured value of a particular variable, such as grain yield, test weight, soil nitrate, daily precipitation, etc.
Variable: An attribute describing some entity (person, place, thing, idea) with values that ‘vary’ from one entity to the next. For instance, if variable x represents crops on a farm, then x can take on the value ‘winter wheat’ in one case and ‘barley’ in another. In experimental design, two major variable types exist: dependent and independent. The independent variable is manipulated to determine its relationship (if any) to the dependent variable.
Factor: An independent variable such as seeding date or crop variety that can be manipulated by the experimenter. Factors always have two or more levels.
Factor Levels: Different values of a factor. For example, if our factor is ‘seeding date’, one factor level might take on the value September 15th and the other October 1st.
Treatments: Combinations of factor levels. The table below shows factors, factor levels, and treatments for a hypothetical experiment which tests the effects of seeding date and variety on winter wheat performance.
Table 1. Hypothetical experiment testing effects of seeding date and variety on crop performance.
Seeding Date Variety
Keldin Loma Yellowstone
September 1st Treatment 1 Treatment 2 Treatment 3
October 1st Treatment 4 Treatment 5 Treatment 6
In this experiment there are two factors: seeding date and variety. The variety factor has three levels: Keldin, Loma, and Yellowstone. The seeding date factor has two levels: September 1st and October 1st. Thus, the experiment has six total treatments. Treatment 1 is Keldin seeded on September 1st, Treatment 2 is Loma seeded on September 1st, and so on.
[NOTE: If we eliminate the seeding date factor from the above experiment, our treatment number drops from six to three—one treatment for each factor level. Because the experiment now contains a single factor with factor levels represented by individual varieties, we refer to the experiment as a variety trial. Variety trials are a type of single-factor experiment in which treatments are represented by the varieties themselves, i.e., the different levels of the variety factor.]
Replicate: Experimental groups to which each treatment is randomly assigned. Experiments led by the Central Ag Research Center typically include three or four replicates. Replication is necessary to account for variation among treatments.

3
Treatment Mean: Treatment observations averaged across replicates. Cell values of summary tables in this report often represent treatment means. For example, Table 21 (Pg. 22) reports grain yield treatment means for several spring lentil varieties. The reported yield of the Richlea variety, for instance, is an average of yields from three different plots seeded to Richlea in three separate treatment groups or replicates.
Grand Mean, Mean, or Average: An average of treatment means. By definition, 50% of treatment means are greater than the overall mean, and vice versa. In Table 21 (Pg. 22), a summary of spring lentil variety trial results shows that grain yield of the Richlea variety is much greater than the overall mean, (reported as ‘Mean’ in the lowermost section), while test weight for the same variety is much less than the (test weight) overall mean.
P-Value: A measure of statistical significance. A P-Value of 0.05 probability indicates that 19 times out of 20, the difference among treatments is real. A P-Value of 0.001 probability indicates that 999 times out of 1000, the difference among treatments is real. The table below offers guidelines for P-Value interpretation.
Table 2. Guidelines for P-Value interpretation.
P-Value Probability of
Significant Difference Between Treatments
P ≤ 0.01 Very Strong 0.01 < P ≤ 0.05 Strong 0.05 < P ≤ 0.1 Low
P > 0.1 Very Low
Turning again to Table 21 (Pg. 22), we see that a P-Value of 0.095 probability was calculated for the variable ‘Grain Yield’, i.e., the probability of significant grain yield differences between treatments is low (Table 2). What is the P-Value for the test weight variable in Table 21? Is the probability of significant differences for test weight lower or higher than for grain yield?
Coefficient of Variation (CV): A statistic used as an indicator of variation of large and small treatment observations among replicates. Larger CVs indicate more variation and vice versa. At the Central Ag Research Center, grain yield CVs of 15% and greater are considered to be problematic. In such cases, the grain yield LSD value will be replaced by ‘NS’ for ‘non-significant’, meaning grain yield treatment differences are not likely to be real.
Least Significant Difference (LSD): A statistic used to determine whether treatment means are significantly different from one another. Turn again to Table 21 (Pg. 22) and note the LSD value for test weights. Since the test weight of the Impala variety, for instance, exceeds that of the Eagle variety by an amount greater than the LSD value, we may conclude that—all else constant—Impala is expected to out-perform Eagle with regard to test weight. Conversely, the test weight of the Impala variety exceeds that of the Redcoats variety by an amount smaller than the LSD value, so we can have little confidence that Impala will out-perform Redcoats under similar environmental conditions.

4
3.0 Weather 3.1 Growing Season (April 1, 2016 – September 30, 2016)
Total precipitation during the 2016 growing season (April 1, 2016-Sep. 30, 2016) exceeded the 107-year average despite low rainfall in June—our wettest month historically (Table 3). Roughly one quarter of the total growing season precipitation fell in the month of September, and this late-summer precipitation provided little if any benefit to the winter wheat crop. Rather, the late rains delayed harvest of the 2016 crop and delayed seeding of the 2017 crop. Figure 1 illustrates the untimeliness of these events and shows the distribution of GDDs over the 2016 growing season. A total of 4,650 Growing Degree Days (GDDs) acumulated during this 6-month period, exceeding the 3,092 GDDs necessary for maturity of hard red winter wheat. Maximum daily GDD and maximum daily precipitation were observed within the same 4-day period in early September. Peak GDD was a full month late based on the long-term average. See Table 4 for a monthly breakdown of GDDs and other meteorolgical variables.
Table 3. Observed precipitation and air temperature with long term averages, 2016 growing season
Figure 1. Daily and long-term growing degree days with daily precipitation for the 2016 growing season.
Apr May Jun Jul Aug Sep Total/Avg.
Precipitation (in.)Current Year 1.2 4.5 1.0 1.7 1.4 3.4 13.21909-2016 Avg. 1.2 2.6 3.1 1.7 1.6 1.4 11.6
Temperature (°F)Current Year 45.3 50.4 61.7 66.0 64.3 55.4 57.21911-2016 Avg. 40.9 50.1 57.9 65.9 64.9 54.9 55.8
0
1
2Apr May Jun Jul Aug Sep Oct
0
10
20
30
40
50
60
70
80
90
100
Prec
ipita
tion,
in
Gro
win
g De
gree
Uni
ts, G
DU
GDD and Precipitation - Moccasin, MT 2016
Daily Precip Daily GDD (2016) Daily GDD (1911-2016)

5
Table 4. Summary of meteorological variables by month, 2016 calendar year.
Snow Accum.
Evap. Wind
mphCurrent 1909 Current 1911 Sod Bare Bare Bare Current 1909
Year -2016 Year -2016 (-4 in.) (-4 in.) (-8 in.) (-20 in.) Year -2016
January 0.3 0.5 27.9 21.8 35.4 33.6 35.2 37.5 131 119 8.5 nR 5.3February 0.3 0.4 35.8 24.7 37.5 35.6 36.4 36.9 245 123 1.5 nR 9.3March 0.6 0.7 38.4 30.7 42.0 40.4 40.8 39.7 319 196 6.5 nR 6.6April 1.2 1.2 45.3 40.9 49.8 47.2 47.2 44.3 425 344 4.5 3.0 6.7May 4.5 2.6 50.4 50.1 56.5 54.4 53.9 49.5 576 573 3.0 7.1 6.0June 1.0 3.1 61.7 57.9 67.4 68.7 66.4 57.8 892 776 0.0 10.5 6.1July 1.7 1.7 66 65.9 73.0 73.1 71.0 63.4 1055 1047 0.0 10.8 5.4August 1.4 1.6 64.3 64.9 71.5 71.2 70.6 64.8 1003 1017 0.0 10.3 5.3September 3.4 1.4 55.4 54.9 59.8 58.4 59.2 58.7 700 695 0.0 5.5 5.6October 2.8 0.9 46.3 44.9 50.5 48.3 49.9 51.4 475 459 5.0 nR 5.8November 0.1 0.6 42.9 32.9 44.7 42.4 44.4 46.8 398 227 1.5 nR 5.7December 0.4 0.5 15.6 24.9 35.6 32.9 35.5 39.6 56 136 12.0 nR 6.2
Total/Avg. 17.7 15.3 45.8 42.9 52.0 50.5 50.9 49.2 6272 5712 42.5 47.2 6.2nR=not recorded due to freezing temperatures or soi l too cold for susta ined plant growth. *GDD=[(Max Air Temp + Min Ai r Temp)/2] - Base Temperature (32°F); where Max Air Temp is capped at 95 °F and Min Ai r Temp is capped
at 32 °F.
Month
Precipitation
inches inches
Soil TemperatureAir
Temperature
°F GDD*
Growing Degree Days

6
3.2 Crop Year (September 1, 2015 – August 31, 2016)
Below-average rainfall and above-average temperatures characterized the 2016 crop year (September 1, 2015-August 31, 2016). Warm and dry conditions were especially evident during winter months (Table 5). A minimum temperature of -5 °F was observed on November 26, 2015 (Table 6). Total monthly precipitation was greatest in May at 4.5 inches, followed by July at 1.7 inches, followed by August at 1.4 inches. Together the year’s three wettest months received 7.6 inches, or 50% of the long-term annual mean.
Table 5. Observed precipitation and air temperature by month with long-term averages, 2016 crop year.
Table 6. Frost and min\max temperature summary, 2016 crop year.
Sept Oct Nov Dec Jan Feb Mar Apr May Jun Jul Aug Total/Avg.2015 2015 2015 2015 2016 2016 2016 2016 2016 2016 2016 2016
Precipitation (in.)Current Year 0.8 0.6 0.5 0.4 0.3 0.3 0.6 1.2 4.5 1.0 1.7 1.4 13.31909-2016 Avg. 1.4 0.9 0.6 0.5 0.5 0.4 0.7 1.2 2.6 3.1 1.7 1.6 15.3
Temperature (°F)Current Year 57.6 48.4 31.8 27.6 27.9 35.8 38.4 45.3 50.4 61.7 66.0 64.3 46.31911-2016 Avg. 54.9 44.9 32.9 24.9 21.8 24.7 30.7 40.9 50.1 57.9 65.9 64.9 42.9
Last killing frost* in Spring2016 May 14 (32 °F)1911-2016 Avg. May 27
First killing frost* in Fall2016 Sep 13 (31 °F)1911-2016 Avg. Sep 15
Frost-free period2016 122 days1911-2016 Avg. 111 days
Max summer temp. 98 °F - Sep 1, 2016Min winter temp. -5 °F - Nov 26, 2015*In this summary 32°F is considered a killing frost

7
3.3 Calendar Year (January 1, 2016 – December 31, 2016)
Mean annual temperature of the 2016 calendar year (January 1, 2016 – December 31, 2016), like that of 2016 crop year, was warmer-than-average. However, total precipitation during the calendar year far exceeded total precipitation during the crop year (Tables 5 & 7). The calendar year accrued 17.7 inches, or 115% of the long-term annual mean, while the crop year received just 13.3 inches, or 87% of the long-term annual mean. The large discrepancy between the 2016 crop and calendar years can be explained by unusually wet conditions in September and October of 2016 (months excluded from the 2016 crop year). Monthly precipitation was greatest in May at 4.5 inches, followed by October at 3.4 inches, followed by September at 2.8 inches. Together the calendar year’s three wettest months received 10.7 inches of precipitation, or 70% of the long-term annual mean.
Table 7. Observed precipitation and air temperature by month with long term averages, 2016 calendar year.
Jan Feb Mar Apr May Jun Jul Aug Sep Oct Nov Dec Total/Avg.
Precipitation (in.)Current Year 0.3 0.3 0.6 1.2 4.5 1.0 1.7 1.4 3.4 2.8 0.1 0.4 17.71909-2016 Avg. 0.5 0.4 0.7 1.2 2.6 3.1 1.7 1.6 1.4 0.9 0.6 0.5 15.3
Temperature (°F)Current Year 27.9 35.8 38.4 45.3 50.4 61.7 66.0 64.3 55.4 46.3 42.9 15.6 45.81911-2016 Avg. 21.8 24.7 30.7 40.9 50.1 57.9 65.9 64.9 54.9 44.9 32.9 24.9 42.9

8
4.0 Climate 4.1 Long-Term Air Temperature (1911-2016)
A simple statistical analysis was performed on air temperature data collected over the period 1911-2016 at the Central Agricultural Research Center. While the results of our analysis identified large variability in air temperature over the 105-year period, some clear trends did emerge—most notably, a steady upward trend in mean annual temperature (Figure 2). Significance of this trend was verified by both Mann-Kendall and linear regression analyses. _____________________________________________________________________________________
IMPORTANT: THESE DATA ARE NOT GLOBAL OR REGIONAL, BUT LOCAL; THEY ARE NOT REPRESENTATIVE OF CLIMATIC TRENDS AT LOCATIONS OTHER THAN THOSE IN THE IMMEDIATE VICINITY OF THE CENTRAL AGRICULTURAL RESEARCH CENTER, MOCCASIN, MT.
_____________________________________________________________________________________
Figure 2. 1911-2016 mean annual temperature and linear model, CARC, Moccasin, MT.
Special Thanks: This dataset embodies the efforts of hundreds of researchers over multiple generations. These devoted professionals collected meteorological data every day, rain or shine, for over century. The result was an extremely valuable dataset. Montana State University and the Central Ag Research Center would like to extend a warm Thank You to these researchers for their dedication to the CARC mission.
y = 0.0266x - 9.3383R² = 0.1952
P-Value < 0.001
37
42
47
1900 1920 1940 1960 1980 2000 2020
Tem
pera
ture
, °F
Mean Annual Air Temperature (1911 - 2016) - CARC
Mean Annual Temp Linear (Mean Annual Temp)

9
5.0 Variety Trial Results 5.1 Cereals 5.1.1 Winter Wheat
Table 8. Winter wheat variety trial, Moccasin, MT, 2016.
Test Weight (lb/bu)
Protein (%)
Gross Return* ($/ac)
2016 2015-16Bearpaw 2011 MAES 38.1 38.5 57.3 14.1 167.6Broadview 2009 Meridian Seeds LLC, ALB 32.1 33.4 55.4 14.5 145.2CDC Falcon 1999 WPB/SK 35.8 38.7 56.8 13.7 153.1Colter 2013 MAES 49.7 43.4 59.3 13.5 209.6
+ Cowboy 2012 CO/WY 45.1 … 58.0 13.3 187.5Decade 2010 MAES/NDSU 38.2 41.6 57.7 13.7 163.4Jerry 2001 NDSU 36.7 37.3 55.9 14.4 164.8Judee 2011 MAES 32.6 31.7 57.9 13.9 141.5
+ Keldin 2011 Seed Linc./Wesbred LLC 47.4 … 57.6 13.1 194.4Loma 2016 MAES 41.5 41.8 58.9 13.5 175.2Northern 2015 MAES 39.3 38.6 59.4 13.5 165.8Rampart 1996 MAES 35.0 28.7 59.0 14.5 158.1SY Clearstone 2CL 2012 Syngenta 44.4 42.6 57.6 13.6 188.6SY Wolf 2010 AgriPro/Syngenta 40.6 40.9 56.8 13.7 173.5Warhorse 2013 MAES 39.3 40.1 56.1 14.1 173.1WB3768 2013 WestBred LLC 42.3 42.3 59.4 14.3 188.8WB-Quake 2011 WestBred LLC 30.1 32.7 55.9 15.0 140.7Yellowstone 2005 MAES 42.0 44.1 57.6 13.8 180.9Average 40.5 39.7 57.8 13.9 174.9LSD (0.05) 8.1 7.8 2.9 … …C.V. (%) 10.8 9.4 2.5 … …
+ = new for 2016
*Gross returns ca lculated based on protein premiums\dockages as of September 2016, United Gra ins Elevator, Moccas in, MT.
Note: Study averages include experimenta l l ines not l i s ted here. Tria l seeded 9/23/2015 and harvested 8/2/2016.
Grain Yield (bu/ac)Year of Release
SourceVariety/Pedigree2016

10
Table 9. Winter wheat variety trial, Geraldine, Montana, 2016.
Test Weight (lb/bu)
Protein (%)
Gross Return* ($/ac)
2016 2015-16Bearpaw 2011 MAES 76.9 78.7 61.4 9.6 219.9Broadview 2009 Meridian Seeds LLC, ALB 78.1 72.1 61.7 9.5 220.1CDC Falcon 1999 WPB/SK 77.5 75.4 62.1 10.1 237.0Colter 2013 MAES 82.1 81.6 62.1 10.0 248.0
+ Cowboy 2012 CO/WY 98.8 … 62.6 8.5 239.1Decade 2010 MAES/NDSU 71.8 73.4 63.0 9.0 188.0Jerry 2001 NDSU 74.1 74.5 61.0 9.6 211.9Judee 2011 MAES 71.6 74.7 64.0 9.8 210.5
+ Keldin 2011 Seed Linc./Wesbred LLC 101.1 … 63.8 9.1 268.7Loma 2016 MAES 77.3 77.3 62.0 9.8 227.2Northern 2015 MAES 90.1 83.0 62.2 9.6 257.6Rampart 1996 MAES 72.5 68.1 63.0 10.4 230.5SY Clearstone 2CL 2012 Syngenta 92.7 82.8 62.3 9.2 250.3SY Wolf 2010 AgriPro/Syngenta 94.0 88.1 64.6 9.3 257.5Warhorse 2013 MAES 80.6 76.2 62.7 10.4 256.1WB3768 2013 WestBred LLC 94.4 87.0 63.4 8.8 239.8WB-Quake 2011 WestBred LLC 73.7 74.3 62.5 10.1 225.3Yellowstone 2005 MAES 89.8 88.3 62.7 9.2 242.5Average 85.4 79.8 62.6 9.5 240.1LSD (0.05) 6.0 … 0.5 … …C.V. (%) 3.8 … 0.4 … …
+ = new for 2016
*Gross returns ca lculated based on protein premiums\dockages as of September 2016, United Gra ins Elevator, Moccas in, MT.
Note: Study averages include experimenta l l ines not l i s ted here. Tria l seeded 9/22/2015 and harvested 7/26/2016.
Variety/PedigreeYear of Release
Source Grain Yield (bu/ac)
2016

11
Table 10. Winter wheat variety trial, Highwood, MT, 2016.
Year of Grain Yield Protein Gross Return*Release (bu/ac) (%) ($/ac)
Bearpaw 2011 MAES 48.1 10.6 156.7Broadview 2009 Meridian Seeds LLC, ALB 57.3 9.9 170.6CDC Falcon 1999 WPB/SK 58.5 11.1 202.5Colter 2013 MAES 54.0 12.3 208.5
+ Cowboy 2012 CO/WY 60.7 9.9 181.0Decade 2010 MAES/NDSU 55.0 11.0 188.2Jerry 2001 NDSU 41.6 9.9 123.8Judee 2011 MAES 66.0 12.0 248.9
+ Keldin 2011 Seed Linc./Wesbred LLC 58.3 11.6 212.6Loma 2016 MAES 55.4 11.9 207.0MT1138 NA MAES 61.7 11.7 226.9Northern 2015 MAES 58.5 12.5 229.2Rampart 1996 MAES 46.3 11.3 164.0SY Clearstone 2CL 2012 Syngenta 68.5 11.8 254.0SY Wolf 2010 AgriPro/Syngenta 43.1 11.1 149.1Warhorse 2013 MAES 68.3 12.2 261.5WB3768 2013 WestBred LLC 51.3 10.5 165.1WB-Quake 2011 WestBred LLC 51.6 12.1 196.2Yellowstone 2005 MAES 51.2 11.4 183.3Average 56.1 11.2 196.7LSD (0.05) 8.7 … …C.V. (%) 8.7 … …P-value <0.0001 … …
+ = new for 2016
*Gross returns ca lculated based on protein premiums\dockages as of September 2016, United Gra ins Elevator, Moccas in, MT.
Note: Study averages include experimenta l l ines not l i s ted here. Tria l seeded 9/26/2015 and harvested 7/29/2016.
Variety/Pedigree Source

12
Table 11. Winter wheat variety trial, Winifred, MT, 2016.
Test Weight (lb/bu)
Protein (%)
Gross Return* ($/ac)
2016 2015-16Bearpaw 2011 MAES 79.7 65.1 61.6 9.5 224.7Broadview 2009 Meridian Seeds LLC, ALB 77.7 59.7 61.9 10.2 240.9CDC Falcon 1999 WPB/SK 76.5 66.2 62.1 10.1 234.0Colter 2013 MAES 82.7 69.2 62.4 9.5 233.1
+ Cowboy 2012 CO/WY 98.5 … 62.0 8.8 250.2Decade 2010 MAES/NDSU 75.5 67.4 62.1 9.5 212.8Jerry 2001 NDSU 73.3 60.7 60.7 10.1 224.1Judee 2011 MAES 88.4 67.0 63.8 10.0 266.8
+ Keldin 2011 Seed Linc./Wesbred LLC 105.7 … 63.0 9.1 281.1Loma 2016 MAES 92.4 78.6 62.6 10.5 297.5Northern 2015 MAES 91.3 72.3 62.1 9.6 261.1Rampart 1996 MAES 71.2 55.3 61.2 11.5 257.7SY Clearstone 2CL 2012 Syngenta 89.7 64.1 62.2 9.1 238.5SY Wolf 2010 AgriPro/Syngenta 101.5 77.9 63.9 9.7 294.4Warhorse 2013 MAES 84.2 66.8 62.5 10.3 264.3WB3768 2013 WestBred LLC 87.5 67.8 63.0 9.0 229.2WB-Quake 2011 WestBred LLC 81.2 67.3 62.6 9.3 222.4Yellowstone 2005 MAES 92.5 76.0 62.5 9.9 275.5Average 86.4 67.8 62.3 9.7 249.8LSD (0.05) 8.38 ns 0.70 … …C.V. (%) 5.22 9.10 0.50 … …
+ = new for 2016
*Gross returns ca lculated based on protein premiums\dockages as of September 2016, United Gra ins Elevator, Moccas in, MT.
Note: Study averages include experimenta l l ines not l i s ted here. Tria l seeded: 9/22/2015 and harvested 8/2/2016.
Variety/PedigreeYear of Release
Source Grain Yield (bu/ac)
2016

13
5.1.2 Spring Wheat
Table 12. Spring wheat variety trial, Moccasin, MT, 2016.
Test Weight (lb/bu)
Protein(%)
Gross Return* ($/ac)
2016 2015-16 2014-16Alum 2014 WSU 37.5 … … 61.1 13.6 173.2Brennan 2009 Syngenta/AgriPro 31.1 29.6 29.8 62.0 14.7 150.2Choteau 2003 MAES 35.9 31.8 30.9 59.9 14.3 170.9Corbin 2006 Westbred, LLC 30.3 29.1 31.0 59.8 14.5 145.3Duclair 2011 MAES 35.4 33.1 33.8 59.1 13.3 161.1Egan 2013 Westbred, LLC 37.4 33.7 33.8 59.3 14.5 179.4Fortuna 1966 MAES/NDSU 35.1 32.8 32.2 59.6 14.0 165.0HRS3100 -- Croplan 35.3 … … 60.5 14.0 165.6HRS3504 -- Croplan 35.2 … … 60.0 13.9 164.6HRS3530 -- Croplan 32.2 … … 59.4 14.7 155.9HRS3361 -- Croplan 29.3 … … 60.4 15.0 143.3McNeal 1995 MAES 31.0 29.1 28.7 60.2 14.0 145.6Mott 2009 NDSU 27.9 26.3 27.2 60.9 15.1 137.1Oneal 2008 WestBred, LLC 33.1 33.3 32.0 60.8 13.8 154.3Prestige 2015 Pulse USA 31.4 30.0 31.4 60.4 14.7 151.8Redstone 2014 Pulse USA 29.0 26.6 28.1 57.0 14.2 137.5Reeder 1999 NDSU 36.3 31.7 31.0 60.1 14.5 174.1SY Soren 2011 Syngenta/AgriPro 32.4 28.5 … 60.5 15.8 164.0SY Tyra 2011 MAES/Syngenta/AgriPro 36.2 30.9 29.0 61.1 12.9 161.9Vida 2005 MAES 33.5 32.2 34.0 60.2 14.0 157.5WB Gunnison -- Westbred, LLC 33.2 32.0 32.2 60.3 13.4 152.1WB9879CLP -- MAES 33.8 30.8 47.1 61.3 14.5 162.2Average 33.9 30.7 32.0 60.2 14.2 160.5LSD (0.05) 8.10 … … 1.61 … …C.V. (%) 14.50 … … 1.30 … …
*Gross returns ca lculated based on protein premiums\dockages as of September 2016, United Gra ins Elevator, Moccas in, MT.
Note: Tria l seeded 4/16/16 and harvested 8/17/2016. Ferti l i zer appl ied at 10+15+10+5 w/seed + 90 lbs N top urea.
Grain Yield (bu/ac)
2016Variety/Pedigree
Year of Release
Source

14
Table 13. Spring wheat variety trial, Geraldine, MT, 2016.
Test Weight (lb/bu)
Protein(%)
Gross Return* ($/ac)
2016 2015-16 2014-16Alum 2014 WSU 42.0 … … 62.2 11.4 174.4Brennan 2009 Syngenta/AgriPro 35.6 40.1 37.6 61.7 13.0 160.2Choteau 2003 MAES 39.9 36.7 36.2 60.5 11.9 170.4Corbin 2006 Westbred, LLC 36.9 35.8 35.3 61.2 11.2 150.4Duclair 2011 MAES 41.2 38.2 37.7 59.7 10.9 162.8Egan 2013 Westbred, LLC 40.8 39.8 38.0 59.8 12.7 181.1Fortuna 1966 MAES/NDSU 34.4 35.1 33.9 60.8 12.4 150.4HRS3100 -- Croplan 29.5 … … 57.0 11.6 124.4HRS3504 -- Croplan 34.8 … … 58.6 10.4 130.8HRS3530 -- Croplan 30.0 … … 59.3 11.6 127.2HRS3361 -- Croplan 26.7 … … 58.6 12.0 114.8McNeal 1995 MAES 36.5 37.7 35.2 58.6 11.7 154.7Mott 2009 NDSU 32.8 36.9 34.5 59.2 12.5 144.2Oneal 2008 WestBred, LLC 36.0 37.6 35.0 58.7 11.2 146.7Prestige 2015 Pulse USA 32.0 37.2 35.0 59.5 11.6 134.9Redstone 2014 Pulse USA 38.2 33.0 33.2 59.4 11.8 162.6Reeder 1999 NDSU 38.6 38.7 37.1 61.6 11.4 160.4SY Soren 2011 Syngenta/AgriPro 36.0 … … 59.8 12.3 156.9SY Tyra 2011 MAES/Syngenta/AgriPro 29.2 36.0 34.2 56.7 12.1 126.2Vida 2005 MAES 37.4 39.8 38.1 60.2 11.2 152.3WB Gunnison -- Westbred, LLC 34.9 36.3 35.0 61.4 11.0 139.4WB9879CLP -- MAES 37.2 39.5 39.6 60.7 11.7 159.2Average 35.2 37.4 36.0 59.9 11.5 146.3LSD (0.05) 5.74 … … 1.58 … …C.V. (%) 9.94 … … 1.28 … …
*Gross returns ca lculated based on protein premiums\dockages as of September 2016, United Gra ins Elevator, Moccas in, MT.
Note: Tria l seeded 4/22/2016 and harvested 8/18/2016. Ferti l i zer appl ied at 10+15+10+5 w/seed + 60 lbs N top urea.
Grain Yield (bu/ac)
2016Variety/Pedigree
Year of Release
Source

15
Table 14. Spring wheat variety trial, acidic soils, Highwood, MT, 2016.
Variety/PedigreeYear of Release
Source Grain Yield
(bu/a)Test Weight
(lb/bu)Protein
(%)Gross Return
($/ac)Alum 2014 WSU 46.4 62.7 13.2 210.3Brennan 2009 Syngenta/AgriPro 27.6 59.8 15.4 137.2Choteau 2003 MAES 35.1 58.8 13.0 157.8Corbin 2006 Westbred, LLC 35.0 60.6 13.1 157.9Duclair 2011 MAES 37.2 59.7 12.5 163.4Egan 2013 Westbred, LLC 42.2 60.3 14.5 202.2Fortuna 1966 MAES/NDSU 28.7 60.3 13.0 129.0HRS3100 -- Croplan 31.7 58.7 11.1 127.8HRS3504 -- Croplan 33.9 59.5 12.1 146.3HRS3530 -- Croplan 30.7 57.0 12.8 136.9HRS3361 -- Croplan 23.8 58.4 12.4 104.1McNeal 1995 MAES 29.9 58.1 12.2 129.8Mott 2009 NDSU 30.9 58.5 14.5 148.0Oneal 2008 WestBred, LLC 30.4 58.1 12.1 131.0Prestige 2015 Pulse USA 22.1 57.4 12.2 95.8Redstone 2014 Pulse USA 39.1 59.3 12.3 170.3Reeder 1999 NDSU 37.8 59.9 13.6 174.5SY Soren 2011 Syngenta/AgriPro 29.3 60.4 14.8 142.1SY Tyra 2011 MAES/Syngenta/AgriPro 23.0 57.6 13.3 104.9Vida 2005 MAES 33.9 59.4 11.5 142.2WB Gunnison -- Westbred, LLC 29.5 61.3 11.5 123.6WB9879CLP -- MAES 35.9 59.8 13.3 163.4Average 32.4 59.4 12.9 145.2LSD (0.05) 4.94 2.53 … …C.V. (%) 9.31 2.07 … …
*Gross returns ca lculated based on protein premiums\dockages as of September 2016, United Gra ins Elevator, Moccas in, MT.
Note: Tria l seeded 4/11/2016 and harvest 8/17/16. Ferti l i zer appl ied at 10+15+10+5 w/seed + 60 lbs N top urea.

16
5.1.3 Barley
Table 15. Barley variety trial, Moccasin, MT, 2016.
Protein(%)
Test Weight (lb/bu)
Plump(%)
2016 2015-16 2014-16Champion 2007 WestBred, LLC F 57.6 54.4 49.7 14.4 55.3 85.1Conlon 1996 NDSU M/F 41.5 … … 15.2 53.2 76.8Conrad 2007 MAES M/F 46.5 46.6 47.0 16.3 54.2 65.3Craft -- -- M/F 40.5 43.7 43.2 14.9 56.3 75.9Eslick 2003 MAES F 70.9 … … 13.4 55.8 90.6Genesis 2015 NDSU M/F 42.2 … … 13.3 54.7 84.4Harrington 1981 Canada M/F 46.8 44.8 46.7 15.3 53.7 40.8Haxby 2003 MAES F 60.0 55.3 54.9 13.6 56.5 87.6Haybet 1989 MAES/USDA Forage 36.7 39.7 … 16.4 52.3 30.2Hays 2003 MAES Forage 53.4 … … 15.9 53.9 74.8Hockett 2008 MAES M/F 59.3 52.4 50.0 13.8 56.1 32.3Lavina 1989 MAES/USDA Forage 59.8 54.5 … 14.3 53.0 21.0Merit -- -- -- 52.2 47.6 …. 16.5 53.7 43.3Metcalfe -- Canada M/F 48.4 44.9 47.8 15.3 55.4 89.2Moravian115 -- -- -- 39.1 38.8 15.4 52.7 73.4Overture -- Britain -- 58.8 … … 13.2 55.2 86.9Pinnacle 2006 NDSU M/F 48.9 … … 13.6 55.7 96.5Rawson 2005 NDSU F 49.5 … … 13.3 56.3 94.3Stepford -- -- Forage 45.8 … … 13.8 49.2 89.7Stockford -- -- Forage 64.1 54.4 13.1 54.7 93.0Average 51.38 48.1 48.5 14.3 54.6 73.0C.V. (%) 19.22 … … 8.33 2.39 30.19LSD (0.05) 21.63 … … … 3.66 …
Note: Tria l seeded 4/4/2016 and harvested 8/8/2016. Ferti l i zer appl ied at 10+15+10+5 w/seed + 30 N topdress urea.
2016
Grain Yield (bu/ac)Year of Release
Variety/Pedigree Source Type

17
Table 16. Barley variety trial, Geraldine, MT, 2016.
Protein(%)
Test Weight (lb/bu)
Plump(%)
2016 2015-16Champion 2007 WestBred, LLC F 87.7 73.6 10.1 57.4 91.4Conlon 1996 NDSU M/F 67.7 … 11.9 54.9 94.7Conrad 2007 MAES M/F 86.9 70.9 11.9 55.0 94.2Craft -- -- M/F 64.3 58.7 12.1 56.3 92.7Eslick 2003 MAES F 106.0 … 11.2 55.6 88.7Genesis 2015 NDSU M/F 75.8 … 10.4 55.9 90.0Harrington 1981 Canada M/F 78.2 66.6 11.6 56.5 92.0Haxby 2003 MAES F 79.3 70.5 10.9 57.1 91.7Haybet 1989 MAES/USDA Forage 58.1 52.5 12.1 54.7 69.7Hays 2003 MAES Forage 89.1 … 10.9 54.1 87.2Hockett 2008 MAES M/F 84.1 67.8 10.5 58.3 95.1Lavina 1989 MAES/USDA Forage 87.0 68.7 10.9 53.4 76.7Merit -- -- -- 84.1 74.0 11.2 56.2 87.9Metcalfe -- Canada M/F 79.1 67.0 11.7 56.1 91.9Moravian115 -- -- -- 91.5 67.8 10.8 55.9 92.2Overture -- Britain -- 90.9 … 11.4 57.3 93.5Pinnacle 2006 NDSU M/F 75.8 … 10.8 56.1 94.0Rawson 2005 NDSU F 63.5 … 12 56.6 89.0Stepford -- -- Forage 69.6 … 11.7 50.7 93.1Stockford -- -- Forage 84.1 65.7 10.9 54.0 93.7Average 80.35 67.0 11.07 55.6 90.1C.V. (%) 8.09 … 6.14 1.19 6.14LSD (0.05) 14.23 … … 1.85 …
Note: Tria l seeded 4/11/2016 and harvested 8/15/2016. Ferti l i zer appl ied at 10+15+10+5 w/seed + 30 N topdress urea.
2016Variety/Pedigree
Year of Release
Source TypeGrain Yield (bu/ac)
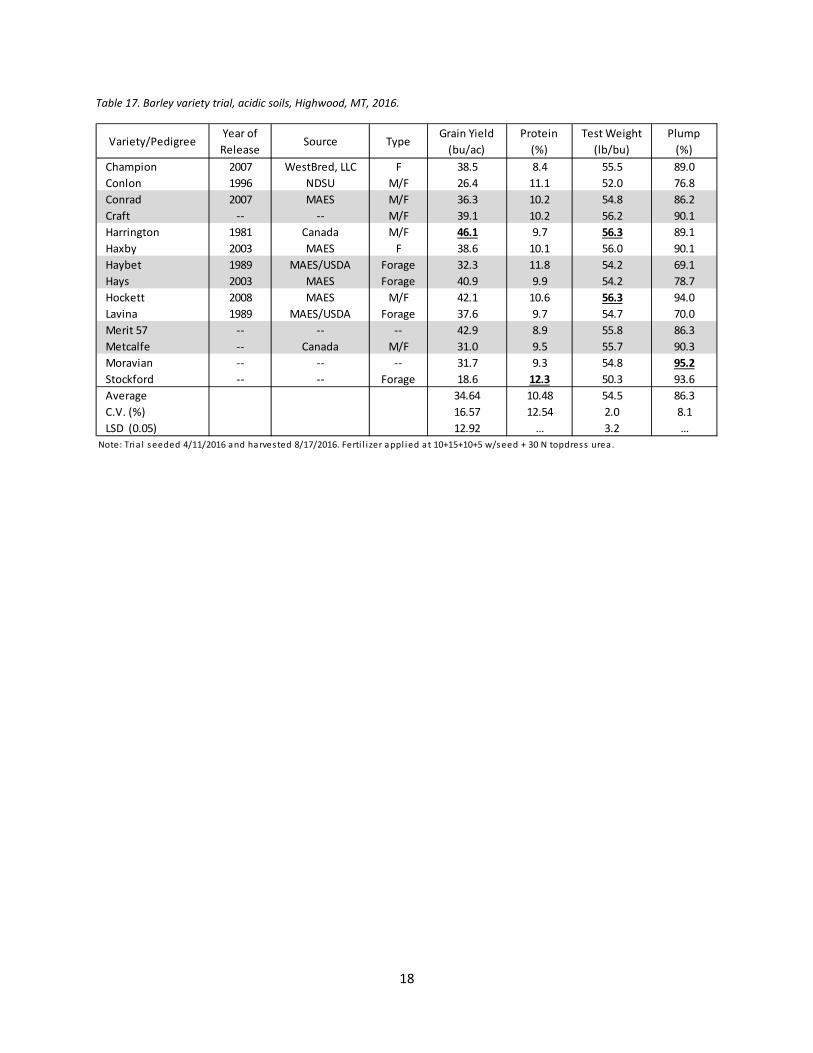
18
Table 17. Barley variety trial, acidic soils, Highwood, MT, 2016.
Variety/PedigreeYear of Release
Source TypeGrain Yield
(bu/ac)Protein
(%)Test Weight
(lb/bu) Plump
(%)Champion 2007 WestBred, LLC F 38.5 8.4 55.5 89.0Conlon 1996 NDSU M/F 26.4 11.1 52.0 76.8Conrad 2007 MAES M/F 36.3 10.2 54.8 86.2Craft -- -- M/F 39.1 10.2 56.2 90.1Harrington 1981 Canada M/F 46.1 9.7 56.3 89.1Haxby 2003 MAES F 38.6 10.1 56.0 90.1Haybet 1989 MAES/USDA Forage 32.3 11.8 54.2 69.1Hays 2003 MAES Forage 40.9 9.9 54.2 78.7Hockett 2008 MAES M/F 42.1 10.6 56.3 94.0Lavina 1989 MAES/USDA Forage 37.6 9.7 54.7 70.0Merit 57 -- -- -- 42.9 8.9 55.8 86.3Metcalfe -- Canada M/F 31.0 9.5 55.7 90.3Moravian -- -- -- 31.7 9.3 54.8 95.2Stockford -- -- Forage 18.6 12.3 50.3 93.6Average 34.64 10.48 54.5 86.3C.V. (%) 16.57 12.54 2.0 8.1LSD (0.05) 12.92 … 3.2 …
Note: Tria l seeded 4/11/2016 and harvested 8/17/2016. Ferti l i zer appl ied at 10+15+10+5 w/seed + 30 N topdress urea.

19
5.2 Pulses 5.2.1 Spring Pea
Table 18. Spring pea variety trial, Moccasin, MT, 2016.
Plant Count
Days to Flower
Days to Maturity
Canopy Height
Lodging Score*
Grain Yield
Test Weight
Seeds per Pound
(plants/ft²) (inches) (0-9) (bu/ac) (lb/bu) (seeds/lb)
AAC Carver 6.0 74 108 19 1 24.2 67.0 1813AAC Lacombe 7.2 75 112 18 2 25.6 65.6 1617Abarth 7.0 72 108 16 3 22.0 66.2 1680AC Earlystar 8.2 73 109 17 2 21.2 66.8 1929Agassiz 7.7 75 108 16 1 25.5 66.1 1891Bridger 7.8 71 108 16 2 21.0 67.4 1950CDC Amarillo 7.0 75 110 17 1 28.3 66.3 1870CDC Saffron 8.8 75 108 16 2 25.9 66.4 1861CDC Treasure 7.9 72 107 18 2 21.3 67.3 1983Delta 7.4 72 107 14 3 23.2 67.1 1982DS Admiral 7.8 74 108 16 2 23.6 66.5 1861Durwood 7.8 74 110 19 1 30.0 67.2 1848Gunner 8.5 74 110 17 2 25.0 66.6 1802Hyline 7.2 75 108 18 1 22.1 66.3 1802Jet Set 7.9 74 109 17 1 23.4 66.8 1925Korando 6.6 69 109 16 3 21.5 66.3 1656Majestic 7.6 75 109 17 1 26.3 66.4 1771Navarro 7.9 70 110 15 3 21.1 66.1 1589Nette 2010 7.5 72 108 16 2 24.2 67.6 1856Pro 093-7410 7.5 71 108 17 2 23.5 66.9 1945Salamanca 6.5 74 108 16 2 24.3 67.1 1762Spider 8.3 74 111 17 2 23.0 66.0 1758
Aragon 8.7 72 107 14 3 19.9 65.1 2040Arcadia 8.3 74 108 14 3 19.6 66.9 2104Banner 7.3 69 108 16 2 21.6 66.7 2036CDC Patrick 7.8 74 110 16 2 23.0 66.6 2263CDC Raezer 7.7 72 110 17 2 22.0 66.1 1926Cruiser 7.1 73 107 15 3 19.1 65.2 2182Ginny 7.9 72 108 15 2 21.3 66.7 2090Greenwood 8.3 72 108 14 3 22.5 66.5 2109Hampton 8.0 74 109 14 2 23.8 65.5 1885LN 1123 8.8 75 109 15 2 22.6 67.2 1923Majoret 8.0 74 109 16 3 20.9 66.8 1901Viper 8.1 71 109 17 2 21.3 66.6 1795
P-Value 0.989 < 0.001 < 0.001 < 0.001 < 0.001 < 0.001 < 0.001 < 0.001Mean 7.7 73 109 16.2 1.9 23.1 66.5 1894.4CV% 24.2 1.4 0.9 9.6 33.1 10.5 0.8 2.6LSD (0.05) NS 1.4 1.3 2.2 0.9 3.4 0.8 68.0
*Lodging score: 0=Al l plants upright; 9=Al l plants prostrate
Note: Tria l seeded 4/8/2016 and harvested 8/1/2016.
All
(days)
Variety/Pedigree
Green Cotyl. Type
Yellow Cotyl. Type

20
5.2.2 Winter Pea
Table 19. Winter pea variety trial #1, Moccasin, MT, 2016.
Days to Flower*
Grain Yield
Test Weight
Seeds per Pound
(days) (bu/ac) (lb/bu) (seeds/lb)
MTWP97097 67 22.8 66.5 3090MTWP980961 66 21.0 67.4 3598MTWP980962 67 19.2 66.4 2427MTWP980963G 69 12.7 66.2 2994MTWP980963Y 67 18.1 66.1 2865MTWP981032BE 66 18.4 66.7 3141MTWP98106BE 67 18.1 67.3 3429PS0017018 67 20.6 66.2 3111PS0230F092 68 9.8 65.0 3167PS03101150 67 15.3 66.1 2864PS03101160W 65 14.5 66.3 2334PS05300180W 66 13.2 66.3 3146PS05300225 66 17.9 65.8 2662PS0530069 66 18.2 66.0 2391PS0530078 66 15.8 65.9 2190PS0530083 65 14.7 66.4 2628PS9830F011 66 21.1 66.7 3076P-Value < 0.001 < 0.001 < 0.001 < 0.001Mean 66 17.1 66.3 2889CV% 1.3 16 0.6 5.7LSD (0.05) 1.2 NS** 0.5 234.2
*Apri l 1, 2016 to date of fi rs t flowering
**LSD cons idered non-s igni ficant when gra in yield CV% > 15
Note: Tria l seeded 9/22/2015 and harvested 7/26/2016.
Variety/Pedigree

21
Table 20. Winter pea variety trial #2, Moccasin, MT, 2016.
Days to Flower*
Grain Yield
Test Weight
Seeds per Pound
(days) (bu/ac) (lb/bu) (seeds/lb)
1234-271-1 66 16.2 66.7 28831234-271-2 66 14.8 66.7 26101234-273-0 66 12.6 67.1 313512WIL01-0 66 10.5 65.5 269112WIL02-0 66 17.1 68.1 274812WIL04-0 66 13.2 66.3 298412WIL07-0 66 12.9 67.2 322812WIL10-0 67 16.0 66.5 303912WIL11-0 66 11.5 67.3 283912WIL17-0 66 14.1 66.4 2782X09MP012-0-1-W-MT 66 12.7 66.5 2736X09MP020-0-1-W-MT 67 13.3 66.8 2811X09MP021-0-1-W-MT 66 11.8 66.9 2894X09RP040-0-1-1-MT 66 14.3 66.8 2986X09RP040-0-7-1-MT 66 14.2 67.2 2476P-Value 0.409 0.370 < 0.001 < 0.001Mean 66 13.7 66.8 2862CV% 0.8 26 0.5 6.6LSD (0.05) NS NS 0.5 271.6
*Apri l 1, 2016 to date of fi rs t flowering
Note: Tria l seeded 9/22/2015 and harvested 7/27/2016.
Variety/Pedigree

22
5.2.3 Spring Lentil
Table 21. Spring lentil variety trial, Moccasin, MT, 2016.
5.2.4 Winter Lentil
Table 22. Winter lentil variety trial, Moccasin, MT, 2016.
Plant Count
Days to Flower
Days to Maturity
Canopy Height
Vine Length
Lodging Score*
Grain Yield
Test Weight
(plants/ft²) (0-9) (lb/ac) (lb/bu)
Avondale 14.5 72 112 11 13 1.3 1430 62.9CDC Imigreen 13.3 74 114 12 14 1.0 1142 62.0CDC Impala CL 13.0 75 111 12 12 1.0 1299 65.4CDC Redcoats 15.8 75 111 11 12 1.0 1235 64.9CDC Richlea 14.9 73 112 12 13 1.3 1497 62.7CDC Viceroy 14.6 76 112 11 12 0.8 1311 65.1Eagle 12.9 72 112 11 12 1.3 1243 64.3Imvincible 12.8 76 112 11 12 1.0 1340 64.7P-Value 0.060 < 0.001 < 0.001 0.439 0.028 0.689 0.095 < 0.001Mean 14.0 74.1 111.8 11.5 12.4 1.1 1312 64.0CV% 10.5 0.8 0.4 8.7 6.5 40.4 12.0 0.8LSD (0.05) NS NS 0.64 NS 1.2 NS NS 0.76
*Lodging score: 0=Al l plants upright; 9=Al l plants prostrate
Note: Tria l seeded 4/8/2016 and harvested 8/4/2016.
(days ) (inches)
Variety/Pedigree
Days to Flower*
Flower Duration
Grain Yield
Test Weight
(bu/ac) (lb/bu)
LC99709065 69 20 18.9 66.6LC9976079 67 23 13.3 66.1LC9977019 66 24 17.8 66.3LC9977116 66 23 13.5 66.3LC99780571 66 23 12.4 66.6LC9978094 67 24 12.8 66.3LC9979016 70 22 18.3 66.4LC9979120 69 21 18.5 66.6WA8649090 66 24 15.3 66.8P-Value 0.012 0.078 0.005 < 0.001Mean 67 23 15.6 66.4CV% 2.3 8.5 17.9 0.3LSD (0.05) 2.3 NS NS** 0.3
*Apri l 1, 2016 to date of fi rs t flowering
**LSD cons idered non-s igni ficant when gra in yield CV% > 15
Note: Tria l seeded 9/22/2015 and harvested 8/2/2016.
(days )
Variety/Pedigree

23
5.3 Other 5.3.1 Safflower
Table 23. Spineless safflower variety trial, Moccasin, MT, 2016.
Grain Yield Test Weight Oil
(lb/ac) (lb/bu) (%)
Baldy 628.7 46.2 27.1Cardinal 669.0 42.0 35.8Finch 632.3 43.7 33.0Rubis Red 663.9 46.0 28.711 C 21 800.1 44.3 30.911Saff01 687.0 43.8 29.211Saff17 701.8 45.3 28.811Saff18 770.4 45.2 28.7132 Saff 02 SaffD17 811.6 44.0 29.9132Saff01 Saff D12 624.9 45.3 29.2132Saff19 647.3 44.8 27.9C14 red 3SC14 602.7 44.0 28.3C15 609.6 42.3 26.6C18 short 6SC18 700.9 45.9 29.0C21SE3 H 576.5 45.7 28.4D13 716.6 45.4 28.6D20 793.5 44.3 28.5D23 882.5 45.5 27.4Saff D11 649.0 45.5 28.4Saff D14 753.1 45.0 28.3Average 696.1 44.7 29.1LSD (0.05) NS 1.62 1.26C.V. (%) 22.10 1.73 0.77P- Value NS < 0.001 < 0.001
Variety/Pedigree

24
Table 24. Spineless safflower variety trial, Geraldine, MT, 2016.
Grain Yield Test Weight Oil
(lb/ac) (lb/bu) (%)
Baldy 1189 43.4 26.7Cardinal 1712 42.7 34.7Finch 1692 43.5 31.3Rubis Red 1763 46.1 30.311 C 21 1859 44.4 30.411Saff01 2001 44.1 26.611Saff17 1667 45.5 27.611Saff18 1886 44.6 28.0132 Saff 02 SaffD17 1849 44.8 27.6132Saff01 Saff D12 1744 44.7 27.7132Saff19 1496 44.0 27.5C14 red 3SC14 1833 46.7 30.2C15 1344 42.2 28.1C18 short 6SC18 1819 46.3 29.1C21SE3 H 1853 46.6 30.4D13 1863 45.8 27.5D20 1867 44.4 27.8D23 1974 45.1 27.4Saff D11 1694 44.8 31.1Saff D14 2052 45.1 27.3Average 1758 44.7 28.9LSD (0.05) 311 1.43 1.53C.V. (%) 12.4 1.53 2.54P- Value < 0.001 < 0.001 < 0.001
Variety/Pedigree

25
Table 25. Safflower statewide variety trial, Moccasin, MT, 2016.
Grain Yield Test Weight Oil
(lb/ac) (lb/bu) (%)
10B6015 461.3 40.6 36.5Baldy 717.4 45.3 27.4Cardinal 767.5 41.9 35.6Finch 616.5 43.1 35.7Hybrid 1601 871.1 40.1 37.1Hybrid 200 707.6 41.3 34.3Hybrid 300 842.9 42.4 33.6Hybrid 446 753.8 43.5 32.6Hybrid 621 887.1 36.8 43.4MonDak 617.5 42.5 35.3Montola 2003 638.0 41.7 36.1NutraSaff 508.9 37.1 48.2Rubis Red 756.5 45.2 28.6STI 1201 667.9 35.7 43.5Average 701.0 41.2 36.3LSD (0.05) NS* 1.17 1.41C.V. (%) 22.02 1.31 1.79P- Value 0.008 < 0.001 < 0.001
*LSD cons idered non-s igni ficant when gra in yield CV% > 15
Variety/Pedigree

26
Table 26. Safflower statewide variety trial, Geraldine, MT, 2016.
Grain Yield Test Weight Oil
(lb/ac) (lb/bu) (%)
10B6015 1493.8 40.4 35.0Baldy 1403.9 43.9 27.3Cardinal 1985.6 42.2 32.6Finch 1703.4 42.5 33.7Hybrid 1601 2326.9 39.5 36.3Hybrid 200 1998.4 41.9 30.8Hybrid 300 2404.6 42.6 31.3Hybrid 446 2396.7 43.9 30.0Hybrid 621 1686.6 35.5 41.1MonDak 2254.2 41.7 34.6Montola 2003 1854.6 41.8 36.5NutraSaff 1555.9 37.7 46.0Rubis Red 1815.9 45.5 29.7STI 1201 1620.6 35.6 43.9Average 1892.9 41.0 34.9LSD (0.05) 288.3 1.64 1.25C.V. (%) 10.60 1.73 1.66P- Value < 0.001 < 0.001 < 0.001
Variety/Pedigree

27
5.3.2 Sorghum
Table 27. Sorghum variety trial, Moccasin, MT, 2016.
Grain Yield*
(lb/ac)
13 Sorg23 177.613NW6-119 171.613Sorg12 154.813Sorg12D red 223.613Sorg12NirrWhite 109.013Sorg17-14Nirr 184.413Sorg19 99.813Sorg22-17Nirr whiteseed 102.713sorg25 231.713Sorg25Nirr 162.613Sorg29 177.413Sorg29 NIrr 148.013Sorg29drkhd 136.213Sorg29Nirrwhite 71.213Sorg37 96.213Sorg44-35Nirr 140.413Sorg45 45.813SorgNW6-109 287.2Bag 2 13Sorg12 Ndry 50.1DK18C 138.1P-Value < 0.001Mean 2.6CV% 32.1LSD (0.05) NS**
*Up to 80% harvest loss due to poor threshing
**LSD cons idered non-s igni ficant when gra in yield CV% > 15
Note: Tria l seeded 6/1/2016 and harvested 10/21/2016.
Variety/Pedigree

28
6.0 Cover Crop Trial Results
Table 28. Cover crop comparison study, Moccasin, MT, 2016.
Harvest Date
Plant Count
Dry Matter Yield
AUMs per Acre
(m/d) (plants/ft²) (lb/ac) (AUM/ac)
Alsike Clover 8/10 4.4 713 0.27Alternative Cool* 7/22 5.2 601 0.23Canola 7/5 11.0 725 0.28Cool Season Cool** 7/13 8.7 1126 0.43Diversity Early⁺ 7/13 8.7 1034 0.40Flax 7/5 16.2 619 0.24Oat 7/13 26.1 1548 0.59Purple Top Turnip Cool 8/10 25.9 751 0.29Radish Cool 7/1 5.0 716 0.27Safflower 8/10 3.1 2008 0.77Spring Pea 7/13 4.4 944 0.36Triticale 7/5 15.1 1294 0.50Vetch 7/29 5.4 1678 0.64Warm Season Cool⁺⁺ 7/5 4.8 492 0.19Alternative Warm* 8/10 3.2 1802 0.69Berseem Clover 7/22 10.5 271 0.10Black Bean 8/10 2.0 1214 0.46Chickpea 7/13 2.4 584 0.22Cool Season Warm** 7/22 12.1 1786 0.68Diversity Late⁺ 7/22 11.0 1697 0.65Fababean 7/22 3.8 754 0.29German Millet 8/10 10.7 2205 0.84Indian Corn 8/10 1.0 2853 1.09Purple Top Turnip Warm 8/10 8.3 234 0.09Radish Warm 8/10 3.5 181 0.07Sorghum 8/10 15.0 1901 0.73Soybean 8/10 1.6 1187 0.45Sunflower 8/10 0.2 1835 0.70Warm Season Warm⁺⁺ 7/29 3.0 1284 0.49P-Value - < 0.001 < 0.001 < 0.001Mean - 8.0 1174 0.45CV% - 40.2 34.2 34.2LSD (0.05) - 4.5 564 0.22
Note: AUM per acre = (lbs per acre dry forage) * (35% grazing efficiency) / (915 lbs per AUM)
*Radish, purple top turnip, faba bean, black bean, teff, Indian corn, sorghum
**Radish, spring pea, canola , spineless safflower, oat
⁺Radish, purple top turnip, spring pea, faba bean, chickpea, canola , spineless safflower, oat, sorghum
⁺⁺Radish, purple top turnip, chickpea, faba bean, sunflower, sorghum
Seed
ed 5
/5Se
eded
5/2
6
Cover Crop or Cocktail Name

29
Table 29. 2014 and 2016 cover crop performance with winter wheat and barley responses, Moccasin, MT, 2016.
Crop Canopy Height
Dry Matter Yield
Canopy Height
Dry Matter Yield
Canopy Height
Dry Matter Yield
Grain Yield
Test Weight
Grain Yield
Test Weight
(inches) (lb/ac) (inches (lb/ac) (inches (lb/ac) (lb/ac) (lb/bu) (bu/ac) (lb/bu)
Cocktail* 52.5 921.0 41.0 531.5 46.8 726.3 51.9 56.6 35.1 50.9Flax 57.8 1283.4 49.8 684.7 53.8 984.0 44.3 56.0 26.8 49.9No Crop - - - - - - 46.4 55.0 33.9 50.4Radish 79.8 1339.0 65.3 396.6 72.5 867.8 50.0 56.7 29.7 50.5Safflower 69.8 1442.4 51.8 520.5 60.8 981.5 43.4 55.8 35.4 49.9Sweet Clover 34.0 974.6 18.3 329.3 26.1 651.9 52.4 55.1 28.9 51.1Turnip 14.3 431.6 9.5 404.9 11.9 418.3 43.3 55.8 37.5 50.8Yellow Mustard 75.0 2010.0 52.5 508.8 63.8 1259.4 49.7 56.4 35.4 50.3P-Value < 0.001 < 0.001 < 0.001 0.018 - - 0.101 0.235 0.215 0.780Mean 54.7 1200.3 41.1 482.3 - - 47.6 55.9 32.8 50.5CV% 9.4 4.4 10.0 26.0 - - 11.3 1.9 16.0 2.1LSD (0.05) 7.1 14.3 6.1 186.5 - - NS NS NS NS
*Safflower, clover, flax, turnip, radish
Note: Winter wheat in 2015 was planted into plots fol lowing cover crop treatments in 2014; barley in 2016 was planted into plots planted to
winter wheat in 2015 and cover crops in 2014; a second field experiment was ini tiated in 2016 establ i shing the same cover crop treatments as
those planted in 2014.
2014 Cover Crop 2016 Cover Crop 2015 Winter Wheat 2016 Barley2014 & 2016 Avg.

30
Table 30. Cover crop sequence study, Moccasin, MT, 2016.
Plant Count
Dry Matter Yield
AUM per Acre
Plant Count
Dry Matter Yield
AUM per Acre
Plant Count
Grain Yield#
(plants/ft²) (lb/ac) (AUM/ac)‡ (plants/ft²) (lb/ac) (AUM/ac)‡ (plants/ft²) (lb/ac)
Browntop Millet 2.8 95 0.0 3.8 537 0.1 - -Buckwheat 19.8 2328 0.6 22.2 2368 0.6 22.3 119Bush Cowpea 1.6 467 0.1 1.8 1167 0.3 - -Corn 1.3 1773 0.5 1.3 3797 1.0 1.3 621Corn+Pinto 1.2 1661 0.5 1.2 2981 0.8 1.5 567
* CS Cocktail 14.5 1818 0.5 14.7 2112 0.6 15.1 1322Forage Sorghum 11.7 1699 0.5 14.3 2713 0.7 - -German Millet 32.1 1193 0.3 27.6 2315 0.6 - -Grain Sorghum 8.1 1762 0.5 10.6 1992 0.5 8.4 170Hungarian Millet 35.3 1980 0.5 35.8 2520 0.7 41.8 576
† Mung Bean 2.0 759 0.2 1.8 1606 0.4 2.2 13† Navy Bean 2.0 1218 0.3 2.6 1290 0.4 2.8 96
Pearl Millet 4.7 869 0.2 4.6 1733 0.5 - -† Pinto Bean 1.8 1296 0.4 1.2 1736 0.5 1.6 154
Proso Millet 20.3 2488 0.7 24.2 3090 0.8 22.6 73Proso+Pinto 4.3 1324 0.4 5.1 1978 0.5 4.9 99SorghumXSudan 21.8 1684 0.5 22.4 2450 0.7 - -
† Soybean 3.3 1419 0.4 3.8 2182 0.6 3.4 168Spring Pea 7.2 1316 0.4 7.7 1570 0.4 7.8 1008Spring Wheat 20.9 1463 0.4 22.3 1567 0.4 23.6 1492Sudangrass 29.1 1728 0.5 23.1 2840 0.8 - -Sunflower 0.7 3114 0.9 0.8 2904 0.8 0.8 755Viney Cowpea 2.0 705 0.2 2.0 1237 0.3 - -
** WS Cocktail 3.8 1925 0.5 3.6 3124 0.9 - -P-Value < 0.001 < 0.001 < 0.001 < 0.001 < 0.001 < 0.001 < 0.001 < 0.001Mean 10.5 1503.5 0.4 10.8 2158.8 0.6 10.7 482.2CV% 49.3 29.2 29.2 47.7 27.2 27.2 35.3 40.2LSD (0.05) 7.3 619.9 0.2 7.3 829.6 0.2 5.4 NS††
*Wheat, barley, pea, lenti l
** Corn, sorghum-sudangrass hybrid, pinto bean, cowpea†Up to 85% gra in harvest loss††LSD cons idered non-s igni ficant when gra in yield CV% > 15‡AUM per acre = (lbs per acre dry forage) * (35% grazing efficiency) / (915 lbs per AUM)#Gra in/seed shattering was severe for some treatments (e.g., soybean) whi le others were planted late (e.g., corn), resul ting in
measured yields that were cons iderably lower than potentia l yields .Note: Plots belonging to the 'Cover Crop' treatment were terminated at heading for smal l gra ins and at flowering for broadleafs .
Those in the 'Forage' treatment were terminated prior to seed fi l l s tage and s igni ficant leaf loss . Lastly, plots belonging to the
'Gra in' treatment were harvested at ful l seed maturi ty.
GrainForageCover Crop
Crop or Cocktail Name

31
7.0 Cereal Forage Trial Results
Table 31. Winter cereal forage performance in conventional-and no-till systems, Moccasin, MT, 2016.
Plant Height
Dry Matter Yield
AUM per Acre
Plant Height
Dry Matter Yield
AUM per Acre
(inches) (lb/ac) (AUM/ac) (inches) (lb/ac) (AUM/ac)
Experimental Triticale Line #1 52.2 6129 2.34 43.2 4361 1.67" #2 55.3 5767 2.21 42.7 3524 1.35" #3 51.4 5619 2.15 44.0 4985 1.91" #4 54.8 5651 2.16 41.1 3323 1.27" #5 54.4 5767 2.21 39.6 3281 1.26" #6 51.6 6138 2.35 39.3 2617 1.00" #7 51.8 5977 2.29 38.5 4596 1.76" #8 55.9 6502 2.49 43.5 3105 1.19" #9 54.3 6676 2.55 42.6 3518 1.35" #10 53.3 6217 2.38 40.4 4394 1.68" #11 53.8 5962 2.28 42.3 4432 1.70" #12 53.0 6582 2.52 41.9 3463 1.32" #13 52.1 6025 2.30 45.1 5094 1.95" #14 56.4 5982 2.29 42.7 5309 2.03" #15 56.2 6253 2.39 41.9 4519 1.73" #16 46.3 6550 2.51 41.3 2809 1.07
Trical Triticale 50.3 5641 2.16 33.7 2957 1.13Willow Creek Winter Wheat 38.6 3285 1.26 21.2 1963 0.75P-Value 0.002 < 0.001 < 0.001 < 0.001 < 0.001 < 0.001Mean 52.3 5929 2.27 40.3 3792 1.45CV% 7.8 11.0 11.0 6.9 13.1 13.1LSD (0.05) 6.8 1079 0.41 4.6 827 0.32
Note: AUM per acre = (lbs per acre dry forage) * (35% grazing efficiency) / (915 lbs per AUM)
Conventional-Till No-Till
Crop

32
Table 32. Spring cereal forage performance, Moccasin, MT, 2016.
(m/d) (inches) (lb/ac) (bu/ac) (lb/bu)(n=2)
Experimental Line #1 (B) 7/18 19.8 2591 19.2 48.1" #2 (B) 7/15 16.1 2688 9.8 41.1" #3 (B) 7/16 16.0 3096 9.8 43.1" #4 (B) 7/14 17.6 2630 19.7 47.7" #5 (B) 7/18 22.3 1480 7.7 48.5" #6 (B) 7/14 19.3 2203 16.7 51.2
Haxby (B) 7/13 18.5 2319 26.5 56.9Haybet (B) 7/14 18.1 2882 15.4 55.0Haymaker (B) 7/18 16.8 2707 19.7 51.1Hays (B) 7/13 18.0 2610 23.3 50.2Horsford (B) 6/30 23.5 2222 24.2 47.4Lavina (B) 7/14 17.8 3212 20.1 52.0Otana (O) 7/7 24.8 2474 32.8 40.0Pronghorn (T) 6/30 22.6 2494 14.8 47.7Stampede (O) 7/15 20.9 3309 25.9 32.0P-Value - 0.159 0.379 < 0.001 < 0.001Mean - 19 2595 19.0 47.4CV% - 19.7 28.5 25.1 4.0LSD (0.05) - 6.4 1238 NS** 4.1
Test Weight
(n=3)
Variety/Pedigree Crop*
Heading Date
Canopy Height
Dry Matter Yield
Grain Yield
*(B)=Barley; (O)=Oats; (T)=Triticale**LSD cons idered non-significant when grain yield CV% > 15

33
8.0 Application Trial Results 8.1 Fertilizer Table 33. Responses of three barley varieties to varied rates of nitrogen and sulfur fertilizers Moccasin, MT, 2016.
N+SPlant
DensityGrain Yield
Test Weight
Seeds per Pound
Plumps Thins
(lb/ac) (plants/ft²) (bu/ac) (lb/bu) (seeds/lb)
68+0 10.5 30.2 47.6 11,142 79.8 4.868+10 12.6 29.9 50.3 10,885 84.2 3.291+0 11.1 33.6 48.2 11,011 79.5 5.1
91+10 13.0 34.6 48.7 10,440 86.6 2.8114+0 13.9 31.2 48.5 11,027 78.3 4.3114+10 13.1 39.9 49.2 10,627 83.0 3.9137+0 12.2 32.9 48.4 10,961 75.8 6.3137+10 13.4 41.2 49.6 10,434 83.6 3.9
68+0 12.7 30.5 50.6 10,152 89.6 2.968+10 12.1 31.8 51.3 9,930 92.1 2.391+0 13.3 43.5 51.1 9,982 91.2 2.5
91+10 10.6 38.3 50.6 10,147 92.9 2.1114+0 10.8 36.1 50.3 10,377 85.3 4.3114+10 11.1 38.0 50.8 10,157 90.3 2.9137+0 13.9 38.0 49.8 10,429 87.6 3.4137+10 11.9 41.9 50.5 9,868 91.1 2.8
68+0 8.6 30.6 48.1 10,516 89.7 2.668+10 8.8 30.3 49.8 10,617 89.8 2.291+0 8.8 31.4 48.7 10,674 89.9 2.8
91+10 8.4 30.2 49.3 10,680 90.0 2.6114+0 10.0 35.5 48.8 10,627 90.1 2.8114+10 8.9 34.8 49.7 10,492 88.3 3.2137+0 8.2 33.3 47.5 10,434 90.7 2.4137+10 10.0 39.2 48.5 10,434 89.6 2.7
P-Value - 0.507 < 0.001 0.148 0.173 < 0.001 < 0.001Mean - 11.2 34.9 49.4 10,502 87.0 3.3CV% - 18.7 12.4 2.4 3.4 3.0 28.2LSD (0.05) - NS 6.1 NS NS 3.7 1.3
Note: Tria l seeded 5/3/2016 and harvested 8/29/2016.
Exp. #1
Odyssey
Voyager
(%)
Var./Ped.

34
Table 34. Alfalfa responses to 15 fertilizer treatments, Moccasin, MT, 2016.
N+P+K+S+Zn+BDry Matter
YieldCanopy Height
ADF NDF Protein P K S Mg Zn Mn Cu Mo
(lb/ac) (ton/ac) (inches)
No Fertilizer 0+0+0 0.3 12 23 28 22 0.36 2.56 0.14 0.38 25.4 39.0 9.7 6.9Urea 46+0+0 0.4 15 22 27 26 0.41 2.31 0.14 0.38 24.8 39.0 10.0 5.4Check (standard NPS) 22+20+0+20 1.2 19 25 27 25 0.32 2.86 0.26 0.28 19.4 44.7 7.9 2.2Check minus P 22+0+0+20 1.2 20 26 28 25 0.31 2.89 0.30 0.29 19.6 48.0 8.2 1.3Check minus S 22+20+0+0 0.4 14 26 30 22 0.36 2.66 0.13 0.35 24.2 32.7 9.2 5.0Check plus B 22+20+0+20+0+1 1.2 19 27 30 24 0.31 2.65 0.32 0.27 20.5 45.7 7.2 1.3Check plus K 22+20+20+20 1.2 19 24 26 25 0.31 2.60 0.32 0.32 19.2 52.3 7.6 1.3Check w/Gypsum 22+20+0+20 1.0 19 26 29 24 0.31 2.76 0.21 0.29 18.6 39.3 8.1 2.0Check w/Dissolving S 22+20+0+23 0.5 15 26 30 22 0.36 2.58 0.14 0.33 24.7 38.7 9.8 5.7Check w/Elemental S 22+20+0+20 0.5 14 24 28 23 0.36 2.68 0.14 0.36 26.5 42.3 9.3 5.8Simplot 40 Rock 22+20+0+20+0+1 1.1 18 25 28 24 0.31 2.69 0.27 0.31 19.9 49.0 7.5 2.0MosaicSZ (P) 22+80+0+35+2 1.1 18 24 27 25 0.31 2.68 0.28 0.32 19.2 47.3 7.0 1.1MosaicSZ 22+20+0+20+1 1.2 19 23 26 26 0.32 2.58 0.35 0.31 18.6 50.3 6.6 2.7ELX Lvstck Mnrl 22+20+0+20+0+0 1.1 18 28 31 23 0.32 2.80 0.22 0.30 20.7 42.3 8.6 2.5Simplot 16-20-0-S13 25+31+0+20 1.2 20 26 29 24 0.32 2.79 0.30 0.29 21.2 48.3 7.8 1.2Simplot " w/NutriSphere 25+31+0+20 1.2 18 24 27 25 0.32 2.71 0.31 0.30 18.5 47.0 7.4 1.3P-Value - < 0.001 < 0.001 0.148 0.888 0.053 < 0.001 0.049 < 0.001 0.024 < 0.001 0.025 0.002 < 0.001Mean - 0.93 17.2 24.9 28.2 24.1 0.33 2.67 0.24 0.32 21.3 44.1 8.23 3.0CV% - 9.9 9.0 14.0 14.0 7.7 6.65 6.30 15.16 12.35 9.3 13.8 12.14 38.5LSD (0.05) - 0.15 2.6 NS NS NS 0.04 0.28 0.06 0.07 3.3 10.1 1.67 1.9
(%) (ppm)
Treatment

35
8.2 Inoculant Table 35. Spring pea inoculant trial, Moccasin, MT, 2016.
Table 36. Spring lentil inoculant trial, Moccasin, MT, 2016.
Plant Density
Node Count
Nodule Count
Nodule Weight
Grain Yield
Test Weight
Seeds per Pound
(plants/ft²) (g/plant) (bu/ac) (lb/bu) (seeds/lb)
Check 5.2 13 39 0.32 28.5 65.3 1635Exceed Granular 4.8 13 37 0.34 28.2 65.4 1624Exceed Granular+Chitosan 4.9 14 49 0.41 28.7 65.8 1646Exceed Stic 5.6 13 33 0.32 31.5 65.4 1630Standard Peat 5.6 14 38 0.26 26.9 65.7 1670P-Value 0.54 0.93 0.06 0.21 0.33 0.38 0.35Mean 5.2 13.3 39.3 0.33 28.8 65.5 1641CV% 16.0 11.4 17.4 25.8 10.3 0.6 2.0LSD (0.05) NS NS NS NS NS NS NS
Note: Tria l seeded 4/18/2016 and harvested 8/2/2016.
(#/plant)
Treatment
Plant Density
Node Count
Nodule Count
Nodule Weight
Grain Yield
Test Weight
Seeds/lb
(plants/ft²) (g/plant) (bu/ac) (lb/bu) (seeds/lb)
Check 11.3 14 29 0.09 23.0 61.5 8323Exceed granular 9.8 12 26 0.07 23.2 61.4 8248Exceed granular + chitosan 10.2 14 27 0.12 19.7 61.5 8213Exceed Stic 10.1 13 23 0.07 22.7 61.2 8210Peat 10.9 13 30 0.08 22.7 61.5 8288P-Value 0.38 0.79 0.75 0.37 0.08 0.95 0.78Mean 10.4 13.1 26.8 0.09 22.3 61.4 8257CV% 11.0 13.0 32.3 40.0 8.0 0.8 1.8LSD (0.05) NS NS NS NS NS NS NS
Note: Tria l seeded 4/18/2016 and harvested 8/4/2016.
(#/plant)
Treatment

36
8.3 Herbicide
Table 37. Spring pea, spring lentil, and spring chickpea responses to varied rates of 8 different herbicide treatments applied in spring, Moccasin, MT, 2016.
Grain Yield
Test Weight
Grain Yield
Test Weight
Grain Yield
Test Weight
(bu/ac) (lb/bu) (bu/ac) (lb/bu) (bu/ac) (lb/bu)
ANTHEM MAXX 8.25 floz/ac 29.1 65.7 16.7 62.3 12.1 62.1ANTHEM MAXX 16.5 floz/ac 24.3 65.8 17.8 62.2 12.8 62.2AUTHORITY MTZ 8 oz/ac 35.5 65.9 21.0 62.4 9.7 62.5AUTHORITY MTZ 16 oz/ac 26.6 65.9 5.5 61.8 14.0 62.7CORVUS 4 oz/ac 28.6 64.7 12.3 61.9 9.3 62.3CORVUS 8 oz/ac 26.1 65.3 10.0 61.4 10.4 62.4CORVUS+METRIBUZIN 3,8 oz/ac 29.5 65.4 20.2 62.3 14.6 62.3CORVUS+METRIBUZIN 6,16 oz/ac 28.8 66.1 12.4 61.6 13.8 62.9METRIBUZIN 75 DF 8 oz/ac 28.1 65.4 17.2 62.4 7.9 62.4METRIBUZIN 75 DF 16 oz/ac 25.3 65.5 18.3 63.0 10.1 62.7PROWL H2O+Outlook 16,18 floz/ac 30.8 65.8 23.1 62.4 10.0 62.7PROWL H2O+Outlook 32,36 floz/ac 27.5 65.8 23.0 62.5 10.2 62.8SPARTAN 4L 5 oz/ac 27.7 66.0 8.5 62.4 12.1 62.8SPARTAN 4L 10 oz/ac 28.6 65.9 8.3 61.9 9.6 62.3VALOR SX 3 oz/ac 30.3 65.4 21.5 62.6 14.4 62.7VALOR SX 6 oz/ac 30.6 65.6 17.9 62.6 9.5 62.2NO TREATMENT NA 27.6 65.4 21.9 62.4 9.7 62.1P-Value - 0.721 0.444 < 0.001 < 0.001 0.34 0.22Mean - 28.5 65.6 16.2 62.2 11.2 62.5CV% - 17.8 0.9 25.9 0.5 29.8 0.6LSD (0.05) - NS NS NS* 0.5 NS NS*LSD cons idered non-s igni ficant when gra in yield CV% > 15
Treatment
Pea Lentil Chickpea
Rate