2016 admissions standards rpt che final 052918 · 2016, eight public senior institutions (usc...
TRANSCRIPT
_______________________________________________________________________________________________________________________ 1122 Lady Street ♦ Suite 300 ♦ Columbia, SC 29201 ♦ Phone: (803) 737-2260 ♦ Fax: (803) 737-2297 ♦ Web: www.che.sc.gov
Mr. Tim M. Hofferth, Chair Ms. Dianne C. Kuhl, Vice Chair
Mr. Paul O. Batson, III Mr. Devron H. Edwards
Dr. Bettie Rose Horne Mr. Richard A. Jones, Jr.
Mr. Kenneth W. Kirkland Ms. Allison Dean Love
Dr. Louis B. Lynn Vice Admiral Charles Munns, USN (ret.)
Mr. Kim F. Phillips Ms. Terrye C. Seckinger
Mr. Jeffrey M. Schilz
Interim President and Executive Director
South Carolina Commission on Higher Education
CHE 06/07/2018 Agenda Item 8.02.E
June 7, 2018
MEMORANDUM To: Chairman Tim Hofferth and Members, SC Commission on Higher Education From: Chair Terrye Seckinger and Members, Committee on Academic Affairs and Licensing
Annual Report on Admission Standards for First‐Time Entering Freshmen, Fall 2016
Background In 1988, in response to Act 629, the Commission on Higher Education began to report data related to first time entering freshmen for each South Carolina public institution. The act, The Cutting Edge, required the Commission to monitor the admission standards at the public colleges and universities to comply as follows: In consultation and coordination with the public institutions of higher learning in this state,
the State Commission on Higher Education shall ensure that minimal admission standards are maintained by the institutions.
The Commission, with the institutions, shall monitor the effect of compliance with admission prerequisites that are effective in fall, 1988 (Section 59‐104‐10[A]).
In addition, in Act 359 of 1996, Section 59‐103‐45(3), the General Assembly reiterated the importance of the Commission reporting admission standards to include these categories: freshmen applications, acceptances, and enrollment; minimum admission requirements set by individual institutions; mean SAT and ACT scores for freshmen classes; college preparatory course prerequisites compliance; and, information on provisional students.

Annual Report on Admission Standards for First Time Entering Freshmen, Fall 2016 Page 2
Findings The attached Annual Report on Admission Standards for First‐Time Entering Freshman, Fall 2016 provides findings from data reported by the 12 South Carolina public senior colleges and universities regarding admission standards. In Fall 2016, the public senior institutions admitting freshmen in South Carolina received 102,267 applications from individuals, both in‐state and out‐of‐state, seeking admission as first‐time freshmen. Of the first‐time freshmen applicants 64.1 percent (65,588) were offered admission, and 29.0 percent (19,035) of applicants offered admission accepted and enrolled. This is a one percent decrease among the public senior institutions for both applicants offered admission, and those accepted and enrolled compared to Fall 2015. The number and percentage of applicable first‐time freshmen meeting all of the college preparatory course prerequisites decreased, after increasing for three consecutive years. In Fall 2016, 88.7 percent of first‐time freshmen met all the prerequisites compared to 91.2 percent in 2015, 85.4 percent in 2014, and 83.3 percent in 2013. Data indicates that among the public senior institutions, the percentage of freshmen meeting high school course prerequisites slightly decreased from Fall 2015 to Fall 2016. Eleven of the 12 institutions (approximately 91.6 percent) demonstrate decreases in freshmen meeting high school course prerequisites, while one institution (South Carolina State University) indicates an increase in freshmen meeting high school course prerequisites. Retention rates among students who did not meet the high school course prerequisites are lower for half of the public senior institutions. Six institutions indicate an increase in freshmen‐to‐sophomore retention rates for students who did not meet the high school course prerequisites, while the other six institutions demonstrate a decrease in retention rates for the same category of students.
The majority of students attending South Carolina public senior institutions report taking the ACT (10,841 students) rather than the SAT (7,736 students) as a college entrance examination. Between 2015 and 2016, eight public senior institutions (USC Columbia, Coastal Carolina, Lander, South Carolina State, USC Aiken, USC Beaufort, USC Upstate, and Winthrop) indicate an increase in the average combined SAT/ACT mean between 2015 and 2016. Four institutions (USC Columbia, The Citadel, College of Charleston, and Francis Marion) demonstrate a decrease. An institution may offer two types of admission to a degree‐seeking student, regular or provisional. The classification is based on whether or not the applicant meets the institution’s minimum admission criteria. Among the public senior institutions, only 41.6 percent indicated admitting “provisional” students, yet all have first‐time freshmen not meeting the college preparatory course prerequisites. The institutions reporting provisional students, again, were all comprehensive teaching colleges and universities in South Carolina. Winthrop admitted the largest percentage of provisional freshmen (12.0 percent), followed by College of Charleston with a percentage of 11.1. Although, the data indicate that the percentage of provisional students admitted to the comprehensive sector continues to fluctuate at several institutions, the levels remain below the 15 percent threshold CHE formally recommended. Institutions continue to adjust admission requirements for first‐time entering freshmen. The required minimum SAT/ACT scores are, generally, lower for students with a higher GPA and high school class rank at most institutions. The minimum admission standards of the public senior institutions in South Carolina for Fall 2017 incorporate the use of both GPA and high school class rank. Five institutions (Clemson, South Carolina State, USC Aiken, USC Beaufort, and USC Upstate) report intent to apply both methods. Four institutions (The Citadel, South Carolina State, USC Aiken, and USC Beaufort) require the same minimum SAT/ACT scores for students regardless of high school class rank, and three institutions required the same minimum SAT/ACT scores for student regardless of GPA (Francis Marion, Lander, and South Carolina

Annual Report on Admission Standards for First Time Entering Freshmen, Fall 2016 Page 3
State). In addition to SAT/ACT scores, class rank, and GPA, considerations to include the SAT writing component as an admission requirement are constantly changing. In Fall 2017, three institutions (Coastal Carolina, Francis Marion, and USC Upstate) continue to require the SAT writing component and use it as a factor in admission decisions. Five institutions (The Citadel, Lander, South Carolina State, USC Aiken, and USC Beaufort) do not require the SAT writing component, while four institutions (Clemson, USC Columbia, College of Charleston, and Winthrop) use it as supplemental information in evaluating college readiness. Structure and Methods The Annual Report on the 2015 admission standards compliance for first‐time entering freshmen at South Carolina public senior institutions is presented in five segments:
Part I: Fall 2016 Applications, Acceptances, Enrollments, and Demographics
Part II: Fall 2016 Data Related to College Preparatory Course Prerequisites
Part III: Fall 2016 SAT and ACT Scores Part IV: Fall 2016 Provisionally Admitted Students
Part V: Fall 2017 Minimum Admission Standards
The report relies on the Commission on Higher Education Management Information System (CHEMIS) as the primary data source for information presented. Parts II‐IV and the enrollment data included in Part I are collected through CHEMIS, and self‐reported by each institution. The data is supplied by the institutions no later than November 1 of each calendar year. The institutions provide the data for Part V through a separate questionnaire with topic‐specific queries. Data verification, generally, occurs no later than December of each calendar year. Recommendation The Committee on Academic Affairs and Licensing recommends the Commission approve the Annual Report on Admission Standards for First‐Time Entering Freshmen, Fall 2016.

Annual Report on Admission Standards for First Time Entering Freshmen, Fall 2016 Page 4
Attachment
ANNUAL REPORT ON ADMISSION STANDARDS FOR FIRST‐TIME ENTERING FRESHMEN, FALL 2016 SOUTH CAROLINA PUBLIC SENIOR INSTITUTIONS
Introduction The Annual Report on the 2016 admission standards compliance for first‐time entering freshmen at South Carolina public senior institutions is presented in five segments:
Part I: Fall 2016 Applications, Acceptances, Enrollments, and Demographics Part II: Fall 2016 Data Related to High School Course Prerequisites
Part III: Fall 2016 SAT and ACT Scores Part IV: Fall 2016 Provisionally Admitted Students
Part V: Fall 2017 Minimum Admission Standards The report relies on the Commission on Higher Education Management Information System (CHEMIS) as the primary data source for information presented. Parts II ‐ IV and the enrollment data included in Part I are collected through CHEMIS, and self‐reported by each institution. The data is supplied by the institutions no later than November 1 of each calendar year. The institutions provide the data for Part V through a separate questionnaire with topic‐specific queries. Data verification, generally, occurs no later than December of each calendar year. In accordance with the Commission’s North Star of Access, Affordability, and Excellence, this report details new student access in that it demonstrates efforts to collaborate with South Carolina institutions to expand postsecondary education opportunities for residents, in‐state and out‐of‐state, through the dissemination of information about institutional admission requirements and outcomes. Part I: Fall 2016 Applications, Acceptances, Enrollments, and Demographics
South Carolina has 13 public senior institutions: 1) The Citadel; 2) Clemson University; 3) Coastal Carolina University; 4) College of Charleston; 5) Francis Marion University; 6) Lander University; 7) Medical University of South Carolina (MUSC); 8) South Carolina State University; University of South Carolina (USC) campuses in 9) Columbia, 10) Aiken, 11) Beaufort, and 12) Upstate; and 13) Winthrop University. Three of the public senior institutions, Clemson, MUSC, and USC Columbia, are s research institutions. However, MUSC only offers undergraduate programs that begin through articulation agreements in the junior year, and thus does not admit freshmen students. As a result, MUSC is not included in the annual report on admission standards. In Fall 2015, South Carolina’s 12 public senior colleges and universities admitting freshmen received 102,267 applications from individuals seeking admission as first‐time freshmen. Table 1 (p. 5) presents the number and percentage of students who applied and accepted and enrolled at each public senior institution. Of the first‐time freshmen applicants, 65,588 (64.1 percent) were offered admission. Of those offered admission, 19,035 (29.0 percent) applicants accepted admission and enrolled. This is close to the 2015 national average of 29.9 percent of 18 – 24 year olds enrolled in 4‐year degree‐granting postsecondary institutions (NCES, 2016). Overall, among the public senior institutions, an increase of approximately two percent occurred for applicants offered admission (62.3 percent), and a decrease of one‐half percent occurred for those accepted and enrolled (29.5 percent) in Fall 2015(CHE, 2018).

Annual Report on Admission Standards for First Time Entering Freshmen, Fall 2016 Page 5
Table 1
Applications, Acceptances, and Enrollments S.C. Public Senior Institutions, Fall 2016
Institution Number of Applications1
Number of Applicants Offered
Admission1
Percent of Applicants Offered
Admission
Number Accepted
and Enrolled
Percent Accepted
and Enrolled
Research Institutions
Clemson 23,506 11,891 50.6% 3,684 31.0%
USC Columbia 25,057 17,073 68.1% 5,110 29.9%
Total 48,563 28,964 59.6% 8,794 30.4%
Comprehensive Teaching Colleges & Universities
The Citadel 2,622 2,158 82.3% 734 34.0%
Coastal Carolina 17,768 10,871 61.2% 2,249 20.7%
College of Charleston 10,828 9,110 84.1% 2,349 25.8%
Francis Marion 3,738 2,301 61.6% 729 31.7%
Lander 2,886 1,439 49.9% 608 42.3%
SC State 2,847 2,455 86.2% 628 25.6%
USC Aiken 2,146 1,436 66.9% 623 43.4%
USC Beaufort 2,148 1399 65.1% 487 34.8%
USC Upstate 3,781 2,071 54.8% 762 36.8%
Winthrop 4,940 3,384 68.5% 1,072 31.7%
Total 53,704 36,624 68.2% 10,241 28.0%
Grand Total 102,267 65,588 64.1% 19,035 29.0%
1 Reported by the institutions.
As shown in Table 1, South Carolina State University offered admission to the largest percentage (86.2 percent) of applicants, but only 25.6 percent accepted and enrolled. South Carolina State University also offered admission to the largest percentage of applicants in 2015 (94.9 percent), but a decrease of 8.7 percent occurred in 2016 (CHE, 2018). An increase of 4.3 percent occurred among students accepted and enrolled to South Carolina State University compared to Fall 2015. The Citadel and College of Charleston offered admission to 82.3 and 84.1 percent of applicants, respectively. This is an increase of 6.6 percent for The Citadel and 7 percent for the College of Charleston from Fall 2015 (CHE, 2018). None of the public senior institutions offered admission to 70 ‐ 80 percent of applicants. Six institutions (USC Columbia, Coastal Carolina, Francis Marion, USC Aiken, USC Beaufort, and Winthrop) offered admission to 60 ‐ 69 percent of applicants. Two institutions (Clemson and USC Upstate) offered admission to 50 ‐ 59 percent of applicants. Lander, same as in Fall 2015, offered admission to the lowest percentage of applicants at 49.9 percent (CHE, 2018). USC Aiken had the largest percentage (43.4 percent) of students accept and enroll. Lander followed with 42.3 percent of the applicants offered admission, accepted and enrolled.
A comparison of data from Fall 2015 to Fall 2016 indicates the percentage of students accepted and enrolled decreased for eight institutions: USC Columbia, Coastal Carolina, Francis Marion, Lander, USC Beaufort, and Winthrop (CHE, 2018). USC Beaufort experienced the largest decrease in the percentage of students accepted and enrolled (‐6.7 percent). An increase occurred among Clemson, The Citadel, College of Charleston, South Carolina State, and USC Aiken, with the largest increase occurring for South Carolina State University (4.3 percent). The percentage of accepted and enrolled students for USC Upstate remained approximately the same as in 2015. Again, the majority of the public senior institutions, 75 percent, meet and exceed the national average of 29.9 percent for students accepted and enrolled among those offered admission.
Annual Report on Admission Standards for First Time Entering Freshmen, Fall 2016 Page 6
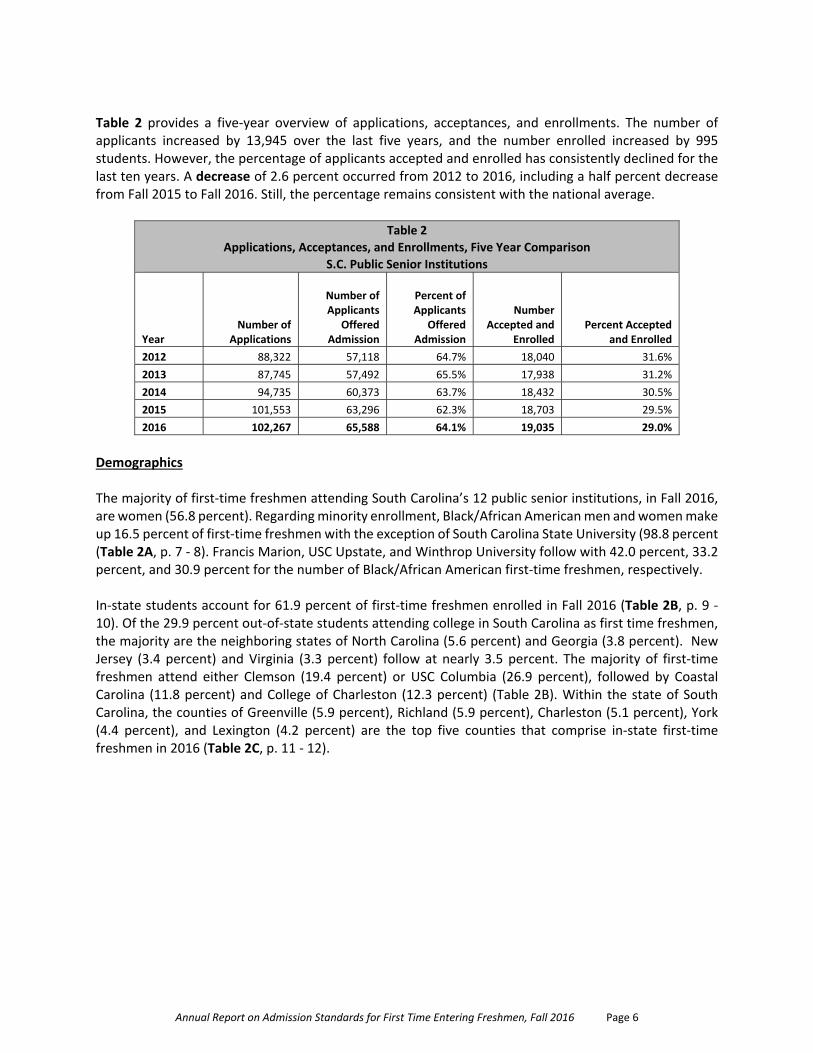
Table 2 provides a five‐year overview of applications, acceptances, and enrollments. The number of applicants increased by 13,945 over the last five years, and the number enrolled increased by 995 students. However, the percentage of applicants accepted and enrolled has consistently declined for the last ten years. A decrease of 2.6 percent occurred from 2012 to 2016, including a half percent decrease from Fall 2015 to Fall 2016. Still, the percentage remains consistent with the national average.
Table 2
Applications, Acceptances, and Enrollments, Five Year Comparison
S.C. Public Senior Institutions
Year
Number of Applications
Number of Applicants
Offered Admission
Percent of Applicants
Offered Admission
Number Accepted and
Enrolled
Percent Accepted
and Enrolled
2012 88,322 57,118 64.7% 18,040 31.6%
2013 87,745 57,492 65.5% 17,938 31.2%
2014 94,735 60,373 63.7% 18,432 30.5%
2015 101,553 63,296 62.3% 18,703 29.5%
2016 102,267 65,588 64.1% 19,035 29.0%
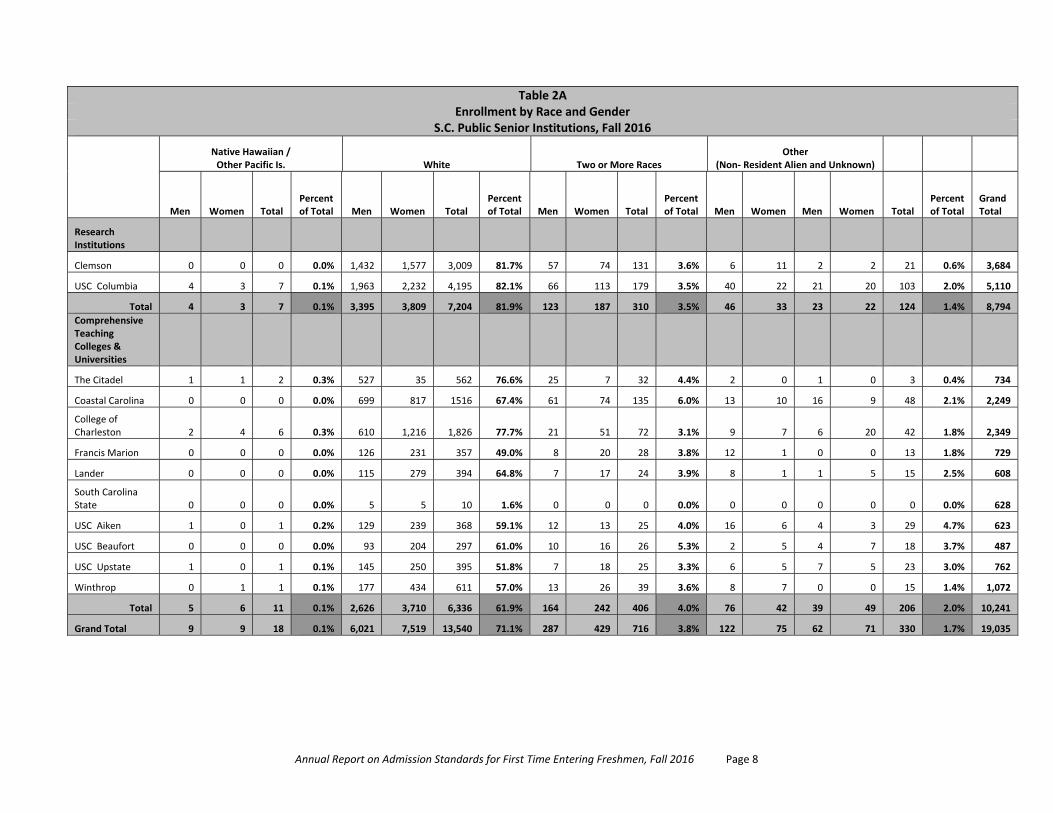
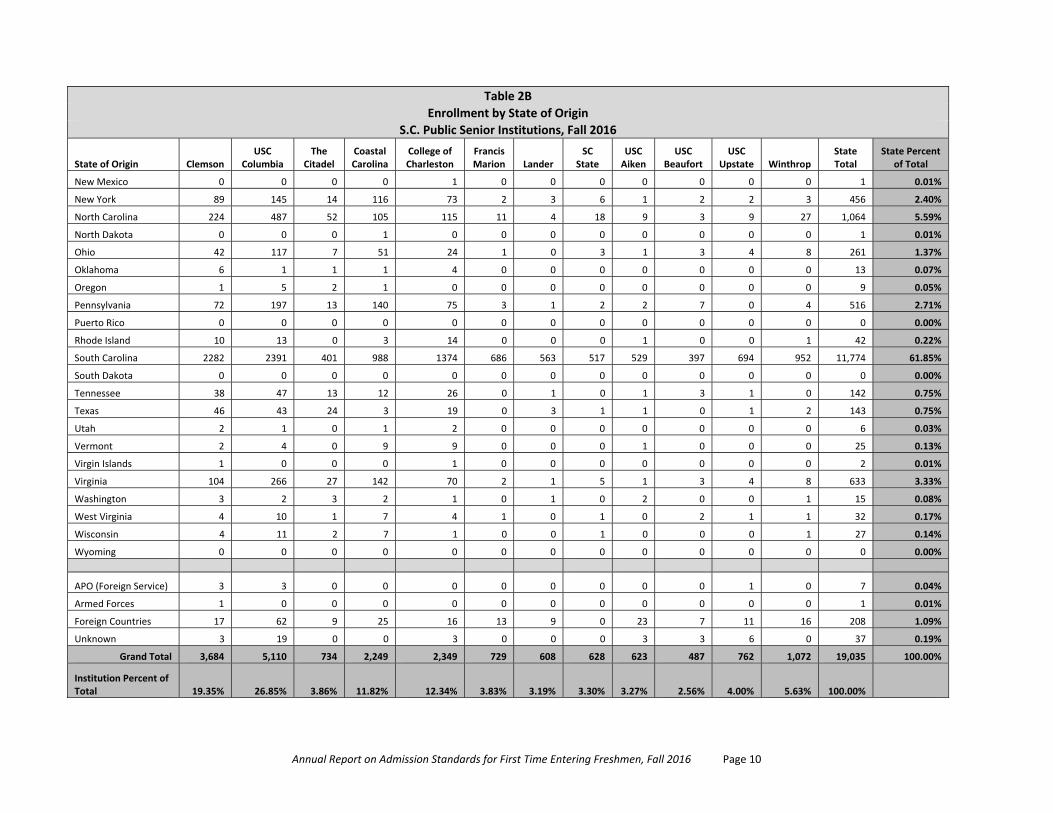
Demographics The majority of first‐time freshmen attending South Carolina’s 12 public senior institutions, in Fall 2016, are women (56.8 percent). Regarding minority enrollment, Black/African American men and women make up 16.5 percent of first‐time freshmen with the exception of South Carolina State University (98.8 percent (Table 2A, p. 7 ‐ 8). Francis Marion, USC Upstate, and Winthrop University follow with 42.0 percent, 33.2 percent, and 30.9 percent for the number of Black/African American first‐time freshmen, respectively. In‐state students account for 61.9 percent of first‐time freshmen enrolled in Fall 2016 (Table 2B, p. 9 ‐ 10). Of the 29.9 percent out‐of‐state students attending college in South Carolina as first time freshmen, the majority are the neighboring states of North Carolina (5.6 percent) and Georgia (3.8 percent). New Jersey (3.4 percent) and Virginia (3.3 percent) follow at nearly 3.5 percent. The majority of first‐time freshmen attend either Clemson (19.4 percent) or USC Columbia (26.9 percent), followed by Coastal Carolina (11.8 percent) and College of Charleston (12.3 percent) (Table 2B). Within the state of South Carolina, the counties of Greenville (5.9 percent), Richland (5.9 percent), Charleston (5.1 percent), York (4.4 percent), and Lexington (4.2 percent) are the top five counties that comprise in‐state first‐time freshmen in 2016 (Table 2C, p. 11 ‐ 12).

Annual Report on Admission Standards for First Time Entering Freshmen, Fall 2016 Page 7
Table 2A Enrollment by Race and Gender
S.C. Public Senior Institutions, Fall 2016
Hispanic/ Latino American Indian / Alaskan Native Asian Black/African American
Men Women Total Percent of Total Men Women Total
Percent of Total Men Women Total
Percent of Total Men Women Total
Percent of Total
Grand Total
Research Institutions
Clemson 67 73 140 3.8% 2 3 5 0.1% 42 54 96 2.6% 143 139 282 7.7% 3,684
USC Columbia 89 129 218 4.3% 2 3 5 0.1% 65 83 148 2.9% 96 159 255 5.0% 5,110
Total 156 202 358 4.1% 4 6 10 0.1% 107 137 244 2.8% 239 298 537 6.1% 8,794
Comprehensive Teaching Colleges & Universities
The Citadel 46 7 53 7.2% 5 1 6 0.8% 12 1 13 1.8% 59 4 63 8.6% 734
Coastal Carolina 45 55 100 4.4% 4 6 10 0.4% 5 5 10 0.4% 212 218 430 19.1% 2,249
College of Charleston 36 90 126 5.4% 3 7 10 0.4% 17 47 64 2.7% 60 143 203 8.6% 2,349
Francis Marion 6 12 18 2.5% 0 1 1 0.1% 2 4 6 0.8% 57 249 306 42.0% 729
Lander 6 12 18 3.0% 0 2 2 0.3% 0 2 2 0.3% 42 111 153 25.2% 608
South Carolina State 0 5 5 0.8% 2 2 4 0.6% 0 1 1 0.2% 306 302 608 96.8% 628
USC Aiken 10 26 36 5.8% 2 2 4 0.6% 1 3 4 0.6% 41 115 156 25.0% 623
USC Beaufort 12 28 40 8.2% 0 1 1 0.2% 1 2 3 0.6% 25 77 102 20.9% 487
USC Upstate 14 33 47 6.2% 0 0 0 0.0% 11 7 18 2.4% 73 180 253 33.2% 762
Winthrop 12 52 64 6.0% 0 3 3 0.3% 2 6 8 0.7% 93 238 331 30.9% 1,072
Total 187 320 507 5.0% 16 25 41 0.4% 51 78 129 1.3% 968 1,637 2,605 25.4% 10,241
Grand Total 343 522 865 4.5% 20 31 51 0.3% 158 215 373 2.0% 1,207 1,935 3,142 16.5% 19,035
Annual Report on Admission Standards for First Time Entering Freshmen, Fall 2016 Page 8
Table 2A Enrollment by Race and Gender
S.C. Public Senior Institutions, Fall 2016
Native Hawaiian / Other Pacific Is. White Two or More Races
Other (Non‐ Resident Alien and Unknown)
Men Women Total Percent of Total Men Women Total
Percent of Total Men Women Total
Percent of Total Men Women Men Women Total
Percent of Total
Grand Total
Research Institutions
Clemson 0 0 0 0.0% 1,432 1,577 3,009 81.7% 57 74 131 3.6% 6 11 2 2 21 0.6% 3,684
USC Columbia 4 3 7 0.1% 1,963 2,232 4,195 82.1% 66 113 179 3.5% 40 22 21 20 103 2.0% 5,110
Total 4 3 7 0.1% 3,395 3,809 7,204 81.9% 123 187 310 3.5% 46 33 23 22 124 1.4% 8,794
Comprehensive Teaching Colleges & Universities
The Citadel 1 1 2 0.3% 527 35 562 76.6% 25 7 32 4.4% 2 0 1 0 3 0.4% 734
Coastal Carolina 0 0 0 0.0% 699 817 1516 67.4% 61 74 135 6.0% 13 10 16 9 48 2.1% 2,249
College of Charleston 2 4 6 0.3% 610 1,216 1,826 77.7% 21 51 72 3.1% 9 7 6 20 42 1.8% 2,349
Francis Marion 0 0 0 0.0% 126 231 357 49.0% 8 20 28 3.8% 12 1 0 0 13 1.8% 729
Lander 0 0 0 0.0% 115 279 394 64.8% 7 17 24 3.9% 8 1 1 5 15 2.5% 608
South Carolina State 0 0 0 0.0% 5 5 10 1.6% 0 0 0 0.0% 0 0 0 0 0 0.0% 628
USC Aiken 1 0 1 0.2% 129 239 368 59.1% 12 13 25 4.0% 16 6 4 3 29 4.7% 623
USC Beaufort 0 0 0 0.0% 93 204 297 61.0% 10 16 26 5.3% 2 5 4 7 18 3.7% 487
USC Upstate 1 0 1 0.1% 145 250 395 51.8% 7 18 25 3.3% 6 5 7 5 23 3.0% 762
Winthrop 0 1 1 0.1% 177 434 611 57.0% 13 26 39 3.6% 8 7 0 0 15 1.4% 1,072
Total 5 6 11 0.1% 2,626 3,710 6,336 61.9% 164 242 406 4.0% 76 42 39 49 206 2.0% 10,241
Grand Total 9 9 18 0.1% 6,021 7,519 13,540 71.1% 287 429 716 3.8% 122 75 62 71 330 1.7% 19,035

Annual Report on Admission Standards for First Time Entering Freshmen, Fall 2016 Page 9
Table 2B
Enrollment by State of Origin
S.C. Public Senior Institutions, Fall 2016
State of Origin Clemson USC
Columbia The
Citadel Coastal Carolina
College of Charleston
Francis Marion Lander
SC State
USC Aiken
USC Beaufort
USC Upstate Winthrop
State Total
State Percent of Total
Alabama 15 8 2 3 3 1 1 1 0 0 0 0 34 0.18%
Alaska 1 1 0 1 0 0 0 0 0 0 0 0 3 0.02%
Arizona 1 2 1 1 1 0 0 0 0 0 0 1 7 0.04%
Arkansas 0 0 2 1 1 0 0 0 0 0 0 0 4 0.02%
California 29 20 11 6 23 1 0 5 1 1 1 2 100 0.53%
Colorado 18 9 2 4 9 0 0 0 0 1 0 1 44 0.23%
Connecticut 39 69 7 56 67 0 0 1 0 1 0 3 243 1.28%
Delaware 8 19 5 23 12 0 0 0 1 2 0 0 70 0.37%
District Of Columbia 1 2 1 0 8 0 0 7 0 0 0 0 19 0.10%
Florida 65 68 34 11 47 5 6 6 7 6 8 5 268 1.41%
Georgia 160 247 35 34 55 0 11 42 23 33 10 13 663 3.48%
Hawaii 2 1 1 0 1 0 0 0 0 0 0 1 6 0.03%
Idaho 0 0 0 0 0 0 0 0 0 0 0 0 0 0.00%
Illinois 50 81 8 17 21 1 1 2 1 1 0 0 183 0.96%
Indiana 11 16 1 7 6 0 0 0 1 1 3 1 47 0.25%
Iowa 0 1 1 2 1 0 0 0 1 0 0 0 6 0.03%
Kansas 3 4 3 4 3 0 0 0 0 0 0 1 18 0.09%
Kentucky 16 34 5 21 6 0 0 0 1 2 1 0 86 0.45%
Louisiana 6 4 2 1 7 0 0 0 0 0 0 0 20 0.11%
Maine 2 5 1 4 5 0 0 0 2 1 0 0 20 0.11%
Maryland 81 249 14 134 66 2 0 5 2 2 0 9 564 2.96%
Massachusetts 57 135 4 111 67 0 0 0 1 1 0 3 379 1.99%
Michigan 12 8 2 9 6 0 0 2 0 1 1 0 41 0.22%
Minnesota 8 7 0 5 4 0 0 0 0 0 1 2 27 0.14%
Mississippi 2 1 0 0 0 0 1 0 0 0 0 0 4 0.02%
Missouri 9 11 5 6 4 0 0 1 1 0 0 0 37 0.19%
Montana 0 0 0 0 0 0 0 0 0 0 0 0 0 0.00%
Nebraska 2 4 2 2 1 0 0 0 0 0 0 0 11 0.06%
Nevada 0 1 0 0 0 0 0 0 0 1 1 1 4 0.02%
New Hampshire 13 9 0 31 6 0 0 0 0 0 0 1 60 0.32%
New Jersey 119 270 16 141 87 0 2 2 6 3 2 4 652 3.43%
Annual Report on Admission Standards for First Time Entering Freshmen, Fall 2016 Page 10
Table 2B
Enrollment by State of Origin
S.C. Public Senior Institutions, Fall 2016
State of Origin Clemson USC
Columbia The
Citadel Coastal Carolina
College of Charleston
Francis Marion Lander
SC State
USC Aiken
USC Beaufort
USC Upstate Winthrop
State Total
State Percent of Total
New Mexico 0 0 0 0 1 0 0 0 0 0 0 0 1 0.01%
New York 89 145 14 116 73 2 3 6 1 2 2 3 456 2.40%
North Carolina 224 487 52 105 115 11 4 18 9 3 9 27 1,064 5.59%
North Dakota 0 0 0 1 0 0 0 0 0 0 0 0 1 0.01%
Ohio 42 117 7 51 24 1 0 3 1 3 4 8 261 1.37%
Oklahoma 6 1 1 1 4 0 0 0 0 0 0 0 13 0.07%
Oregon 1 5 2 1 0 0 0 0 0 0 0 0 9 0.05%
Pennsylvania 72 197 13 140 75 3 1 2 2 7 0 4 516 2.71%
Puerto Rico 0 0 0 0 0 0 0 0 0 0 0 0 0 0.00%
Rhode Island 10 13 0 3 14 0 0 0 1 0 0 1 42 0.22%
South Carolina 2282 2391 401 988 1374 686 563 517 529 397 694 952 11,774 61.85%
South Dakota 0 0 0 0 0 0 0 0 0 0 0 0 0 0.00%
Tennessee 38 47 13 12 26 0 1 0 1 3 1 0 142 0.75%
Texas 46 43 24 3 19 0 3 1 1 0 1 2 143 0.75%
Utah 2 1 0 1 2 0 0 0 0 0 0 0 6 0.03%
Vermont 2 4 0 9 9 0 0 0 1 0 0 0 25 0.13%
Virgin Islands 1 0 0 0 1 0 0 0 0 0 0 0 2 0.01%
Virginia 104 266 27 142 70 2 1 5 1 3 4 8 633 3.33%
Washington 3 2 3 2 1 0 1 0 2 0 0 1 15 0.08%
West Virginia 4 10 1 7 4 1 0 1 0 2 1 1 32 0.17%
Wisconsin 4 11 2 7 1 0 0 1 0 0 0 1 27 0.14%
Wyoming 0 0 0 0 0 0 0 0 0 0 0 0 0 0.00%
APO (Foreign Service) 3 3 0 0 0 0 0 0 0 0 1 0 7 0.04%
Armed Forces 1 0 0 0 0 0 0 0 0 0 0 0 1 0.01%
Foreign Countries 17 62 9 25 16 13 9 0 23 7 11 16 208 1.09%
Unknown 3 19 0 0 3 0 0 0 3 3 6 0 37 0.19%
Grand Total 3,684 5,110 734 2,249 2,349 729 608 628 623 487 762 1,072 19,035 100.00%
Institution Percent of Total 19.35% 26.85% 3.86% 11.82% 12.34% 3.83% 3.19% 3.30% 3.27% 2.56% 4.00% 5.63% 100.00%

Annual Report on Admission Standards for First Time Entering Freshmen, Fall 2016 Page 11
Table 2C First‐Time Freshmen Enrollment by County S.C. Public Senior Institutions, Fall 2016
County Clemson USC
Columbia The
Citadel Coastal Carolina
College of Charleston
Francis Marion Lander
SC State
USC Aiken
USC Beaufort
USC Upstate Winthrop
County Total
County Percent of Total
Abbeville 10 3 0 3 0 0 30 2 1 1 0 2 52 0.27%
Aiken 65 63 7 14 27 9 22 15 257 11 5 18 513 2.70%
Allendale 7 1 0 1 0 0 0 3 2 0 0 0 14 0.07%
Anderson 165 54 13 20 18 4 38 13 0 3 11 23 362 1.90%
Bamberg 7 1 2 2 2 0 0 11 5 3 0 1 34 0.18%
Barnwell 8 7 2 2 5 1 2 7 15 4 1 4 58 0.30%
Beaufort 67 91 13 23 54 3 13 6 4 98 6 29 407 2.14%
Berkeley 93 100 27 27 65 22 11 22 12 24 14 42 459 2.41%
Calhoun 8 8 3 3 4 1 1 4 2 2 3 3 42 0.22%
Charleston 234 226 51 38 234 21 13 42 4 36 14 57 970 5.10%
Cherokee 11 12 1 6 12 2 5 1 1 1 22 10 84 0.44%
Chester 10 8 2 5 1 2 4 3 1 0 5 5 46 0.24%
Chesterfield 7 13 2 8 6 13 3 2 3 4 1 9 71 0.37%
Clarendon 9 3 1 7 6 11 2 9 0 0 6 0 54 0.28%
Colleton 6 9 4 4 10 0 1 11 3 6 1 3 58 0.30%
Darlington 21 28 4 13 11 73 9 17 7 10 2 12 207 1.09%
Dillon 2 7 1 12 4 37 2 1 2 1 0 7 76 0.40%
Dorchester 78 108 31 27 83 9 7 21 11 32 10 36 453 2.38%
Edgefield 6 10 1 3 2 0 4 3 28 1 1 11 70 0.37%
Fairfield 6 6 6 9 2 5 1 6 1 1 5 1 49 0.26%
Florence 57 59 11 32 37 195 5 29 4 9 6 20 464 2.44%
Georgetown 22 24 4 34 42 11 3 6 0 3 1 6 156 0.82%
Greenville 384 261 46 38 125 6 43 13 2 10 110 93 1,131 5.94%
Greenwood 34 24 9 4 12 0 64 4 3 1 7 8 170 0.89%
Hampton 10 4 2 2 0 1 2 6 4 5 0 4 40 0.21%
Horry 59 123 19 322 102 53 6 7 4 6 3 25 729 3.83%
Jasper 4 2 1 4 2 1 7 10 0 6 0 1 38 0.20%
Kershaw 20 38 5 13 22 11 7 4 6 1 5 27 159 0.84%
Lancaster 31 27 1 9 24 2 6 4 2 4 4 36 150 0.79%
Laurens 16 23 4 11 6 1 28 4 0 1 16 6 116 0.61%
Lee 5 4 2 2 0 4 1 2 0 0 0 0 20 0.11%
Lexington 132 254 31 43 91 8 45 14 59 26 30 68 801 4.21%

Annual Report on Admission Standards for First Time Entering Freshmen, Fall 2016 Page 12
Table 2C First‐Time Freshmen Enrollment by County S.C. Public Senior Institutions, Fall 2016
County Clemson USC
Columbia The
Citadel Coastal Carolina
College of Charleston
Francis Marion Lander
SC State
USC Aiken
USC Beaufort
USC Upstate Winthrop
County Total
County Percent of Total
McCormick 3 2 1 0 0 1 1 4 6 0 0 4 22 0.12%
Marion 4 5 0 17 7 20 1 8 2 0 0 2 66 0.35%
Marlboro 1 10 0 4 4 15 2 12 2 0 3 0 53 0.28%
Newberry 12 17 1 2 5 1 12 4 5 2 5 4 70 0.37%
Oconee 46 15 0 4 11 0 13 1 1 1 2 7 101 0.53%
Orangeburg 19 15 4 13 12 10 2 59 9 12 6 16 177 0.93%
Pickens 74 18 13 10 21 2 13 1 2 4 8 13 179 0.94%
Richland 186 349 38 76 103 33 44 56 37 34 54 113 1,123 5.90%
Saluda 8 4 1 1 0 0 16 2 10 0 2 2 46 0.24%
Spartanburg 126 108 14 36 69 3 35 12 0 9 255 42 709 3.72%
Sumter 26 31 6 16 20 43 9 27 5 5 8 24 220 1.16%
Union 2 6 1 1 6 0 2 1 0 0 4 6 29 0.15%
Williamsburg 4 2 0 11 4 34 3 11 2 1 0 5 77 0.40%
York 167 208 16 56 103 18 25 17 5 19 58 147 839 4.41%
Out‐Of‐State 26 2,657 324 1,236 956 30 37 111 71 83 57 104 5,692 29.90%
Foreign 2 62 9 25 16 13 8 0 23 7 11 16 192 1.01%
Unknown 1,384 0 0 0 3 0 0 0 0 0 0 0 1,387 7.29%
Institution Total 3,684 5,110 734 2,249 2,349 729 608 628 623 487 762 1,072 19,035 100.00%

Annual Report on Admission Standards for First Time Entering Freshmen, Fall 2016 Page 13
Part II: Fall 2016 Data Related to College Preparatory Course Prerequisites
Since Fall 1988, public senior institutions in South Carolina require that applicants complete certain high school courses prior to entering college. The Commission reviews, vets, and updates the list of course prerequisites to ensure alignment with minimal institution requirements. The following table details the college preparatory course prerequisites implemented in Fall 2011, and valid through Fall 2018 (CHE 2006, 2012). The requirements for first‐time freshmen beginning in Fall 2019 were revised, approved, and distributed to the South Carolina Department of Education and made available to the public in Spring 2015 (CHE, 2015). The next revision cycle is scheduled to begin in Fall 2020.
College Preparatory Course Prerequisites 2011 Four (4) Units of English: At least two units must have strong grammar and composition components, at least one must be in English literature, and at least one must be in American literature. Completion of College Preparatory English I, II, III, and IV will meet this criterion.
Four (4) Units of Mathematics: These include Algebra I (for which Applied Mathematics I and II may count together as a substitute, if a student successfully completes Algebra II), Algebra II, and Geometry. A fourth higher‐level mathematics course should be selected from among Algebra III/trigonometry, pre‐calculus, calculus, statistics, discrete mathematics, or a capstone mathematics course and should be taken during the senior year.
Three (3) Units of Laboratory Science: Two units must be taken in two different fields of the physical or life sciences and selected from among biology, chemistry, or physics. The third unit may be from the same field as one of the first two units (biology, chemistry, or physics) or from any laboratory science for which biology and/or chemistry is a prerequisite. Courses in earth science, general physical science, or introductory or general environmental science for which biology and/or chemistry is not a prerequisite will not meet this requirement. It is strongly recommended that students take physical science (taught as a laboratory science) as a prerequisite to the three required units of laboratory science outlined in this section. It is also strongly recommended that students desiring to pursue careers in science, mathematics, engineering or technology take one course in all three fields.
Two (2) Units of the same Foreign Language.
Three (3) Units of Social Science: One unit of U.S. History is required; a half unit of Economics and a half unit in Government are strongly recommended.
One (1) Unit of Elective: One unit must be taken as an elective. A college preparatory course in Computer Science (i.e., one involving significant programming content, not simply keyboarding) is strongly recommended for this elective. Other acceptable electives include college preparatory courses in English; fine arts; foreign languages; social science; humanities; laboratory science (excluding earth science, general physical science, general environmental science, and other introductory science courses for which biology and/or chemistry is not a prerequisite); or mathematics above the level of Algebra II.
One (1) Unit of Physical Education or ROTC.
One (1) Unit of Fine Arts: One unit in Appreciation of, History of, or Performance in one of the fine arts.
Each institution may also make exceptions in admitting 1) students who do not meet all of the prerequisites in cases where the failure to meet one or more prerequisites is due to circumstances beyond the reasonable control of the student, or 2) students who have taken the Tech Prep (Applied Academics) courses rather than the required college preparatory curriculum described above and who meet all other institutional admission criteria (CHE 2006, 2015). Thus, some variation of admission requirements from one college to the next is the normative. The College Board (n.d.) states “there’s no magic formula when it comes to college admission decisions” and that many factors influence admission. Table 3 (p. 15) presents the number and percentage of applicable first‐time freshmen meeting all of the college preparatory course prerequisites, also referred to as compliance rate. The proportion of all applicable first‐time freshmen meeting all of the prerequisites was on a steady incline from 2013 to 2015 (CHE 2018). After a decrease from 91.7 percent in 2012 to 85.3 percent in 2013, there was an increase to 85.4 percent in 2014, and a subsequent increase to 91.2 percent in 2015. However, in Fall 2016, the percentage of students meeting the college preparatory course prerequisites decreased to 88.7 percent,

Annual Report on Admission Standards for First Time Entering Freshmen, Fall 2016 Page 14
and continues to fall below the 1999 average of 98.15 percent. Of the public senior institutions, no institution met and exceeded the 1999 average in Fall 2016. College of Charleston experienced the largest percentage of students meeting the college preparatory course prerequisites at 97.5 percent, followed by Francis Marion at 94.1 percent. The prerequisites for first‐time freshmen that do not meet the requirements are either waived or additional courses are required. In Fall 2016, 918 in‐state students did not meet the requirements compared to 1262 out‐of‐state students for the public senior institutions and USC two‐year campuses. The number of students not meeting the college preparatory course prerequisites increased for both in‐state (42.3 percent increase) and out‐of‐state (14.5 percent increase) first‐time freshmen. Again, all but one of the public senior institutions, Francis Marion, waived the prerequisites. Instead, Francis Marion required students not meeting the prerequisites to take additional courses. In Fall 2015, four in‐state students were required to take additional courses. However, twelve (12) in‐state students and four (4) out‐of‐state students contributed to the 16 first‐time freshmen not meeting the prerequisites and required to take additional courses in Fall 2016. This is a 40 percent increase from the previous year. Again, the number of in‐state students not meeting the college preparatory course prerequisites is higher than out‐of‐state students for seven of the twelve public senior institutions (Francis Marion, Lander, South Carolina State, USC Aiken, USC Beaufort, USC Upstate, and Winthrop).

Annual Report on Admission Standards for First Time Entering Freshmen, Fall 2016 Page 15
1 Not applicable to foreign students, GED students, and students who graduated prior to 1988. 2 At the USC two‐year campuses, the prerequisites are applicable to those students accepted and classified by the institution as baccalaureate‐ready. 3 As reported in Annual report on admission standards for first‐time entering freshmen, Fall 2014 (CHE, 2017).
Table 3
Percent of Applicable1 First‐Time Freshmen Meeting College Preparatory Course Prerequisites
20133 20143 2015 2016
Institution Applicab
le
Freshman
Number
Meeting
Prerequisites
Percent
Meeting
Prerequisites
Applicab
le
Freshman
Number
Meeting
Prerequisites
Percent
Meeting
Prerequisites
Applicab
le
Freshman
Number
Meeting
Prerequisites
Percent
Meeting
Prerequisites
Applicab
le
Freshman
Number
Meeting
Prerequisites
Percent
Meeting
Prerequisites
Percentage
Diff. Comparing
2013 and 2016
Research Institutions
Clemson 3,289 2,786 84.7% 3,475 2,966 85.4% 3,447 3,099 89.9% 3,684 3,290 89.3% 4.6%
USC Columbia 5,009 4,076 81.4% 4,927 3,963 80.4% 5,073 4,424 87.2% 5,040 4,147 82.3% 0.9%
Total 8,298 6,862 82.7% 8,402 6,929 82.5% 8,520 7,523 88.3% 8,724 7,437 85.2% 2.6%
Comprehensive Teaching Colleges & Universities
The Citadel 645 568 88.1% 539 479 88.9% 602 557 92.5% 734 678 92.4% 4.3%
Coastal Carolina 2,064 2,014 97.6% 2348 2,280 97.1% 2,331 2,254 96.7% 2,211 2,130 96.3% ‐1.2%
College of Charleston 2,107 2,072 98.3% 2164 2,120 98.0% 2,226 2,182 98.0% 2,340 2,281 97.5% ‐0.9%
Francis Marion 744 682 91.7% 758 723 95.4% 739 735 99.2% 729 686 94.1% 2.4%
Lander 505 449 88.9% 533 497 93.2% 541 502 92.8% 600 556 92.7% 3.8%
SC State 566 526 92.9% 641 570 88.9% 494 430 87.0% 628 600 95.5% 2.6%
USC Aiken 634 532 83.9% 605 528 87.3% 570 505 88.6% 598 518 86.6% 2.7%
USC Beaufort 397 288 72.5% 388 275 70.9% 460 387 84.1% 475 363 76.4% 3.9%
USC Upstate 766 640 83.6% 784 655 83.5% 779 697 89.5% 745 617 82.8% ‐0.7%
Winthrop 1,077 1,010 93.8% 1,011 955 94.5% 1,081 1,004 92.9% 1,055 971 92.0% ‐1.7%
Total 9,505 8,781 92.4% 9,771 9,082 92.9% 9,823 9,253 94.2% 10,115 9,400 92.9% 0.5%
Total Senior Institutions 17,803 15,643 87.9% 18,173 16,011 88.1% 18,343 16,776 91.5% 18,839 16,837 89.4% 1.5%
Two‐Year Regional Campuses of USC2
USC Lancaster 363 188 51.8% 319 145 45.5% 100 36 36.0% 277 147 53.1% 1.3%
USC Salkehatchie 287 13 4.5% 256 3 1.2% 0 0 ‐ 8 8 100.0% 95.5%
USC Sumter 226 169 74.8% 216 151 69.9% 0 0 ‐ 212 164 77.4% 2.6%
USC‐Union 100 3 3.0% 134 0 0.0% 0 0 ‐ 0 0 ‐ ‐
Total USC Two‐Year 976 373 38.2% 925 299 32.3% 100 36 36.0% 497 319 64.2% 26.0%
Grand Total 18,779 16,016 85.3% 19,098 16,310 85.4% 18,443 16,812 91.2% 19,336 17,156 88.7% 3.4%
Annual Report on Admission Standards for First Time Entering Freshmen, Fall 2016 Page 16
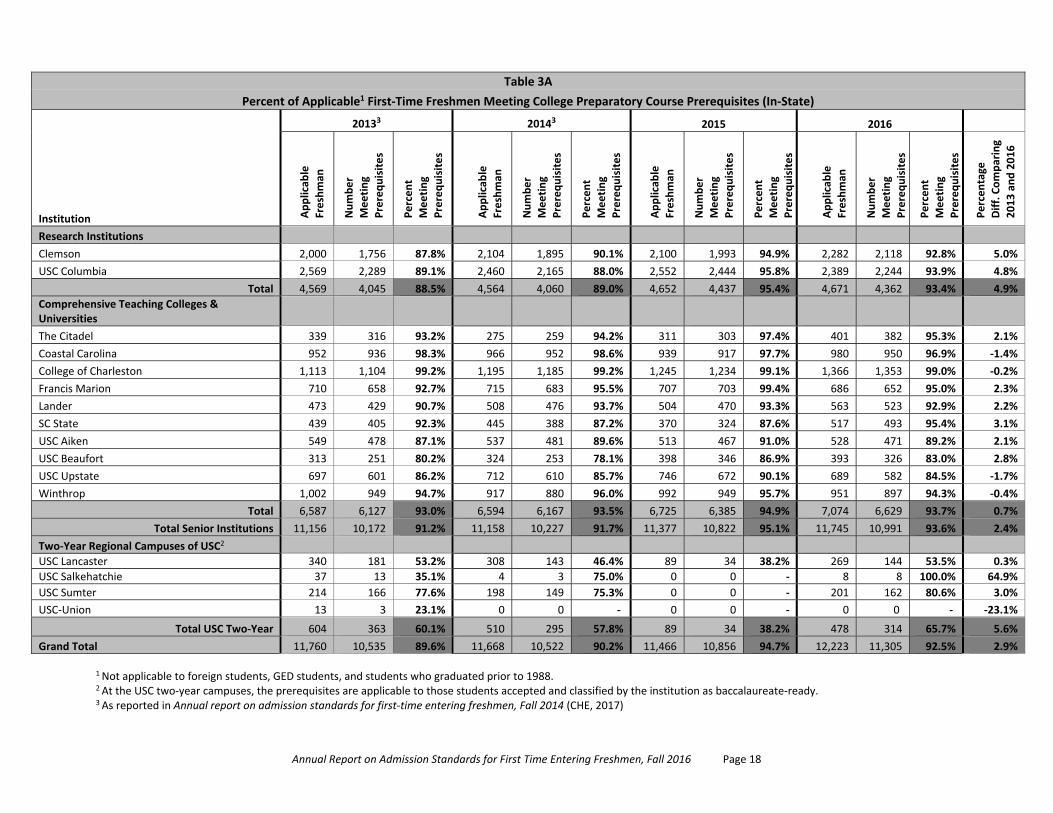
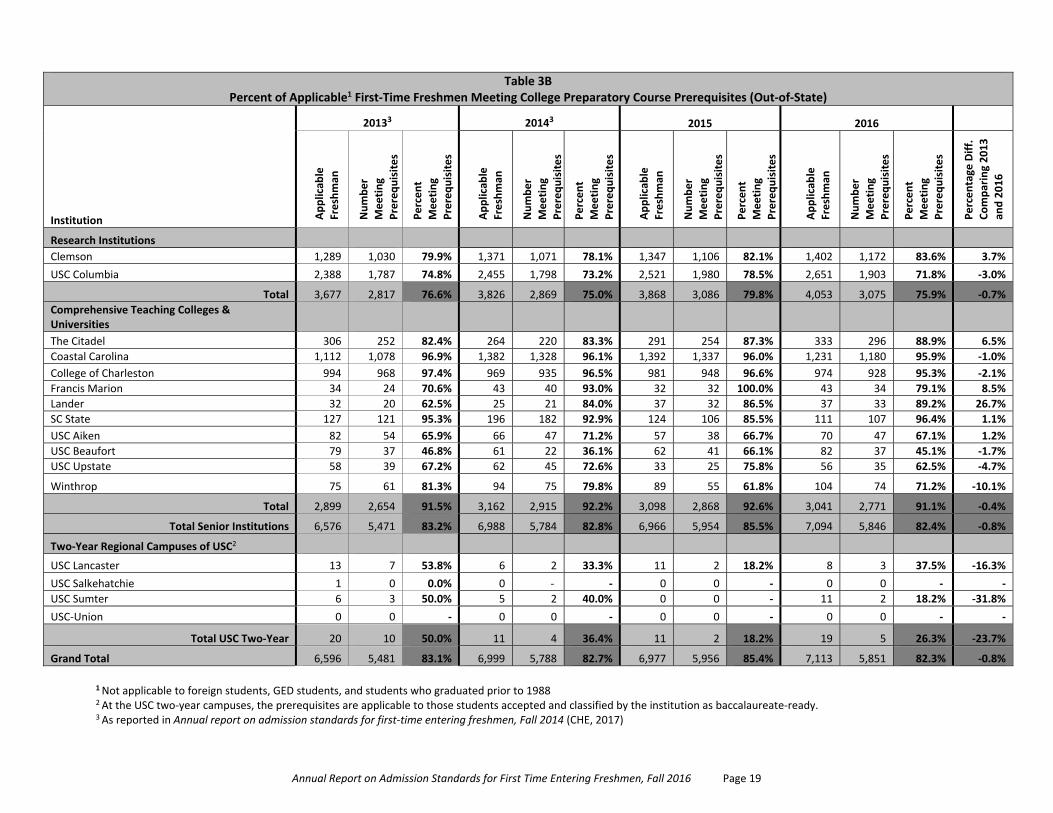
Institutional Findings The compliance rate is the number and percentage of applicable first‐time freshmen meeting all of the college preparatory course prerequisites. As shown in Table 3, for Fall 2016, seven (one more than 2015) public senior institutions (The Citadel, Coastal Carolina, College of Charleston, Francis Marion, Lander, South Carolina State, and Winthrop) indicate a compliance rate between 90 ‐ 100 percent. Four public senior institutions (Clemson, USC Columbia, USC Aiken, and USC Upstate) indicate a compliance rate between 80 – 90 percent. USC Beaufort is the only public senior institution to demonstrate a compliance rate less than 80 percent. All (five more than in 2015) of the public senior institutions (Clemson, USC Columbia, The Citadel, Coastal Carolina, College of Charleston, Francis Marion, Lander, USC Aiken, USC Beaufort, USC Upstate, and Winthrop), except South Carolina State University, indicate a decrease in the compliance rate from Fall 2015 to Fall 2016. South Carolina State University is the only institution in which an increase occurred (8.5 percent). College of Charleston has the highest compliance rate at 97.5 percent. The compliance rate for Lander remains approximately the same at 92.7 percent, 0.1 percent higher than the data indicated in 2015 (CHE, 2018). USC Beaufort continues to demonstrate the lowest compliance rate among the public senior institutions, decreasing from 84.1 percent in 2015 to 76.4 percent in 2016 and indicating the largest decrease in the compliance rate at 7.7 percent. Despite the decrease in compliance, the overall retention rate of USC Beaufort remains steady (Table 3C, p. 16). The data received from USC Beaufort reveals the majority of first‐time freshmen who did not meet the college preparatory prerequisites occurred in the areas of Fine Arts (42.0 percent), Lab Science (39.2 percent), Mathematics (25.9 percent), and English (13.4 percent). In 2015, first‐time freshmen lacking requirements in Foreign Language, not English, accounted for 13 percent. In addition, in‐state students at USC Beaufort account for the majority of first‐time freshmen students not meeting the college preparatory course prerequisites (59.8 percent) in Fall 2016, but this is 15 percent less than in Fall 2015. Thus, more in‐state students are now meeting college preparatory course prerequisites. Fine Arts is the primary area in which prerequisites are not met among the eleven public senior institutions reporting a lower compliance rate (Clemson, USC Columbia, The Citadel, Coastal Carolina, College of Charleston, Francis Marion, Lander, USC Aiken, USC Beaufort, USC Upstate, and Winthrop) in Fall 2016. The highest number of students not meeting the requirements for Foreign Language occurred for Clemson (229 students) and USC Columbia (741 students). However, Foreign Language and Lab Science also emerged as areas in which prerequisites are not met for institutions with lower compliance. Previous reports indicate the rate of compliance among “out‐of‐state” students contributed to a lower overall compliance rate (CHE 2012, 2014, 2017, 2018). Considering admission requirements can vary from one college to the next within and across state lines, a higher compliance rate among in‐state students is expected since the South Carolina prerequisites are disseminated to the South Carolina K‐12 system to use as a resource in preparing students for college. In Fall 2016 data, out‐of‐state students continue to represent a higher percentage of first‐time freshmen not meeting the college preparatory course prerequisites. Table 3A (p. 18) and Table 3B (p. 19) represent the number of applicable first‐time freshmen meeting high school course prerequisites “In‐State” and “Out‐of‐State”, respectively. A comparison between the last column of both Table 3A and Table 3B in Fall 2016 indicates the compliance rate of first‐time in‐state freshmen is higher than for out‐of‐state freshmen for all but one public senior institution, South Carolina State University. The compliance rate for out‐of‐state first‐time freshmen attending South Carolina State University is one percent higher than in‐state students. Overall, a decrease

Annual Report on Admission Standards for First Time Entering Freshmen, Fall 2016 Page 17
in the compliance rate occurs among both in‐state (‐2.2 percent) and out‐of‐state students (‐3.1 percent), but remains higher among out‐of‐state students. The amount of the decrease in compliance also remains larger among out‐of‐state students, ranging from 0.2 percent to 1.0 percent, with USC Beaufort indicating the largest percentage. Therefore, the decrease in compliance reported in Table 3 is likely attributed to out‐of‐state students as a result of larger decreases from Fall 2012 to Fall 2015. Six institutions (USC Columbia, Coastal Carolina, College of Charleston, Francis Marion, USC Beaufort, and USC Upstate) experienced a decrease in the compliance rate among both in‐state and out‐of‐state students. Six senior public institutions (Clemson, The Citadel, Lander, South Carolina Sate, USC Aiken, and Winthrop) increased the compliance rate among out‐of‐state students in 2015. Six senior institutions report a compliance rate for out‐of‐state students below the average of 82.3 percent for all institutions, ranging from 45.1 percent to 79.1 percent. This is retrogression in compliance among out‐of‐state students from the Fall 2015 rate, in which the lowest compliance was 61.8 percent. However, among the 11 public senior institutions with an overall lower compliance rate in Fall 2016 compared to Fall 2015 (Clemson, USC Columbia, The Citadel, Coastal Carolina, College of Charleston, Francis Marion, Lander, USC Aiken, USC Beaufort, USC Upstate, and Winthrop), in‐state students accounted for the majority of first‐time freshmen not meeting the prerequisites for four of the institutions (USC Columbia, The Citadel, Coastal Carolina, USC Aiken, and Winthrop).
Annual Report on Admission Standards for First Time Entering Freshmen, Fall 2016 Page 18
1 Not applicable to foreign students, GED students, and students who graduated prior to 1988. 2 At the USC two‐year campuses, the prerequisites are applicable to those students accepted and classified by the institution as baccalaureate‐ready. 3 As reported in Annual report on admission standards for first‐time entering freshmen, Fall 2014 (CHE, 2017)
Table 3A
Percent of Applicable1 First‐Time Freshmen Meeting College Preparatory Course Prerequisites (In‐State)
20133 20143 2015 2016
Institution Applicab
le
Freshman
Number
Meeting
Prerequisites
Percent
Meeting
Prerequisites
Applicab
le
Freshman
Number
Meeting
Prerequisites
Percent
Meeting
Prerequisites
Applicab
le
Freshman
Number
Meeting
Prerequisites
Percent
Meeting
Prerequisites
Applicab
le
Freshman
Number
Meeting
Prerequisites
Percent
Meeting
Prerequisites
Percentage
Diff. Comparing
2013 and 2016
Research Institutions
Clemson 2,000 1,756 87.8% 2,104 1,895 90.1% 2,100 1,993 94.9% 2,282 2,118 92.8% 5.0%
USC Columbia 2,569 2,289 89.1% 2,460 2,165 88.0% 2,552 2,444 95.8% 2,389 2,244 93.9% 4.8%
Total 4,569 4,045 88.5% 4,564 4,060 89.0% 4,652 4,437 95.4% 4,671 4,362 93.4% 4.9%
Comprehensive Teaching Colleges & Universities
The Citadel 339 316 93.2% 275 259 94.2% 311 303 97.4% 401 382 95.3% 2.1%
Coastal Carolina 952 936 98.3% 966 952 98.6% 939 917 97.7% 980 950 96.9% ‐1.4%
College of Charleston 1,113 1,104 99.2% 1,195 1,185 99.2% 1,245 1,234 99.1% 1,366 1,353 99.0% ‐0.2%
Francis Marion 710 658 92.7% 715 683 95.5% 707 703 99.4% 686 652 95.0% 2.3%
Lander 473 429 90.7% 508 476 93.7% 504 470 93.3% 563 523 92.9% 2.2%
SC State 439 405 92.3% 445 388 87.2% 370 324 87.6% 517 493 95.4% 3.1%
USC Aiken 549 478 87.1% 537 481 89.6% 513 467 91.0% 528 471 89.2% 2.1%
USC Beaufort 313 251 80.2% 324 253 78.1% 398 346 86.9% 393 326 83.0% 2.8%
USC Upstate 697 601 86.2% 712 610 85.7% 746 672 90.1% 689 582 84.5% ‐1.7%
Winthrop 1,002 949 94.7% 917 880 96.0% 992 949 95.7% 951 897 94.3% ‐0.4%
Total 6,587 6,127 93.0% 6,594 6,167 93.5% 6,725 6,385 94.9% 7,074 6,629 93.7% 0.7%
Total Senior Institutions 11,156 10,172 91.2% 11,158 10,227 91.7% 11,377 10,822 95.1% 11,745 10,991 93.6% 2.4%
Two‐Year Regional Campuses of USC2
USC Lancaster 340 181 53.2% 308 143 46.4% 89 34 38.2% 269 144 53.5% 0.3%
USC Salkehatchie 37 13 35.1% 4 3 75.0% 0 0 ‐ 8 8 100.0% 64.9%
USC Sumter 214 166 77.6% 198 149 75.3% 0 0 ‐ 201 162 80.6% 3.0%
USC‐Union 13 3 23.1% 0 0 ‐ 0 0 ‐ 0 0 ‐ ‐23.1%
Total USC Two‐Year 604 363 60.1% 510 295 57.8% 89 34 38.2% 478 314 65.7% 5.6%
Grand Total 11,760 10,535 89.6% 11,668 10,522 90.2% 11,466 10,856 94.7% 12,223 11,305 92.5% 2.9%
Annual Report on Admission Standards for First Time Entering Freshmen, Fall 2016 Page 19
1 Not applicable to foreign students, GED students, and students who graduated prior to 1988 2 At the USC two‐year campuses, the prerequisites are applicable to those students accepted and classified by the institution as baccalaureate‐ready.3 As reported in Annual report on admission standards for first‐time entering freshmen, Fall 2014 (CHE, 2017)
Table 3B Percent of Applicable1 First‐Time Freshmen Meeting College Preparatory Course Prerequisites (Out‐of‐State)
20133 20143 2015 2016
Institution Applicab
le
Freshman
Number
Meeting
Prerequisites
Percent
Meeting
Prerequisites
Applicab
le
Freshman
Number
Meeting
Prerequisites
Percent
Meeting
Prerequisites
Applicab
le
Freshman
Number
Meeting
Prerequisites
Percent
Meeting
Prerequisites
Applicab
le
Freshman
Number
Meeting
Prerequisites
Percent
Meeting
Prerequisites
Percentage
Diff.
Comparing 2013
and 2016
Research Institutions
Clemson 1,289 1,030 79.9% 1,371 1,071 78.1% 1,347 1,106 82.1% 1,402 1,172 83.6% 3.7%
USC Columbia 2,388 1,787 74.8% 2,455 1,798 73.2% 2,521 1,980 78.5% 2,651 1,903 71.8% ‐3.0%
Total 3,677 2,817 76.6% 3,826 2,869 75.0% 3,868 3,086 79.8% 4,053 3,075 75.9% ‐0.7%
Comprehensive Teaching Colleges & Universities
The Citadel 306 252 82.4% 264 220 83.3% 291 254 87.3% 333 296 88.9% 6.5%
Coastal Carolina 1,112 1,078 96.9% 1,382 1,328 96.1% 1,392 1,337 96.0% 1,231 1,180 95.9% ‐1.0%
College of Charleston 994 968 97.4% 969 935 96.5% 981 948 96.6% 974 928 95.3% ‐2.1%
Francis Marion 34 24 70.6% 43 40 93.0% 32 32 100.0% 43 34 79.1% 8.5%
Lander 32 20 62.5% 25 21 84.0% 37 32 86.5% 37 33 89.2% 26.7%
SC State 127 121 95.3% 196 182 92.9% 124 106 85.5% 111 107 96.4% 1.1%
USC Aiken 82 54 65.9% 66 47 71.2% 57 38 66.7% 70 47 67.1% 1.2%
USC Beaufort 79 37 46.8% 61 22 36.1% 62 41 66.1% 82 37 45.1% ‐1.7%
USC Upstate 58 39 67.2% 62 45 72.6% 33 25 75.8% 56 35 62.5% ‐4.7%
Winthrop 75 61 81.3% 94 75 79.8% 89 55 61.8% 104 74 71.2% ‐10.1%
Total 2,899 2,654 91.5% 3,162 2,915 92.2% 3,098 2,868 92.6% 3,041 2,771 91.1% ‐0.4%
Total Senior Institutions 6,576 5,471 83.2% 6,988 5,784 82.8% 6,966 5,954 85.5% 7,094 5,846 82.4% ‐0.8%
Two‐Year Regional Campuses of USC2
USC Lancaster 13 7 53.8% 6 2 33.3% 11 2 18.2% 8 3 37.5% ‐16.3%
USC Salkehatchie 1 0 0.0% 0 ‐ ‐ 0 0 ‐ 0 0 ‐ ‐
USC Sumter 6 3 50.0% 5 2 40.0% 0 0 ‐ 11 2 18.2% ‐31.8%
USC‐Union 0 0 ‐ 0 0 ‐ 0 0 ‐ 0 0 ‐ ‐
Total USC Two‐Year 20 10 50.0% 11 4 36.4% 11 2 18.2% 19 5 26.3% ‐23.7%
Grand Total 6,596 5,481 83.1% 6,999 5,788 82.7% 6,977 5,956 85.4% 7,113 5,851 82.3% ‐0.8%

Annual Report on Admission Standards for First Time Entering Freshmen, Fall 2016 Page 20
Retention and Compliance The Annual Report on Admission Standards also examines the freshman‐to‐sophomore retention rate of first‐time freshmen in relationship to the college preparatory course prerequisite compliance data for the last five years. Retention rate, reported by each institution, is “the rate at which entering freshmen in a fall semester enroll the following fall semester” at the same institution (The National Center for Higher Education Management Systems [NCHEMS], 2015). NCHEMS reported the Fall 2015 national retention rate was 79.8 percent and steadily increased since 2009. NCHEMS also reported the Fall 2015 retention rate for South Carolina was 76.6 percent. South Carolina retention rates usually fall below the national average, but began to increase in 2012 (74.1 percent) after a slight decline in 2011 (73.7 percent) from a rate of 73.9 percent in 2010 and 75.0 percent in 2009. The Fall 2015 rate was also a slight decline from the Fall 2014 rate of 76.8 percent. Table 3C (p. 21) shows the overall retention rate and the retention rate of first‐time freshmen who did not meet the recommended college preparatory course prerequisites for the South Carolina public senior institutions. The average retention rate among the 12 public senior institutions is 79.7 percent, which is only slightly below the national retention rate and above the state retention rate of South Carolina in Fall 2015 and slightly above the Fall 2015 rate of 79.2 percent (CHE, 2018). However, eight (Coastal Carolina, Francis Marion, Lander, South Carolina State, USC Aiken, USC Beaufort, USC Upstate, and Winthrop) of the 12 institutions fall below both the 2015 state and national retention rates. Four (Clemson, USC Columbia, The Citadel, and College of Charleston) institutions exceed the 2015 state and national retention rates. Clemson continues to demonstrate the highest retention rate at 92.2 percent, followed by USC Columbia (86.5 percent) and The Citadel (83.7 percent). USC Beaufort (53.7 percent) and Francis Marion (67.7 percent) indicate the lowest retention rates. The overall retention rate among the public senior institutions in South Carolina continues to remain constant at nearly 80 percent from Fall 2015 to Fall 2016 (CHE, 2018). Six institutions (Coastal Carolina, Lander, South Carolina State, and USC Aiken), some only slightly, increased the overall retention rate of first‐time freshmen from Fall 2015 to Fall 2016. The retention rate remained approximately the same for three institutions (College of Charleston, USC Beaufort, and USC Upstate), and five institutions (Clemson, USC Columbia, The Citadel, Francis Marion, and Winthrop) indicate a decrease in retention rates from Fall 2015 to Fall 2016 for both first‐time freshmen meeting and not meeting the college preparatory prerequisites. Both Clemson and USC Columbia indicating a slight decrease in the retention rate of 0.6 percent. Based on previous data, first‐time freshmen that meet the college preparatory course prerequisites are more likely to remain in college and transition to sophomore year compared to students who did not meet the requirements (CHE 2012, 2014, 2017, and 2018). Six of the 12 senior institutions demonstrate a decreased retention rate for students who did not meet the college preparatory course requirements (Clemson, Coastal Carolina, South Carolina State, USC Aiken, USC Upstate, and Winthrop), while the remaining half indicate an increased rate of retention for students who did not meet the high school course requirements. Francis Marion (42.9 percent) presents the largest difference in retention between students who meet and do not meet the college preparatory requirements followed by Lander (28.5 percent) and Winthrop (17.2 percent). USC Beaufort follows Winthrop with a retention difference of 11.7 percent. College of Charleston indicates the smallest difference at 0.2 percent. Although it is expected for first‐time freshmen meeting the college preparatory course requirements to have a higher retention rate than students not meeting the requirements, retention and increasing

Annual Report on Admission Standards for First Time Entering Freshmen, Fall 2016 Page 21
retention of all admitted students is the desired outcome. However, retention efforts often cost in time and money to students, institutions, and government (Simpson, 2005). Students who transfer to another school or drop out after freshmen year can negatively impact the institution’s retention rate, one of the legitimate metrics related to success of an institution’s performance, as well as their bottom line. Ultimately institutions are interested in practices that cover costs, but provide a financial return and increase student success. On the other hand, from the perspective of students and parents, retention rates are indicators of satisfaction with the school, academic and personal support, and the potential return on investment in attending a particular institution. Seven public senior institutions (Clemson, USC Columbia, The Citadel, Francis Marion, USC Aiken, USC Upstate, and Winthrop) indicate an increase in the retention rate among students meeting the requirements from Fall 2015 to Fall 2016. The retention rate remained approximately the same for USC Beaufort, but decreased for Coastal Carolina, College of Charleston, Lander, and South Carolina State. However, half of the public senior institutions experienced a lower retention rate from Fall 2015 to Fall 2016 among students not meeting the college preparatory course prerequisites. Six (Clemson, Coastal Carolina, South Carolina State, USC Aiken, USC Upstate, and Winthrop) of the 12 public senior institutions indicate a decrease in the retention rate among students not meeting the requirements. The remaining institutions (USC Columbia, The Citadel, College of Charleston, Francis Marion, Lander, and USC Beaufort) demonstrate a higher retention rate among this subgroup. USC Columbia, The Citadel, and Francis Marion experienced an increase in retention among students meeting and not meeting the college preparatory requirements. On average, there was only a 2.1 percent difference in retention rates for students meeting the prerequisites compared to those not meeting the prerequisites, a slight increase from the 1.6 percent difference in 2015 (CHE, 2018).
Table 3C Fall 2015 First‐Time Freshmen Not Meeting High School Prerequisites Retained at Same Institution in Fall 2016
S.C. Public Senior Institutions
Institution
Applicable Freshmen Meeting Prerequisites
Applicable Freshmen Not Meeting Prerequisites
Research Institutions Applicable Freshmen
Total Retention Fall 2016 Number Retained Percentage Number Retained Percentage
Clemson 3,447 92.2% 3,099 2,854 92.1% 348 323 92.8%
USC Columbia 5,073 86.5% 4,424 3,845 86.9% 649 544 83.8%
Total 8,520 88.8% 7,523 6,699 89.5% 997 867 88.3%
Comprehensive Teaching Colleges & Universities
The Citadel 602 82.7% 557 461 82.8% 45 37 82.2%
Coastal Carolina 2,331 68.3% 2,254 1,545 68.5% 77 47 61.0%
College of Charleston 2,226 79.3% 2,182 1,731 79.3% 44 35 79.5%
Francis Marion 739 67.7% 735 499 67.9% 4 1 25.0%
Lander University 541 70.1% 502 362 72.1% 39 17 43.6%
SC State 494 69.2% 430 298 69.3% 64 44 68.8%
USC Aiken 570 69.3% 505 352 69.7% 65 43 66.2%
USC Beaufort 460 53.7% 387 215 55.6% 73 32 43.8%
USC Upstate 779 68.8% 697 485 69.6% 82 51 62.2%
Winthrop 1,081 73.1% 1,004 746 74.3% 77 44 57.1%
Total 9,823 71.7% 9,253 6,694 72.3% 570 351 61.6%
Grand Total 18,343 79.7% 16,776 13,393 79.8% 1,567 1,218 77.7%

Annual Report on Admission Standards for First Time Entering Freshmen, Fall 2016 Page 22
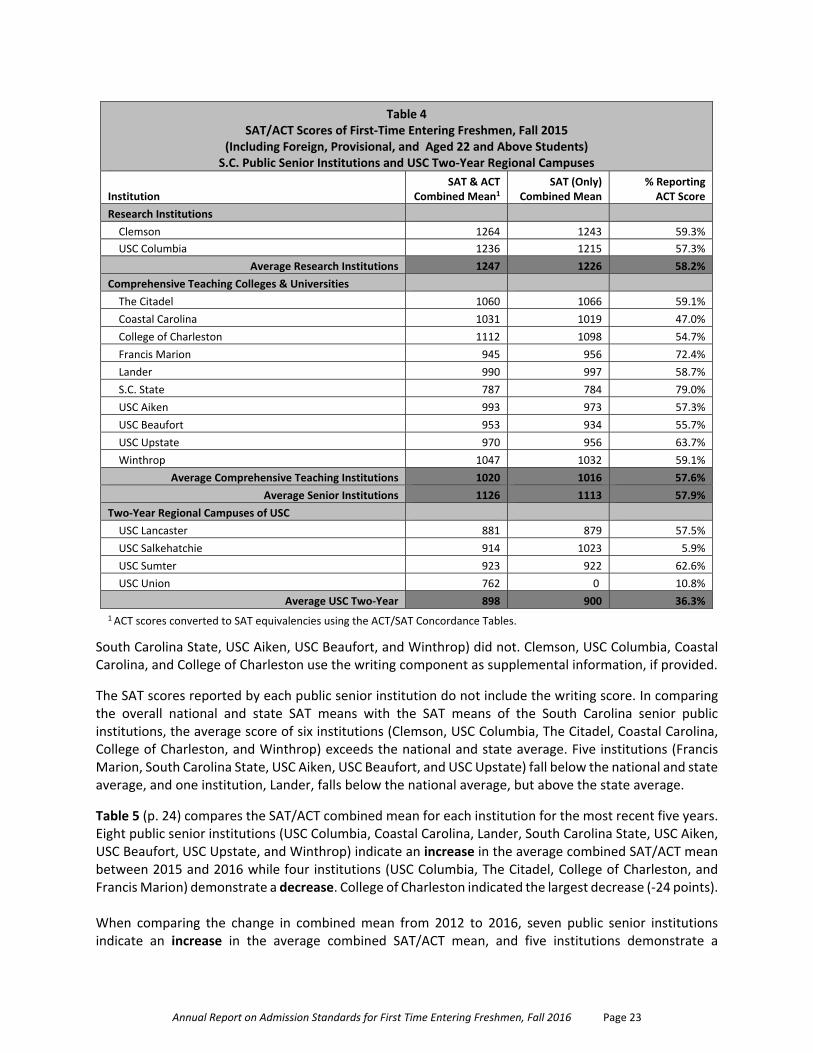
Part III: Fall 2015 SAT and ACT Scores The Annual Report on Admission Standards highlights scores from the average Scholastic Aptitude Test (SAT) and American College Testing (ACT) assessments for all first‐time entering freshmen as indicators of academic preparation and college readiness. The SAT is composed of three sections: 1) Critical Reading, 2) Mathematics, and 3) Writing (The College Board, 2015a). In Fall 2016, the majority of students attending South Carolina public senior institutions report taking the ACT (10,841 students) rather than the SAT (7,736 students) as a college entrance examination, contradicting the pattern of the last four years. Less than 1 percent of first‐time freshmen (175 students) take both the SAT and ACT, and 1.5 percent (282 students) did not take either assessment. The scores of students who report only ACT scores are converted to SAT equivalencies using the ACT‐SAT concordance tables developed by the Educational Testing Service (ETS) and The College Board (The College Board, 2015b). The converted scores are then averaged with the SAT scores to construct an SAT/ACT combined mean. When ACT scores are converted into SAT equivalencies and combined into the mean, the SAT/ACT combined mean is slightly lower than the SAT combined mean excluding ACT scores (except for the research institutions). In general, the combined SAT/ACT mean is lower because more than one SAT combined score (verbal and math) converts into the same ACT score, whereas only one ACT composite score converts to an SAT combined score except at the lowest end of the range. Depending on the range within students’ scores fall (including ACT/SAT equivalencies in the calculation of the mean), a student’s score could either increase or decrease the combined mean at that institution. The SAT total score is reported on a scale ranging from 400 – 1600 (The College Board, 2015c). For this report, the national and state overall mean SAT scores for 2015 college‐bound seniors who took the SAT at any time during their high school year through June 2015, and using the most recent score, is examined. Nationally, the average mean scores is 1002 without the writing section and 1484 with the writing section, four and six points lower than the averages mean scores in 2015, respectively (The College Board, 2016a). The South Carolina overall mean scores are 987 without the writing section and 1458 with the writing section, 12 and 16 points higher than the average mean scores in 2015, respectively (The College Board, 2016b). The South Carolina institutions in which students seek admission vary in whether or not the writing section/score is required and/or factored into admission decisions (CHE, 2017 and 2018). Table 4 (p. 23) details the following for Fall 2016 first‐time freshmen attending public senior institutions in South Carolina by sector: 1) SAT/ACT combined mean, 2) combined mean for SAT scores only, and 3) percentage of students reporting ACT scores only. Again, Clemson indicated the highest average SAT/ACT (1264) and SAT (1243) combined means (a decrease of three and eight points, respectively), followed by USC Columbia with average scores of 1236 and 1215, an increase of fifteen and six points, respectively. South Carolina State indicated the lowest average SAT/ACT (787) and SAT (784) combined means, but also indicated the highest percentage of student reporting an ACT score (79.0 percent). This represents an increase of seven and fourteen points, respectively, in the SAT/ACT and SAT combined means, and a 22.7 percent increase among students reporting an ACT score. In comparing the overall national and state SAT means with the SAT means of the South Carolina senior public institutions, the application of the writing section may influence how the results of each institution are viewed. Based on the 2015 Admission Standards annual report, only three of the institutions (Coastal Carolina, Francis Marion, and USC Upstate) factor the writing component into Fall 2016 admissions (CHE, 2018). The remaining institutions (Clemson, USC Columbia, The Citadel, College of Charleston Lander,
Annual Report on Admission Standards for First Time Entering Freshmen, Fall 2016 Page 23
South Carolina State, USC Aiken, USC Beaufort, and Winthrop) did not. Clemson, USC Columbia, Coastal Carolina, and College of Charleston use the writing component as supplemental information, if provided.
The SAT scores reported by each public senior institution do not include the writing score. In comparing the overall national and state SAT means with the SAT means of the South Carolina senior public institutions, the average score of six institutions (Clemson, USC Columbia, The Citadel, Coastal Carolina, College of Charleston, and Winthrop) exceeds the national and state average. Five institutions (Francis Marion, South Carolina State, USC Aiken, USC Beaufort, and USC Upstate) fall below the national and state average, and one institution, Lander, falls below the national average, but above the state average.
Table 5 (p. 24) compares the SAT/ACT combined mean for each institution for the most recent five years. Eight public senior institutions (USC Columbia, Coastal Carolina, Lander, South Carolina State, USC Aiken, USC Beaufort, USC Upstate, and Winthrop) indicate an increase in the average combined SAT/ACT mean between 2015 and 2016 while four institutions (USC Columbia, The Citadel, College of Charleston, and Francis Marion) demonstrate a decrease. College of Charleston indicated the largest decrease (‐24 points). When comparing the change in combined mean from 2012 to 2016, seven public senior institutions indicate an increase in the average combined SAT/ACT mean, and five institutions demonstrate a
Table 4 SAT/ACT Scores of First‐Time Entering Freshmen, Fall 2015
(Including Foreign, Provisional, and Aged 22 and Above Students) S.C. Public Senior Institutions and USC Two‐Year Regional Campuses
Institution SAT & ACT
Combined Mean1 SAT (Only)
Combined Mean % Reporting ACT Score
Research Institutions
Clemson 1264 1243 59.3%
USC Columbia 1236 1215 57.3%
Average Research Institutions 1247 1226 58.2%
Comprehensive Teaching Colleges & Universities
The Citadel 1060 1066 59.1%
Coastal Carolina 1031 1019 47.0%
College of Charleston 1112 1098 54.7%
Francis Marion 945 956 72.4%
Lander 990 997 58.7%
S.C. State 787 784 79.0%
USC Aiken 993 973 57.3%
USC Beaufort 953 934 55.7%
USC Upstate 970 956 63.7%
Winthrop 1047 1032 59.1%
Average Comprehensive Teaching Institutions 1020 1016 57.6%
Average Senior Institutions 1126 1113 57.9%
Two‐Year Regional Campuses of USC
USC Lancaster 881 879 57.5%
USC Salkehatchie 914 1023 5.9%
USC Sumter 923 922 62.6%
USC Union 762 0 10.8%
Average USC Two‐Year 898 900 36.3%
1 ACT scores converted to SAT equivalencies using the ACT/SAT Concordance Tables.

Annual Report on Admission Standards for First Time Entering Freshmen, Fall 2016 Page 24
decrease. Only two institutions, The Citadel and College of Charleston indicate a decrease from 2015 to 2016, and also demonstrate a decrease in the combined mean from 2012 to 2016. Clemson and Francis Marion demonstrate a decrease from 2015 to 2016, but average an increase from 2012 to 2016. USC Columbia, Coastal Carolina, Lander, USC Aiken, and USC Beaufort demonstrate increases from 2015 to 2016, as well as the average from 2012 to 2016. Despite the decreases, the average combined SAT/ACT mean for public senior institutions in South Carolina increased by 13 points from 2012 to 2015.
Table 5 SAT/ACT Scores of First‐Time Entering Freshmen1
(Including Foreign, Provisional, and Students Age 22 and Above) S.C. Public Senior Institutions and USC Two‐Year Regional Campuses
2012 SAT/ACT
Combined Mean
2013 SAT/ACT
Combined Mean
2014 SAT/ACT
Combined Mean
2015 SAT/ACT
Combined Mean
2016 SAT/ACT
Combined Mean
2015‐2016 Change
Combined Mean
2012‐2016 Change
Combined Mean
Institution
Research Institutions
Clemson 1253 1254 1264 1267 1264 ‐3 11
USC Columbia 1202 1212 1218 1221 1236 15 34
Average Research Institutions 1224 1229 1237 1240 1247 7 23
Comprehensive Teaching Colleges & Universities
The Citadel 1083 1079 1083 1082 1060 ‐22 ‐23
Coastal Carolina 998 1004 1001 1018 1031 13 33
College of Charleston 1159 1153 1141 1136 1112 ‐24 ‐47
Francis Marion 944 942 942 956 945 ‐11 1
Lander 976 979 985 983 990 7 14
S.C. State 835 799 828 774 787 13 ‐48
USC Aiken 982 986 988 988 993 5 11
USC Beaufort 942 951 948 932 953 21 11
USC Upstate 984 972 971 961 970 9 ‐14
Winthrop 1049 1037 1056 1044 1047 3 ‐2
Average Comprehensive Teaching Institutions 1023 1021 1021 1022 1020 ‐2 ‐3
Average Senior Institutions 1113 1118 1120 1124 1126 2 13
Two‐Year Regional Campuses of USC
USC Lancaster 870 873 882 887 881 ‐6 11
USC Salkehatchie 798 798 802 806 914 108 116
USC Sumter 931 931 944 913 923 10 ‐8
USC Union 834 834 799 751 762 11 ‐72
Average USC Two‐Year 859 859 863 854 898 44 39 1 ACT scores converted to SAT equivalencies using the ACT/SAT Concordance Tables.
Annual Report on Admission Standards for First Time Entering Freshmen, Fall 2016 Page 25
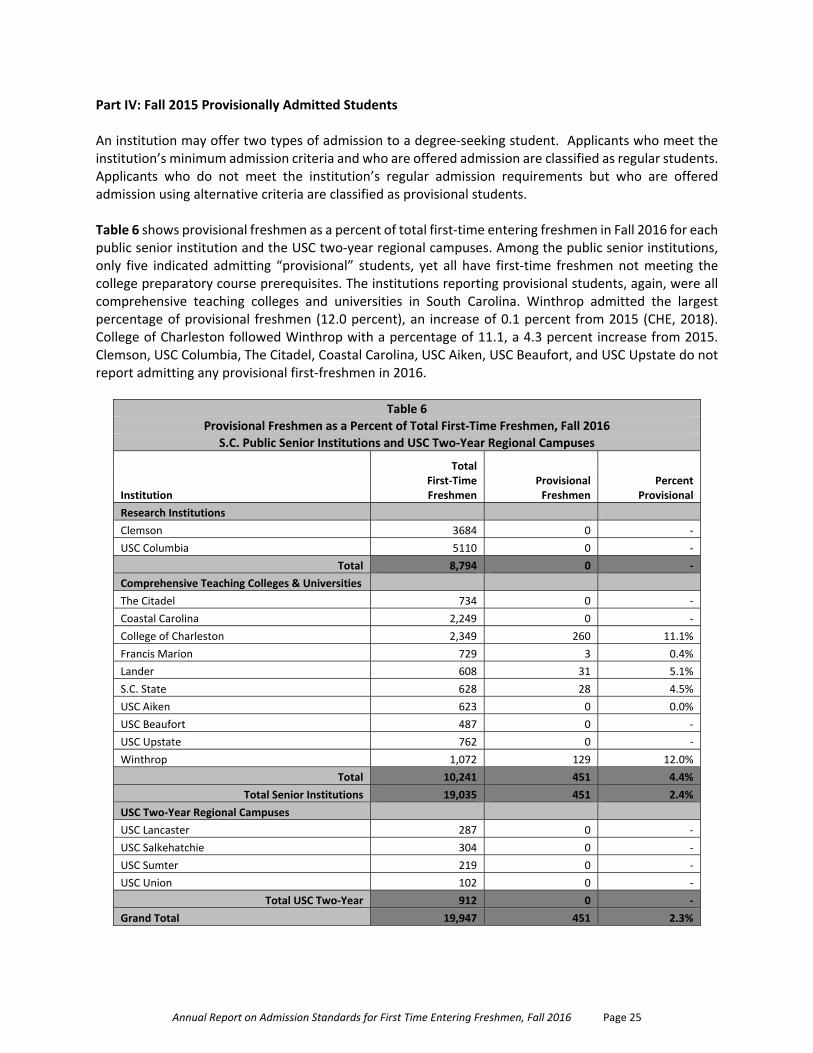
Part IV: Fall 2015 Provisionally Admitted Students An institution may offer two types of admission to a degree‐seeking student. Applicants who meet the institution’s minimum admission criteria and who are offered admission are classified as regular students. Applicants who do not meet the institution’s regular admission requirements but who are offered admission using alternative criteria are classified as provisional students. Table 6 shows provisional freshmen as a percent of total first‐time entering freshmen in Fall 2016 for each public senior institution and the USC two‐year regional campuses. Among the public senior institutions, only five indicated admitting “provisional” students, yet all have first‐time freshmen not meeting the college preparatory course prerequisites. The institutions reporting provisional students, again, were all comprehensive teaching colleges and universities in South Carolina. Winthrop admitted the largest percentage of provisional freshmen (12.0 percent), an increase of 0.1 percent from 2015 (CHE, 2018). College of Charleston followed Winthrop with a percentage of 11.1, a 4.3 percent increase from 2015. Clemson, USC Columbia, The Citadel, Coastal Carolina, USC Aiken, USC Beaufort, and USC Upstate do not report admitting any provisional first‐freshmen in 2016.
Table 6
Provisional Freshmen as a Percent of Total First‐Time Freshmen, Fall 2016
S.C. Public Senior Institutions and USC Two‐Year Regional Campuses
Total First‐Time Freshmen
Provisional Freshmen
Percent
Provisional
Institution
Research Institutions
Clemson 3684 0 ‐
USC Columbia 5110 0 ‐
Total 8,794 0 ‐
Comprehensive Teaching Colleges & Universities
The Citadel 734 0 ‐
Coastal Carolina 2,249 0 ‐
College of Charleston 2,349 260 11.1%
Francis Marion 729 3 0.4%
Lander 608 31 5.1%
S.C. State 628 28 4.5%
USC Aiken 623 0 0.0%
USC Beaufort 487 0 ‐
USC Upstate 762 0 ‐
Winthrop 1,072 129 12.0%
Total 10,241 451 4.4%
Total Senior Institutions 19,035 451 2.4%
USC Two‐Year Regional Campuses
USC Lancaster 287 0 ‐
USC Salkehatchie 304 0 ‐
USC Sumter 219 0 ‐
USC Union 102 0 ‐
Total USC Two‐Year 912 0 ‐
Grand Total 19,947 451 2.3%

Annual Report on Admission Standards for First Time Entering Freshmen, Fall 2016 Page 26
At a meeting on August 25, 1997, the Commission approved several recommendations for the institutions to consider regarding provisional students (CHE 2012, 2014, 2017). Among these recommendations were two related to the data presented in Table 6 (p. 25):
Research universities should limit provisional admissions to no more than 10 percent of the first‐time entering freshman class.
Four‐year comprehensive teaching colleges and universities should limit provisional admissions to no more than 15 percent of the first‐time entering freshman class.
As evident by reviewing the data presented in Table 6, in 2016, all institutions were in compliance with the recommendations. Trend data for provisional admissions for the last five years for the public senior institutions is provided below in Table 7:
Table 7
Provisional Freshmen as a Percent of Total First‐Time Freshmen S.C. Public Senior Institutions
Institution 2011 2012 2013 2014 2015 2016
Research Institutions
Clemson ‐ ‐ ‐ ‐ ‐ ‐
USC Columbia 16.0% 13.8% ‐ ‐ ‐ ‐
Comprehensive Teaching Colleges & Universities
The Citadel ‐ ‐ ‐ ‐ ‐ ‐
Coastal Carolina ‐ ‐ ‐ ‐ ‐ ‐
College of Charleston 12.1% 9.5% 10.1% 10.4% 6.8% 11.1%
Francis Marion 0.8% 0.1% 0.3% 0.1% ‐ 0.4%
Lander 4.5% 4.0% 3.5% 5.4% 4.1% 5.1%
S.C. State 2.4% 7.4% 7.1% 11.1% 13.0% 4.5%
USC Aiken 4.8% 6.5% ‐ ‐ ‐ ‐
USC Beaufort* 6.7% 3.4% 2.0% 2.5% 1.7% ‐
USC Upstate 9.0% 6.5% ‐ 5.9% 6.8% ‐
Winthrop 10.0% 12.0% 12.2% 9.1% 11.9% 12.0%
USC Two‐Year Regional Campuses
Average Percentage of All Campuses 64.5% 68.8% 0.1% ‐ 0.1% ‐
The data indicate that the percentage of provisional students admitted to the comprehensive sector continues to fluctuate at several institutions over the last five years. As of this report College of Charleston increased the percentage of provisional first‐time freshmen by 4.3 percent, and Winthrop remains at 12 percent as in 2015. South Carolina State University admitted a smaller number of provisional students in 2016, 4.5 percent, the second lowest percentage during the previous five years, and remains below the recommended 15 percent.
The University of South Carolina System consists of the Research 1 campus (USC Columbia), three comprehensive campuses that are separately funded and accredited (USC Aiken, USC Beaufort, and USC Upstate), as well as four two‐year regional campuses (USC Lancaster, USC Salkehatchie, USC Sumter, and USC Union). It is important to note that, prior to the implementation of the Banner enterprise system in fall 2013, when students applied to a regional campus, the application was compared to USC Columbia’s admission standards. If the student was eligible for admission to Columbia yet desired admission to a

Annual Report on Admission Standards for First Time Entering Freshmen, Fall 2016 Page 27
specific regional campus, the student was classified as “baccalaureate‐ready”, indicating they were a USC Columbia‐admissible student. Regional (two‐year) campus admitted students must earn a minimum 2.0 GPA and at least 30 hours in order to be able to change campuses to Columbia for most programs of study, some may have higher GPA and/or specific course requirements. USC reports that regional campuses do not provide remediation and the procedural change explains the large reduction in the number of first‐time entering freshmen classified as provisional students for the USC two‐year campuses over the past three years to non‐existence.
Annual Report on Admission Standards for First Time Entering Freshmen, Fall 2016 Page 28
Part V: Fall 2016 Minimum Admission Standards A component of Act 629 of 1988 requires the Commission to work with public institutions of higher learning in South Carolina to ensure minimal admission standards are maintained by each institution. The publication and dissemination of minimal admission standards was recommended by external consultants who argued that unless students have a clear sense of institutional expectations, they could not rise to meet the expectations. In 1988, each institution was required to specify annually the minimum required SAT score (combined math and verbal) for admission as freshmen. In 1993, the Commission approved the collection of additional data to include minimum ACT scores if submitted in lieu of SAT scores.
It is important to note minimum admission standards are approximate. Some institutions apply a predictive equation to determine admission. At such institutions, the minimum required scores will vary depending on the value and weight of the other elements in the admissions formula. For this reason, the minimum SAT and ACT scores reported by the institutions as required for admission are to be used as guideposts for students aspiring to admission to any given institution.
Institutions continue to adjust admission requirements for first‐time entering freshmen. Year after year, institutions report transitioning from the use of class rank to set the approximate minimum SAT/ACT score to the Grade Point Average (GPA) of the core high school college preparatory curriculum. In order to more accurately report the approximate minimum SAT/ACT score for institutions, the Commission requests information on which method institutions apply to set the minimum score and presents the results in this report. The required minimum SAT/ACT scores are, generally, lower for students with a higher GPA and high school class rank at most institutions. The data are separated into two tables indicating institutions that use class rank (Table 8, p. 29) and/or core GPA (Table 9, p. 30) to set the approximate minimum SAT/ACT score. Five institutions (Clemson, South Carolina State, USC Aiken, USC Beaufort, and USC Upstate) report the application of both methods, one less institution than in 2015 (CHE, 2018). USC Columbia, Coastal Carolina, Francis Marion, Lander, and Winthrop now report utilizing only the core GPA.

Annual Report on Admission Standards for First Time Entering Freshmen, Fall 2016 Page 29
Table 8 shows the approximate SAT and ACT score requirements reported by institution using class rank in Fall 2017. Four institutions (The Citadel, South Carolina State, USC Aiken, and USC Beaufort) require the same minimum SAT/ACT scores for students regardless of high school class rank. This is one more institution than in 2016.
Table 8
Admission Requirements Approximate Minimum SAT Score (Combined) and
Minimum ACT Score Requirements for First‐Time Entering Freshmen
2017
Institution
High School Class Rank and Minimum SAT/ACT Scored Predictive Equation1 Top 20% of Class Top 50% of Class Top 80% of Class
SAT ACT SAT ACT SAT ACT Yes No
Research Institutions
Clemson 1140 23 1400 30 1600 36 X
USC Columbia ‐ ‐ ‐ ‐ ‐ ‐ ‐ ‐
Comprehensive Teaching Colleges & Universities
The Citadel 950 20 950 20 950 20 X
Coastal Carolina ‐ ‐ ‐ ‐ ‐ ‐ ‐ ‐
College of Charleston2 ‐ ‐ ‐ ‐ ‐ ‐ ‐ ‐
Francis Marion ‐ ‐ ‐ ‐ ‐ ‐ ‐ ‐
Lander ‐ ‐ ‐ ‐ ‐ ‐ ‐ ‐
S.C. State 830 17 830 17 830 17 X
USC Aiken 800 17 800 17 ‐ ‐ X
USC Beaufort 880 17 880 17 880 17 X
USC Upstate 930 18 980 19 980 19 X
Winthrop ‐ ‐ ‐ ‐ ‐ ‐ X
Two‐Year Regional Campuses of USC
USC Lancaster ‐ ‐ ‐ ‐ ‐ ‐ ‐ ‐
USC Salkehatchie ‐ ‐ ‐ ‐ ‐ ‐ ‐ ‐
USC Sumter ‐ ‐ ‐ ‐ ‐ ‐ ‐ ‐
USC Union ‐ ‐ ‐ ‐ ‐ ‐ ‐ ‐ 1 Some institutions use predictive equations, a formula combining high school class rank, high school grade point ratio, and SAT or ACT score, to determine which students to admit. At these institutions, the minimum required score will vary depending on the value and weight of the other elements in the formula. 2 No test score minimums for public school students from pilot counties in top ten percent initiative program. Counties include Berkeley, Charleston, Clarendon, Colleton, Dorchester, Orangeburg, Williamsburg.
” – “ means not applicable.

Annual Report on Admission Standards for First Time Entering Freshmen, Fall 2016 Page 30
Table 9 shows the approximate SAT and ACT score requirements reported by institution using core GPA in Fall 2017. Three institutions (Francis Marion, Lander, and South Carolina State) required the same minimum SAT/ACT scores for student regardless of GPA.
Table 9 Admission Requirements Approximate Minimum SAT Score (Combined) and
Minimum ACT Score Requirements for First‐Time Entering Freshmen 2017
High School Core GPA and Minimum SAT/ACT score
Predictive Equation1
Core GPA Core GPA Core GPA 2.0 3.0 4.0
Institution SAT ACT SAT ACT SAT ACT Yes No
Research Institutions
Clemson 1600 36 1360 29 1110 22 X
USC Columbia 1310 28 1020 20 850 15 X
Comprehensive Teaching Colleges & Universities
The Citadel ‐ ‐ ‐ ‐ ‐ ‐ ‐ ‐
Coastal Carolina 1040 20 980 19 940 18 X
College of Charleston ‐ ‐ ‐ ‐ 1100 22 X
Francis Marion2 * * 880 17 880 17 X
Lander ‐ ‐ 820 17 820 17 X
S.C. State 830 17 830 17 830 17 X
USC Aiken 920 19 800 17 ‐ ‐ X
USC Beaufort 880 17 880 17 980 17 X
USC Upstate 980 19 930 18 880 17 X
Winthrop University ‐ ‐ 900 19 850 18 X
USC Two‐Year Regional Campuses
USC Lancaster 1310 28 950 20 700 15 X
USC Salkehatchie 1310 28 950 20 700 15 X
USC Sumter 1310 28 950 20 700 15 X
USC Union 1310 28 950 20 700 15 X 1 Some institutions use predictive equations, a formula combining high school class rank, high school grade point ratio, and SAT or ACT score, to determine which students to admit. At these institutions, the minimum required score will vary depending on the value and weight of the other elements in the formula. 2 At Francis Marion, a new freshman applicant who has a high school GPA of 2.3 or below may be presented to the Admissions, Advising, and Retention Committee for possible admittance if they have an SAT score of at least 1000 or an ACT score of at least 22.
” – “ means not applicable.
“ * “ means a new freshman applicant who has a high school GPA 2.3 or below may be presented to the Admissions, Advising, and Retention Committee for possible admittance if they have an SAT of at least 1080 or an ACT of at least 22.
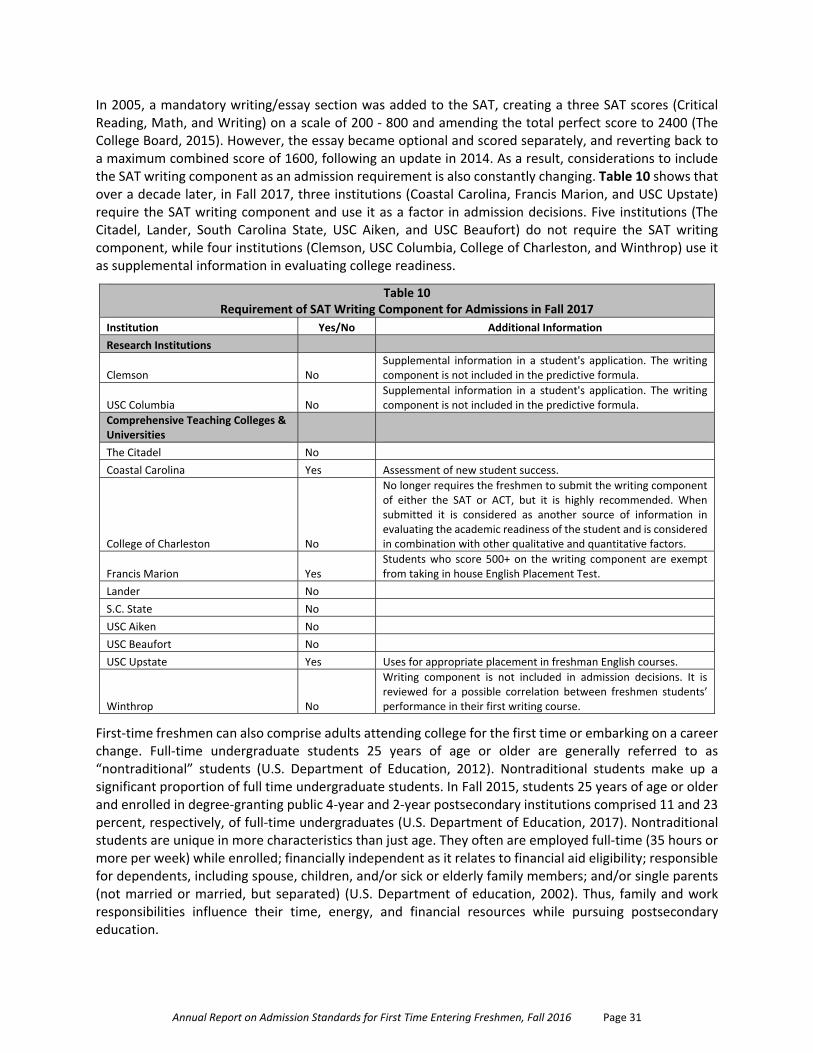
Annual Report on Admission Standards for First Time Entering Freshmen, Fall 2016 Page 31
In 2005, a mandatory writing/essay section was added to the SAT, creating a three SAT scores (Critical Reading, Math, and Writing) on a scale of 200 ‐ 800 and amending the total perfect score to 2400 (The College Board, 2015). However, the essay became optional and scored separately, and reverting back to a maximum combined score of 1600, following an update in 2014. As a result, considerations to include the SAT writing component as an admission requirement is also constantly changing. Table 10 shows that over a decade later, in Fall 2017, three institutions (Coastal Carolina, Francis Marion, and USC Upstate) require the SAT writing component and use it as a factor in admission decisions. Five institutions (The Citadel, Lander, South Carolina State, USC Aiken, and USC Beaufort) do not require the SAT writing component, while four institutions (Clemson, USC Columbia, College of Charleston, and Winthrop) use it as supplemental information in evaluating college readiness.
Table 10 Requirement of SAT Writing Component for Admissions in Fall 2017
Institution Yes/No Additional Information
Research Institutions
Clemson No Supplemental information in a student's application. The writing component is not included in the predictive formula.
USC Columbia No Supplemental information in a student's application. The writing component is not included in the predictive formula.
Comprehensive Teaching Colleges & Universities
The Citadel No
Coastal Carolina Yes Assessment of new student success.
College of Charleston No
No longer requires the freshmen to submit the writing component of either the SAT or ACT, but it is highly recommended. When submitted it is considered as another source of information in evaluating the academic readiness of the student and is considered in combination with other qualitative and quantitative factors.
Francis Marion Yes Students who score 500+ on the writing component are exempt from taking in house English Placement Test.
Lander No
S.C. State No
USC Aiken No
USC Beaufort No
USC Upstate Yes Uses for appropriate placement in freshman English courses.
Winthrop No
Writing component is not included in admission decisions. It is reviewed for a possible correlation between freshmen students’ performance in their first writing course.
First‐time freshmen can also comprise adults attending college for the first time or embarking on a career change. Full‐time undergraduate students 25 years of age or older are generally referred to as “nontraditional” students (U.S. Department of Education, 2012). Nontraditional students make up a significant proportion of full time undergraduate students. In Fall 2015, students 25 years of age or older and enrolled in degree‐granting public 4‐year and 2‐year postsecondary institutions comprised 11 and 23 percent, respectively, of full‐time undergraduates (U.S. Department of Education, 2017). Nontraditional students are unique in more characteristics than just age. They often are employed full‐time (35 hours or more per week) while enrolled; financially independent as it relates to financial aid eligibility; responsible for dependents, including spouse, children, and/or sick or elderly family members; and/or single parents (not married or married, but separated) (U.S. Department of education, 2002). Thus, family and work responsibilities influence their time, energy, and financial resources while pursuing postsecondary education.
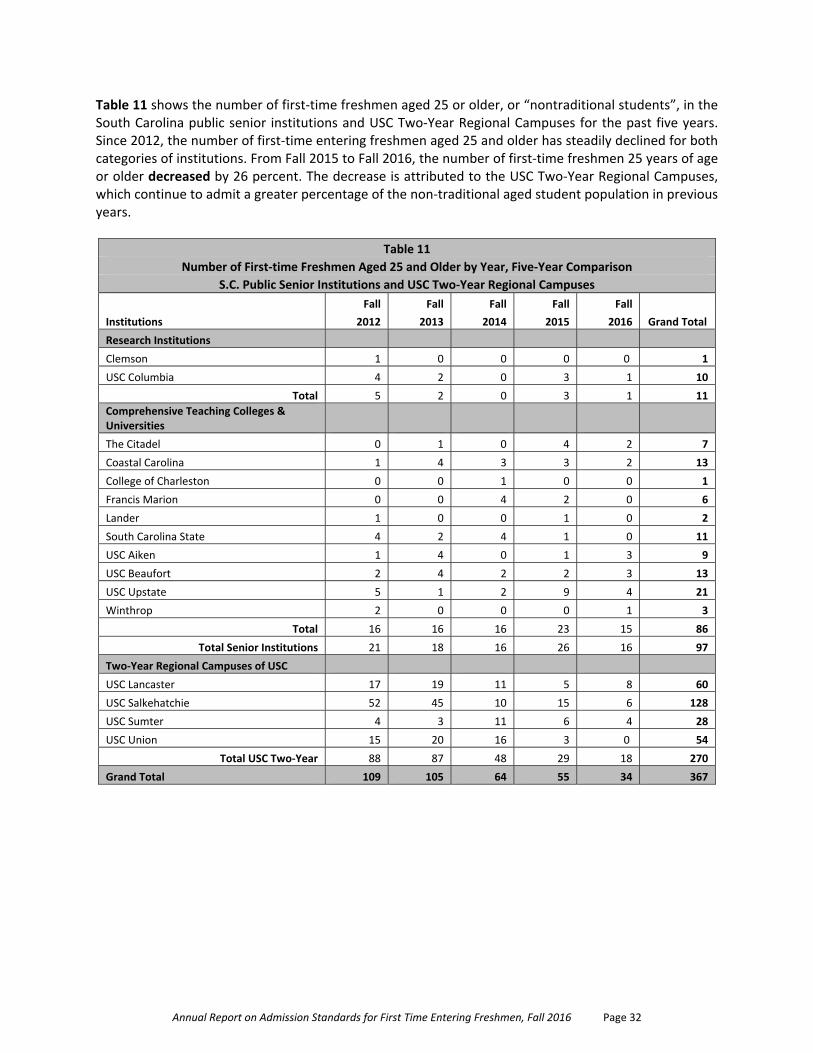
Annual Report on Admission Standards for First Time Entering Freshmen, Fall 2016 Page 32
Table 11 shows the number of first‐time freshmen aged 25 or older, or “nontraditional students”, in the South Carolina public senior institutions and USC Two‐Year Regional Campuses for the past five years. Since 2012, the number of first‐time entering freshmen aged 25 and older has steadily declined for both categories of institutions. From Fall 2015 to Fall 2016, the number of first‐time freshmen 25 years of age or older decreased by 26 percent. The decrease is attributed to the USC Two‐Year Regional Campuses, which continue to admit a greater percentage of the non‐traditional aged student population in previous years.
Table 11
Number of First‐time Freshmen Aged 25 and Older by Year, Five‐Year Comparison
S.C. Public Senior Institutions and USC Two‐Year Regional Campuses
Fall Fall Fall Fall Fall
Grand Total Institutions 2012 2013 2014 2015 2016
Research Institutions
Clemson 1 0 0 0 0 1
USC Columbia 4 2 0 3 1 10
Total 5 2 0 3 1 11
Comprehensive Teaching Colleges & Universities
The Citadel 0 1 0 4 2 7
Coastal Carolina 1 4 3 3 2 13
College of Charleston 0 0 1 0 0 1
Francis Marion 0 0 4 2 0 6
Lander 1 0 0 1 0 2
South Carolina State 4 2 4 1 0 11
USC Aiken 1 4 0 1 3 9
USC Beaufort 2 4 2 2 3 13
USC Upstate 5 1 2 9 4 21
Winthrop 2 0 0 0 1 3
Total 16 16 16 23 15 86
Total Senior Institutions 21 18 16 26 16 97
Two‐Year Regional Campuses of USC
USC Lancaster 17 19 11 5 8 60
USC Salkehatchie 52 45 10 15 6 128
USC Sumter 4 3 11 6 4 28
USC Union 15 20 16 3 0 54
Total USC Two‐Year 88 87 48 29 18 270
Grand Total 109 105 64 55 34 367
Annual Report on Admission Standards for First Time Entering Freshmen, Fall 2016 Page 33
Conclusion The attached Annual Report on Admission Standards for First‐Time Entering Freshman, Fall 2016 provides findings from data reported by the 12 South Carolina public senior colleges and universities regarding admission standards. In Fall 2015, the public senior institutions admitting freshmen in South Carolina received 102,267 applications from individuals, both in‐state and out‐of‐state, seeking admission as first‐time freshmen. Of the first‐time freshmen applicants 64.1 percent (65,588) were offered admission, and 29.0 percent (19,035) of applicants offered admission accepted and enrolled. This is a one percent decrease among the public senior institutions for both applicants offered admission, and those accepted and enrolled compared to Fall 2015. The number and percentage of applicable first‐time freshmen meeting all of the college preparatory course prerequisites decreased, after increasing for three consecutive years. In Fall 2016, 88.7 percent of first‐time freshmen met all the prerequisites compared to 91.2 percent in 2015, 85.4 percent in 2014, and 83.3 percent in 2013. Data indicates that among the public senior institutions, the percentage of freshmen meeting high school course prerequisites slightly decreased from Fall 2015 to Fall 2016. Eleven of the 12 institutions (approximately 91.6 percent) demonstrate decreases in freshmen meeting high school course prerequisites, while one institution (South Carolina State University) indicates an increase in freshmen meeting high school course prerequisites. Retention rates among students who did not meet the high school course prerequisites are lower for half of the public senior institutions. Six institutions indicate an increase in freshmen‐to‐sophomore retention rates for students who did not meet the high school course prerequisites, while the other six institutions demonstrate a decrease in retention rates for the same category of students.
The majority of students attending South Carolina public senior institutions report taking the ACT (10,841 students) rather than the SAT (7,736 students) as a college entrance examination. Between 2015 and 2016, eight public senior institutions (USC Columbia, Coastal Carolina, Lander, South Carolina State, USC Aiken, USC Beaufort, USC Upstate, and Winthrop) indicate an increase in the average combined SAT/ACT mean between 2015 and 2016. Four institutions (USC Columbia, The Citadel, College of Charleston, and Francis Marion) demonstrate a decrease. An institution may offer two types of admission to a degree‐seeking student, regular or provisional. The classification is based on whether or not the applicant meets the institution’s minimum admission criteria. Among the public senior institutions, only 41.6 percent indicated admitting “provisional” students, yet all have first‐time freshmen not meeting the college preparatory course prerequisites. The institutions reporting provisional students, again, were all comprehensive teaching colleges and universities in South Carolina. Winthrop admitted the largest percentage of provisional freshmen (12.0 percent), followed by College of Charleston with a percentage of 11.1. Although, the data indicate that the percentage of provisional students admitted to the comprehensive sector continues to fluctuate at several institutions, the levels remain below the 15 percent threshold CHE formally recommended. Institutions continue to adjust admission requirements for first‐time entering freshmen. The required minimum SAT/ACT scores are, generally, lower for students with a higher GPA and high school class rank at most institutions. The minimum admission standards of the public senior institutions in South Carolina for Fall 2017 incorporate the use of both GPA and high school class rank. Five institutions (Clemson, South Carolina State, USC Aiken, USC Beaufort, and USC Upstate) report intent to apply both methods. Four institutions (The Citadel, South Carolina State, USC Aiken, and USC Beaufort) require the same minimum SAT/ACT scores for students regardless of high school class rank, and three institutions required the same minimum SAT/ACT scores for student regardless of GPA (Francis Marion, Lander, and South Carolina

Annual Report on Admission Standards for First Time Entering Freshmen, Fall 2016 Page 34
State). In addition to SAT/ACT scores, class rank, and GPA, considerations to include the SAT writing component as an admission requirement are constantly changing. In Fall 2017, three institutions (Coastal Carolina, Francis Marion, and USC Upstate) continue to require the SAT writing component and use it as a factor in admission decisions. Five institutions (The Citadel, Lander, South Carolina State, USC Aiken, and USC Beaufort) do not require the SAT writing component, while four institutions (Clemson, USC Columbia, College of Charleston, and Winthrop) use it as supplemental information in evaluating college readiness. Future Opportunities The 2016 Annual Report on Admission Standards reveals nontraditional students remain an untapped market for public postsecondary education. With the burgeoning South Carolina economy facilitated by an influx of jobs with the addition of new companies across various sectors, workforce development has renewed focus and has become a statewide priority. However, many business and industry representatives indicate the emerging and existing workforce is not prepared or equipped with the necessary skills for initial employment and advancement. Institutions of higher learning are presented with an opportunity to align recruitment strategies, training, programs, and degrees to the labor market, staying attuned and responsive to workforce needs. In addition to the inclusion of additional demographic data, future iterations of the Annual Report on Admission Standards may include an in‐depth examination of trend data of the various subject areas highlighted in the report and definitions for provisional admission are also opportunities for development. Trend analysis allows for the assessment of patterns and changes over time, especially in student retention and persistence. The retention of all admitted students continues to be a topic that deserves more exploration. Data‐driven decision making, if successful, generates collaborative opportunities that can translate research and theory into best practice. This report can serve to inform our institutions and all stakeholders about gaps in our educational landscape and the support needed for all postsecondary students, but especially the underserved students, and can ignite further research. Commission staff intend to explore other issues related to admission standards in higher education, and ultimately increase student access and success, while enhancing institutional effectiveness.

Annual Report on Admission Standards for First Time Entering Freshmen, Fall 2016 Page 35
References: South Carolina Commission on Higher Education. (2006). College preparatory course prerequisite requirements, Effective date: Academic Year 2011‐2012 entering college freshmen. Retrieved from http://www.che.sc.gov/che_docs/academicaffairs/collegeprepcourse_prereqs101106.pdf South Carolina Commission on Higher Education. (2012). Annual report on admission standards for first‐time entering freshmen, FY 2011‐12. Retrieved from http://www.che.sc.gov/CHE_Docs/new_web/rep&pubs/annual_rpt_on_admissions_standards_for_first‐time.pdf South Carolina Commission on Higher Education. (2014). Annual report on admission standards for first‐time entering freshmen, FY 2013‐14. Retrieved from http://www.che.sc.gov/CHE_Docs/publications/AnnualReports/Admissions_Standards_for_First‐Time_Entering_Freshmen_%20FY2013‐14.pdf South Carolina Commission on Higher Education. (2015). College preparatory course prerequisite requirements for entering college freshmen beginning in Academic Year 2019‐20. Retrieved from http://www.che.sc.gov/CHE_Docs/academicaffairs/College_Preparatory_Course_Prerequisite_Requirements_Fall_2019.pdf South Carolina Commission on Higher Education. (2017). Annual report on admission standards for first‐time entering freshmen, Fall 2014. Retrieved from http://www.che.sc.gov/CHE_Docs/publications/AnnualReports/2014AdmissionsStandardsRpt_CHE_FINAL.pdf South Carolina Commission on Higher Education. (2018). Annual report on admission standards for first‐time entering freshmen, Fall 2015. Retrieved from http://www.che.sc.gov/CHE_Docs/publications/AnnualReports/2015AdmissionsStandardsRpt_CHE_FINAL.pdf Simpson, O. (2005). The costs and benefits of student retention for students, institutions and governments. Studies in Learning, Evaluation Innovation and Development, 2(3). Retrieved from http://oro.open.ac.uk/6761/1/SLEID_costs_and_benefits.pdf. The College Board. (n.d.). Admission decisions: What counts. Retrieved from https://professionals.collegeboard.org/guidance/applications/decisions. The College Board. (2015a). Total group profile report: 2015 college‐bound seniors. Retrieved from https://secure‐media.collegeboard.org/digitalServices/pdf/sat/total‐group‐2015.pdf The College Board. (2015b). Comparing SAT and ACT scores. Retrieved from https://secure‐media.collegeboard.org/digitalServices/pdf/sat/cSAT‐concordance‐flyer.pdf The College Board. (2015c). Test specifications for the redesigned SAT. Retrieved from https://collegereadiness.collegeboard.org/pdf/test‐specifications‐redesigned‐sat‐1.pdf

Annual Report on Admission Standards for First Time Entering Freshmen, Fall 2016 Page 36
The College Board. (2015d). Total group profile report: 2015 college‐bound seniors, South Carolina. Retrieved from https://secure‐media.collegeboard.org/digitalServices/pdf/sat/SC_15_03_03_01.pdf The College Board. (2016a). Total group profile report: 2016 college‐bound seniors. Retrieved from
https://reports.collegeboard.org/pdf/total-group-2016.pdf The College Board. (2016b). Total group profile report: 2016 college‐bound seniors, South Carolina. https://reports.collegeboard.org/pdf/sc16030301.pdf The National Center for Higher Education Management Systems. (2015). Retention rates ‐ First‐time college freshmen returning their second year. Retrieved from http://www.higheredinfo.org/dbrowser/index.php?measure=92 U.S. Department of Education, NCES. (2002). The condition of education 2002 (NCES 2002–025). Retrieved from https://nces.ed.gov/pubs2002/2002012.pdf U.S. Department of Education, NCES. (2017). The condition of education 2017 (NCES 2017–144). Retrieved from https://nces.ed.gov/pubs2017/2017144.pdf