2016 4e commentary - abn newswiremedia.abnnewswire.net/media/en/docs/asx-ypb-2a1001566.pdf · 2016...
TRANSCRIPT

Lvl 29, 66 Goulburn St
SYDNEY NSW 2000
[email protected] ypbsystems.com
brandreporter.com
2016 4E Commentary
2016 loss increased due to investment in accelerated commercial roll out of technologies
Costs to fall by 40% by mid-2017
Revenues to exceed costs (breakeven) by end June 2017
Pre-tax profit of $5m for 2017 confirmed
Key 2016 developments
2016 was a year of increased investment in business building for YPB. Operating expenses
increased as the multi-national, commercial roll-out of our technologies accelerated over the year.
As planned, costs grew ahead of revenues and the operating loss increased. As previously
foreshadowed, this investment in operations is expected to bear fruit in 2017 as revenue growth is
anticipated to accelerate through the year and revenue is expected to exceed costs for the first
time by end June 2017. A $5m pre-tax profit remains our expectation for 2017.
There were three primary accomplishments in 2016:
1. Assembly of a top-rate management team. YPB was successful in attracting management
of a calibre well beyond that of most young companies with key executive and sales rolls
filled.
2. Confirmation of product interest. The expanded sales capability saw much increased client
interaction over multiple geographies which pleasingly confirmed that brand owners
recognise the urgent need to protect against fakes and eagerly want to directly engage
with their customers. Interest in our technologies is high and there are few, if any,
competitive offers presently being considered by our potential clients.
3. Development of substantial new business pipeline. The combination of expanded sales
effort and strong customer interest resulted in a substantial pipeline of potential new
business with a total value of $110m (of possible annual revenue) as at end 2016. The
pipeline grew more than five-fold over 2016. High quality distribution partners and
prominent clients were engaged and signed. A portion of this pipeline converting to
revenue will be the key driver of financial success in 2017.
In May 2016, YPB issued two key financial milestones: achieving run-rate break-even by end March
2017 and a pre-tax profit of $5m for 2017. On 2 February 2017, a 3 month slippage in the break-
even expectation from end March to end June 2017 was announced due to slower contract
closures but the profit expectation of $5m pre-tax for 2017 was confirmed.
ASX/MEDIA ANNOUNCEMENT
ASX: YPB | 28th February 2017
Lvl 29, 66 Goulburn St
SYDNEY NSW 2000
[email protected] ypbsystems.com
brandreporter.com
On the same date, a 40% reduction in non-COGS costs by May 2017 was announced due to a
refined geographic focus and the opportunity to move from direct sales to partnering. The key new
partnership, which was expected by end February 2017 but which now should conclude in coming
weeks, will allow a significant reduction in costs and likely see more rapid market penetration due
to the credibility and distribution network of the partner.
The cost reductions being presently implemented will not benefit all of 2017 and total non-COGS
costs for 2017 are likely to be 30% below 2016 costs. On an annual run-rate basis costs will reduce
by 40% by mid-2017.
A key advantage of our multiplier partnership distribution model is that revenue can grow rapidly
while risk is minimised with fixed costs and capital commitments being kept low. Profit leverage to
revenue should be high as cost growth is likely to lag revenue growth.
While many young technology companies are prepared to lose money indefinitely in “land grab”
strategies, the Board and Management of YPB are intent on building a sustainable, highly profitable
business while still growing as rapidly as possible. We aim to minimise risk while maximising
shareholder wealth.
Brief financial review
As noted above, costs increased in 2016 due primarily to increased staff numbers and several
senior management hires. Expenses related to a greater sales effort, such as travel, also increased.
Production costs grew as more product was shipped, particularly in the new retail anti-theft
product lines.
The reported pre-tax operating loss, excluding impairments, increased from $6.762m to $12.113m.
Revenue grew 74% to $2.982m. Costs, excluding impairments and share-based payments, rose
78% from $8.194m to $14.551m. There were a number of costs associated with setting up
international partnerships in 2016 that will not recur in 2017, which meant the full year 2016 cost
base is exaggerated relative to the true operating cost base.
The true operating cost base as at end 2016 was approximately $11.1m. For the full year 2017,
operating costs are expected to be $7.7m. By mid-2017, costs are expected to fall by 40% to $6.5m
on an annual run-rate basis. COGS will be additional to this figure but will incur a sound positive
margin and so although COGS will add to cost on a gross basis they will directly add profit on a net
basis.
The cash operating picture was better than the profit report. Cash operating loss was up 65% from
$5.767m to $9.493m. Cash receipts from customers of $3.262m was up 294% from $0.828m. Cash
receipts exceeded reported revenue by $0.280m. Cash expenses increased from $6.595m to
$12.755m.

Lvl 29, 66 Goulburn St
SYDNEY NSW 2000
[email protected] ypbsystems.com
brandreporter.com
Two non-cash impairment charges were taken through the profit and loss account. As a
conservative measure, all goodwill of $3.089m was written off. A further impairment charge of
$0.178m on intangible customer relationships was taken as a result of moving from a direct to a
partnership distribution model in one specific geography.
A mark-to-market charge on the cash receivable from Lanstead of $1.060m arose due to the YPB
share price being below the reference price specified in the Lanstead Equity Sharing Agreement.
The company was successful in raising capital in 2016. In May $4.5m was raised at $0.24 per share
and in October 2016 $4.0m was raised at $0.25 per share.
A more expansive review of operations and results will be included in the forthcoming annual
report.
For further information, please contact;
Mr. John Houston Mr. Gerard Eakin
Executive Chairman Director
YPB Group Limited YPB Group Limited
T: +61 458 701 088 T: +61 427 011 596
E: [email protected] E: [email protected]
MEDIA AND INVESTOR ENQUIRIES
Matthew Wright
NWR Communications
+61 451 896 420
ABOUT YPB
YPB Group (ASX: YPB) is a pioneer in advanced brand protection solutions. Listed on the Australian Securities
Exchange, YPB is expanding its global footprint with an established presence in Australia, China, Thailand,
USA, Mexico and India.
YPB’s patented Anti-Counterfeit technology combined with its Security Packaging and Anti-Theft solutions,
Consulting Services and YPB’s proprietary CONNECT platform enables clients to PROTECT their high value
brands from the risks of counterfeit, product diversion and theft while providing the tools to CONNECT
directly with their customers.
PROTECT
Smart Security Packaging and labeling for Brands
YPB offers a wide range of Smart Security Packaging and Labeling solutions that can be incorporated into
almost any material and offer cost effective strategies to PROTECT the integrity and value of products and
brands in high-risk markets.

Lvl 29, 66 Goulburn St
SYDNEY NSW 2000
[email protected] ypbsystems.com
brandreporter.com
Government Vital Documents
YPB offers solutions to Governments to PROTECT their Vital Documents that include ID cards, Visas,
Passports, Vehicle Labels and many other applications.
Retail Anti-theft
YPB offers clients the latest technology in Retail Anti-Theft and Labeling solutions effective for mainstream
retailers, boutiques and exporters to PROTECT against theft.
IP solutions & forensic services
YPB’s IP solution specialists work with quality brands and Governments, to develop bespoke brand protection
strategies and solutions that will deliver real protection and safety for brands, products and consumers.
Secure Supply Chain
YPB offers secure supply chain solutions to Governments, banks and companies wanting to ensure the
integrity of their supply chain using a combination of YPB’s authentication technology and secure track and
trace solutions, delivering real protection for high value documents, brands, products and consumers.
DETECT
Scanner and Tracer protection solutions
YPB’s patent protected state-of-the art Tracer technology is invisible, cannot be copied or destroyed.
Brand owners who include YPB’s tracers in their packaging can use YPB’s scanners to verify their product’s
authenticity. If a counterfeit is detected YPB’s forensic services can consult with a brand owner to develop
strategic, tailored solutions to protect the brand against counterfeiting and product diversion.
CONNECT
Smartphone applications to Detect and Connect
YPB’s sophisticated, user friendly and powerful smartphone applications allow brand owners and consumers
to identify and report suspected counterfeit or diverted products. They also allow brands to connect and
engage directly with their customers via QR codes, Near Field Communication, secure track and trace and
product scanning. The YPB CONNECT platform delivers brand owners valuable and actionable intelligence
about their products and customers to measure, tailor and individualise direct marketing campaigns through
a ‘big data’ analytics capability.

YPB Group Ltd Appendix 4E Preliminary final report
1. Results for announcement to the market $'000 Revenues from ordinary activities up 74.0% to 2,982 Loss from ordinary activities after tax attributable to the owners of YPB Group Ltd
up
143.1%
to
(16,441)
Loss for the year attributable to the owners of YPB Group Ltd up 143.1% to (16,441) Dividends There were no dividends paid, recommended or declared during the current financial period. Comments The loss for the Group after providing for income tax amounted to $16,441,000 (31 December 2015: $6,762,000).
2. Net tangible assets
Reporting
period Previous
period Cents Cents Total assets per ordinary security 8.83 15.12
Net tangible assets per ordinary security 0.67 2.97
3. Control gained over entities Not applicable.
4. Loss of control over entities Not applicable.
5. Dividends Current period There were no dividends paid, recommended or declared during the current financial period. Previous period There were no dividends paid, recommended or declared during the previous financial period.
6. Dividend reinvestment plans Not applicable.

YPB Group Ltd Appendix 4E Preliminary final report
7. Details of associates and joint venture entities Not applicable.
8. Foreign entities Details of origin of accounting standards used in compiling the report: Not applicable.
9. Audit qualification or review The financial statements are in the process of being audited.
10. Signed Signed ___________________________ Date: 28 February 2017

YPB Group Ltd Statement of profit or loss and other comprehensive income For the year ended 31 December 2016
Consolidated
Note 31 December
2016 31 December
2015 $'000 $'000
The above statement of profit or loss and other comprehensive income should be read in conjunction with the accompanying notes
3
Revenue 2 2,982 1,714 Expenses Production costs (1,823) (221) Consulting fees (1,068) (1,377) Depreciation and amortisation expense (970) (902) Directors' fees (171) (197) Employee benefits expense (5,126) (1,039) Finance costs (198) (197) Rental expenses (409) (304) Research and development (1,570) (1,380) Marketing (561) (183) Traveling expense (1,253) (645) Options expense (202) - Share-based payments (515) (282) Commissions expense - (797) Regulatory expenses (234) (250) Professional fees (316) (142) Other expenses (851) (560) Impairment expense (3,267) - Diminution in fair value of financial assets (1,060) -
Loss before income tax benefit 3 (16,612) (6,762) Income tax benefit 171 -
Loss after income tax benefit for the year attributable to the owners of YPB Group Ltd
(16,441)
(6,762)
Other comprehensive income Items that may be reclassified subsequently to profit or loss Exchange differences on translation of foreign operations (225) 731
Other comprehensive income for the year, net of tax (225) 731
Total comprehensive loss for the year attributable to the owners of YPB Group Ltd
(16,666)
(6,031)
Cents Cents Basic earnings per share 17 (8.76) (5.44)

YPB Group Ltd Statement of financial position As at 31 December 2016
Consolidated
Note 31 December
2016 31 December
2015 $'000 $'000
The above statement of financial position should be read in conjunction with the accompanying notes 4
Assets Current assets Cash and cash equivalents 4 2,715 2,877 Trade and other receivables 5 729 1,221 Inventories 6 348 179 Financial assets 7 2,250 3,347 Total current assets 6,042 7,624
Non-current assets Plant and equipment 8 588 313 Intangibles 9 12,081 16,176 Financial assets 7 - 1,653
Total non-current assets 12,669 18,142 Total assets 18,711 25,766
Liabilities Current liabilities Trade and other payables 10 2,177 1,418
Total current liabilities 2,177 1,418
Non-current liabilities Borrowings 11 3,024 3,104 Other liabilities 1 -
Total non-current liabilities 3,025 3,104 Total liabilities 5,202 4,522
Net assets 13,509 21,244
Equity Issued capital 12 40,437 33,606 Reserves 13 4,931 3,056 Accumulated losses (31,859) (15,418)
Total equity 13,509 21,244

YPB Group Ltd Statement of changes in equity For the year ended 31 December 2016
The above statement of changes in equity should be read in conjunction with the accompanying notes 5
Total equity
Issued capital
Issued options
Foreign currency
translation Reserve
Accumulated losses
Share based
payment reserve
Consolidated $'000 $'000 $'000 $'000 $'000 $'000 Balance at 1 January 2015 17,449 - 1,835 (8,656) 97 10,725 Loss after income tax expense for the year
-
-
-
(6,762)
-
(6,762)
Other comprehensive income for the year, net of tax
-
-
731
-
-
731
Total comprehensive profit/(loss) for the year
-
-
731
(6,762)
-
(6,031)
Transactions with owners in their capacity as owners:
Shares issued, net of transaction costs
16,144
-
-
-
-
16,144
Options exercised during the year
13
-
-
-
-
13
Options issued during the year - 393 - - - 393 Balance at 31 December 2015 33,606 393 2,566 (15,418) 97 21,244
Total equity
Issued capital
Issued options
Foreign currency
translation reserve
Accumulated losses
Share based
payment reserve
Consolidated $'000 $'000 $'000 $'000 $'000 $'000 Balance at 1 January 2016 33,606 393 2,566 (15,418) 97 21,244 Loss after income tax benefit for the year
-
-
-
(16,441)
-
(16,441)
Other comprehensive loss for the year, net of tax
-
-
(225)
-
-
(225)
Total comprehensive loss for the year
-
-
(225)
(16,441)
-
(16,666)
Transactions with owners in their capacity as owners:
Shares issued, net of transaction costs
6,569
-
-
-
-
6,569
Options exercised during the year
2
-
-
-
-
2
Shares granted from consulting agreement
260
-
-
-
-
260
Options granted during the year - 1,182 - - - 1,182 Share based payments - - - - 918 918
Balance at 31 December 2016 40,437 1,575 2,341 (31,859) 1,015 13,509

YPB Group Ltd Statement of cash flows For the year ended 31 December 2016
Consolidated
Note 31 December
2016 31 December
2015 $'000 $'000
The above statement of cash flows should be read in conjunction with the accompanying notes 6
Cash flows from operating activities Receipts from customers 3,262 828 Payments to suppliers and employees (12,755) (6,595) Interest received 37 77 Finance costs (198) (1)
Net cash used in operating activities 16 (9,654) (5,691)
Cash flows from investing activities Payments for property, plant and equipment (353) (299) Payments for acquisitions of subsidiaries (net of cash acquired) 14 - (423) Proceeds from disposal of intangibles - (39)
Net cash used in investing activities (353) (761)
Cash flows from financing activities Proceeds from issue of shares (net of costs) 7,334 6,752 Proceeds from issue of options 880 393 Repayment of loan from related party (8) (197) Proceeds from loans provided by related parties - (24) Settlement of deferred share consideration 1,690 - Repayment of borrowings (51) -
Net cash from financing activities 9,845 6,924
Net (decrease)/increase in cash and cash equivalents (162) 472 Cash and cash equivalents at the beginning of the financial year 2,877 2,405
Cash and cash equivalents at the end of the financial year 4 2,715 2,877

YPB Group Ltd Notes to the financial statements 31 December 2016
7
Note 1. Operating segments Identification of reportable operating segments
The Consolidated Entity is organised into operating segments as outlined below: Management determines operating segments based on the internal reports that are reviewed and used by the Board of Directors (who are identified as the Chief Operating Decision Makers ('CODM')) in assessing performance and in determining the allocation of resources. The CODM reviews EBITDA (earnings before interest, tax, depreciation and amortisation). The accounting policies adopted for internal reporting to the CODM are consistent with those adopted in the consolidated financial statements. Types of products and services
For the year ended 31 December 2016, management considers the company to offer its client base a complete end-to-end service and product offering, hence considering its main operations to be represent by one business segment apart from a specialised counterfeit printing operation. The bundled “complete solution offering” encompasses a range of products and services which are available to customers, including:
Covert forensic products which are invisible particles (‘tracers’) fused into a product or packaging during or after the manufacturing process, and are detectable using YPB’s proprietary scanner.
Forensic laboratory services for the examination of counterfeit products.
Security consulting services provided to governments, corporations and intellectual property owners for the deterrence of counterfeiting, grey markets, product diversions and fraud.
The specialised printing operation provides its customers with a dedicated product range, including:
Anti-counterfeiting solutions to brands and resellers in the areas of packaging and labelling. Print Other Solutions segments Total Consolidated - 31 December 2016 $'000 $'000 $'000 Revenue Sales to external customers 662 2,283 2,945 Interest revenue - 37 37 Total revenue 662 2,320 2,982
EBITDA (564) (11,613) (12,177) Depreciation and amortisation (13) (957) (970) Impairment of assets (117) (3,150) (3,267) Finance costs - (198) (198) Loss before income tax benefit (694) (15,918) (16,612)
Income tax benefit 171 Loss after income tax benefit (16,441)
Assets Segment assets 140 18,571 18,711 Total assets 18,711 Liabilities Segment liabilities 177 5,025 5,202 Total liabilities 5,202

YPB Group Ltd Notes to the financial statements 31 December 2016
8
Print Other Solutions segments Total Consolidated - 31 December 2015 $'000 $'000 $'000 Revenue Sales to external customers 744 893 1,637 Interest revenue 3 74 77 Total revenue 747 967 1,714
EBITDA 310 (6,170) (5,860) Depreciation and amortisation - (902) (902) Profit/(loss) before income tax expense 310 (7,072) (6,762)
Income tax expense - Loss after income tax expense (6,762) Assets Segment assets 491 25,275 25,766 Total assets 25,766
Liabilities Segment liabilities 370 4,152 4,522 Total liabilities 4,522 Geographical information Sales to external customers Geographical assets
31 December
2016 31 December
2015 31 December
2016 31 December
2015 $'000 $'000 $'000 $'000 Australia 1,271 74 6,220 10,883 Peoples Republic of China and HK 299 379 11,162 13,658 Thailand 331 489 773 700 United States of America 1,083 772 557 525
2,984 1,714 18,711 25,766

YPB Group Ltd Notes to the financial statements 31 December 2016
9
Note 2. Revenue
Consolidated
31 December
2016 31 December
2015 $'000 $'000 Revenue Sale of goods 2,945 1,637
Other revenue Interest 37 77
Revenue 2,982 1,714
Note 3. Loss for the period The loss for the period includes the following expenses:
Consolidated
31 December
2016 31 December
2015 $'000 $'000 Finance costs 198 197 Research and development costs 1,570 1,380 Depreciation and amortisation 970 902 Impairment of goodwill & customer relationships 3,267 - Rental expense on operating leases - minimum lease payments 409 304 Diminution in fair value of financial assets 1,060 -
7,474 2,783
Note 4. Current assets - cash and cash equivalents Consolidated
31 December
2016 31 December
2015 $'000 $'000 Cash on hand 4 10 Cash at bank 2,711 2,867
2,715 2,877

YPB Group Ltd Notes to the financial statements 31 December 2016
10
Note 5. Current assets - trade and other receivables Consolidated
31 December
2016 31 December
2015 $'000 $'000 Trade receivables 348 891 Sundry receivables 381 330
729 1,221
Note 6. Current assets - inventories Consolidated
31 December
2016 31 December
2015 $'000 $'000 Finished goods - at cost 348 179
Note 7. Financial assets Consolidated
31 December
2016 31 December
2015 $'000 $'000 Current Receivable from Lanstead 2,250 3,347
Non-current Receivable from Lanstead - 1,653
2,250 5,000
The fair value of the Lanstead receivable as at 31 December 2016 has been estimated as follows:
Share
price Number of
shares Fair
value
$ Outstanding
$’000
$ Value recognised on inception 0.26 19,231 5,000 Consideration received up to 31 December 2016 (10,150) (1,690) Gain/(loss) on diminution in fair value of the Lanstead receivable - (1,060)
Value of the Lanstead receivable at 31 December 2016 9,081 2,250

YPB Group Ltd Notes to the financial statements 31 December 2016
Note 7. Current assets - financial assets (continued)
11
As announced to the market on 22 December 2015, the Company issued 20,192,307 shares to Lanstead Capital L.P. (‘Lanstead’). Lanstead, subscribed for 19,230,769 shares (the ‘Subscription Shares’), for an aggregate nominal consideration of $5,000,000. Lanstead also received 961,538 shares in lieu of payment of a $250,000 fee for entering an Equity Sharing Agreement. The Company entered into an Equity Sharing Agreement with Lanstead to allow the Company to retain much of the economic interest in the Lanstead Subscription Shares. The Equity Sharing Agreement enables the Company to secure much of the potential upside arising from the anticipated near term news flow. The aggregate consideration of $5,000,000 is to be repaid by way of an initial $750,000 (received 7 January 2016) followed by 18 monthly instalments. The diminution in fair value is a result of the actual share price of the company trading below the anticipated reference share price agreed on at the time of the underlying contract.
Note 8. Non-current assets - plant and equipment
Consolidated
31 December
2016 31 December
2015 $'000 $'000 Plant and equipment - at cost 750 388 Less: Accumulated depreciation (162) (75)
Plant and equipment - at cost 588 313
Reconciliations Reconciliations of the written down values at the beginning and end of the current and previous financial year are set out below:
Plant and
equipment
Total Consolidated $'000 $'000 Balance at 1 January 2015 26 26 Additions 299 299 Additions through business combinations (note 14) 13 13 Exchange differences 30 30 Depreciation expense (55) (55)
Balance at 31 December 2015 313 313 Additions 353 353 Exchange differences 2 2 Depreciation expense (80) (80)
Balance at 31 December 2016 588 588
YPB Group Ltd Notes to the financial statements 31 December 2016
12
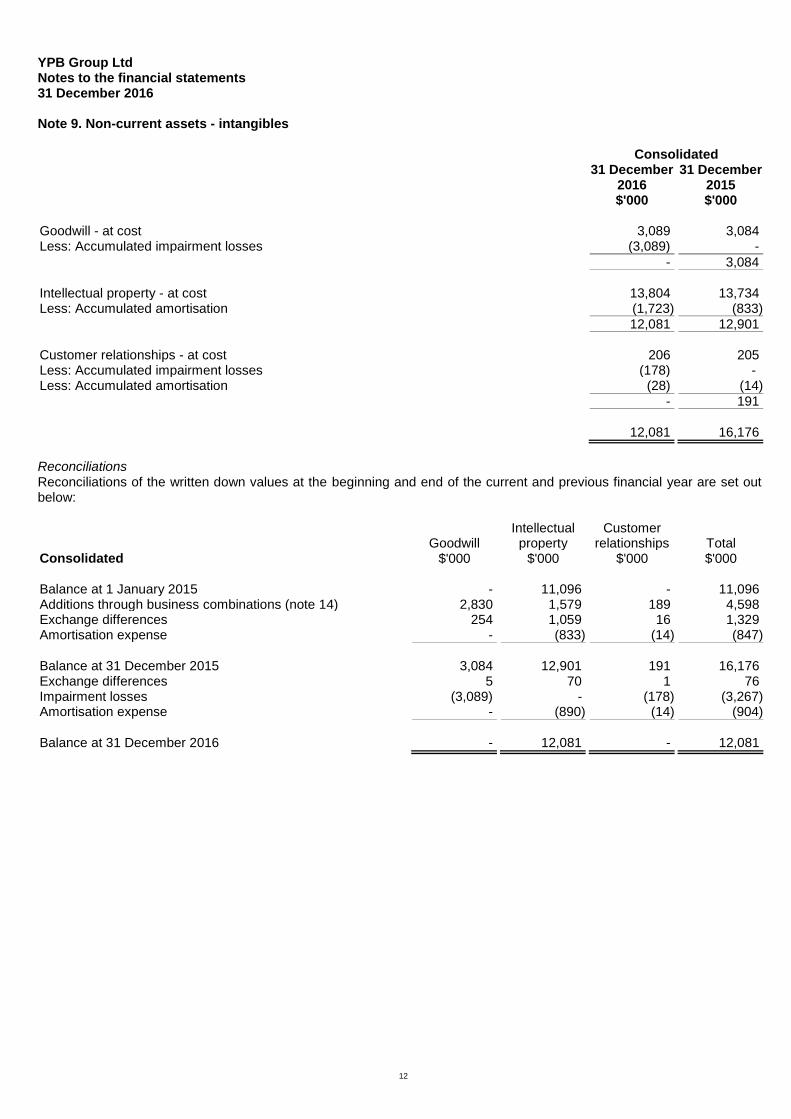
Note 9. Non-current assets - intangibles Consolidated
31 December
2016 31 December
2015 $'000 $'000 Goodwill - at cost 3,089 3,084 Less: Accumulated impairment losses (3,089) -
- 3,084
Intellectual property - at cost 13,804 13,734 Less: Accumulated amortisation (1,723) (833)
12,081 12,901 Customer relationships - at cost 206 205 Less: Accumulated impairment losses (178) - Less: Accumulated amortisation (28) (14)
- 191
12,081 16,176
Reconciliations Reconciliations of the written down values at the beginning and end of the current and previous financial year are set out below:
Goodwill Intellectual
property Customer
relationships
Total Consolidated $'000 $'000 $'000 $'000 Balance at 1 January 2015 - 11,096 - 11,096 Additions through business combinations (note 14) 2,830 1,579 189 4,598 Exchange differences 254 1,059 16 1,329 Amortisation expense - (833) (14) (847)
Balance at 31 December 2015 3,084 12,901 191 16,176 Exchange differences 5 70 1 76 Impairment losses (3,089) - (178) (3,267) Amortisation expense - (890) (14) (904)
Balance at 31 December 2016 - 12,081 - 12,081
YPB Group Ltd Notes to the financial statements 31 December 2016
Note 9. Non-current assets - intangibles (continued)
13
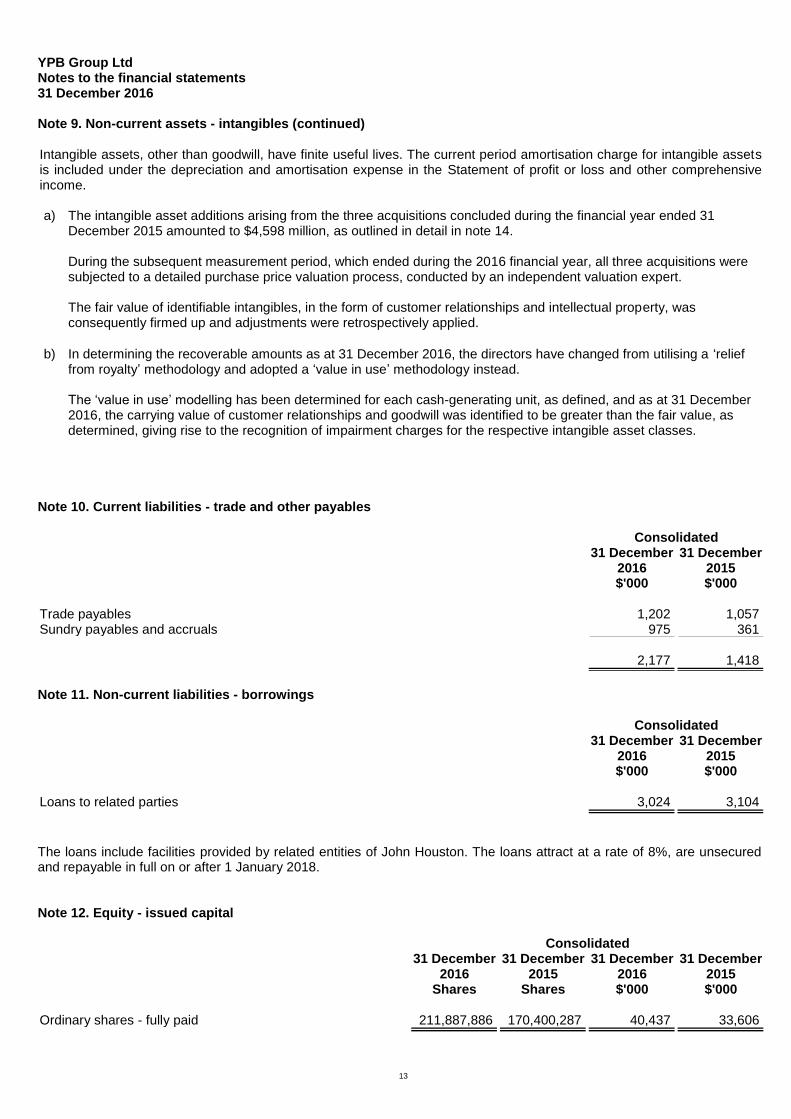
Intangible assets, other than goodwill, have finite useful lives. The current period amortisation charge for intangible assets is included under the depreciation and amortisation expense in the Statement of profit or loss and other comprehensive income. a) The intangible asset additions arising from the three acquisitions concluded during the financial year ended 31
December 2015 amounted to $4,598 million, as outlined in detail in note 14.
During the subsequent measurement period, which ended during the 2016 financial year, all three acquisitions were subjected to a detailed purchase price valuation process, conducted by an independent valuation expert. The fair value of identifiable intangibles, in the form of customer relationships and intellectual property, was consequently firmed up and adjustments were retrospectively applied.
b) In determining the recoverable amounts as at 31 December 2016, the directors have changed from utilising a ‘relief from royalty’ methodology and adopted a ‘value in use’ methodology instead. The ‘value in use’ modelling has been determined for each cash-generating unit, as defined, and as at 31 December 2016, the carrying value of customer relationships and goodwill was identified to be greater than the fair value, as determined, giving rise to the recognition of impairment charges for the respective intangible asset classes.
Note 10. Current liabilities - trade and other payables Consolidated
31 December
2016 31 December
2015 $'000 $'000 Trade payables 1,202 1,057 Sundry payables and accruals 975 361
2,177 1,418
Note 11. Non-current liabilities - borrowings Consolidated
31 December
2016 31 December
2015 $'000 $'000 Loans to related parties 3,024 3,104
The loans include facilities provided by related entities of John Houston. The loans attract at a rate of 8%, are unsecured and repayable in full on or after 1 January 2018.
Note 12. Equity - issued capital Consolidated
31 December
2016 31 December
2015 31 December
2016 31 December
2015 Shares Shares $'000 $'000 Ordinary shares - fully paid 211,887,886 170,400,287 40,437 33,606

YPB Group Ltd Notes to the financial statements 31 December 2016
Note 12. Equity - issued capital (continued)
14
Movements in ordinary share capital Details Date Shares $'000 Balance 1 January 2015 108,921,678 17,449 Issued under share-based payments 4 February 2015 73,333 22 Exercise of share options 6 February 2015 10,357 2 Issued under share placement 24 February 2015 10,000,000 3,000 Exercise of share options 2 March 2015 29,618 6 Exercise of share options 15 April 2015 1,607 1 Issued under Share Purchase Plan 28 April 2015 4,522,182 1,357 Shares issued on acquisition of IPP 7 May 2015 1,170,913 390 Exercise of share options 15 June 2015 7,500 2 Exercise of share options 30 June 2015 5,000 1 Shares issued on acquisition of CFC 1 September 2015 1,094,830 383 Share based payment to executives 1 September 2015 401,283 140 Share based payment to executives 12 October 2015 400,000 142 Shares issued on acquisition of Ntouch 30 October 2015 12,857,143 3,350 Exercise of share options 16 November 2015 3,000 1 Issued under share placement 29 December 2015 10,709,536 2,784 Shares issued to Lanstead 29 December 2015 19,230,769 5,000 Issued under share-based payments 29 December 2015 961,538 250 Less: Transaction costs on shares issued, net of tax - (674)
Balance 31 December 2015 170,400,287 33,606 Exercise of share options 17 February 2016 10,000 2 Issuance in accordance with consulting arrangement 17 February 2016 1,000,000 260 Issued in lieu of directors' fees 13 May 2016 648,486 - Share placement 30 May 2016 18,916,667 4,540 Issued under share-based payments 6 June 2016 944,446 227 Issued under share-based payments 8 August 2016 200,000 - Issued under share-based payments 8 August 2016 3,488,000 - Share placement 26 October 2016 16,000,000 3,120 Issued under share-based payments 27 October 2016 280,000 - Less: Transaction costs on shares issued, net of tax - (1,318)
Balance 31 December 2016 211,887,886 40,437
Ordinary shares Ordinary shares entitle the holder to participate in dividends and the proceeds on the winding up of the Company in proportion to the number of and amounts paid on the shares held. The fully paid ordinary shares have no par value and the Company does not have a limited amount of authorised capital. On a show of hands every member present at a meeting in person or by proxy shall have one vote and upon a poll each share shall have one vote.
YPB Group Ltd Notes to the financial statements 31 December 2016
Note 12. Equity - issued capital (continued)
15
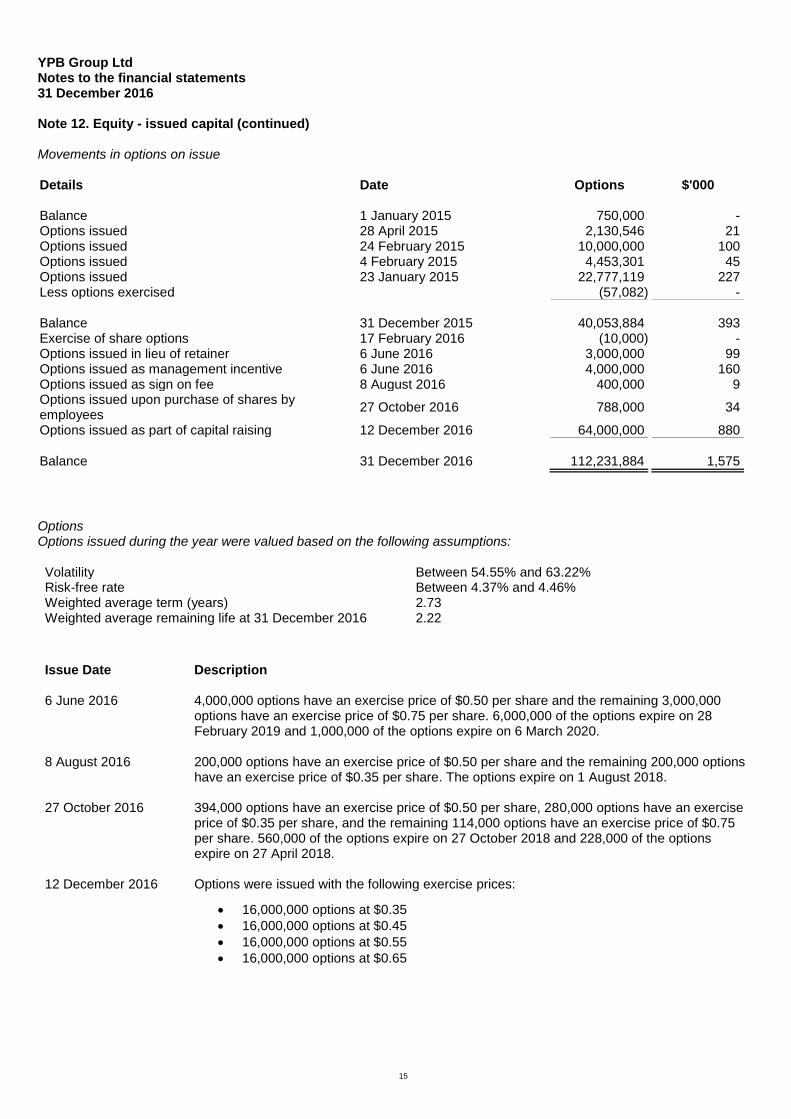
Movements in options on issue Details Date Options $'000 Balance 1 January 2015 750,000 - Options issued 28 April 2015 2,130,546 21 Options issued 24 February 2015 10,000,000 100 Options issued 4 February 2015 4,453,301 45 Options issued 23 January 2015 22,777,119 227 Less options exercised (57,082) - Balance 31 December 2015 40,053,884 393 Exercise of share options 17 February 2016 (10,000) - Options issued in lieu of retainer 6 June 2016 3,000,000 99 Options issued as management incentive 6 June 2016 4,000,000 160 Options issued as sign on fee 8 August 2016 400,000 9 Options issued upon purchase of shares by employees
27 October 2016 788,000 34
Options issued as part of capital raising 12 December 2016 64,000,000 880
Balance 31 December 2016 112,231,884 1,575
Options Options issued during the year were valued based on the following assumptions: Volatility Between 54.55% and 63.22% Risk-free rate Between 4.37% and 4.46% Weighted average term (years) 2.73 Weighted average remaining life at 31 December 2016 2.22
Issue Date Description 6 June 2016
4,000,000 options have an exercise price of $0.50 per share and the remaining 3,000,000 options have an exercise price of $0.75 per share. 6,000,000 of the options expire on 28 February 2019 and 1,000,000 of the options expire on 6 March 2020.
8 August 2016 200,000 options have an exercise price of $0.50 per share and the remaining 200,000 options have an exercise price of $0.35 per share. The options expire on 1 August 2018.
27 October 2016 394,000 options have an exercise price of $0.50 per share, 280,000 options have an exercise price of $0.35 per share, and the remaining 114,000 options have an exercise price of $0.75 per share. 560,000 of the options expire on 27 October 2018 and 228,000 of the options expire on 27 April 2018.
12 December 2016 Options were issued with the following exercise prices:
16,000,000 options at $0.35
16,000,000 options at $0.45
16,000,000 options at $0.55
16,000,000 options at $0.65

YPB Group Ltd Notes to the financial statements 31 December 2016
Note 12. Equity - issued capital (continued)
16
Capital risk management Management controls the capital of the group in order to maintain a sustainable debt to equity ratio, generate long-term shareholder value and ensure that the Group can fund its operations and continue as a going concern. The Group's debt and capital includes ordinary share capital, redeemable preference shares, convertible preference shares and financial liabilities, supported by financial assets. The group is not subject to any externally imposed capital requirements. Management effectively manages the Group's capital by assessing the Group's financial risks and adjusting its capital structure in response to changes in these risks and in the market. These responses include the management of debt levels, distributions to shareholders and share issues. The gearing ratios as at 31 December 2016 and 31 December 2015 are as follows: Note Consolidated
31 December
2015 31 December
2015 $ $ Total borrowings 11 3,024 3,104 Less cash and cash equivalents 4 (2,715) (2,877)
Net debt 309 227 Total equity 13,509 21,244
Total capital 13,818 21,471
Gearing ratio 2% 1%
Note 13. Equity - reserves Consolidated
31 December
2016 31 December
2015 $'000 $'000 Foreign currency reserve 2,341 2,566 Options reserve 1,575 393 Share-based payments reserve 1,015 97
4,931 3,056
Foreign currency translation reserve The foreign currency translation reserve is used to recognise exchange differences arising from the translation of the financial statements of foreign controlled subsidiaries to Australian dollars. Issued Options reserve The option reserve records items recognised as expenses on valuation of share options issued. Share-based payments reserve
The share based payment reserve is used to recognise the value of equity benefits provided to employees and directors as part of their remuneration, and other parties as part of their compensation for services.

YPB Group Ltd Notes to the financial statements 31 December 2016
Note 13. Equity - reserves (continued)
17
Movements in share based payments Details Date $'000 Balance 1 January 2015 97
Balance 31 December 2015 97 Issued under share-based payments 13 May 2016 203 Issued under share-based payments 8 August 2016 36 Conversion of performance rights 8 August 2016 627 Issued under share-based payments 27 October 2017 52
Balance 31 December 2016 1,015
Note 14. Business combinations Acquisition of Intellectual Property Protection Co Ltd and Intellectual Product Protection Inc (IPP) On 7 May 2015, the Company acquired a security consulting business specialising in providing high security programs to governments, major brands and fortune 500 companies which operates under the name "Intellectual Product Protection" or "IPP" for a provisional consideration of $641,000 (US$500,000) of which $252,000 (US$200,000) was paid/payable in cash and the balance by the issue shares in YPB Group Limited as shown in Note 12, and as disclosed in the financial report for the year ended 31 December 2015. The measurement period relating to the acquisition of IPP ended during the current financial year. The independent valuation of the purchase price allocation has been finalised whereby the intellectual property allocation was confirmed at $400,000 with a corresponding adjustment to goodwill arising from that acquisition. In line with reporting requirements, any measurement period adjustments identified during the year ended 31 December 2016 have been taken up retrospectively and the comparative position adjusted accordingly.

YPB Group Ltd Notes to the financial statements 31 December 2016
Note 14. Business combinations (continued)
18
Details of the acquisition are as follows: Fair value $'000 Cash and cash equivalents 21 Trade and other receivables 118 Intellectual property 400 Plant and equipment 13 Trade and other payables (5) Borrowings (23)
Net assets acquired 524 Goodwill 117
Acquisition-date fair value of the total consideration transferred 641
Representing: - Cash paid / payable 252 - Issuance of shares 389
641
Purchase consideration - cash outflow Cash consideration 252 less: Unpaid cash (126) Less: Cash and cash equivalents (21)
Net cash used during the 2015 financial year 105

YPB Group Ltd Notes to the financial statements 31 December 2016
Note 14. Business combinations (continued)
19
Acquisition of Continuous Forms Control Inc (CFC) Effective 31 August 2015, the Company acquired all the issued shares of the US based printing company Continuous Forms Control Inc., since renamed YPB Print Solutions Inc. ('Print Solutions') for a provisional consideration of $1,007,000 (US$600,000) of which $285,000 (US$300,000) was paid/payable in cash, $339,000 (US$243,000) was settled of pre-existing relationships and the balance by the issue of shares in YPB Group Limited as shown in Note 12, and as disclosed in the financial report for the year ended 31 December 2015. The measurement period relating to the acquisition of YPB Print Solutions Inc. ended during the current financial year. The independent valuation of the purchase price allocation has been finalised whereby the customer relationships allocation was confirmed at $198,000 with a corresponding adjustment to goodwill arising from that acquisition. In line with reporting requirements, any measurement period adjustments identified during the year ended 31 December 2016 have been taken up retrospectively and the comparative position adjusted accordingly. Details of the acquisition are as follows: Fair value $'000 Bank overdraft (33) Trade receivables 453 Inventories 32 Other current assets 7 Customer relationships 198 Trade payables (418) Other payables (58) Other liabilities (42)
Net assets acquired 139 Goodwill 868
Acquisition-date fair value of the total consideration transferred 1,007
Representing: Cash paid / payable 285 Issuance of shares 383 Pre-existing relationships 339
1,007
Purchase consideration - cash outflow Cash consideration 285 Add: cash and cash equivalents 33
Net cash used during the 2015 financial year 318

YPB Group Ltd Notes to the financial statements 31 December 2016
Note 14. Business combinations (continued)
20
Acquisition of nTouch Holdings Pty Ltd Effective 31 October 2015, the company acquired all the issued shares of proximity marketing technology company nTouch Holdings Pty Ltd ('nTouch'). The transaction was based on an all script offering of 12,857,143 YPB shares at a price of 35c per share. Management had however determined that the fair value of the YPB shares is $0.26 per share, on the basis that shares placed at and around this time were at $0.26. nTouch is a unique marketing platform that leverages proximity technologies to allow business clients to engage with customers (B2C) based on time, location and specific user characteristics. The nTouch group of companies has launched a fully tested communications platform which integrates with YPB’s customer engagement strategy around product authenticity. The measurement period relating to the acquisition of nTouch ended during the current financial year. The independent valuation of the purchase price allocation has been finalised whereby the intellectual property allocation was confirmed at $944,000 with a corresponding adjustment to goodwill arising from that acquisition. In line with reporting requirements, any measurement period adjustments identified during the year ended 31 December 2016 have been taken up retrospectively and the comparative position adjusted accordingly. Details of the acquisition are as follows: Fair value $'000 Intellectual property 944
Net assets acquired 944 Goodwill 2,406
Acquisition-date fair value of the total consideration transferred 3,350
Representing: YPB Group Ltd shares issued to vendor 3,350
Note 15. Interests in subsidiaries The consolidated financial statements incorporate the assets, liabilities and results of the following subsidiaries: Principal place of business / Name Country of incorporation YPB Limited (HK) Hong Kong YPB Technology (Beijing) Limited PRC China Product ID & Quality Systems (Beijing) Ltd PRC China Brand Reporter Pty Ltd Australia YPB Group (USA) Inc USA Intellectual Product Protection Inc USA YPB Print Solutions Inc USA YPB Group Co., Ltd Thailand nTouch Holdings Pty Ltd Australia nTouch Agency Pty Ltd Australia nTouch Pty Ltd Australia nTouch IP Pty Ltd Australia

YPB Group Ltd Notes to the financial statements 31 December 2016
21
Note 16. Reconciliation of loss after income tax to net cash used in operating activities Consolidated
31 December
2016 31 December
2015 $'000 $'000 Loss after income tax (16,441) (6,762) Adjustments for: Depreciation and amortisation expense 970 902 Options expense 202 - Share-based payments 515 282 Impairment of goodwill & customer relationships 3,267 - Unrealised foreign exchange (308) - Diminution in fair value of derivative assets 1,060 - Change in operating assets and liabilities; net of the effects of purchase and disposal of subsidiaries
(Increase)/decrease in trade and other receivables 213 (470) (Increase) in inventories (169) (10) Increase/(decrease) in trade and other payables 1,037 367
Net cash used in operating activities (9,654) (5,691)

22
Note 17. Earnings per share Consolidated
31 December
2016 31 December
2015 $'000 $'000 Loss after income tax attributable to the owners of YPB Group Ltd (16,441) (6,762)
Number Number Weighted average number of ordinary shares used in calculating basic earnings per share 187,755,202 124,326,070
Weighted average number of ordinary shares used in calculating diluted earnings per share 187,755,202 124,326,070
Cents Cents Basic earnings per share (8.76) (5.44) Due to losses of the YPB Group, diluted earnings per share have not been presented.