2016 -2026 · boston public schools before 1899! draft: november 2, 2016 demographics report for...
TRANSCRIPT

! !!
!
!
!
!
! Boston Public Schools
Before 1899!
DRAFT: November 2, 2016
Demographics Report for the 10 Year Facility Master Plan
1900 -1939!
1940 -1959!
1960 -1984!
1985 -2015!
2016 -2026!
DRAFT

! BOSTON&PUBLIC&SCHOOLS&!&NOVEMBER&2,&2016&DEMOGRAPHICS&REPORT&FACILITIES&MASTER&PLAN!
www.mgtamer.com!
!
BOSTON PUBLIC SCHOOLS DEMOGRAPHICS REPORT FACILITIES MASTER PLAN NOVEMBER 2, 2016
SUBMITTED BY MGT OF AMERICA CONSULTING, LLC. DRAFT REPORT
TABLE OF CONTENTS
BUILDBPS OVERVIEW .................................................................................................................................................... 1!
EXECUTIVE SUMMARY .................................................................................................................................................. 2!
PURPOSE AND CHARGE .............................................................................................................................................. 3!
CONTEXTUAL DATA .................................................................................................................................................... 4!BOSTON&POPULATION&TRENDS&.................................................................................................................&4!BOSTON’S&RACIAL&DIVERSITY&.....................................................................................................................&6!BOSTON&PUBLIC&SCHOOLS&STUDENTS&BY&NEIGHBORHOOD&.......................................................&7!BOSTON&PUBLIC&SCHOOLS&–&ALL&STUDENTS&DISTRIBUTION&......................................................&8!
BOSTON!PUBLIC!SCHOOLS!ALL!STUDENTS!.........................................................................!9!
SOCIO;ECONOMICALLY!DISADVANTAGED!STUDENTS!.....................................................!10!
STUDENTS!WITH!DISABILITIES!.........................................................................................!11!
ENGLISH!LANGUAGE!LEARNERS!.......................................................................................!12!
WHAT&THIS&DATA&TELLS&US&.....................................................................................................................&13!ENROLLMENT DATA, METHODOLOGY AND PROJECTIONS .................................................................... 14!EARLY&CHILDHOOD&EDUCATION&–&KO&/&K1&ENROLLMENT&.......................................................&14!HISTORICAL&K2E12&ENROLLMENT&.........................................................................................................&15!
HISTORICAL!GRADE!BAND!ENROLLMENT!........................................................................!16!
HISTORICAL!ENROLLMENT!FINDINGS!..............................................................................!19!
DEMOGRAPHIC&MODELS&.............................................................................................................................&21!ENROLLMENT&PROJECTION&METHODOLOGY&...................................................................................&23!
LIVE!BIRTHS!AND!KINDERGARTEN!ENROLLMENT!............................................................!23!
HOUSING!UNITS!...............................................................................................................!29!
ENROLLMENT&PROJECTIONS&....................................................................................................................&31!GRADE!BAND!PROJECTED!ENROLLMENT!.........................................................................!33!
CONCLUSIONS, OBSERVATIONS AND NEXT STEPS ...................................................................................... 35!
APPENDIX A .................................................................................................................................................................... 36!ENROLLMENT!COMPARISON!CHARTS!..............................................................................!36!
APPENDIX B .................................................................................................................................................................... 59!PERCENT!IN!CHANGE!OF!POPULATION!............................................................................!59!
DRAFT

BOSTON&PUBLIC&SCHOOLS&!&NOVEMBER&2,&2016&DEMOGRAPHICS&REPORT&FACILITIES&MASTER&PLAN&
P A G E & 1 &
!
BUILDBPS OVERVIEW
Launched!on!September!29,!2015!by!Mayor!Martin!J.!Walsh,!the!Boston!School!Committee,!and!Superintendent!Tommy!Chang,!BuildBPS!is!a!ten;Year!Educational!and!Facilities!Master!Plan!for!Boston!Public!Schools!(BPS).!
BuildBPS!will!provide!a!strategic!framework!for!facilities!investments,!as!well!as!curriculum!and!instruction!reforms!that!are!aligned!with!the!district’s!educational!vision.!BPS!and!the!Mayor’s!Education!Cabinet!are!working!with!Symmes,!Maini!&!McKee!Associates!(SMMA)!to!develop!a!comprehensive!set!of!options.!!MGT!of!America!Consulting,!LLC!is!a!member!of!SMMA’s!consulting!team.!
The!project!is!guided!by!five!advisory!committees!that!include!educators!and!representatives!of!parent!and!community!partner!organizations.!The!work!of!SMMA!is!conducted!in!partnership!with!BPS,!the!Mayor’s!Education!Cabinet,!and!several!City!agencies,!including!Public!Facilities,!the!Office!of!Budget!Management,!Environment,!Energy!and!Open!Space,!Neighborhood!Services,!and!the!Boston!Planning!and!Development!Agency!(formerly!the!Boston!Redevelopment!Authority),!in!consultation!with!designer!and!project!manager!Margaret!Wood!of!Pinck!&!Co.!
!
!
!
!
!
!
!
!
!
!
DRAFT

BOSTON&PUBLIC&SCHOOLS&!&NOVEMBER&2,&2016&DEMOGRAPHICS&REPORT&FACILITIES&MASTER&PLAN&
P A G E & 2 &
!
EXECUTIVE SUMMARY
The!Boston!Public!Schools!is!engaging!in!the!development!of!BuildBPS,!a!district;wide!Educational!and!Facilities!Master!Plan.!!As!part!of!that!process,!the!district!is!undertaking!a!demographic!and!enrollment!analysis!to!better!understand!potential!population!changes!and!implications!for!BPS!enrollment.!!MGT!of!America!Consulting,!LLC!has!been!leading!the!demographic!and!enrollment!study!process.!
There!are!a!number!of!major!themes!within!the!study’s!findings.!!First,!and!possibly!most!important,!is!the!strong!disconnect!between!the!growth!patterns!of!Boston!and!the!growth!patterns!of!Boston!Public!Schools.!!Since!the!recession!of!2007!–!2011,!the!City!of!Boston!has!experienced!a!continuous!and!significant!increase!in!population1.!!The!contributing!factors!to!Boston’s!overall!population!increase!could!include!the!following:!
• Job!opportunities!in!the!technology!and!health!sectors!
• Higher!education!institutions!with!increased!enrollment!
• An!increase!in!new!housing!units!
Despite!this!overall!population!increase,!this!study!predicts!that!the!population!of!the!Boston!Public!
Schools!will!increase!only!moderately!over!the!next!ten!years,!primarily!because!of!two!factors:!
• A!relatively!small!increase!in!birth!to!age;5!population!
• The!growth!in!charter!schools,!which!draw!students!away!from!district!schools!
Results!outlined!in!the!study!project!moderate!enrollment!increases!due!to!the!primary!factors!
outlined!above!and!are!further!influenced!by!the!following:!!
• Census!Bureau!population!counts!show!an!increase!in!the!overall!population!but!a!decrease!in!the!population!segments!which!typically!impact!K2;12!enrollment.!
" The!general!population!and!demographics!of!Boston!are!getting!older,!which!is!likely!to!contribute!to!only!modest!growth!of!the!K2;12!population.!!
!
!!!!!!!!!!!!!!!!!!!!!!!!!!!!!!!!!!!!!!!!!!!!!!!!!!!!!!!!!!!!!1!Please!see!Exhibit!1!on!page!3.!
DRAFT

BOSTON&PUBLIC&SCHOOLS&!&NOVEMBER&2,&2016&DEMOGRAPHICS&REPORT&FACILITIES&MASTER&PLAN&
P A G E & 3 &
!
PURPOSE AND CHARGE
In!July!of!2015,!the!master!planning!project!management!team!began!to!look!at!how!the!changing!demographics!of!the!city!and!school!district!were!impacting!the!district’s!schools.!!This!management!team!met!with!various!agencies!and!city!and!district!personnel!to!gain!insight!into!current!and!potential!demographic!trends.!!
In!November!of!2015,!a!Demographics!Advisory!Committee!was!formed!to!look!specifically!at!the!demographic!and!enrollment!trends!of!the!district!and!city!in!an!effort!to!begin!to!develop!projection!models!for!forecasting!future!student!enrollment!and!to!determine!what!influence!these!enrollment!patterns!would!have!on!a!Facilities!Master!Plan.!The!Committee!started!with!an!examination!of!historical!demographic!data!from!city!planners!and!demographers,!as!well!as!longitudinal!historical!district!data.!!The!data!included!district!enrollment!and!grade;level!information,!sub;group!population!percentage!data,!and!geographical!information!related!to!existing!neighborhoods!and!assignment!zones.!!The!Demographics!Advisory!Committee!met!several!times!in!2016!to!discuss!the!emerging!data!patterns,!to!analyze!the!initial!impacts!of!the!data,!and!to!refine!the!approach!to!future!projection!methodologies.!!
!
DRAFT

BOSTON&PUBLIC&SCHOOLS&!&NOVEMBER&2,&2016&DEMOGRAPHICS&REPORT&FACILITIES&MASTER&PLAN&
P A G E & 4 &
!
CONTEXTUAL DATA
An!analysis!of!both!quantitative!and!qualitative!data!forms!the!basis!for!BPS’!enrollment!projections.!!Quantitative!data!comes!from!the!district,!city,!and!the!U.S.!Census!Bureau!(Census)!and!provides!the!“what”!–!the!basic!understanding!of!trends!“by!the!numbers.”!!Qualitative!data!was!gathered!through!conversations!with!district!officials!familiar!with!enrollment!trends!and!provides!the!“why”!behind!the!numbers.!!Both!forms!of!data!are!critical!to!the!preparation!of!enrollment!projections!for!the!district’s!ten;year!Educational!and!Facilities!Master!Plan.!
BOSTON POPULATION TRENDS
Boston’s'population'has'been'on'the'rise.'
The!City!of!Boston!had!a!population!of!617,594!in!2010;!Census!data!indicates!that!number!had!increased!to!639,594!in!2014,!a!population!growth!of!almost!3.6%!in!four!years.!!Exhibit!1!shows!the!increase!in!total!population!from!2010!to!2014.!
EXHIBIT!1!
!Source:!!U.S.!Census!Bureau.!
! !
!617,594!!!639,594!!
!H!!!!
!100,000!!
!200,000!!
!300,000!!
!400,000!!
!500,000!!
!600,000!!
!700,000!!
2010! 2014!est.!
Boston,!MA!PopulaNon!
DRAFT

BOSTON&PUBLIC&SCHOOLS&!&NOVEMBER&2,&2016&DEMOGRAPHICS&REPORT&FACILITIES&MASTER&PLAN&
P A G E & 5 &
!
Boston’s'population'overall'is'aging'and'population'make'up'does'not'directly'indicate'an'increase'in'Boston’s'student9aged'population.''''
An!examination!of!the!age!structure!of!Boston!reveals!that!the!largest!segment!of!the!population!is!between!25!and!34!years!of!age:!
Exhibit!2!illustrates!the!population!age!structure!of!Boston!in!2010!and!in!2014.!
EXHIBIT!2!
!Source:!!U.S.!Census!Bureau.!
Analysis!and!context!for!the!age!structure!offers!some!interesting!observations.!The!youngest!three!population!segments!(“Under!5,”!“5!to!9”!and!“10!to!14”),!those!at!or!nearing!school!age,!show!virtually!no!change!from!2010!to!2014.!!The!next!two!segments!(“15!to!19”!and!“20!to!24”)!show!a!decline!from!2010!to!2014.!!!
There!is!a!significant!increase!in!the!“25!to!34”!segment,!but!again!very!little!change!in!the!“35!to!44”!age!segment.!!Typically!these!two!age!groups!are!considered!the!childbearing!years,!but!in!this!case!the!majority!of!the!growth!in!the!“25!to!34”!segment!is!due!primarily!to!an!influx!of!students!obtaining!postsecondary!degrees!at!a!number!of!area!universities.!This!is!further!reflected!in!the!subsequent!decline!in!population!in!the!“35!to!44”!segment!when!the!same!students!leave!the!city!to!find!employment!or!return!home.!!
Despite!the!size!of!the!population!between!25!and!34!years!old,!there!are!more!people!living!in!the!City!of!Boston!who!fall!above!this!age!group,!contributing!to!an!older!average!age!–!an!average!which!is!only!increasing2.!!
These!data!points!indicate!a!slowing!of!the!growth!of!K2;12!students.!!!
!!!!!!!!!!!!!!!!!!!!!!!!!!!!!!!!!!!!!!!!!!!!!!!!!!!!!!!!!!!!!2!Please!see!Appendix!B!for!table!of!data.!
!H!!!! !20,000!!!40,000!!!60,000!!!80,000!!!100,000!!!120,000!!!140,000!!!160,000!!
Under!5!
5!to!9!
10!to!14!
15!to!19!
20!to!24!
25!to!34!
35!to!44!
45!to!54!
55!to!59!
60!to!64!
65!to!74!
75!to!84!
85!and!over!
Boston,!MA!Age!Structure!!
2010! 2014!est.!
DRAFT

BOSTON&PUBLIC&SCHOOLS&!&NOVEMBER&2,&2016&DEMOGRAPHICS&REPORT&FACILITIES&MASTER&PLAN&
P A G E & 6 &
!
BOSTON’S RACIAL DIVERSITY
Boston’s'racial'diversity'has'not'changed'significantly'from'2010'to'2014.''
The!racial!composition!of!Boston!in!2010!consisted!of!47%!White,!22%!Black!or!African;American,!18%!Hispanic,!and!9%!Asian,!with!other!races!accounting!for!the!remaining!4%!of!the!population.!There!is!very!little!difference!between!the!2010!and!2014!estimates!for!the!city’s!racial!composition.!!!
Exhibit!3!illustrates!the!racial!structure!in!the!City!of!Boston!for!2010!and!2014.!
EXHIBIT!3!
!Source:!!U.S.!Census!Bureau.!
290,312! 294,432!
138,073! 145,112!
107,917! 117,514!
54,846! 58,090!
14,959! 14,791!
10,078! 8,352!
0%!
10%!
20%!
30%!
40%!
50%!
60%!
70%!
80%!
90%!
100%!
2010! 2014!est.!
Boston,!MA!Racial!Structure!
NaNve!Hawaiian!and!
Other!Pacific!Islander!!
American!Indian!and!
Alaska!NaNve!!
Some!Other!Race!!
Two!or!More!Races!
Asian!!
Hispanic!(all!races)!
Black!or!African!
American!!
White!!
DRAFT
BOSTON&PUBLIC&SCHOOLS&!&NOVEMBER&2,&2016&DEMOGRAPHICS&REPORT&FACILITIES&MASTER&PLAN&
P A G E & 7 &
!
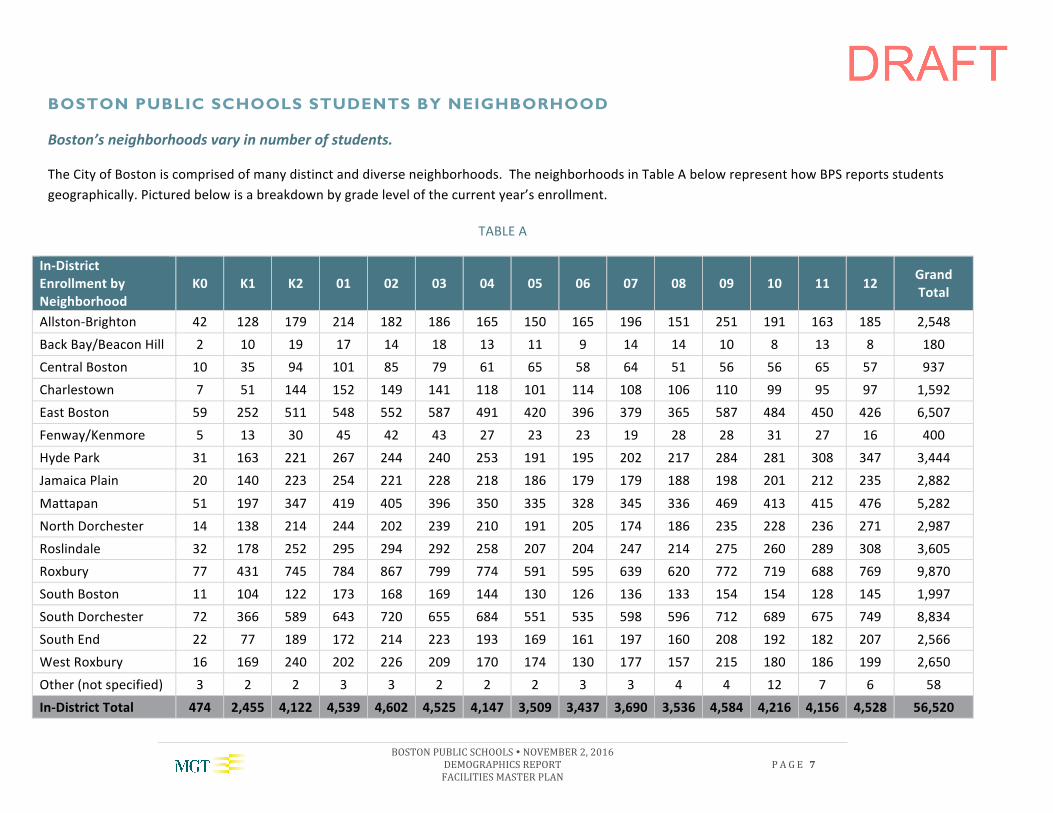
BOSTON PUBLIC SCHOOLS STUDENTS BY NEIGHBORHOOD
Boston’s'neighborhoods'vary'in'number'of'students.'
The!City!of!Boston!is!comprised!of!many!distinct!and!diverse!neighborhoods.!!The!neighborhoods!in!Table!A!below!represent!how!BPS!reports!students!geographically.!Pictured!below!is!a!breakdown!by!grade!level!of!the!current!year’s!enrollment.!!
TABLE!A!
In#District*Enrollment*by*Neighborhood!
K0! K1! K2! 01! 02! 03! 04! 05! 06! 07! 08! 09! 10! 11! 12! Grand*Total!
AllstonBBrighton! 42! 128! 179! 214! 182! 186! 165! 150! 165! 196! 151! 251! 191! 163! 185! 2,548!Back!Bay/Beacon!Hill! 2! 10! 19! 17! 14! 18! 13! 11! 9! 14! 14! 10! 8! 13! 8! 180!Central!Boston! 10! 35! 94! 101! 85! 79! 61! 65! 58! 64! 51! 56! 56! 65! 57! 937!Charlestown! 7! 51! 144! 152! 149! 141! 118! 101! 114! 108! 106! 110! 99! 95! 97! 1,592!East!Boston! 59! 252! 511! 548! 552! 587! 491! 420! 396! 379! 365! 587! 484! 450! 426! 6,507!Fenway/Kenmore! 5! 13! 30! 45! 42! 43! 27! 23! 23! 19! 28! 28! 31! 27! 16! 400!Hyde!Park! 31! 163! 221! 267! 244! 240! 253! 191! 195! 202! 217! 284! 281! 308! 347! 3,444!Jamaica!Plain! 20! 140! 223! 254! 221! 228! 218! 186! 179! 179! 188! 198! 201! 212! 235! 2,882!
Mattapan! 51! 197! 347! 419! 405! 396! 350! 335! 328! 345! 336! 469! 413! 415! 476! 5,282!North!Dorchester! 14! 138! 214! 244! 202! 239! 210! 191! 205! 174! 186! 235! 228! 236! 271! 2,987!Roslindale! 32! 178! 252! 295! 294! 292! 258! 207! 204! 247! 214! 275! 260! 289! 308! 3,605!Roxbury! 77! 431! 745! 784! 867! 799! 774! 591! 595! 639! 620! 772! 719! 688! 769! 9,870!South!Boston! 11! 104! 122! 173! 168! 169! 144! 130! 126! 136! 133! 154! 154! 128! 145! 1,997!South!Dorchester! 72! 366! 589! 643! 720! 655! 684! 551! 535! 598! 596! 712! 689! 675! 749! 8,834!South!End! 22! 77! 189! 172! 214! 223! 193! 169! 161! 197! 160! 208! 192! 182! 207! 2,566!West!Roxbury! 16! 169! 240! 202! 226! 209! 170! 174! 130! 177! 157! 215! 180! 186! 199! 2,650!Other!(not!specified)! 3! 2! 2! 3! 3! 2! 2! 2! 3! 3! 4! 4! 12! 7! 6! 58!In#District*Total! 474! 2,455! 4,122! 4,539! 4,602! 4,525! 4,147! 3,509! 3,437! 3,690! 3,536! 4,584! 4,216! 4,156! 4,528! 56,520!!

BOSTON&PUBLIC&SCHOOLS&!&NOVEMBER&2,&2016&DEMOGRAPHICS&REPORT&FACILITIES&MASTER&PLAN&
P A G E & 8 &
!
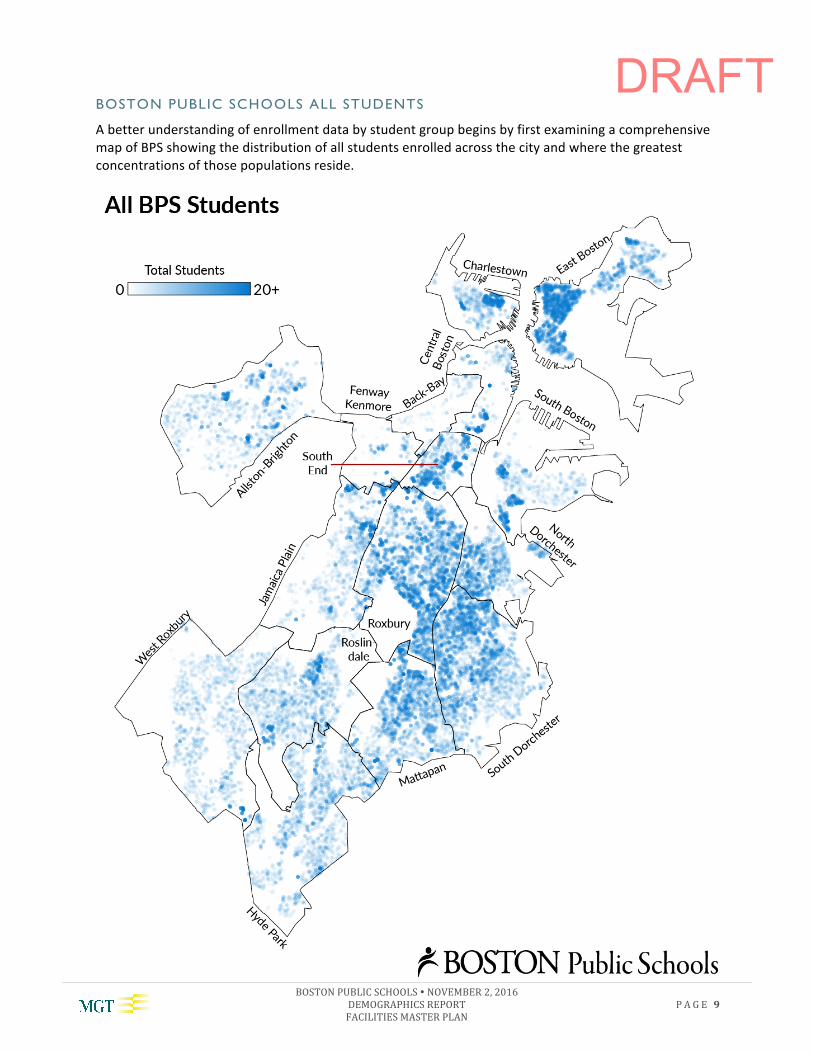
BOSTON PUBLIC SCHOOLS – ALL STUDENTS DISTRIBUTION
A"geographical"view"of"where"students"live.""
Boston!Public!Schools!(BPS)!is!comprised!of!over!56,520!students!spread!across!128!schools!in!a!variety!of!programs.!In!examining!the!geographical!distribution!of!students!who!qualify!for!the!three!broadGbased!programs!Free!and!Reduced!Lunch,!Students!with!Disabilities,!and!English!Language!Learners,!we!can!begin!to!see!some!commonalities!across!the!city!with!respect!to!poverty,!program,!and!population.!!!!
Table&B,!below,!shows!the!percentages!by!grade!level!of!each!of!the!programs,!and!the!total!percentage!of!students!within!those!programs!in!the!Total!line.!The!maps!below!represent!the!students!distribution!in!the!above!classifications.!It!is!clear!that!most!of!the!students!within!these!groups!reside!in!a!mostly!north/south!corridor,!stretching!from!East!Boston!to!Mattapan!and!along!an!east/west!orientation!throughout!Roxbury!and!Dorchester.!!There!are!smaller!numbers!of!these!students!in!Fenway/Kenmore,!Jamaica!Plain,!and!West!Roxbury.!!Most!of!the!remaining!neighborhoods!have!limited!numbers!of!these!students.!
By!displaying!this!program!information!in!a!Geographical!Information!System!(GIS)!mapping!format!we!can!clearly!see!where!students!with!greater!needs!are!concentrated!across!the!city.!
TABLE!B!
GRADE! %!AWC! %!ELL! %!GEN!ED! %!SPED! %!FREE!LUNCH!
%!FULL!PRICE!LUNCH!
TOTAL!STUDENTS!
K0& ! 6%! 33%! 61%! 63%! 37%! 408!K1& ! 12%! 75%! 13%! 55%! 45%! 2604!K2& ! 14%! 77%! 9%! 65%! 35%! 4123!1& ! 17%! 74%! 9%! 73%! 27%! 4113!2& ! 15%! 75%! 10%! 74%! 26%! 4387!3& ! 12%! 78%! 10%! 75%! 25%! 4429!4& 6%! 8%! 76%! 10%! 76%! 24%! 4401!5& 7%! 6%! 75%! 12%! 76%! 24%! 3610!6& 10%! 6%! 73%! 11%! 72%! 28%! 3403!7& ! 6%! 84%! 10%! 69%! 31%! 3610!8& ! 7%! 82%! 11%! 70%! 30%! 3675!9& ! 14%! 75%! 11%! 69%! 31%! 4327!10& ! 10%! 80%! 10%! 69%! 31%! 4114!11& ! 9%! 82%! 9%! 68%! 32%! 4255!12& ! 4%! 83%! 13%! 69%! 31%! 4493!
Grand&Total& 2%& 10%& 78%& 0.11& 0.70& 30%& 55952&Source:!Boston!Public!Schools.!
!
!
BOSTON&PUBLIC&SCHOOLS&!&NOVEMBER&2,&2016&DEMOGRAPHICS&REPORT&FACILITIES&MASTER&PLAN&
P A G E & 9 &
!
BOSTON PUBLIC SCHOOLS ALL STUDENTS
A!better!understanding!of!enrollment!data!by!student!group!begins!by!first!examining!a!comprehensive!
map!of!BPS!showing!the!distribution!of!all!students!enrolled!across!the!city!and!where!the!greatest!
concentrations!of!those!populations!reside.!!
!!!
!
DRAFT

BOSTON&PUBLIC&SCHOOLS&!&NOVEMBER&2,&2016&DEMOGRAPHICS&REPORT&FACILITIES&MASTER&PLAN&
P A G E & 1 0 &
!
SOCIO-ECONOMICALLY DISADVANTAGED STUDENTS
Boston!has!a!large!population!of!students!who!would!typically!qualify!for!the!free!and!reduced!lunch3!
program.!In!an!effort!to!support!all!children!and!families,!Boston!has!chosen!to!offer!free!meals!to!all!
students.!The!map!below!shows!the!distribution!of!the!students!who!would!have!qualified!under!the!
previous!model.!Overall,!the!population!of!students!eligible!for!free!and!reduced!lunch!is!largely!
concentrated!in!the!Roxbury,!Dorchester!and!Mattapan!neighborhoods,!with!other!significant!pockets!in!
East!Boston!and!the!South!End.!The!remaining!neighborhoods!across!the!district!show!moderate!
distributions!of!free!and!reduced!lunch!students.!!!
!
!
!!!!!!!!!!!!!!!!!!!!!!!!!!!!!!!!!!!!!!!!!!!!!!!!!!!!!!!!!!!!!3!The!Free!and!Reduced!Lunch!program!is!used!to!determine!eligibility!for!federallyGfunded!education!programs.!
Although!Boston!Public!Schools!feeds!all!children!this!data!is!still!collected!for!the!purpose!of!submitting!for!federal!
funds.!
DRAFT
BOSTON&PUBLIC&SCHOOLS&!&NOVEMBER&2,&2016&DEMOGRAPHICS&REPORT&FACILITIES&MASTER&PLAN&
P A G E & 1 1 &
!
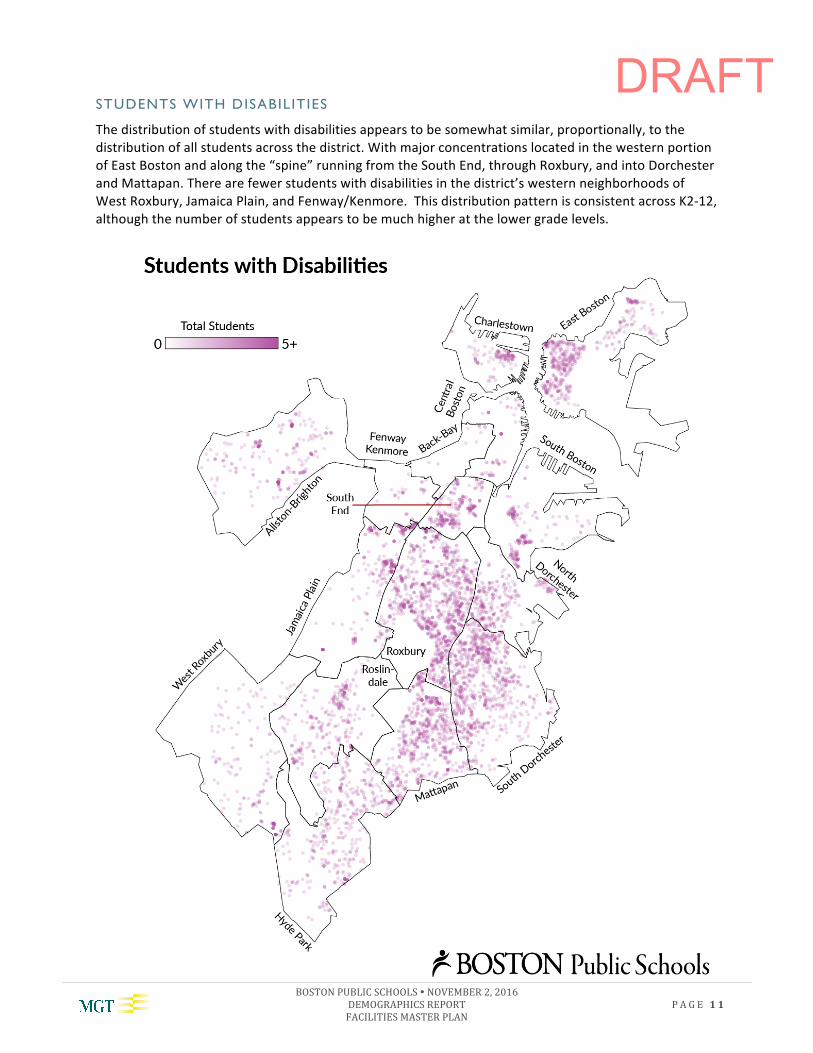
STUDENTS WITH DISABILITIES
The!distribution!of!students!with!disabilities!appears!to!be!somewhat!similar,!proportionally,!to!the!
distribution!of!all!students!across!the!district.!With!major!concentrations!located!in!the!western!portion!
of!East!Boston!and!along!the!“spine”!running!from!the!South!End,!through!Roxbury,!and!into!Dorchester!
and!Mattapan.!There!are!fewer!students!with!disabilities!in!the!district’s!western!neighborhoods!of!
West!Roxbury,!Jamaica!Plain,!and!Fenway/Kenmore.!!This!distribution!pattern!is!consistent!across!K2G12,!
although!the!number!of!students!appears!to!be!much!higher!at!the!lower!grade!levels.!
!
!
!
DRAFT

BOSTON&PUBLIC&SCHOOLS&!&NOVEMBER&2,&2016&DEMOGRAPHICS&REPORT&FACILITIES&MASTER&PLAN&
P A G E & 1 2 &
!
ENGLISH LANGUAGE LEARNERS
The!distribution!of!English!Language!Learners!(ELLs)!in!Boston!Public!Schools!is!similar!to!that!of!the!free!
and!reduced!lunch!students!and!the!students!with!disabilities!with!a!few!minor!exceptions,!notably!in!
Mattapan,!Hyde!Park,!and!Roslindale,!where!there!are!smaller!concentrations!of!ELLs!than!other!student!
groups.!The!highest!numbers!of!ELL!students!are!in!East!Boston,!followed!by!more!moderate!
concentrations!in!Roxbury!and!Dorchester.!
!
!
!
!
!
DRAFT

BOSTON&PUBLIC&SCHOOLS&!&NOVEMBER&2,&2016&DEMOGRAPHICS&REPORT&FACILITIES&MASTER&PLAN&
P A G E & 1 3 &
!
WHAT THIS DATA TELLS US
The!historical!data!presented!thus!far!builds!the!context!for!a!discussion!of!future!BPS!enrollment.!!We!
have!learned!that!the!Boston!is!growing!at!a!faster!rate!than!enrollment!in!the!school!district.!!We!have!
learned!that!the!overall!population!in!Boston!is!getting!older!and!not!producing!as!many!children!as!it!
once!did.!!We!have!also!learned!where!specific!subpopulations!of!students!are!concentrated,!which!
could!help!inform!future!educational!programming!and!facility!investments.!!!
!
DRAFT
BOSTON&PUBLIC&SCHOOLS&!&NOVEMBER&2,&2016&DEMOGRAPHICS&REPORT&FACILITIES&MASTER&PLAN&
P A G E & 1 4 &
ENROLLMENT DATA, METHODOLOGY AND PROJECTIONS
This!section!presents!the!demographic!analysis!and!enrollment!projections!for!the!tenGyear!facilities!
master!planning!period!of!2016!through!2026.!!It!is!important!to!keep!in!mind!that!enrollment!
projections!are!merely!an!estimate!of!future!activity!based!on!the!historical!data!and!information!
provided.!!Over!the!next!ten!years,!enrollment!is!expected!to!increase!modestly!across!the!district.!!
Although!the!data!provides!tremendous!insight!into!the!future,!it!is!important!to!understand!that!the!
information!contained!in!this!report!is!constantly!changing!and!will!need!to!be!reviewed!and!updated!on!
a!regular!basis.!!The!data!used!was!provided!by!the!Boston!Public!Schools!and!were!not!altered!or!
changed!prior!to!its!use!in!the!calculations!and/or!the!projections!contained!in!this!report.!!
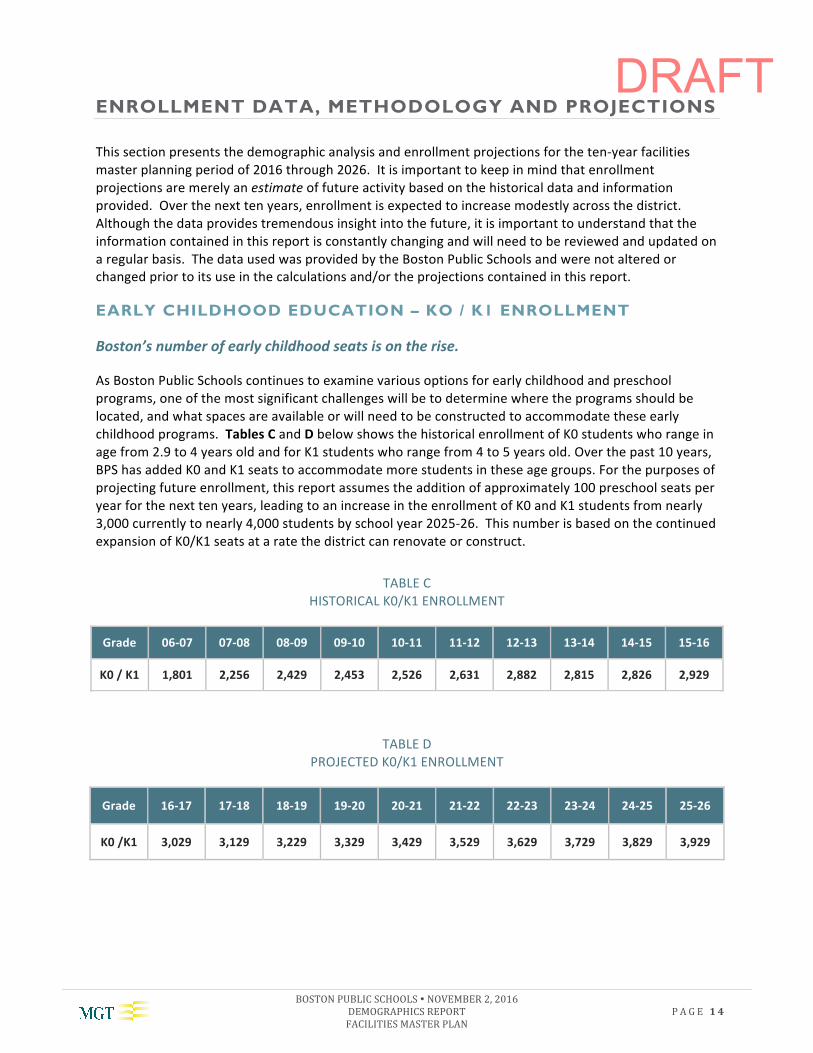
EARLY CHILDHOOD EDUCATION – KO / K1 ENROLLMENT
Boston’s"number"of"early"childhood"seats"is"on"the"rise."
As!Boston!Public!Schools!continues!to!examine!various!options!for!early!childhood!and!preschool!
programs,!one!of!the!most!significant!challenges!will!be!to!determine!where!the!programs!should!be!
located,!and!what!spaces!are!available!or!will!need!to!be!constructed!to!accommodate!these!early!
childhood!programs.!!Tables&C&and!D!below!shows!the!historical!enrollment!of!K0!students!who!range!in!
age!from!2.9!to!4!years!old!and!for!K1!students!who!range!from!4!to!5!years!old.!Over!the!past!10!years,!
BPS!has!added!K0!and!K1!seats!to!accommodate!more!students!in!these!age!groups.!For!the!purposes!of!
projecting!future!enrollment,!this!report!assumes!the!addition!of!approximately!100!preschool!seats!per!
year!for!the!next!ten!years,!leading!to!an!increase!in!the!enrollment!of!K0!and!K1!students!from!nearly!
3,000!currently!to!nearly!4,000!students!by!school!year!2025G26.!!This!number!is!based!on!the!continued!
expansion!of!K0/K1!seats!at!a!rate!the!district!can!renovate!or!construct.!
TABLE!C!
HISTORICAL!K0/K1!ENROLLMENT!
Grade! 06>07! 07>08! 08>09! 09>10! 10>11! 11>12! 12>13! 13>14! 14>15! 15>16!
K0&/&K1! 1,801! 2,256! 2,429! 2,453! 2,526! 2,631! 2,882! 2,815! 2,826! 2,929!
!!
TABLE!D!
PROJECTED!K0/K1!ENROLLMENT!!
Grade 16>17 17>18 18>19 19>20 20>21 21>22 22>23 23>24 24>25 25>26
K0&/K1 3,029 3,129 3,229 3,329 3,429 3,529 3,629 3,729 3,829 3,929
!
!
DRAFT
BOSTON&PUBLIC&SCHOOLS&!&NOVEMBER&2,&2016&DEMOGRAPHICS&REPORT&FACILITIES&MASTER&PLAN!
P A G E & 1 5 &
!
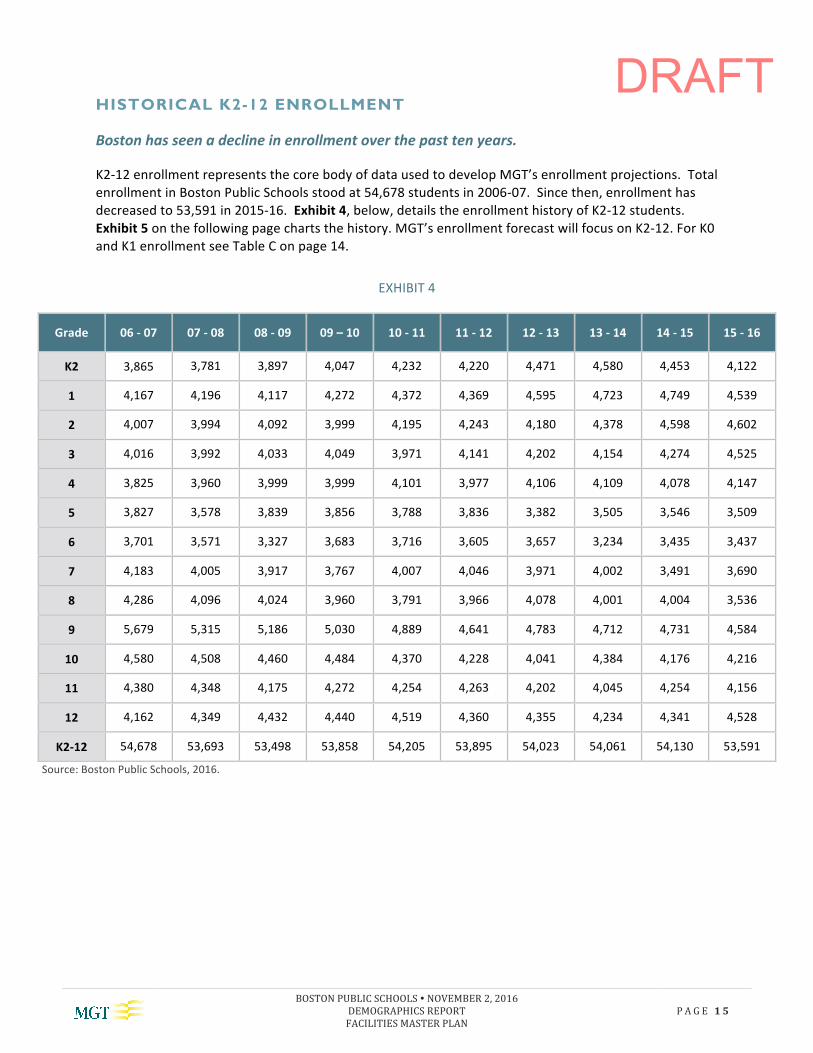
HISTORICAL K2-12 ENROLLMENT
Boston"has"seen"a"decline"in"enrollment"over"the"past"ten"years."
K2G12!enrollment!represents!the!core!body!of!data!used!to!develop!MGT’s!enrollment!projections.!!Total!
enrollment!in!Boston!Public!Schools!stood!at!54,678!students!in!2006G07.!!Since!then,!enrollment!has!
decreased!to!53,591!in!2015G16.!!Exhibit&4,!below,!details!the!enrollment!history!of!K2G12!students.!
Exhibit&5!on!the!following!page!charts!the!history.!MGT’s!enrollment!forecast!will!focus!on!K2G12.!For!K0!
and!K1!enrollment!see!Table!C!on!page!14.!!
EXHIBIT!4!
Grade! 06&>&07! 07&>&08! 08&>&09! 09&–&10! 10&>&11! 11&>&12! 12&>&13! 13&>&14! 14&>&15! 15&>&16!
K2! 3,865! 3,781! 3,897! 4,047! 4,232! 4,220! 4,471! 4,580! 4,453! 4,122!
1! 4,167! 4,196! 4,117! 4,272! 4,372! 4,369! 4,595! 4,723! 4,749! 4,539!
2! 4,007! 3,994! 4,092! 3,999! 4,195! 4,243! 4,180! 4,378! 4,598! 4,602!
3! 4,016! 3,992! 4,033! 4,049! 3,971! 4,141! 4,202! 4,154! 4,274! 4,525!
4! 3,825! 3,960! 3,999! 3,999! 4,101! 3,977! 4,106! 4,109! 4,078! 4,147!
5! 3,827! 3,578! 3,839! 3,856! 3,788! 3,836! 3,382! 3,505! 3,546! 3,509!
6! 3,701! 3,571! 3,327! 3,683! 3,716! 3,605! 3,657! 3,234! 3,435! 3,437!
7! 4,183! 4,005! 3,917! 3,767! 4,007! 4,046! 3,971! 4,002! 3,491! 3,690!
8! 4,286! 4,096! 4,024! 3,960! 3,791! 3,966! 4,078! 4,001! 4,004! 3,536!
9! 5,679! 5,315! 5,186! 5,030! 4,889! 4,641! 4,783! 4,712! 4,731! 4,584!
10! 4,580! 4,508! 4,460! 4,484! 4,370! 4,228! 4,041! 4,384! 4,176! 4,216!
11! 4,380! 4,348! 4,175! 4,272! 4,254! 4,263! 4,202! 4,045! 4,254! 4,156!
12! 4,162! 4,349! 4,432! 4,440! 4,519! 4,360! 4,355! 4,234! 4,341! 4,528!
K2>12& 54,678! 53,693! 53,498! 53,858! 54,205! 53,895! 54,023! 54,061! 54,130! 53,591!
Source:!Boston!Public!Schools,!2016.!!
!
DRAFT
BOSTON&PUBLIC&SCHOOLS&!&NOVEMBER&2,&2016&DEMOGRAPHICS&REPORT&FACILITIES&MASTER&PLAN!
P A G E & 1 6 &
!
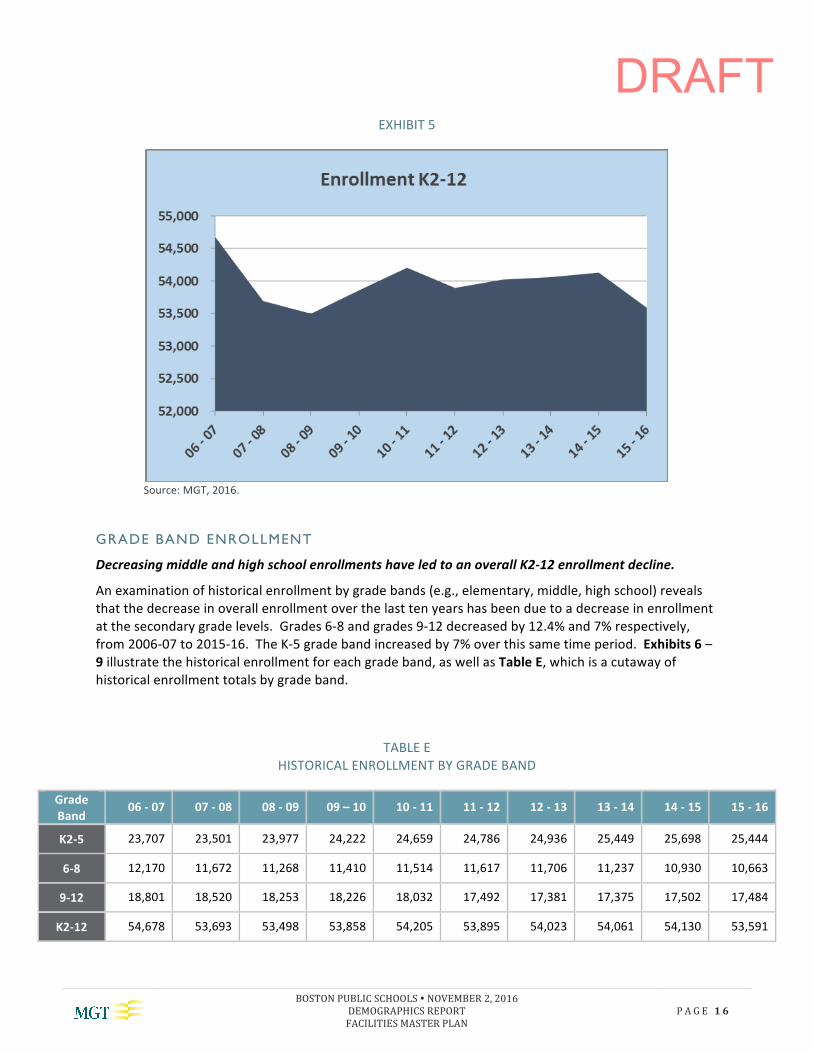
EXHIBIT!5!
!Source:!MGT,!2016.!
GRADE BAND ENROLLMENT
Decreasing"middle"and"high"school"enrollments"have"led"to"an"overall"K2>12"enrollment"decline.""
An!examination!of!historical!enrollment!by!grade!bands!(e.g.,!elementary,!middle,!high!school)!reveals!
that!the!decrease!in!overall!enrollment!over!the!last!ten!years!has!been!due!to!a!decrease!in!enrollment!
at!the!secondary!grade!levels.!!Grades!6G8!and!grades!9G12!decreased!by!12.4%!and!7%!respectively,!
from!2006G07!to!2015G16.!!The!KG5!grade!band!increased!by!7%!over!this!same!time!period.!!Exhibits&6!–!9!illustrate!the!historical!enrollment!for!each!grade!band,!as!well!as!Table&E,!which!is!a!cutaway!of!historical!enrollment!totals!by!grade!band.!
!
TABLE!E!
HISTORICAL!ENROLLMENT!BY!GRADE!BAND!
Grade&Band!
06&>&07! 07&>&08! 08&>&09! 09&–&10! 10&>&11! 11&>&12! 12&>&13! 13&>&14! 14&>&15! 15&>&16!
K2>5& 23,707! 23,501! 23,977! 24,222! 24,659! 24,786! 24,936! 25,449! 25,698! 25,444!
6>8! 12,170!! 11,672!! 11,268!! 11,410!! 11,514!! 11,617!! 11,706!! 11,237!! 10,930!! 10,663!!
9>12! 18,801!! 18,520! 18,253! 18,226! 18,032! 17,492! 17,381! 17,375! 17,502! 17,484!
K2>12! 54,678!! 53,693! 53,498! 53,858! 54,205! 53,895! 54,023! 54,061! 54,130! 53,591!
!
DRAFT

BOSTON&PUBLIC&SCHOOLS&!&NOVEMBER&2,&2016&DEMOGRAPHICS&REPORT&FACILITIES&MASTER&PLAN!
P A G E & 1 7 &
!
EXHIBIT!6!
!Source:!MGT,!2016.!
EXHIBIT!7!
!Source:!MGT,!2016.!
!
!
DRAFT
BOSTON&PUBLIC&SCHOOLS&!&NOVEMBER&2,&2016&DEMOGRAPHICS&REPORT&FACILITIES&MASTER&PLAN!
P A G E & 1 8 &
!
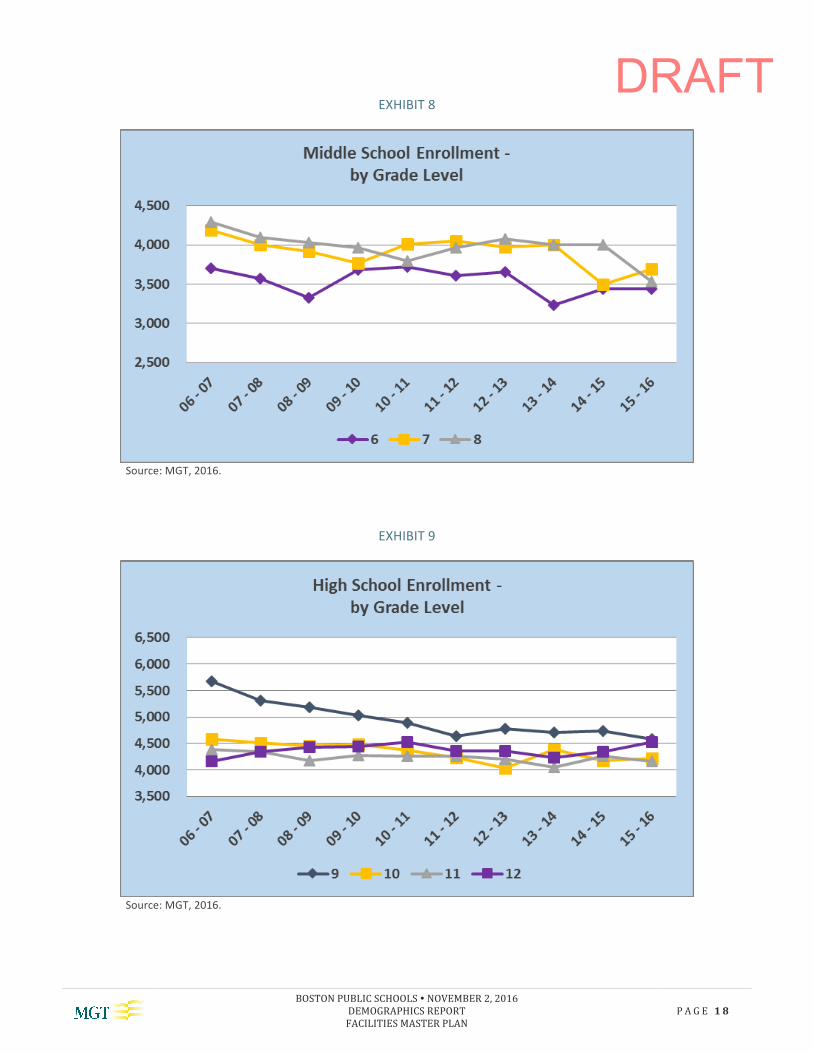
EXHIBIT!8!
!Source:!MGT,!2016.!
!
EXHIBIT!9!
!Source:!MGT,!2016.! !
DRAFT

BOSTON&PUBLIC&SCHOOLS&!&NOVEMBER&2,&2016&DEMOGRAPHICS&REPORT&FACILITIES&MASTER&PLAN!
P A G E & 1 9 &
!
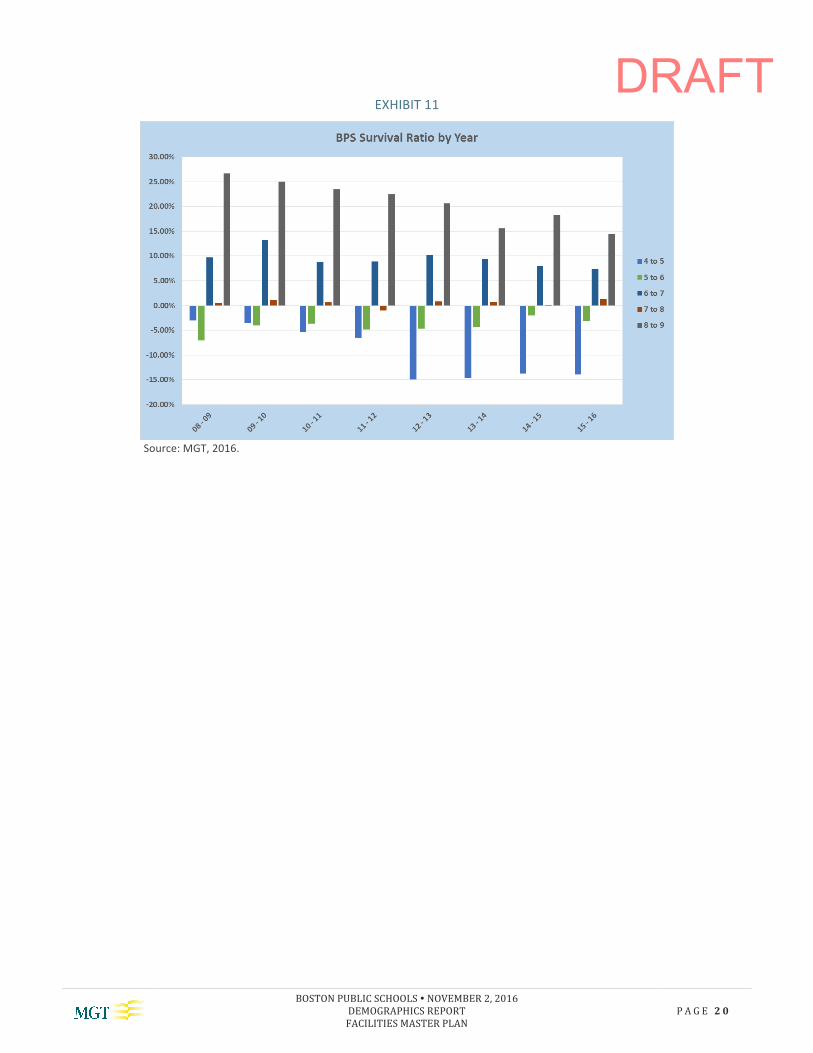
HISTORICAL ENROLLMENT FINDINGS
Based!on!an!analysis!of!the!data!presented!in!this!section,!we!have!found!the!following!regarding!the!
demographics!of!the!City!of!Boston:!
" Census!Bureau!population!counts!show!an!increase!in!the!overall!population,!but!a!decrease!in!
the!population!segments!which!typically!impact!K2G12!enrollment.!
" The!general!population!of!Boston!is!getting!older,!which!is!likely!to!impact!growth!in!the!K2G12!
population.!!
" There!has!been!a!decline!in!enrollment!between!4th!and!8
th!grades!over!the!last!ten!years,!
however!there!is!a!return!to!typical!enrollment!in!9th!grade.!
Exhibit&10!shows!ten!years!of!enrollment!data,!illustrating!the!variability!of!student!enrollment!between!
4th!and!8
th!grades.!!Exhibit&11!shows!the!survival!ratios!between!grades!4!and!8.!!!
!
EXHIBIT!10!
GRADE! 06&>&07! 07&>&08! 08&>&09! 09&>&10! 10&>&11! 11&>&12! 12&>&13! 13&>&14! 14&>&15! 15&>&16!
4! 3,825! 3,960! 3,999! 3,999! 4,101! 3,977! 4,106! 4,109! 4,078! 4,147!
5! 3,827! 3,578! 3,839! 3,856! 3,788! 3,836! 3,382! 3,505! 3,546! 3,509!
6! 3,701! 3,571! 3,327! 3,683! 3,716! 3,605! 3,657! 3,234! 3,435! 3,437!
7! 4,183! 4,005! 3,917! 3,767! 4,007! 4,046! 3,971! 4,002! 3,491! 3,690!
8! 4,286! 4,096! 4,024! 3,960! 3,791! 3,966! 4,078! 4,001! 4,004! 3,536!
4>8& 19,822! 19,210! 19,106! 19,265! 19,403! 19,430! 19,194! 18,851! 18,554! 18,319!
Source:!MGT,!2016.!
!
!
!
!
!
!
!
!
!
DRAFT
BOSTON&PUBLIC&SCHOOLS&!&NOVEMBER&2,&2016&DEMOGRAPHICS&REPORT&FACILITIES&MASTER&PLAN!
P A G E & 2 0 &
!
EXHIBIT!11!
!Source:!MGT,!2016.!
! !
DRAFT

BOSTON&PUBLIC&SCHOOLS&!&NOVEMBER&2,&2016&DEMOGRAPHICS&REPORT&FACILITIES&MASTER&PLAN!
P A G E & 2 1 &
!
DEMOGRAPHIC MODELS
There!are!several!population!and!demographic!studies!going!on!simultaneously!throughout!the!city!
which!need!to!be!taken!into!consideration!when!making!longGterm!decisions!regarding!schools,!building!
construction,!transportation,!and!economic!growth.!!The!Boston!Planning!and!Development!Agency!
(BPDA)!is!developing!models!that!will!help!shape!Imagine*Boston"2030,"the!Mayor’s!longGterm!future!
plan!for!the!city.!!!
The!City!of!Boston!has!also!projected!charter!school!enrollment!growth,!both!under!the!existing!charter!
cap!and!in!the!event!that!voters!approve!this!year’s!Ballot!Question!2,!which!would!lift!the!current!cap.!!!
Whereas!the!MGT!study!contained!in!the!remaining!pages!of!this!document!is!focused!specifically!on!
the!historical,!current,!and!future!enrollment!of!Boston!Public!Schools,!the!other!two!analyses!do!not!
have!this!focus.!The!BPDA!study!looks!at!population!growth,!but!does!not!account!for!student!choice!
decisions!and!BPS’s!capture!rate.!The!charter!school!growth!analysis!looks!solely!at!possible!added!
capacity!at!charter!schools!under!the!current!charter!school!cap!and!does!not!take!population!changes!
into!account.!Only!the!MGT!analysis!accounts!for!changes!in!the!population!and!BPS’s!capture!rate.!!
MGT PROJECTED GROWTH
The!MGT!projections!are!based!on!historical!enrollment!data!and!look!at!how!student!populations!could!
vary!using!four!nationally!recognized!projection!methodologies:!average!percentage!growth,!cohort!
survival,!students!per!household,!and!linear!regression.!!MGT!then!combines!these!four!models!into!one!
weighted!model!that!identifies!our!best!estimate!for!a!single!enrollment!projection.!Based!on!our!
enrollment!projection!methodologies,!MGT’s!conclusions!contained!in!this!report!show!a!slow!and!
steady!enrollment!growth!pattern!for!Boston!Public!Schools!over!the!next!ten!years.!!The!combined!
weighted!model!for!districtwide!enrollment!projections!calculates!a!total!projected!growth!of!2,515!
students!by!the!school!year!2025G26.!
BOSTON PLANNING AND DEVELOPMENT AGENCY (BPDA) PROJECTED GROWTH
The!BPDA!in!its!Imagine*Boston*2030!documents!projects!a!significant!amount!of!growth!throughout!the!
City.!!The!projections!are!based!on!U.S.!Census!data,!housing!starts,!immigration!data,!and!live!birth!data!
and!are!being!used!to!examine!where!and!how!much!the!city!population!will!grow!over!the!next!ten!to!
fifteen!years.!!If!these!projections!come!to!fruition,!an!additional!10,000!schoolGaged!children!could!be!
added!to!Boston,!but!it!is!unclear!what!portion!of!this!would!be!captured!by!BPS!from!this!analysis.!!
CHARTER SCHOOL IMPACT
The!number!of!charter!school!seats!continues!to!grow!in!Boston!based!on!the!state!achievement!gap!
legislation!enacted!in!2010.!!In!the!2016G2017!school!year,!there!is!an!18%!cap!on!the!percentage!of!
Boston’s!net!school!spending!that!the!state!can!assess!from!Boston!to!pay!for!charter!schools.!Largely!
due!to!this!legislation,!which!increased!the!cap!from!9%!in!2010!to!18%!today,!Boston’s!charter!school!
population!has!grown!from!5,273!in!2010G2011!to!9,251!in!2015G2016.!
Because!the!current!cap!is!on!Boston’s!charter!school!spending,!not!a!cap!on!students,!Boston!projects!
that!an!additional!4,368!students!could!attend!charter!schools!by!the!2025G2026!school!year.!This!
projection!is!based!on!the!roll!out!of!seats!already!approved!by!the!Commonwealth!and!the!availability!
of!more!seats!each!year!as!Boston’s!spending!in!support!of!education!grows.!
DRAFT

BOSTON&PUBLIC&SCHOOLS&!&NOVEMBER&2,&2016&DEMOGRAPHICS&REPORT&FACILITIES&MASTER&PLAN&
P A G E & 2 2 &
Due$to$the$continued$increase$in$allowable$charter$school$seats$as$a$function$of$the$district’s$expenditures,$Commonwealth$charter$schools$will$
continue$to$increase$and$to$impact$BPS$enrollment.$$In$2013,$the$Boston$Municipal$Research$Bureau$reported$that$between$2002$and$2012,$74%$of$
new$charter$school$students$in$grades$1H12$had$transferred$from$BPS$the$year$before4.$Applying$that$rate$over$the$next$ten$years,$it$is$projected$that$
BPS$will$lose$an$additional$3,232$students$to$charter$schools,$even$under$the$existing$charter$school$cap.$If$voters$approve$Ballot$Question$2$to$raise$
the$cap$on$charter$schools,$the$growth$in$charter$school$students$would$accelerate,$and$Boston$should$reexamine$its$BPS$demographic/enrollment$
projections.$For$more$detail,$see$Table&F$below,$which$illustrates$the$historical$changes$in$outHofHdistrict$enrollment$over$time.$
TABLE$F$
Ten)Year&Enrollment&of&School&)aged&Children&Living&in&Boston,&School&Year&2007&–&2016&
$ BPS(1)$ CHARTER
(2)$ METCO
(3)$ PRIVATE$ PAROCHIAL$ OTHER
(4)$ TOTAL$
2015)16& 56,520$ 72.5%$ 9,240$ 11.9%$ 2,844$ 3.7%$ 4,262$ 5.5%$ 4,573$ 5.9%$ 470$ 0.60%$ 77,909&
2014)15& 56,956$ 73.1%$ 8,255$ 10.6%$ 2,815$ 3.6%$ 4,133$ 5.3%$ 5,278$ 6.8%$ 463$ 0.59%$ 77,900&
2013)14& 56,866$ 73.8%$ 7,139$ 9.3%$ 3,072$ 4.0%$ 4,091$ 5.3%$ 5,401$ 7.0%$ 435$ 0.56%$ 77,004&
2012)13& 56,905$ 73.9%$ 6,726$ 8.7%$ 3,088$ 4.0%$ 4,149$ 5.4%$ 5,713$ 7.4%$ 471$ 0.61%$ 77,052&
2011)12& 56,526$ 74.9%$ 5,467$ 7.2%$ 3,043$ 4.0%$ 4,063$ 5.4%$ 5,939$ 7.9%$ 458$ 0.61%$ 75,496&
2010)11& 56,731$ 76.3%$ 4,785$ 6.4%$ 2,903$ 3.9%$ 3,621$ 4.9%$ 5,884$ 7.9%$ 440$ 0.59%$ 74,364&
2009)10& 55,891$ 74.9%$ 4,663$ 6.3%$ 3,183$ 4.3%$ 3,709$ 5.0%$ 6,678$ 9.0%$ 458$ 0.61%$ 74,582&
2008)09& 55,927$ 75.0%$ 4,806$ 6.4%$ 3,142$ 4.2%$ 3,733$ 5.0%$ 6,555$ 8.8%$ 425$ 0.57%$ 74,588&
2007)08& 55,949$ 74.8%$ 4,372$ 5.8%$ 3,051$ 4.1%$ 3,651$ 4.9%$ 7,261$ 9.7%$ 486$ 0.65%$ 74,770&
2006)07& 56,957$ 74.6%$ 4,405$ 5.8%$ 3,034$ 4.0%$ 3,606$ 4.7%$ 7,906$ 10.4%$ 450$ 0.59%$ 76,358&
Source:$BPS$Records$Management$Unit$(RMU).$
Notes:$
1. Boston$Public$School$students,$including$students$attending$an$inHdistrict$Horace$Mann$Charter$School$
2. Commonwealth$Charter$School$students$
3. Metropolitan$Cooperative$students$attending$a$public$school$in$another$school$district$
4. Includes$privately$placed$Special$Education,$educational$collaborative,$homeschooled$students$and$other$placement
$$$$$$$$$$$$$$$$$$$$$$$$$$$$$$$$$$$$$$$$$$$$$$$$$$$$$$$$$$$$$4$Boston$Municipal$Research$Bureau$Special$Report;$September$18,$2013.$

BOSTON&PUBLIC&SCHOOLS&!&NOVEMBER&2,&2016&DEMOGRAPHICS&REPORT&FACILITIES&MASTER&PLAN&
P A G E & 2 3 &
ENROLLMENT PROJECTION METHODOLOGY
MGT’s&enrollment&projections&are&based&on&a&compilation&of&the&following&four,&nationally&recognized&demographic&models:&
AVERAGE PERCENTAGE ANNUAL INCREASE MODEL
This&model&calculates&future&school&enrollment&growth&based&on&the&historical&average&growth&from&year&to&year&for&each&grade&level.&&This&simple&model&multiplies&the&historical&average&percentage&increase&(or&decrease)&by&the&prior&year’s&enrollment&to&project&future&enrollment&estimates.&&For&example,&if&enrollment&in&the&first&grade&decreased&five&percent&from&2000&to&2001&and&decreased&seven&percent&from&2001&to&2002,&then&the&average&percentage&change&would&be&a&six&percent&decrease,&and&six&percent&would&be&the&factor&used&to&project&future&first&grade&enrollment&in&this&model.&
LINEAR REGRESSION MODEL
This&model&uses&a&statistical&approach&to&estimating&an&unknown&future&value&of&a&variable&by&performing&calculations&on&known&historical&values.&&Once&calculated,&future&values&for&different&future&dates&can&then&be&plotted&to&provide&a&“regression&line”&or&“trend&line.”&&MGT&has&chosen&a&“straightKline”&model&to&estimate&future&enrollment&values,&a&model&that&finds&the&“best&fit”&based&on&the&historical&data.&
COHORT SURVIVAL MODEL
This&model&calculates&the&growth&or&decline&between&grade&levels&over&a&period&of&ten&years&based&on&the&ratio&of&students&who&attend&each&of&the&subsequent&years,&or&the&“survival&rate.”&&This&ratio&is&then&applied&to&the&incoming&class&to&calculate&the&trends&in&that&class&as&it&“moves”&or&graduates&through&the&school&system.&&For&example,&if&history&shows&that&between&the&first&and&second&grades,&the&classes&for&the&last&ten&years&have&grown&by&an&average&of&3.5%,&then&the&size&of&incoming&classes&for&the&next&ten&years&is&calculated&by&multiplying&them&by&103.5%.&&If&the&history&shows&a&declining&trend,&the&multiplying&factor&would&be&100%&minus&the&declining&trend&number.&
The&determination&of&future&kindergarten&enrollment&estimates&is&critical,&especially&for&projections&exceeding&more&than&five&years.&&There&are&two&methods&of&projecting&kindergarten&enrollment.&&The&first&model&is&based&on&the&correlation&between&historical&resident&birth&rates&(natality&rates)&and&historical&kindergarten&enrollment.&&The&second&model&uses&a&linear®ression&line&based&on&the&historical&kindergarten&enrollment&data.&&The&correlation&method&was&used&for&BPS&due&to&a&seemingly&more&accurate&longitudinal&projection&between&live&births&and&kindergarten&enrollment.&&
STUDENTS-PER-HOUSEHOLD MODEL
This&last&model&utilizes&the&estimated&number&of&housing&units&as&its&base&data.&&Using&the&housing&unit&data&and&historical&enrollment&data,&MGT&created&a&student&generation&factor&for&each&projected&grade&level.&&By&taking&the&total&enrollment&by&grade&level&and&dividing&it&by&the¤t&housing&levels,&a&student'generation'factor&(SGF)&was&calculated&for&each&grade&level.&&This&factor&indicates&the&number&of&students&within&each&grade&level&that&will&be&generated&by&each&new&housing&unit.&
WEIGHTED MODEL
Once&each&of&these&four&base&models&has&been&calculated,&MGT&generates&a&weighted&average&of&each&of&the&models.&&A&weighted&average&allows&the&analysis&to&reflect&all&of&the&trends&observed&in&the&historical&
DRAFT

BOSTON&PUBLIC&SCHOOLS&!&NOVEMBER&2,&2016&DEMOGRAPHICS&REPORT&FACILITIES&MASTER&PLAN!
P A G E & 2 4 &
&
data&and&the&overKarching&themes&from&the&qualitative&information&gathered&in&this&process.&&The&weighted&average&also&works&to&maximize&the&strengths&of&each&of&the&“base”&models.&
Two&models,&the&Average&Percentage&Annual&Increase&Model&and&the&Linear&Regression&Model,&emphasize&historical&data.&&These&models&are&quite&effective&predictors&if&there&is&no&expectation&of&unusual&community&growth&or&decline&and&student&population&rates&have&minimal&fluctuation.&
The&Cohort&Survival&Model&also&uses&historical&enrollment&numbers&but&takes&into&account&studentKmobility&patterns&and&the&effects&of&the&natality&rates&in&prior&years.&&The&Cohort&Survival&Model&is&perhaps&the&bestKknown&predictive&tool&using&this&type&of&data.&&However,&like&the&Annual&Percentage&Annual&Increase&Model&and&the&Linear&Regression&Model,&the&Cohort&Survival&Model&loses&its&predictive&capabilities&in&communities&that&experience,&or&are&expecting&to&experience,&more&rapid&growth&or&rapid&decline.&
The&StudentsKPerKHousehold&Model&allows&the&planner&to&take&into&account&projections&for&housing&developments&and&general&growth&in&the&City.&&This&model&looks&forward&and&is&based&on&input&from&local&planners.&&The&planning&information&is&important&and&the&district&should&continue&to&monitor&this&information.&The&Demographics&Advisory&Committee&agreed&to&weight&the&models&equally&for&the&purpose&of&controlling&any&one&model&from&over&emphasizing&or&influencing&the&total&projections.&
Exhibit'12&illustrates&the&four&enrollment&projection&models&and&the&one&combined&weighted&model.&
EXHIBIT&12&
&Source:&MGT,&2016.&
&
DRAFT

BOSTON&PUBLIC&SCHOOLS&!&NOVEMBER&2,&2016&DEMOGRAPHICS&REPORT&FACILITIES&MASTER&PLAN!
P A G E & 2 5 &
&
LIVE BIRTHS AND KINDERGARTEN ENROLLMENT
Boston&has&shown&a&fluctuating&birth&rate&that&has&had&little&influence&on&kindergarten&enrollment.&
A&second&key&component&to&analyzing&potential&future&enrollment&is&to&examine&live&birth&trends&in&the&area&and&the&liveKbirthsKtoKkindergarten&capture&rate.&&A&steady&or&increasing&birth&rate&could&lead&to&additional&students&in&the&district,&which&would&also&push&future&enrollment&higher.&&The&number&of&live&births&in&Boston&has&fluctuated&between&a&low&of&7,554&in&2015&to&a&high&of&8,231&in&2001.&&
Exhibit'13'shows&the&trend&of&historical&live&births&for&Boston.&
EXHIBIT&13&
&*2015&estimated&via&linear®ression.&Source:&Massachusetts&Executive&Office&of&Health&and&Human&Services,&2016.&
& &
DRAFT

BOSTON&PUBLIC&SCHOOLS&!&NOVEMBER&2,&2016&DEMOGRAPHICS&REPORT&FACILITIES&MASTER&PLAN!
P A G E & 2 6 &
&
For&the&examination&of&the&ratio&of&liveKbirthsKtoKkindergarten&enrollment,&we&have&used&live&birth&data&for&the&past&15&years&and&kindergarten&enrollment&for&the&past&ten&years.&&For&example,&a&child&born&in&1990&would&enroll&in&kindergarten&at&the&age&of&five&in&1995.&&Therefore,&in&this&analysis,&we&are&looking&at&how&many&children&are&enrolled&in&kindergarten&as&compared&to&the&number&of&children&born&in&the&area&five&years&prior&to&a&particular&school&year.&&&
Exhibit'14'compares&the&district’s&historical&kindergarten&enrollment&to&the&live&birth&data.&
EXHIBIT&14&
&Source:&MGT,&2016.&
Two&statistics&are&critical&to&understanding&the&relationship&between&live&births&and&kindergarten&enrollment&in&the&district:&&the&correlation&coefficient&and&the&capture&rate.&
A&correlation&coefficient&calculates&the&relationship&between&two&series&of&data.&&A&correlation&coefficient&of&1&or&K1&indicates&a&strong&positive&or&negative&relationship;&a&correlation&coefficient&of&0&indicates&a&weak&relationship.&&For&BPS,&the&correlation&coefficient&for&live&birth&to&kindergarten&enrollment&is&K0.134&which&indicates&a&weak&relationship&–&meaning&that&the&data&cannot&predict&the&future.&& &
DRAFT

BOSTON&PUBLIC&SCHOOLS&!&NOVEMBER&2,&2016&DEMOGRAPHICS&REPORT&FACILITIES&MASTER&PLAN!
P A G E & 2 7 &
&
The&capture&rate&is&used&to&forecast&the&percentage&of&live&births&that&resulted&in&kindergarten&enrollment&five&years&later.&&Over&the&last&ten&years,&the&district’s&capture&rate&has&averaged&52.8%.&However,&the&capture&rate&has&been&decreasing&in&recent&years,&as&Exhibit'15'illustrates.&&Driving&this&weakened&coefficient&and&capture&rate&is&the&district’s&lack&of&appropriate&capacity&to&meet&the&demand&for&K0&and&K1&student&seats,&particularly&in&highKdemand&areas.&
EXHIBIT&15&
&Source:&MGT,&2016.&
& &
DRAFT

BOSTON&PUBLIC&SCHOOLS&!&NOVEMBER&2,&2016&DEMOGRAPHICS&REPORT&FACILITIES&MASTER&PLAN!
P A G E & 2 8 &
&
Exhibit'16&illustrates&the&projected&live&births&for&the&district.&&Live&births&are&projected&using&a&linear®ression&model&based&on&historical&live&births&in&Boston.&&
EXHIBIT&16&
&Source:&&MGT,&2016.&
&
DRAFT

BOSTON&PUBLIC&SCHOOLS&!&NOVEMBER&2,&2016&DEMOGRAPHICS&REPORT&FACILITIES&MASTER&PLAN&
P A G E & 2 9 &
HOUSING UNITS
After&a&significant&decline,&housing&units&have&generally&been&on&the&rise&in&Boston.&
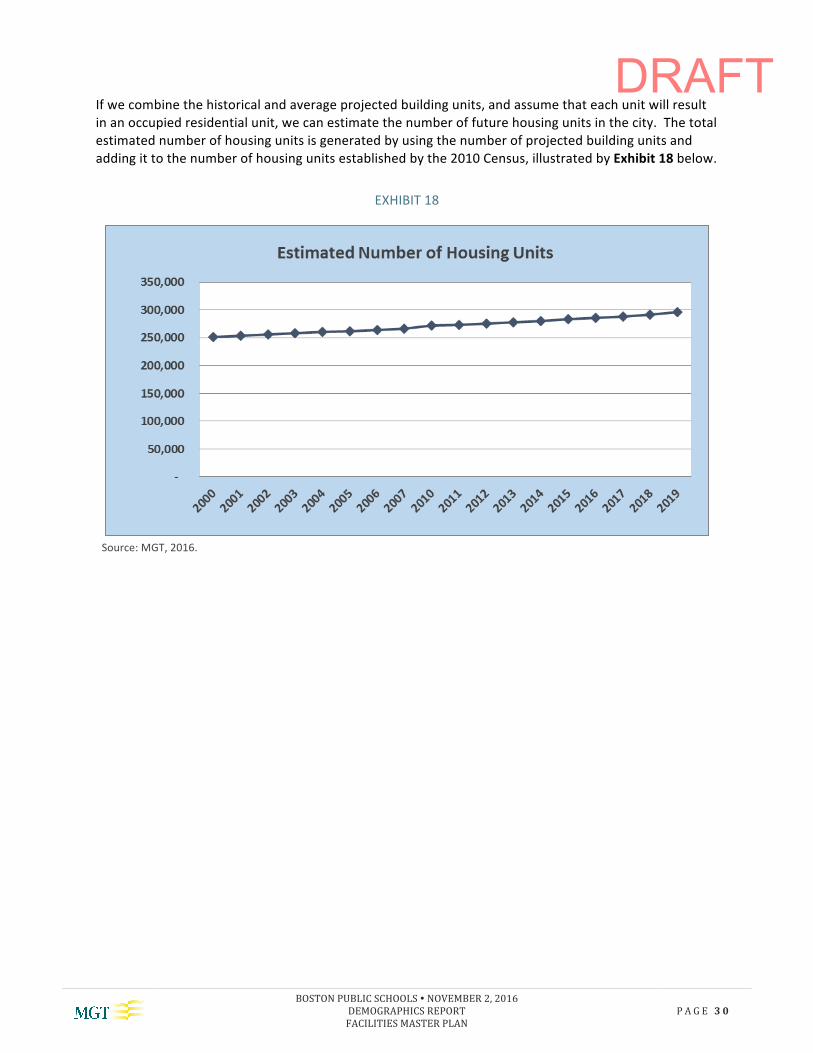
Another&approach&to&developing&enrollment&projections&is&to&conduct&an&analysis&of&the&trends&in&housing&units&in&the&city.&&The&U.S.&Census&Bureau&recorded&251,935&Boston&housing&units&in&the&2000&Census&and&272,481&housing&units&in&2010.&&&
Since&2006,&the&number&of&housing&permits&issued&each&year&in&Boston&has&fluctuated&greatly.&&In&an&effort&to&better&understand&these&fluctuations,&MGT&met&with&the&Boston&Planning&and&Development&Agency&planners&to&further&analyze&the&housing&permit&information.&&The&consensus&was&to&continue&to&use&census&data&as&the&default,&given&the&lack&of&an&alternative&data&source&or&the&availability&of&data&such&as&city&housing&permits.&&&
Exhibit'17&illustrates&the&number&of&housing&units&each&year&since&2006&in&Boston,&which&includes&both&singleK&and&multiKfamily&building&units.&&After&a&prolonged&decline&due&to&the&great&recession,&the&number&of&housing&units&has&generally&been&on&the&rise.&&&
EXHIBIT&17&HOUSING&UNITS&–&ALL&TYPES&&
&Source:&U.S.&Census&Bureau,&Building&Permits&Survey,&2010.&
& &
DRAFT
BOSTON&PUBLIC&SCHOOLS&!&NOVEMBER&2,&2016&DEMOGRAPHICS&REPORT&FACILITIES&MASTER&PLAN!
P A G E & 3 0 &
&
If&we&combine&the&historical&and&average&projected&building&units,&and&assume&that&each&unit&will&result&in&an&occupied&residential&unit,&we&can&estimate&the&number&of&future&housing&units&in&the&city.&&The&total&estimated&number&of&housing&units&is&generated&by&using&the&number&of&projected&building&units&and&adding&it&to&the&number&of&housing&units&established&by&the&2010&Census,&illustrated&by&Exhibit'18&below.&&&
EXHIBIT&18&
&Source:&MGT,&2016.&
DRAFT
BOSTON&PUBLIC&SCHOOLS&!&NOVEMBER&2,&2016&DEMOGRAPHICS&REPORT&FACILITIES&MASTER&PLAN&
P A G E & 3 1 &
ENROLLMENT PROJECTIONS
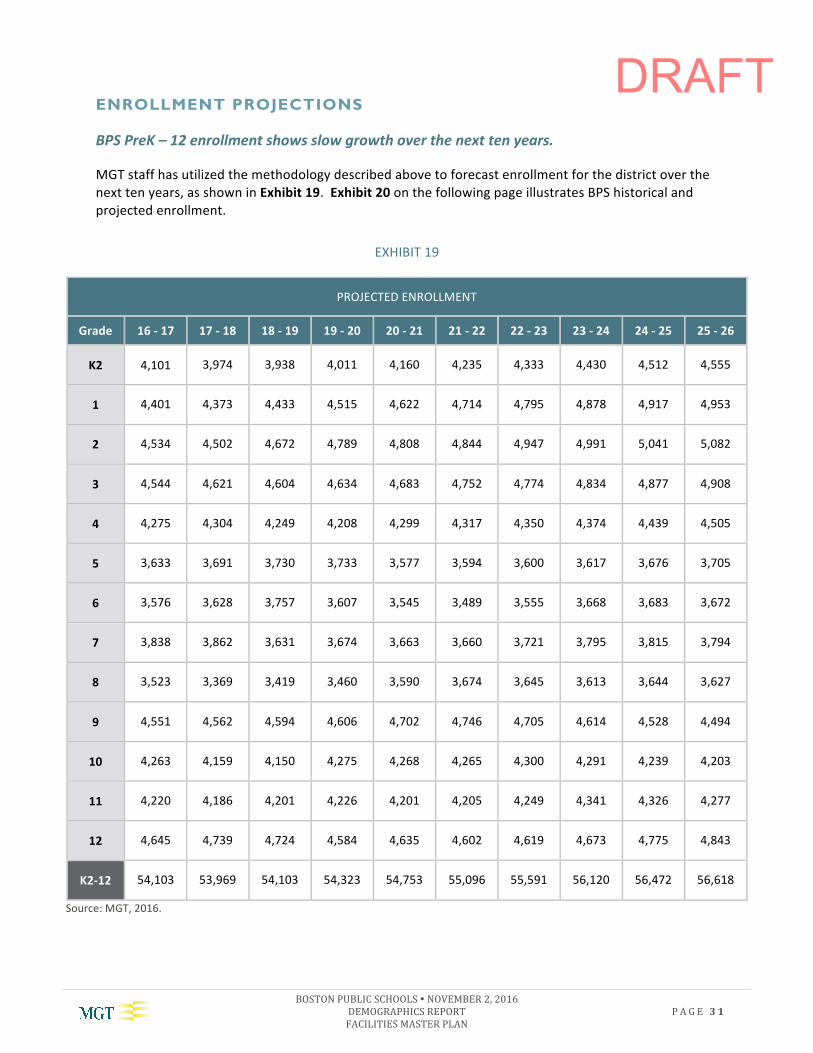
BPS&PreK&–&12&enrollment&shows&slow&growth&over&the&next&ten&years.&
MGT&staff&has&utilized&the&methodology&described&above&to&forecast&enrollment&for&the&district&over&the&next&ten&years,&as&shown&in'Exhibit'19.&&Exhibit'20&on&the&following&page&illustrates&BPS&historical&and&projected&enrollment.&
EXHIBIT&19&
PROJECTED&ENROLLMENT&
Grade& 16'7'17& 17'7'18& 18'7'19& 19'7'20& 20'7'21& 21'7'22& 22'7'23& 23'7'24& 24'7'25& 25'7'26&
K2& 4,101& 3,974& 3,938& 4,011& 4,160& 4,235& 4,333& 4,430& 4,512& 4,555&
1& 4,401& 4,373& 4,433& 4,515& 4,622& 4,714& 4,795& 4,878& 4,917& 4,953&
2& 4,534& 4,502& 4,672& 4,789& 4,808& 4,844& 4,947& 4,991& 5,041& 5,082&
3& 4,544& 4,621& 4,604& 4,634& 4,683& 4,752& 4,774& 4,834& 4,877& 4,908&
4& 4,275& 4,304& 4,249& 4,208& 4,299& 4,317& 4,350& 4,374& 4,439& 4,505&
5& 3,633& 3,691& 3,730& 3,733& 3,577& 3,594& 3,600& 3,617& 3,676& 3,705&
6& 3,576& 3,628& 3,757& 3,607& 3,545& 3,489& 3,555& 3,668& 3,683& 3,672&
7& 3,838& 3,862& 3,631& 3,674& 3,663& 3,660& 3,721& 3,795& 3,815& 3,794&
8& 3,523& 3,369& 3,419& 3,460& 3,590& 3,674& 3,645& 3,613& 3,644& 3,627&
9& 4,551& 4,562& 4,594& 4,606& 4,702& 4,746& 4,705& 4,614& 4,528& 4,494&
10& 4,263& 4,159& 4,150& 4,275& 4,268& 4,265& 4,300& 4,291& 4,239& 4,203&
11& 4,220& 4,186& 4,201& 4,226& 4,201& 4,205& 4,249& 4,341& 4,326& 4,277&
12& 4,645& 4,739& 4,724& 4,584& 4,635& 4,602& 4,619& 4,673& 4,775& 4,843&
K2712& 54,103& 53,969& 54,103& 54,323& 54,753& 55,096& 55,591& 56,120& 56,472& 56,618&
Source:&MGT,&2016.&
& &
DRAFT

BOSTON&PUBLIC&SCHOOLS&!&NOVEMBER&2,&2016&DEMOGRAPHICS&REPORT&FACILITIES&MASTER&PLAN!
P A G E & 3 2 &
&
EXHIBIT&20&
&Source:&MGT,&2016.&
&
DRAFT

BOSTON&PUBLIC&SCHOOLS&!&NOVEMBER&2,&2016&DEMOGRAPHICS&REPORT&FACILITIES&MASTER&PLAN!
P A G E & 3 3 &
&
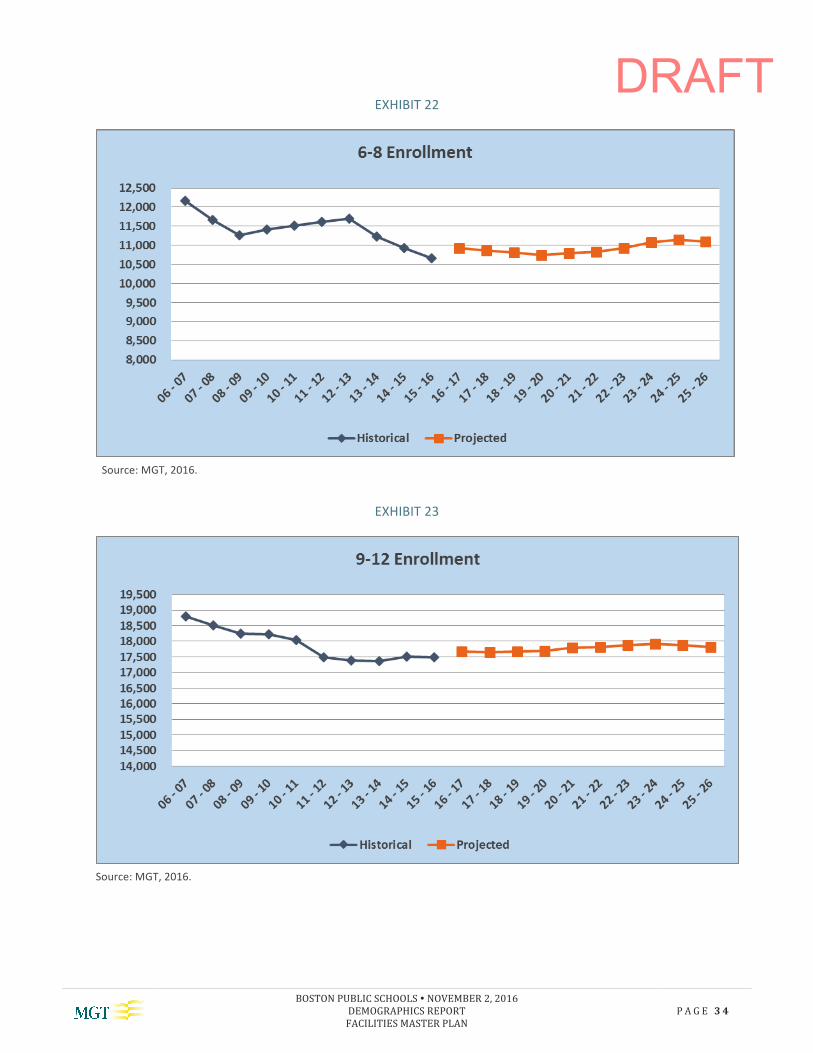
GRADE BAND PROJECTED ENROLLMENT
The&District&is&strongly&encouraged&to&continue&revisiting&these&projections&on&an&annual&basis&and&to&update&them&to&reflect¤t&trends&and&data.&&The&following&Exhibits'21&through&23'illustrate&the&historical&and&projected&enrollment&at&each&grade&band,&with&Table'G&as&a&reference&of&projected&enrollment&by&grade&band.&
TABLE&G&PROJECTED&ENROLLMENT&BY&GRADE&BAND&
Grade& 16'7'17& 17'7'18& 18'7'19& 19'7'20& 20'7'21& 21'7'22& 22'7'23& 23'7'24& 24'7'25& 25'7'26&
K275' 25,488& 25,464& 25,627& 25,890& 26,149& 26,455& 26,798& 27,124& 27,461& 27,708&
678& 10,937& 10,859& 10,807& 10,741& 10,799& 10,823& 10,921& 11,077& 11,142& 11,093&
9712& 17,678& 17,646& 17,669& 17,692& 17,805& 17,818& 17,872& 17,919& 17,868& 17,817&
K2712& 54,103& 53,969& 54,103& 54,323& 54,753& 55,096& 55,591& 56,120& 56,472& 56,618&
&
EXHIBIT&21&
&Source:&MGT,&2016.&
& &
DRAFT
BOSTON&PUBLIC&SCHOOLS&!&NOVEMBER&2,&2016&DEMOGRAPHICS&REPORT&FACILITIES&MASTER&PLAN!
P A G E & 3 4 &
&
EXHIBIT&22&
&Source:&MGT,&2016.&
EXHIBIT&23&
&Source:&MGT,&2016.&
DRAFT

BOSTON&PUBLIC&SCHOOLS&!&NOVEMBER&2,&2016&DEMOGRAPHICS&REPORT&FACILITIES&MASTER&PLAN&
P A G E & 3 5 &
CONCLUSIONS, OBSERVATIONS AND NEXT STEPS
The&demographic&analysis&shows&the&historical&and&tenKyear&potential&school&age&population&trends.&The&study&also&reveals&where&the&children&are&based&through&Global&Information&System&(GIS)&mapping,&as&provided&by&BPS.&The&report&highlights&where&particular&populations,&such&as&students&with&disabilities&and&English&Language&Learners,&are&most&concentrated,&providing&BPS&with&insight&into&where&program&and&space&needs&could&be&evolving&across&the&district.&The&report&will&help&BPS&to&locate&particular&populations&of&students,&or&to&examine&the&addition&of&necessary&seats&in&neighborhoods&where&there&is&overcrowding.&&
As&described&earlier,&enrollment&across&the&district&is&expected&to&grow&at&a&rate&of&2,515&students&in&the&next&ten&years,&or&approximately&0.4&percent.&As&previously&mentioned,&this&study&points&to&a&number&of&factors&that&are&contributing&to&the&modest&enrollment&growth.&Those&factors&include:&
" An&aging&Boston&population&
" A&relatively&small&increase&in&birth&to&ageK5&population&
" A&reduction&in&the&population&segments&ranging&between&6K19&years&of&age&
" A&growth&in&charter&school&enrollment,&which&draw&students&away&from&district&schools&
&
DRAFT

BOSTON&PUBLIC&SCHOOLS&!&NOVEMBER&2,&2016&DEMOGRAPHICS&REPORT&FACILITIES&MASTER&PLAN&
P A G E & 3 6 &
APPENDIX A
ENROLLMENT COMPARISON CHARTS
&
DRAFT

Enrollment Projection Models Comparison
TOTAL PROJECTED ENROLLMENT Analysis
Model 16 - 17 17 - 18 18 - 19 19 - 20 20 - 21 21 - 22 22 - 23 23 - 24 24 - 25 25 - 26 Maximum Minimum Mean Median Change % Change
Average Percentage Growth 53,475 53,411 53,418 53,470 53,465 53,540 53,672 53,786 53,818 53,859 53,859 53,411 53,591 53,507 384 0.72%
Students Per Household 56,867 57,381 57,998 58,844 59,967 61,250 62,570 63,843 64,979 66,181 66,181 56,867 60,988 60,608 9,313 16.38%
Cohort Survival 53,017 52,572 52,010 51,701 51,991 52,177 52,434 52,710 52,835 52,797 53,017 51,701 52,424 52,503 (220) -0.41%
Linear Regression 53,052 52,513 52,987 53,276 53,589 53,419 53,686 54,141 54,255 53,636 54,255 52,513 53,455 53,504 584 1.10%
50,000 52,000 54,000 56,000 58,000 60,000 62,000 64,000 66,000 68,000
Base Models Comparison -Total Projected Enrollment
Average Percentage Growth Students Per HouseholdCohort Survival Linear Regression
50,000 52,000 54,000 56,000 58,000 60,000 62,000 64,000 66,000 68,000
Base Models Comparison Total Projected Enrollment
Historical Ave Pct GrowthStudents Per Household Cohort Survival
TOTAL PROJECTED ENROLLMENT Analysis
Model 16 - 17 17 - 18 18 - 19 19 - 20 20 - 21 21 - 22 22 - 23 23 - 24 24 - 25 25 - 26 Maximum Minimum Mean Median Change % Change
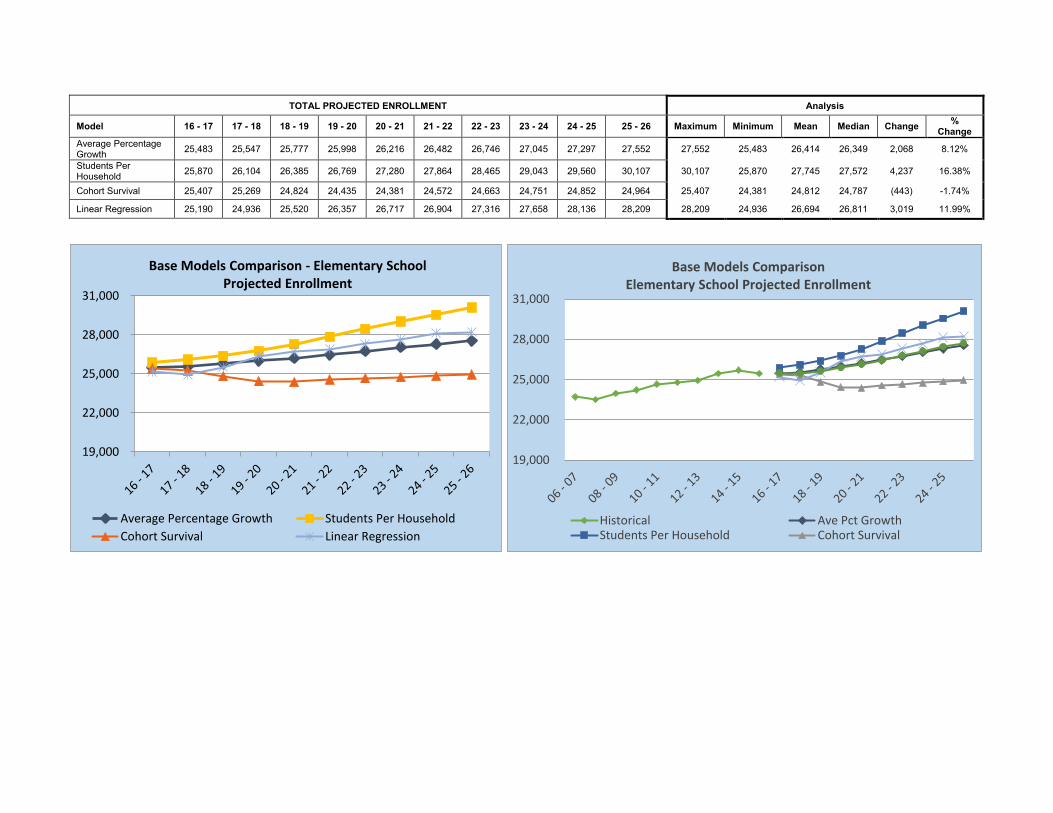
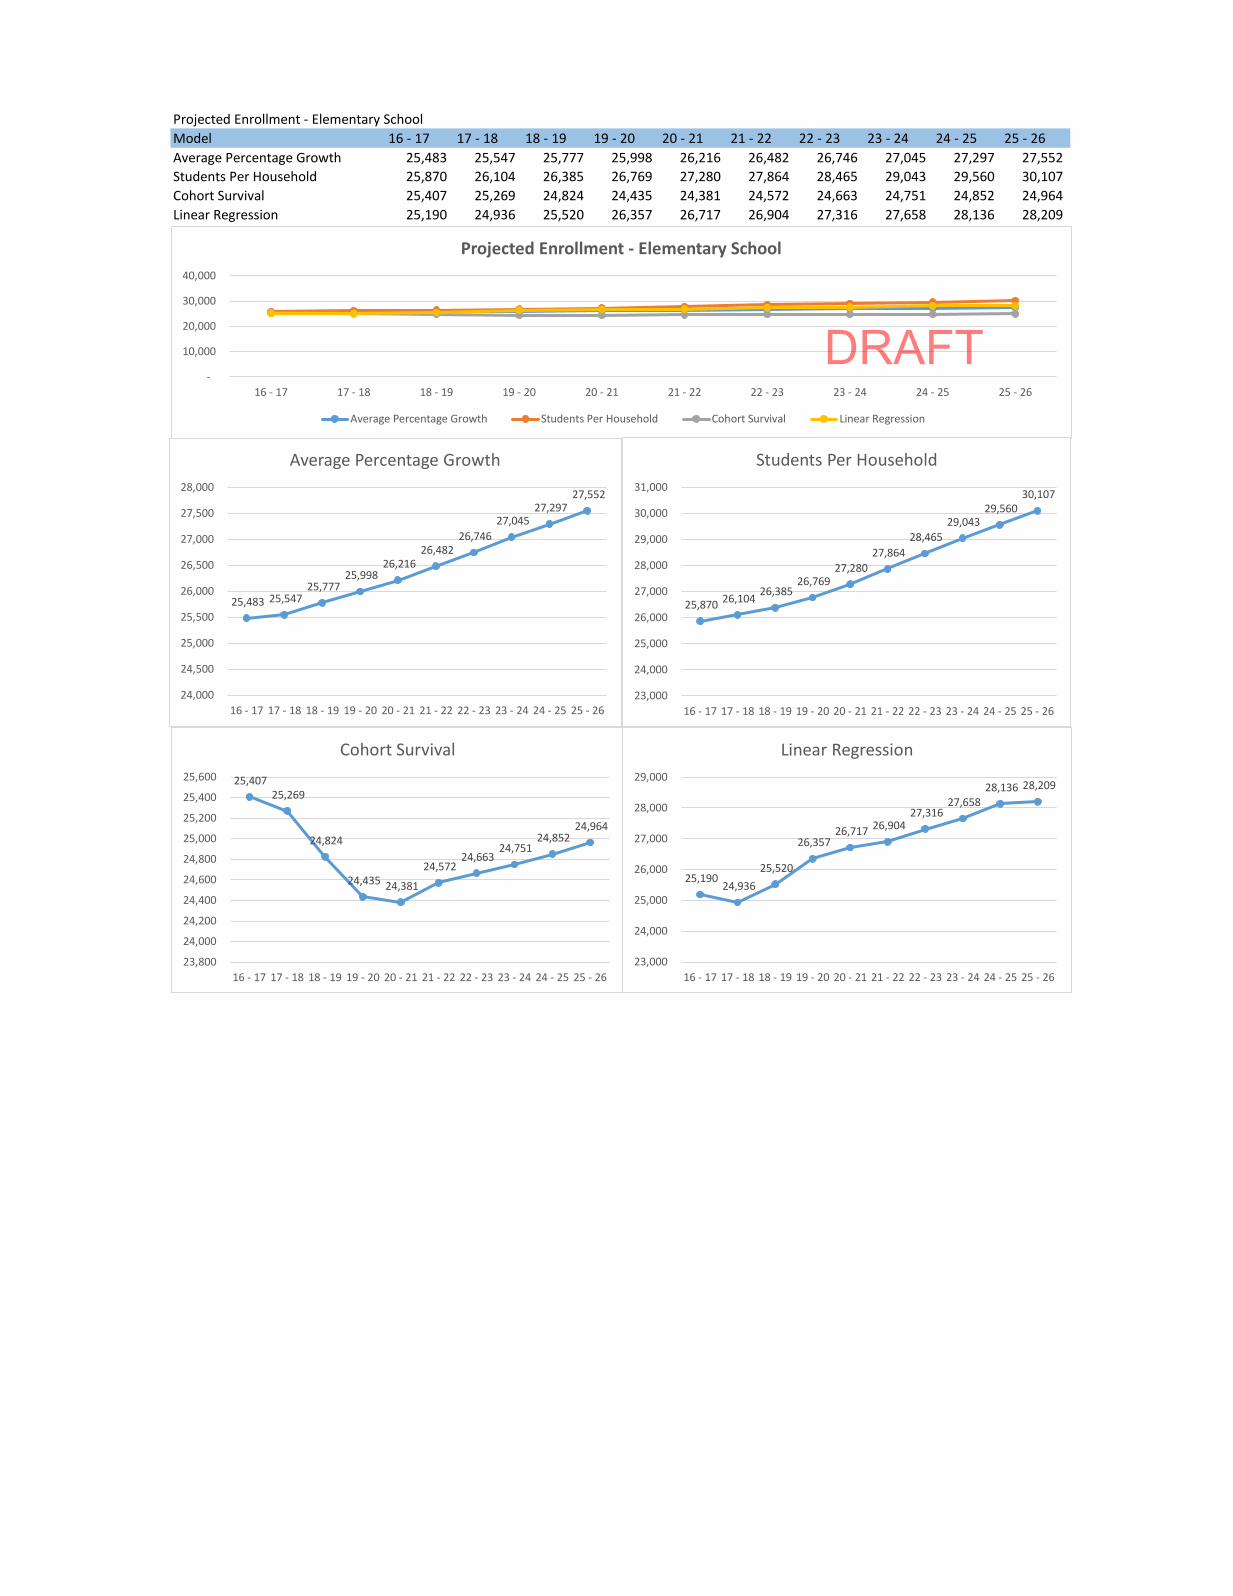
Average Percentage Growth 25,483 25,547 25,777 25,998 26,216 26,482 26,746 27,045 27,297 27,552 27,552 25,483 26,414 26,349 2,068 8.12%
Students Per Household 25,870 26,104 26,385 26,769 27,280 27,864 28,465 29,043 29,560 30,107 30,107 25,870 27,745 27,572 4,237 16.38%
Cohort Survival 25,407 25,269 24,824 24,435 24,381 24,572 24,663 24,751 24,852 24,964 25,407 24,381 24,812 24,787 (443) -1.74%
Linear Regression 25,190 24,936 25,520 26,357 26,717 26,904 27,316 27,658 28,136 28,209 28,209 24,936 26,694 26,811 3,019 11.99%
19,000
22,000
25,000
28,000
31,000
Base Models Comparison - Elementary School Projected Enrollment
Average Percentage Growth Students Per HouseholdCohort Survival Linear Regression
19,000
22,000
25,000
28,000
31,000
Base Models ComparisonElementary School Projected Enrollment
Historical Ave Pct GrowthStudents Per Household Cohort Survival

TOTAL PROJECTED ENROLLMENT Analysis
Model 16 - 17 17 - 18 18 - 19 19 - 20 20 - 21 21 - 22 22 - 23 23 - 24 24 - 25 25 - 26 Maximum Minimum Mean Median Change % Change
Average Percentage Growth 10,435 10,227 9,949 9,766 9,635 9,547 9,501 9,416 9,300 9,186 10,435 9,186 9,696 9,591 (1,249) -11.97%
Students Per Household 12,080 12,189 12,320 12,499 12,738 13,010 13,291 13,561 13,803 14,058 14,058 12,080 12,955 12,874 1,978 16.38%
Cohort Survival 10,836 10,892 11,165 11,455 11,470 11,106 10,948 11,045 11,259 11,285 11,470 10,836 11,146 11,136 449 4.14%
Linear Regression 10,396 10,129 9,795 9,244 9,352 9,630 9,944 10,283 10,208 9,844 10,396 9,244 9,882 9,894 (552) -5.31%
8,000 9,000
10,000 11,000 12,000 13,000 14,000 15,000
Base Models Comparison -Middle School Projected Enrollment
Average Percentage Growth Students Per HouseholdCohort Survival Linear Regression
8,000
9,000
10,000
11,000
12,000
13,000
14,000
15,000
6-8 Model Comparison
Historical Ave Pct GrowthStudents Per Household Cohort Survival
TOTAL PROJECTED ENROLLMENT Analysis
Model 16 - 17 17 - 18 18 - 19 19 - 20 20 - 21 21 - 22 22 - 23 23 - 24 24 - 25 25 - 26 Maximum Minimum Mean Median Change % Change
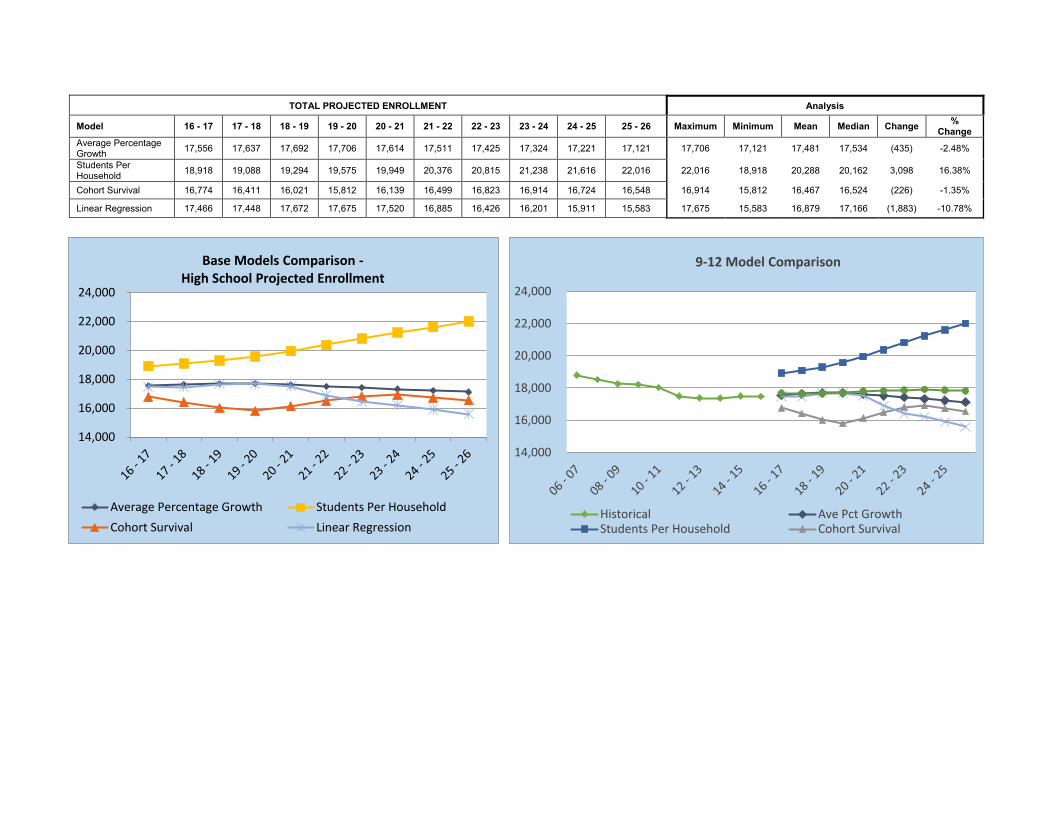
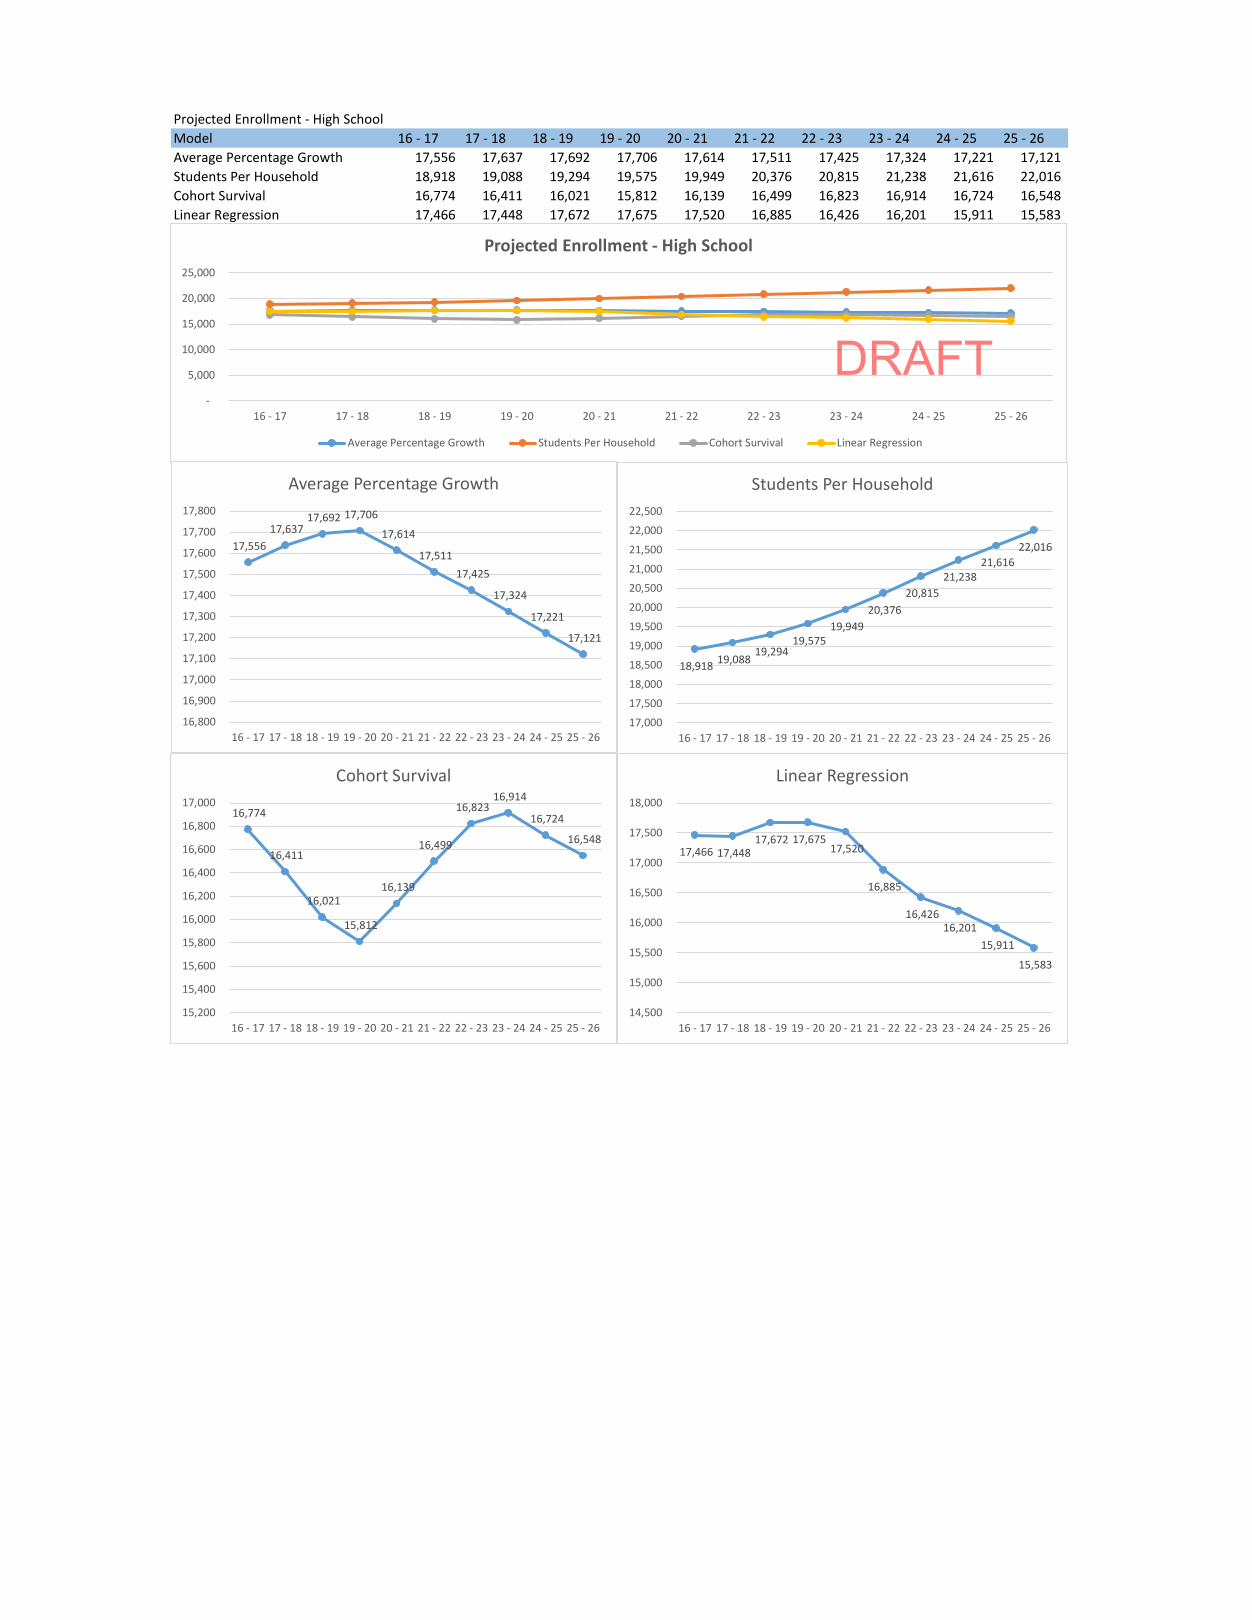
Average Percentage Growth 17,556 17,637 17,692 17,706 17,614 17,511 17,425 17,324 17,221 17,121 17,706 17,121 17,481 17,534 (435) -2.48%
Students Per Household 18,918 19,088 19,294 19,575 19,949 20,376 20,815 21,238 21,616 22,016 22,016 18,918 20,288 20,162 3,098 16.38%
Cohort Survival 16,774 16,411 16,021 15,812 16,139 16,499 16,823 16,914 16,724 16,548 16,914 15,812 16,467 16,524 (226) -1.35%
Linear Regression 17,466 17,448 17,672 17,675 17,520 16,885 16,426 16,201 15,911 15,583 17,675 15,583 16,879 17,166 (1,883) -10.78%
14,000
16,000
18,000
20,000
22,000
24,000
Base Models Comparison -High School Projected Enrollment
Average Percentage Growth Students Per HouseholdCohort Survival Linear Regression
14,000
16,000
18,000
20,000
22,000
24,000
9-12 Model Comparison
Historical Ave Pct GrowthStudents Per Household Cohort Survival

Distrct TOTAL PROJECTED ENROLLMENT 16 - 17 17 - 18 18 - 19 19 - 20 20 - 21 21 - 22 22 - 23 23 - 24 24 - 25 25 - 26Average Percentage Growth 53,475 53,411 53,418 53,470 53,465 53,540 53,672 53,786 53,818 53,859 Students Per Household 56,867 57,381 57,998 58,844 59,967 61,250 62,570 63,843 64,979 66,181 Cohort Survival 53,017 52,572 52,010 51,701 51,991 52,177 52,434 52,710 52,835 52,797 Linear Regression 53,052 52,513 52,987 53,276 53,589 53,419 53,686 54,141 54,255 53,636
30,000
35,000
40,000
45,000
50,000
55,000
60,000
65,000
70,000
16 - 17 17 - 18 18 - 19 19 - 20 20 - 21 21 - 22 22 - 23 23 - 24 24 - 25 25 - 26
Model Comparison Projected Enrollment
Average Percentage Growth Students Per Household Cohort Survival Linear Regression
57,381 57,998 58,844
59,967 61,250
62,570 63,843
64,979 66,181
52,000
54,000
56,000
58,000
60,000
62,000
64,000
66,000
68,000
17 - 18 18 - 19 19 - 20 20 - 21 21 - 22 22 - 23 23 - 24 24 - 25 25 - 26
Students Per Household
53,475 53,411 53,418
53,470 53,465 53,540
53,672
53,786 53,818
53,859
53,100
53,200
53,300
53,400
53,500
53,600
53,700
53,800
53,900
16 - 17 17 - 18 18 - 19 19 - 20 20 - 21 21 - 22 22 - 23 23 - 24 24 - 25 25 - 26
Average Percentage Growth
53,017
52,572
52,010
51,701
51,991 52,177
52,434
52,710 52,835 52,797
51,000
51,500
52,000
52,500
53,000
53,500
16 - 17 17 - 18 18 - 19 19 - 20 20 - 21 21 - 22 22 - 23 23 - 24 24 - 25 25 - 26
Cohort Survival
53,052
52,513
52,987
53,276
53,589 53,419
53,686
54,141 54,255
53,636
51,500
52,000
52,500
53,000
53,500
54,000
54,500
16 - 17 17 - 18 18 - 19 19 - 20 20 - 21 21 - 22 22 - 23 23 - 24 24 - 25 25 - 26
Linear Regression
0
10000
20000
30000
40000
50000
60000
K-12 Enrollment
Historical Projected
DRAFT
Projected Enrollment - Elementary SchoolModel 16 - 17 17 - 18 18 - 19 19 - 20 20 - 21 21 - 22 22 - 23 23 - 24 24 - 25 25 - 26Average Percentage Growth 25,483 25,547 25,777 25,998 26,216 26,482 26,746 27,045 27,297 27,552 Students Per Household 25,870 26,104 26,385 26,769 27,280 27,864 28,465 29,043 29,560 30,107 Cohort Survival 25,407 25,269 24,824 24,435 24,381 24,572 24,663 24,751 24,852 24,964 Linear Regression 25,190 24,936 25,520 26,357 26,717 26,904 27,316 27,658 28,136 28,209
-
10,000
20,000
30,000
40,000
16 - 17 17 - 18 18 - 19 19 - 20 20 - 21 21 - 22 22 - 23 23 - 24 24 - 25 25 - 26
Projected Enrollment - Elementary School
Average Percentage Growth Students Per Household Cohort Survival Linear Regression
25,483 25,547 25,777
25,998 26,216
26,482 26,746
27,045 27,297
27,552
24,000
24,500
25,000
25,500
26,000
26,500
27,000
27,500
28,000
16 - 17 17 - 18 18 - 19 19 - 20 20 - 21 21 - 22 22 - 23 23 - 24 24 - 25 25 - 26
Average Percentage Growth
25,870 26,104 26,385 26,769
27,280 27,864
28,465 29,043
29,560 30,107
23,000
24,000
25,000
26,000
27,000
28,000
29,000
30,000
31,000
16 - 17 17 - 18 18 - 19 19 - 20 20 - 21 21 - 22 22 - 23 23 - 24 24 - 25 25 - 26
Students Per Household
25,407 25,269
24,824
24,435 24,381
24,572 24,663
24,751 24,852
24,964
23,800
24,000
24,200
24,400
24,600
24,800
25,000
25,200
25,400
25,600
16 - 17 17 - 18 18 - 19 19 - 20 20 - 21 21 - 22 22 - 23 23 - 24 24 - 25 25 - 26
Cohort Survival
25,190 24,936
25,520
26,357 26,717 26,904
27,316 27,658
28,136 28,209
23,000
24,000
25,000
26,000
27,000
28,000
29,000
16 - 17 17 - 18 18 - 19 19 - 20 20 - 21 21 - 22 22 - 23 23 - 24 24 - 25 25 - 26
Linear Regression
DRAFT

Projected Enrollment - Middle SchoolModel 16 - 17 17 - 18 18 - 19 19 - 20 20 - 21 21 - 22 22 - 23 23 - 24 24 - 25 25 - 26Average Percentage Growth 10,435 10,227 9,949 9,766 9,635 9,547 9,501 9,416 9,300 9,186 Students Per Household 12,080 12,189 12,320 12,499 12,738 13,010 13,291 13,561 13,803 14,058 Cohort Survival 10,836 10,892 11,165 11,455 11,470 11,106 10,948 11,045 11,259 11,285 Linear Regression 10,396 10,129 9,795 9,244 9,352 9,630 9,944 10,283 10,208 9,844
-
2,000
4,000
6,000
8,000
10,000
12,000
14,000
16,000
16 - 17 17 - 18 18 - 19 19 - 20 20 - 21 21 - 22 22 - 23 23 - 24 24 - 25 25 - 26
Projected Enrollment - Middle School
Average Percentage Growth Students Per Household Cohort Survival Linear Regression
10,435 10,227
9,949 9,766
9,635 9,547 9,501 9,416
9,300 9,186
8,400 8,600 8,800 9,000 9,200 9,400 9,600 9,800
10,000 10,200 10,400 10,600
16 - 17 17 - 18 18 - 19 19 - 20 20 - 21 21 - 22 22 - 23 23 - 24 24 - 25 25 - 26
Average Percentage Growth
12,080 12,189 12,320 12,499
12,738 13,010
13,291 13,561
13,803 14,058
11,000
11,500
12,000
12,500
13,000
13,500
14,000
14,500
16 - 17 17 - 18 18 - 19 19 - 20 20 - 21 21 - 22 22 - 23 23 - 24 24 - 25 25 - 26
Students Per Household
10,836 10,892
11,165
11,455 11,470
11,106
10,948 11,045
11,259 11,285
10,500
10,600
10,700
10,800
10,900
11,000
11,100
11,200
11,300
11,400
11,500
11,600
16 - 17 17 - 18 18 - 19 19 - 20 20 - 21 21 - 22 22 - 23 23 - 24 24 - 25 25 - 26
Cohort Survival
10,396
10,129
9,795
9,244 9,352
9,630
9,944
10,283 10,208
9,844
8,600
8,800
9,000
9,200
9,400
9,600
9,800
10,000
10,200
10,400
10,600
16 - 17 17 - 18 18 - 19 19 - 20 20 - 21 21 - 22 22 - 23 23 - 24 24 - 25 25 - 26
Linear Regression
DRAFT
Projected Enrollment - High SchoolModel 16 - 17 17 - 18 18 - 19 19 - 20 20 - 21 21 - 22 22 - 23 23 - 24 24 - 25 25 - 26Average Percentage Growth 17,556 17,637 17,692 17,706 17,614 17,511 17,425 17,324 17,221 17,121 Students Per Household 18,918 19,088 19,294 19,575 19,949 20,376 20,815 21,238 21,616 22,016 Cohort Survival 16,774 16,411 16,021 15,812 16,139 16,499 16,823 16,914 16,724 16,548 Linear Regression 17,466 17,448 17,672 17,675 17,520 16,885 16,426 16,201 15,911 15,583
-
5,000
10,000
15,000
20,000
25,000
16 - 17 17 - 18 18 - 19 19 - 20 20 - 21 21 - 22 22 - 23 23 - 24 24 - 25 25 - 26
Projected Enrollment - High School
Average Percentage Growth Students Per Household Cohort Survival Linear Regression
17,556 17,637
17,692 17,706
17,614
17,511 17,425
17,324
17,221
17,121
16,800
16,900
17,000
17,100
17,200
17,300
17,400
17,500
17,600
17,700
17,800
16 - 17 17 - 18 18 - 19 19 - 20 20 - 21 21 - 22 22 - 23 23 - 24 24 - 25 25 - 26
Average Percentage Growth
18,918 19,088 19,294
19,575 19,949
20,376 20,815
21,238 21,616
22,016
17,000
17,500
18,000
18,500
19,000
19,500
20,000
20,500
21,000
21,500
22,000
22,500
16 - 17 17 - 18 18 - 19 19 - 20 20 - 21 21 - 22 22 - 23 23 - 24 24 - 25 25 - 26
Students Per Household
16,774
16,411
16,021
15,812
16,139
16,499
16,823 16,914
16,724
16,548
15,200
15,400
15,600
15,800
16,000
16,200
16,400
16,600
16,800
17,000
16 - 17 17 - 18 18 - 19 19 - 20 20 - 21 21 - 22 22 - 23 23 - 24 24 - 25 25 - 26
Cohort Survival
17,466 17,448 17,672 17,675
17,520
16,885
16,426 16,201
15,911
15,583
14,500
15,000
15,500
16,000
16,500
17,000
17,500
18,000
16 - 17 17 - 18 18 - 19 19 - 20 20 - 21 21 - 22 22 - 23 23 - 24 24 - 25 25 - 26
Linear Regression
DRAFT

Year K0 K1 % K0 % K1 Totals wPK Totalw/o PK06 - 07 375 1,426 0.7% 2.5% 56,479 54,678 07 - 08 370 1,886 0.7% 3.4% 55,949 53,693 08 - 09 382 2,047 0.7% 3.7% 55,927 53,498 09 - 10 360 2,093 0.6% 3.7% 56,311 53,858 10 - 11 363 2,163 0.6% 3.8% 56,731 54,205 11 - 12 424 2,207 0.8% 3.9% 56,526 53,895 12 - 13 485 2,397 0.9% 4.2% 56,905 54,023 13 - 14 433 2,372 0.8% 4.2% 56,866 54,061 14 - 15 485 2,341 0.9% 4.1% 56,956 54,130 15 - 16 474 2,455 0.8% 4.3% 56,520 53,591
10 yr ave 415 2,139 0.7% 3.8% 56,517 5 yr ave 460 2,354 0.8% 4.1% 56,755 3 yr ave 464 2,389 0.8% 4.2% 56,781
375 370 382 360 363 424 485 433 485 474
1,426
1,886 2,047 2,093 2,163 2,207
2,397 2,372 2,341 2,455
0
500
1,000
1,500
2,000
2,500
3,000
BPS Historical K0 and K1 Enrollment
K0 K1
0.7% 0.7% 0.7% 0.6% 0.6% 0.8% 0.9% 0.8% 0.9% 0.8%
2.5%
3.4% 3.7% 3.7% 3.8% 3.9%4.2% 4.2% 4.1% 4.3%
0.0%
1.0%
2.0%
3.0%
4.0%
5.0%
BPS Historical K0 and K1 Enrollment as a Percentage of Total Enrollment
% K0 % K1
DRAFT
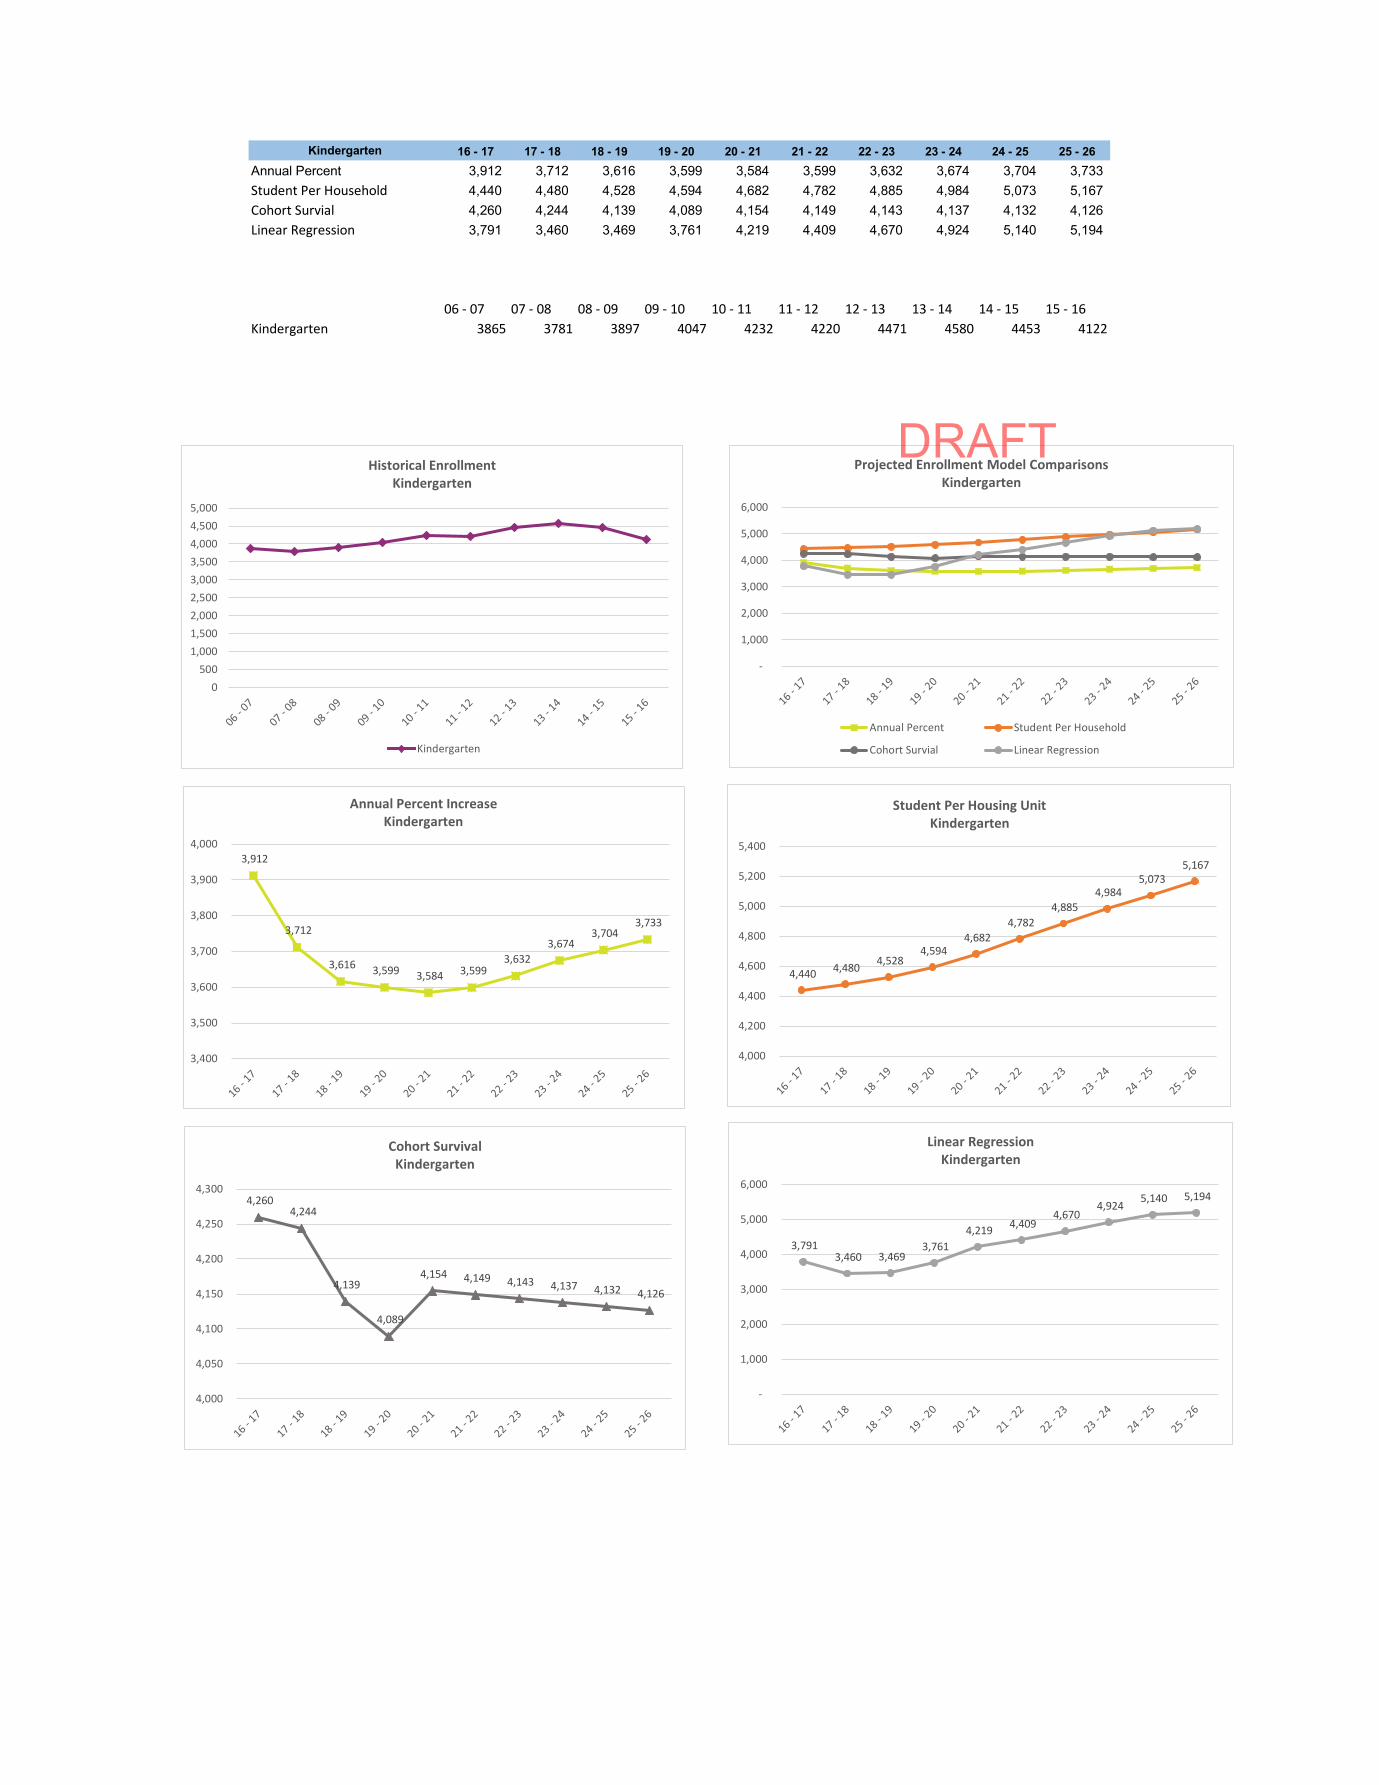
Kindergarten 16 - 17 17 - 18 18 - 19 19 - 20 20 - 21 21 - 22 22 - 23 23 - 24 24 - 25 25 - 26
Annual Percent 3,912 3,712 3,616 3,599 3,584 3,599 3,632 3,674 3,704 3,733 Student Per Household 4,440 4,480 4,528 4,594 4,682 4,782 4,885 4,984 5,073 5,167 Cohort Survial 4,260 4,244 4,139 4,089 4,154 4,149 4,143 4,137 4,132 4,126 Linear Regression 3,791 3,460 3,469 3,761 4,219 4,409 4,670 4,924 5,140 5,194
06 - 07 07 - 08 08 - 09 09 - 10 10 - 11 11 - 12 12 - 13 13 - 14 14 - 15 15 - 16Kindergarten 3865 3781 3897 4047 4232 4220 4471 4580 4453 4122
-
1,000
2,000
3,000
4,000
5,000
6,000
Projected Enrollment Model ComparisonsKindergarten
Annual Percent Student Per Household
Cohort Survial Linear Regression
3,912
3,712
3,616 3,599 3,584 3,599 3,632
3,674 3,704
3,733
3,400
3,500
3,600
3,700
3,800
3,900
4,000
Annual Percent IncreaseKindergarten
4,440 4,480 4,528 4,594
4,682 4,782
4,885 4,984
5,073 5,167
4,000
4,200
4,400
4,600
4,800
5,000
5,200
5,400
Student Per Housing UnitKindergarten
4,260 4,244
4,139
4,089
4,154 4,149 4,143 4,137 4,132 4,126
4,000
4,050
4,100
4,150
4,200
4,250
4,300
Cohort SurvivalKindergarten
3,791 3,460 3,469
3,761 4,219 4,409
4,670 4,924
5,140 5,194
-
1,000
2,000
3,000
4,000
5,000
6,000
Linear RegressionKindergarten
0500
1,0001,5002,0002,5003,0003,5004,0004,5005,000
Historical EnrollmentKindergarten
Kindergarten
DRAFT

1st Grade 16 - 17 17 - 18 18 - 19 19 - 20 20 - 21 21 - 22 22 - 23 23 - 24 24 - 25 25 - 26
Annual Percent 4,451 4,365 4,349 4,394 4,429 4,476 4,541 4,587 4,633 4,679 Student Per Household 4,587 4,628 4,678 4,746 4,837 4,940 5,047 5,149 5,241 5,338 Cohort Survial 4,238 4,379 4,403 4,348 4,281 4,372 4,392 4,402 4,406 4,400 Linear Regression 4,329 4,119 4,302 4,573 4,941 5,069 5,199 5,373 5,389 5,395
06 - 07 07 - 08 08 - 09 09 - 10 10 - 11 11 - 12 12 - 13 13 - 14 14 - 15 15 - 161st Grade 4167 4196 4117 4272 4372 4369 4595 4723 4749 4539
-
1,000
2,000
3,000
4,000
5,000
6,000
Projected Enrollment Model Comparisons1st Grade
Annual Percent Student Per Household
Cohort Survial Linear Regression
4,451
4,365 4,349 4,394
4,429 4,476
4,541 4,587
4,633 4,679
4,100
4,200
4,300
4,400
4,500
4,600
4,700
4,800
Annual Percent Increase1st Grade
4,587 4,628 4,678
4,746 4,837
4,940 5,047
5,149 5,241
5,338
4,200
4,400
4,600
4,800
5,000
5,200
5,400
Student Per Housing Unit1st Grade
4,238
4,379 4,403
4,348
4,281
4,372 4,392 4,402 4,406 4,400
4,150
4,200
4,250
4,300
4,350
4,400
4,450
Cohort Survival1st Grade
4,329 4,119 4,302 4,573
4,941 5,069 5,199 5,373 5,389 5,395
-
1,000
2,000
3,000
4,000
5,000
6,000
Linear Regression1st Grade
3,8003,9004,0004,1004,2004,3004,4004,5004,6004,7004,800
Historical Enrollment1st Grade
1st Grade
DRAFT

2nd Grade 16 - 17 17 - 18 18 - 19 19 - 20 20 - 21 21 - 22 22 - 23 23 - 24 24 - 25 25 - 26
Annual Percent 4,720 4,840 4,999 5,104 5,201 5,326 5,418 5,517 5,604 5,693 Student Per Household 4,401 4,441 4,489 4,554 4,641 4,740 4,842 4,941 5,029 5,122 Cohort Survial 4,409 4,116 4,227 4,240 4,193 4,141 4,232 4,255 4,260 4,264 Linear Regression 4,606 4,610 4,974 5,257 5,195 5,167 5,296 5,251 5,270 5,249
06 - 07 07 - 08 08 - 09 09 - 10 10 - 11 11 - 12 12 - 13 13 - 14 14 - 15 15 - 162nd Grade 4007 3994 4092 3999 4195 4243 4180 4378 4598 4602
-
1,000
2,000
3,000
4,000
5,000
6,000
Projected Enrollment Model Comparisons2nd Grade
Annual Percent Student Per Household
Cohort Survial Linear Regression
4,720 4,840 4,999 5,104 5,201 5,326 5,418 5,517 5,604 5,693
-
1,000
2,000
3,000
4,000
5,000
6,000
Annual Percent Increase2nd Grade
4,401 4,441 4,489
4,554 4,641
4,740 4,842
4,941 5,029
5,122
4,000
4,200
4,400
4,600
4,800
5,000
5,200
Student Per Housing Unit2nd Grade
4,409
4,116
4,227 4,240
4,193
4,141
4,232 4,255 4,260 4,264
3,950
4,000
4,050
4,100
4,150
4,200
4,250
4,300
4,350
4,400
4,450
Cohort Survival2nd Grade
4,606 4,610
4,974
5,257 5,195 5,167
5,296 5,251 5,270 5,249
4,200
4,400
4,600
4,800
5,000
5,200
5,400
Linear Regression2nd Grade
3,6003,7003,8003,9004,0004,1004,2004,3004,4004,5004,6004,700
Historical Enrollment2nd Grade
2nd Grade
DRAFT

3rd Grade 16 - 17 17 - 18 18 - 19 19 - 20 20 - 21 21 - 22 22 - 23 23 - 24 24 - 25 25 - 26
Annual Percent 4,723 4,930 5,055 5,170 5,309 5,410 5,501 5,590 5,666 5,743 Student Per Household 4,166 4,204 4,249 4,311 4,393 4,487 4,584 4,677 4,760 4,848 Cohort Survial 4,511 4,321 4,053 4,168 4,182 4,141 4,090 4,192 4,218 4,222 Linear Regression 4,776 5,027 5,060 4,888 4,847 4,969 4,919 4,878 4,863 4,820
06 - 07 07 - 08 08 - 09 09 - 10 10 - 11 11 - 12 12 - 13 13 - 14 14 - 15 15 - 163rd Grade 4016 3992 4033 4049 3971 4141 4202 4154 4274 4525
-
1,000
2,000
3,000
4,000
5,000
6,000
7,000
Projected Enrollment Model Comparisons3rd Grade
Annual Percent Student Per Household
Cohort Survial Linear Regression
4,723 4,930 5,055 5,170 5,309 5,410 5,501 5,590 5,666 5,743
-
1,000
2,000
3,000
4,000
5,000
6,000
7,000
Annual Percent Increase3rd Grade
4,166 4,204 4,249
4,311 4,393
4,487 4,584
4,677 4,760
4,848
3,800
4,000
4,200
4,400
4,600
4,800
5,000
Student Per Housing Unit3rd Grade
4,511
4,321
4,053
4,168 4,182 4,141
4,090
4,192 4,218 4,222
3,800
3,900
4,000
4,100
4,200
4,300
4,400
4,500
4,600
Cohort Survival3rd Grade
4,776
5,027 5,060
4,888 4,847
4,969
4,919 4,878 4,863
4,820
4,600
4,650
4,700
4,750
4,800
4,850
4,900
4,950
5,000
5,050
5,100
Linear Regression3rd Grade
3,6003,7003,8003,9004,0004,1004,2004,3004,4004,5004,600
Historical Enrollment3rd Grade
3rd Grade
DRAFT

4th Grade 16 - 17 17 - 18 18 - 19 19 - 20 20 - 21 21 - 22 22 - 23 23 - 24 24 - 25 25 - 26
Annual Percent 4,166 4,186 4,200 4,245 4,255 4,282 4,305 4,331 4,371 4,411 Student Per Household 4,302 4,341 4,388 4,452 4,537 4,634 4,734 4,830 4,916 5,007 Cohort Survial 4,416 4,403 4,220 3,974 4,104 4,137 4,098 4,054 4,152 4,178 Linear Regression 4,216 4,285 4,187 4,161 4,302 4,217 4,263 4,281 4,315 4,423 Weighted Average 4,275 4,304 4,249 4,208 4,299 4,317 4,350 4,374 4,439 4,505
06 - 07 07 - 08 08 - 09 09 - 10 10 - 11 11 - 12 12 - 13 13 - 14 14 - 15 15 - 164th Grade 3825 3960 3999 3999 4101 3977 4106 4109 4078 4147
-
1,000
2,000
3,000
4,000
5,000
6,000
Projected Enrollment Model Comparisons4th Grade
Annual Percent Student Per Household
Cohort Survial Linear Regression
4,166 4,186 4,200
4,245 4,255 4,282
4,305 4,331
4,371
4,411
4,000
4,050
4,100
4,150
4,200
4,250
4,300
4,350
4,400
4,450
Annual Percent Increase4th Grade
4,302 4,341 4,388 4,452
4,537 4,634
4,734 4,830
4,916 5,007
3,800
4,000
4,200
4,400
4,600
4,800
5,000
5,200
Student Per Housing Unit4th Grade
4,416 4,403
4,220
3,974
4,104 4,137
4,098 4,054
4,152 4,178
3,700
3,800
3,900
4,000
4,100
4,200
4,300
4,400
4,500
Cohort Survival4th Grade
4,216
4,285
4,187 4,161
4,302
4,217
4,263 4,281
4,315
4,423
4,000
4,050
4,100
4,150
4,200
4,250
4,300
4,350
4,400
4,450
Linear Regression4th Grade
3,600
3,700
3,800
3,900
4,000
4,100
4,200
Historical Enrollment4th Grade
4th Grade
DRAFT

5th Grade 16 - 17 17 - 18 18 - 19 19 - 20 20 - 21 21 - 22 22 - 23 23 - 24 24 - 25 25 - 26
Annual Percent 3,511 3,513 3,558 3,486 3,438 3,389 3,350 3,346 3,319 3,292 Student Per Household 3,974 4,010 4,053 4,112 4,191 4,280 4,373 4,462 4,541 4,625 Cohort Survial 3,574 3,806 3,782 3,616 3,467 3,632 3,708 3,710 3,684 3,773 Linear Regression 3,472 3,435 3,528 3,718 3,213 3,074 2,969 2,951 3,158 3,128 Weighted Average 3,633 3,691 3,730 3,733 3,577 3,594 3,600 3,617 3,676 3,705
06 - 07 07 - 08 08 - 09 09 - 10 10 - 11 11 - 12 12 - 13 13 - 14 14 - 15 15 - 165th Grade 3827 3578 3839 3856 3788 3836 3382 3505 3546 3509
- 500
1,000 1,500 2,000 2,500 3,000 3,500 4,000 4,500 5,000
Projected Enrollment Model Comparisons5th Grade
Annual Percent Student Per Household
Cohort Survial Linear Regression
3,511 3,513
3,558
3,486
3,438
3,389 3,350 3,346
3,319 3,292
3,150
3,200
3,250
3,300
3,350
3,400
3,450
3,500
3,550
3,600
Annual Percent Increase5th Grade
3,974 4,010 4,053 4,112
4,191 4,280
4,373 4,462
4,541 4,625
3,600
3,800
4,000
4,200
4,400
4,600
4,800
Student Per Housing Unit5th Grade
3,574
3,806 3,782
3,616
3,467
3,632
3,708 3,710 3,684
3,773
3,200
3,300
3,400
3,500
3,600
3,700
3,800
3,900
Cohort Survival5th Grade
3,472 3,435 3,528 3,718
3,213 3,074 2,969 2,951 3,158 3,128
-
500
1,000
1,500
2,000
2,500
3,000
3,500
4,000
Linear Regression5th Grade
3,100
3,200
3,300
3,400
3,500
3,600
3,700
3,800
3,900
Historical Enrollment5th Grade
5th Grade
DRAFT

6th Grade 16 - 17 17 - 18 18 - 19 19 - 20 20 - 21 21 - 22 22 - 23 23 - 24 24 - 25 25 - 26
Annual Percent 3,545 3,656 3,591 3,557 3,508 3,474 3,497 3,488 3,466 3,445 Student Per Household 3,899 3,934 3,976 4,034 4,111 4,199 4,289 4,377 4,455 4,537 Cohort Survial 3,420 3,483 3,686 3,648 3,479 3,337 3,494 3,552 3,544 3,519 Linear Regression 3,439 3,441 3,775 3,188 3,083 2,949 2,941 3,257 3,265 3,187 Weighted Average 3,576 3,628 3,757 3,607 3,545 3,489 3,555 3,668 3,683 3,672
06 - 07 07 - 08 08 - 09 09 - 10 10 - 11 11 - 12 12 - 13 13 - 14 14 - 15 15 - 166th Grade 3701 3571 3327 3683 3716 3605 3657 3234 3435 3437
- 500
1,000 1,500 2,000 2,500 3,000 3,500 4,000 4,500 5,000
Projected Enrollment Model Comparisons6th Grade
Annual Percent Student Per Household
Cohort Survial Linear Regression
3,545
3,656
3,591 3,557
3,508 3,474
3,497 3,488 3,466
3,445
3,300
3,350
3,400
3,450
3,500
3,550
3,600
3,650
3,700
Annual Percent Increase6th Grade
3,899 3,934 3,976 4,034
4,111 4,199
4,289 4,377
4,455 4,537
3,400
3,600
3,800
4,000
4,200
4,400
4,600
Student Per Housing Unit6th Grade
3,420 3,483
3,686 3,648
3,479
3,337
3,494 3,552 3,544 3,519
3,100
3,200
3,300
3,400
3,500
3,600
3,700
3,800
Cohort Survival6th Grade
3,439 3,441 3,775
3,188 3,083 2,949 2,941 3,257 3,265 3,187
-
500
1,000
1,500
2,000
2,500
3,000
3,500
4,000
Linear Regression6th Grade
2,900
3,000
3,100
3,200
3,300
3,400
3,500
3,600
3,700
3,800
Historical Enrollment6th Grade
6th Grade
DRAFT

7th Grade 16 - 17 17 - 18 18 - 19 19 - 20 20 - 21 21 - 22 22 - 23 23 - 24 24 - 25 25 - 26
Annual Percent 3,560 3,434 3,362 3,293 3,246 3,242 3,220 3,193 3,154 3,115 Student Per Household 4,204 4,242 4,287 4,350 4,433 4,528 4,625 4,719 4,803 4,892 Cohort Survial 3,701 3,683 3,771 4,008 3,968 3,784 3,651 3,823 3,883 3,874 Linear Regression 3,889 4,088 3,104 3,044 3,006 3,086 3,387 3,443 3,421 3,296 Weighted Average 3,838 3,862 3,631 3,674 3,663 3,660 3,721 3,795 3,815 3,794
06 - 07 07 - 08 08 - 09 09 - 10 10 - 11 11 - 12 12 - 13 13 - 14 14 - 15 15 - 167th Grade 4183 4005 3917 3767 4007 4046 3971 4002 3491 3690
-
1,000
2,000
3,000
4,000
5,000
6,000
Projected Enrollment Model Comparisons7th Grade
Annual Percent Student Per Household
Cohort Survial Linear Regression
3,560
3,434
3,362 3,293
3,246 3,242 3,220 3,193 3,154
3,115
2,800
2,900
3,000
3,100
3,200
3,300
3,400
3,500
3,600
Annual Percent Increase7th Grade
4,204 4,242 4,287
4,350 4,433
4,528 4,625
4,719 4,803
4,892
3,800
4,000
4,200
4,400
4,600
4,800
5,000
Student Per Housing Unit7th Grade
3,701 3,683
3,771
4,008 3,968
3,784
3,651
3,823 3,883 3,874
3,400
3,500
3,600
3,700
3,800
3,900
4,000
4,100
Cohort Survival7th Grade
3,889 4,088
3,104 3,044 3,006 3,086 3,387 3,443 3,421 3,296
-
500
1,000
1,500
2,000
2,500
3,000
3,500
4,000
4,500
Linear Regression7th Grade
3,000
3,200
3,400
3,600
3,800
4,000
4,200
4,400
Historical Enrollment7th Grade
7th Grade
DRAFT

8th Grade 16 - 17 17 - 18 18 - 19 19 - 20 20 - 21 21 - 22 22 - 23 23 - 24 24 - 25 25 - 26
Annual Percent 3,331 3,137 2,996 2,916 2,881 2,831 2,783 2,735 2,680 2,626 Student Per Household 3,977 4,013 4,056 4,115 4,194 4,284 4,376 4,465 4,545 4,629 Cohort Survial 3,715 3,726 3,709 3,798 4,023 3,985 3,804 3,669 3,832 3,892 Linear Regression 3,068 2,600 2,917 3,012 3,263 3,595 3,616 3,584 3,521 3,361 Weighted Average 3,523 3,369 3,419 3,460 3,590 3,674 3,645 3,613 3,644 3,627
06 - 07 07 - 08 08 - 09 09 - 10 10 - 11 11 - 12 12 - 13 13 - 14 14 - 15 15 - 168th Grade 4286 4096 4024 3960 3791 3966 4078 4001 4004 3536
- 500
1,000 1,500 2,000 2,500 3,000 3,500 4,000 4,500 5,000
Projected Enrollment Model Comparisons8th Grade
Annual Percent Student Per Household
Cohort Survial Linear Regression
3,331 3,137
2,996 2,916 2,881 2,831 2,783 2,735 2,680 2,626
-
500
1,000
1,500
2,000
2,500
3,000
3,500
Annual Percent Increase8th Grade
3,977 4,013 4,056 4,115
4,194 4,284
4,376 4,465
4,545 4,629
3,600
3,800
4,000
4,200
4,400
4,600
4,800
Student Per Housing Unit8th Grade
3,715 3,726 3,709
3,798
4,023 3,985
3,804
3,669
3,832 3,892
3,400
3,500
3,600
3,700
3,800
3,900
4,000
4,100
Cohort Survival8th Grade
3,068
2,600 2,917 3,012
3,263 3,595 3,616 3,584 3,521
3,361
-
500
1,000
1,500
2,000
2,500
3,000
3,500
4,000
Linear Regression8th Grade
0500
1,0001,5002,0002,5003,0003,5004,0004,5005,000
Historical Enrollment8th Grade
8th Grade
DRAFT

9th Grade 16 - 17 17 - 18 18 - 19 19 - 20 20 - 21 21 - 22 22 - 23 23 - 24 24 - 25 25 - 26
Annual Percent 4,522 4,461 4,399 4,386 4,332 4,267 4,194 4,118 4,022 3,929 Student Per Household 5,129 5,175 5,231 5,307 5,409 5,524 5,644 5,758 5,861 5,969 Cohort Survial 4,115 4,323 4,326 4,347 4,492 4,792 4,780 4,595 4,446 4,643 Linear Regression 4,437 4,290 4,420 4,385 4,574 4,401 4,202 3,985 3,785 3,435
06 - 07 07 - 08 08 - 09 09 - 10 10 - 11 11 - 12 12 - 13 13 - 14 14 - 15 15 - 169th Grade 5679 5315 5186 5030 4889 4641 4783 4712 4731 4584
-
1,000
2,000
3,000
4,000
5,000
6,000
7,000
Projected Enrollment Model Comparisons9th Grade
Annual Percent Student Per Household
Cohort Survial Linear Regression
4,522 4,461
4,399 4,386 4,332
4,267 4,194
4,118
4,022
3,929
3,600
3,700
3,800
3,900
4,000
4,100
4,200
4,300
4,400
4,500
4,600
Annual Percent Increase9th Grade
5,129 5,175 5,231 5,307
5,409 5,524
5,644 5,758
5,861 5,969
4,600
4,800
5,000
5,200
5,400
5,600
5,800
6,000
6,200
Student Per Housing Unit9th Grade
4,115
4,323 4,326 4,347
4,492
4,792 4,780
4,595
4,446
4,643
3,600
3,800
4,000
4,200
4,400
4,600
4,800
5,000
Cohort Survival9th Grade
4,437 4,290 4,420 4,385 4,574 4,401
4,202 3,985
3,785 3,435
-
500
1,000
1,500
2,000
2,500
3,000
3,500
4,000
4,500
5,000
Linear Regression9th Grade
0
1,000
2,000
3,000
4,000
5,000
6,000
Historical Enrollment9th Grade
9th Grade
DRAFT

10th Grade 16 - 17 17 - 18 18 - 19 19 - 20 20 - 21 21 - 22 22 - 23 23 - 24 24 - 25 25 - 26
Annual Percent 4,136 4,058 4,121 4,124 4,100 4,062 4,033 4,003 3,969 3,935 Student Per Household 4,585 4,626 4,676 4,744 4,835 4,938 5,044 5,147 5,239 5,335 Cohort Survial 4,074 3,657 3,882 3,855 3,851 3,966 4,219 4,184 3,980 3,851 Linear Regression 4,256 4,296 3,923 4,379 4,287 4,094 3,901 3,830 3,766 3,690
06 - 07 07 - 08 08 - 09 09 - 10 10 - 11 11 - 12 12 - 13 13 - 14 14 - 15 15 - 1610th Grade 4580 4508 4460 4484 4370 4228 4041 4384 4176 4216
-
1,000
2,000
3,000
4,000
5,000
6,000
Projected Enrollment Model Comparisons10th Grade
Annual Percent Student Per Household
Cohort Survial Linear Regression
4,136
4,058
4,121 4,124 4,100
4,062 4,033
4,003 3,969
3,935
3,800
3,850
3,900
3,950
4,000
4,050
4,100
4,150
4,200
Annual Percent Increase10th Grade
4,585 4,626 4,676
4,744 4,835
4,938 5,044
5,147 5,239
5,335
4,200
4,400
4,600
4,800
5,000
5,200
5,400
Student Per Housing Unit10th Grade
4,074
3,657
3,882 3,855 3,851
3,966
4,219 4,184
3,980
3,851
3,300
3,400
3,500
3,600
3,700
3,800
3,900
4,000
4,100
4,200
4,300
Cohort Survival10th Grade
4,256 4,296
3,923
4,379 4,287
4,094
3,901 3,830
3,766 3,690
3,200
3,400
3,600
3,800
4,000
4,200
4,400
4,600
Linear Regression10th Grade
3,7003,8003,9004,0004,1004,2004,3004,4004,5004,6004,700
Historical Enrollment10th Grade
10th Grade
DRAFT

11th Grade 16 - 17 17 - 18 18 - 19 19 - 20 20 - 21 21 - 22 22 - 23 23 - 24 24 - 25 25 - 26
Annual Percent 4,215 4,276 4,263 4,239 4,221 4,203 4,202 4,180 4,158 4,135 Student Per Household 4,463 4,503 4,552 4,618 4,706 4,807 4,911 5,010 5,100 5,194 Cohort Survial 4,143 4,004 3,616 3,843 3,805 3,777 3,877 4,097 4,053 3,855 Linear Regression 4,058 3,960 4,374 4,203 4,071 4,032 4,004 4,078 3,994 3,925
06 - 07 07 - 08 08 - 09 09 - 10 10 - 11 11 - 12 12 - 13 13 - 14 14 - 15 15 - 1611th Grade 4380 4348 4175 4272 4254 4263 4202 4045 4254 4156
-
1,000
2,000
3,000
4,000
5,000
6,000
Projected Enrollment Model Comparisons11th Grade
Annual Percent Student Per Household
Cohort Survial Linear Regression
4,215
4,276 4,263
4,239 4,221
4,203 4,202 4,180
4,158
4,135
4,050
4,100
4,150
4,200
4,250
4,300
Annual Percent Increase11th Grade
4,463 4,503 4,552 4,618
4,706 4,807
4,911 5,010
5,100 5,194
4,000
4,200
4,400
4,600
4,800
5,000
5,200
5,400
Student Per Housing Unit11th Grade
4,143
4,004
3,616
3,843 3,805 3,777
3,877
4,097 4,053
3,855
3,300
3,400
3,500
3,600
3,700
3,800
3,900
4,000
4,100
4,200
Cohort Survival11th Grade
4,058
3,960
4,374
4,203
4,071 4,032 4,004
4,078
3,994 3,925
3,700
3,800
3,900
4,000
4,100
4,200
4,300
4,400
4,500
Linear Regression11th Grade
3,800
3,900
4,000
4,100
4,200
4,300
4,400
4,500
Historical Enrollment11th Grade
11th Grade
DRAFT
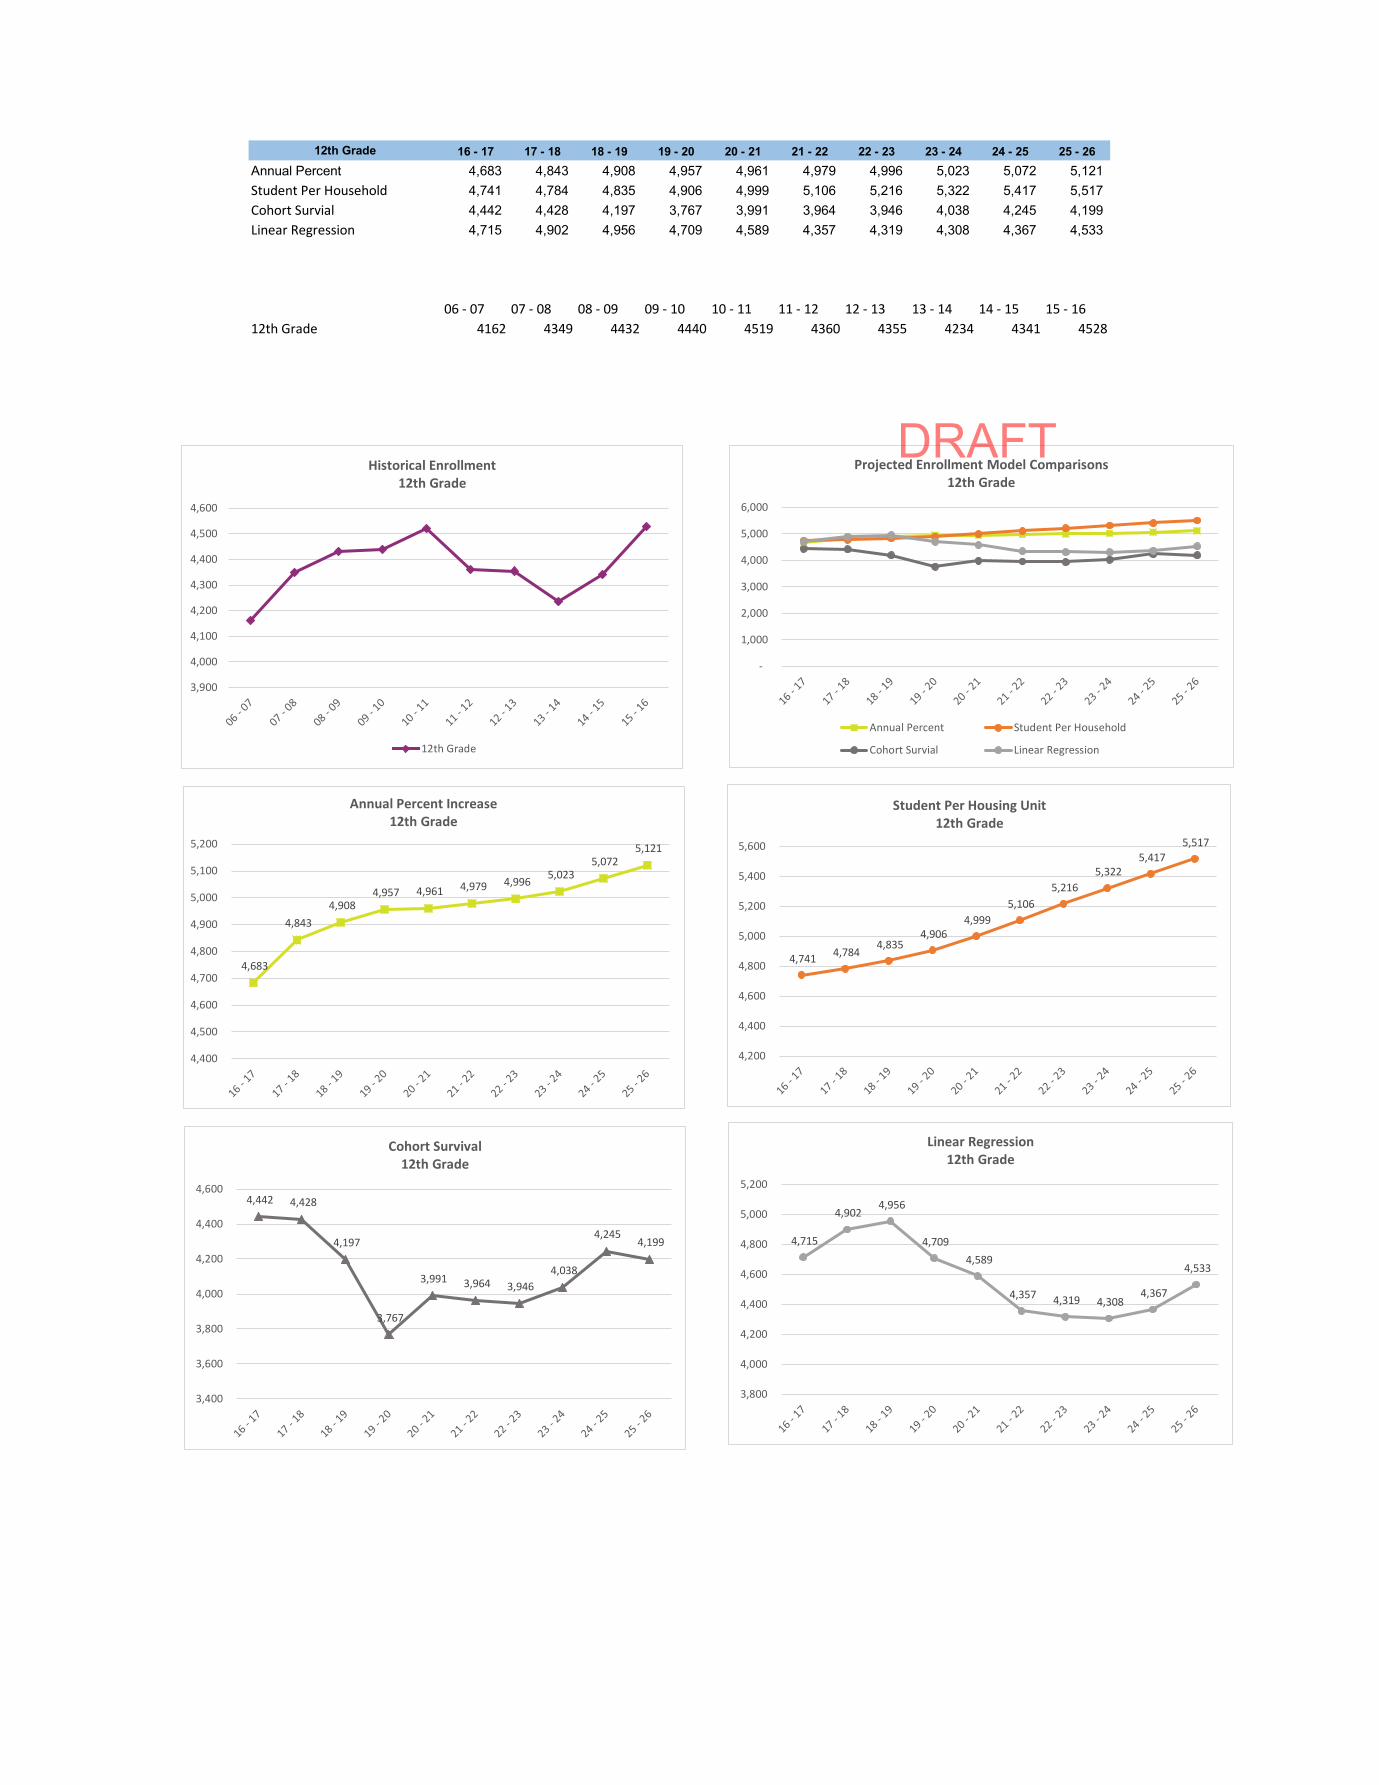
12th Grade 16 - 17 17 - 18 18 - 19 19 - 20 20 - 21 21 - 22 22 - 23 23 - 24 24 - 25 25 - 26
Annual Percent 4,683 4,843 4,908 4,957 4,961 4,979 4,996 5,023 5,072 5,121 Student Per Household 4,741 4,784 4,835 4,906 4,999 5,106 5,216 5,322 5,417 5,517 Cohort Survial 4,442 4,428 4,197 3,767 3,991 3,964 3,946 4,038 4,245 4,199 Linear Regression 4,715 4,902 4,956 4,709 4,589 4,357 4,319 4,308 4,367 4,533
06 - 07 07 - 08 08 - 09 09 - 10 10 - 11 11 - 12 12 - 13 13 - 14 14 - 15 15 - 1612th Grade 4162 4349 4432 4440 4519 4360 4355 4234 4341 4528
-
1,000
2,000
3,000
4,000
5,000
6,000
Projected Enrollment Model Comparisons12th Grade
Annual Percent Student Per Household
Cohort Survial Linear Regression
4,683
4,843 4,908
4,957 4,961 4,979 4,996 5,023 5,072
5,121
4,400
4,500
4,600
4,700
4,800
4,900
5,000
5,100
5,200
Annual Percent Increase12th Grade
4,741 4,784 4,835
4,906 4,999
5,106 5,216
5,322 5,417
5,517
4,200
4,400
4,600
4,800
5,000
5,200
5,400
5,600
Student Per Housing Unit12th Grade
4,442 4,428
4,197
3,767
3,991 3,964 3,946 4,038
4,245 4,199
3,400
3,600
3,800
4,000
4,200
4,400
4,600
Cohort Survival12th Grade
4,715
4,902 4,956
4,709 4,589
4,357 4,319 4,308 4,367
4,533
3,800
4,000
4,200
4,400
4,600
4,800
5,000
5,200
Linear Regression12th Grade
3,900
4,000
4,100
4,200
4,300
4,400
4,500
4,600
Historical Enrollment12th Grade
12th Grade
DRAFT

BOSTON&PUBLIC&SCHOOLS&!&NOVEMBER&2,&2016&DEMOGRAPHICS&REPORT&FACILITIES&MASTER&PLAN&
P A G E & 3 7 &
APPENDIX B
PERCENT IN CHANGE OF POPULATION
&
CHANGE&IN&PERCENT&OF&POPULATION&&2010&TO&2014&ESTIMATE&&
(BY&AGE&SEGMENT)&
AGE&SEGMENT&%&OF&2010&
POPULATION&
%&OF&2014&est.&
POPULATION&
CHANGE&IN&%&OF&
POPULATION&
Under&5& 5.2%& 5.3%& 1.1%&
5&to&9& 4.3%& 4.4%& 0.4%&
10&to&14& 4.3%& 4.2%& K2.3%&
15&to&19& 8.1%& 7.8%& K3.7%&
20&to&24& 14.3%& 12.5%& K12.2%&
25&to&34& 20.7%& 22.0%& 6.3%&
35&to&44& 12.5%& 12.5%& K0.2%&
45&to&54& 11.4%& 11.3%& K0.3%&
55&to&59& 4.9%& 5.0%& 2.5%&
60&to&64& 4.2%& 4.5%& 8.4%&
65&to&74& 5.3%& 5.6%& 4.9%&
75&to&84& 3.3%& 3.2%& K1.2%&
85&and&over& 1.5%& 1.6%& 7.4%&
&
DRAFT