2016-2017 budget executive summarybudget.gmu.edu/wp-content/uploads/17budexecsumm.… · ·...
TRANSCRIPT
2016-2017 BUDGET EXECUTIVE SUMMARY
Office of Budget and Planning

i
George Mason University Total Budget, 2016-2017
Executive Summary
Table of Contents BUDGET SUMMARY OVERVIEW ..................................................................................................................1 Budget Highlights, FY 2017 .................................................................................1 Annual Change: All Programs ..............................................................................3 All Funds—All Sources—Revenue ......................................................................4 All Funds—All Uses—Outlay ..............................................................................5 Institutional Profile ...............................................................................................6 Performance Measures ........................................................................................14 Institutional Performance Standards ...................................................................18 Strategic Plan ......................................................................................................19 EDUCATIONAL AND GENERAL...............................................................................25 Educational and General Revenues ....................................................................25 Funds Available For Allocation (Sources) .........................................................29 Use of Funds / Expenses .....................................................................................31 Educational & General Budget by Unit .............................................................34 AUXILIARY ENTERPRISES .......................................................................................35 Auxiliary Enterprises Revenues ..........................................................................35 New Student Fee Requirements ..........................................................................40 Use of Funds / Expenses .....................................................................................42 Summary of Auxiliary Enterprises Operating Budget ........................................48 TUITION AND FEES ....................................................................................................49 STUDENT FINANCIAL ASSISTANCE.......................................................................55 SPONSORED RESEARCH ...........................................................................................63 CAPITAL OUTLAY ......................................................................................................71 BUDGET DETAILS EDUCATIONAL & GENERAL DETAIL BY MAJOR UNIT .....................................75 AUXILIARY ENTERPRISES DETAIL BY MAJOR UNIT ........................................99

ii
Members of the George Mason University Budget Planning Team
Ms. Jennifer (J.J.) Wagner Davis and Dr. S. David Wu, Co-chairs
Ms. Janet Bingham
Mr. David Burge
Mr. Thomas Calhoun
Ms. Lisa Kemp
Mr. Paul Liberty
Dr. Michelle Marks
Ms. Rose Pascarell
Ms. Marilyn Smith
Ex officio
Mr. David Moore, Chief Budget Officer
Mr. Frank Neville, Chief of Staff
Dr. Susan Trencher, Faculty Senate Representative
Support Staff
Ms. Barbara Clark
Ms. Kim Dight
Ms. Renate Guilford
Ms. Patrice Musco
Office of Budget and Planning
Ms. Jieping Li
Ms. Monica Michaud
Ms. Dorian Mroz
Mr. David Oler
Mr. Mark Stahley
Ms. Tracy Williams
Ms. Li Zhou
Contributions by other departments:
Dr. Thulasi Kumar— Institutional Research & Reporting
Dr. Sandra L. Tarbox— Student Financial Aid
Mr. Mike Laskofski, Ms. Kimberly Maze— Office of Sponsored Programs
1
GEORGE MASON UNIVERSITY
TOTAL BUDGET, 2016–2017 BUDGET HIGHLIGHTS
• The total university budget for FY 2017 has reached $1.0 billion, which represents a 2.4 percent increase compared to the FY 2016 budget. The FY 2017 budget comprises $920.3 million in operating funds, an impressive $22.3 million state-supported financial student aid that represents 19.3 percent increase for both undergraduate and graduate financial aid support, and $58.4 million in capital outlay. Compared to the FY 2016 budget, the operating budget increases by 4.9 percent, most notably including a 6.1 percent increase in Educational and General that is primarily due to an increase in General Fund support. Capital outlay decreases as construction enters its final stage before completion for Fenwick Library and Potomac Science Center. This decrease is not anticipated for long as Mason will see planning and construction funds for Robinson Hall, Utility Infrastructure, and the Telecommunication projects, which were submitted to the state for funding consideration.
• Mason continues to be the largest public university in the Commonwealth with a headcount of 34,112 across all campuses, which represents 16 percent of the total headcount from all 15 public, four-year institutions of higher education in the Commonwealth. Mason welcomed its largest recorded freshman class of approximately 3,256 during fall of 2015 and welcomed over 8,500 new degree-seeking students in FY 2016–an indicator of Mason’s strong market brand.
• Like most institutions of higher education, Mason continues to experience a shifting and competitive enrollment landscape. In FY 2017, Mason will take a conservative approach to its enrollment goals. The FY 2017 budget will have overall enrollment and revenues remain stable with the majority of the revenue changes coming from the tuition and fee rate increases and the increase in state General Fund support for the Educational and General budget and state-supported student financial aid.
• Serving a large, diverse student population requires investment in services and programs to maintain and balance an accessible, affordable, and high quality education for our students. Within the total operating budget increase is approximately $2.8 million for strategic plan initiatives that will provide support for student services, investment in research, new diversity and inclusion initiatives, and permanent support for student financial assistance through the Stay Mason Initiative. The total price for an undergraduate student living on-campus (including tuition, fees, room, and board) is $22,030 for in-state and $43,312 for out-of-state, an increase over the previous year of 2.7 and 2.9 percent respectively. Institutional financial aid for undergraduates includes the continuation of the out-of-state leveraging grant funds. The combination of Commonwealth and institutional financial aid will increase by 7.2 percent or approximately $4.2 million.
• New to last year’s operating budget was a successful allocation of carryforward funds that were targeted toward retention and compensation funding and the creation of the Stay Mason Initiative, a student support fund to assist Mason students who are at risk of not continuing their education due to unexpected financial situations. Carryforward funds from savings achieved in previous years are one-time in nature. Anticipated FY 2016 budget savings will carry forward to help fund two strategic initiatives: 1) the Stay Mason Initiative, which will be funded by both one-time and permanent funds, and 2) funding for the expansion of Mason’s online course delivery, an initiative that is projected to increase Mason’s profile in the online markets.

2
GEORGE MASON UNIVERSITY
TOTAL BUDGET, 2016–2017 BUDGET HIGHLIGHTS, (CONTINUED)
• Compared to the FY 2016 budget, total FY 2017 Educational and General (E&G) budget SOURCES increase by $29.4 million or 6.1 percent.
External subsidies from state appropriations increase by $10.9 million in FY 2017. The change in appropriations comprises additional resources that provide for an overall increase in cost for a state-supported salary increase and rising healthcare and pension costs and funding for the support of Mason’s strategic plan initiatives of access, affordability, quality, and degree completion. General Fund appropriations are projected to provide approximately 28 percent of the total E&G operating funds.
In addition to the funding noted above, state appropriations have increased for the second consecutive year for the development of a pathway program to attract and train veterans for cybersecurity careers.
• FY 2017 Educational and General (E&G) budget USES increase by $29.4 million or 6.1 percent.
The budget reflects $17.5 million in additional compensation, including 1) a state-supported salary plan increase; 2) employer-paid health insurance premium and pension increases; 3) a new retention and compensation initiative; and 4) increases for faculty promotion and tenure.
Non-personnel budgets reflect $11.9 million additional support for 1) state-supported six-year plan initiative for pathways in cybersecurity along with funding to support the Small Business Development Center; 2) investment in Mason’s strategic plan initiatives; 3) investment in research; 4) academic program and service funding; 5) contractual escalation costs; and 6) support increases in operation and maintenance costs for new facilities. The E&G budget includes efforts to drive down costs and repurpose the base budget through cost containment, efficiencies, and organizational restructuring.
• Auxiliary Enterprise (AE) revenue in FY 2017 will increase by 4.4 percent or $10.6 million, with an increase in AE Independent Operations of $5.6 million, student fee revenue of $4.7 million, and self-generated revenue of approximately $0.3 million. The FY 2017 AE budget includes an increase for additional student housing revenue and additional fee revenue, primarily due to a student fee rate increase and enrollment growth in the Mason INTO program (students in this program pay the university student fee). Operating expense increases are primarily due to required state-supported salary increases, additional student services, and enhanced student financial assistance.
• Sponsored Research activity in FY 2017 is projected to total $104.7 million, which is approximately a 2 percent increase over the level originally budgeted for FY 2016. Although projected expenditures are being revised to reflect recent experience, overall awards remain stable under these relatively unpredictable economic conditions.

3
ANNUAL CHANGE: ALL PROGRAMS
This Executive Summary summarizes an all funds view of the budget plans for FY 2017. It describes the priorities of the institution and how financial resources for FY 2017 have been allocated to support those priorities. Key performance metrics and trends are included to provide context for budget allocation decisions.
The overall university budget increases by approximately 2.4 percent when compared to the FY 2016 original budget. As shown in the summary table below, Mason’s FY 2017 operating budget increases by 4.9 percent, state financial assistance increases by an impressive 19.3 percent, and the capital outlay budget will decrease by 28.3 percent as some large capital projects near completion. In addition, the university will continue the one-time funds category to provide support for a major initiative in online course delivery as Mason explores expansion in its online course offering and to provide continuing support for the Stay Mason Initiative. The one-time funds category includes carryforward funds that represents savings in FY 2016 that will be used for strategic initiatives in FY 2017. Savings for one-time support typically come from efficiencies that started in FY 2016 and have been incorporated into the overall FY 2017 financial plan as base budget reallocations.
PROGRAM ($ in Millions)
BUDGET FY 2013
BUDGET FY 2014
BUDGET FY 2015
BUDGET FY 2016
BUDGET FY 2017
FY16 TO FY17 %
CHANGE Educational and General (E&G)*
$447.4
$456.8
$475.1
$485.4
$514.8 6.1%
Philanthropic Activities
24.9
31.0
38.0
43.0
45.0 4.7%
Auxiliary Enterprises (AE)
204.6
223.3
232.3
242.7
253.3 4.4%
Sponsored Research
102.9
102.6
104.7
102.6
104.7 2.0%
One-Time Funds
0
0
0
3.7
2.5 -32.4%
SUBTOTAL OPERATING
$779.8
$813.7
$850.1
$877.4
$920.3 4.9%
State Student Financial Assist.
16.3
17.4
17.4
18.7
22.3 19.3%
Capital Outlay
91.9
79.9
78.2
81.5
58.4 -28.3%
TOTAL $888.0
$911.0
$945.7
$977.6
$1,001.0
2.4%
*All years include Equipment Trust Funds (ETF).
Total University Budget, FY 2017….$1.0B
4
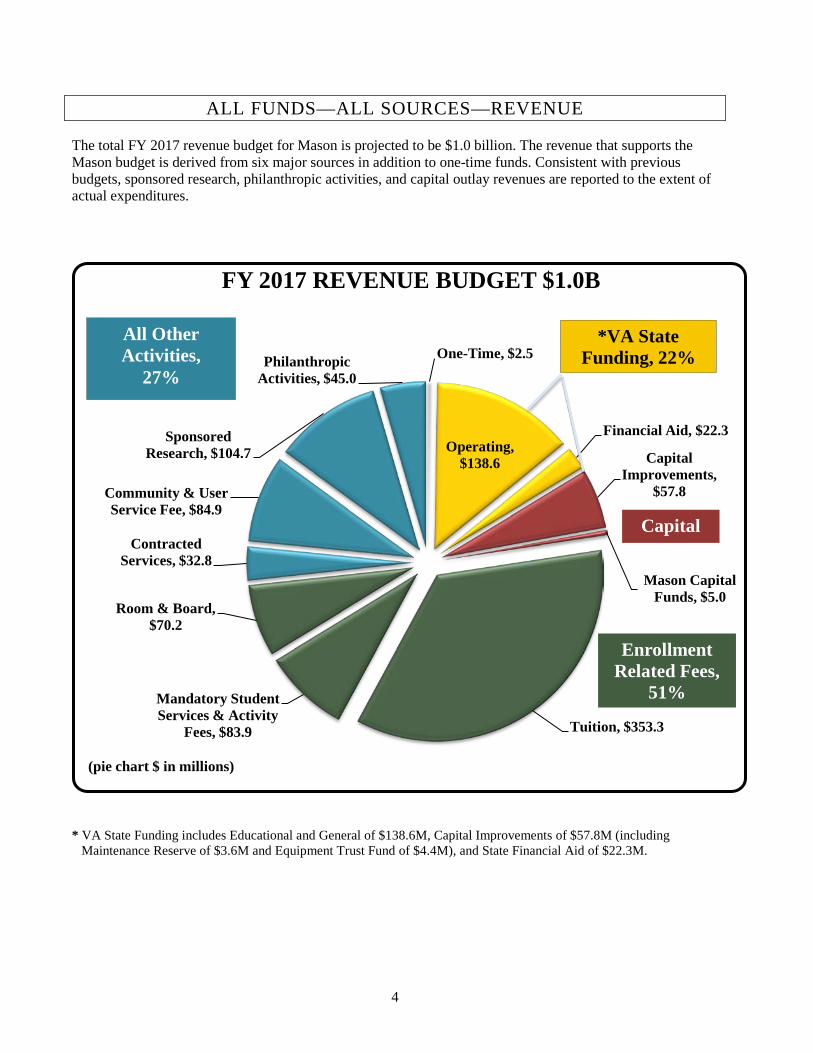
ALL FUNDS—ALL SOURCES—REVENUE
The total FY 2017 revenue budget for Mason is projected to be $1.0 billion. The revenue that supports the Mason budget is derived from six major sources in addition to one-time funds. Consistent with previous budgets, sponsored research, philanthropic activities, and capital outlay revenues are reported to the extent of actual expenditures.
* VA State Funding includes Educational and General of $138.6M, Capital Improvements of $57.8M (including Maintenance Reserve of $3.6M and Equipment Trust Fund of $4.4M), and State Financial Aid of $22.3M.
One-Time, $2.5
Operating, $138.6
Financial Aid, $22.3
Capital Improvements,
$57.8
Mason Capital Funds, $5.0
Tuition, $353.3
Mandatory Student Services & Activity
Fees, $83.9
Room & Board, $70.2
Contracted Services, $32.8
Community & User Service Fee, $84.9
Sponsored Research, $104.7
Philanthropic Activities, $45.0
FY 2017 REVENUE BUDGET $1.0B
(pie chart $ in millions)
Enrollment Related Fees,
51%
Capital
All Other Activities,
27%
*VA State Funding, 22%
5
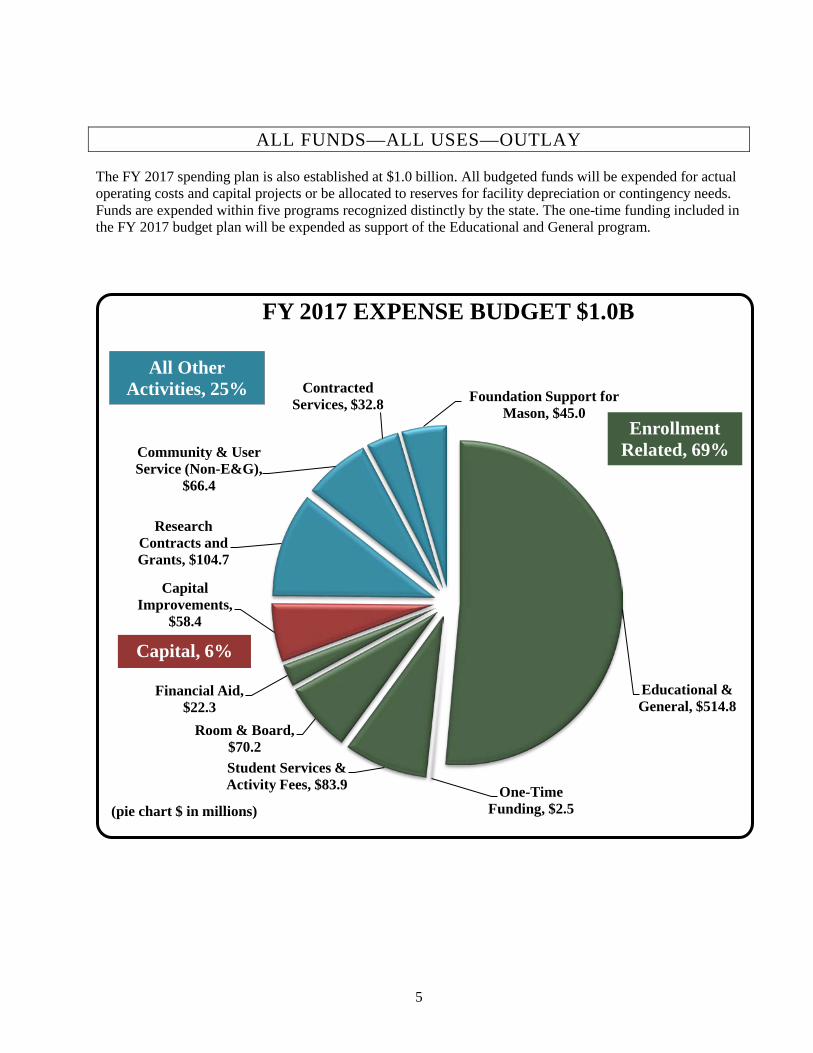
ALL FUNDS—ALL USES—OUTLAY
The FY 2017 spending plan is also established at $1.0 billion. All budgeted funds will be expended for actual operating costs and capital projects or be allocated to reserves for facility depreciation or contingency needs. Funds are expended within five programs recognized distinctly by the state. The one-time funding included in the FY 2017 budget plan will be expended as support of the Educational and General program.
Educational & General, $514.8
One-Time Funding, $2.5
Student Services & Activity Fees, $83.9
Room & Board, $70.2
Financial Aid, $22.3
Capital Improvements,
$58.4
Research Contracts and Grants, $104.7
Community & User Service (Non-E&G),
$66.4
Contracted Services, $32.8 Foundation Support for
Mason, $45.0
FY 2017 EXPENSE BUDGET $1.0B
(pie chart $ in millions)
Enrollment Related, 69%
Capital, 6%
All Other Activities, 25%

6
INSTITUTIONAL PROFILE
New Student Selectivity and Institutional Attractiveness
Student Quality: The tables that follow illustrate that, while Mason enrollments have increased, Mason has become more selective in its admission policies as evidenced by the increase in both the SAT and GPA of incoming students. Taken together, they indicate the increasing competitiveness at Mason.
FIRST-TIME FRESHMEN – HEADCOUNT FALL 2008–FALL 2015
FALL 2008
FALL 2009
FALL 2010 *
FALL 2011
FALL 2012
FALL 2013
FALL 2014
FALL 2015
Freshmen Applicants 12,943 13,732 14,200 14,596 14,703 20,805 22,532 21,981 Freshmen Admits 8,112 8,691 8,900 9,263 9,667 12,905 15,017 15,138 Freshmen Enrolled 2,558 2,656 2,603 2,665 2,694 3,011 3,080 3,181
Transfer Applicants 5,546 6,199 7,016 7,197 6,561 7,439 6,640 6,370 Transfer Admits 3,555 4,068 3,888 3,739 3,201 4,035 3,678 3,537 Transfer Enrolled 2,259 2,600 2,452 2,446 2,108 2,547 2,465 2,386 Graduate Applicants 8,001 8,436 10,171 10,134 10,198 10,197 9,462 9,533 Graduate Admits 4,502 4,965 5,807 5,599 5,684 5,547 5,222 5,450 Graduate Enrolled 2,833 2,878 2,938 2,934 2,931 2,853 2,757 2,833 Law Applicants 5,236 5,428 5,512 4,701 3,985 2,261 2,275 2,195 Law Admits 980 1,299 1,340 1,076 1,066 768 824 713 Law Enrolled 162 249 299 193 153 155 165 167
Source: Office of Institutional Research and Reporting
* Students applying for the International Access program that began in fall 2010 are excluded from these figures.

7
FIRST-TIME FRESHMEN
QUALITY INDICATOR TRENDS FALL 2008–FALL 2015
FRESHMEN APPLIED
AVERAGE HS GPA
AVERAGE SAT
2008 3.32 1095 2009 3.36 1113 2010 3.42 1113 2011 3.50 1117 2012 3.51 1119 2013 3.54 1124 2014 3.54 1129 2015 3.57 1129
FRESHMEN ADMITTED
AVERAGE HS GPA
AVERAGE SAT
2008 3.55 1154 2009 3.58 1171 2010 3.64 1176 2011 3.71 1182 2012 3.71 1181 2013 3.75 1181 2014 3.73 1184 2015 3.74 1177
FRESHMEN ENROLLED
AVERAGE HS GPA
AVERAGE SAT
2008 3.48 1121 2009 3.55 1143 2010 3.59 1151 2011 3.65 1155 2012 3.66 1155 2013 3.66 1153 2014 3.65 1153 2015 3.66 1148

8
Institutional Size: Student Enrollment (Headcount)
In fall 2003, Mason became the largest university in the Commonwealth, with a headcount of 28,426. Mason continues to be the largest public university in the Commonwealth, with a headcount of 34,112 (see chart below). This is 4.4 percent greater than the next largest public university. In the fall of 2015, Mason enrolled approximately 16 percent of the total headcount across Virginia’s 15 public, four-year institutions of higher education.
0
5,000
10,000
15,000
20,000
25,000
30,000
35,000
1,717 2,0284,647 4,696 5,087 5,107 5,172
8,4849,743
21,22723,883 24,672
31,24232,663
34,112
VIRGINIA PUBLIC INSTITUTIONS OF HIGHER EDUCATION
FALL 2015, STUDENT HEADCOUNT
TOTAL HEADCOUNT STUDENT ENROLLMENT – 214,480 78% of the student enrollment is at the six largest institutions
9
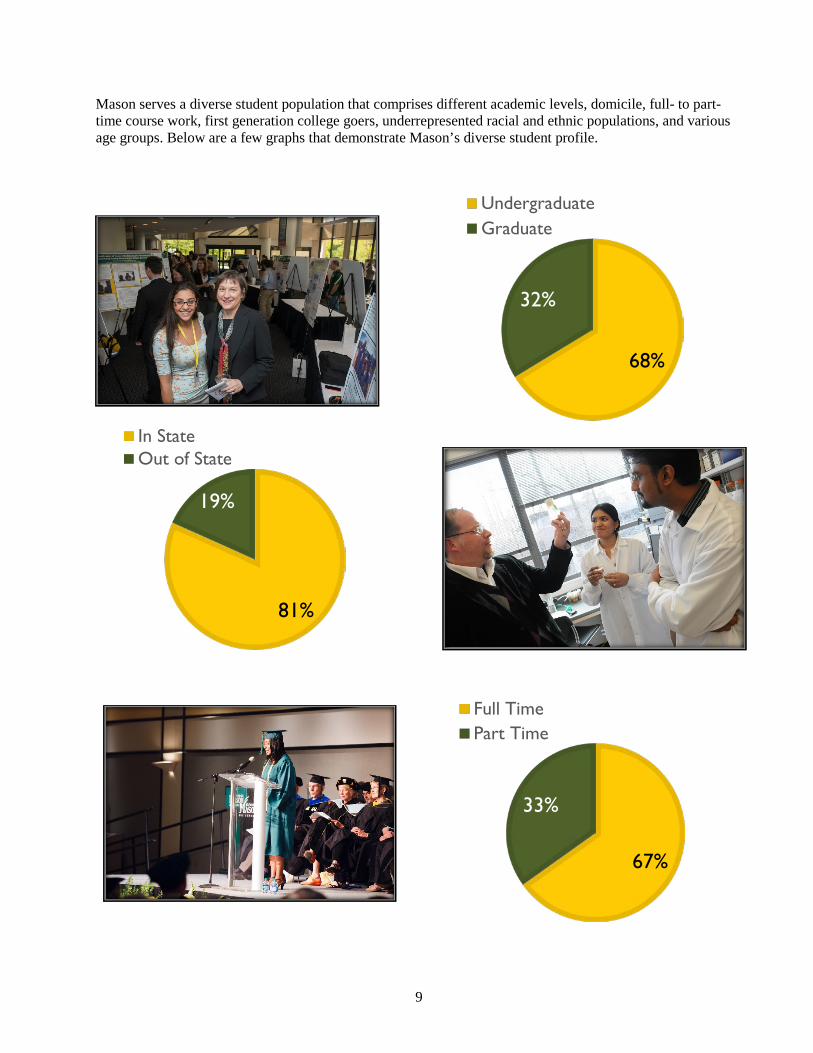
Mason serves a diverse student population that comprises different academic levels, domicile, full- to part-time course work, first generation college goers, underrepresented racial and ethnic populations, and various age groups. Below are a few graphs that demonstrate Mason’s diverse student profile.
81%
19%
In StateOut of State
68%
32%
UndergraduateGraduate
67%
33%
Full TimePart Time

10
Institutional Size: Undergraduate Enrollment (Headcount)
Mason serves a diverse population with a broad array of needs which require investments. Mason’s undergraduate student population is approximately 68 percent of the total headcount.
49%51%
Underrepresented Racial/Ethnic
Other
35%
65%
First GenerationOther
13%
87%
Over Age 25 at Entry
Other
1 in 8
11
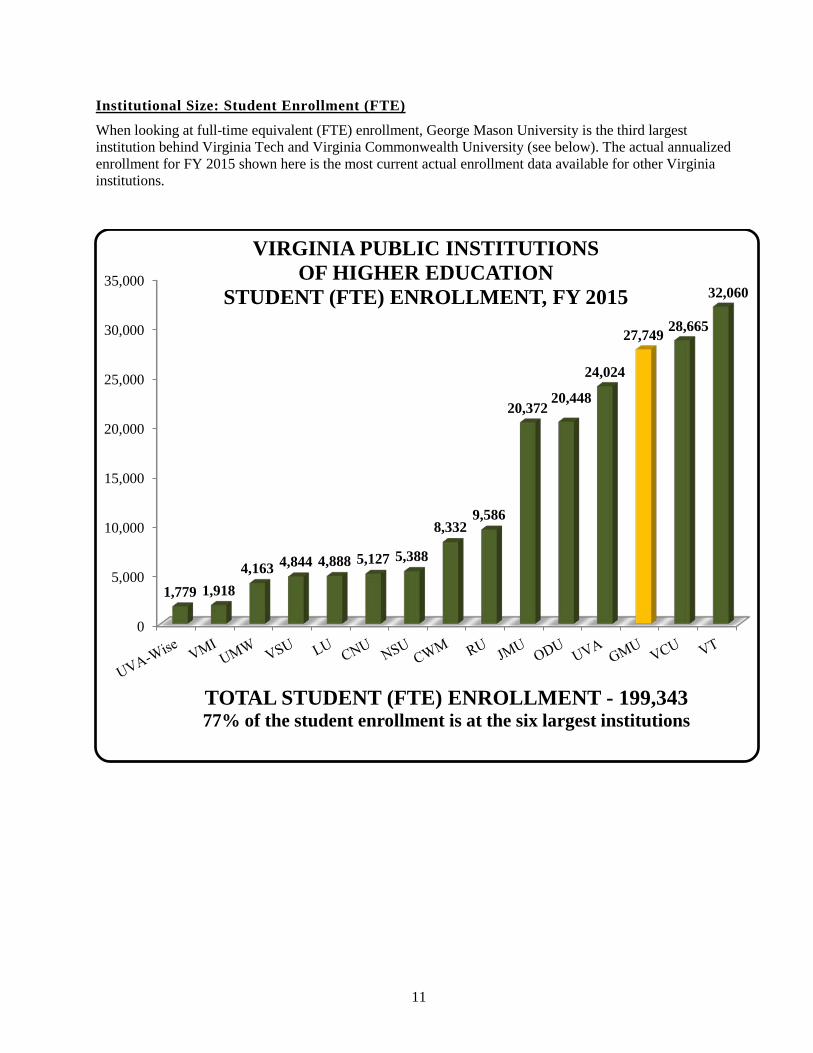
Institutional Size: Student Enrollment (FTE)
When looking at full-time equivalent (FTE) enrollment, George Mason University is the third largest institution behind Virginia Tech and Virginia Commonwealth University (see below). The actual annualized enrollment for FY 2015 shown here is the most current actual enrollment data available for other Virginia institutions.
0
5,000
10,000
15,000
20,000
25,000
30,000
35,000
1,779 1,9184,163 4,844 4,888 5,127 5,388
8,3329,586
20,37220,448
24,024
27,749 28,665
32,060
TOTAL STUDENT (FTE) ENROLLMENT - 199,34377% of the student enrollment is at the six largest institutions
VIRGINIA PUBLIC INSTITUTIONS OF HIGHER EDUCATION
STUDENT (FTE) ENROLLMENT, FY 2015
12
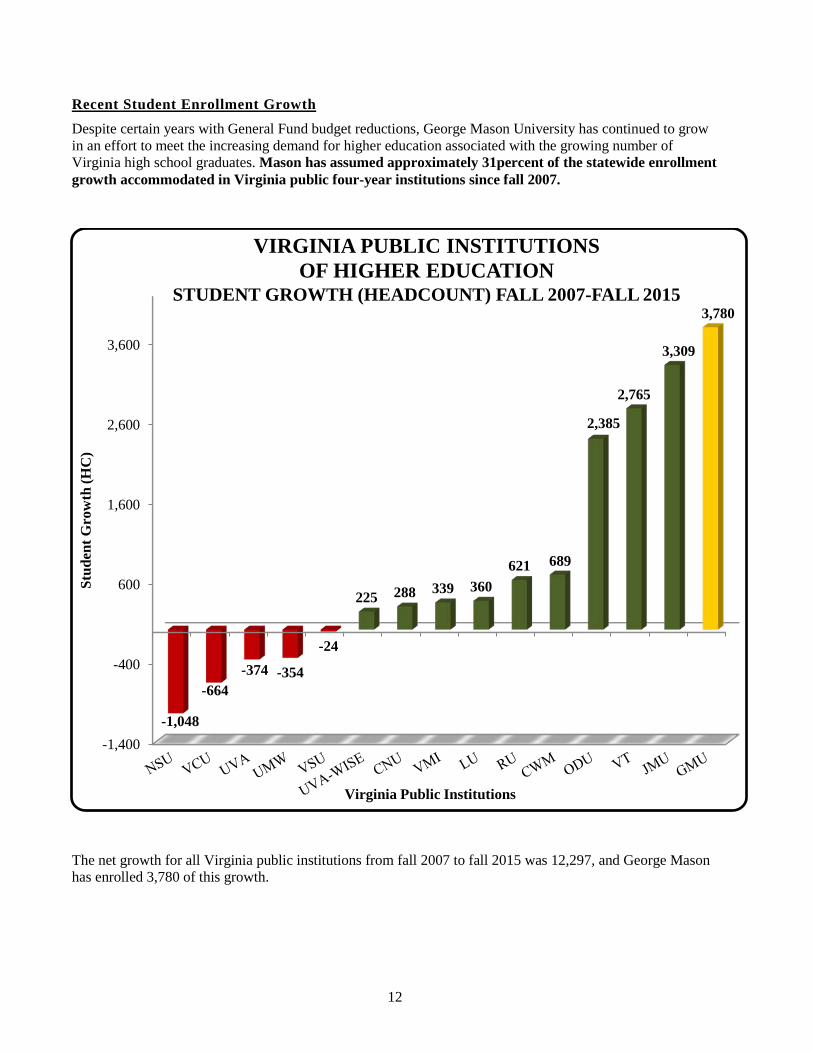
Recent Student Enrollment Growth
Despite certain years with General Fund budget reductions, George Mason University has continued to grow in an effort to meet the increasing demand for higher education associated with the growing number of Virginia high school graduates. Mason has assumed approximately 31percent of the statewide enrollment growth accommodated in Virginia public four-year institutions since fall 2007.
The net growth for all Virginia public institutions from fall 2007 to fall 2015 was 12,297, and George Mason has enrolled 3,780 of this growth.
-1,400
-400
600
1,600
2,600
3,600
-1,048
-664-374 -354
-24
225 288 339 360621 689
2,385
2,765
3,309
3,780
Stud
ent G
row
th (H
C)
Virginia Public Institutions
VIRGINIA PUBLIC INSTITUTIONS OF HIGHER EDUCATION
STUDENT GROWTH (HEADCOUNT) FALL 2007-FALL 2015
13
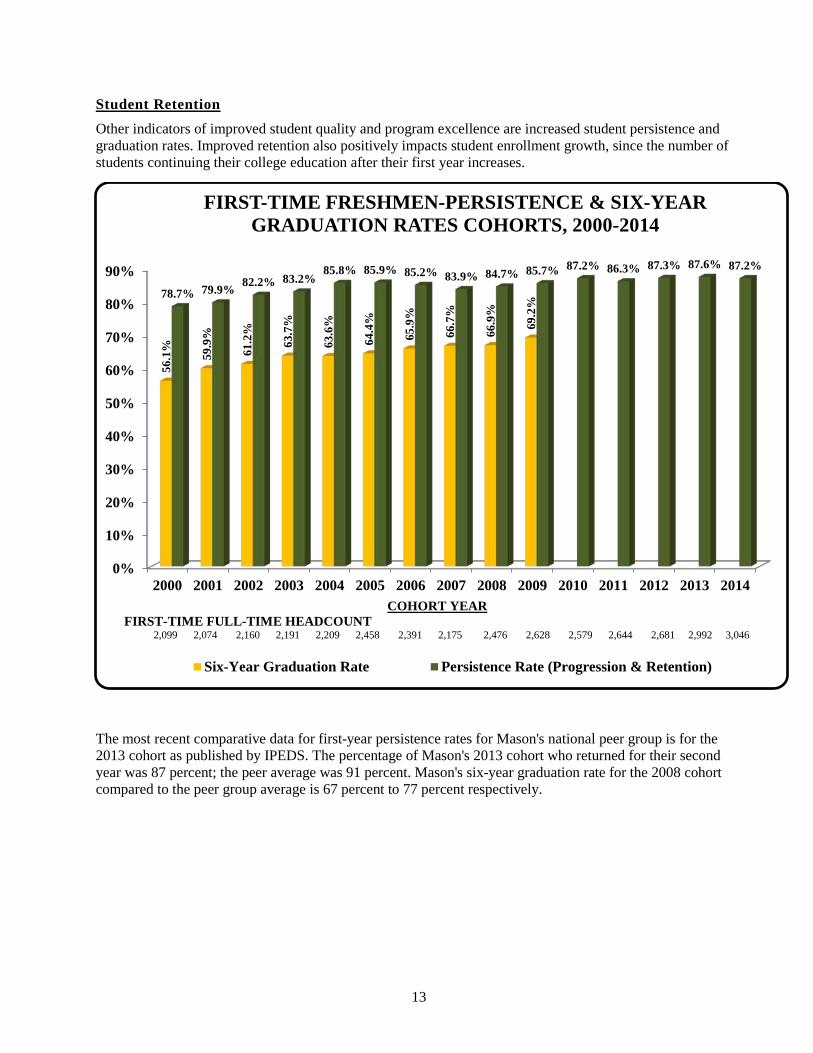
Student Retention
Other indicators of improved student quality and program excellence are increased student persistence and graduation rates. Improved retention also positively impacts student enrollment growth, since the number of students continuing their college education after their first year increases.
The most recent comparative data for first-year persistence rates for Mason's national peer group is for the 2013 cohort as published by IPEDS. The percentage of Mason's 2013 cohort who returned for their second year was 87 percent; the peer average was 91 percent. Mason's six-year graduation rate for the 2008 cohort compared to the peer group average is 67 percent to 77 percent respectively.
0%
10%
20%
30%
40%
50%
60%
70%
80%
90%
2000 2001 2002 2003 2004 2005 2006 2007 2008 2009 2010 2011 2012 2013 2014
56.1
%
59.9
%
61.2
%
63.7
%
63.6
%
64.4
%
65.9
%
66.7
%
66.9
%
69.2
%
78.7% 79.9% 82.2% 83.2%85.8% 85.9% 85.2% 83.9% 84.7% 85.7% 87.2% 86.3% 87.3% 87.6% 87.2%
FIRST-TIME FRESHMEN-PERSISTENCE & SIX-YEAR GRADUATION RATES COHORTS, 2000-2014
Six-Year Graduation Rate Persistence Rate (Progression & Retention)
COHORT YEAR FIRST-TIME FULL-TIME HEADCOUNT 2,099 2,074 2,160 2,191 2,209 2,458 2,391 2,175 2,476 2,628 2,579 2,644 2,681 2,992 3,046

14
PERFORMANCE MEASURES
Mason takes great pride in its regular assessment of a series of important operational indicators of institutional effectiveness.
Total Core Funding per FTE Student
The combination of General Fund support and tuition approximates the total funding available to teach a full-time student. The 25 institutions shown below were approved for benchmarking by university and state officials as the schools most similar to Mason. As reported by the U.S. Department of Education Integrated Postsecondary Education System (IPEDS), Mason has one of the lowest core funding levels per FTE student among this national peer group.
FY 2014 GEORGE MASON UNIVERSITY PEER GROUP COMPARISON
INSTITUTION ENROLLMENT
(FTES) CORE SPENDING PER
STUDENT University of Southern California 37,891 $65,068 New York University 48,306 43,966 University of Connecticut 24,161 40,728 George Washington University 21,365 40,207 University of Washington—Seattle Campus 46,238 40,194 Boston University 31,850 38,388 University of North Carolina at Chapel Hill 28,938 36,873 Northeastern University 20,777 33,967 Stony Brook University 23,299 33,072 University of Minnesota—Twin Cities 54,015 28,831 Rutgers University—New Brunswick 46,845 28,366 Syracuse University 21,764 27,990 Arizona State University-Tempe 46,791 25,744 University of Kansas 25,019 24,652 University of Florida 47,483 24,454 University of Illinois at Urbana—Champaign 49,552 24,389 SUNY at Albany 15,649 23,944 Temple University 33,618 23,601 University of Maryland—College Park 36,616 23,222 University of Arizona 38,970 22,616 Michigan State University 46,076 21,741 University of Massachusetts Amherst 27,970 21,634 North Carolina State University at Raleigh 30,250 20,701 George Mason University 27,291 18,255 University of Nebraska—Lincoln 21,470 17,528 Florida State University 39,141 14,774 Peer Group Average (Excluding Mason) 34,562 $29,866 Mason % of Peer Group Average 79.0% 61.1%
Source: FY 2014 IPEDS

15
Funding Improvement: Statewide Comparison is Slowly Improving
Each doctoral institution within the Commonwealth of Virginia has a unique mission, but funding comparisons present an interesting analysis. The following table illustrates both the institutional difference in total funding within the Commonwealth of Virginia and the relationship between tuition and General Fund support at the Virginia doctoral universities. In terms of total funding, in FY 2016 Mason is operating with approximately 75 percent of the total resources available to the other doctoral universities.
EDUCATIONAL AND GENERAL ESTIMATED TOTAL FUNDING PER IN-STATE FTE STUDENT, FY 2016
General Fund, Tuition and Mandatory E&G Fees DOCTORAL
INSTITUTIONS GENERAL FUND
FY 2016* IN-STATE
TUITION FY 2016
TOTAL College of William & Mary $7,833 $14,114 $21,947 University of Virginia 8,420 12,347 20,767 Virginia Tech 6,893 10,628 17,521 Virginia Commonwealth Univ 6,707 10,719 17,426 Old Dominion 5,884 6,193 12,077 Doctoral Avg. excl. Mason $7,147 $10,800 $17,948 GEORGE MASON $5,488 $7,976 $13,464 Mason % of Average 76.8% 73.9% 75.0%
* General Fund estimate based on SCHEV FTE projection in the 2B report; numbers for all institutions will change with actual revised numbers. General Fund estimate includes budget reductions in FY 2016.
Student: Faculty & Staff Ratios
The number of students (headcount) supported by the total number of faculty/staff positions (FTE) is a national benchmark for institutional effectiveness. Mason’s ratio remains more efficient than the average ratios at the other doctoral institutions in Virginia. Based on IPEDS Human Resource data for fall 2013 and the State Council of Higher Education for Virginia (SCHEV) fall 2013 headcount enrollment data, the difference between Mason’s number of total faculty and staff positions and the doctoral average is approximately 2.4 students per faculty/staff member. In order for Mason to operate with the same average number of positions per student as other Virginia doctoral institutions, Mason would have to add over 1,500 new positions to its current staffing complement.
DOCTORAL INSTITUTIONS
STUDENTS (HEADCOUNT) PER FACULTY &
STAFF POSITION College of William & Mary 3.6 University of Virginia 4.0 Virginia Tech 4.2 Virginia Commonwealth Univ 7.1 Old Dominion 9.3 Doctoral Average excluding Mason 5.6 GEORGE MASON UNIVERSITY 8.0
Source: Fall 2013 IPEDS Data, SCHEV
16
Faculty: Support Staff Ratios
Another ratio is the relationship of teaching positions to non-teaching positions. The FY 2016 budget for George Mason University establishes the ratio of 1,898 teaching to 2,034 non-teaching positions at approximately a 1:1.1 ratio, which is more efficient than the average for Mason’s national peer group.
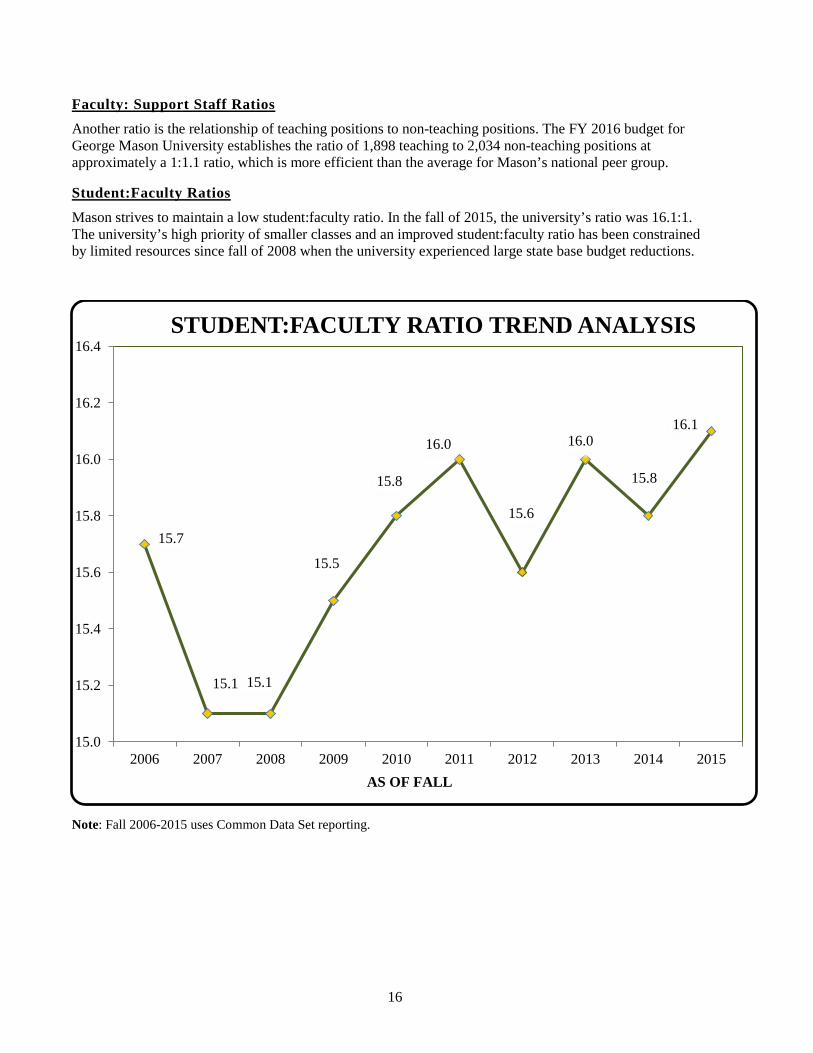
Student:Faculty Ratios
Mason strives to maintain a low student:faculty ratio. In the fall of 2015, the university’s ratio was 16.1:1. The university’s high priority of smaller classes and an improved student:faculty ratio has been constrained by limited resources since fall of 2008 when the university experienced large state base budget reductions.
Note: Fall 2006-2015 uses Common Data Set reporting.
15.7
15.1 15.1
15.5
15.8
16.0
15.6
16.0
15.8
16.1
15.0
15.2
15.4
15.6
15.8
16.0
16.2
16.4
2006 2007 2008 2009 2010 2011 2012 2013 2014 2015
STUDENT:FACULTY RATIO TREND ANALYSIS
AS OF FALL
17
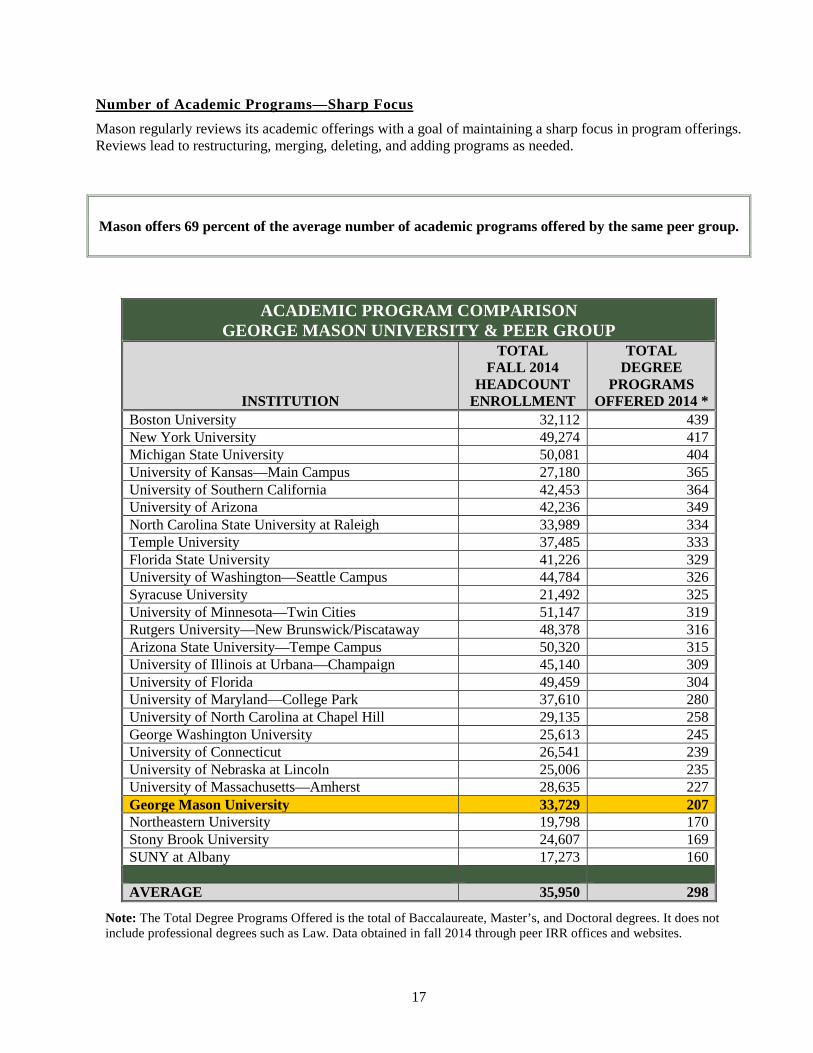
Number of Academic Programs—Sharp Focus
Mason regularly reviews its academic offerings with a goal of maintaining a sharp focus in program offerings. Reviews lead to restructuring, merging, deleting, and adding programs as needed.
Mason offers 69 percent of the average number of academic programs offered by the same peer group.
ACADEMIC PROGRAM COMPARISON GEORGE MASON UNIVERSITY & PEER GROUP
INSTITUTION
TOTAL FALL 2014
HEADCOUNT ENROLLMENT
TOTAL DEGREE
PROGRAMS OFFERED 2014 *
Boston University 32,112 439 New York University 49,274 417 Michigan State University 50,081 404 University of Kansas—Main Campus 27,180 365 University of Southern California 42,453 364 University of Arizona 42,236 349 North Carolina State University at Raleigh 33,989 334 Temple University 37,485 333 Florida State University 41,226 329 University of Washington—Seattle Campus 44,784 326 Syracuse University 21,492 325 University of Minnesota—Twin Cities 51,147 319 Rutgers University—New Brunswick/Piscataway 48,378 316 Arizona State University—Tempe Campus 50,320 315 University of Illinois at Urbana—Champaign 45,140 309 University of Florida 49,459 304 University of Maryland—College Park 37,610 280 University of North Carolina at Chapel Hill 29,135 258 George Washington University 25,613 245 University of Connecticut 26,541 239 University of Nebraska at Lincoln 25,006 235 University of Massachusetts—Amherst 28,635 227 George Mason University 33,729 207 Northeastern University 19,798 170 Stony Brook University 24,607 169 SUNY at Albany 17,273 160 AVERAGE 35,950 298
Note: The Total Degree Programs Offered is the total of Baccalaureate, Master’s, and Doctoral degrees. It does not include professional degrees such as Law. Data obtained in fall 2014 through peer IRR offices and websites.
18
INSTITUTIONAL PERFORMANCE STANDARDS
Changes to State Institutional Performance Standards
The Virginia Higher Education Restructuring Act was implemented in 2006 to increase institutional management flexibility in exchange for meeting accountability standards. The Institutional Performance Standards are designed to track institutional progress in meeting state higher education priorities by gathering information in a wide range of areas. With the passage of the Commonwealth’s 2011 Higher Education Opportunity Act, these measures are undergoing a revision. The current version of the Institutional Performance Measures was approved by the State Council of Higher Education for Virginia (SCHEV) at its November 19, 2012 meeting to replace section §4-9.02 Assessment of Institutional Performance of the 2012 Appropriation Act. Under the Act, institutions will be expected to meet the IPS measures in order to qualify for incentive funding offered by the Commonwealth.
The Institutional Performance Standard measures continue to focus on each institution’s contribution to the education of citizens of the Commonwealth. Institutions will be expected to meet 95 percent of the State Council approved biennial projections on the following measures:
• in-state undergraduate headcount (HC) enrollment, • in-state upper-level full-time equivalency (FTE) enrollment (juniors and seniors), • in-state bachelor degree awards, and • in-state bachelor degree awards in Science, Technology, Engineering, Math, and Health Sciences
(STEM/H). Two additional measures focus on access by requiring institutions to maintain or increase:
• the number of in-state associate and bachelor degrees awarded to students from underrepresented populations, and
• the number of in-state two-year transfers to four-year institutions: total those with an associate degree those with a guaranteed admission agreement
The State Council of Higher Education for Virginia will certify institutions based on these criteria and will recommend the institutions eligible to receive financial benefits such as incentive funds.
As part of the certification process, an institution that does not meet all of the Institutional Performance Standard measures is given an opportunity to explain the circumstances involved. SCHEV will determine if the institution will be certified and will recommend whether such institution will be denied access to incentive funding or other financial benefits for the subsequent biennium.

19
STRATEGIC PLAN, GEORGE MASON UNIVERSITY
Mason Vision: Executive Summary
Since its birth less than a half-century ago, George Mason University has grown impressively in size, stature, and influence. Now a standard-setter among modern public universities, Mason’s reach is both deep and broad, extending from Virginia, as the Commonwealth’s largest public university; throughout the United States, where its location near Washington, D.C., affords unique types of audiences, resources, and opportunities; and around the world, through its groundbreaking research on complex global problems and an expanding international student body. From the outset, Mason has not been content to coast or merely follow. Instead, it has crafted a new path; it has embraced new ideas and remained adaptable to the evolving needs of its community. A spirit of innovation and acceptance of wide-ranging viewpoints and cultures are ingrained in our community. In view of today’s complex global challenges and rapid pace of change, George Mason University is in a unique position to capitalize on its strengths and make an even greater impact—producing the very kinds of leaders, professionals, scholars, ideas, and solutions that our world needs. As we chart our future course, we have asked the following question: How can George Mason University become not necessarily the best university in the world, but the best university for the world? That is, what can Mason do—or do better—to produce the types of graduates, scholarship, and service-oriented action that will best serve society? This question framed the work of creating a bold and far-reaching vision and strategic plan. After extensive community-wide discussion and input from all parts of the Mason family, a new vision was constructed with the mission, values, and commitments that define our institution and the work we do, providing inspiration to propel Mason forward. Our vision further provides a foundation upon which our strategic plan has been constructed. The university’s primary responsibility is to advance society through education, research, and engagement with others. Our vision and strategic plan speak to this responsibility, building upon the successes of our past and creating an environment at Mason that is inclusive, inspirational, and focused not only on the needs of our institution, but also on the needs of those we serve. The strategic planning document that follows outlines the components of our vision—our mission (who we are), values (what we stand for), commitments (what we are committing to), the Mason IDEA (how we define ourselves), and the Mason graduate (whom we help develop). These foundational aspects of the vision precede the strategic plan, which comprises 12 areas of action that are focused in four key areas. Our plan lays out how we will strategically move forward in ways that positively impact our students, our community, our faculty and staff, and our world. Each of these areas is explicated via initiatives, narratives, and metrics that highlight areas of attention and action. The past year of vision and strategic planning has reinvigorated our community and confirmed our belief that George Mason University’s greatest days lie ahead. The details that follow provide a launching pad for propelling us into this bright future.
20
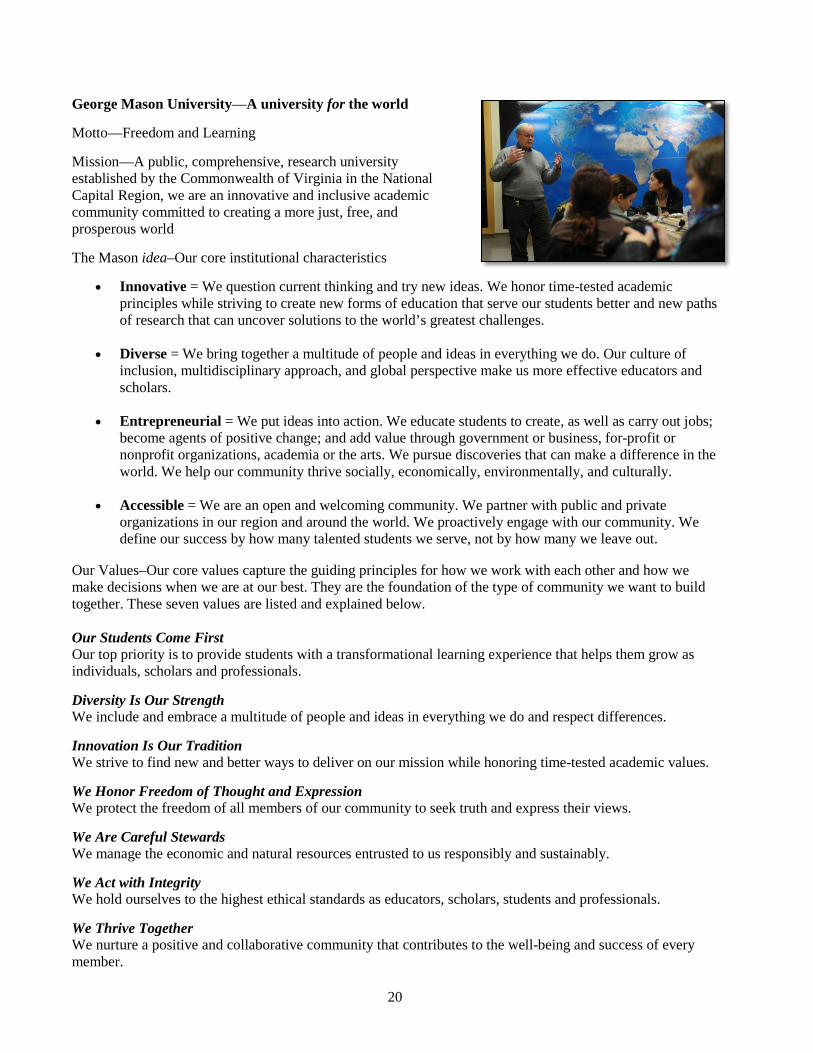
George Mason University—A university for the world
Motto—Freedom and Learning
Mission—A public, comprehensive, research university established by the Commonwealth of Virginia in the National Capital Region, we are an innovative and inclusive academic community committed to creating a more just, free, and prosperous world
The Mason idea–Our core institutional characteristics
• Innovative = We question current thinking and try new ideas. We honor time-tested academic principles while striving to create new forms of education that serve our students better and new paths of research that can uncover solutions to the world’s greatest challenges.
• Diverse = We bring together a multitude of people and ideas in everything we do. Our culture of inclusion, multidisciplinary approach, and global perspective make us more effective educators and scholars.
• Entrepreneurial = We put ideas into action. We educate students to create, as well as carry out jobs;
become agents of positive change; and add value through government or business, for-profit or nonprofit organizations, academia or the arts. We pursue discoveries that can make a difference in the world. We help our community thrive socially, economically, environmentally, and culturally.
• Accessible = We are an open and welcoming community. We partner with public and private
organizations in our region and around the world. We proactively engage with our community. We define our success by how many talented students we serve, not by how many we leave out.
Our Values–Our core values capture the guiding principles for how we work with each other and how we make decisions when we are at our best. They are the foundation of the type of community we want to build together. These seven values are listed and explained below. Our Students Come First Our top priority is to provide students with a transformational learning experience that helps them grow as individuals, scholars and professionals.
Diversity Is Our Strength We include and embrace a multitude of people and ideas in everything we do and respect differences.
Innovation Is Our Tradition We strive to find new and better ways to deliver on our mission while honoring time-tested academic values.
We Honor Freedom of Thought and Expression We protect the freedom of all members of our community to seek truth and express their views.
We Are Careful Stewards We manage the economic and natural resources entrusted to us responsibly and sustainably.
We Act with Integrity We hold ourselves to the highest ethical standards as educators, scholars, students and professionals.
We Thrive Together We nurture a positive and collaborative community that contributes to the well-being and success of every member.
21
The Mason Graduate Is–
• . . . an engaged citizen:
ethically oriented and committed to democratic ideals respectful of individual differences, rights, and liberties knowledgeable of important issues affecting the world focused on the well-being of others, today and tomorrow committed to building a just society
• . . . a well-rounded scholar:
thinks critically and creatively and demonstrates professional competence possesses an inquisitive nature appreciates science, humanities, and the arts skilled as a communicator committed to lifelong learning
• . . . prepared to act:
innovative, resourceful, and entrepreneurial; ready to do or create a job interested and practiced in working with individuals from other cultures, backgrounds, and
perspectives equipped to make positive and meaningful changes in society
Our Commitments–
• Learning Innovation: We will apply new and emerging learning technologies, environments, and methods to improve learning effectiveness and student completion, and to better serve the evolving needs of students, working professionals, and public, private, and nonprofit organizations.
• Research of Consequence: We will expand research as a central element of our mission; we will translate our discoveries into interventions and applications with social, cultural, and economic impact.
• Economic and Cultural Engine: We will act as a catalyst for the economic and cultural vibrancy of our region, as a growing source of talent in high demand disciplines, as an incubator of business and social enterprises, as a hub of lifelong learning, arts, and athletics, and as a research and learning partner for public, private, and nonprofit organizations.
• Engagement with the World: We will prepare our students to thrive in a global context by infusing global awareness, citizenship values, and learning opportunities across all fields, and we will partner with other organizations in solving global problems where our impact will be highest.
• Sound Investment: We will be a valuable investment for our students, taxpayers, and donors by focusing on outcomes, operational efficiency, and affordability. Specifically, we will
• Expand the number of graduates, the career prospects for our graduates, the impact of our research, and the value we provide to our community.
• Be sensitive to trends in household income in making decisions about tuition and financial aid.
• Enriching Work Environment: We will invest in recruiting, retaining, and developing talented and diverse faculty and academic and professional staff. We will prioritize the well-being of our community and create a vibrant campus life in which all members can grow and thrive.
• Foundation for the Future: We will aggressively seek additional sources of funding through higher levels of philanthropy; expanded online, certificate, and executive education programs; research grants; and the commercialization of intellectual property. We will also increase our engagement with alumni, strengthen the Mason brand nationally and internationally, and effectively communicate Mason’s value to stakeholders throughout Virginia and the National Capital Region.
22
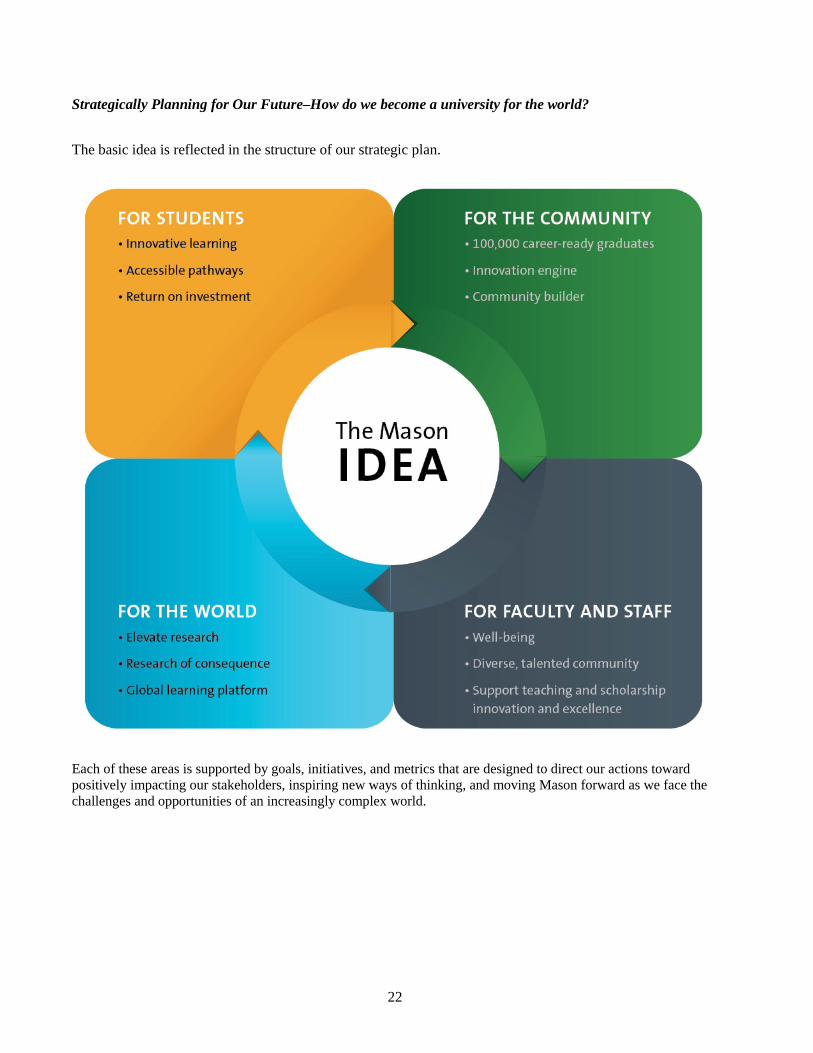
Strategically Planning for Our Future–How do we become a university for the world?
The basic idea is reflected in the structure of our strategic plan.
Each of these areas is supported by goals, initiatives, and metrics that are designed to direct our actions toward positively impacting our stakeholders, inspiring new ways of thinking, and moving Mason forward as we face the challenges and opportunities of an increasingly complex world.
23
Goals for Students– Goal 1: Innovative Learning – Deliver a transformative signature Mason Learning Experience that is experiential, global, and technology-rich. Goal 2: Accessible Pathways – Provide multiple pathways and delivery formats to serve the needs of different students. Goal 3: Return on Investment – Enable all graduates to pursue meaningful lives and successful careers. Goals for the Community– Goal 4: 100,000 Career-Ready Graduates – Produce the talent needed to drive economic growth in our region over the next decade. Goal 5: Innovation Engine – Contribute to the economic vitality of the region by driving innovation and creating learning partnerships with private and public organizations. Goal 6: Community Builder – Contribute to the cultural vitality of our community through regional partnerships and commitments to the arts, athletics, and community engagement. Goals for Faculty and Staff– Goal 7: Well-being – Become a model well-being university that allows all of its members to thrive. Goal 8: Diverse Academic Community – Create an inclusive and diverse academic community that reflects the diversity of the National Capital Region. Goal 9: Support Teaching and Scholarship Excellence – Provide an environment and resources to support and encourage academic innovation and excellence. Goals for the World– Goal 10: Elevate Research – Expand research and enhance standards of scholarship across disciplines.
Goal 11: Research of Consequence – Strategically focus on multidisciplinary domains of great societal and economic consequence where we can make a difference. Goal 12: Global Learning Platform – Create partnerships and other arrangements to support student and faculty mobility and collaboration.

24

25
EDUCATIONAL AND GENERAL
The Educational and General (E&G) budget is the largest portion of the budget within the university. The E&G budget (excluding philanthropic funds) represents 56 percent of Mason’s total operating budget and 51 percent of the overall total budget. The Educational and General budget is comprised of seven expenditure programs that directly support the university’s mission of teaching, research, and public service.
PROGRAM
ACTIVITIES
Instruction Instructional Faculty, Departmental Costs Academic Support Deans and Directors, School Level Costs Libraries Professional Librarians, Library Reference Materials Technology University Computing, Both Academic/Administrative Costs Student Services Registrar, Admissions, Financial Aid, Career Services, Univ Life, etc. Institutional Support Executive Management, Purchasing, Payroll, Fiscal Services, etc. Physical Plant Building Maintenance, Physical Plant Personnel, Utilities, Police, EHS, etc.
EDUCATIONAL AND GENERAL REVENUES
Total E&G revenues (excluding philanthropic funds) for FY 2017 are projected at $514.8 million, which is approximately $29.4 million more than the original FY 2016 budget of $485.4 million. In FY 2017, the General Fund will provide approximately 28 percent of the total sources available for the E&G budget. Tuition and other E&G funds will provide approximately 72 percent of the total sources available. When compared to the early 2000s, this picture continues to show the shift of having students and other revenue sources fund the majority of the cost for higher education’s Educational and General budgets. The General Funds received by the university saw significant reductions during FY 2015, which become permanent in FY 2016. During the budget development in early fall of 2015 and through the legislative cycle, additional General Funds were provided to institutions of higher education for FY 2017. Mason will see a projected overall General Fund increase of approximately $10.9 million. The increase will support a state-supported salary increase of 3 percent (on average), increasing healthcare and pension costs, continuation of the development for a pathway program to attract and train veterans for cybersecurity careers, new facilities coming online, and support for prior year in-state enrollment growth.

26
Note: General Fund includes $4.4M in Equipment Trust Funds.
General Fund
While FY 2017 all-funds General Fund support of $218.7 million provides funding equal to approximately 22 percent of total university revenues, this “total funding” ratio can be misleading since the General Fund amount includes both student financial aid and capital project support that can fluctuate significantly from year to year. Shown in the General Fund Trend Analysis chart is the ratio of General Fund support as a percentage of the E&G budget that funds core activities of the university. Since FY 2005, this core E&G General Fund support dropped from over 43 percent to approximately 28 percent projected in FY 2017. This was in large part due to the Commonwealth of Virginia not being in a position to provide commensurate financial support to higher education to address increased in-state student enrollment coupled with the several years of base budget reductions. As a result, in order to maintain quality, tuition charges have increased at rates beyond normal cost of inflation.
In FY 2014 and FY 2015, the increased share of the General Fund as a percentage of E&G reversed a 10-year trend of declining state support. Then due to the mid-year budget reduction in FY 2015, General Fund support decreased both as a percentage of the total E&G budget and on a per Virginia resident student FTE basis in FY 2016. Although total dollars have increased in General Fund support, the increases received in most recent years have been largely connected to state-supported compensation increases. This trend continues in FY 2017, yet it is encouraging to see some return of General Fund support for the university’s goals of access, affordability, quality, and degree completion initiatives.
$18.6
$142.9
$353.3
$0 $50 $100 $150 $200 $250 $300 $350 $400
All Other
General Fund
Tuition
FY 2017 SOURCE OF FUNDSTOTAL E&G REVENUE $514.8M
($ in millions)
WITHOUT PHILANTHROPIC
ACTIVITIES

27
In FY 2006, Mason was receiving approximately 72 percent of the average General Fund support per in-state FTE student among the Virginia doctoral schools and it continues to receive below the average of support, which shifts a greater burden of the cost to students. For FY 2016, Mason has been operating with approximately 77 percent of the average General Fund support per in-state FTE student among the Virginia doctoral schools (see table). The university anticipates a slight increase with the FY 2017 General Fund Budget.
GENERAL FUND SUPPORT PER IN-STATE STUDENT FTE
INSTITUTION FY 2006 FY 2016* University of Virginia $9,298 $8,420 William & Mary 8,599 7,833 Virginia Tech 8,108 6,893 Virginia Commonwealth 7,707 6,707 Old Dominion 6,095 5,884 Doctoral Average excluding Mason $7,961 $7,147 GEORGE MASON UNIVERSITY $5,756 $5,488 MASON % of Average 72.3% 76.8%
*General Fund per in-state student estimate based on SCHEV FTE projection in the 2B report; numbers for all institutions will change with actual revised numbers. General Fund estimate includes budget reductions in FY 2016.
43% 42%42% 42%40%
34%
30%26% 26% 28% 28% 27% 28%
20%
25%
30%
35%
40%
45%
50%
2005 2006 2007 2008 2009 2010 2011 2012 2013 2014 2015 2016* 2017*
G.F
. Per
cent
age o
f E&
GGENERAL FUND TREND ANALYSIS
PERCENTAGE OF E&G
FISCAL YEAR* FY 2016 & 2017 reflect budget
28
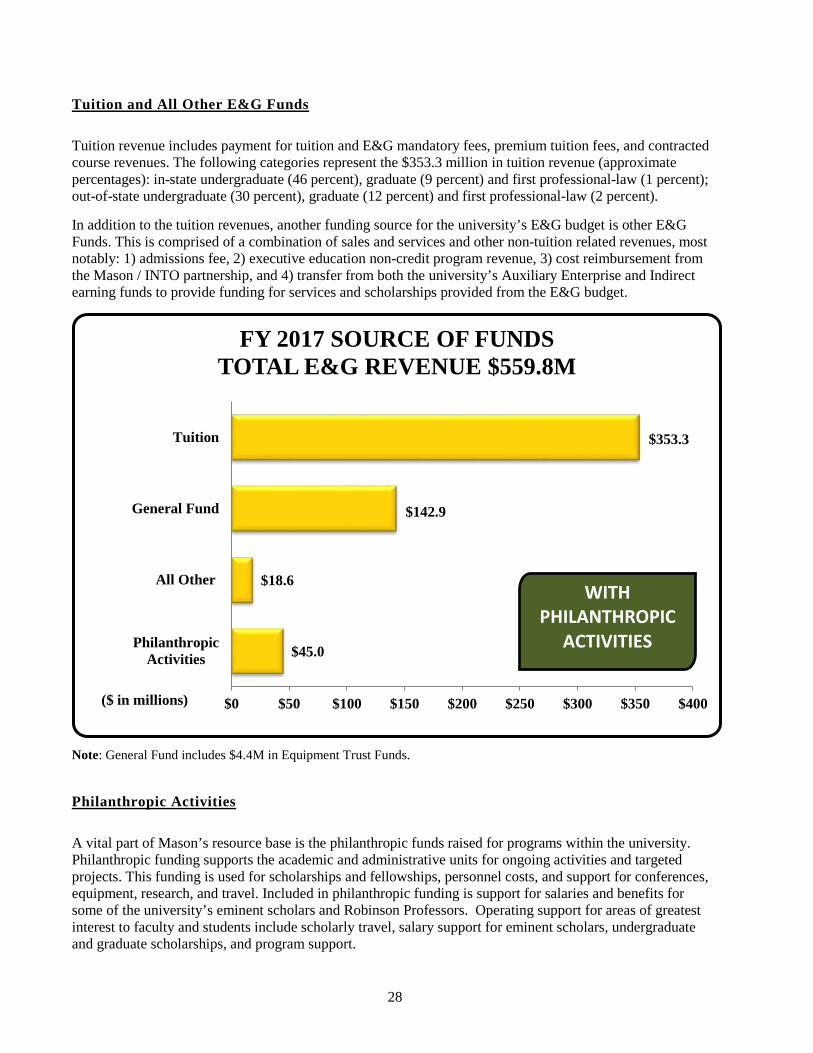
Tuition and All Other E&G Funds
Tuition revenue includes payment for tuition and E&G mandatory fees, premium tuition fees, and contracted course revenues. The following categories represent the $353.3 million in tuition revenue (approximate percentages): in-state undergraduate (46 percent), graduate (9 percent) and first professional-law (1 percent); out-of-state undergraduate (30 percent), graduate (12 percent) and first professional-law (2 percent).
In addition to the tuition revenues, another funding source for the university’s E&G budget is other E&G Funds. This is comprised of a combination of sales and services and other non-tuition related revenues, most notably: 1) admissions fee, 2) executive education non-credit program revenue, 3) cost reimbursement from the Mason / INTO partnership, and 4) transfer from both the university’s Auxiliary Enterprise and Indirect earning funds to provide funding for services and scholarships provided from the E&G budget.
Note: General Fund includes $4.4M in Equipment Trust Funds.
Philanthropic Activities
A vital part of Mason’s resource base is the philanthropic funds raised for programs within the university. Philanthropic funding supports the academic and administrative units for ongoing activities and targeted projects. This funding is used for scholarships and fellowships, personnel costs, and support for conferences, equipment, research, and travel. Included in philanthropic funding is support for salaries and benefits for some of the university’s eminent scholars and Robinson Professors. Operating support for areas of greatest interest to faculty and students include scholarly travel, salary support for eminent scholars, undergraduate and graduate scholarships, and program support.
$45.0
$18.6
$142.9
$353.3
$0 $50 $100 $150 $200 $250 $300 $350 $400
PhilanthropicActivities
All Other
General Fund
Tuition
FY 2017 SOURCE OF FUNDSTOTAL E&G REVENUE $559.8M
($ in millions)
WITH PHILANTHROPIC
ACTIVITIES
29
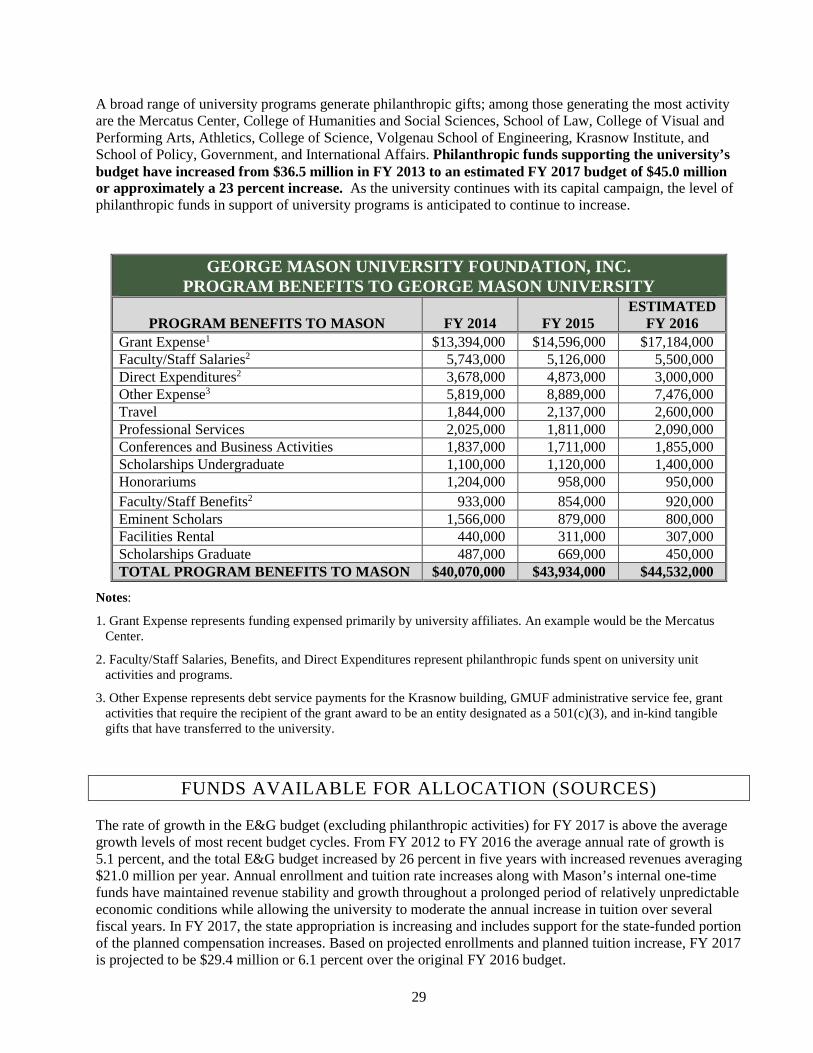
A broad range of university programs generate philanthropic gifts; among those generating the most activity are the Mercatus Center, College of Humanities and Social Sciences, School of Law, College of Visual and Performing Arts, Athletics, College of Science, Volgenau School of Engineering, Krasnow Institute, and School of Policy, Government, and International Affairs. Philanthropic funds supporting the university’s budget have increased from $36.5 million in FY 2013 to an estimated FY 2017 budget of $45.0 million or approximately a 23 percent increase. As the university continues with its capital campaign, the level of philanthropic funds in support of university programs is anticipated to continue to increase.
GEORGE MASON UNIVERSITY FOUNDATION, INC. PROGRAM BENEFITS TO GEORGE MASON UNIVERSITY
PROGRAM BENEFITS TO MASON FY 2014 FY 2015
ESTIMATED FY 2016
Grant Expense1 $13,394,000 $14,596,000 $17,184,000 Faculty/Staff Salaries2 5,743,000 5,126,000 5,500,000 Direct Expenditures2 3,678,000 4,873,000 3,000,000 Other Expense3 5,819,000 8,889,000 7,476,000 Travel 1,844,000 2,137,000 2,600,000 Professional Services 2,025,000 1,811,000 2,090,000 Conferences and Business Activities 1,837,000 1,711,000 1,855,000 Scholarships Undergraduate 1,100,000 1,120,000 1,400,000 Honorariums 1,204,000 958,000 950,000 Faculty/Staff Benefits2 933,000 854,000 920,000 Eminent Scholars 1,566,000 879,000 800,000 Facilities Rental 440,000 311,000 307,000 Scholarships Graduate 487,000 669,000 450,000 TOTAL PROGRAM BENEFITS TO MASON $40,070,000 $43,934,000 $44,532,000
Notes:
1. Grant Expense represents funding expensed primarily by university affiliates. An example would be the Mercatus Center.
2. Faculty/Staff Salaries, Benefits, and Direct Expenditures represent philanthropic funds spent on university unit activities and programs.
3. Other Expense represents debt service payments for the Krasnow building, GMUF administrative service fee, grant activities that require the recipient of the grant award to be an entity designated as a 501(c)(3), and in-kind tangible gifts that have transferred to the university.
FUNDS AVAILABLE FOR ALLOCATION (SOURCES)
The rate of growth in the E&G budget (excluding philanthropic activities) for FY 2017 is above the average growth levels of most recent budget cycles. From FY 2012 to FY 2016 the average annual rate of growth is 5.1 percent, and the total E&G budget increased by 26 percent in five years with increased revenues averaging $21.0 million per year. Annual enrollment and tuition rate increases along with Mason’s internal one-time funds have maintained revenue stability and growth throughout a prolonged period of relatively unpredictable economic conditions while allowing the university to moderate the annual increase in tuition over several fiscal years. In FY 2017, the state appropriation is increasing and includes support for the state-funded portion of the planned compensation increases. Based on projected enrollments and planned tuition increase, FY 2017 is projected to be $29.4 million or 6.1 percent over the original FY 2016 budget.

30
ORIGINAL EDUCATIONAL AND GENERAL BUDGET
FY 2012 FY 2013 FY 2014 FY 2015 FY 2016 FY 2017 Amount $409.6M $447.4M $456.8M $475.1M $485.4M $514.8M Increase ($) $15.7M $37.8M $9.4M $18.3M $10.3M $29.4M Increase (%) 4.0% 9.2% 2.1% 4.0% 2.2% 6.1%
Note: Original Budget numbers includes Equipment Trust Fund (ETF).
Budget Focus & Priority
Mason has a long history and takes great pride in allocating the majority of its limited resources to its core mission. This philosophy has maximized resource effectiveness and continues to illustrate Mason’s commitment and focus on a mission-based allocation of resources. The following table compares the allocation of funds by year and major programs within the E&G budget.
The E&G budget also includes a central reserve of $4.0 million (or approximately 0.8 percent) of the E&G operating budget. This represents the only portion of the budget that is not allocated to specific program needs and is available for unplanned contingency requirements. If these funds remain unexpended at the end of the year, their intended one-time use is for high institutional priorities not covered by other funding sources. An example would be the FY 2017 one-time funds to support the expansion of the university’s online course delivery.
PERCENTAGE OF BUDGET BY MAJOR PROGRAM
FISCAL YEAR 2012 2013 2014 2015 2016 2017 Instruction/Academic Support 59.0% 59.7% 59.6% 59.3% 60.2% 61.2% Library 5.3% 5.1% 5.1% 5.2% 4.8% 4.8% Technology 7.0% 7.3% 7.3% 7.2% 6.9% 6.7% Student Services 4.7% 4.8% 4.8% 4.9% 5.3% 5.3% Institutional Support* 10.0% 10.5% 8.3% 8.8% 8.6% 7.8% Physical Plant* 9.9% 9.1% 11.4% 11.1% 10.7% 10.4% Financial Aid ** 1.8% 1.8% 1.9% 1.9% 2.0% 2.1% Equipment Trust Fund 0.8% 0.8% 0.8% 0.8% 0.7% 0.9% Reserve 1.5% 0.9% 0.9% 0.8% 0.8% 0.8% TOTAL 100.0% 100.0% 100.0% 100.0% 100.0% 100.0%
* Due to a change in reporting requirements, for FY 2014 both Campus Safety (Police) and Environmental Health and Safety moved from Institutional Support to Physical Plant.
** Does not include funds budgeted as discounts to tuition and fees. These discounts represent approximately 4.2 percent of the E&G expense budget. If included as expenses, the total percentage of E&G would be 6.4 percent.
Mason is committed to protecting the core and continues to allocate a greater percentage of its E&G budget to instruction than most of the other Virginia doctoral institutions.
31
USE OF FUNDS / EXPENSES
Use Overview
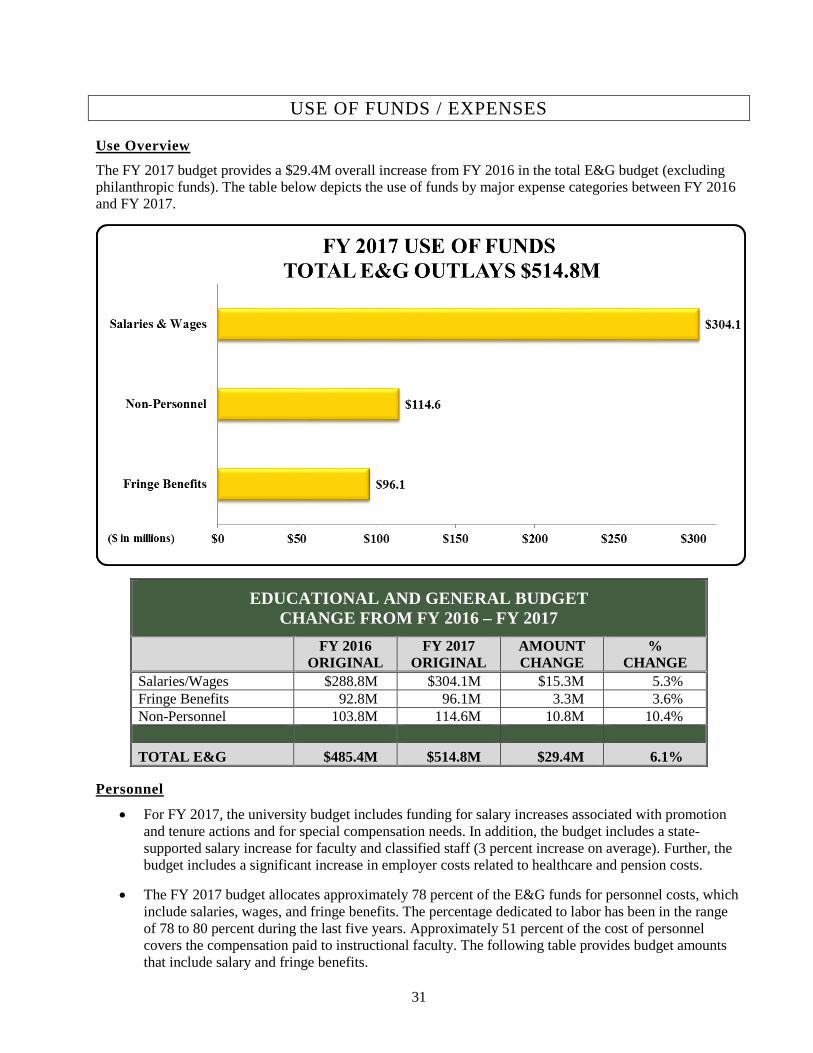
The FY 2017 budget provides a $29.4M overall increase from FY 2016 in the total E&G budget (excluding philanthropic funds). The table below depicts the use of funds by major expense categories between FY 2016 and FY 2017.
EDUCATIONAL AND GENERAL BUDGET CHANGE FROM FY 2016 – FY 2017
FY 2016
ORIGINAL FY 2017
ORIGINAL AMOUNT CHANGE
% CHANGE
Salaries/Wages $288.8M $304.1M $15.3M 5.3% Fringe Benefits 92.8M 96.1M 3.3M 3.6% Non-Personnel 103.8M 114.6M 10.8M 10.4% TOTAL E&G $485.4M $514.8M $29.4M 6.1%
Personnel
• For FY 2017, the university budget includes funding for salary increases associated with promotion and tenure actions and for special compensation needs. In addition, the budget includes a state-supported salary increase for faculty and classified staff (3 percent increase on average). Further, the budget includes a significant increase in employer costs related to healthcare and pension costs.
• The FY 2017 budget allocates approximately 78 percent of the E&G funds for personnel costs, which include salaries, wages, and fringe benefits. The percentage dedicated to labor has been in the range of 78 to 80 percent during the last five years. Approximately 51 percent of the cost of personnel covers the compensation paid to instructional faculty. The following table provides budget amounts that include salary and fringe benefits.

32
EDUCATIONAL AND GENERAL PERSONNEL EXPENSE
PERSONNEL TYPE
FY 2017
BUDGET % OF
PERSONNEL Instructional Faculty $202.7M 50.6% Admin Faculty 68.9M 17.2% Classified Staff 118.6M 29.7% Wages/Student Wages 10.0M 2.5% TOTAL PERSONNEL EXPENSE $400.2M 100.0%
EDUCATIONAL AND GENERAL BUDGET FULL-TIME EQUIVALENT FACULTY AND STAFF POSITIONS BY MAJOR PROGRAM
Total Positions (FTE) FY 2016 Total Positions (FTE) FY 2017
Faculty Staff Total Faculty Staff Total Instruction/Academic Support 1,856 626 2,482 1,897 648 2,545 Library 0 141 141 0 142 142 Technology 0 229 229 0 223 223 Student Services 0 252 252 0 257 257 Institutional Support 0 415 415 0 424 424 Plant 0 350 350 0 352 352 TOTAL 1,856 2,013 3,869 1,897 2,046 3,943
Instructional Faculty
In FY 2017, Mason plans to add an additional 41 FTE in instructional faculty (which includes part-time instructors and graduate teaching assistants) compared to the original FY 2016 budget. Actual instructional faculty spending reflects the use of adjunct faculty and graduate assistants as the colleges and schools meet enrollment demands. The success or failure in filling full-time faculty positions impacts the use of both adjunct faculty and graduate assistants. Consequently, actual expenses for full-time and adjunct faculty and graduate assistants typically vary from the original budget which can be seen in the table that follows.
Administrative Staff & Wage Support
In FY 2017, approximately 33 FTE staff positions will be added across various units to provide critical support for new programs and increased enrollment. Staff position changes are in areas of instruction and research support, student services, regulatory reporting and compliance requirements, as well as unit reorganizations. Some units are realizing adjustments, primarily decreases, in position levels.
Wage personnel expenditures account for approximately 2.5 percent of personnel costs. In most years, the wage (or temporary staff) budget is established at a level of funding substantially lower than actual prior year spending levels. Additional temporary staff are largely funded through reallocation of permanent staff lines, which are fully funded in the budget, as vacancies and turnover occur.
The university uses wage and student wage workers to meet its demand to support new enrollment and programs within the university. That level of wage spending equates to approximately 165 FTE staff positions.
33
EDUCATIONAL AND GENERAL PERSONNEL COSTS BY EMPLOYEE TYPE
FY 2012 ACTUAL
FY 2013 ACTUAL
FY 2014 ACTUAL
FY 2015 ACTUAL
FY 2016 BUDGET
FY 2017 BUDGET
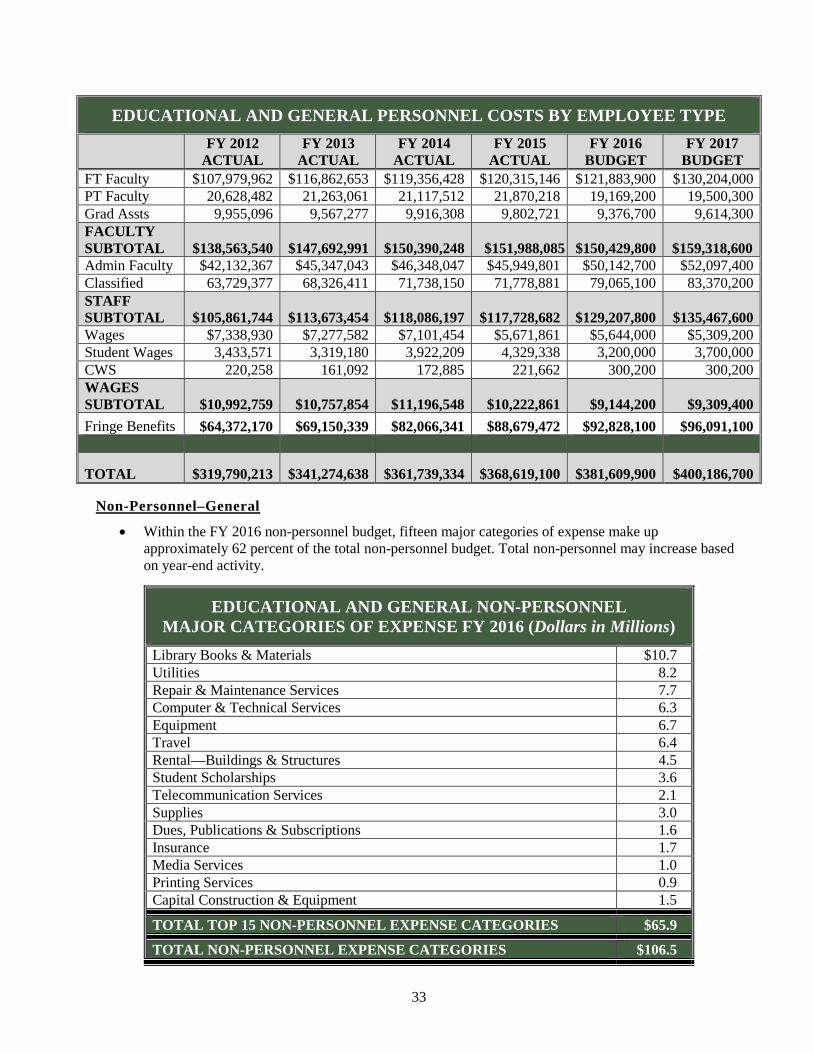
FT Faculty $107,979,962 $116,862,653 $119,356,428 $120,315,146 $121,883,900 $130,204,000 PT Faculty 20,628,482 21,263,061 21,117,512 21,870,218 19,169,200 19,500,300 Grad Assts 9,955,096 9,567,277 9,916,308 9,802,721 9,376,700 9,614,300 FACULTY SUBTOTAL $138,563,540 $147,692,991 $150,390,248 $151,988,085 $150,429,800 $159,318,600 Admin Faculty $42,132,367 $45,347,043 $46,348,047 $45,949,801 $50,142,700 $52,097,400 Classified 63,729,377 68,326,411 71,738,150 71,778,881 79,065,100 83,370,200 STAFF SUBTOTAL $105,861,744 $113,673,454 $118,086,197 $117,728,682 $129,207,800 $135,467,600 Wages $7,338,930 $7,277,582 $7,101,454 $5,671,861 $5,644,000 $5,309,200 Student Wages 3,433,571 3,319,180 3,922,209 4,329,338 3,200,000 3,700,000 CWS 220,258 161,092 172,885 221,662 300,200 300,200 WAGES SUBTOTAL $10,992,759 $10,757,854 $11,196,548 $10,222,861 $9,144,200 $9,309,400 Fringe Benefits $64,372,170 $69,150,339 $82,066,341 $88,679,472 $92,828,100 $96,091,100
TOTAL $319,790,213 $341,274,638 $361,739,334 $368,619,100 $381,609,900 $400,186,700
Non-Personnel–General
• Within the FY 2016 non-personnel budget, fifteen major categories of expense make up approximately 62 percent of the total non-personnel budget. Total non-personnel may increase based on year-end activity.
EDUCATIONAL AND GENERAL NON-PERSONNEL MAJOR CATEGORIES OF EXPENSE FY 2016 (Dollars in Millions)
Library Books & Materials $10.7 Utilities 8.2 Repair & Maintenance Services 7.7 Computer & Technical Services 6.3 Equipment 6.7 Travel 6.4 Rental—Buildings & Structures 4.5 Student Scholarships 3.6 Telecommunication Services 2.1 Supplies 3.0 Dues, Publications & Subscriptions 1.6 Insurance 1.7 Media Services 1.0 Printing Services 0.9 Capital Construction & Equipment 1.5
TOTAL TOP 15 NON-PERSONNEL EXPENSE CATEGORIES $65.9
TOTAL NON-PERSONNEL EXPENSE CATEGORIES $106.5
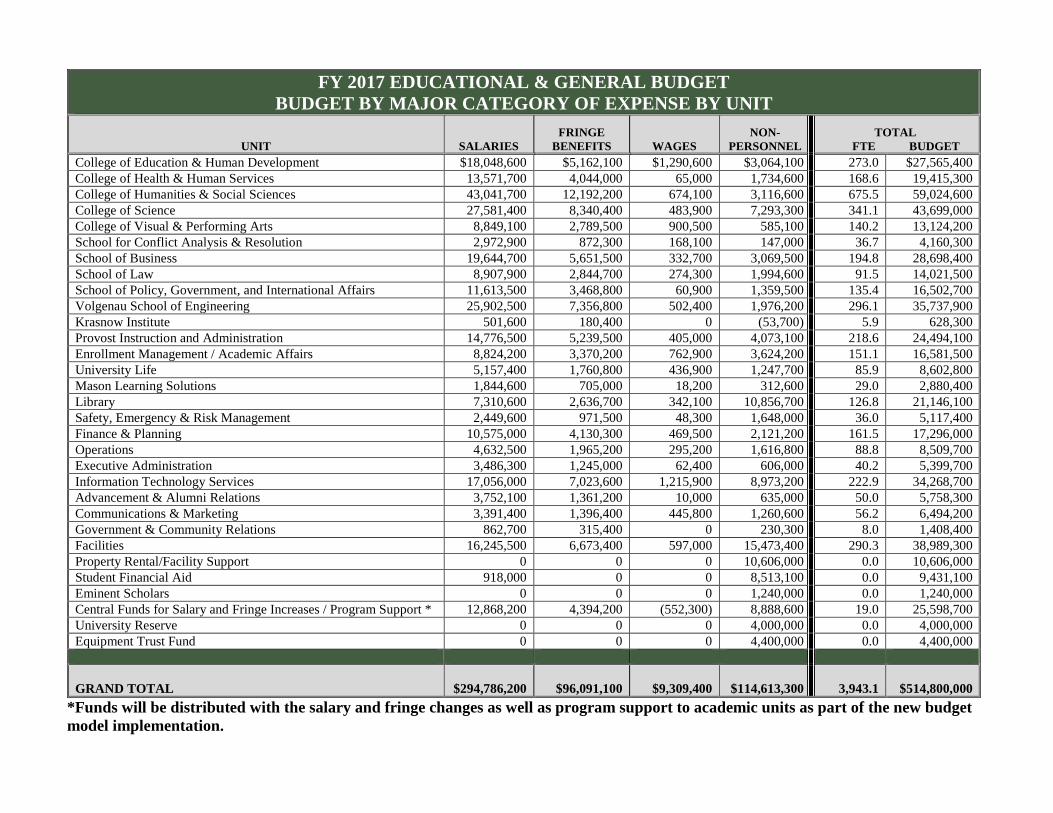
*Funds will be distributed with the salary and fringe changes as well as program support to academic units as part of the new budgetmodel implementation.
FY 2017 EDUCATIONAL & GENERAL BUDGET BUDGET BY MAJOR CATEGORY OF EXPENSE BY UNIT
UNIT SALARIES FRINGE
BENEFITS WAGES NON-
PERSONNEL TOTAL
FTE BUDGET College of Education & Human Development $18,048,600 $5,162,100 $1,290,600 $3,064,100 273.0 $27,565,400 College of Health & Human Services 13,571,700 4,044,000 65,000 1,734,600 168.6 19,415,300 College of Humanities & Social Sciences 43,041,700 12,192,200 674,100 3,116,600 675.5 59,024,600 College of Science 27,581,400 8,340,400 483,900 7,293,300 341.1 43,699,000 College of Visual & Performing Arts 8,849,100 2,789,500 900,500 585,100 140.2 13,124,200 School for Conflict Analysis & Resolution 2,972,900 872,300 168,100 147,000 36.7 4,160,300 School of Business 19,644,700 5,651,500 332,700 3,069,500 194.8 28,698,400 School of Law 8,907,900 2,844,700 274,300 1,994,600 91.5 14,021,500 School of Policy, Government, and International Affairs 11,613,500 3,468,800 60,900 1,359,500 135.4 16,502,700 Volgenau School of Engineering 25,902,500 7,356,800 502,400 1,976,200 296.1 35,737,900 Krasnow Institute 501,600 180,400 0 (53,700) 5.9 628,300 Provost Instruction and Administration 14,776,500 5,239,500 405,000 4,073,100 218.6 24,494,100 Enrollment Management / Academic Affairs 8,824,200 3,370,200 762,900 3,624,200 151.1 16,581,500 University Life 5,157,400 1,760,800 436,900 1,247,700 85.9 8,602,800 Mason Learning Solutions 1,844,600 705,000 18,200 312,600 29.0 2,880,400 Library 7,310,600 2,636,700 342,100 10,856,700 126.8 21,146,100 Safety, Emergency & Risk Management 2,449,600 971,500 48,300 1,648,000 36.0 5,117,400 Finance & Planning 10,575,000 4,130,300 469,500 2,121,200 161.5 17,296,000 Operations 4,632,500 1,965,200 295,200 1,616,800 88.8 8,509,700 Executive Administration 3,486,300 1,245,000 62,400 606,000 40.2 5,399,700 Information Technology Services 17,056,000 7,023,600 1,215,900 8,973,200 222.9 34,268,700 Advancement & Alumni Relations 3,752,100 1,361,200 10,000 635,000 50.0 5,758,300 Communications & Marketing 3,391,400 1,396,400 445,800 1,260,600 56.2 6,494,200 Government & Community Relations 862,700 315,400 0 230,300 8.0 1,408,400 Facilities 16,245,500 6,673,400 597,000 15,473,400 290.3 38,989,300 Property Rental/Facility Support 0 0 0 10,606,000 0.0 10,606,000 Student Financial Aid 918,000 0 0 8,513,100 0.0 9,431,100 Eminent Scholars 0 0 0 1,240,000 0.0 1,240,000 Central Funds for Salary and Fringe Increases / Program Support * 12,868,200 4,394,200 (552,300) 8,888,600 19.0 25,598,700 University Reserve 0 0 0 4,000,000 0.0 4,000,000 Equipment Trust Fund 0 0 0 4,400,000 0.0 4,400,000
GRAND TOTAL $294,786,200 $96,091,100 $9,309,400 $114,613,300 3,943.1 $514,800,000
3344
3343434

35
AUXILIARY ENTERPRISES
AUXILIARY ENTERPRISE REVENUES
The projected Auxiliary Enterprise revenue budget for FY 2017 represents approximately 25 percent of the university’s $1.0 billion total revenue budget and represents the second largest component of the institutional budget. Auxiliary Enterprises by definition include activities that are ancillary to the university’s central mission of instruction, service, and research. Auxiliary Enterprises include operations and activities that are: a) self-supporting through revenues that they generate; b) supported by both revenues that they generate and student fees; or c) funded exclusively through student fees.
Auxiliary Enterprise revenues (inclusive of independent operations) are budgeted at $253.3 million in FY 2017. This represents approximately 4.4 percent growth in revenues over the FY 2016 original budget of $242.7 million.
For FY 2017, the revenue growth in Auxiliary Enterprises is projected to be approximately $10.6 million. This growth reflects $5.6 million increase in independent operations activities, $4.7 million increase in student fee revenue, and $0.3 million increase of self-generated revenue.

36
AUXILIARY ENTERPRISES SOURCE OF FUNDS SOURCE ($ in Millions)
ORIGINAL FY 2014
ORIGINAL FY 2015
ORIGINAL FY 2016
ORIGINAL FY 2017
CHANGE, FY 2016-2017 AMOUNT PERCENT
Student Fees $71.9 $76.9 $79.2 $83.9 $4.7 5.9% User Fees 120.9 124.4 136.3 136.6 0.3 0.2% Independent Operations 30.5 31.0 27.2 32.8 5.6 20.6% TOTAL $223.3 $232.3 $242.7 $253.3 $10.6 4.4%
The table below identifies the ten largest programs and activities included within Auxiliary Enterprises. They represent approximately 75.5 percent of the Auxiliary Enterprise revenue.
*Dining commission goes to Dining and Auxiliary central.
Independent Operations
Auxiliary Enterprises include seven independent operations: 1) Bookstore; 2) Dining; 3) Arena Management (EagleBank Arena); 4) Privately owned housing; 5) Vending; 6) Independent retail operations; and 7) Collegiate Licensing Company (trademark licensing). A third party manages each operation through their own corporate financial and accounting system. The total budget of all independent operations is $63.5 million, and includes $10.4 million of commissions that are returned to George Mason University in exchange for the vendor’s exclusive right to provide the service on campus. The university provides oversight and guidance for these operations, conducts regular audits, and receives annual commissions. These annual commissions are used to support Auxiliary Enterprise operations and activities and thereby reduce Mason’s dependence upon student fees. These annual commissions of $10.4 million reduced the required per person student fee by approximately over $300 annually!
FY 2017 AUXILIARY ENTERPRISES REVENUE BY MAJOR PROGRAMS AND ACTIVITIES
FY 2017 ACTIVITY
INDEPENDENT OPERATIONS
COMMISSION
USER FEE REVENUE
STUDENT FEES
TOTAL REVENUE
Housing & Residence Life $3,944,900 $657,700 $45,558,100 $0 $50,160,700 Dining* 11,215,400 5,956,700 20,257,400 0 37,429,500 Intercollegiate Athletics 0 0 4,934,100 14,951,100 19,885,200 Campus Access/Transportation 0 0 13,829,300 3,959,500 17,788,800 Arts Centers 0 0 6,951,600 7,092,600 14,044,200 Student Centers 0 0 2,751,100 8,923,100 11,674,200 University Life 0 0 2,349,100 8,237,400 10,586,500 Indirect Cost 0 0 700,000 9,825,000 10,525,000 Bookstore 8,300,000 1,600,000 0 0 9,900,000 Recreational Department 0 0 1,635,600 7,558,400 9,194,000 TOTAL $23,460,300
$8,214,400 $98,966,300 $60,547,100 $191,188,100
37
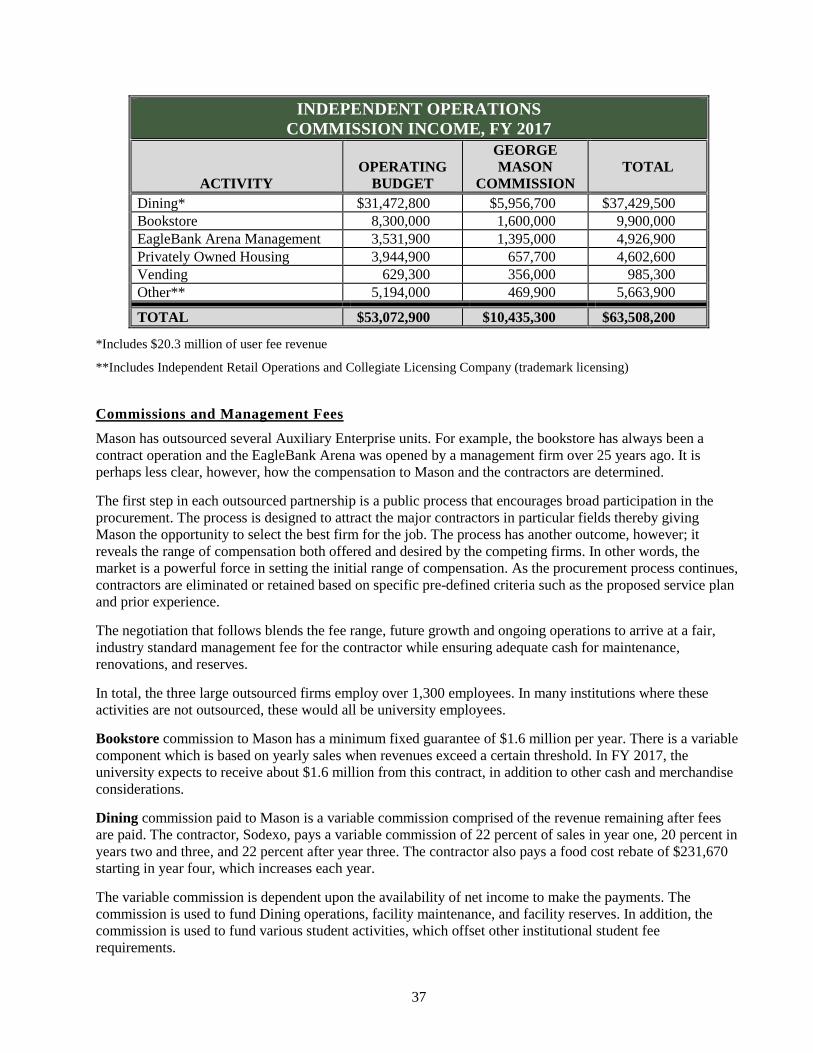
INDEPENDENT OPERATIONS COMMISSION INCOME, FY 2017
ACTIVITY
OPERATING BUDGET
GEORGE MASON
COMMISSION
TOTAL
Dining* $31,472,800 $5,956,700 $37,429,500 Bookstore 8,300,000 1,600,000 9,900,000 EagleBank Arena Management 3,531,900 1,395,000 4,926,900 Privately Owned Housing 3,944,900 657,700 4,602,600 Vending 629,300 356,000 985,300 Other** 5,194,000 469,900 5,663,900
TOTAL $53,072,900 $10,435,300 $63,508,200
*Includes $20.3 million of user fee revenue
**Includes Independent Retail Operations and Collegiate Licensing Company (trademark licensing)
Commissions and Management Fees
Mason has outsourced several Auxiliary Enterprise units. For example, the bookstore has always been a contract operation and the EagleBank Arena was opened by a management firm over 25 years ago. It is perhaps less clear, however, how the compensation to Mason and the contractors are determined.
The first step in each outsourced partnership is a public process that encourages broad participation in the procurement. The process is designed to attract the major contractors in particular fields thereby giving Mason the opportunity to select the best firm for the job. The process has another outcome, however; it reveals the range of compensation both offered and desired by the competing firms. In other words, the market is a powerful force in setting the initial range of compensation. As the procurement process continues, contractors are eliminated or retained based on specific pre-defined criteria such as the proposed service plan and prior experience.
The negotiation that follows blends the fee range, future growth and ongoing operations to arrive at a fair, industry standard management fee for the contractor while ensuring adequate cash for maintenance, renovations, and reserves.
In total, the three large outsourced firms employ over 1,300 employees. In many institutions where these activities are not outsourced, these would all be university employees.
Bookstore commission to Mason has a minimum fixed guarantee of $1.6 million per year. There is a variable component which is based on yearly sales when revenues exceed a certain threshold. In FY 2017, the university expects to receive about $1.6 million from this contract, in addition to other cash and merchandise considerations.
Dining commission paid to Mason is a variable commission comprised of the revenue remaining after fees are paid. The contractor, Sodexo, pays a variable commission of 22 percent of sales in year one, 20 percent in years two and three, and 22 percent after year three. The contractor also pays a food cost rebate of $231,670 starting in year four, which increases each year.
The variable commission is dependent upon the availability of net income to make the payments. The commission is used to fund Dining operations, facility maintenance, and facility reserves. In addition, the commission is used to fund various student activities, which offset other institutional student fee requirements.
38
Arena Management (EagleBank Arena) commission to Mason is composed of both a guaranteed and variable amount. The guaranteed amount is $675,000 in the first year and increases to $715,000 in the fifth year of the contract. The variable amount is 80.0 percent of revenues net of fixed management fee and guaranteed commission to Mason. The variable amount changes by year depending on the success of the performances.
The contractor, Monumental Sports & Entertainment, is paid an annual fixed fee of $435,000 in the first year that increases to $465,000 in the fifth year of the contract. In addition, the contractor receives a variable fee of 20.0 percent of revenues net of fixed management fee and guaranteed commission to Mason.
In addition to the yearly commission, Mason receives tickets and other considerations from Monumental Sports & Entertainment as part of the overall contract.
Privately Owned Housing is the Potomac Heights resident hall with over 500 beds in apartment style housing. Potomac Heights is owned by George Mason University Foundation and operated by Mason’s Housing and Residence Life, for which Mason receives a distribution of funds.
Vending contracts are with Coca-Cola and Canteen to manage all the university’s beverage and snack machines. The vending contracts generate $330,000 in commissions, which supports student athletes and University Scholars in the Honors program.
Independent Retail Operations include rental and commission contracts with Panera, Panda Express, Manhattan Pizza, and UPS. Wing Zone and Argo Tea will open prior to FY17. Each contract is separately negotiated and includes both a base rent and a percentage commission over certain revenue targets.
Collegiate Licensing Company (CLC) provides trademark licensing for all Mason products, assisting with brand protection and brand management, and helping to set royalty rates on Mason products. CLC provides over $100,000 in annual commissions.
Note: Although these independent operations are critical to the university, however, their operating budgets are not part of the State Auxiliary Enterprise program for reporting purposes.

39
Revenue Changes
• Student fee revenue increases by approximately $4.7 million, with additional revenue coming from an annual student fee rate increase of four percent and growth in enrollment primarily due to increased population of Mason INTO students.
• Within user fee activities, the units that generate most increases in self-generated revenue are Housing and Residence Life of $1.0 million, Student Health Services of $0.8 million, EagleBank Arena of $0.5 million, and Telecommunications of $0.3 million.
• The decrease of $2.3 million is primarily due to a reconfiguration of Meal Plan revenues.

40
NEW STUDENT FEE REQUIREMENTS
In FY 2017, Auxiliary Enterprises that are funded by student fees will incur increased costs, thereby requiring additional student fee support. The major reasons for an increase in the fee are to fund AE student fee funded salary and compensation increases, to enhance University Life programs and services, to provide additional funding for student scholarships, to support the university’s shuttle services, and to support facility maintenance needs.
MAJOR ALLOCATION OF INCREASED STUDENT FEE, FY 2017
• State approved salary & compensation increases $1,500,000
• University Life program and service enhancements $1,000,000
• University Scholars financial aid and other student support services $700,000
• Facility, maintenance, and operating reserves $500,000
• Athletic scholarships & general operating funds $360,000
• General operating funds for Transportation shuttle services $240,000
• General operating funds for AE Indirect Cost $200,000
• General operating funds for Arts Centers $200,000
STUDENT FEE REQUIREMENT $4,700,000

41
The table below summarizes the revenue budget by revenue type for Auxiliary Enterprise major units in FY 2017.
AUXILIARY ENTERPRISES REVENUE BUDGET, FY 2017
ENTERPRISE UNIT STUDENT FEES
SELF-GENERATED TOTAL
Housing & Residence Life $0 $46,215,800 $46,215,800 Dining 0 24,007,100 24,007,100 Intercollegiate Athletics 14,951,100 4,934,100 19,885,200 Arts Centers 7,092,600 6,921,600 14,014,200 Campus Access 757,300 11,988,300 12,745,600 Auxiliary Central 8,772,300 3,445,300 12,217,600 Student Centers 8,923,100 2,751,100 11,674,200 University Life 8,237,400 2,349,100 10,586,500 Indirect Cost 9,825,000 700,000 10,525,000 Recreational Department 7,558,400 1,635,600 9,194,000 Freedom Aquatic & Fitness Center 156,800 6,401,900 6,558,700 Student Health Services 2,676,600 3,750,600 6,427,200 ITS Telecommunications 163,300 4,900,000 5,063,300 Transportation 3,202,200 1,841,000 5,043,200 Computer Store 0 4,050,000 4,050,000 Global Center Debt Service 0 2,893,200 2,893,200 University Scholars 2,249,300 224,200 2,473,500 Field House (RSC) 2,435,700 11,700 2,447,400 Facility Reserves 1,800,000 554,400 2,354,400 EagleBank Arena 1,538,200 785,000 2,323,200 AE Administration 1,981,600 93,500 2,075,100 Child Development Center 0 1,895,600 1,895,600 Print Services 43,500 1,445,600 1,489,100 Mason Card Office 711,800 193,000 904,800 Central Utility Plant Debt Service 0 728,100 728,100 Founders Hall-Debt Service 0 689,500 689,500 Independent Retail Ops 0 643,600 643,600 The Bookstores 0 582,600 582,600 AE Police Cadet/Access 391,900 0 391,900 Aquia Building-Debt Service 309,000 0 309,000 Regional Campuses 70,900 0 70,900 Subtotal Aux Ent Budget $83,848,000 $136,631,500 $220,479,500 Independent Operations $32,815,500 GRAND TOTAL $83,848,000 $136,631,500 $253,295,000
42
USE OF FUNDS/EXPENSES
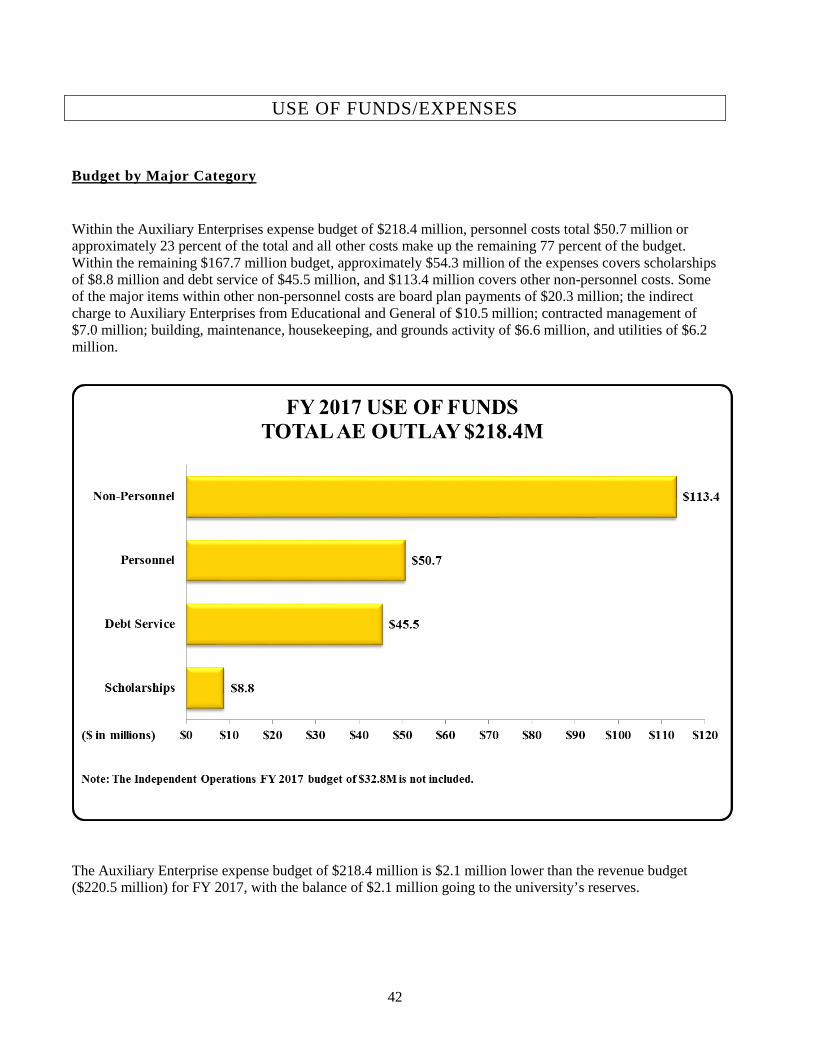
Budget by Major Category
Within the Auxiliary Enterprises expense budget of $218.4 million, personnel costs total $50.7 million or approximately 23 percent of the total and all other costs make up the remaining 77 percent of the budget. Within the remaining $167.7 million budget, approximately $54.3 million of the expenses covers scholarships of $8.8 million and debt service of $45.5 million, and $113.4 million covers other non-personnel costs. Some of the major items within other non-personnel costs are board plan payments of $20.3 million; the indirect charge to Auxiliary Enterprises from Educational and General of $10.5 million; contracted management of $7.0 million; building, maintenance, housekeeping, and grounds activity of $6.6 million, and utilities of $6.2 million.
The Auxiliary Enterprise expense budget of $218.4 million is $2.1 million lower than the revenue budget ($220.5 million) for FY 2017, with the balance of $2.1 million going to the university’s reserves.
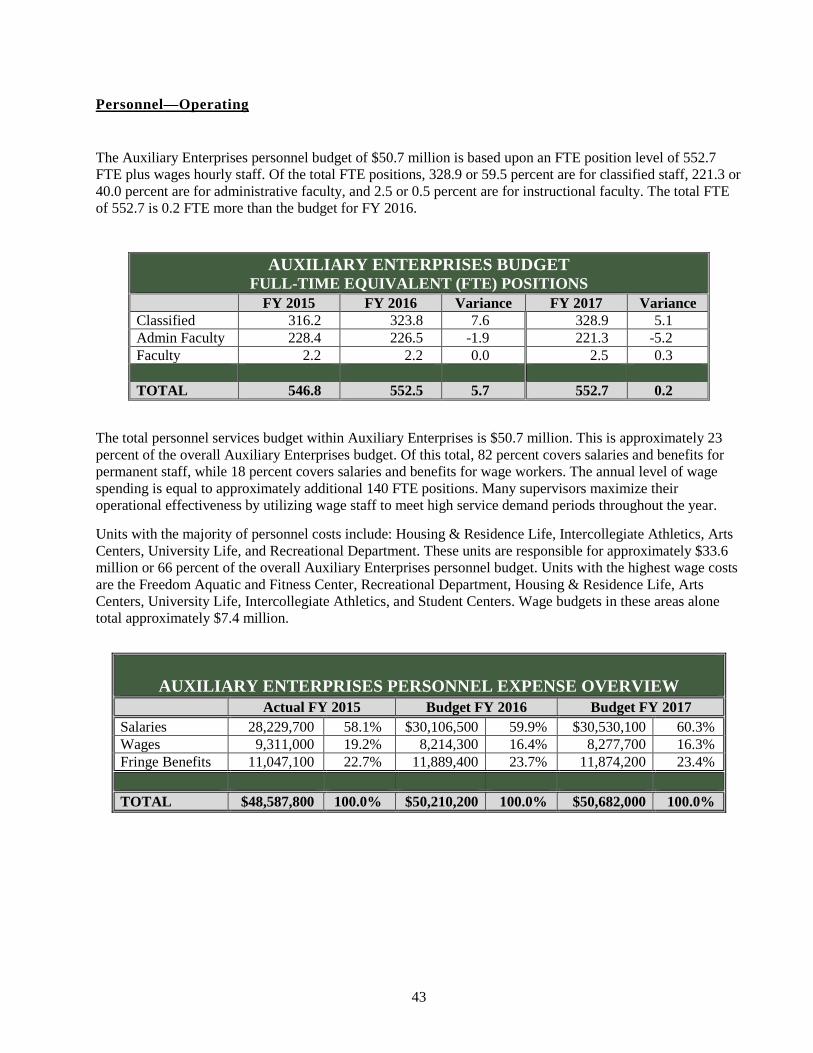
43
Personnel—Operating
The Auxiliary Enterprises personnel budget of $50.7 million is based upon an FTE position level of 552.7 FTE plus wages hourly staff. Of the total FTE positions, 328.9 or 59.5 percent are for classified staff, 221.3 or 40.0 percent are for administrative faculty, and 2.5 or 0.5 percent are for instructional faculty. The total FTE of 552.7 is 0.2 FTE more than the budget for FY 2016.
The total personnel services budget within Auxiliary Enterprises is $50.7 million. This is approximately 23 percent of the overall Auxiliary Enterprises budget. Of this total, 82 percent covers salaries and benefits for permanent staff, while 18 percent covers salaries and benefits for wage workers. The annual level of wage spending is equal to approximately additional 140 FTE positions. Many supervisors maximize their operational effectiveness by utilizing wage staff to meet high service demand periods throughout the year.
Units with the majority of personnel costs include: Housing & Residence Life, Intercollegiate Athletics, Arts Centers, University Life, and Recreational Department. These units are responsible for approximately $33.6 million or 66 percent of the overall Auxiliary Enterprises personnel budget. Units with the highest wage costs are the Freedom Aquatic and Fitness Center, Recreational Department, Housing & Residence Life, Arts Centers, University Life, Intercollegiate Athletics, and Student Centers. Wage budgets in these areas alone total approximately $7.4 million.
AUXILIARY ENTERPRISES BUDGET FULL-TIME EQUIVALENT (FTE) POSITIONS
FY 2015 FY 2016 Variance FY 2017 Variance Classified 316.2 323.8 7.6 328.9 5.1 Admin Faculty 228.4 226.5 -1.9 221.3 -5.2 Faculty 2.2 2.2 0.0 2.5 0.3 TOTAL 546.8 552.5 5.7 552.7 0.2
AUXILIARY ENTERPRISES PERSONNEL EXPENSE OVERVIEW
Actual FY 2015 Budget FY 2016 Budget FY 2017 Salaries 28,229,700 58.1% $30,106,500 59.9% $30,530,100 60.3% Wages 9,311,000 19.2% 8,214,300 16.4% 8,277,700 16.3% Fringe Benefits 11,047,100 22.7% 11,889,400 23.7% 11,874,200 23.4% TOTAL $48,587,800 100.0% $50,210,200 100.0% $50,682,000 100.0%

44
Non-Personnel—Operating
Within Auxiliary Enterprise activities, approximately $113.4 million is budgeted for non-personnel, excluding debt service and scholarships. The major expense categories in non-personnel are:
AUXILIARY ENTERPRISES MAJOR CATEGORIES OF NON-PERSONNEL EXPENSE BUDGET
Meal Plans $20,257,400 Indirect Cost 10,525,000 Campus Access/Parking 7,043,600 Building Maintenance, Housekeeping, Grounds 6,589,900 Utilities 6,194,500 Telecommunications 5,355,700 Athletics (Sports, Events) 4,755,000 Transportation 4,723,600 Computer Store Equipment 3,562,200 Insurance (Student Health) 3,033,000 Housing Renovations 2,401,200 Arts Centers Performances 1,657,900 TOTAL $76,099,000
These twelve items make up approximately 67 percent of the non-personnel budget (excluding debt service & scholarships) within Auxiliary Enterprises.
Non-Personnel—Debt Service
During FY 2017, the university will make $45.5 million in debt service payments from Auxiliary Enterprises for parking, residential housing, recreation, and student activity facilities. This represents approximately 21 percent of the overall Auxiliary Enterprises expenditure plan.
Over the last few years, debt for some facilities has been completed, allowing the university to reallocate funds for student activities or other funding requirements. In the next five years, approximately $13.5 million or 30 percent of the existing Auxiliary Enterprise debt service payments will be eliminated, thereby reducing the financial burden currently placed upon several programs funded by student fees and user fees. Of the total debt service payments to be reduced, approximately $4.0 million is funded by student fees, while $3.5 million is financed through user fees of residential housing and another $6.0 million is supported by other self-generated revenue funds. This reduction does not represent projects that may start to pay for debt service during this time frame.
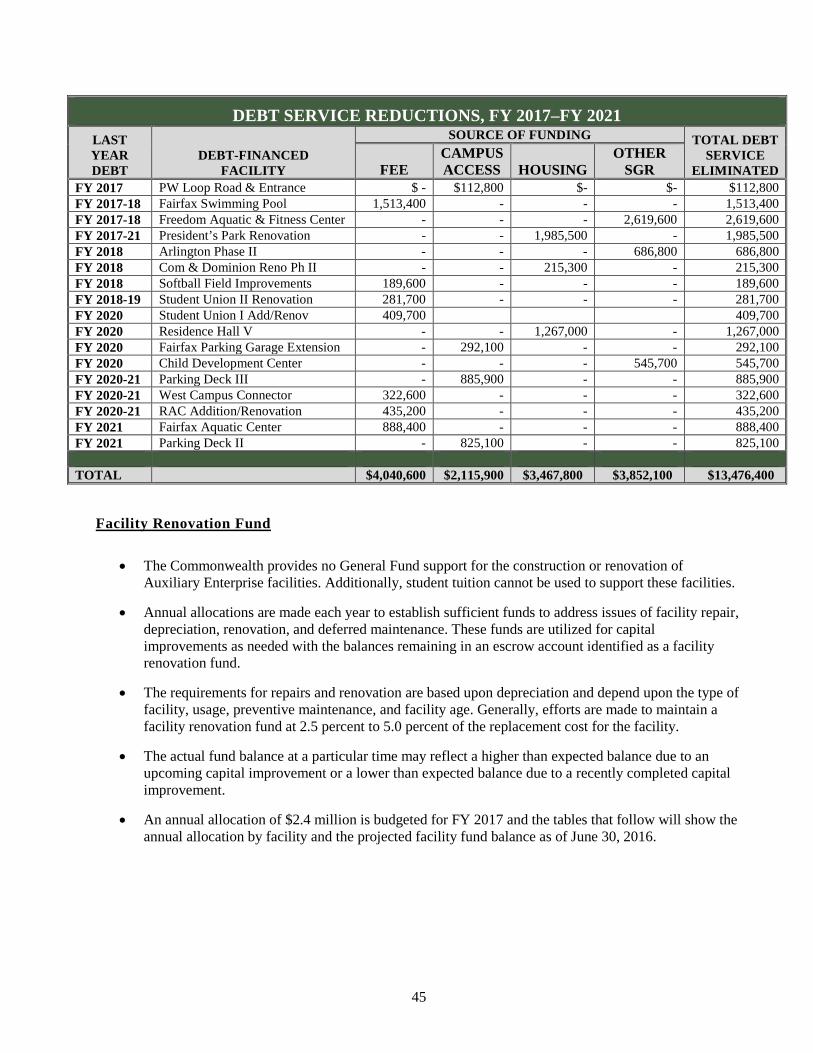
45
DEBT SERVICE REDUCTIONS, FY 2017–FY 2021 LAST YEAR DEBT
DEBT-FINANCED FACILITY
SOURCE OF FUNDING TOTAL DEBT SERVICE
ELIMINATED FEE CAMPUS ACCESS HOUSING
OTHER SGR
FY 2017 PW Loop Road & Entrance $ - $112,800 $- $- $112,800 FY 2017-18 Fairfax Swimming Pool 1,513,400 - - - 1,513,400 FY 2017-18 Freedom Aquatic & Fitness Center - - - 2,619,600 2,619,600 FY 2017-21 President’s Park Renovation - - 1,985,500 - 1,985,500 FY 2018 Arlington Phase II - - - 686,800 686,800 FY 2018 Com & Dominion Reno Ph II - - 215,300 - 215,300 FY 2018 Softball Field Improvements 189,600 - - - 189,600 FY 2018-19 Student Union II Renovation 281,700 - - - 281,700 FY 2020 Student Union I Add/Renov 409,700 409,700 FY 2020 Residence Hall V - - 1,267,000 - 1,267,000 FY 2020 Fairfax Parking Garage Extension - 292,100 - - 292,100 FY 2020 Child Development Center - - - 545,700 545,700 FY 2020-21 Parking Deck III - 885,900 - - 885,900 FY 2020-21 West Campus Connector 322,600 - - - 322,600 FY 2020-21 RAC Addition/Renovation 435,200 - - - 435,200 FY 2021 Fairfax Aquatic Center 888,400 - - - 888,400 FY 2021 Parking Deck II - 825,100 - - 825,100 TOTAL $4,040,600 $2,115,900 $3,467,800 $3,852,100 $13,476,400
Facility Renovation Fund
• The Commonwealth provides no General Fund support for the construction or renovation of Auxiliary Enterprise facilities. Additionally, student tuition cannot be used to support these facilities.
• Annual allocations are made each year to establish sufficient funds to address issues of facility repair, depreciation, renovation, and deferred maintenance. These funds are utilized for capital improvements as needed with the balances remaining in an escrow account identified as a facility renovation fund.
• The requirements for repairs and renovation are based upon depreciation and depend upon the type of facility, usage, preventive maintenance, and facility age. Generally, efforts are made to maintain a facility renovation fund at 2.5 percent to 5.0 percent of the replacement cost for the facility.
• The actual fund balance at a particular time may reflect a higher than expected balance due to an upcoming capital improvement or a lower than expected balance due to a recently completed capital improvement.
• An annual allocation of $2.4 million is budgeted for FY 2017 and the tables that follow will show the annual allocation by facility and the projected facility fund balance as of June 30, 2016.

46
ANNUAL ALLOCATION–FACILITY RESERVES FACILITY AMOUNT Dining Facilities $554,400 Facility Maintenance Reserve* 500,000 Student Centers 300,000 Arts Centers (Center for the Arts, Hylton Center) 300,000 EagleBank Arena 150,000 Field House (RSC) 150,000 Fairfax Aquatic Center 150,000 Recreation and Athletic Complex (RAC) 150,000 Child Development Center (CDC) 100,000 TOTAL $2,354,400
*The annual Facility Maintenance Reserve of $0.5 million will be allocated among various facilities.
FACILITY RENOVATION FUND SUMMARY
FACILITY
BUILT
GROSS SQUARE
FOOTAGE
AVERAGE REPLACEMENT COSTS/GROSS SQUARE FOOT
ESTIMATED REPLACEMENT
VALUE
PROJECTED BALANCE
JUNE 30, 2016
% OF COST
Student Housing 1977/
2004–14
2,004,170 $300 $601,251,000 $9,696,200 1.6% Parking Structures
1993/2005/ 2009 1,431,800 82 117,408,000 6,023,900 5.1%
Student Centers 1974/1996 671,900 300 201,570,000 4,697,100 2.3% Field House (RSC) 1982 246,600 300 73,980,000 694,900 0.9% Arts Centers 1990/2010 233,100 300 69,930,000 803,300 1.1% EagleBank Arena 1985 188,900 300 56,670,000 5,749,300 10.1% Freedom Aquatic & Fitness Center 1999
160,500 300 48,150,000 757,400 1.6%
Global Center 2010 173,000 300 51,900,000 0 0.0% Fairfax Aquatic Center 1998 90,800 300 27,240,000 1,192,700 4.4% Warehouse 1996 23,600 300 7,080,000 0 0.0% Child Development Ctr 2007 9,000 300 2,700,000 500,000 18.5% TOTAL
5,233,370 ----------- $1,257,879,000 $30,114,800 2.4%
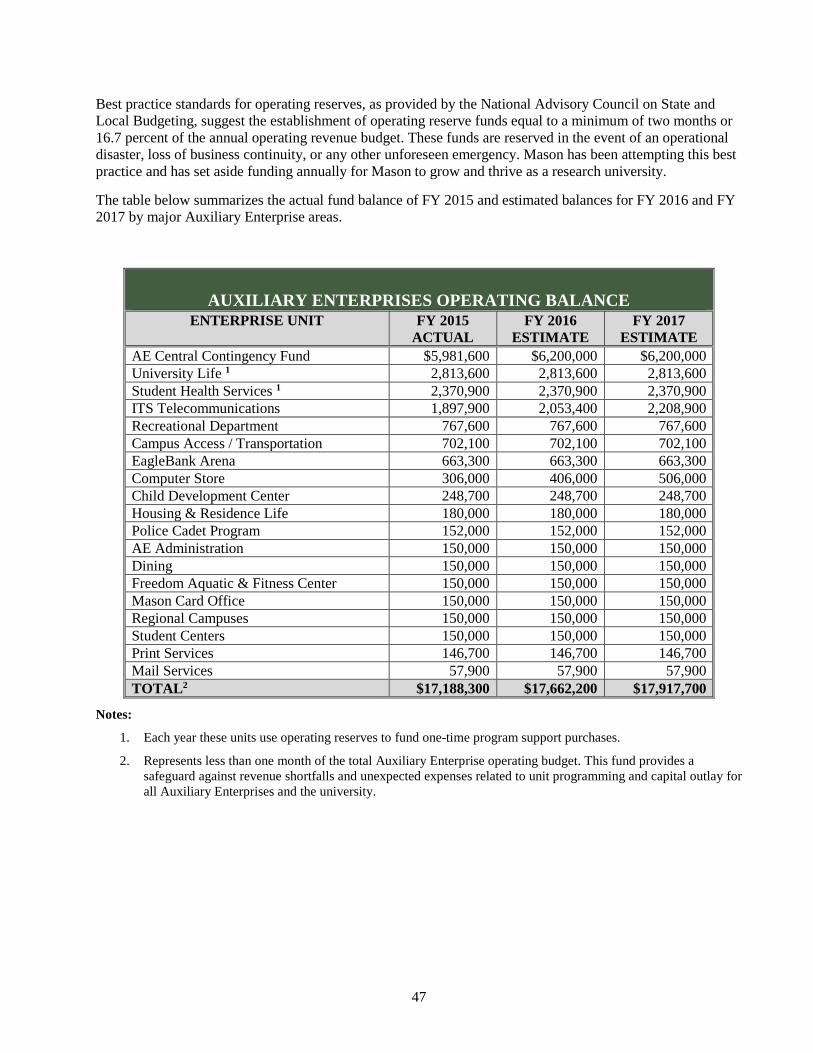
47
Best practice standards for operating reserves, as provided by the National Advisory Council on State and Local Budgeting, suggest the establishment of operating reserve funds equal to a minimum of two months or 16.7 percent of the annual operating revenue budget. These funds are reserved in the event of an operational disaster, loss of business continuity, or any other unforeseen emergency. Mason has been attempting this best practice and has set aside funding annually for Mason to grow and thrive as a research university.
The table below summarizes the actual fund balance of FY 2015 and estimated balances for FY 2016 and FY 2017 by major Auxiliary Enterprise areas.
Notes:
1. Each year these units use operating reserves to fund one-time program support purchases.
2. Represents less than one month of the total Auxiliary Enterprise operating budget. This fund provides a safeguard against revenue shortfalls and unexpected expenses related to unit programming and capital outlay for all Auxiliary Enterprises and the university.
AUXILIARY ENTERPRISES OPERATING BALANCE
ENTERPRISE UNIT FY 2015 ACTUAL
FY 2016 ESTIMATE
FY 2017 ESTIMATE
AE Central Contingency Fund $5,981,600 $6,200,000 $6,200,000 University Life 1 2,813,600 2,813,600 2,813,600 Student Health Services 1 2,370,900 2,370,900 2,370,900 ITS Telecommunications 1,897,900 2,053,400 2,208,900 Recreational Department 767,600 767,600 767,600 Campus Access / Transportation 702,100 702,100 702,100 EagleBank Arena 663,300 663,300 663,300 Computer Store 306,000 406,000 506,000 Child Development Center 248,700 248,700 248,700 Housing & Residence Life 180,000 180,000 180,000 Police Cadet Program 152,000 152,000 152,000 AE Administration 150,000 150,000 150,000 Dining 150,000 150,000 150,000 Freedom Aquatic & Fitness Center 150,000 150,000 150,000 Mason Card Office 150,000 150,000 150,000 Regional Campuses 150,000 150,000 150,000 Student Centers 150,000 150,000 150,000 Print Services 146,700 146,700 146,700 Mail Services 57,900 57,900 57,900 TOTAL2 $17,188,300 $17,662,200 $17,917,700
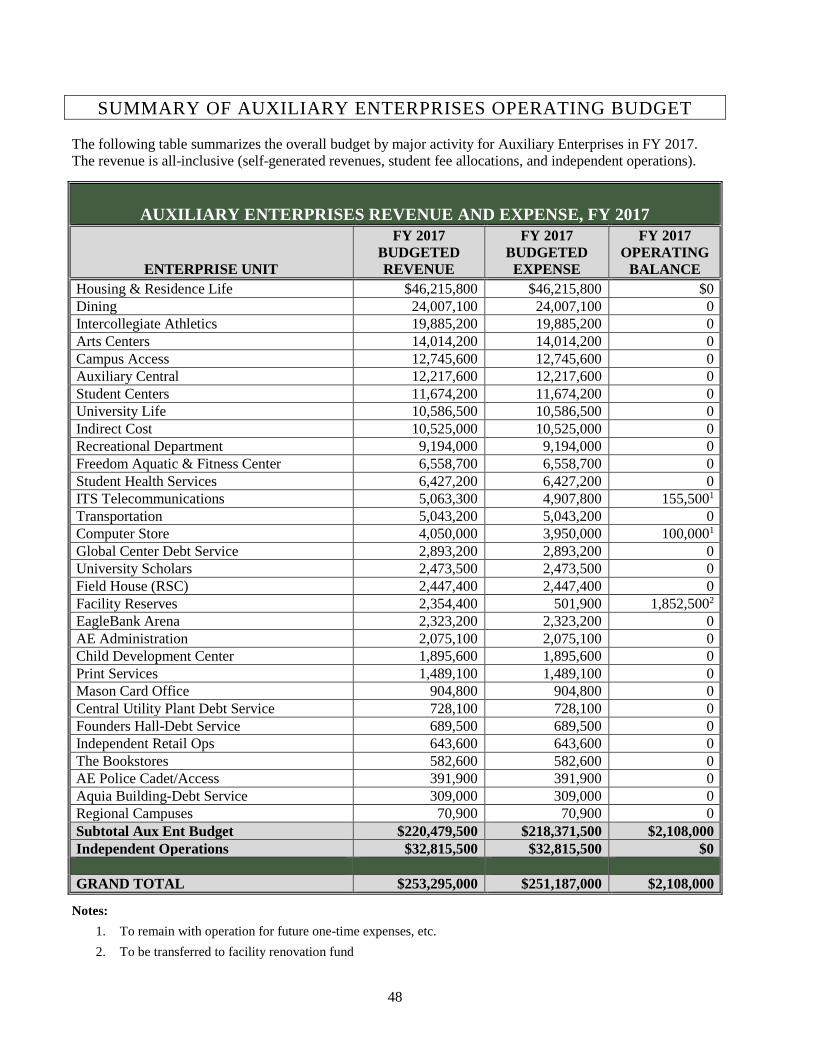
48
SUMMARY OF AUXILIARY ENTERPRISES OPERATING BUDGET
The following table summarizes the overall budget by major activity for Auxiliary Enterprises in FY 2017. The revenue is all-inclusive (self-generated revenues, student fee allocations, and independent operations).
AUXILIARY ENTERPRISES REVENUE AND EXPENSE, FY 2017
ENTERPRISE UNIT
FY 2017 BUDGETED REVENUE
FY 2017 BUDGETED EXPENSE
FY 2017 OPERATING
BALANCE Housing & Residence Life $46,215,800 $46,215,800 $0 Dining 24,007,100 24,007,100 0 Intercollegiate Athletics 19,885,200 19,885,200 0 Arts Centers 14,014,200 14,014,200 0 Campus Access 12,745,600 12,745,600 0 Auxiliary Central 12,217,600 12,217,600 0 Student Centers 11,674,200 11,674,200 0 University Life 10,586,500 10,586,500 0 Indirect Cost 10,525,000 10,525,000 0 Recreational Department 9,194,000 9,194,000 0 Freedom Aquatic & Fitness Center 6,558,700 6,558,700 0 Student Health Services 6,427,200 6,427,200 0 ITS Telecommunications 5,063,300 4,907,800 155,5001 Transportation 5,043,200 5,043,200 0 Computer Store 4,050,000 3,950,000 100,0001 Global Center Debt Service 2,893,200 2,893,200 0 University Scholars 2,473,500 2,473,500 0 Field House (RSC) 2,447,400 2,447,400 0 Facility Reserves 2,354,400 501,900 1,852,5002 EagleBank Arena 2,323,200 2,323,200 0 AE Administration 2,075,100 2,075,100 0 Child Development Center 1,895,600 1,895,600 0 Print Services 1,489,100 1,489,100 0 Mason Card Office 904,800 904,800 0 Central Utility Plant Debt Service 728,100 728,100 0 Founders Hall-Debt Service 689,500 689,500 0 Independent Retail Ops 643,600 643,600 0 The Bookstores 582,600 582,600 0 AE Police Cadet/Access 391,900 391,900 0 Aquia Building-Debt Service 309,000 309,000 0 Regional Campuses 70,900 70,900 0 Subtotal Aux Ent Budget $220,479,500 $218,371,500 $2,108,000 Independent Operations $32,815,500 $32,815,500 $0 GRAND TOTAL $253,295,000 $251,187,000 $2,108,000
Notes: 1. To remain with operation for future one-time expenses, etc. 2. To be transferred to facility renovation fund
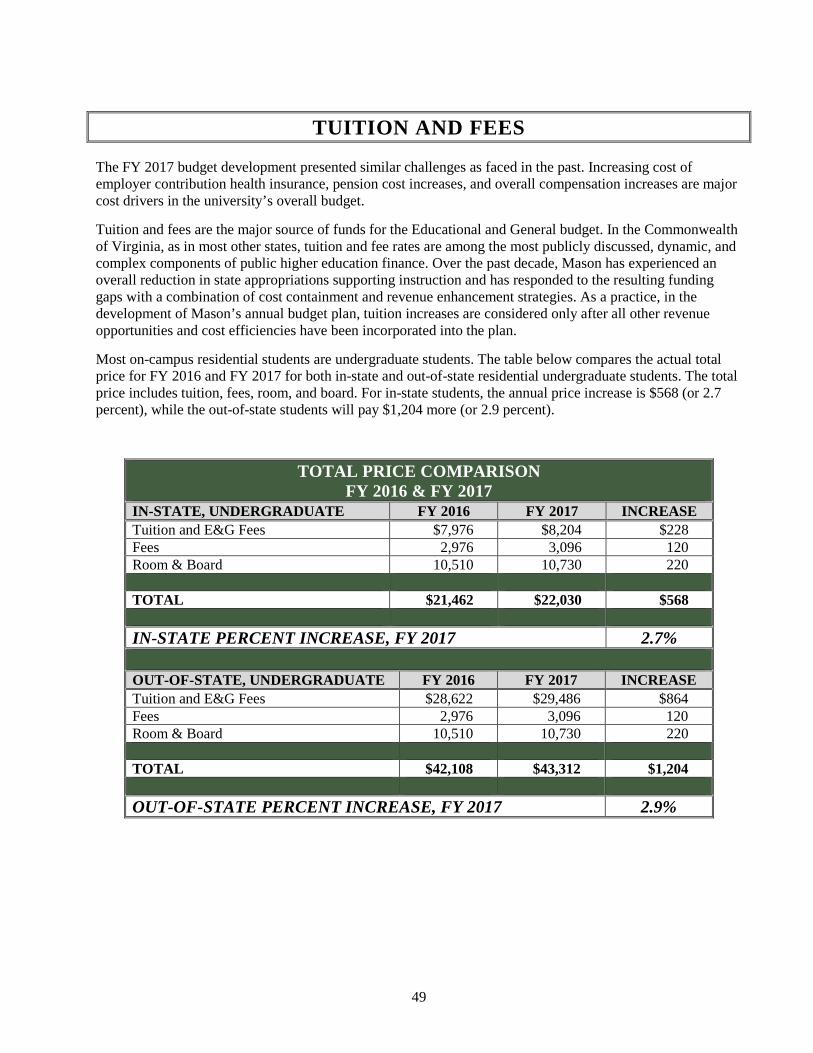
49
TUITION AND FEES
The FY 2017 budget development presented similar challenges as faced in the past. Increasing cost of employer contribution health insurance, pension cost increases, and overall compensation increases are major cost drivers in the university’s overall budget.
Tuition and fees are the major source of funds for the Educational and General budget. In the Commonwealth of Virginia, as in most other states, tuition and fee rates are among the most publicly discussed, dynamic, and complex components of public higher education finance. Over the past decade, Mason has experienced an overall reduction in state appropriations supporting instruction and has responded to the resulting funding gaps with a combination of cost containment and revenue enhancement strategies. As a practice, in the development of Mason’s annual budget plan, tuition increases are considered only after all other revenue opportunities and cost efficiencies have been incorporated into the plan.
Most on-campus residential students are undergraduate students. The table below compares the actual total price for FY 2016 and FY 2017 for both in-state and out-of-state residential undergraduate students. The total price includes tuition, fees, room, and board. For in-state students, the annual price increase is $568 (or 2.7 percent), while the out-of-state students will pay $1,204 more (or 2.9 percent).
TOTAL PRICE COMPARISON FY 2016 & FY 2017
IN-STATE, UNDERGRADUATE FY 2016 FY 2017 INCREASE Tuition and E&G Fees $7,976 $8,204 $228 Fees 2,976 3,096 120 Room & Board 10,510 10,730 220 TOTAL $21,462 $22,030 $568 IN-STATE PERCENT INCREASE, FY 2017 2.7%
OUT-OF-STATE, UNDERGRADUATE FY 2016 FY 2017 INCREASE Tuition and E&G Fees $28,622 $29,486 $864 Fees 2,976 3,096 120 Room & Board 10,510 10,730 220 TOTAL $42,108 $43,312 $1,204 OUT-OF-STATE PERCENT INCREASE, FY 2017 2.9%
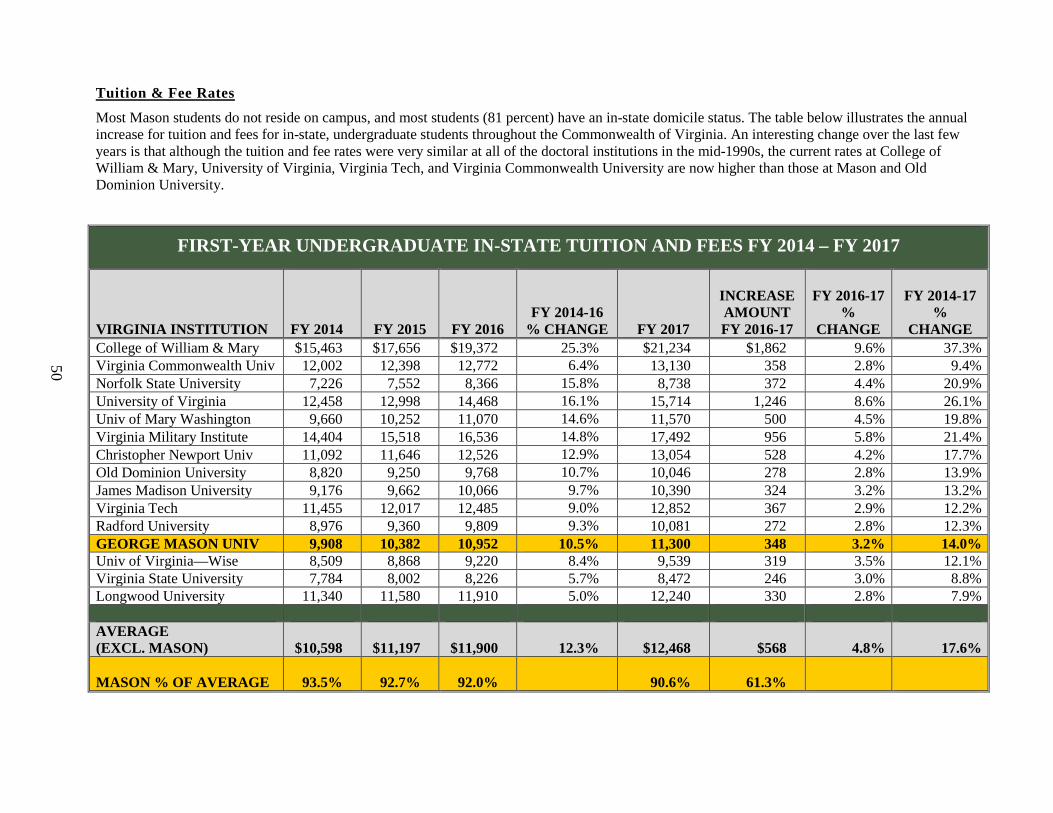
Tuition & Fee Rates
Most Mason students do not reside on campus, and most students (81 percent) have an in-state domicile status. The table below illustrates the annual increase for tuition and fees for in-state, undergraduate students throughout the Commonwealth of Virginia. An interesting change over the last few years is that although the tuition and fee rates were very similar at all of the doctoral institutions in the mid-1990s, the current rates at College of William & Mary, University of Virginia, Virginia Tech, and Virginia Commonwealth University are now higher than those at Mason and Old Dominion University.
FIRST-YEAR UNDERGRADUATE IN-STATE TUITION AND FEES FY 2014 – FY 2017
VIRGINIA INSTITUTION
FY 2014
FY 2015
FY 2016
FY 2014-16 % CHANGE
FY 2017
INCREASE AMOUNT FY 2016-17
FY 2016-17
% CHANGE
FY 2014-17 %
CHANGE College of William & Mary $15,463 $17,656 $19,372 25.3% $21,234 $1,862 9.6% 37.3% Virginia Commonwealth Univ 12,002 12,398 12,772 6.4% 13,130 358 2.8% 9.4% Norfolk State University 7,226 7,552 8,366 15.8% 8,738 372 4.4% 20.9% University of Virginia 12,458 12,998 14,468 16.1% 15,714 1,246 8.6% 26.1% Univ of Mary Washington 9,660 10,252 11,070 14.6% 11,570 500 4.5% 19.8% Virginia Military Institute 14,404 15,518 16,536 14.8% 17,492 956 5.8% 21.4% Christopher Newport Univ 11,092 11,646 12,526 12.9% 13,054 528 4.2% 17.7% Old Dominion University 8,820 9,250 9,768 10.7% 10,046 278 2.8% 13.9% James Madison University 9,176 9,662 10,066 9.7% 10,390 324 3.2% 13.2% Virginia Tech 11,455 12,017 12,485 9.0% 12,852 367 2.9% 12.2% Radford University 8,976 9,360 9,809 9.3% 10,081 272 2.8% 12.3% GEORGE MASON UNIV 9,908 10,382 10,952 10.5% 11,300 348 3.2% 14.0% Univ of Virginia—Wise 8,509 8,868 9,220 8.4% 9,539 319 3.5% 12.1% Virginia State University 7,784 8,002 8,226 5.7% 8,472 246 3.0% 8.8% Longwood University 11,340 11,580 11,910 5.0% 12,240 330 2.8% 7.9% AVERAGE (EXCL. MASON) $10,598 $11,197 $11,900
12.3% $12,468 $568 4.8% 17.6%
MASON % OF AVERAGE 93.5% 92.7% 92.0% 90.6% 61.3%
50
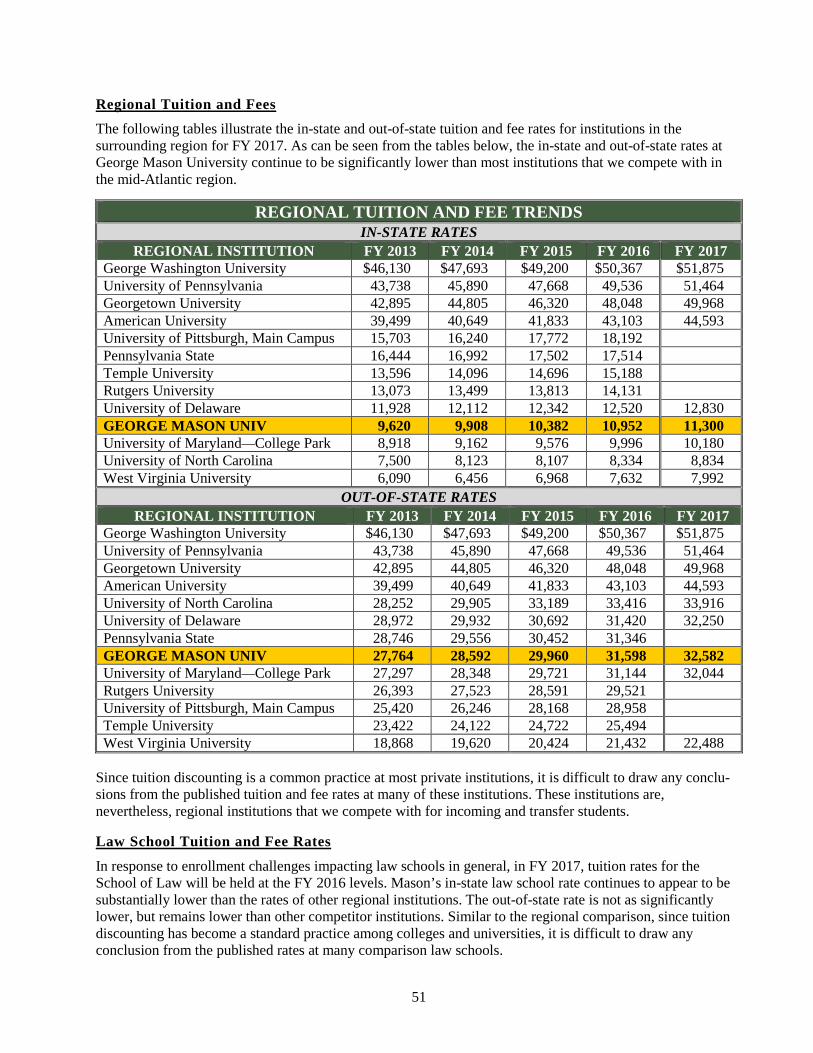
51
Regional Tuition and Fees
The following tables illustrate the in-state and out-of-state tuition and fee rates for institutions in the surrounding region for FY 2017. As can be seen from the tables below, the in-state and out-of-state rates at George Mason University continue to be significantly lower than most institutions that we compete with in the mid-Atlantic region.
REGIONAL TUITION AND FEE TRENDS IN-STATE RATES
REGIONAL INSTITUTION FY 2013 FY 2014 FY 2015 FY 2016 FY 2017 George Washington University $46,130 $47,693 $49,200 $50,367 $51,875 University of Pennsylvania 43,738 45,890 47,668 49,536 51,464 Georgetown University 42,895 44,805 46,320 48,048 49,968 American University 39,499 40,649 41,833 43,103 44,593 University of Pittsburgh, Main Campus 15,703 16,240 17,772 18,192 Pennsylvania State 16,444 16,992 17,502 17,514 Temple University 13,596 14,096 14,696 15,188 Rutgers University 13,073 13,499 13,813 14,131 University of Delaware 11,928 12,112 12,342 12,520 12,830 GEORGE MASON UNIV 9,620 9,908 10,382 10,952 11,300 University of Maryland—College Park 8,918 9,162 9,576 9,996 10,180 University of North Carolina 7,500 8,123 8,107 8,334 8,834 West Virginia University 6,090 6,456 6,968 7,632 7,992
OUT-OF-STATE RATES REGIONAL INSTITUTION FY 2013 FY 2014 FY 2015 FY 2016 FY 2017
George Washington University $46,130 $47,693 $49,200 $50,367 $51,875 University of Pennsylvania 43,738 45,890 47,668 49,536 51,464 Georgetown University 42,895 44,805 46,320 48,048 49,968 American University 39,499 40,649 41,833 43,103 44,593 University of North Carolina 28,252 29,905 33,189 33,416 33,916 University of Delaware 28,972 29,932 30,692 31,420 32,250 Pennsylvania State 28,746 29,556 30,452 31,346 GEORGE MASON UNIV 27,764 28,592 29,960 31,598 32,582 University of Maryland—College Park 27,297 28,348 29,721 31,144 32,044 Rutgers University 26,393 27,523 28,591 29,521 University of Pittsburgh, Main Campus 25,420 26,246 28,168 28,958 Temple University 23,422 24,122 24,722 25,494 West Virginia University 18,868 19,620 20,424 21,432 22,488
Since tuition discounting is a common practice at most private institutions, it is difficult to draw any conclu-sions from the published tuition and fee rates at many of these institutions. These institutions are, nevertheless, regional institutions that we compete with for incoming and transfer students.
Law School Tuition and Fee Rates
In response to enrollment challenges impacting law schools in general, in FY 2017, tuition rates for the School of Law will be held at the FY 2016 levels. Mason’s in-state law school rate continues to appear to be substantially lower than the rates of other regional institutions. The out-of-state rate is not as significantly lower, but remains lower than other competitor institutions. Similar to the regional comparison, since tuition discounting has become a standard practice among colleges and universities, it is difficult to draw any conclusion from the published rates at many comparison law schools.
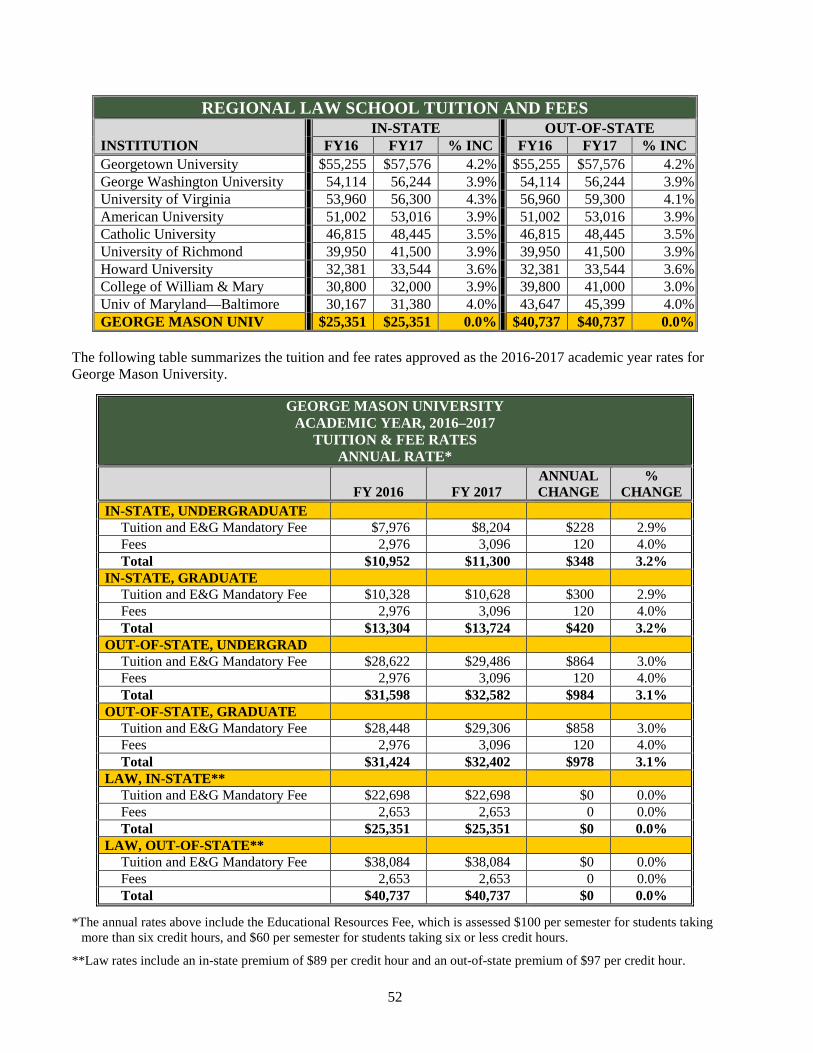
52
REGIONAL LAW SCHOOL TUITION AND FEES
INSTITUTION IN-STATE OUT-OF-STATE
FY16 FY17 % INC FY16 FY17 % INC Georgetown University $55,255 $57,576 4.2% $55,255 $57,576 4.2% George Washington University 54,114 56,244 3.9% 54,114 56,244 3.9% University of Virginia 53,960 56,300 4.3% 56,960 59,300 4.1% American University 51,002 53,016 3.9% 51,002 53,016 3.9% Catholic University 46,815 48,445 3.5% 46,815 48,445 3.5% University of Richmond 39,950 41,500 3.9% 39,950 41,500 3.9% Howard University 32,381 33,544 3.6% 32,381 33,544 3.6% College of William & Mary 30,800 32,000 3.9% 39,800 41,000 3.0% Univ of Maryland—Baltimore 30,167 31,380 4.0% 43,647 45,399 4.0% GEORGE MASON UNIV $25,351 $25,351 0.0% $40,737 $40,737 0.0%
The following table summarizes the tuition and fee rates approved as the 2016-2017 academic year rates for George Mason University.
GEORGE MASON UNIVERSITY ACADEMIC YEAR, 2016–2017
TUITION & FEE RATES ANNUAL RATE*
FY 2016 FY 2017 ANNUAL CHANGE
% CHANGE
IN-STATE, UNDERGRADUATE Tuition and E&G Mandatory Fee $7,976 $8,204 $228 2.9% Fees 2,976 3,096 120 4.0% Total $10,952 $11,300 $348 3.2% IN-STATE, GRADUATE Tuition and E&G Mandatory Fee $10,328 $10,628 $300 2.9% Fees 2,976 3,096 120 4.0% Total $13,304 $13,724 $420 3.2% OUT-OF-STATE, UNDERGRAD Tuition and E&G Mandatory Fee $28,622 $29,486 $864 3.0% Fees 2,976 3,096 120 4.0% Total $31,598 $32,582 $984 3.1% OUT-OF-STATE, GRADUATE Tuition and E&G Mandatory Fee $28,448 $29,306 $858 3.0% Fees 2,976 3,096 120 4.0% Total $31,424 $32,402 $978 3.1% LAW, IN-STATE** Tuition and E&G Mandatory Fee $22,698 $22,698 $0 0.0% Fees 2,653 2,653 0 0.0% Total $25,351 $25,351 $0 0.0% LAW, OUT-OF-STATE** Tuition and E&G Mandatory Fee $38,084 $38,084 $0 0.0% Fees 2,653 2,653 0 0.0% Total $40,737 $40,737 $0 0.0%
*The annual rates above include the Educational Resources Fee, which is assessed $100 per semester for students taking more than six credit hours, and $60 per semester for students taking six or less credit hours.
**Law rates include an in-state premium of $89 per credit hour and an out-of-state premium of $97 per credit hour.

53
GEORGE MASON UNIVERSITY ACADEMIC YEAR, 2016–17
TUITION & FEE RATES HOURLY RATE*
FY 2015–16 FY 2016–17 HOURLY CHANGE
% CHANGE
IN-STATE, UNDERGRADUATE Tuition and E&G Mandatory Fee $324.00 $333.50 $9.50 2.9% Fees 124.00 129.00 5.00 4.0% Total $448.00 $462.50 $14.50 3.2% IN-STATE, GRADUATE Tuition and E&G Mandatory Fee $422.00 $434.50 $12.50 2.9% Fees 124.00 129.00 5.00 4.0% Total $546.00 $563.50 $17.50 3.2% OUT-OF-STATE, UNDERGRAD Tuition and E&G Mandatory Fee $1,184.25 $1,220.25 $36.00 3.0% Fees 124.00 129.00 5.00 4.0% Total $1,308.25 $1,349.25 $41.00 3.1% OUT-OF-STATE, GRADUATE Tuition and E&G Mandatory Fee $1,177.00 $1,212.75 $35.75 3.0% Fees 124.00 129.00 5.00 4.0% Total $1,301.00 $1,341.75 $40.75 3.1% LAW, IN-STATE** Tuition and E&G Mandatory Fee $803.50 $803.50 $0.00 0.0% Fees 94.75 94.75 0.00 0.0% Total $898.25 $898.25 $0.00 0.0% LAW, OUT-OF-STATE** Tuition and E&G Mandatory Fee $1,353.00 $1,353.00 $0.00 0.0% Fees 94.75 94.75 0.00 0.0% Total $1,447.75 $1,447.75 $0.00 0.0%
*The hourly rates above do not include the Educational Resources Fee.
**Law rates include an in-state premium of $89 per credit hour and an out-of-state premium of $97 per credit hour.
Tuition (Only) Increases
• State officials consistently provide legislative and executive guidance regulating tuition. Direction on student fee rates is also occasionally given.
• Since students pay tuition and fees together as a package price, a table that shows tuition only is of limited value. However, state officials do review tuition only increases to ensure institutional compliance with legislative and executive branch guidance.
• Students are charged a tuition and fee rate for each student credit hour. The student fee portion of the rate is used to support student activities within Auxiliary Enterprises while tuition supports E&G activities.
PREMIUM PRICING FOR SELECT GRADUATE PROGRAMS
Starting fall 2004, several graduate programs implemented premium pricing tuition rates at levels higher than the regular graduate student rates. The premium rates by unit for FY 2017 are listed in the next table.

54
PREMIUM PRICING FOR SELECT GRADUATE PROGRAMS PER CREDIT HOUR RATE ABOVE REGULAR RATES
In-State Out-of-State College of Education & Human Development Graduate programs* $0 $0 Mason Online Master’s in Education and certificates* $0 $0 College of Health & Human Services All Graduate Programs $75 $75 College of Humanities & Social Sciences Master’s in History of Decorative Arts* $737 $0 College of Science Advanced Biomedical Sciences Certificate $989 $211 Forensics Certificate Program $100 $100 Geographic Information Sciences Certificate Program $200 $200 Geospatial Intelligence Certificate Program $200 $200 Nano Certificate Program $100 $100 Remote Sensing Certificate Program $200 $200 SSB Bioinformatics Certificate Program $100 $100 School for Conflict Analysis & Resolution Mason Online Master’s in Conflict* $0 $0 School of Business Chief Learning Officer Graduate Certificate* $237 $0 EMBA Program—In-person $1,082 $304 EMBA Program—Online* $733 $0 MBA Program* $343 $336 MSA Program* $370 $362 MSA Program—Online* $370 $362 MSIS Program $852 $74 MSM Program* $370 $362 MSRED* $306 $0 MSTM Program $852 $74 School of Law All Professional Programs $89 $97 School of Policy, Government, & International Affairs All Graduate Programs except Political Science MA & PhD $200 $100 Biodefense Degrees & Certificates $200 $100 Master's in Public Administration (MPA) & Certificates $200 $100 MA in International Security (I-Sec) $200 $100 Volgenau School of Engineering Master’s and PhD Degrees $100 $0
*Programs that offer discounts from regular tuition and fee rates based on select criteria.

55
STUDENT FINANCIAL ASSISTANCE
This section addresses Student Financial Assistance and examines key trends and indicators in this important aspect of the annual budget plan. Financial aid is a critical component for meeting the university’s institutional goals. Student Financial Assistance includes federal financial aid funds, state student financial assistance appropriations, university operating funds (including merit scholarships, tuition fee waivers, and assistantships), and philanthropic fund sources.
Financial aid is awarded to undergraduate and graduate students on the basis of demonstrated financial need, enrollment status, and satisfactory academic progress. The majority of the financial aid programs at Mason are administered or monitored by the Office of Student Financial Aid. There has been a significant increase in the numbers of financial aid students served by the university due to the strategic uses of all financial aid fund sources for undergraduate and graduate students coupled with the increased number of students attending Mason.
COMBINED INSTITUTIONAL AND COMMONWEALTH OF VIRGINIA FINANCIAL AID
CATEGORY
FY 2016 BUDGET
FY 2017 BUDGET
% CHANGE
Institutional Student Aid $40,319,200 $40,882,600 1.4% Commonwealth of Virginia Student Aid
18,675,500 22,338,700 19.6%
TOTAL FINANCIAL AID / SUPPORT $58,994,700 $63,221,300 7.2%
Combined institutional and Commonwealth student financial aid totals $63.2 million in FY 2017. This represents an increase of 7.2 percent or approximately $4.2 million when compared to the FY 2016 level. Institutional aid is increasing to $40.9 million, representing an increase of 1.4 percent. The increase in institutional aid includes funds to support the Stay Mason Initiative which helps students in need as well as provides a financial literacy program. Commonwealth student financial aid in FY 2017 will increase by 19.6 percent or approximately $3.7 million. Appropriations received from the Commonwealth provides financial assistance increases for both undergraduate and graduate students.
INSTITUTIONALLY-FUNDED FINANCIAL ASSISTANCE
Mason has implemented a comprehensive pricing strategy for both the undergraduate and graduate populations. The pricing strategy was informed by a study that: 1) analyzed market position; 2) assessed value perceptions; 3) measured price sensitivity; 4) evaluated effectiveness of current and past strategies; and 5) reviewed pricing model options. The graduate portion of the study reviewed groups based on discipline clusters where market position and value perceptions were compared to Mason’s competitors. The outcome from the pricing strategy study suggested that Mason could increase both resident and nonresident tuition. With the increase, the pricing strategy study suggested that there would need to be an increase in student financial aid. Over the past few years, the institutionally-funded financial aid budget has included additional funding for a leveraging fund. This funding has helped Mason enroll its largest freshman classes in the fall of 2014 and 2015.
Undergraduate aid, which includes discounting, merit, Stay Mason Initiative, and University Scholars is increasing by 1.6 percent. Other increases include $0.2 million for graduate waivers. In addition, in response to enrollment challenges impacting law schools in general, FY 2017 tuition rates for the School of Law will be held at the FY 2016 levels. Salary payments (stipends) for GTAs and GRAs are included in departmental

56
and sponsored program budgets. The following table includes all categories of institutional aid and centrally budgeted graduate support. These allocations include tuition grants (foregone revenue) and aid disbursed directly to students to help fund educational costs.
INSTITUTIONAL FINANCIAL AID UNDERGRADUATE AND GRADUATE SUPPORT
CATEGORY
FY 2016 BUDGET
FY 2017 BUDGET
% CHANGE
Undergraduate Need-Based Grant $5,207,600 $5,207,600
Discounting Grant 2,487,700 2,487,700 Undergraduate Out-of-State Leveraging Fund 4,400,000 4,400,000
Subtotal UG Grants $12,095,300 $12,095,300 0.0%
Undergraduate Merit $6,647,000 $6,741,700 Stay Mason Initiative 1,000,000 1,000,000 Athletic Scholarships 5,544,000 5,844,000
Subtotal UG Merit $13,191,000 $13,585,700 3.0%
Subtotal UG Merit and Grants $25,286,300 $25,681,000 1.6%
Graduate Tuition Waivers $5,621,700 $5,790,400
Graduate Merit 4,436,200 4,436,200 Graduate Leveraging Fund 700,000 700,000 Graduate Student Health Insurance 600,000 600,000 Law Scholarship/Discounting Grant 3,150,000 3,150,000 Law School Merit 525,000 525,000
Subtotal Graduate $15,032,900 $15,201,600 1.1% TOTAL INSTITUTIONAL AID / SUPPORT $40,319,200 $40,882,600 1.4%
STATE-FUNDED FINANCIAL ASSISTANCE
The Commonwealth of Virginia provides need-based funding for in-state undergraduate and graduate students. These funds are used to cover a portion of tuition and fee charges and do not appear in the university’s Educational and General budget as they are restricted funds provided for student financial assistance. Securing additional financial assistance funding was the university’s top priority in its submission of its six-year operating plan. In FY 2017, Mason will see one of the largest increase in state-funded financial assistance with an increase of 19.6% or a $3.7 million over the prior year.
COMMONWEALTH OF VIRGINIA FINANCIAL AID
CATEGORY
FY 2016 BUDGET
FY 2017 BUDGET
% CHANGE
Undergraduate Need-Based $16,789,300 $19,854,100 18.3% Graduate Support 1,886,200 2,484,600 31.7%
TOTAL STATE AID / SUPPORT $18,675,500 $22,338,700 19.6%

57
FEDERAL AND OTHER FINANCIAL ASSISTANCE
The student financial aid provided by sources other than Commonwealth and institutional funds are displayed in the table below. These funds are not included in the university budget but are realized as revenues (payments) primarily for tuition and fees, room and board, and other items included in the cost of education. Funding levels available to students from these sources vary based on numerous factors such as federal regulations (Pell Grant award amounts and eligibility requirements), student loan funds, and levels of gift aid from the GMU Foundation and other private agency sources of student support.
OTHER SOURCES OF FINANCIAL AID (ACTUAL AWARDS, FY 2014–FY 2015)
CATEGORY FY 2014
ACTUAL FY 2015
ACTUAL %
CHANGE Federal Need-Based Grants $24,681,697 $26,757,335 8.4% Federal Work-Study 806,691 987,299 22.4% Federal Need-Based Loans 38,281,801 39,654,848 3.6% Federal Non-Need-Based Loans 131,302,945 128,396,510 -2.2% Other Merit Scholarships/Grants * 4,451,003 4,940,048 11.0% Other Non-Need-Based Loans 20,888,707 24,436,663 17.0% TOTAL OTHER SOURCES $220,412,844 $225,172,703 2.2%
* Includes scholarship awards from the GMU Foundation and external private scholarship funds awarded to students from outside resources.
UNDERGRADUATE FINANCIAL AID APPLICATION TRENDS
In FY 2015, approximately 65 percent of degree-seeking undergraduate students at Mason applied for financial aid, continuing a trend that began after FY 2008 toward a significantly higher proportion of students applying for assistance.
PERCENTAGE OF DEGREE-SEEKING UNDERGRADUATE STUDENTS APPLYING FOR FINANCIAL AID, FY 2008–FY 2015
FY 2008
FY 2009
FY 2010
FY 2011
FY 2012
FY 2013
FY 2014
FY 2015
UG Degree Seeking 17,983 18,240 19,130 19,623 20,194 20,067 21,324 21,678 Applied for Aid 52.4% 57.5% 62.8% 65.9% 64.0% 65.0% 65.0% 65.0% Did Not Apply 47.6% 42.5% 37.2% 34.1% 36.0% 35.0% 35.0% 35.0%
Source: Common Data Set 2015–2016, metric H2 (a&b)
In both numbers and percentages, students applying for financial aid are anticipated to continue to remain high in the foreseeable future.
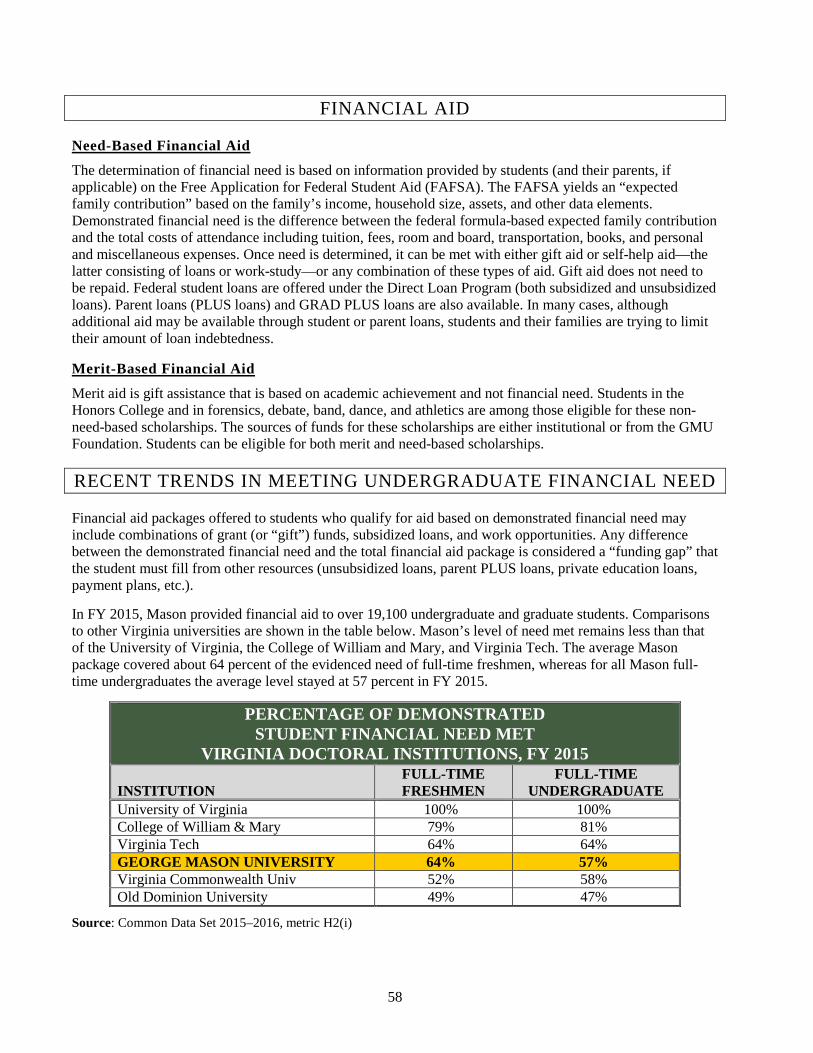
58
FINANCIAL AID
Need-Based Financial Aid
The determination of financial need is based on information provided by students (and their parents, if applicable) on the Free Application for Federal Student Aid (FAFSA). The FAFSA yields an “expected family contribution” based on the family’s income, household size, assets, and other data elements. Demonstrated financial need is the difference between the federal formula-based expected family contribution and the total costs of attendance including tuition, fees, room and board, transportation, books, and personal and miscellaneous expenses. Once need is determined, it can be met with either gift aid or self-help aid—the latter consisting of loans or work-study—or any combination of these types of aid. Gift aid does not need to be repaid. Federal student loans are offered under the Direct Loan Program (both subsidized and unsubsidized loans). Parent loans (PLUS loans) and GRAD PLUS loans are also available. In many cases, although additional aid may be available through student or parent loans, students and their families are trying to limit their amount of loan indebtedness.
Merit-Based Financial Aid
Merit aid is gift assistance that is based on academic achievement and not financial need. Students in the Honors College and in forensics, debate, band, dance, and athletics are among those eligible for these non-need-based scholarships. The sources of funds for these scholarships are either institutional or from the GMU Foundation. Students can be eligible for both merit and need-based scholarships.
RECENT TRENDS IN MEETING UNDERGRADUATE FINANCIAL NEED
Financial aid packages offered to students who qualify for aid based on demonstrated financial need may include combinations of grant (or “gift”) funds, subsidized loans, and work opportunities. Any difference between the demonstrated financial need and the total financial aid package is considered a “funding gap” that the student must fill from other resources (unsubsidized loans, parent PLUS loans, private education loans, payment plans, etc.).
In FY 2015, Mason provided financial aid to over 19,100 undergraduate and graduate students. Comparisons to other Virginia universities are shown in the table below. Mason’s level of need met remains less than that of the University of Virginia, the College of William and Mary, and Virginia Tech. The average Mason package covered about 64 percent of the evidenced need of full-time freshmen, whereas for all Mason full-time undergraduates the average level stayed at 57 percent in FY 2015.
PERCENTAGE OF DEMONSTRATED STUDENT FINANCIAL NEED MET
VIRGINIA DOCTORAL INSTITUTIONS, FY 2015 INSTITUTION
FULL-TIME FRESHMEN
FULL-TIME UNDERGRADUATE
University of Virginia 100% 100% College of William & Mary 79% 81% Virginia Tech 64% 64% GEORGE MASON UNIVERSITY 64% 57% Virginia Commonwealth Univ 52% 58% Old Dominion University 49% 47%
Source: Common Data Set 2015–2016, metric H2(i)
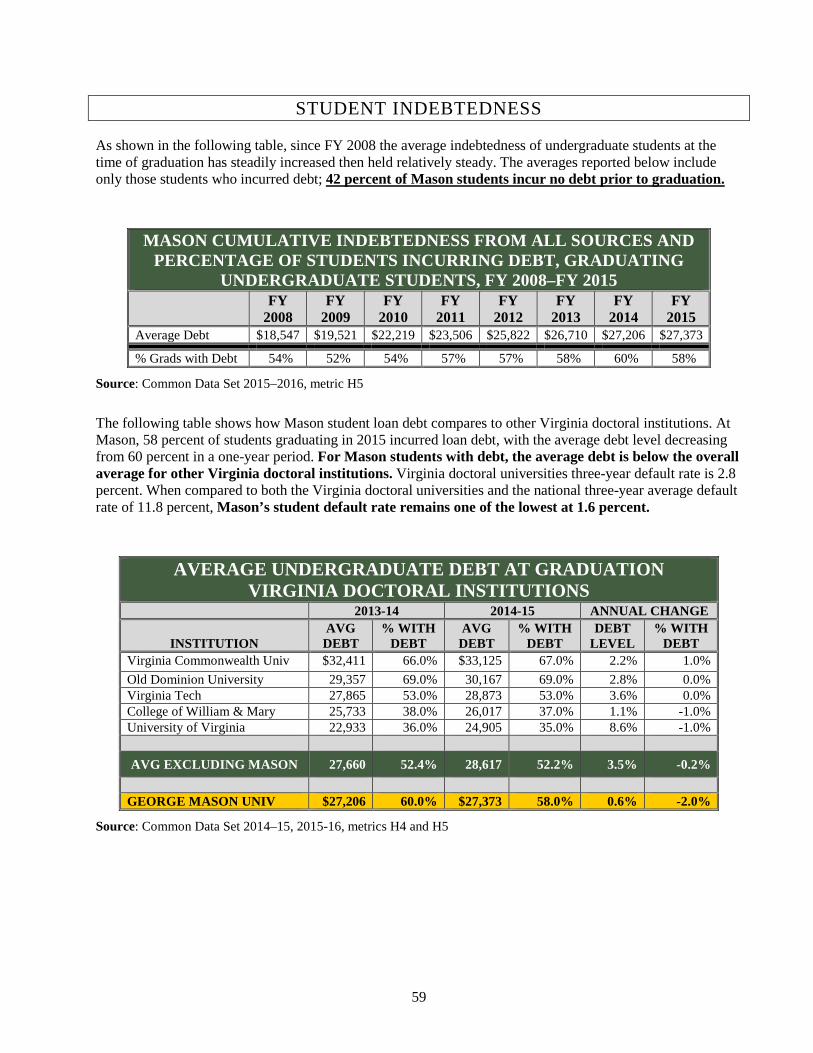
59
STUDENT INDEBTEDNESS
As shown in the following table, since FY 2008 the average indebtedness of undergraduate students at the time of graduation has steadily increased then held relatively steady. The averages reported below include only those students who incurred debt; 42 percent of Mason students incur no debt prior to graduation.
MASON CUMULATIVE INDEBTEDNESS FROM ALL SOURCES AND PERCENTAGE OF STUDENTS INCURRING DEBT, GRADUATING
UNDERGRADUATE STUDENTS, FY 2008–FY 2015
FY 2008
FY 2009
FY 2010
FY 2011
FY 2012
FY 2013
FY 2014
FY 2015
Average Debt $18,547 $19,521 $22,219 $23,506 $25,822 $26,710 $27,206 $27,373
% Grads with Debt 54% 52% 54% 57% 57% 58% 60% 58%
Source: Common Data Set 2015–2016, metric H5
The following table shows how Mason student loan debt compares to other Virginia doctoral institutions. At Mason, 58 percent of students graduating in 2015 incurred loan debt, with the average debt level decreasing from 60 percent in a one-year period. For Mason students with debt, the average debt is below the overall average for other Virginia doctoral institutions. Virginia doctoral universities three-year default rate is 2.8 percent. When compared to both the Virginia doctoral universities and the national three-year average default rate of 11.8 percent, Mason’s student default rate remains one of the lowest at 1.6 percent.
AVERAGE UNDERGRADUATE DEBT AT GRADUATION VIRGINIA DOCTORAL INSTITUTIONS
2013-14 2014-15 ANNUAL CHANGE
INSTITUTION AVG
DEBT % WITH
DEBT AVG
DEBT % WITH
DEBT DEBT
LEVEL % WITH
DEBT Virginia Commonwealth Univ $32,411 66.0% $33,125 67.0% 2.2% 1.0% Old Dominion University 29,357 69.0% 30,167 69.0% 2.8% 0.0% Virginia Tech 27,865 53.0% 28,873 53.0% 3.6% 0.0% College of William & Mary 25,733 38.0% 26,017 37.0% 1.1% -1.0% University of Virginia 22,933 36.0% 24,905 35.0% 8.6% -1.0% AVG EXCLUDING MASON 27,660 52.4% 28,617 52.2% 3.5% -0.2%
GEORGE MASON UNIV $27,206 60.0% $27,373 58.0% 0.6% -2.0%
Source: Common Data Set 2014–15, 2015-16, metrics H4 and H5
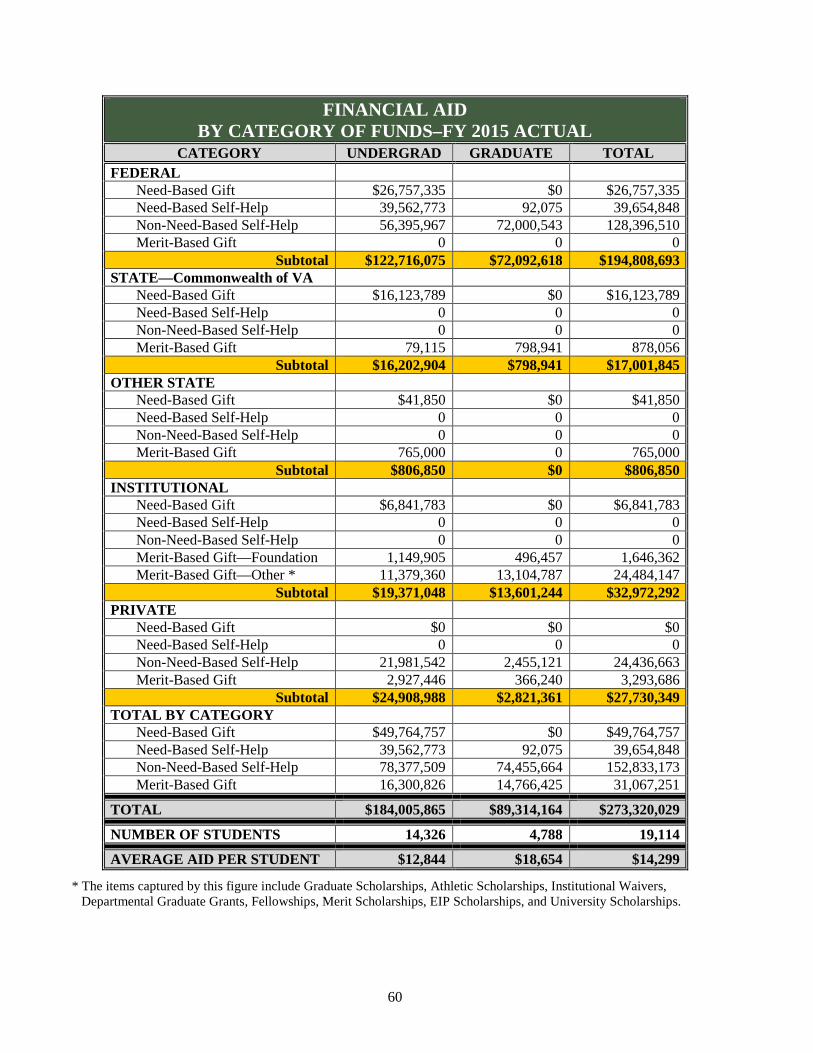
60
FINANCIAL AID BY CATEGORY OF FUNDS–FY 2015 ACTUAL
CATEGORY UNDERGRAD GRADUATE TOTAL FEDERAL Need-Based Gift $26,757,335 $0 $26,757,335 Need-Based Self-Help 39,562,773 92,075 39,654,848 Non-Need-Based Self-Help 56,395,967 72,000,543 128,396,510 Merit-Based Gift 0 0 0
Subtotal $122,716,075 $72,092,618 $194,808,693 STATE—Commonwealth of VA Need-Based Gift $16,123,789 $0 $16,123,789 Need-Based Self-Help 0 0 0 Non-Need-Based Self-Help 0 0 0 Merit-Based Gift 79,115 798,941 878,056
Subtotal $16,202,904 $798,941 $17,001,845 OTHER STATE Need-Based Gift $41,850 $0 $41,850 Need-Based Self-Help 0 0 0 Non-Need-Based Self-Help 0 0 0 Merit-Based Gift 765,000 0 765,000
Subtotal $806,850 $0 $806,850 INSTITUTIONAL Need-Based Gift $6,841,783 $0 $6,841,783 Need-Based Self-Help 0 0 0 Non-Need-Based Self-Help 0 0 0 Merit-Based Gift—Foundation 1,149,905 496,457 1,646,362 Merit-Based Gift—Other * 11,379,360 13,104,787 24,484,147
Subtotal $19,371,048 $13,601,244 $32,972,292 PRIVATE Need-Based Gift $0 $0 $0 Need-Based Self-Help 0 0 0 Non-Need-Based Self-Help 21,981,542 2,455,121 24,436,663 Merit-Based Gift 2,927,446 366,240 3,293,686
Subtotal $24,908,988 $2,821,361 $27,730,349 TOTAL BY CATEGORY Need-Based Gift $49,764,757 $0 $49,764,757 Need-Based Self-Help 39,562,773 92,075 39,654,848 Non-Need-Based Self-Help 78,377,509 74,455,664 152,833,173 Merit-Based Gift 16,300,826 14,766,425 31,067,251
TOTAL $184,005,865 $89,314,164 $273,320,029
NUMBER OF STUDENTS 14,326 4,788 19,114
AVERAGE AID PER STUDENT $12,844 $18,654 $14,299
* The items captured by this figure include Graduate Scholarships, Athletic Scholarships, Institutional Waivers, Departmental Graduate Grants, Fellowships, Merit Scholarships, EIP Scholarships, and University Scholarships.
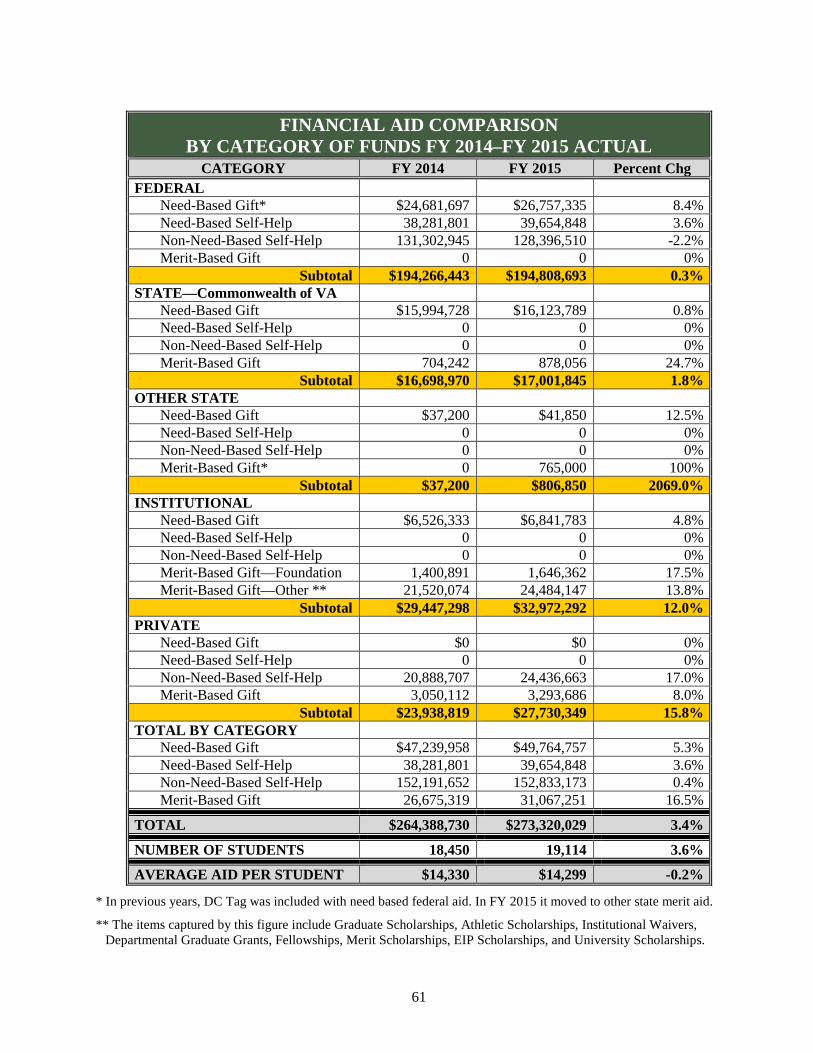
61
FINANCIAL AID COMPARISON BY CATEGORY OF FUNDS FY 2014–FY 2015 ACTUAL
CATEGORY FY 2014 FY 2015 Percent Chg FEDERAL Need-Based Gift* $24,681,697 $26,757,335 8.4% Need-Based Self-Help 38,281,801 39,654,848 3.6% Non-Need-Based Self-Help 131,302,945 128,396,510 -2.2% Merit-Based Gift 0 0 0%
Subtotal $194,266,443 $194,808,693 0.3% STATE—Commonwealth of VA Need-Based Gift $15,994,728 $16,123,789 0.8% Need-Based Self-Help 0 0 0% Non-Need-Based Self-Help 0 0 0% Merit-Based Gift 704,242 878,056 24.7%
Subtotal $16,698,970 $17,001,845 1.8% OTHER STATE Need-Based Gift $37,200 $41,850 12.5% Need-Based Self-Help 0 0 0% Non-Need-Based Self-Help 0 0 0% Merit-Based Gift* 0 765,000 100%
Subtotal $37,200 $806,850 2069.0% INSTITUTIONAL Need-Based Gift $6,526,333 $6,841,783 4.8% Need-Based Self-Help 0 0 0% Non-Need-Based Self-Help 0 0 0% Merit-Based Gift—Foundation 1,400,891 1,646,362 17.5% Merit-Based Gift—Other ** 21,520,074 24,484,147 13.8%
Subtotal $29,447,298 $32,972,292 12.0% PRIVATE Need-Based Gift $0 $0 0% Need-Based Self-Help 0 0 0% Non-Need-Based Self-Help 20,888,707 24,436,663 17.0% Merit-Based Gift 3,050,112 3,293,686 8.0%
Subtotal $23,938,819 $27,730,349 15.8% TOTAL BY CATEGORY Need-Based Gift $47,239,958 $49,764,757 5.3% Need-Based Self-Help 38,281,801 39,654,848 3.6% Non-Need-Based Self-Help 152,191,652 152,833,173 0.4% Merit-Based Gift 26,675,319 31,067,251 16.5%
TOTAL $264,388,730 $273,320,029 3.4%
NUMBER OF STUDENTS 18,450 19,114 3.6%
AVERAGE AID PER STUDENT $14,330 $14,299 -0.2%
* In previous years, DC Tag was included with need based federal aid. In FY 2015 it moved to other state merit aid.
** The items captured by this figure include Graduate Scholarships, Athletic Scholarships, Institutional Waivers, Departmental Graduate Grants, Fellowships, Merit Scholarships, EIP Scholarships, and University Scholarships.

62
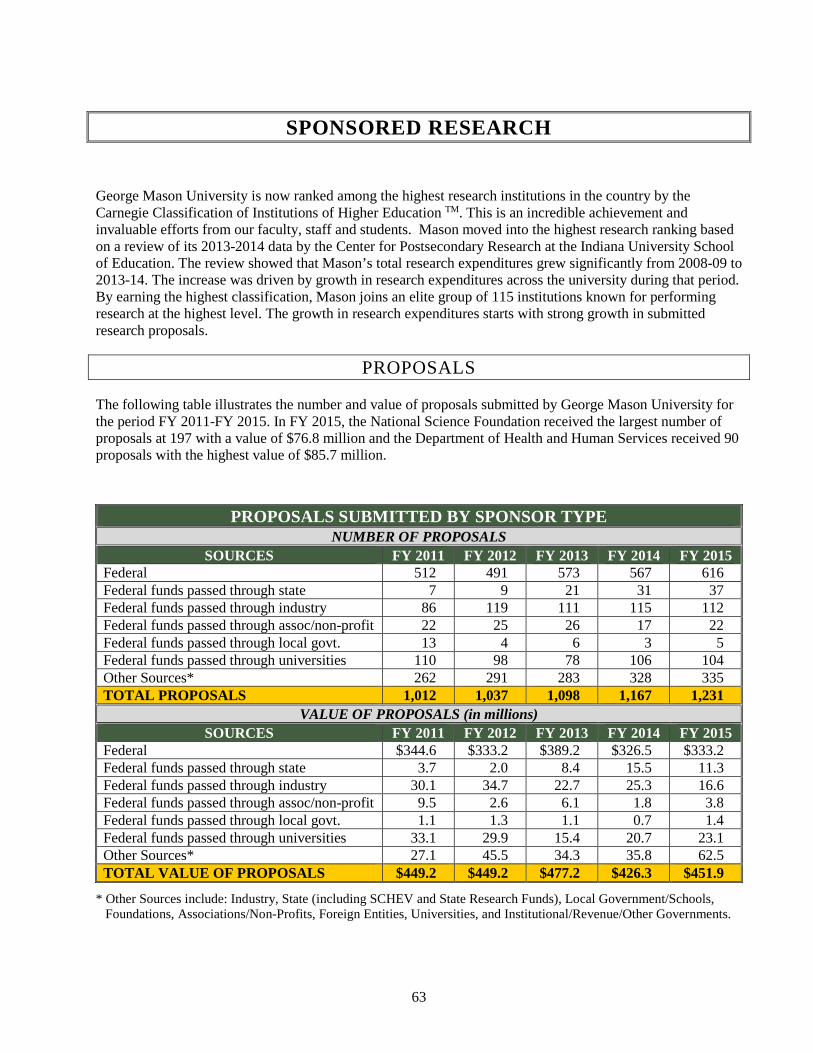
63
SPONSORED RESEARCH
George Mason University is now ranked among the highest research institutions in the country by the Carnegie Classification of Institutions of Higher Education TM. This is an incredible achievement and invaluable efforts from our faculty, staff and students. Mason moved into the highest research ranking based on a review of its 2013-2014 data by the Center for Postsecondary Research at the Indiana University School of Education. The review showed that Mason’s total research expenditures grew significantly from 2008-09 to 2013-14. The increase was driven by growth in research expenditures across the university during that period. By earning the highest classification, Mason joins an elite group of 115 institutions known for performing research at the highest level. The growth in research expenditures starts with strong growth in submitted research proposals.
PROPOSALS
The following table illustrates the number and value of proposals submitted by George Mason University for the period FY 2011-FY 2015. In FY 2015, the National Science Foundation received the largest number of proposals at 197 with a value of $76.8 million and the Department of Health and Human Services received 90 proposals with the highest value of $85.7 million.
PROPOSALS SUBMITTED BY SPONSOR TYPE NUMBER OF PROPOSALS
SOURCES FY 2011 FY 2012 FY 2013 FY 2014 FY 2015 Federal 512 491 573 567 616 Federal funds passed through state 7 9 21 31 37 Federal funds passed through industry 86 119 111 115 112 Federal funds passed through assoc/non-profit 22 25 26 17 22 Federal funds passed through local govt. 13 4 6 3 5 Federal funds passed through universities 110 98 78 106 104 Other Sources* 262 291 283 328 335 TOTAL PROPOSALS 1,012 1,037 1,098 1,167 1,231
VALUE OF PROPOSALS (in millions) SOURCES FY 2011 FY 2012 FY 2013 FY 2014 FY 2015
Federal $344.6 $333.2 $389.2 $326.5 $333.2 Federal funds passed through state 3.7 2.0 8.4 15.5 11.3 Federal funds passed through industry 30.1 34.7 22.7 25.3 16.6 Federal funds passed through assoc/non-profit 9.5 2.6 6.1 1.8 3.8 Federal funds passed through local govt. 1.1 1.3 1.1 0.7 1.4 Federal funds passed through universities 33.1 29.9 15.4 20.7 23.1 Other Sources* 27.1 45.5 34.3 35.8 62.5 TOTAL VALUE OF PROPOSALS $449.2 $449.2 $477.2 $426.3 $451.9
* Other Sources include: Industry, State (including SCHEV and State Research Funds), Local Government/Schools, Foundations, Associations/Non-Profits, Foreign Entities, Universities, and Institutional/Revenue/Other Governments.
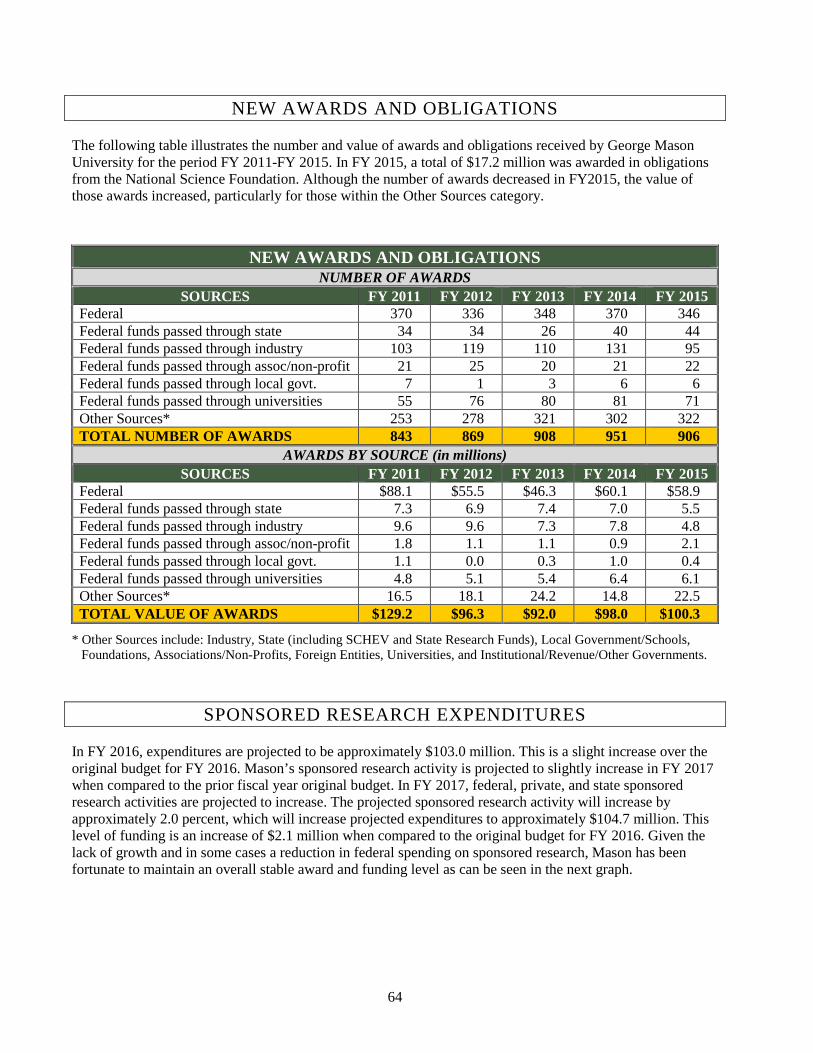
64
NEW AWARDS AND OBLIGATIONS
The following table illustrates the number and value of awards and obligations received by George Mason University for the period FY 2011-FY 2015. In FY 2015, a total of $17.2 million was awarded in obligations from the National Science Foundation. Although the number of awards decreased in FY2015, the value of those awards increased, particularly for those within the Other Sources category.
NEW AWARDS AND OBLIGATIONS NUMBER OF AWARDS
SOURCES FY 2011 FY 2012 FY 2013 FY 2014 FY 2015 Federal 370 336 348 370 346 Federal funds passed through state 34 34 26 40 44 Federal funds passed through industry 103 119 110 131 95 Federal funds passed through assoc/non-profit 21 25 20 21 22 Federal funds passed through local govt. 7 1 3 6 6 Federal funds passed through universities 55 76 80 81 71 Other Sources* 253 278 321 302 322 TOTAL NUMBER OF AWARDS 843 869 908 951 906
AWARDS BY SOURCE (in millions) SOURCES FY 2011 FY 2012 FY 2013 FY 2014 FY 2015
Federal $88.1 $55.5 $46.3 $60.1 $58.9 Federal funds passed through state 7.3 6.9 7.4 7.0 5.5 Federal funds passed through industry 9.6 9.6 7.3 7.8 4.8 Federal funds passed through assoc/non-profit 1.8 1.1 1.1 0.9 2.1 Federal funds passed through local govt. 1.1 0.0 0.3 1.0 0.4 Federal funds passed through universities 4.8 5.1 5.4 6.4 6.1 Other Sources* 16.5 18.1 24.2 14.8 22.5 TOTAL VALUE OF AWARDS $129.2 $96.3 $92.0 $98.0 $100.3
* Other Sources include: Industry, State (including SCHEV and State Research Funds), Local Government/Schools, Foundations, Associations/Non-Profits, Foreign Entities, Universities, and Institutional/Revenue/Other Governments.
SPONSORED RESEARCH EXPENDITURES
In FY 2016, expenditures are projected to be approximately $103.0 million. This is a slight increase over the original budget for FY 2016. Mason’s sponsored research activity is projected to slightly increase in FY 2017 when compared to the prior fiscal year original budget. In FY 2017, federal, private, and state sponsored research activities are projected to increase. The projected sponsored research activity will increase by approximately 2.0 percent, which will increase projected expenditures to approximately $104.7 million. This level of funding is an increase of $2.1 million when compared to the original budget for FY 2016. Given the lack of growth and in some cases a reduction in federal spending on sponsored research, Mason has been fortunate to maintain an overall stable award and funding level as can be seen in the next graph.

65
The units with the largest sponsored research expenditures are the College of Science, the College of Humanities and Social Sciences, the Volgenau School of Engineering, and the College of Education and Human Development. These schools comprise 79 percent of total sponsored research spending.
Research activity at the university generates indirect cost earnings to cover facilities and administrative costs resulting from the research activity. Approximately $17.1 million is projected to be earned from indirect cost reimbursements in FY 2016. Based on the overall sponsored research projections, it is anticipated that approximately $17.4 million in indirect will be earned in FY 2017. Each unit retains 35 percent of the original indirect cost earnings, 35 percent provides support for other research activity, and 30 percent is allocated to the E&G budget for facilities and administrative support of sponsored research. A capped amount of $3.4 million will transfer to E&G and all excess will stay with central academic administration to support research facilities and research initiatives. The units earning the largest amounts of indirect earnings are the College of Science, the Volgenau School of Engineering, the College of Humanities and Social Sciences, the College of Education and Human Development, and the Krasnow Institute. These five units account for approximately 89 percent of the total indirect earned.
Summary: Mason is maintaining its comparative ranking in terms of research spending over the past five years.
$0
$20
$40
$60
$80
$100
$120
FY 2012 FY 2013 FY 2014 FY 2015 FY 2016 FY 2017
$96.8$101.6 $97.9 $101.0 $102.6 $104.7
($ in
mill
ions
)
SPONSORED RESEARCH EXPENDITURESFY 2012-FY 2017
* FY12 - FY15 are actual expenditures. Mason anticipates expenses for FY16 will be at or more than the original budget amount of $102.6M.
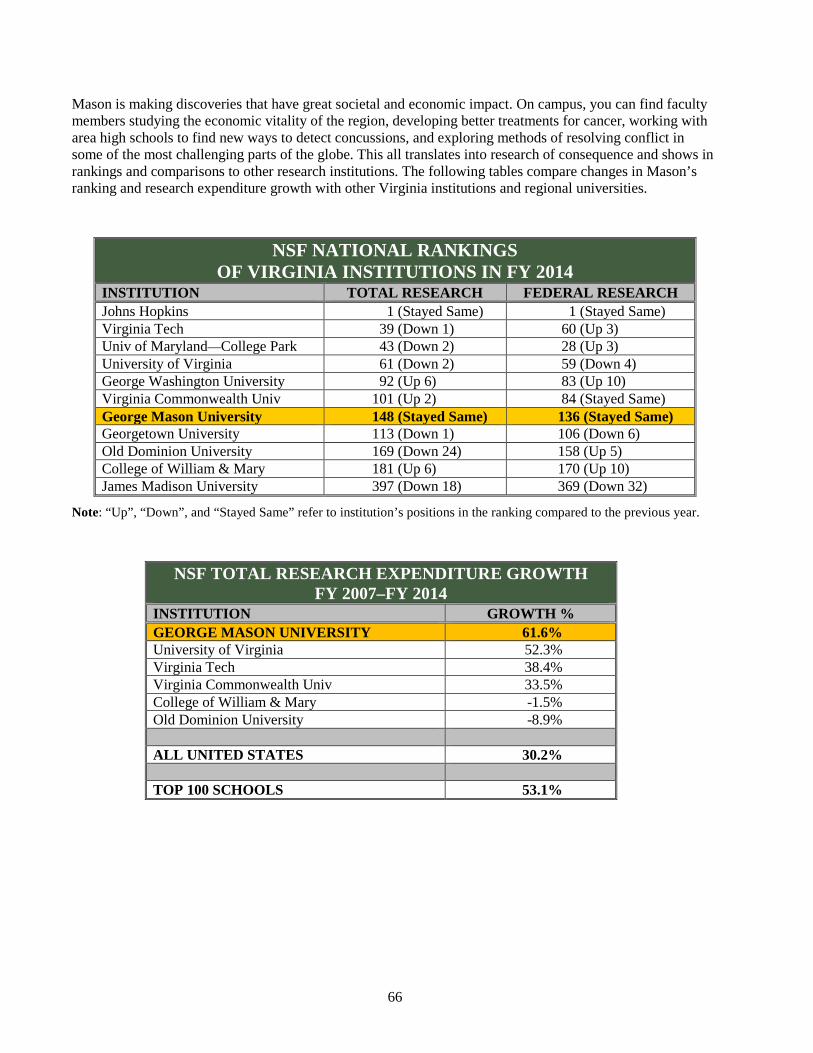
66
Mason is making discoveries that have great societal and economic impact. On campus, you can find faculty members studying the economic vitality of the region, developing better treatments for cancer, working with area high schools to find new ways to detect concussions, and exploring methods of resolving conflict in some of the most challenging parts of the globe. This all translates into research of consequence and shows in rankings and comparisons to other research institutions. The following tables compare changes in Mason’s ranking and research expenditure growth with other Virginia institutions and regional universities.
NSF NATIONAL RANKINGS OF VIRGINIA INSTITUTIONS IN FY 2014
INSTITUTION TOTAL RESEARCH FEDERAL RESEARCH Johns Hopkins 1 (Stayed Same) 1 (Stayed Same) Virginia Tech 39 (Down 1) 60 (Up 3) Univ of Maryland—College Park 43 (Down 2) 28 (Up 3) University of Virginia 61 (Down 2) 59 (Down 4) George Washington University 92 (Up 6) 83 (Up 10) Virginia Commonwealth Univ 101 (Up 2) 84 (Stayed Same) George Mason University 148 (Stayed Same) 136 (Stayed Same) Georgetown University 113 (Down 1) 106 (Down 6) Old Dominion University 169 (Down 24) 158 (Up 5) College of William & Mary 181 (Up 6) 170 (Up 10) James Madison University 397 (Down 18) 369 (Down 32)
Note: “Up”, “Down”, and “Stayed Same” refer to institution’s positions in the ranking compared to the previous year.
NSF TOTAL RESEARCH EXPENDITURE GROWTH FY 2007–FY 2014
INSTITUTION GROWTH % GEORGE MASON UNIVERSITY 61.6% University of Virginia 52.3% Virginia Tech 38.4% Virginia Commonwealth Univ 33.5% College of William & Mary -1.5% Old Dominion University -8.9% ALL UNITED STATES 30.2% TOP 100 SCHOOLS 53.1%
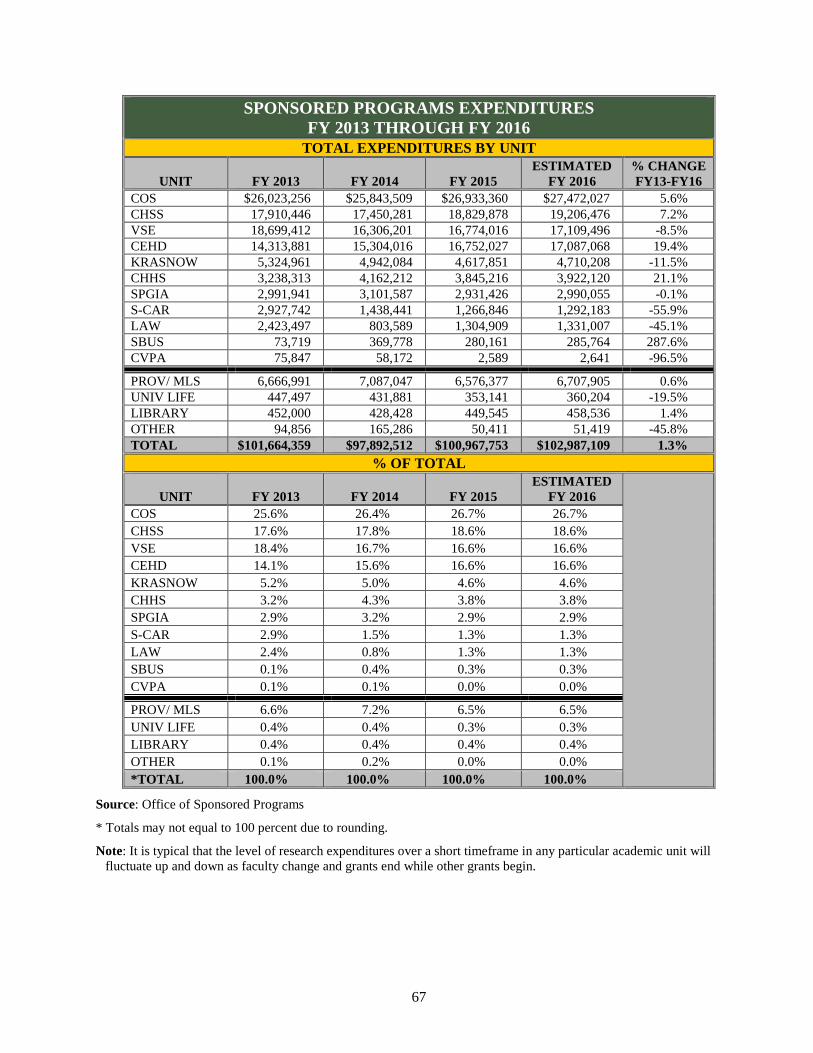
67
SPONSORED PROGRAMS EXPENDITURES FY 2013 THROUGH FY 2016
TOTAL EXPENDITURES BY UNIT
UNIT FY 2013 FY 2014
FY 2015 ESTIMATED
FY 2016 % CHANGE FY13-FY16
COS $26,023,256 $25,843,509 $26,933,360 $27,472,027 5.6% CHSS 17,910,446 17,450,281 18,829,878 19,206,476 7.2% VSE 18,699,412 16,306,201 16,774,016 17,109,496 -8.5% CEHD 14,313,881 15,304,016 16,752,027 17,087,068 19.4% KRASNOW 5,324,961 4,942,084 4,617,851 4,710,208 -11.5% CHHS 3,238,313 4,162,212 3,845,216 3,922,120 21.1% SPGIA 2,991,941 3,101,587 2,931,426 2,990,055 -0.1% S-CAR 2,927,742 1,438,441 1,266,846 1,292,183 -55.9% LAW 2,423,497 803,589 1,304,909 1,331,007 -45.1% SBUS 73,719 369,778 280,161 285,764 287.6% CVPA 75,847 58,172 2,589 2,641 -96.5%
PROV/ MLS 6,666,991 7,087,047 6,576,377 6,707,905 0.6% UNIV LIFE 447,497 431,881 353,141 360,204 -19.5% LIBRARY 452,000 428,428 449,545 458,536 1.4% OTHER 94,856 165,286 50,411 51,419 -45.8% TOTAL $101,664,359 $97,892,512 $100,967,753 $102,987,109 1.3%
% OF TOTAL
UNIT FY 2013 FY 2014
FY 2015 ESTIMATED
FY 2016
COS 25.6% 26.4% 26.7% 26.7% CHSS 17.6% 17.8% 18.6% 18.6% VSE 18.4% 16.7% 16.6% 16.6% CEHD 14.1% 15.6% 16.6% 16.6% KRASNOW 5.2% 5.0% 4.6% 4.6% CHHS 3.2% 4.3% 3.8% 3.8% SPGIA 2.9% 3.2% 2.9% 2.9% S-CAR 2.9% 1.5% 1.3% 1.3% LAW 2.4% 0.8% 1.3% 1.3% SBUS 0.1% 0.4% 0.3% 0.3% CVPA 0.1% 0.1% 0.0% 0.0%
PROV/ MLS 6.6% 7.2% 6.5% 6.5% UNIV LIFE 0.4% 0.4% 0.3% 0.3% LIBRARY 0.4% 0.4% 0.4% 0.4% OTHER 0.1% 0.2% 0.0% 0.0% *TOTAL 100.0% 100.0% 100.0% 100.0%
Source: Office of Sponsored Programs
* Totals may not equal to 100 percent due to rounding.
Note: It is typical that the level of research expenditures over a short timeframe in any particular academic unit will fluctuate up and down as faculty change and grants end while other grants begin.

68
TOTAL INDIRECT EARNINGS
FY 2013 THROUGH FY 2016 INDIRECT EARNED BY UNIT
UNIT FY 2013 FY 2014
FY 2015
ESTIMATED FY 2016
% CHANGE FY13-FY16
COS $5,284,664 $5,324,990 $6,038,509 $6,159,279 16.6% VSE 4,208,371 3,763,028 3,582,970 3,654,629 -13.2% CHSS 2,732,035 2,468,708 2,700,596 2,754,608 0.8% CEHD 1,376,305 1,398,219 1,440,232 1,469,037 6.7% KRASNOW 1,350,151 1,272,861 1,123,577 1,146,049 -15.1% CHHS 420,589 608,041 579,032 590,613 40.4% SPGIA 441,468 500,609 509,047 519,228 17.6% LAW 683,443 145,306 240,252 245,057 -64.1% S-CAR 331,749 221,434 140,685 143,499 -56.7% SBUS 13,548 23,037 17,909 18,267 34.8% CVPA 17,212 4,242 0 0 -100.0%
PROVOST 326,600 420,230 355,042 362,143 10.9% UNIV LIFE 16,913 18,534 20,606 21,018 24.3% LIBRARY 0 0 0 0 0.0% OTHER 32,646 0 0 0 -100.0% TOTAL $17,235,694 $16,169,239 $16,748,457 $17,083,426 -0.9%
% OF TOTAL
UNIT FY 2013 FY 2014
FY 2015 ESTIMATED
FY 2016
COS 30.7% 32.9% 36.1% 36.1% VSE 24.4% 23.3% 21.4% 21.4% CHSS 15.9% 15.3% 16.1% 16.1% CEHD 8.0% 8.6% 8.6% 8.6% KRASNOW 7.8% 7.9% 6.7% 6.7% CHHS 2.4% 3.8% 3.5% 3.5% SPGIA 2.6% 3.1% 3.0% 3.0% LAW 4.0% 0.9% 1.4% 1.4% S-CAR 1.9% 1.4% 0.8% 0.8% SBUS 0.1% 0.1% 0.1% 0.1% CVPA 0.1% 0.0% 0.0% 0.0%
PROVOST 1.9% 2.6% 2.1% 2.1% UNIV LIFE 0.1% 0.1% 0.1% 0.1% LIBRARY 0.0% 0.0% 0.0% 0.0% OTHER 0.2% 0.0% 0.0% 0.0% *TOTAL 100.0% 100.0% 100.0% 100.0%
* Totals may not equal to 100 percent due to rounding.
69
Mason has improved its comparative ranking in terms of research spending over the past five years but expects to dramatically increase the level of sponsored funding over the next decade. As described in the university’s 2014-2024 Strategic Plan, research is an institutional priority and Mason expects to expand research and enhance standards of scholarship across disciplines by increasing sponsored funding, improving research infrastructure, and increasing the number of PhD graduates. In an effort to support research with a focus on research of consequence, investment will be focused on multidisciplinary domains that have great societal, economic, and global impact.

70
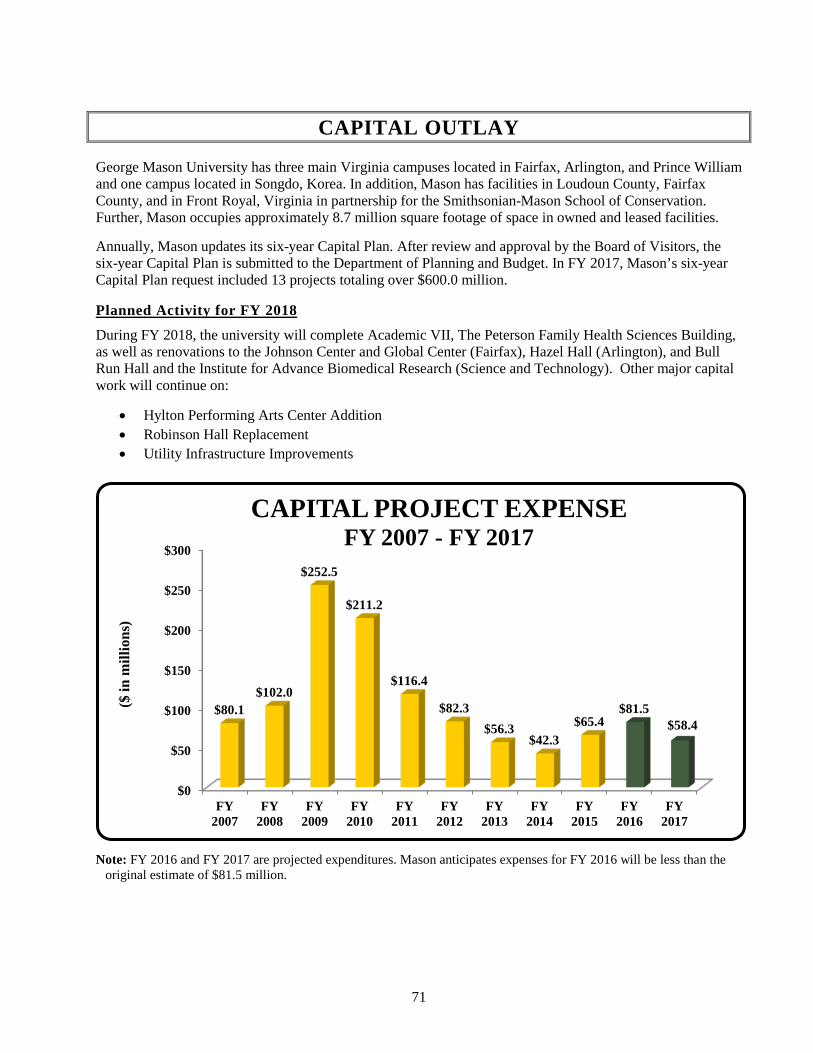
71
CAPITAL OUTLAY
George Mason University has three main Virginia campuses located in Fairfax, Arlington, and Prince William and one campus located in Songdo, Korea. In addition, Mason has facilities in Loudoun County, Fairfax County, and in Front Royal, Virginia in partnership for the Smithsonian-Mason School of Conservation. Further, Mason occupies approximately 8.7 million square footage of space in owned and leased facilities.
Annually, Mason updates its six-year Capital Plan. After review and approval by the Board of Visitors, the six-year Capital Plan is submitted to the Department of Planning and Budget. In FY 2017, Mason’s six-year Capital Plan request included 13 projects totaling over $600.0 million.
Planned Activity for FY 2018
During FY 2018, the university will complete Academic VII, The Peterson Family Health Sciences Building, as well as renovations to the Johnson Center and Global Center (Fairfax), Hazel Hall (Arlington), and Bull Run Hall and the Institute for Advance Biomedical Research (Science and Technology). Other major capital work will continue on:
• Hylton Performing Arts Center Addition • Robinson Hall Replacement • Utility Infrastructure Improvements
Note: FY 2016 and FY 2017 are projected expenditures. Mason anticipates expenses for FY 2016 will be less than the
original estimate of $81.5 million.
$0
$50
$100
$150
$200
$250
$300
FY2007
FY2008
FY2009
FY2010
FY2011
FY2012
FY2013
FY2014
FY2015
FY2016
FY2017
$80.1$102.0
$252.5
$211.2
$116.4
$82.3$56.3
$42.3$65.4
$81.5$58.4
($ in
mill
ions
)
CAPITAL PROJECT EXPENSE FY 2007 - FY 2017
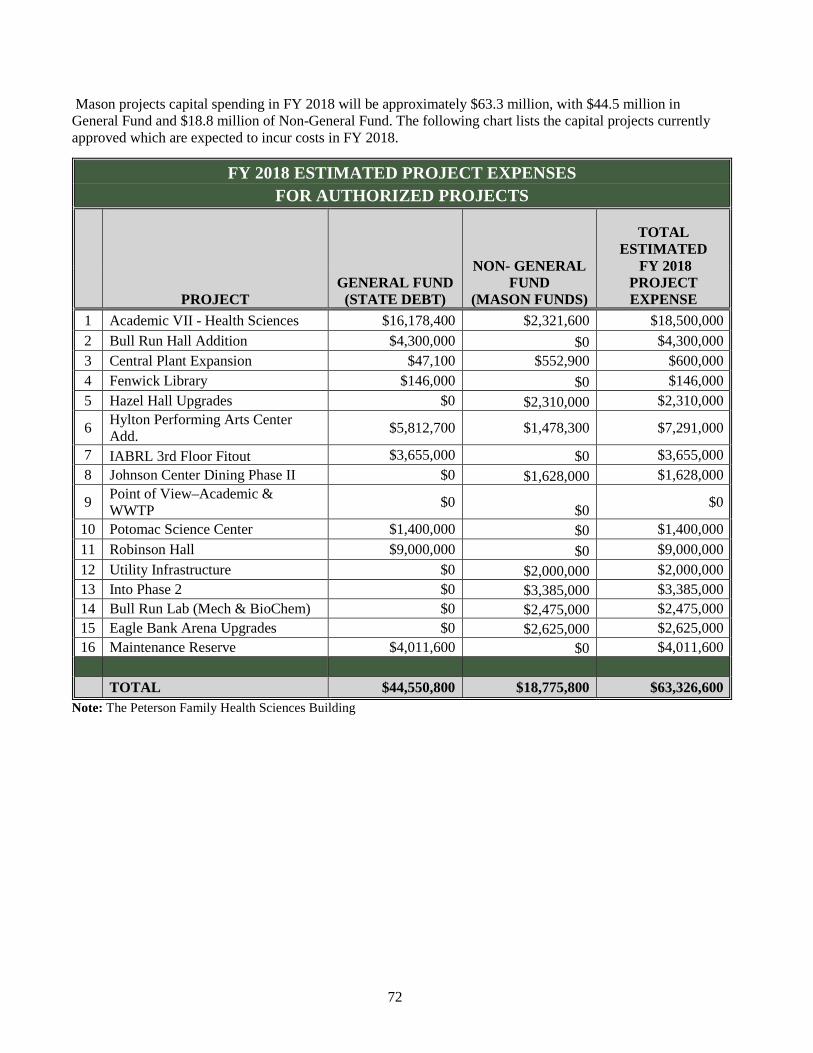
72
Mason projects capital spending in FY 2018 will be approximately $63.3 million, with $44.5 million in General Fund and $18.8 million of Non-General Fund. The following chart lists the capital projects currently approved which are expected to incur costs in FY 2018.
FY 2018 ESTIMATED PROJECT EXPENSES FOR AUTHORIZED PROJECTS
PROJECT GENERAL FUND
(STATE DEBT)
NON- GENERAL FUND
(MASON FUNDS)
TOTAL ESTIMATED
FY 2018 PROJECT EXPENSE
1 Academic VII - Health Sciences $16,178,400 $2,321,600 $18,500,000 2 Bull Run Hall Addition $4,300,000 $0 $4,300,000 3 Central Plant Expansion $47,100 $552,900 $600,000 4 Fenwick Library $146,000 $0 $146,000 5 Hazel Hall Upgrades $0 $2,310,000 $2,310,000
6 Hylton Performing Arts Center Add. $5,812,700 $1,478,300 $7,291,000
7 IABRL 3rd Floor Fitout $3,655,000 $0 $3,655,000 8 Johnson Center Dining Phase II $0 $1,628,000 $1,628,000
9 Point of View–Academic & WWTP $0 $0 $0
10 Potomac Science Center $1,400,000 $0 $1,400,000 11 Robinson Hall $9,000,000 $0 $9,000,000 12 Utility Infrastructure $0 $2,000,000 $2,000,000 13 Into Phase 2 $0 $3,385,000 $3,385,000 14 Bull Run Lab (Mech & BioChem) $0 $2,475,000 $2,475,000 15 Eagle Bank Arena Upgrades $0 $2,625,000 $2,625,000 16 Maintenance Reserve $4,011,600 $0 $4,011,600 TOTAL $44,550,800 $18,775,800 $63,326,600
Note: The Peterson Family Health Sciences Building
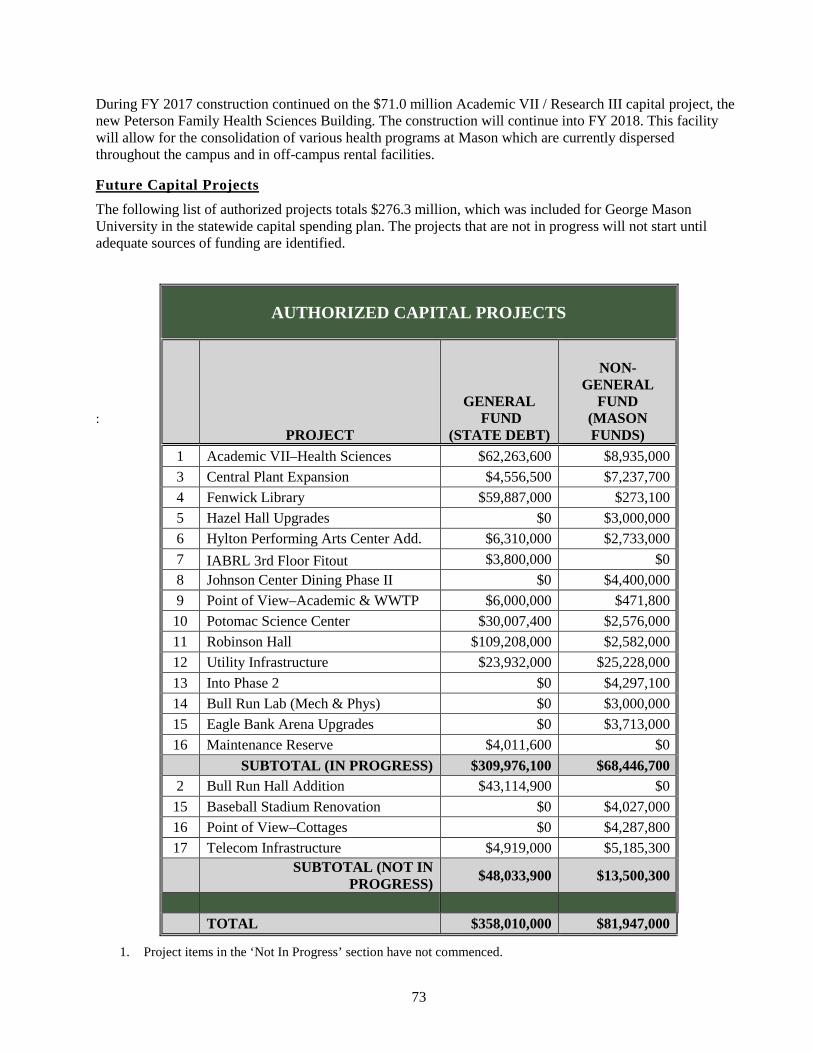
73
During FY 2017 construction continued on the $71.0 million Academic VII / Research III capital project, the new Peterson Family Health Sciences Building. The construction will continue into FY 2018. This facility will allow for the consolidation of various health programs at Mason which are currently dispersed throughout the campus and in off-campus rental facilities.
Future Capital Projects
The following list of authorized projects totals $276.3 million, which was included for George Mason University in the statewide capital spending plan. The projects that are not in progress will not start until adequate sources of funding are identified.
:
1. Project items in the ‘Not In Progress’ section have not commenced.
AUTHORIZED CAPITAL PROJECTS
PROJECT
GENERAL FUND
(STATE DEBT)
NON-GENERAL
FUND (MASON FUNDS)
1 Academic VII–Health Sciences $62,263,600 $8,935,000 3 Central Plant Expansion $4,556,500 $7,237,700 4 Fenwick Library $59,887,000 $273,100 5 Hazel Hall Upgrades $0 $3,000,000 6 Hylton Performing Arts Center Add. $6,310,000 $2,733,000 7 IABRL 3rd Floor Fitout $3,800,000 $0 8 Johnson Center Dining Phase II $0 $4,400,000 9 Point of View–Academic & WWTP $6,000,000 $471,800 10 Potomac Science Center $30,007,400 $2,576,000 11 Robinson Hall $109,208,000 $2,582,000 12 Utility Infrastructure $23,932,000 $25,228,000 13 Into Phase 2 $0 $4,297,100 14 Bull Run Lab (Mech & Phys) $0 $3,000,000 15 Eagle Bank Arena Upgrades $0 $3,713,000 16 Maintenance Reserve $4,011,600 $0 SUBTOTAL (IN PROGRESS) $309,976,100 $68,446,700 2 Bull Run Hall Addition $43,114,900 $0 15 Baseball Stadium Renovation $0 $4,027,000 16 Point of View–Cottages $0 $4,287,800 17 Telecom Infrastructure $4,919,000 $5,185,300
SUBTOTAL (NOT IN PROGRESS) $48,033,900 $13,500,300
TOTAL $358,010,000 $81,947,000
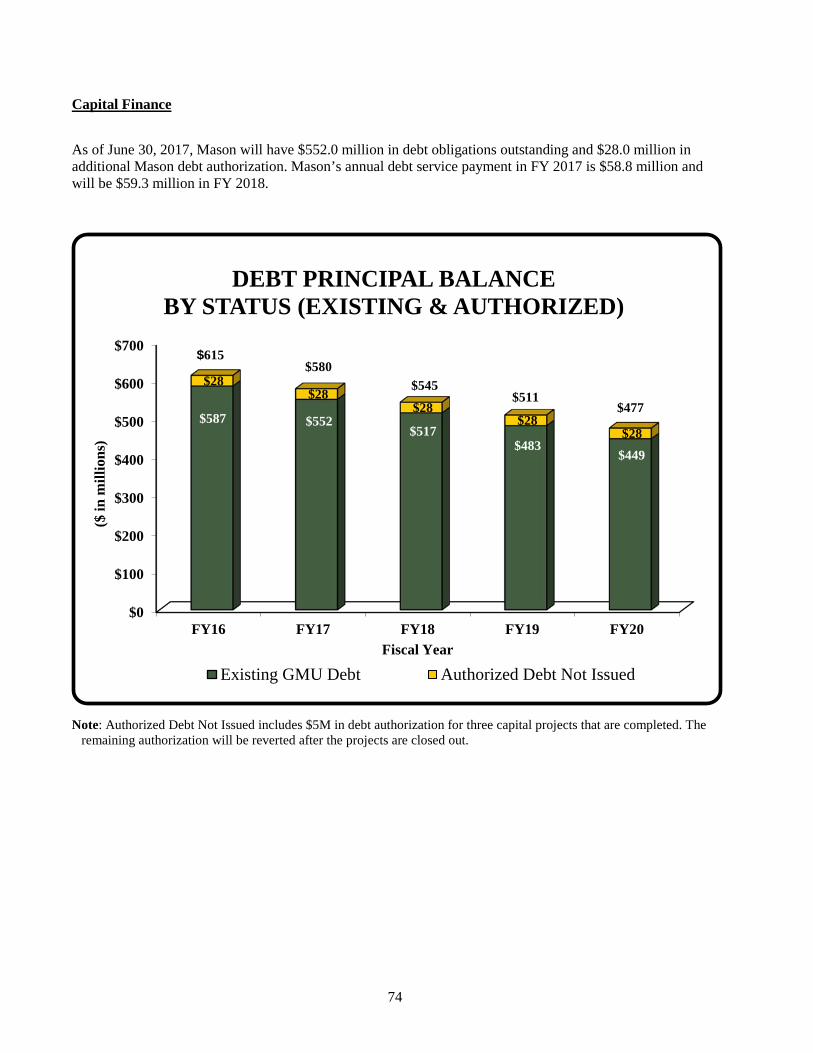
74
Capital Finance
As of June 30, 2017, Mason will have $552.0 million in debt obligations outstanding and $28.0 million in additional Mason debt authorization. Mason’s annual debt service payment in FY 2017 is $58.8 million and will be $59.3 million in FY 2018.
Note: Authorized Debt Not Issued includes $5M in debt authorization for three capital projects that are completed. The
remaining authorization will be reverted after the projects are closed out.
$0
$100
$200
$300
$400
$500
$600
$700
FY16 FY17 FY18 FY19 FY20
$587 $552 $517
$483 $449
$28 $28
$28 $28
$28
($ in
mill
ions
)
Fiscal Year
DEBT PRINCIPAL BALANCE BY STATUS (EXISTING & AUTHORIZED)
Existing GMU Debt Authorized Debt Not Issued
$615$580
$545$511
$477
75
EDUCATIONAL AND GENERAL
DETAIL BY MAJOR UNIT
COLLEGE OF EDUCATION & HUMAN DEVELOPMENT (CEHD)
The College of Education and Human Development (CEHD) is an innovative, inclusive, and cutting-edge college that successfully prepares professionals to promote learning and development across the life span while contributing meaningfully to research in human and organization performance as well as in the learning and developmental sciences. The five core values of the CEHD prominently encapsulate the work of our faculty and the themes of our academic programs: collaboration, ethical leadership, innovation, research-based practice, and social justice.
The College is composed of two sub-units: the Graduate School of Education (GSE) and the School of Recreation, Health, and Tourism (RHT). GSE’s degree, licensure, and certificate programs are focused on teacher and counselor preparation, advanced studies for teachers and school leaders, instructional technology, and research training. GSE offers many of its academic programs in an innovative cohort outreach format that takes faculty out into school and community sites. In addition, GSE has developed undergraduate pathways to the teaching profession and also offers collaborative undergraduate programs in human development and family science. RHT includes undergraduate and master’s programs in recreation, kinesiology, health and physical education, athletic training, sport management, and tourism, hospitality, and events management. CEHD has approximately 3,450 students (2,620 graduate students) and 125 full-time instructional faculty members. In addition, over 1,000 non-degree students enroll each year in continuing and professional education courses.
CEHD houses a Sports Medicine lab and 13 research and service centers, including the widely acclaimed Helen A. Kellar Institute for Human disAbilities. The Kellar Institute employs approximately 30 research and professional faculty on funded state and federal projects focused on improving the lives and productivity of persons with disabilities. CEHD also maintains a broad range of effective professional development partnerships with school systems and community agencies in the National Capital Region.
The CEHD faculty includes many nationally and internationally prominent scholars. In teaching, the college is committed to exemplary instruction, mentoring, and academic services, and to meeting urgent personnel preparation. In research, CEHD is committed to advancing scientific and applied knowledge in ways that have a consequential impact on education and human development, and on society at large. Last year, external funding in support of research and scholarship was nearly $17.0M.
FY 2016 ORIGINAL FY 2017 ORIGINAL
E&G BUDGET EXPENSE
E&G BUDGET EXPENSE
$27,581,000
$27,565,300
.
76
COLLEGE OF HEALTH AND HUMAN SERVICES (CHHS)
The College of Health and Human Services prepares both undergraduate and graduate students to provide care and services and fill administrative and leadership roles in a variety of public health, clinical health care, and social service organizations. The college comprises a School of Nursing and five academic departments: Social Work, Health Administration and Policy, Global and Community Health, Rehabilitation Science, and Nutrition and Food Studies, and three research centers: the Center for Health Care Policy and Ethics, the Center for the Study of Chronic Illness and Disability, and the Machine Learning and Inference Laboratory. These centers perform cutting-edge health services research and serve as a vital source of health policy information and advocacy on national health and social care issues.
College faculty have been recognized by the university and the State Council of Higher Education for excellence in teaching. The college has developed strong partnerships with regional, national, and international agencies in several important areas:
1. College faculty serve as both research, educational, and clinical resources for local and state agencies and non-profit organizations;
2. Undergraduate, master’s, and doctoral students provide services to clients through their professional practice throughout Northern Virginia and many other regional, national, and international sites; and
3. International students study in CHHS to gain professional knowledge and skills to enhance health care and social policy in their own countries.
These partnerships broaden and strengthen the college’s academic programs and provide leadership in addressing critical population health, clinical health, and social needs. In addition to offering coursework on both the Fairfax and Science and Technology Campuses, the college has a strong academic outreach program to deliver advanced health education to working professionals at or near their work sites and has recently expanded its distance education offerings to make health professional training more accessible to all students.
The philosophy of the College of Health and Human Services includes explicit statements regarding the value of sound general education that enables students to develop analytical and creative thinking and make well-founded ethical decisions. Graduates are expected to practice in a variety of roles in complex, multi-cultural, and international settings. The college encourages diversity in its student body and provides interdisciplinary and innovative professional education that is well-grounded in philosophy, science, social science, health practice, and technology.
FY 2016 ORIGINAL FY 2017 ORIGINAL
E&G BUDGET EXPENSE
E&G BUDGET EXPENSE
$19,195,700
$19,415,400

77
COLLEGE OF HUMANITIES AND SOCIAL SCIENCES (CHSS)
The College of Humanities and Social Sciences houses academic and research programs that span traditional and interdisciplinary fields of study. Students benefit from intense faculty involvement, a student-oriented philosophy and an environment characteristic of a traditional liberal arts college, an educational foundation that focuses on linking the intellectual with the practical, and strong preparation for careers and civic life. Students grapple with fundamental questions about values and culture, history and society, art, and self-development—questions that require nuanced and informed thought if we are to solve the problems facing our communities, nation, and world. Trained in this challenging academic environment our students go on to leadership positions in industry and public service. Their skills particularly serve Northern Virginia and the DC metropolitan area, knowledge economies where the largest career growth is in the management fields.
The largest academic unit on campus with roughly 6,200 undergraduate majors, the college teaches nearly every undergraduate at Mason and also offers a rigorous graduate curriculum and nationally ranked programs to over 1,600 graduate students. Also as a good steward of Mason’s resources, it also teaches students with great efficiency. Indeed, of all major units at Mason, the college provides one of the highest margins of net revenue back to Mason, even as it offers hundreds of small-sized classes each semester. Its students also enjoy higher rates of retention and graduation than the Mason average, including a freshman four-year graduate rate 10 percent higher than Mason’s.
Faculty scholarship underpins instruction within the college and advances knowledge, both locally and globally. Their scholarship leads to an abundance of published monographs, books, and peer-reviewed scholarly articles each year. Notably, Mason’s rating in top 200 universities worldwide by Academic Ranking of World Universities is based almost exclusively on Mason’s achievements in the category of social science, where Mason is ranked in the top 50. A powerhouse in research productivity, the college has averaged $18 million annually in externally funded research expenditures throughout the humanities and social sciences. The college’s research expenditures are included in the National Science Foundation’s Science and Engineering (S&E) and Non-S&E categories, both of which are included in the Carnegie research classification for Mason. College faculty and students have included Nobel, Pulitzer, Guggenheim, and MacArthur recipients; members of the American Academy of Arts and Sciences; Forbes “30 under 30” selections; and winners of countless other faculty and student prizes. Our faculty has influence beyond Mason as consistent contributors to public scholarship, media-cited experts, prize-winning authors and bloggers, elected officials for professional organizations, journal editors, and more.
FY 2016 ORIGINAL FY 2017 ORIGINAL
E&G BUDGET EXPENSE
E&G BUDGET EXPENSE
$58,231,900
$59,024,600
78
COLLEGE OF SCIENCE (COS)
The College of Science at George Mason University provides scientific insight and solutions to the rapidly changing needs and demands of today’s global society by blending traditional science education with sought-after, innovative programs in high-profile disciplines including (but not limited) to personalized medicine, biomedical research, geoinformatics, climate dynamics, environmental conservation and sustainability, data science, cosmic exploration, forensic science, geospatial intelligence, and more. While serving as a vital community and regional resource for science education through hands-on programming for K–12 students, teacher training, and community outreach programs, the college also is a leader in the development of creative STEM initiatives to challenge and engage students at all levels. The college serves the university through extensive Mason Core teaching across its programs, most notably in mathematics, chemistry, physics, and biology.
The college projects student growth within six years as a result of targeting new and expanded programs in high-demand disciplines that meet regional and national workforce development needs. Enhanced undergraduate research opportunities are available to complement this growth, and aggressive recruitment strategies and support programs to accommodate a diverse population of minorities and women in science.
Furthermore, anticipated increases in research expenditures are expected over the next several years. New government and corporate collaborations are emerging in the biomedical area including the Mason Inova partnership, growing data science initiatives, a simulation and traffic safety program, expanded focus on environmental and conservation efforts at the new facilities in Belmont Bay, a strong academic and research presence in remote sensing and geospatial sciences, and broadened sustainability, climate, and water security programs. Entrepreneurial and economic development options will increase with new discoveries, additional patents, and continued success of current spin-off companies.
Academic programs and pioneering research initiatives are housed at the Fairfax campus, the Science and Technology campus in Prince William, and other specialty locations throughout Northern Virginia. This broad regional presence, combined with strategic national and international connections, reinforces the college’s mission to provide world-class scientific leadership in a wide variety of areas important to modern society.
FY 2016 ORIGINAL FY 2017 ORIGINAL
E&G BUDGET EXPENSE
E&G BUDGET EXPENSE
$42,183,700
$43,699,000

79
COLLEGE OF VISUAL AND PERFORMING ARTS (CVPA)
The mission of the College of Visual and Performing Arts is to advance the study, creation, performance, and exhibition of the arts, acting on a strong belief in their transformative influence on individuals and civilizations. To fulfill this mission, CVPA offers degree programs in arts management, art and visual technology, dance, film and video studies, game design, music, and theater; and, through the Center for the Arts (CFA), the Hylton Performing Arts Center (HPAC), and a thriving program of visual art exhibitions and film screenings, brings the professional voice of the arts to the campus and community. CVPA honors the value of the great traditions in the arts while actively engaging in the creation of new works and ideas.
CVPA's success finds expression on many fronts. The number of arts majors has remained relatively stable over the past five years. Ticket revenue for the Great Performances at Mason series in Fairfax and the Manassas Hylton Presents series maintains an overall growth trend. General student attendance and participation in the arts are strong and growing. Some 25,000 students annually experience the arts at Mason.
Program quality has increased greatly. Recognition of student and faculty achievement is strong. Mason alumni perform with prestigious dance, opera, and theater companies, work in film and television, play in prominent bands and orchestras, work as arts managers in top institutions, exhibit their work in galleries across the country, create graphic design for leading corporations, build companies in the growing field of simulation and game design, and hold teaching positions at every level from pre-K through higher education. In the most recent Career Outcomes survey, CVPA undergraduates outperformed the Mason average for the first time. Faculty perform, direct, choreograph, write, design, exhibit, and publish in professional venues internationally.
CVPA is proud of its role as a “front door” of the university, annually serving as a point of inspiration, education, and connection with well over 300,000 members of Mason’s extended communities. As a unit that reflects a unique interweaving of the academic, the professional, and the community, CVPA sees itself as a wellspring of campus culture—a creator, importer, and exporter of a strand of practice that speaks to the best impulses of the human condition as expressed by the great artists of the past and the vital and challenging voices emerging today and in the future. CVPA is actively engaged in partnerships and exchanges of faculty and students in places such as China and Korea.
The principal challenges and opportunities facing CVPA in the next several years involve a master facilities plan with exciting building projects to bring the college’s physical environment more in line with its current size and aspiration and to maintain strength in light of major advances by our peers. CVPA’s active, growing volunteer community is pursuing philanthropic opportunities that will transform the landscape of the arts for generations to come. The college offers undergraduate degrees (BA, BM, BFA), master’s degrees (MA, MAT, MM, MFA), and doctoral degrees (PhD in Music Education, DMA, and a variety of professional certificates) and participates in various Master of Arts in Interdisciplinary Studies (MAIS) programs.
FY 2016 ORIGINAL FY 2017 ORIGINAL
E&G BUDGET EXPENSE
E&G BUDGET EXPENSE
$13,133,900
$13,124,100

80
SCHOOL FOR CONFLICT ANALYSIS AND RESOLUTION (S-CAR)
At the School for Conflict Analysis and Resolution (S-CAR), the whole community of faculty, students, staff, alumni, and partners is committed to the development of theory, research, and practice that interrupt cycles of violence. S-CAR is an innovative academic resource for people and institutions worldwide. It comprises a community of scholars, graduate and undergraduate students, alumni, practitioners, and organizations in the field of peace making and conflict resolution.
S-CAR is committed to:
Advancing the understanding of deeply rooted conflicts between individuals, groups, organizations, and communities all over the world through research, teaching, practice, and outreach;
Carrying on a systematic and ongoing study of the nature, origins, and types of social conflicts; Developing the requisite processes and conditions for the productive resolution of conflict; and Addressing underlying conditions that produce structural violence and asymmetry.
The S-CAR community views conflict as a normal product of human interaction, neither good nor bad. We recognize that the effects of conflict can be positive or negative. Our work attempts to maximize the creative renewing positive qualities of conflict while minimizing the destructive distorting negative ones. We describe conflict as a dynamic system in which events and understandings constantly restructure and reinterpret the past, present, and future. Our objective is more resilient social, institutional, global relationships and an ability to handle routine conflicts more efficiently and to weather serious conflicts which might destroy more rigid structures.
S-CAR is committed to engaged scholarship, taking inquiry and analysis into the field to address problems in our local, national, and global community. S-CAR has anchored itself, theoretically and practically, on applied ethics, a normative value framework that far surpasses, in complexity, the traditional ethical framework of “neutrality.” At S-CAR, we use “reflective practice” as the method by which we grow as human beings and as theorists, researchers, and practitioners; it refers to the process by which persons learn, with others, from reflection on their experience.
FY 2016 ORIGINAL FY 2017 ORIGINAL
E&G BUDGET EXPENSE
E&G BUDGET EXPENSE
$4,197,300
$4,160,400

81
SCHOOL OF BUSINESS
The mission of the School of Business is to prepare a diverse student body to succeed in a global business environment. This mission is achieved through both academic and co-curricular activities. The business faculty's creation and dissemination of business knowledge, practice, and pedagogy enables business students to develop analytical and communication skills as well as ethical business behavior.
The School of Business is fully engaged with the regional business community, graduating highly qualified students as employees, producing research that informs business policy and operations, and providing venues for the region's business leaders to work with our students in the classroom and to learn from each other. Business leaders and organizations are active partners through executive education programs, speaker engagements, classroom lectures, case competitions, business-plan competitions, internships, and career placement. The School of Business also maintains close connections to the business community through its advisory board and advisory councils to academic programs.
With its location at the crossroads of global business and global politics, the business school’s commitment to the region complements the global focus of its programs and the diversity of its student body and faculty. The School of Business enrolls more than 3,500 undergraduate students pursuing majors in accounting, finance, management, marketing, and information systems & operations management. More than 500 graduate students are enrolled in the Mason MBA, Executive MBA, MS in Accounting, MS in Management, MS in Real Estate Development, MS in Technology Management, and MS in Management of Secure Information Systems. We also offer executive education and certificate programs.
The School of Business continues its progress towards becoming a premier business school. While the undergraduate, part-time MBA, and Online EMBA programs rank consistently among the top 100 business schools in the country, the school’s other graduate programs are also receiving recognition. In 2014, the school’s Master’s in Technology Management was featured as an invited session of the United Nations eGovernance conference in Guimarães, Portugal. The School of Business is one of only 25 percent of business schools in the world that is accredited in both business and accounting by the Association to Advance Collegiate Schools of Business (AACSB) International—the most prominent accrediting body for business schools in the world.
FY 2016 ORIGINAL FY 2017 ORIGINAL
E&G BUDGET EXPENSE
E&G BUDGET EXPENSE
$28,095,900
$28,698,400

82
SCHOOL OF LAW (SOL)
George Mason University School of Law is currently ranked 42nd of American law schools and the school’s part-time program is ranked 4th in the nation. Additionally, the law school ranked #17 as the Best Intellectual Property School (U.S. News & World Report, March 2014) and #13 as the Best School for Public Interest/Government careers (National Jurist, 2016). The school has 47 FTE faculty for 453 FTE students in full- and part-time study, 40 percent out-of-state and 60 percent in-state. The students are actively involved in over 30 student-run organizations. The law school occupies 82,381 square feet of space (substantially all of Hazel Hall), and its $14.0 million E&G budget supports the instructional program, the law library, career services, the records office, the admissions office, and a number of legal and academic journals.
Social Science Research Network statistics show that Mason’s faculty is ranked first—among the 350 American law schools—for article downloads per author. In addition, Mason ranks 17th for articles downloaded in the past year, and 21st overall for downloads since SSRN tracking began (SSRN, February 1, 2015). The law faculty was ranked 21st in “scholarly impact” among American law schools, based on a standard objective measure of scholarly impact which uses citations per capita as the metric of faculty quality and reputation (Brian Leiter Rankings, July 2012).
The law school’s 2015 entering class has a median LSAT of 161(top 18 percent) and a median undergraduate GPA of 3.59.
The law school emphasizes the application of public choice theory, decision theory, and economic methods to the study of antitrust, intellectual property and technology, litigation, and public law.
The Law & Economics Center (LEC) is an integral part of the law school, educating thousands of state and federal judges, state attorneys general senior legal staff, competition officials, and other policymakers in the principles and applications of economic analysis of legal doctrines and institutions; conducting large cross-disciplinary research projects; and supporting the law school faculty research. The Center for the Protection of Intellectual Property (CPIP) supports the research of professors and students and undertakes symposia, roundtables, and conferences across the country. The Center for the Study of the Administrative State (CSAS) examines the administrative state, its constitutional foundations, and its political and economic impacts.
The goal of Mason Law is to attract and engage students who will receive an outstanding legal education (Learn), be taught to critically evaluate prevailing orthodoxy and pursue new ideas (Challenge), and, ultimately, be well prepared to distinguish themselves in their chosen fields (Lead).
FY 2016 ORIGINAL FY 2017 ORIGINAL
E&G BUDGET EXPENSE
E&G BUDGET EXPENSE
$14,146,400
$14,021,500
83
SCHOOL OF POLICY, GOVERNMENT, AND INTERNATIONAL AFFAIRS (SPGIA)
The School of Policy, Government, and International Affairs (SPGIA) prepares undergraduate and graduate students to be leaders who advance the public good in the private, public, and nonprofit sectors. SPGIA was created by a merger in 2014 between the School of Public Policy and the Department of Public and International Affairs. Through research and education in policy, government, and international affairs, SPGIA allows Mason to more effectively serve the region, Commonwealth, nation, and world.
The SPGIA faculty combines original research with real-world experience to connect theory and practice for the benefit of students and wider constituencies. The school employs approximately 80 full-time faculty members across a wide range of disciplines, including political science, public administration, international relations, economics, management, geography, engineering, sociology, anthropology, and law. SPGIA is a major research unit of the university, with approximately $3 million per year in sponsored funding. SPGIA faculty members frequently advise governments, companies, and non-profit organizations, appear in the national and international media, and participate in public debates on critical issues of the day.
SPGIA offers two undergraduate majors, ten master’s degree programs, three doctoral programs, and a range of undergraduate minors and graduate certificates. Collectively, these programs enroll approximately 2,000 students. SPGIA offers classes on Mason’s Fairfax and Arlington campuses, and its faculty members have offices on both campuses.
FY 2016 ORIGINAL FY 2017 ORIGINAL
E&G BUDGET EXPENSE
E&G BUDGET EXPENSE
$16,374,900
$16,502,700
84
VOLGENAU SCHOOL OF ENGINEERING (VSE)
The mission of the Volgenau School of Engineering is to provide a transformative learning experience for our students that integrates engineering and technology with other areas of scholarship to produce visionary stewards of society who are prepared to discover solutions to complex global challenges and make the world safer, cleaner, and more prosperous. Our faculty members are engaged educators who lead high-impact research in critical areas such as sustainability, big data, cybersecurity, robotics and artificial intelligence, and healthcare. These existing and emerging areas of expertise span departmental and disciplinary boundaries and reflect the breadth of the scholarly activities of our faculty and students.
VSE continues to expand its course and degrees offerings. In fall 2014, Mason became one of only five universities in the country to offer a multidisciplinary data analytics engineering master’s degree program to meet a burgeoning demand for professionals who can extract insight from the flood of “big data.” We also added bachelor’s degree programs in cyber security engineering, with a focus on critical infrastructure protection and mechanical engineering. Our PhD in bioengineering, aimed at educating future scholars and leaders in this field, also launched in January 2015. This year two new master’s degrees, one in homeland security technology and the other in bioengineering, are awaiting review by the State Council of Higher Education for Virginia.
VSE faculty members have been named professional society fellows and have received international recognition and awards. The school has enjoyed success in attracting world-class faculty and researchers. Critical factors for our continuing success include a commitment to quality and program improvement, expansion of physical facilities including labs and design studios, new academic programs in emerging areas of technologies, and substantial growth in research funding and expenditures.
In the 2015-16 academic year, enrollment reached an all-time high as the student population grew to 6,222. We encourage students to pursue internships to gain practical experience in their fields of study. VSE’s proximity to the nation’s capital allows our students to take advantage of our relationships with business, government, and nonprofits. Our graduates consistently find high-paying jobs with top companies. The school was ranked 11th Best Graduate Program by GraduatePrograms.com (2015).
The school encourages students to become involved in outreach activities through more than 25 student organizations. These organizations include peer advisors, honor societies, student chapters of professional societies, student veterans, and the applied robotics club. VSE’s philanthropic efforts have forged productive relationships with corporate partners and friends.
FY 2016 ORIGINAL FY 2017 ORIGINAL
E&G BUDGET EXPENSE
E&G BUDGET EXPENSE
$33,802,600
$35,737,800

85
KRASNOW INSTITUTE
The Krasnow Institute for Advanced Study seeks to expand the understanding of the mind, brain, and intelligence by conducting research at the intersection of the separate fields of cognitive psychology, neurobiology, and the computer-driven study of artificial intelligence and complex adaptive systems. These separate disciplines increasingly overlap and promise progressively deeper insight into human thought processes. The institute also examines how new insights from cognitive science research can be applied for human benefit in the areas of mental health, neurological disease, education, and computer design.
Krasnow Institute researchers work within 55,000 square feet of space with state-of-the-art laboratory facilities on the Fairfax Campus. Since 1997, Krasnow scientists have been awarded over $64 million in sponsored research funds from federal agencies such as the National Institutes of Health, the National Science Foundation, the Air Force, and the Office of Naval Research, and from private funds such as the W.M. Keck Foundation, the Howard Hughes Medical Institute, Wings for Life, and the Sir John Templeton Foundation. Institute scientists have aggregately published in hundreds of peer-reviewed publications, including high impact journals such as Science, Nature and the Proceedings of the National Academy of Sciences.
FY 2016 ORIGINAL FY 2017 ORIGINAL
E&G BUDGET EXPENSE
E&G BUDGET EXPENSE
$2,114,800
$628,300
86
PROVOST’S INSTRUCTION
The Provost’s Instruction division comprises those academic units that report under the Office of the Provost but whose functions support instructional activity. Included in this division are the Center for Global Education, the Center for Teaching & Faculty Excellence, and the Robinson Professors. For reporting purposes, the Robinson Professors are shown in this division, but they teach courses predominantly within the Honors College, the College of Humanities and Social Sciences (CHSS), and the College of Science (COS).
FY 2016 ORIGINAL FY 2017 ORIGINAL
E&G BUDGET EXPENSE
E&G BUDGET EXPENSE
$11,837,300
$11,035,900
Note: Original Budgets include Summer Term funding and INTO Mason instructional activities.
PROVOST’S ADMINISTRATION
The Provost’s Administration supports various facets of the university. The Faculty Senate, division of Research (including Sponsored Programs), division of Global and International Strategies, and division of University Life fall within this series of organizations. The budget for University Life is separate and follows. The operational department of the Provost’s staff also is included in this budget.
FY 2016 ORIGINAL FY 2017 ORIGINAL
E&G BUDGET EXPENSE E&G BUDGET EXPENSE
$10,333,100
$13,458,200
Note: FY 2017 Original Budget includes INTO Mason administrative activities.
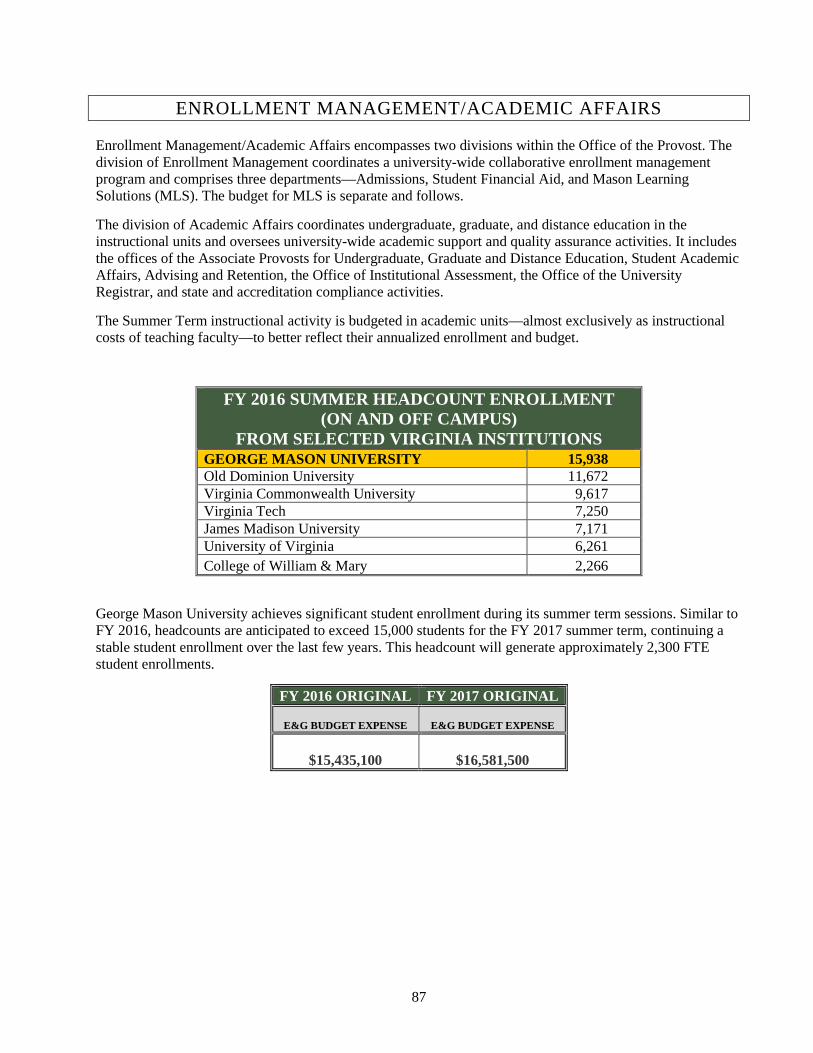
87
ENROLLMENT MANAGEMENT/ACADEMIC AFFAIRS
Enrollment Management/Academic Affairs encompasses two divisions within the Office of the Provost. The division of Enrollment Management coordinates a university-wide collaborative enrollment management program and comprises three departments—Admissions, Student Financial Aid, and Mason Learning Solutions (MLS). The budget for MLS is separate and follows.
The division of Academic Affairs coordinates undergraduate, graduate, and distance education in the instructional units and oversees university-wide academic support and quality assurance activities. It includes the offices of the Associate Provosts for Undergraduate, Graduate and Distance Education, Student Academic Affairs, Advising and Retention, the Office of Institutional Assessment, the Office of the University Registrar, and state and accreditation compliance activities.
The Summer Term instructional activity is budgeted in academic units—almost exclusively as instructional costs of teaching faculty—to better reflect their annualized enrollment and budget.
FY 2016 SUMMER HEADCOUNT ENROLLMENT (ON AND OFF CAMPUS)
FROM SELECTED VIRGINIA INSTITUTIONS GEORGE MASON UNIVERSITY 15,938 Old Dominion University 11,672 Virginia Commonwealth University 9,617 Virginia Tech 7,250 James Madison University 7,171 University of Virginia 6,261 College of William & Mary 2,266
George Mason University achieves significant student enrollment during its summer term sessions. Similar to FY 2016, headcounts are anticipated to exceed 15,000 students for the FY 2017 summer term, continuing a stable student enrollment over the last few years. This headcount will generate approximately 2,300 FTE student enrollments.
FY 2016 ORIGINAL FY 2017 ORIGINAL
E&G BUDGET EXPENSE
E&G BUDGET EXPENSE
$15,435,100 $16,581,500

88
UNIVERSITY LIFE
University Life creates purposeful learning environments, experiences, and opportunities that energize all students to broaden their capacity for academic success, degree completion, and personal growth. University Life prepares students for the demands of work, social responsibility, and life in an ever-changing global society. Through innovative programs, partnerships, and direct services, students discover their unique talents, passions, and place in the world.
University Life integrates the curricular and co-curricular aspects of the institution and creates a sense of community for students, faculty, and staff. Through direct services and programs, University Life supports every student at Mason from orientation through graduation. University Life services and programs focus on:
o Retention o Timely Degree Completion o Post-Graduation Success o Well-Being
o Student Learning o Engagement / Sense of Belonging o Service / Support o Inclusive Community
University Life Offices
Academic, Career Counseling & Educational
Services Academic Integrity Career Services Dean of Students Disability Services Early Identification Program Learning Services Student Conduct Student Support and Case Management Health and Wellness Counseling and Psychological Services Student Health Services Wellness, Alcohol, and Violence Education and
Services
Involvement, Diversity, Leadership & Development Programs & Services
Diversity, Inclusion, and Multicultural Education Fraternity and Sorority Life Graduate Student Life Housing and Residence Life International Programs and Services Leadership Education and Development Lesbian, Gay, Bisexual, Transgender, Queer, and
Questioning Resources Mason Recreation Off-Campus Student Services Orientation and Family Programs and Services Student Government Student Involvement Student Media Women and Gender Studies Center
FY 2016 ORIGINAL FY 2017 ORIGINAL
E&G BUDGET EXPENSE E&G BUDGET EXPENSE
$8,571,500
$8,602,800
89
MASON LEARNING SOLUTIONS (MLS)
Mason Learning Solutions (formerly the Office of Continuing Professional Education) reports to the Provost’s Office, specifically to the Provost and Vice Provost for Academic Affairs. MLS is financially self-sustaining with generated revenues covering all program costs and most operating and salary costs. MLS processes 7,000 registrations a year.
MLS serves as George Mason University’s initial point of contact and referral for the business, government, and professional community and responds to all professional development and continuing education inquiries, requests, and needs. Supported program activities include the following:
Contracted academic credit programs for business and government Non-credit public programs and seminars Non-credit online certificate programs Professional certificate programs Continuing Education Units (CEUs) awards On-site contract training programs Special professional development events and programs Special workforce development programs Training center facilities
A large percentage of courses are delivered through classroom settings but increasingly they are offered through online delivery. MLS offices are strategically located at the Fairfax, Science and Technology, and Arlington campuses.
MLS is positioned internally to provide centralized support and service to the academic community. All business and government contract credit programs, as well as all CEUs awarded, are administered through this office. In addition, technical, marketing, logistical, and administrative support are provided upon request related to academic units’ non-credit initiatives.
FY 2016 ORIGINAL FY 2017 ORIGINAL
E&G BUDGET EXPENSE E&G BUDGET EXPENSE
$3,058,400
$2,880,400
90
LIBRARIES
The George Mason University Libraries, as a core academic function, serves as both a repository of and digital portal to the wider universe of knowledge. The University Libraries fosters innovation, originality, and imagination by qualitatively managing access to scholarship and information, providing expert consultation in the research process, and actively teaching the effective and critical use of information. The University Libraries also fulfills the role of repository for unique historical materials documenting and preserving the evolution of Mason and the Northern Virginia region. Further, it develops specialized research holdings that reflect Mason’s increasingly acknowledged academic strengths that garner national and international visibility for the university.
The tight programmatic and service alignment between the libraries and schools and colleges of the university is achieved through the highly effective academic program liaison librarian program and facilitated through numerous other library-academic unit collaborations and partnerships. Distinctive support for Mason’s faculty by the libraries includes the Fenwick Fellow program for tenure track faculty and the Open Access Publishing Fund, providing support for article processing fees in reputable open access scholarly publications.
Mason’s library system is comprised of five libraries on three different campuses: Fenwick Library and George W. Johnson Center Library, Fairfax Campus; Arlington Campus Library and School of Law Library (administered separately), Arlington Campus; and Mercer Library, Science and Technology Campus. The libraries is a 24x7 operation and serves efficiently a growing student and faculty population and the general public, as well as meets effectively the specialized demands generated by increased university research activities.
Expanded academic support services of the University Libraries include University Copyright Resources Office, University Thesis and Dissertation Services, Data Services (including quantitative and qualitative statistical analysis support, Geographic Information Systems assistance, and research consultation for data management plans and datasets use), University Records Management (for units of the university, mandated by Commonwealth of Virginia regulations) and Mason Archival Repository Service (MARS).
Mason’s Libraries is a member of, and an active participant in, several regional and national resource-sharing academic library consortia, including Virtual Library of Virginia (VIVA), Washington Research Library Consortium (WRLC), Association of Southeastern Research Libraries (ASERL), and Center for Research Libraries—Global Resources Network (CRL).
The libraries’ technology-assisted and enhanced services and programs include: a discovery system offering single search box access to the libraries’ many collections, as well as full-text content from millions of subscribed resources; an e-reference service giving real-time online access to Mason’s librarians; award-winning, discipline-based research portals for special collections, digital images management, and digitization capabilities; and a suite of services supporting data-driven research across disciplines.
FY 2016 ORIGINAL FY 2017 ORIGINAL
E&G BUDGET EXPENSE E&G BUDGET EXPENSE
$20,964,300
$21,146,100
Note: The Law Library budget is included within the School of Law budget.

91
FINANCE AND OPERATIONS
Finance and Operations provides direction, oversight, and financial and operation management for administrative activities at the university. This unit includes the offices of Fiscal Services; Human Resources/Payroll & Faculty/Staff Life; Budget & Planning; the Senior Vice President; Safety, Emergency & Enterprise Risk Management; Campus Police; and Regional Campus Administration. These offices ensure the overall fiscal integrity of the university and provide students, faculty, staff, and visitors with a safe learning and work environment. Together, these offices support the university’s mission as an innovative and inclusive academic community committed to creating a more just, free, and prosperous world.
FY 2016 ORIGINAL FY 2017 ORIGINAL
E&G BUDGET EXPENSE
E&G BUDGET EXPENSE
$29,199,900
$30,923,100
EXECUTIVE ADMINISTRATION
Executive Administration is primarily responsible for senior level leadership and administration for the university. This unit includes the President’s Office; Internal Audit; Office of Compliance, Diversity, and Ethics; and Legal Services. These offices provide institutional guidance and oversight to ensure Mason’s core characteristics–Innovation, Diversity, Entrepreneurship, and Accessibility are central to the university’s mission and strategic plan.
FY 2016 ORIGINAL FY 2017 ORIGINAL
E&G BUDGET EXPENSE E&G BUDGET EXPENSE
$5,118,000
$5,399,700

92
INFORMATION TECHNOLOGY SERVICES (ITS)
The success of George Mason University's Information Technology Services (ITS) continues to rely on its ability to support Mason’s core mission and values. Working in partnership with the university’s faculty, students, and staff, ITS provides essential technology services that enable Mason to do its work: communicate, collaborate, and interact with Mason and beyond.
ITS consists of: Enterprise Infrastructure; Enterprise Applications; Learning Support Services; IT Security; Strategy, Portfolio, and Process Management; Business Operations (HR, Finance, Communications); and Academic Strategies. The organization is focused on improving the effectiveness of the services it delivers that the university relies on to meet its business needs.
FY 2016 ORIGINAL FY 2017 ORIGINAL
E&G BUDGET EXPENSE E&G BUDGET EXPENSE
$33,393,300
$34,268,700
93
ADVANCEMENT AND ALUMNI RELATIONS
The Office of Advancement and Alumni Relations supports the mission and goals of George Mason University by developing relationships with alumni, friends, corporations, foundations, students, and parents that result in philanthropic support and volunteer engagement.
The Advancement team secures private financial support from individuals, foundations, and corporations; this financial support sustains Mason’s mission as a public comprehensive research university and helps Mason attain its goals in the key areas of teaching, research, and service. The Alumni Relations team builds relationships between alumni and the university, facilitating strong bonds of mutual loyalty and engaging alumni in meaningful service. Alumni Relations works with the Alumni Association to offer programs that support the goals of the university and the association. The George Mason University Foundation is a 501(c)(3) non-profit foundation and a private corporation organized and operated exclusively for the benefit of George Mason University. It assists Mason in generating and administering private support and in the acquisition, management, and development of Mason's auxiliary efforts, real property, and other assets that provide strategic support.
FY 2016 ORIGINAL FY 2017 ORIGINAL
E&G BUDGET EXPENSE
E&G BUDGET EXPENSE
$5,695,100
$5,758,300
94
COMMUNICATIONS AND MARKETING
The Office of Communications and Marketing is charged with taking the lead in building and advancing George Mason University’s brand by promoting the talent, expertise, accomplishments, and resources of this world-class university of higher learning.
We operate as a strategic partner with all major university units and initiatives, including academic, development, legislative, and student life. Our approach to every project is holistic, bringing together the right strengths from various disciplines to produce the best results.
One group, Creative Services, consists of highly skilled writers, designers, photographers, and web developers who have an extensive understanding of Mason’s brand voice and visual identity. In addition to being the primary gatekeepers of the brand, together they create printed publications, such as the Mason Spirit, and brochures, posters, videos, and ads.
Working in tandem to help build and manage the Mason brand is our Strategic Communications team. Collaborating with faculty, students, and outside professionals, Mason’s story is told through daily features online and in various print venues by our gifted staff of news writers. They also act as a liaison between the news media and Mason community.
Gathering information isn’t just the domain of Strategic Communications. It is also the function of University Information—a group of dedicated individuals who gather and facilitate the exchange of university facts and details to both internal and external Mason audiences. Astoundingly, they do it for one million people through the university switchboard and directory, kiosks, electronic signboards, and other outlets.
Not surprisingly, every year thousands of events and activities are held on Mason’s three campuses, and these events would not be possible without the planning and staging of University Events. Whether it’s a gubernatorial debate, Nobel Prize reception, Capitol Hill event, or television broadcast, this group ensures each one is expertly managed.
FY 2016 ORIGINAL FY 2017 ORIGINAL
E&G BUDGET EXPENSE E&G BUDGET EXPENSE
$6,328,000
$6,494,200
95
GOVERNMENT AND COMMUNITY RELATIONS
The goals of the Government and Community Relations team are to advance the university’s interests with federal, state, and local governments and develop productive, mutually-beneficial relationships with business and citizen community groups. There are currently three sub-teams within Government and Community Relations.
The federal government relations team advances Mason’s priorities on Capitol Hill and in the federal agencies and acts as the lead group with legislators and regulators. The federal team is regularly engaged with the Virginia Congressional delegation and key departments that are funders for grants and research at Mason.
The state government relations team represents the university administration’s positions in Richmond during the General Assembly and throughout the year on activities related to the budget and other policy issues.
The community relations team is responsible for representing the university to local governments, business, and citizens groups. In particular, the team manages outreach to chambers of commerce and other business specialty groups. The community relations team is also responsible for citizen interaction, project management outreach, and advisory board’s activities.
FY 2016 ORIGINAL FY 2017 ORIGINAL
E&G BUDGET EXPENSE E&G BUDGET EXPENSE
$1,226,700
$1,408,400
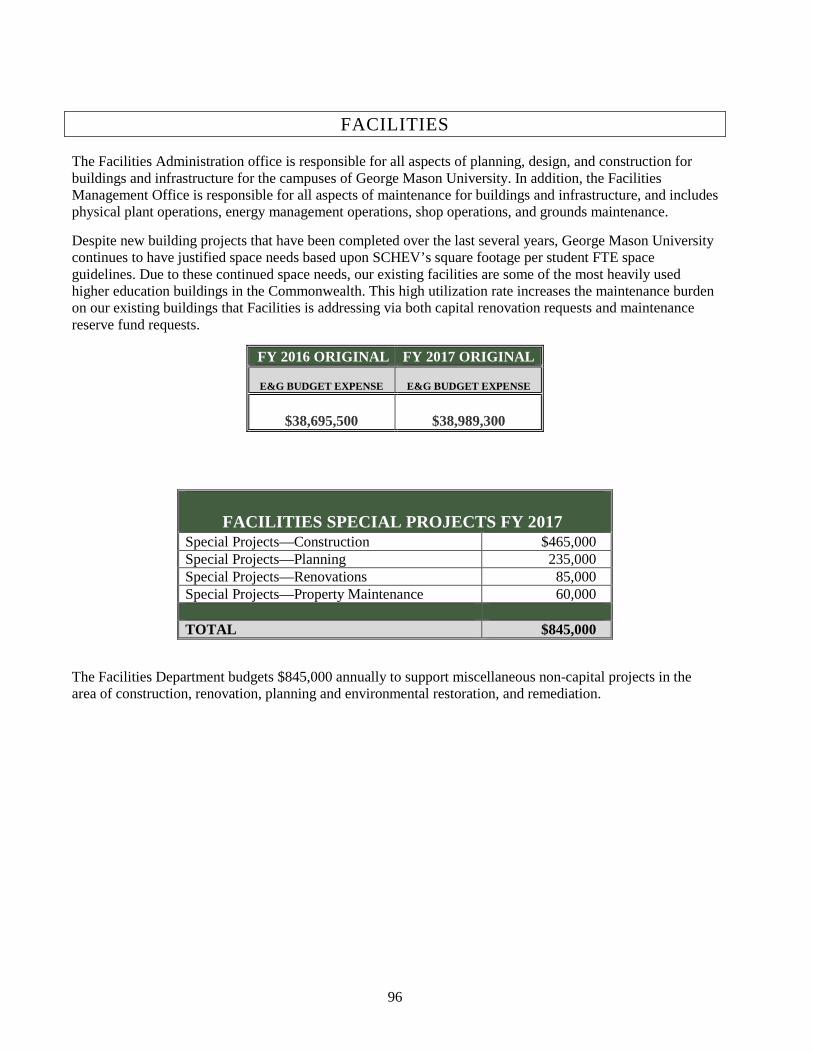
96
FACILITIES
The Facilities Administration office is responsible for all aspects of planning, design, and construction for buildings and infrastructure for the campuses of George Mason University. In addition, the Facilities Management Office is responsible for all aspects of maintenance for buildings and infrastructure, and includes physical plant operations, energy management operations, shop operations, and grounds maintenance.
Despite new building projects that have been completed over the last several years, George Mason University continues to have justified space needs based upon SCHEV’s square footage per student FTE space guidelines. Due to these continued space needs, our existing facilities are some of the most heavily used higher education buildings in the Commonwealth. This high utilization rate increases the maintenance burden on our existing buildings that Facilities is addressing via both capital renovation requests and maintenance reserve fund requests.
FY 2016 ORIGINAL FY 2017 ORIGINAL
E&G BUDGET EXPENSE E&G BUDGET EXPENSE
$38,695,500
$38,989,300
FACILITIES SPECIAL PROJECTS FY 2017
Special Projects—Construction $465,000 Special Projects—Planning 235,000 Special Projects—Renovations 85,000 Special Projects—Property Maintenance 60,000 TOTAL $845,000
The Facilities Department budgets $845,000 annually to support miscellaneous non-capital projects in the area of construction, renovation, planning and environmental restoration, and remediation.
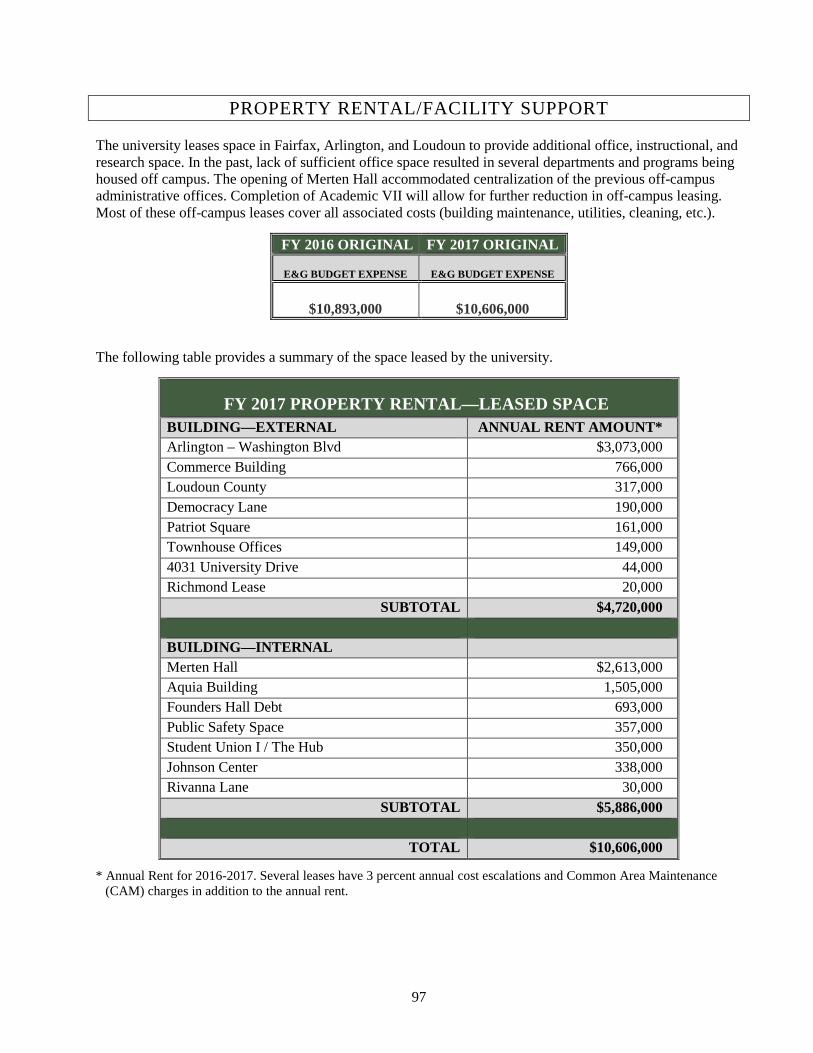
97
PROPERTY RENTAL/FACILITY SUPPORT
The university leases space in Fairfax, Arlington, and Loudoun to provide additional office, instructional, and research space. In the past, lack of sufficient office space resulted in several departments and programs being housed off campus. The opening of Merten Hall accommodated centralization of the previous off-campus administrative offices. Completion of Academic VII will allow for further reduction in off-campus leasing. Most of these off-campus leases cover all associated costs (building maintenance, utilities, cleaning, etc.).
FY 2016 ORIGINAL FY 2017 ORIGINAL
E&G BUDGET EXPENSE
E&G BUDGET EXPENSE
$10,893,000
$10,606,000
The following table provides a summary of the space leased by the university.
FY 2017 PROPERTY RENTAL—LEASED SPACE BUILDING—EXTERNAL ANNUAL RENT AMOUNT* Arlington – Washington Blvd $3,073,000 Commerce Building 766,000 Loudoun County 317,000 Democracy Lane 190,000 Patriot Square 161,000 Townhouse Offices 149,000 4031 University Drive 44,000 Richmond Lease 20,000
SUBTOTAL $4,720,000 BUILDING—INTERNAL Merten Hall $2,613,000 Aquia Building 1,505,000 Founders Hall Debt 693,000 Public Safety Space 357,000 Student Union I / The Hub 350,000 Johnson Center 338,000 Rivanna Lane 30,000
SUBTOTAL $5,886,000
TOTAL $10,606,000
* Annual Rent for 2016-2017. Several leases have 3 percent annual cost escalations and Common Area Maintenance (CAM) charges in addition to the annual rent.

98
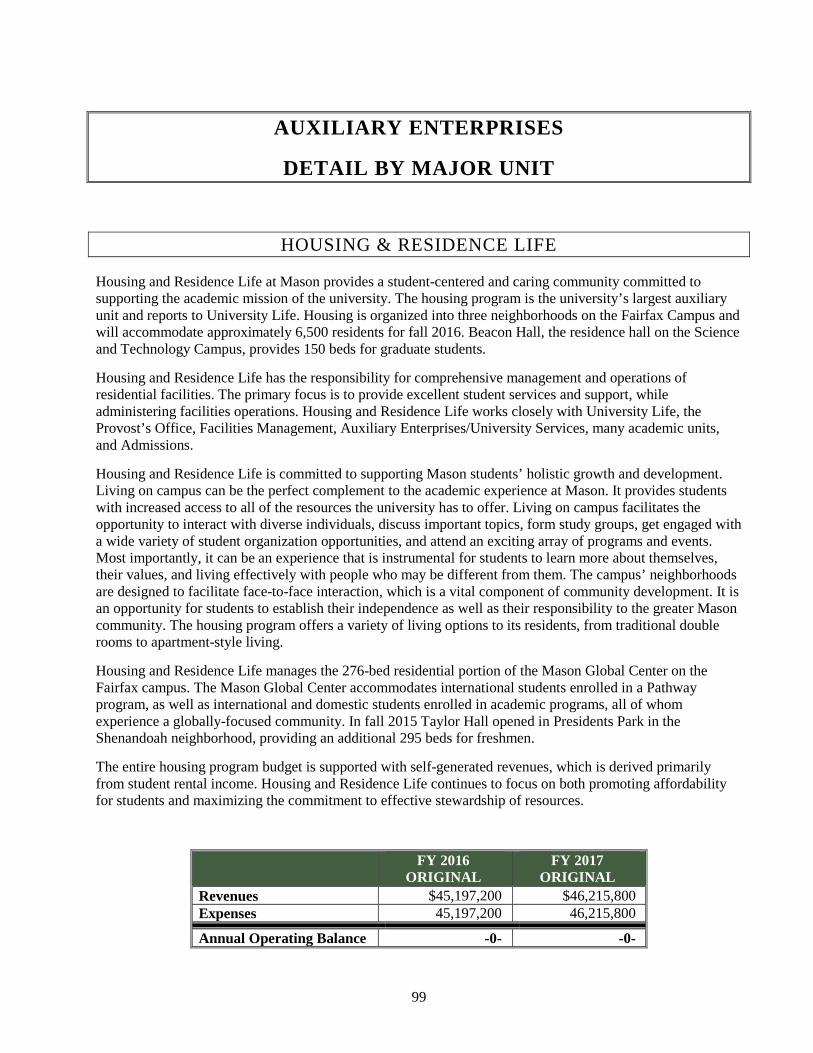
99
AUXILIARY ENTERPRISES
DETAIL BY MAJOR UNIT
HOUSING & RESIDENCE LIFE
Housing and Residence Life at Mason provides a student-centered and caring community committed to supporting the academic mission of the university. The housing program is the university’s largest auxiliary unit and reports to University Life. Housing is organized into three neighborhoods on the Fairfax Campus and will accommodate approximately 6,500 residents for fall 2016. Beacon Hall, the residence hall on the Science and Technology Campus, provides 150 beds for graduate students.
Housing and Residence Life has the responsibility for comprehensive management and operations of residential facilities. The primary focus is to provide excellent student services and support, while administering facilities operations. Housing and Residence Life works closely with University Life, the Provost’s Office, Facilities Management, Auxiliary Enterprises/University Services, many academic units, and Admissions.
Housing and Residence Life is committed to supporting Mason students’ holistic growth and development. Living on campus can be the perfect complement to the academic experience at Mason. It provides students with increased access to all of the resources the university has to offer. Living on campus facilitates the opportunity to interact with diverse individuals, discuss important topics, form study groups, get engaged with a wide variety of student organization opportunities, and attend an exciting array of programs and events. Most importantly, it can be an experience that is instrumental for students to learn more about themselves, their values, and living effectively with people who may be different from them. The campus’ neighborhoods are designed to facilitate face-to-face interaction, which is a vital component of community development. It is an opportunity for students to establish their independence as well as their responsibility to the greater Mason community. The housing program offers a variety of living options to its residents, from traditional double rooms to apartment-style living.
Housing and Residence Life manages the 276-bed residential portion of the Mason Global Center on the Fairfax campus. The Mason Global Center accommodates international students enrolled in a Pathway program, as well as international and domestic students enrolled in academic programs, all of whom experience a globally-focused community. In fall 2015 Taylor Hall opened in Presidents Park in the Shenandoah neighborhood, providing an additional 295 beds for freshmen.
The entire housing program budget is supported with self-generated revenues, which is derived primarily from student rental income. Housing and Residence Life continues to focus on both promoting affordability for students and maximizing the commitment to effective stewardship of resources.
FY 2016
ORIGINAL FY 2017
ORIGINAL Revenues $45,197,200 $46,215,800 Expenses 45,197,200 46,215,800
Annual Operating Balance -0- -0-

100
INTERCOLLEGIATE ATHLETICS
The Intercollegiate Athletics (ICA) program at Mason is recognized for both departmental quality and depth. The ICA program comprises competitive activities in 22 programs for men and women and has competitions taking place on local, regional, and national levels. The ICA program participates in the Atlantic 10 conference. The following programs are currently offered at Mason:
Men’s Baseball Men’s Track (2) Men’s Cross-Country Women’s Track (2) Men’s Wrestling Men’s Tennis Women’s Cross-Country Women’s Volleyball Men’s Volleyball Women’s Soccer Men’s Soccer Women’s Basketball Men’s Basketball Men’s Golf Women’s Lacrosse Women’s Rowing Men’s Swimming Women’s Swimming Women’s Softball Women’s Tennis
Mason is committed to its student athletes both academically and athletically. Mason has created an administrative process committed to excellence in the areas of academic assistance, gender equity, and compliance. Recently, several teams have been recognized for earning high scores in the Academic Progress Rate (APR).
The administrative operations of the ICA program are funded through student fee allocations. However, the ICA program depends upon external revenue to cover the costs of athletic scholarships. Since generating sufficient funds has been difficult throughout the history of the program, alternative funding strategies are often explored. A portion of the revenues used to cover the costs of scholarships is generated through the Athletic Department’s development efforts. Additionally, revenues earned from the EagleBank Arena and beverage and vending contracts support scholarship costs. The ICA program will continue to strengthen its efforts to secure external funding not only to cover tuition and fee increases set forth by the university, but also to fund facility and other enhancements of the program.
FY 2016 ORIGINAL
FY 2017 ORIGINAL
Revenues $18,903,300 $19,885,200 Expenses 18,903,300 19,885,200
Annual Operating Balance -0- -0-

101
FIELD HOUSE
The Field House is located at the corner of Ox Road (Route 123) and University Drive on the Fairfax Campus. The 110,000-square-foot complex features a 200-meter indoor track, basketball courts, weight room, and accommodations for indoor volleyball and indoor soccer. Outdoor features include a baseball stadium, softball stadium, soccer/lacrosse/track stadium, and practice fields. The facility and outdoor practice fields are used by intercollegiate athletic teams as well as club and intramural sports. (FY 2017 Revenue Budget totals $2.2 million)
Athletic Facilities Improvement Funds is an effort to keep well maintained athletic facilities that address the expanding needs of the student athletes. Mason sets aside funds annually to address major athletic facilities improvement projects for all facilities located on the west campus, including the Field House, practice fields, George Mason Stadium, the Spuhler Field (baseball), a softball complex, and two unlighted bermuda grass fields. The funding helps assure that athletic facilities are available to intercollegiate athletic teams year-round. The budget for athletic facilities improvements is supported by student fees. (FY 2017 Revenue Budget totals $0.2 million)
FY 2016 ORIGINAL
FY 2017 ORIGINAL
Revenues $2,494,600 $2,447,400 Expenses 2,494,600 2,447,400
Annual Operating Balance -0- -0-
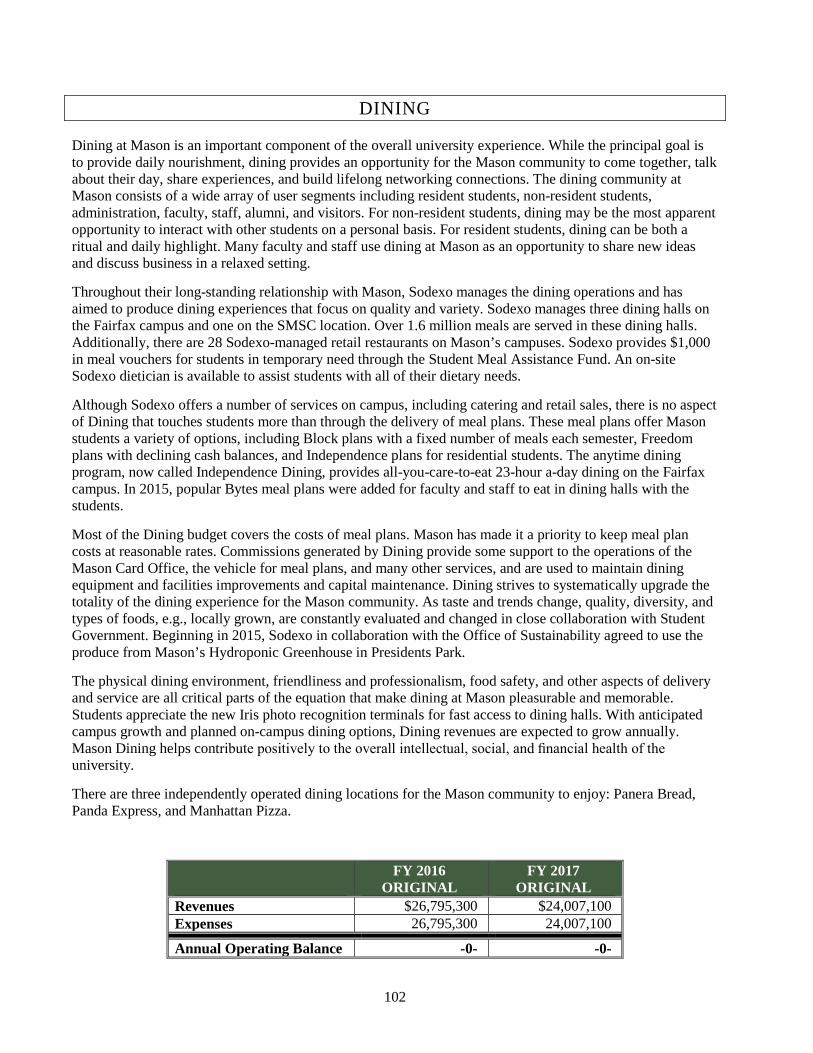
102
DINING
Dining at Mason is an important component of the overall university experience. While the principal goal is to provide daily nourishment, dining provides an opportunity for the Mason community to come together, talk about their day, share experiences, and build lifelong networking connections. The dining community at Mason consists of a wide array of user segments including resident students, non-resident students, administration, faculty, staff, alumni, and visitors. For non-resident students, dining may be the most apparent opportunity to interact with other students on a personal basis. For resident students, dining can be both a ritual and daily highlight. Many faculty and staff use dining at Mason as an opportunity to share new ideas and discuss business in a relaxed setting.
Throughout their long-standing relationship with Mason, Sodexo manages the dining operations and has aimed to produce dining experiences that focus on quality and variety. Sodexo manages three dining halls on the Fairfax campus and one on the SMSC location. Over 1.6 million meals are served in these dining halls. Additionally, there are 28 Sodexo-managed retail restaurants on Mason’s campuses. Sodexo provides $1,000 in meal vouchers for students in temporary need through the Student Meal Assistance Fund. An on-site Sodexo dietician is available to assist students with all of their dietary needs.
Although Sodexo offers a number of services on campus, including catering and retail sales, there is no aspect of Dining that touches students more than through the delivery of meal plans. These meal plans offer Mason students a variety of options, including Block plans with a fixed number of meals each semester, Freedom plans with declining cash balances, and Independence plans for residential students. The anytime dining program, now called Independence Dining, provides all-you-care-to-eat 23-hour a-day dining on the Fairfax campus. In 2015, popular Bytes meal plans were added for faculty and staff to eat in dining halls with the students.
Most of the Dining budget covers the costs of meal plans. Mason has made it a priority to keep meal plan costs at reasonable rates. Commissions generated by Dining provide some support to the operations of the Mason Card Office, the vehicle for meal plans, and many other services, and are used to maintain dining equipment and facilities improvements and capital maintenance. Dining strives to systematically upgrade the totality of the dining experience for the Mason community. As taste and trends change, quality, diversity, and types of foods, e.g., locally grown, are constantly evaluated and changed in close collaboration with Student Government. Beginning in 2015, Sodexo in collaboration with the Office of Sustainability agreed to use the produce from Mason’s Hydroponic Greenhouse in Presidents Park.
The physical dining environment, friendliness and professionalism, food safety, and other aspects of delivery and service are all critical parts of the equation that make dining at Mason pleasurable and memorable. Students appreciate the new Iris photo recognition terminals for fast access to dining halls. With anticipated campus growth and planned on-campus dining options, Dining revenues are expected to grow annually. Mason Dining helps contribute positively to the overall intellectual, social, and financial health of the university.
There are three independently operated dining locations for the Mason community to enjoy: Panera Bread, Panda Express, and Manhattan Pizza.
FY 2016
ORIGINAL FY 2017
ORIGINAL Revenues $26,795,300 $24,007,100 Expenses 26,795,300 24,007,100
Annual Operating Balance -0- -0-
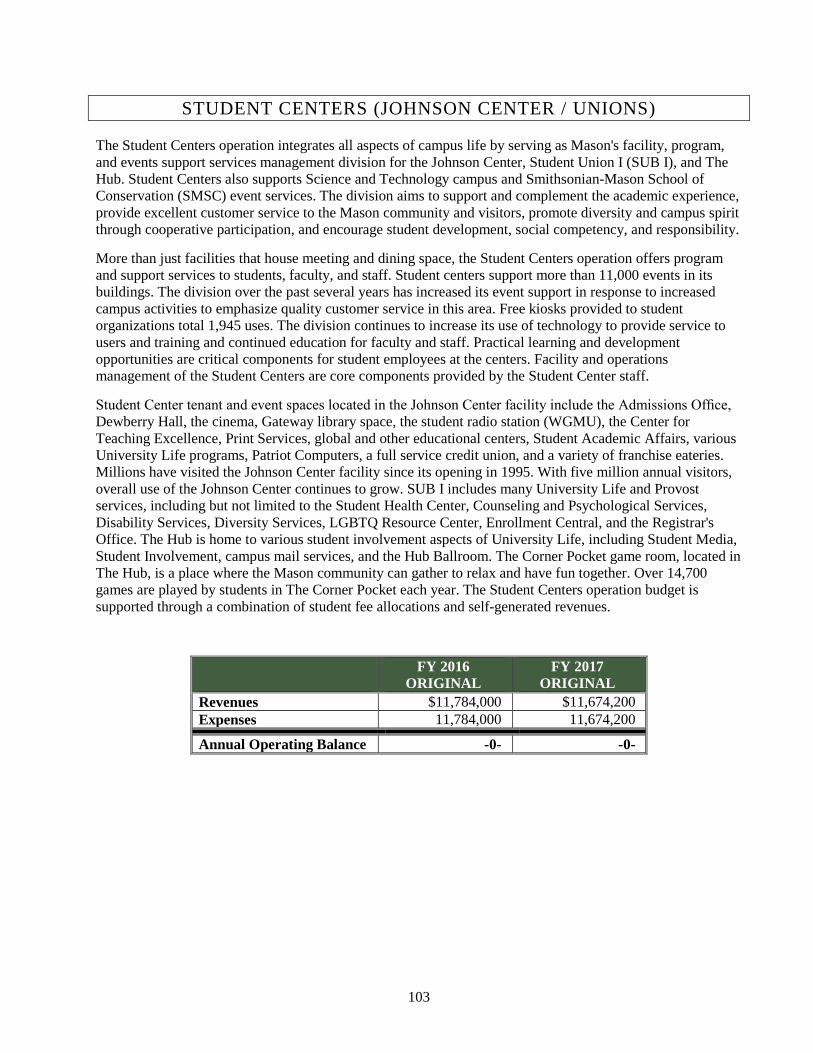
103
STUDENT CENTERS (JOHNSON CENTER / UNIONS)
The Student Centers operation integrates all aspects of campus life by serving as Mason's facility, program, and events support services management division for the Johnson Center, Student Union I (SUB I), and The Hub. Student Centers also supports Science and Technology campus and Smithsonian-Mason School of Conservation (SMSC) event services. The division aims to support and complement the academic experience, provide excellent customer service to the Mason community and visitors, promote diversity and campus spirit through cooperative participation, and encourage student development, social competency, and responsibility.
More than just facilities that house meeting and dining space, the Student Centers operation offers program and support services to students, faculty, and staff. Student centers support more than 11,000 events in its buildings. The division over the past several years has increased its event support in response to increased campus activities to emphasize quality customer service in this area. Free kiosks provided to student organizations total 1,945 uses. The division continues to increase its use of technology to provide service to users and training and continued education for faculty and staff. Practical learning and development opportunities are critical components for student employees at the centers. Facility and operations management of the Student Centers are core components provided by the Student Center staff.
Student Center tenant and event spaces located in the Johnson Center facility include the Admissions Office, Dewberry Hall, the cinema, Gateway library space, the student radio station (WGMU), the Center for Teaching Excellence, Print Services, global and other educational centers, Student Academic Affairs, various University Life programs, Patriot Computers, a full service credit union, and a variety of franchise eateries. Millions have visited the Johnson Center facility since its opening in 1995. With five million annual visitors, overall use of the Johnson Center continues to grow. SUB I includes many University Life and Provost services, including but not limited to the Student Health Center, Counseling and Psychological Services, Disability Services, Diversity Services, LGBTQ Resource Center, Enrollment Central, and the Registrar's Office. The Hub is home to various student involvement aspects of University Life, including Student Media, Student Involvement, campus mail services, and the Hub Ballroom. The Corner Pocket game room, located in The Hub, is a place where the Mason community can gather to relax and have fun together. Over 14,700 games are played by students in The Corner Pocket each year. The Student Centers operation budget is supported through a combination of student fee allocations and self-generated revenues.
FY 2016
ORIGINAL FY 2017
ORIGINAL Revenues $11,784,000 $11,674,200 Expenses 11,784,000 11,674,200
Annual Operating Balance -0- -0-
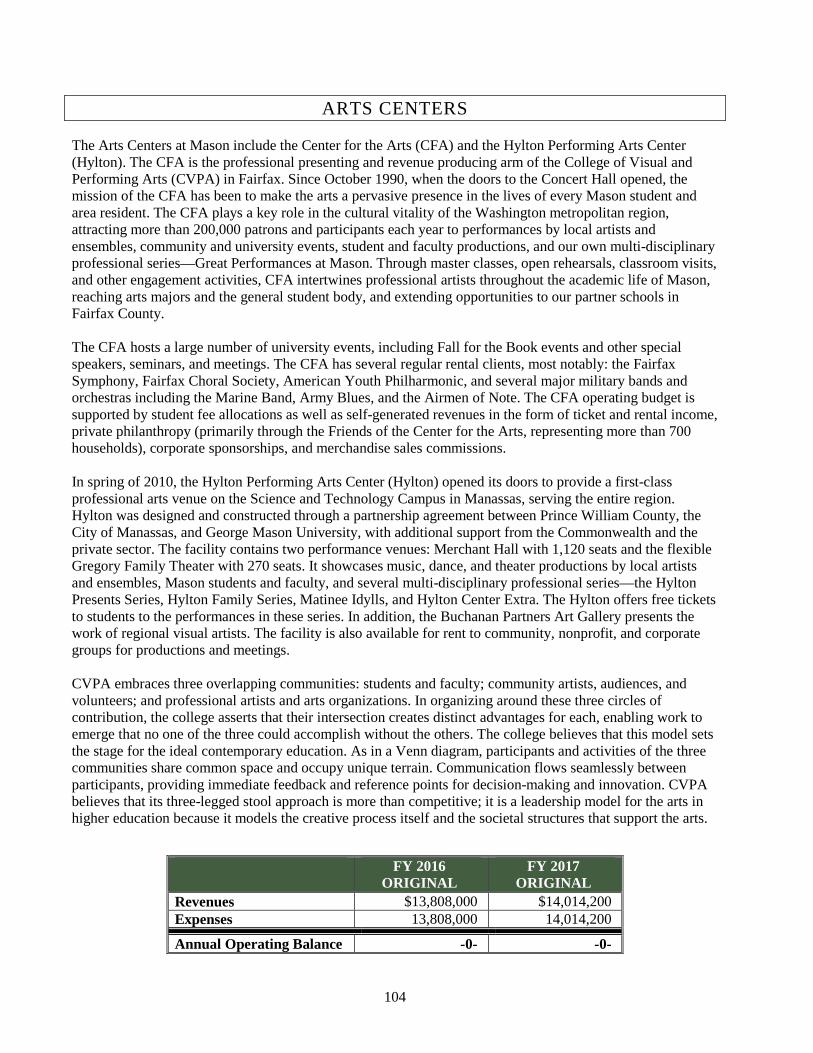
104
ARTS CENTERS
The Arts Centers at Mason include the Center for the Arts (CFA) and the Hylton Performing Arts Center (Hylton). The CFA is the professional presenting and revenue producing arm of the College of Visual and Performing Arts (CVPA) in Fairfax. Since October 1990, when the doors to the Concert Hall opened, the mission of the CFA has been to make the arts a pervasive presence in the lives of every Mason student and area resident. The CFA plays a key role in the cultural vitality of the Washington metropolitan region, attracting more than 200,000 patrons and participants each year to performances by local artists and ensembles, community and university events, student and faculty productions, and our own multi-disciplinary professional series—Great Performances at Mason. Through master classes, open rehearsals, classroom visits, and other engagement activities, CFA intertwines professional artists throughout the academic life of Mason, reaching arts majors and the general student body, and extending opportunities to our partner schools in Fairfax County. The CFA hosts a large number of university events, including Fall for the Book events and other special speakers, seminars, and meetings. The CFA has several regular rental clients, most notably: the Fairfax Symphony, Fairfax Choral Society, American Youth Philharmonic, and several major military bands and orchestras including the Marine Band, Army Blues, and the Airmen of Note. The CFA operating budget is supported by student fee allocations as well as self-generated revenues in the form of ticket and rental income, private philanthropy (primarily through the Friends of the Center for the Arts, representing more than 700 households), corporate sponsorships, and merchandise sales commissions. In spring of 2010, the Hylton Performing Arts Center (Hylton) opened its doors to provide a first-class professional arts venue on the Science and Technology Campus in Manassas, serving the entire region. Hylton was designed and constructed through a partnership agreement between Prince William County, the City of Manassas, and George Mason University, with additional support from the Commonwealth and the private sector. The facility contains two performance venues: Merchant Hall with 1,120 seats and the flexible Gregory Family Theater with 270 seats. It showcases music, dance, and theater productions by local artists and ensembles, Mason students and faculty, and several multi-disciplinary professional series—the Hylton Presents Series, Hylton Family Series, Matinee Idylls, and Hylton Center Extra. The Hylton offers free tickets to students to the performances in these series. In addition, the Buchanan Partners Art Gallery presents the work of regional visual artists. The facility is also available for rent to community, nonprofit, and corporate groups for productions and meetings. CVPA embraces three overlapping communities: students and faculty; community artists, audiences, and volunteers; and professional artists and arts organizations. In organizing around these three circles of contribution, the college asserts that their intersection creates distinct advantages for each, enabling work to emerge that no one of the three could accomplish without the others. The college believes that this model sets the stage for the ideal contemporary education. As in a Venn diagram, participants and activities of the three communities share common space and occupy unique terrain. Communication flows seamlessly between participants, providing immediate feedback and reference points for decision-making and innovation. CVPA believes that its three-legged stool approach is more than competitive; it is a leadership model for the arts in higher education because it models the creative process itself and the societal structures that support the arts.
FY 2016 ORIGINAL
FY 2017 ORIGINAL
Revenues $13,808,000 $14,014,200 Expenses 13,808,000 14,014,200
Annual Operating Balance -0- -0-
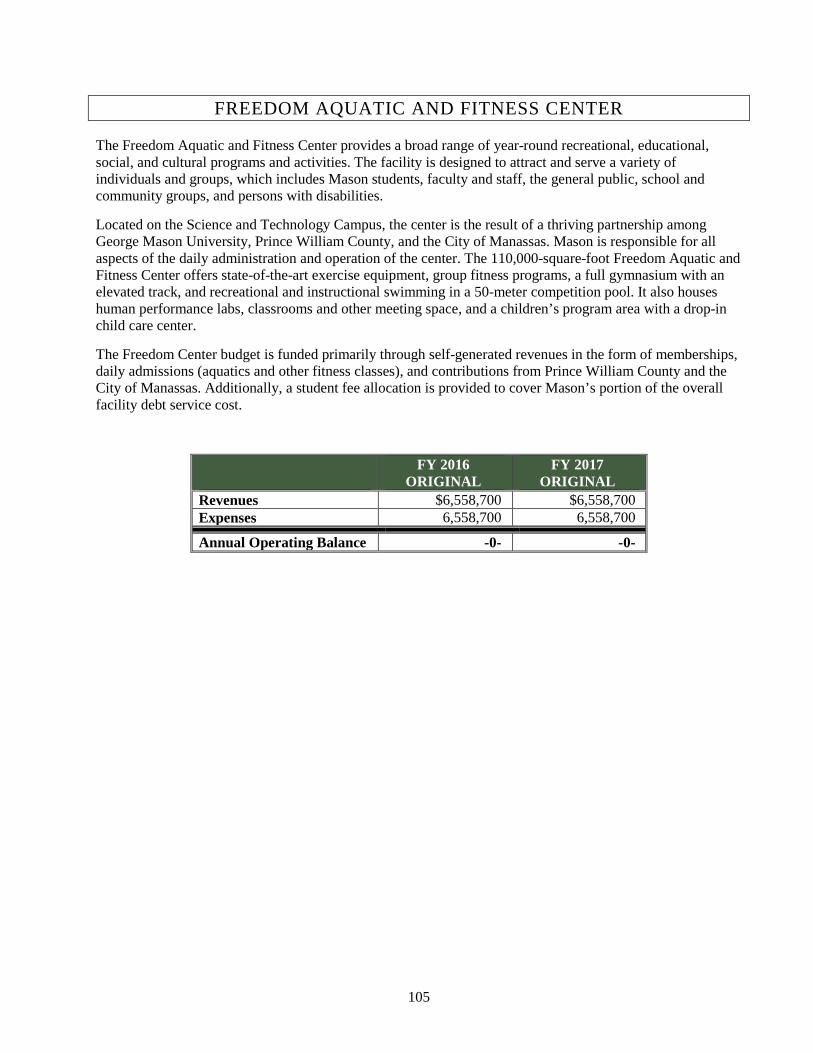
105
FREEDOM AQUATIC AND FITNESS CENTER
The Freedom Aquatic and Fitness Center provides a broad range of year-round recreational, educational, social, and cultural programs and activities. The facility is designed to attract and serve a variety of individuals and groups, which includes Mason students, faculty and staff, the general public, school and community groups, and persons with disabilities.
Located on the Science and Technology Campus, the center is the result of a thriving partnership among George Mason University, Prince William County, and the City of Manassas. Mason is responsible for all aspects of the daily administration and operation of the center. The 110,000-square-foot Freedom Aquatic and Fitness Center offers state-of-the-art exercise equipment, group fitness programs, a full gymnasium with an elevated track, and recreational and instructional swimming in a 50-meter competition pool. It also houses human performance labs, classrooms and other meeting space, and a children’s program area with a drop-in child care center.
The Freedom Center budget is funded primarily through self-generated revenues in the form of memberships, daily admissions (aquatics and other fitness classes), and contributions from Prince William County and the City of Manassas. Additionally, a student fee allocation is provided to cover Mason’s portion of the overall facility debt service cost.
FY 2016
ORIGINAL FY 2017
ORIGINAL Revenues $6,558,700 $6,558,700 Expenses 6,558,700 6,558,700
Annual Operating Balance -0- -0-
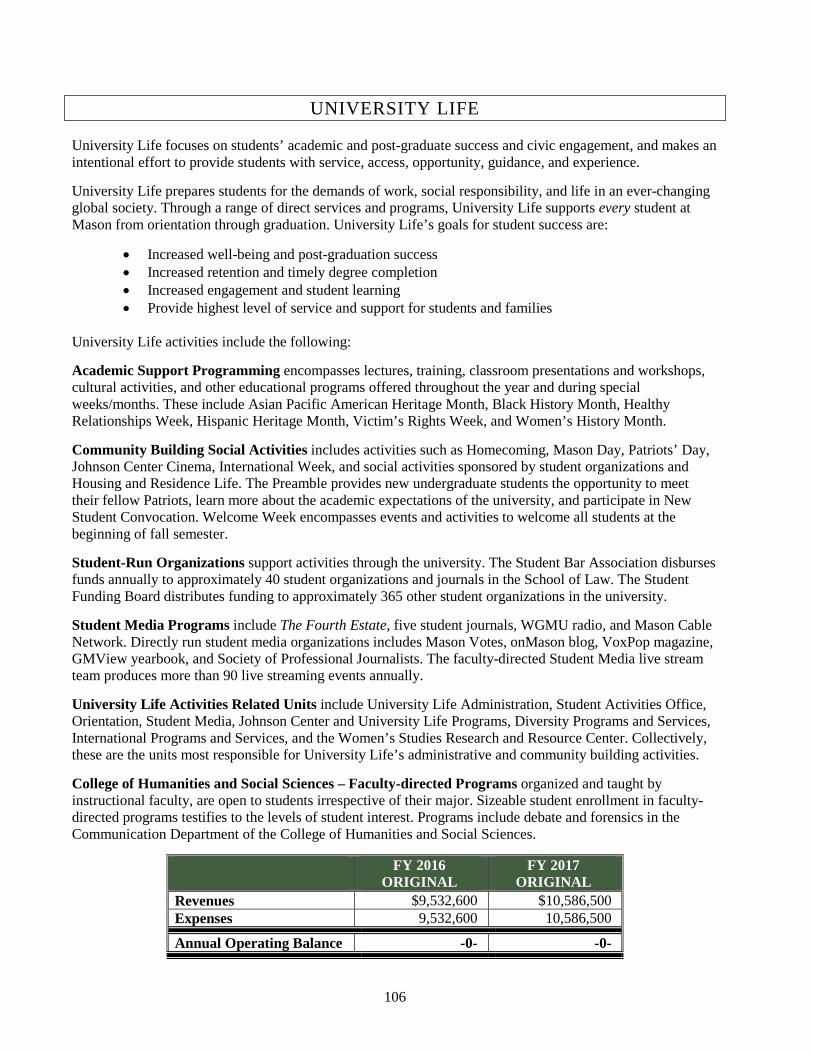
106
UNIVERSITY LIFE
University Life focuses on students’ academic and post-graduate success and civic engagement, and makes an intentional effort to provide students with service, access, opportunity, guidance, and experience.
University Life prepares students for the demands of work, social responsibility, and life in an ever-changing global society. Through a range of direct services and programs, University Life supports every student at Mason from orientation through graduation. University Life’s goals for student success are:
• Increased well-being and post-graduation success • Increased retention and timely degree completion • Increased engagement and student learning • Provide highest level of service and support for students and families
University Life activities include the following:
Academic Support Programming encompasses lectures, training, classroom presentations and workshops, cultural activities, and other educational programs offered throughout the year and during special weeks/months. These include Asian Pacific American Heritage Month, Black History Month, Healthy Relationships Week, Hispanic Heritage Month, Victim’s Rights Week, and Women’s History Month.
Community Building Social Activities includes activities such as Homecoming, Mason Day, Patriots’ Day, Johnson Center Cinema, International Week, and social activities sponsored by student organizations and Housing and Residence Life. The Preamble provides new undergraduate students the opportunity to meet their fellow Patriots, learn more about the academic expectations of the university, and participate in New Student Convocation. Welcome Week encompasses events and activities to welcome all students at the beginning of fall semester.
Student-Run Organizations support activities through the university. The Student Bar Association disburses funds annually to approximately 40 student organizations and journals in the School of Law. The Student Funding Board distributes funding to approximately 365 other student organizations in the university.
Student Media Programs include The Fourth Estate, five student journals, WGMU radio, and Mason Cable Network. Directly run student media organizations includes Mason Votes, onMason blog, VoxPop magazine, GMView yearbook, and Society of Professional Journalists. The faculty-directed Student Media live stream team produces more than 90 live streaming events annually.
University Life Activities Related Units include University Life Administration, Student Activities Office, Orientation, Student Media, Johnson Center and University Life Programs, Diversity Programs and Services, International Programs and Services, and the Women’s Studies Research and Resource Center. Collectively, these are the units most responsible for University Life’s administrative and community building activities.
College of Humanities and Social Sciences – Faculty-directed Programs organized and taught by instructional faculty, are open to students irrespective of their major. Sizeable student enrollment in faculty-directed programs testifies to the levels of student interest. Programs include debate and forensics in the Communication Department of the College of Humanities and Social Sciences.
FY 2016 ORIGINAL
FY 2017 ORIGINAL
Revenues $9,532,600 $10,586,500 Expenses 9,532,600 10,586,500
Annual Operating Balance -0- -0-

107
AUXILIARY ENTERPRISES ADMINISTRATION
Auxiliary Enterprises Administration is composed of several units that provide student services through contracted services along with student fee and self-operated activities. The primary goal is to provide services and activities that complement and enhance student learning and provide necessary support to the Mason community. The following describes these activities.
Auxiliary Enterprises Administration provides central oversight and direction to services such as Print Services, Student Centers, and Trademark Licensing, and contracted services such as the Bookstores, Dining, Mail Services, and EagleBank Arena. The office also collaborates with other university offices such as University Life, Academic Affairs, and Facilities on programs of common interest. Through all Auxiliary Enterprises units, over 550 student employees are managed and provided with valuable experiential learning.
Mason Card Office manages the Mason Money system, Photo ID, and the Mason Merchants off-campus program, where more than 25 local merchants accept Mason Money funds. Over 50,000 Photo ID cards are issued and managed, and the Card Office is transitioning to a new secure smart ID card for all students, faculty, and staff. This operation is funded with a combination of student fees, self-generated revenues from passport photos and ID replacement, and an allocation of funds from the Student Meal Plan. The Card Office recently replaced credit/debit card readers at 65 cash registers. New terminals mitigate processing risk, comply with chip and pin requirements, and accept Apple Pay and Google Wallet.
Auxiliary Mail Services provides a service for students and the Mason community with a location to purchase stamps and packaging materials, as well as send packages by parcel. Over 3.6 million pieces of mail and 75,000 student packages are handled annually by Mail Services. The Auxiliary Mail Services operation is funded through self-generated revenues.
University Bookstores provide a service for Mason students and the community with locations on the Fairfax, Arlington, and Science and Technology Campuses. Managed by Barnes & Noble, the Bookstores provides 128,000 textbooks to students through purchase, rent, or download. The Bookstores are the primary retailer for university licensed apparel, along with gifts, supplies, accessories, and electronics. The Bookstores are funded through self-generated revenues.
Camps Management provides a process for summer camp programming to improve workflow and event organization. The process can include development of marketing, cash handling, compliance, and execution process.
Mason Vending and Collegiate Licensing Company support student scholarships and have provided over $1 million in scholarships over the past five years. Vending distributes 323,000 Coca-Cola and 292,000 snack products during the year. Vending has been providing more healthy options that are good for the mind, body, and spirit.
The shopMason brand and website was created in 2015 to promote all Auxiliary Enterprises services through one website and marketing program. By centralizing marketing, shopMason aims to connect the wide range of goods and services that are offered through units of Auxiliary Enterprises, cross-promote them to the Mason community, and promote special offers and featured events.
FY 2016
ORIGINAL FY 2017
ORIGINAL Revenues $3,618,300 $4,277,000 Expenses 3,618,300 4,277,000
Annual Operating Balance -0- -0-
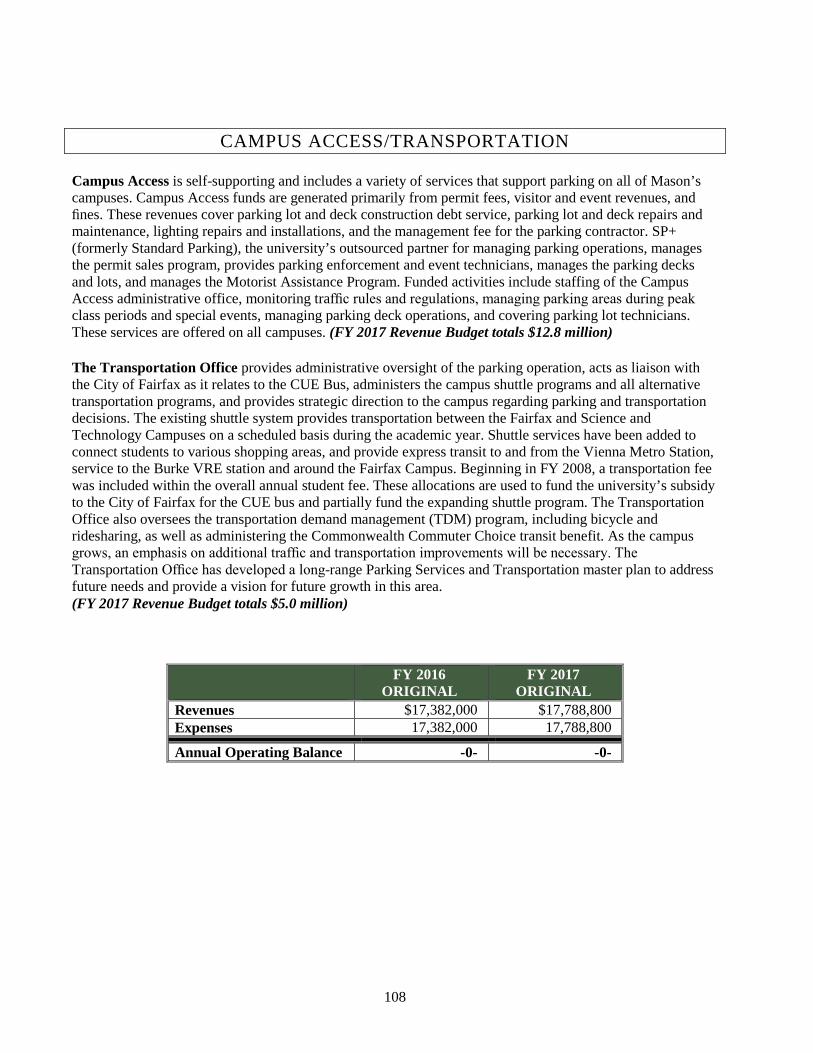
108
CAMPUS ACCESS/TRANSPORTATION
Campus Access is self-supporting and includes a variety of services that support parking on all of Mason’s campuses. Campus Access funds are generated primarily from permit fees, visitor and event revenues, and fines. These revenues cover parking lot and deck construction debt service, parking lot and deck repairs and maintenance, lighting repairs and installations, and the management fee for the parking contractor. SP+ (formerly Standard Parking), the university’s outsourced partner for managing parking operations, manages the permit sales program, provides parking enforcement and event technicians, manages the parking decks and lots, and manages the Motorist Assistance Program. Funded activities include staffing of the Campus Access administrative office, monitoring traffic rules and regulations, managing parking areas during peak class periods and special events, managing parking deck operations, and covering parking lot technicians. These services are offered on all campuses. (FY 2017 Revenue Budget totals $12.8 million)
The Transportation Office provides administrative oversight of the parking operation, acts as liaison with the City of Fairfax as it relates to the CUE Bus, administers the campus shuttle programs and all alternative transportation programs, and provides strategic direction to the campus regarding parking and transportation decisions. The existing shuttle system provides transportation between the Fairfax and Science and Technology Campuses on a scheduled basis during the academic year. Shuttle services have been added to connect students to various shopping areas, and provide express transit to and from the Vienna Metro Station, service to the Burke VRE station and around the Fairfax Campus. Beginning in FY 2008, a transportation fee was included within the overall annual student fee. These allocations are used to fund the university’s subsidy to the City of Fairfax for the CUE bus and partially fund the expanding shuttle program. The Transportation Office also oversees the transportation demand management (TDM) program, including bicycle and ridesharing, as well as administering the Commonwealth Commuter Choice transit benefit. As the campus grows, an emphasis on additional traffic and transportation improvements will be necessary. The Transportation Office has developed a long-range Parking Services and Transportation master plan to address future needs and provide a vision for future growth in this area. (FY 2017 Revenue Budget totals $5.0 million)
FY 2016
ORIGINAL FY 2017
ORIGINAL Revenues $17,382,000 $17,788,800 Expenses 17,382,000 17,788,800
Annual Operating Balance -0- -0-

109
AUXILIARY ENTERPRISES CENTRAL
Auxiliary Enterprises Central includes a variety of budgetary units as the following:
Indirect Cost is the payment made to Educational and General programs for the support services provided to Auxiliary Enterprises and is formula-driven, based on Commonwealth guidelines. This is an expense to the Auxiliary Enterprises. Currently the source of funds for paying this indirect cost assessment is the Auxiliary Enterprise interest income, and a student fee allocation. (FY 2017 Revenue Budget totals $10.5 million)
AE Debt Service includes AE central debt service funding for the Aquia building, Founders Hall, Global Center, as well as the Central Utility Plant expansion project. The Aquia building serves as a data center and a portion of its annual debt service is covered by a student fee allocation. The Founders Hall, utilized for classroom and administrative office space, is covered by space rental funding from Educational and General. The Global Center, as a result of a partnership with INTO University Partnerships, provides an innovative living and learning environment for Mason INTO students; its debt service is covered by the services agreement with the Mason INTO program. The debt service for the Central Utility Plant expansion project will be covered by a user fee charged to internal parties. (FY 2017 Revenue Budget totals $4.6 million)
University Scholars reflects Mason’s commitment to attracting and admitting outstanding students and supporting them through merit scholarships. Several years ago, Mason embarked on a University Scholar program with the anticipation that funds from future capital campaigns and other self-generated revenues would provide funding for the scholarships. Over the last few years, the program has been funded from various sources of revenues such as self-generated revenue from the beverage contract, miscellaneous commission revenues, Educational & General, and student fees. This program is administered by the Admissions Office and Provost’s Office. (FY 2017 Revenue Budget totals $2.5 million)
Auxiliary Contributions for E&G Support have been set up to provide a transfer from Auxiliary Enterprise to support Mason’s Educational and General operating budget. This type of a transfer is unique in higher education, where the Auxiliary Enterprise operation provides support to the Educational and General funding of the institution. A combination of student fee and self-generated revenue allocations fund these reserves. (FY 2017 Revenue Budget totals $4.3 million)
FY 2016
ORIGINAL FY 2017
ORIGINAL Revenues $20,719,600 $21,925,100 Expenses 20,719,600 21,925,100
Annual Operating Balance -0- -0-
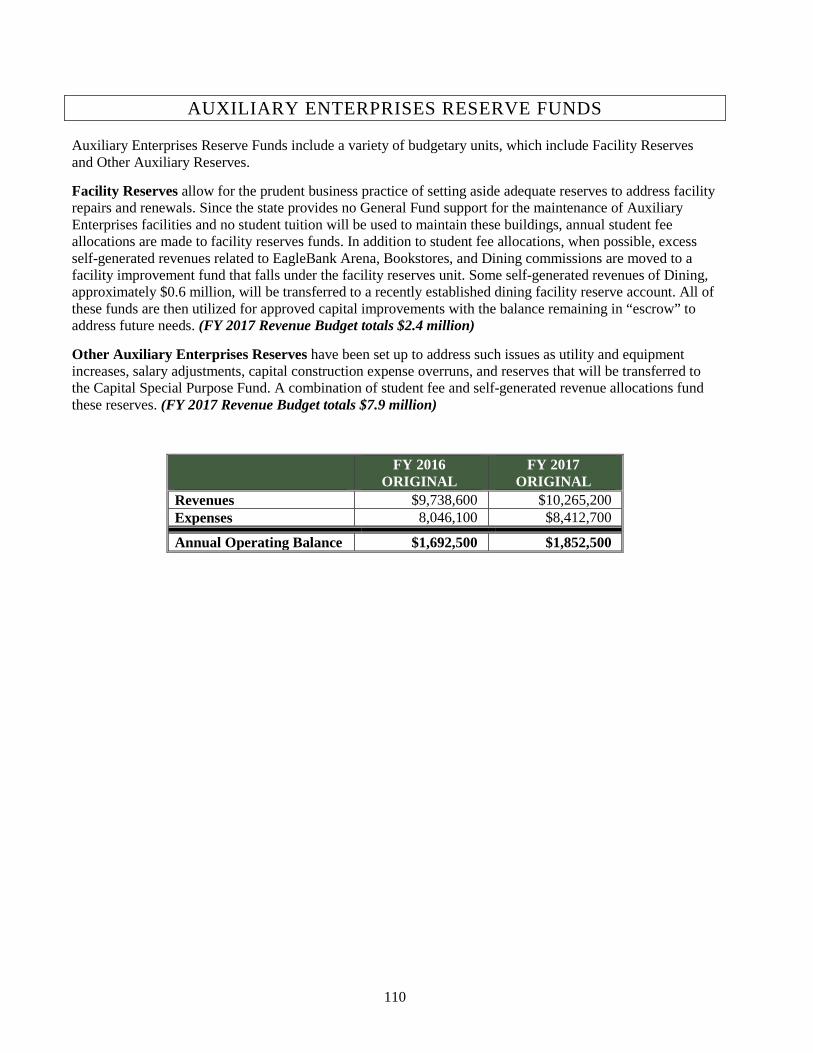
110
AUXILIARY ENTERPRISES RESERVE FUNDS
Auxiliary Enterprises Reserve Funds include a variety of budgetary units, which include Facility Reserves and Other Auxiliary Reserves.
Facility Reserves allow for the prudent business practice of setting aside adequate reserves to address facility repairs and renewals. Since the state provides no General Fund support for the maintenance of Auxiliary Enterprises facilities and no student tuition will be used to maintain these buildings, annual student fee allocations are made to facility reserves funds. In addition to student fee allocations, when possible, excess self-generated revenues related to EagleBank Arena, Bookstores, and Dining commissions are moved to a facility improvement fund that falls under the facility reserves unit. Some self-generated revenues of Dining, approximately $0.6 million, will be transferred to a recently established dining facility reserve account. All of these funds are then utilized for approved capital improvements with the balance remaining in “escrow” to address future needs. (FY 2017 Revenue Budget totals $2.4 million)
Other Auxiliary Enterprises Reserves have been set up to address such issues as utility and equipment increases, salary adjustments, capital construction expense overruns, and reserves that will be transferred to the Capital Special Purpose Fund. A combination of student fee and self-generated revenue allocations fund these reserves. (FY 2017 Revenue Budget totals $7.9 million)
FY 2016
ORIGINAL FY 2017
ORIGINAL Revenues $9,738,600 $10,265,200 Expenses 8,046,100 $8,412,700
Annual Operating Balance $1,692,500 $1,852,500

111
RECREATIONAL SPORTS PROGRAMS & FACILITIES
Mason Recreation, within the division of University Life Programs, operates facilities, programs, and services that include fitness, intramural sports, club sports, EDGE-team challenge course, outdoor recreation, aquatics, and informal / open recreation. Facilities include the Recreation and Athletic Complex (RAC), Aquatic and Fitness Center (AFC), Skyline Fitness Center, RAC Field, tennis courts, outdoor basketball courts, West Campus Park fields, pavilion, and the EDGE team challenge course on the Science and Technology campus. The following paragraphs describe some major functional units.
Intramural Sports provides current Mason students, faculty, and staff an outlet to participate in organized sports leagues, tournaments, and special events.
Club Sports offer students an opportunity to play with a team against other colleges and universities in a highly competitive atmosphere with a less demanding schedule than a NCAA Division I varsity team. Currently, 33 club sports are open to all interested students regardless of skill, ability or experience in a particular activity and involve over 800 students annually.
Mason Recreation Fitness Program provides opportunities for students, faculty/staff, alumni, and community members to participate in a variety of educational and fitness programs. Programs and services include group exercise, indoor cycling, yoga/Pilates, personal training, fitness related clinics and workshops, and health and wellness related events.
EDGE–Center for Organizational and Team Leadership Program is a leadership and team challenge course and outdoor facility located on the Science and Technology Campus. The program serves and generates revenue through schools (3rd–12th grade); corporate and community clients; and local, state, and federal government agencies.
The Aquatic and Fitness Center (AFC) is located on the Fairfax Campus and provides aquatic and fitness opportunities for the broadest spectrum of campus life with an evenly balanced program of recreation, instruction, and competitive activities. The center is a state-of-the-art facility supporting a wide range of fitness and competition activities, including lap and recreational swimming, water games, swimming lessons, cardio and strength equipment, and group exercise. The center houses a 50-meter Olympic pool, 25-yard recreational pool, whirlpool, sauna, and 8,000-square-foot fitness gallery. Full-time students are able to enjoy the facilities free of charge, and memberships to the facility are open to part-time students, Mason employees, Mason alumni, and friends of the university.
The Skyline Fitness Center is located between Southside Dining facilities and Tidewater Residence Hall. The purpose of this center is to provide fitness opportunities for students and members who prefer its centralized location on the Fairfax Campus and its expanded hours of operation. The center boasts one basketball gymnasium, locker rooms, and a large cardio and strength conditioning room.
The Recreation and Athletic Complex (RAC) located on the Fairfax campus provides classrooms, office space, court space, and fitness multipurpose rooms for RHT classes, ICA teams, ROTC, and Recreation. The complex houses three gymnasiums, one ICA athletic training room, two racquetball courts, two squash courts, cardio and strength equipment, a yoga room, and a multipurpose room. In addition, the RAC is an ICA practice facility for Men’s and Women’s Basketball, practice and game site for Men’s and Women’s Volleyball and the host venue for Wrestling home matches. Men’s and Women’s Tennis are also based out of the RAC.
FY 2016
ORIGINAL FY 2017
ORIGINAL Revenues $9,191,000 $9,194,000 Expenses 9,191,000 9,194,000
Annual Operating Balance -0- -0-

112
AUXILIARY ENTERPRISES INFORMATION TECHNOLOGY
Auxiliary Enterprises Information Technology Services (ITS) includes Telecommunications and the Patriot Computer Store. The following paragraphs describe each unit.
Telecommunications provides communications services to Mason for faculty, staff, and students. The major activities include faculty and staff local and long distance telecommunications services, student local phones, student data service, student cable TV service, student long distance service, and telecommunications infrastructure project costs. The operation is funded primarily from charge-backs to student housing and to departments within the university. The housing rental rates paid by students include an amount earmarked to cover the cost of the telecommunications for students. In addition, a student fee allocation is provided to support an Auxiliary Enterprise dedicated support position. (FY 2017 Revenue Budget totals $5.1 million)
Patriot Computer Store is a self-supporting, full-service technology retail and service operation located in the Johnson Center on the Fairfax Campus. The mission of the store is to provide the Mason community with the most current technology products and services at the best price available; to provide information, guidance, and resources to the Mason community that are needed to make informed buying decisions at the personal, academic, and institutional level, and, most importantly, to ensure the academic success of Mason students. The store negotiates and maintains multiple agreements with major technology companies and distributors to provide significant cost savings to the Mason community. The store is an agile and adaptive organization that employs a diverse staff including student workers and is able to respond to the fluid and dynamic economy. (FY 2017 Revenue Budget totals $4.0 million)
FY 2016
ORIGINAL FY 2017
ORIGINAL Revenues $8,779,400 $9,113,300 Expenses 8,523,900 8,857,800
Annual Operating Balance $255,500 $255,500

113
STUDENT HEALTH SERVICES
Student Health Services’ (SHS) mission is to provide high quality health care, health education, and prevention services to George Mason University students, in support of University Life’s core values. The goal of Student Health Services (SHS) is to provide a full range of primary care, treatment, and referral services, and related patient health education. All programs and services are aimed at maintaining the well-being of Mason students.
Student Health Services is utilized by a large and diverse population of students, including students of all genders, ages, races—international and domestic, commutes and residents, insured and uninsured, and students with disabilities.
SHS is able to gather statistics on utilization of health services through the electronic health record system (EHR). The EHR system supports documentation of best clinical practices and helps SHS achieve documentation for accreditation by Accreditation Association for Ambulatory Health Care (AAAHC). The numbers of students who are seen by SHS providers in the Immunization Clinic, in the Allergy Clinic, Laboratory, and in the Insurance office each day are monitored in the system. Statistics are kept on the number of patients who return for follow up appointments, utilize evening clinic hours, are enrolled in the health insurance program, etc. These statistics indicate a consistent number of students utilizing SHS services.
SHS’s staff remains current with medical best practices as evidenced by meeting peer review criteria required by AAAHC. SHS also offers preceptorships to medical residents, nurse practitioners, and nursing students. SHS provides services that are vital to our students’ success through participating and collaborating in campus-wide events such as new student orientation, the Health and Fitness Expo, and invitations from faculty to speak in the classroom and to student groups. SHS maintains an informative website.
The growth and development of students during their time at Mason is demonstrated in terms of their satisfaction with SHS services in the “Patient Satisfaction Survey,” part of the American College Health Association’s benchmarks. By coming to SHS, students learn to navigate the health care system, improve their ability to articulate health problems clearly, take responsibility for making choices about their own health care, and schedule follow-up appointments at Student Health Services and with providers and specialists in the community. Consistently over the last few years, the majority of students who participated in the survey rated our services as satisfactory or better.
Responding to growth on all of our campuses, Mason enhanced the SHS facility on the Science and Technology Campus. The addition of the nurse triage process has decreased wait times for students at the Fairfax campus. Efforts to enhance SHS on all campuses will continue. Funding for SHS comes primarily from student fee allocations. However, significant self-generated revenue is collected to cover wage staff (a critical part of SHS’s operation) and other direct expenditures.
FY 2016
ORIGINAL FY 2017
ORIGINAL Revenues $5,662,600 $6,427,200 Expenses 5,662,600 6,427,200
Annual Operating Balance -0- -0-

114
PRINT SERVICES
The Print Services Department was created to manage the centralized printing and copying operations on all campuses. In order to provide a high level of service to each campus community, Print Services utilizes innovative technologies and partners with leading corporations. Meridian Imaging Solutions provides service support and our copy/printer fleet comprises Ricoh and Konica Minolta equipment.
The department employs a customer-centered management style that supports academic, administrative, and student imaging needs. Print Services currently operates four full-service copy centers on three campuses, all public coin- and card-operated copiers, the administrative copier fleet, and pay-for-print. Over 16 million images are generated through Print Services networked machines. The division’s operating budget is primarily supported by self-generated revenues.
Print Services’ capabilities are not limited to photocopying and pay-for-print. The copy centers are equipped with production-quality monochrome and color digital presses capable of high-speed, high-volume traditional photocopy coupled with digital printing. Print Services works diligently to support Mason’s academic and administrative goals by offering administrative support and student employee work programs that serve the varied needs of each campus.
An RFP was conducted in the fall 2015 to outsource all Print Services operations to a third-party management contractor. Negotiations are in process to finalize the agreement, and it is expected that a third party manager will take over Print Services operations prior to the end of FY 2016.
FY 2016 ORIGINAL
FY 2017 ORIGINAL
Revenues $1,509,000 $1,489,100 Expenses 1,509,000 1,489,100
Annual Operating Balance -0- -0-
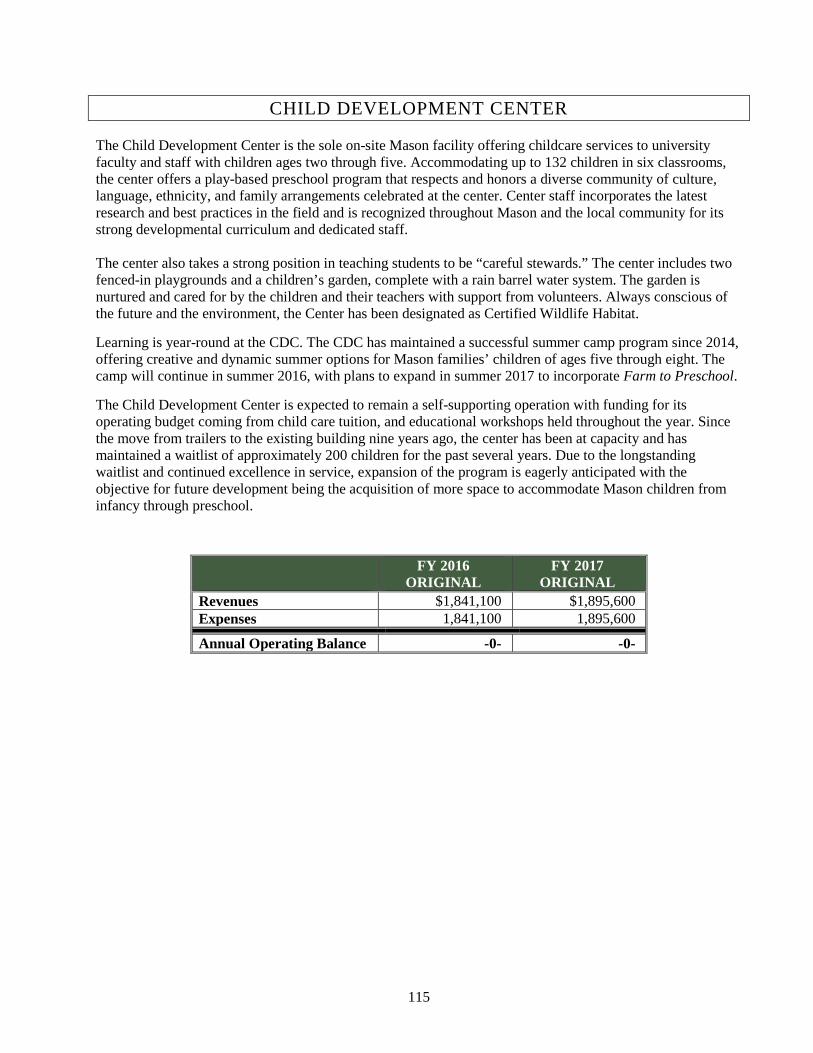
115
CHILD DEVELOPMENT CENTER
The Child Development Center is the sole on-site Mason facility offering childcare services to university faculty and staff with children ages two through five. Accommodating up to 132 children in six classrooms, the center offers a play-based preschool program that respects and honors a diverse community of culture, language, ethnicity, and family arrangements celebrated at the center. Center staff incorporates the latest research and best practices in the field and is recognized throughout Mason and the local community for its strong developmental curriculum and dedicated staff. The center also takes a strong position in teaching students to be “careful stewards.” The center includes two fenced-in playgrounds and a children’s garden, complete with a rain barrel water system. The garden is nurtured and cared for by the children and their teachers with support from volunteers. Always conscious of the future and the environment, the Center has been designated as Certified Wildlife Habitat.
Learning is year-round at the CDC. The CDC has maintained a successful summer camp program since 2014, offering creative and dynamic summer options for Mason families’ children of ages five through eight. The camp will continue in summer 2016, with plans to expand in summer 2017 to incorporate Farm to Preschool.
The Child Development Center is expected to remain a self-supporting operation with funding for its operating budget coming from child care tuition, and educational workshops held throughout the year. Since the move from trailers to the existing building nine years ago, the center has been at capacity and has maintained a waitlist of approximately 200 children for the past several years. Due to the longstanding waitlist and continued excellence in service, expansion of the program is eagerly anticipated with the objective for future development being the acquisition of more space to accommodate Mason children from infancy through preschool.
FY 2016
ORIGINAL FY 2017
ORIGINAL Revenues $1,841,100 $1,895,600 Expenses 1,841,100 1,895,600
Annual Operating Balance -0- -0-

116
EAGLEBANK ARENA
During 2015, the Patriot Center was renamed EagleBank Arena with the naming rights used to fund arena updates and scholarships. The EagleBank Arena is a 10,000-seat venue located on the Fairfax Campus. The only facility of its kind in Northern Virginia, the EagleBank Arena has evolved from a home for Mason Basketball and commencements to a functional university and community assembly space. Each year the EagleBank Arena welcomes popular musicians and other concert events, family entertainment such as Ringling Brothers and Barnum and Bailey Circus, craft and bridal fairs, and local community high school graduation ceremonies. The Arena holds approximately 160 events each year, generating over 525,000 tickets. Faculty and staff of the Mason community receive discounted tickets to many EagleBank Arena concerts and family entertainment events.
The EagleBank Arena is operated by Mason’s third party partner, Monumental Sports & Entertainment. In return for their services, Monumental Sports & Entertainment receives an annual fee and a small percentage of the operations’ overall revenues. The remaining net revenues are returned to the university and are used to fund athletic scholarships, facility maintenance, updates and reserves, and a portion of the EagleBank Arena operating costs (primarily utilities). The remaining operating costs not covered by EagleBank Arena revenues are funded by a student fee allocation.
FY 2016
ORIGINAL FY 2017
ORIGINAL Revenues $1,773,500 $2,323,200 Expenses 1,773,500 2,323,200
Annual Operating Balance -0- -0-

117
AE POLICE CADET/ACCESS
Police Cadet Program is managed by the University Police Department and includes a pedestrian escort service. This service is staffed by Mason students who escort anyone who wishes to be accompanied to their car, buses, classrooms, and residences. In addition, they support Campus Access and Police activity in connection with events on campus. Members of the program are dedicated to providing the highest level of safety, security, and service to all members of the Mason community, their visitors, and guests. Committed to the prevention and control of crime, protection of life, and the safeguarding of property through vigilant patrol, Police Cadets promote the advancement of cooperative relationships within the university environment. The program offers a wide range of services designed to meet Mason’s needs while providing students with an opportunity to gain valuable insight into law enforcement.
The Access and CCTV Group is managed by the Public Safety Office within the Police Department. This department provides support to all George Mason campuses for individual card access rights. The unit is responsible for the design and planning for all security infrastructure in all GMU buildings and grounds. The Access and CCTV technicians provide repair and installation services for all campuses. This unit provides a tremendous service to the university with their knowledge and cost saving measures.
FY 2016
ORIGINAL FY 2017
ORIGINAL Revenues $270,700 $391,900 Expenses 270,700 391,900
Annual Operating Balance -0- -0-
George Mason University Office of Budget and Planning 4400 University Dr., MSN 2E8
Fairfax, VA 22030 Phone 703-993-8824
Fax 703-993-8772 budget.gmu.edu
© 2017 George Mason University