2016 11 15 y kelly give every child a good start in life
TRANSCRIPT
Give every child a good start in life
Yvonne Kelly
International Centre for Lifecourse Studies in
Society and Health (ICLS)
www.ucl.ac.uk/icls
@icls_info
@childofourtime

CSDH conceptual framework for action on the social determinants of health
Solar O, Irwin A (2010): A Conceptual framework for action on the social determinants of health. Social Determinants of Health Discussion Paper 2 (Policy and Practice). Geneva: World Health Organization.
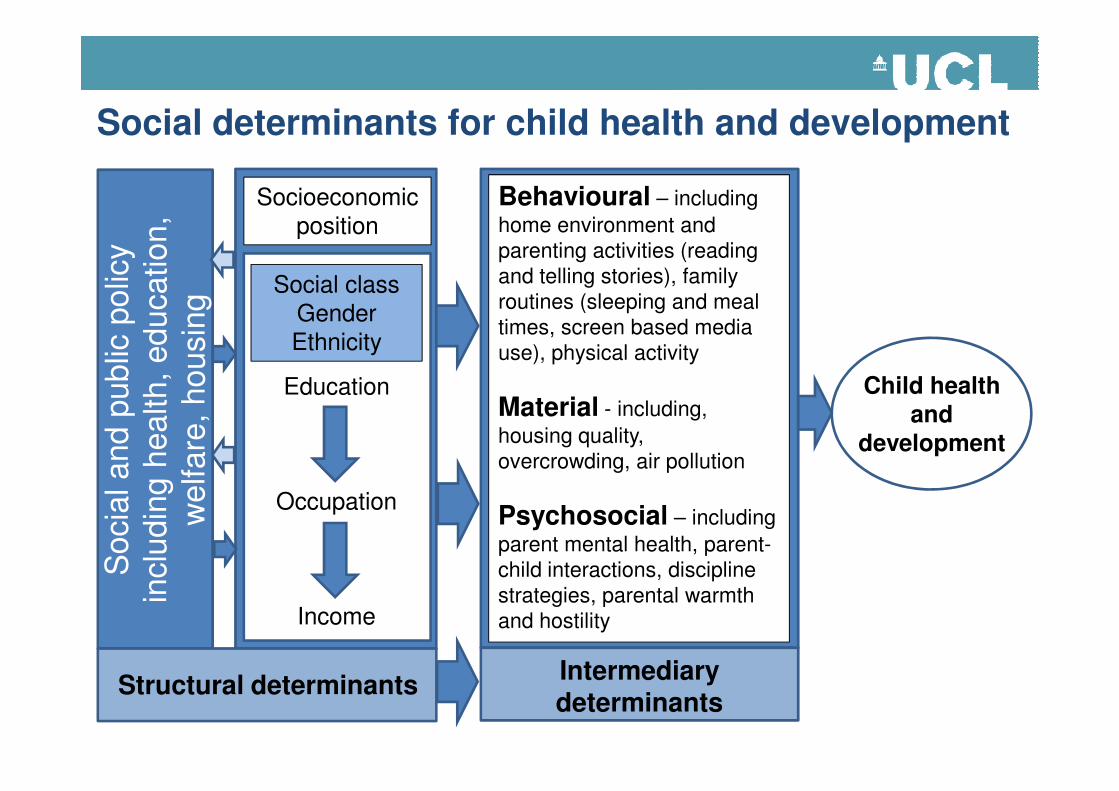
Socioeconomic
position
Social class
Gender
Ethnicity
Education Child health
Behavioural – including
home environment and
parenting activities (reading
and telling stories), family
routines (sleeping and meal
times, screen based media
use), physical activity
Material
Socia
l and p
ublic
polic
y
inclu
din
g h
ealth,
education,
welfare
, housin
g
Social determinants for child health and development
Education
Occupation
Income
Child health and
development
Material - including,
housing quality,
overcrowding, air pollution
Psychosocial – including
parent mental health, parent-
child interactions, discipline
strategies, parental warmth
and hostility
Socia
l and p
ublic
polic
y
inclu
din
g h
ealth,
education,
welfare
, housin
g
Structural determinantsIntermediary determinants

0
5
10
Nu
mb
er
of
mo
nth
s
ad
va
nce
d o
r d
ela
ye
d
Verbal months ahead or behind at age 7 by number of risk factors
-20
-15
-10
-5
0 1 2 3 4 5 6 7+
Nu
mb
er
of
mo
nth
s
ad
va
nce
d o
r d
ela
ye
d
Number of risk factorsKelly et al, forthcoming
20
25
30
% c
lin
ica
lly r
ele
va
nt
pro
ble
ms
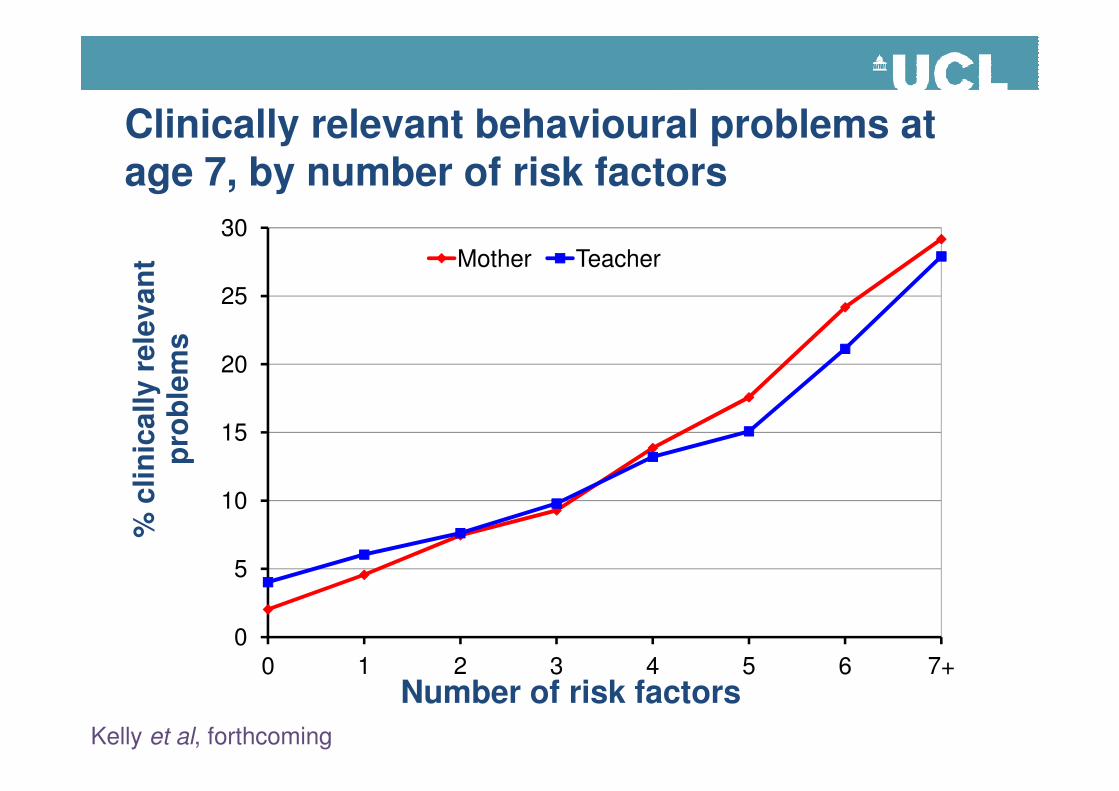
Mother Teacher
Clinically relevant behavioural problems at age 7, by number of risk factors
0
5
10
15
0 1 2 3 4 5 6 7+
% c
lin
ica
lly r
ele
va
nt
pro
ble
ms
Number of risk factors
Kelly et al, forthcoming

Regression coefficients for behavioural difficulties scores (mother report) by non-regular bedtimes throughout early childhood, cumulative effects
4.0
5.0
0.0
1.0
2.0
3.0
any 1 age Any 2 ages All 3 ages
Unadjusted Adjusted
Kelly, Kelly, Sacker Pediatrics 2013;132:e1184-93

0,5
1,0
be
ha
vio
ura
l
dif
ficu
ltie
s sc
ore
Change between ages 3 and 7 Change between ages 5 and 7
The effects of changes in the regularity of bedtimes on behavioural difficulties scores
-2,0
-1,5
-1,0
-0,5
0,0
Non-regular to regular Regular to non-regular
Dif
fere
nce
in
be
ha
vio
ura
l
dif
ficu
ltie
s sc
ore
Kelly, Kelly, Sacker Pediatrics 2013;132:e1184-93

Longitudinal Verbal Profiles
55
60
65
70
Mean
BA
S s
co
res
Average (74.9%) High (19.5%) Low (5.6%)
30
35
40
45
50
55
3 5 7 9 11
Mean
BA
S s
co
res
Age
Zilanawala et al, Eur J Pub Health 2016

BMI trajectories in childhood
24
26
28
30
32
22
24
26
28
30
32
BM
I
14
16
18
20
22
14
16
18
20
22
3 5 7 9 11
BM
I
AgeOverweight range Obese range T1 Stable T2 DecreasingT3 Moderate Increasing T4 High Increasing
Kelly et al Pediatrics 2016

Being read to at age 3
80
85
90
95
100
105
110
Every day 1-6 days/week ***
Less than weekly ***
Te
st
sc
ore
School readiness
0
5
10
15
20
25
30
Every day 1-6 days/week ***
Less than weekly ***
Pe
rce
nt
Socioemotional difficulties
*** differences compared to those read stories to every day p<0.001
Kelly et al, forthcoming
30
35
40
45
50
55
Every day 1-6 days/week ***
Less than weekly ***
Te
st
sc
ore
Verbal ability
-0,2
0,0
0,2
be
ha
vio
ura
l
dif
ficu
ltie
s sc
ore
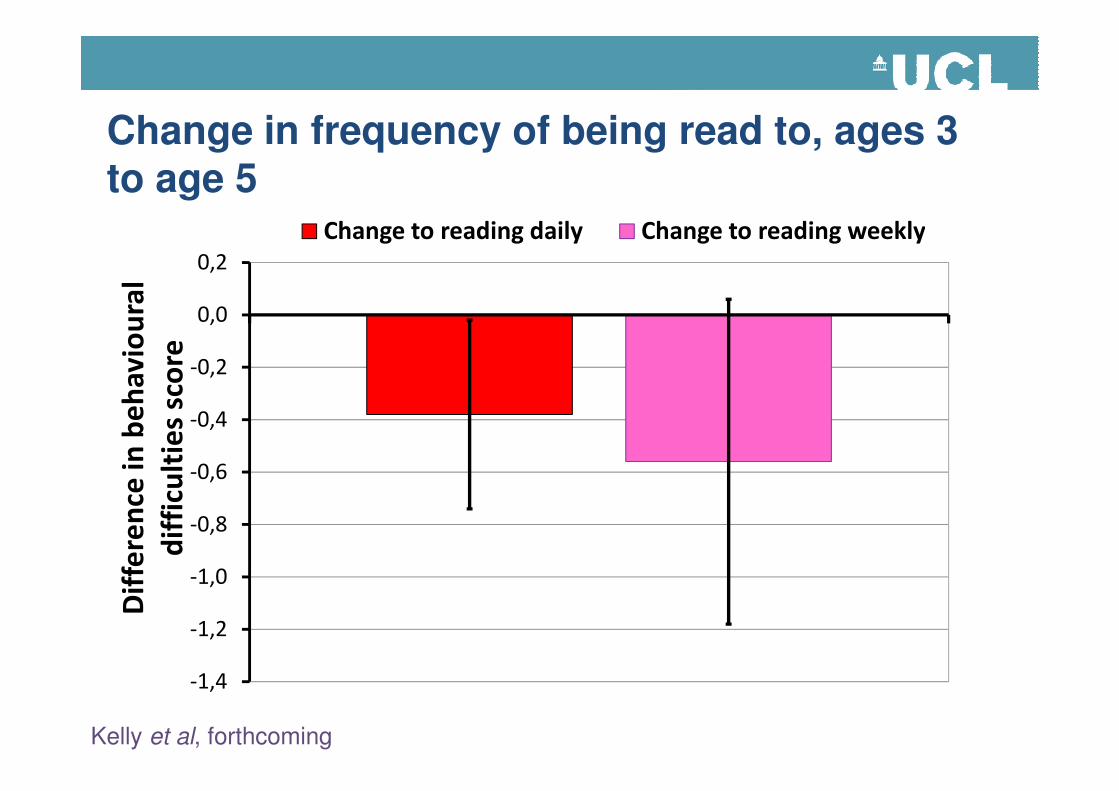
Change to reading daily Change to reading weekly
Change in frequency of being read to, ages 3 to age 5
-1,4
-1,2
-1,0
-0,8
-0,6
-0,4
Dif
fere
nce
in
be
ha
vio
ura
l
dif
ficu
ltie
s sc
ore
Kelly et al, forthcoming

Longitudinal Verbal Profiles
55
60
65
70
Mean
BA
S s
co
res
Average (74.9%) High (19.5%) Low (5.6%)
30
35
40
45
50
55
3 5 7 9 11
Mean
BA
S s
co
res
Age
Zilanawala et al, Eur J Pub Health 2016
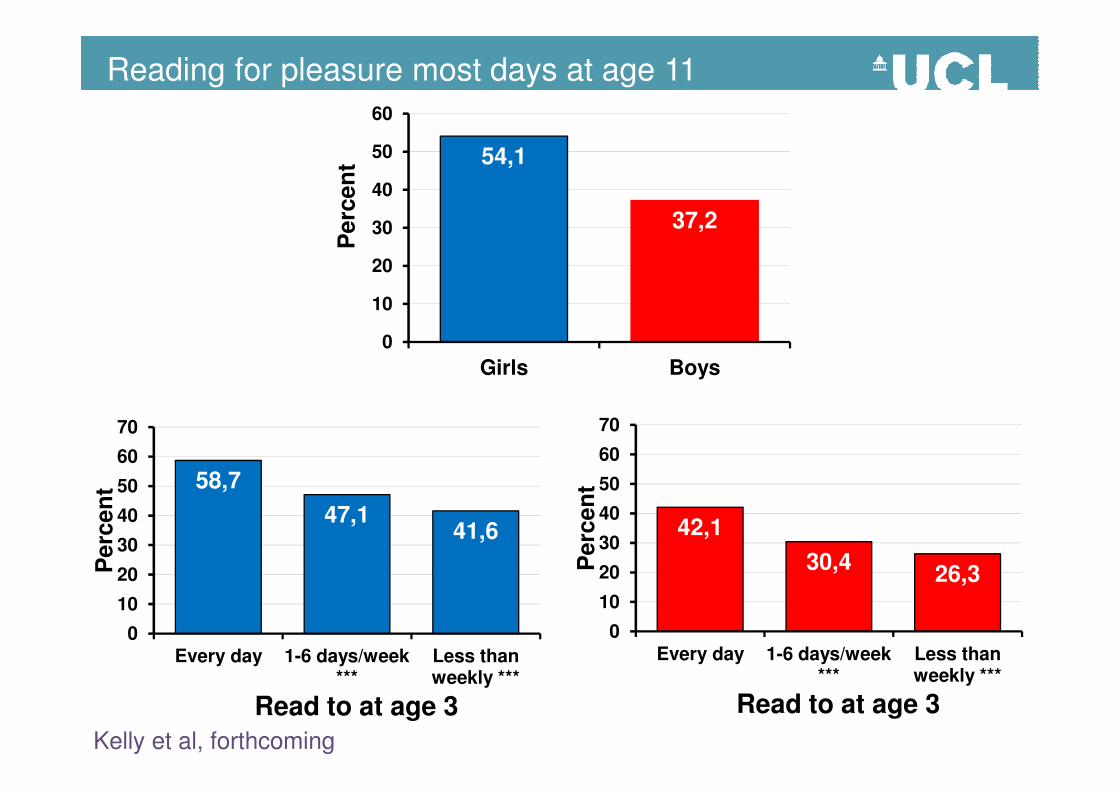
54,1
37,2
0
10
20
30
40
50
60
Girls BoysP
erc
en
t
Reading for pleasure most days at age 11
58,7
47,141,6
0
10
20
30
40
50
60
70
Every day 1-6 days/week ***
Less than weekly ***
Perc
en
t
Read to at age 3
Kelly et al, forthcoming
42,1
30,426,3
0
10
20
30
40
50
60
70
Every day 1-6 days/week ***
Less than weekly ***
Perc
en
t
Read to at age 3

1,4
1,6
1,8
2,0
Od
ds R
ati
oWell being at age 11 by reading for pleasure
0,6
0,8
1,0
1,2
Self esteem Happiniess Socioemotional difficulties
Od
ds R
ati
o
Kelly et al, forthcoming

Income gap in the risk of socioemotionaldifficulties at 5 years of age
6
7
8
9
10
0
1
2
3
4
5
Richest (2.0%)
Band 2 (4.0%)
Band 3 (6.4%)
Band 4 (11.2%)
Poorest (15.9%)
Ris
k
Income
Kelly, Sacker, Del Bono, Francesconi, Marmot. Arch Dis Child 2011;96:832-7

Summary
• Early child health and development matters – now
and for the future
• Stark socioeconomic inequalities are evident and
these start early
• Structural factors shape ‘intermediary’
environments: behavioural, material, psychosocial
• To give every child a good start in life - action is
needed on intermediate and structural influences

ICLSLIFECOURSE STUDIES IN
Bridging social and biological scienceswww.ucl.ac.uk/icls
@icls_info
LIFECOURSE STUDIES IN
SOCIETY AND HEALTH
@childofourtime