2015.2016.budget presentation.super
TRANSCRIPT

Litchfield Public Schools:
2015 – 2016 Education Budget
“An investment in knowledge pays the
best interest.”Benjamin Franklin
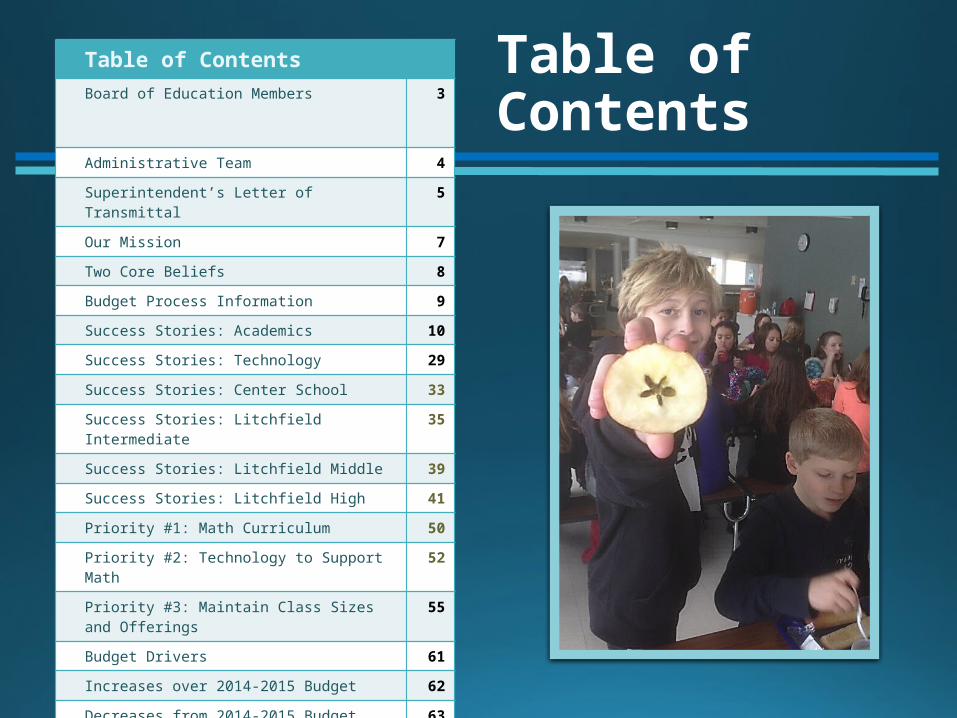
Table of ContentsTable of ContentsBoard of Education Members
3
Administrative Team 4
Superintendent’s Letter of Transmittal 5
Our Mission 7
Two Core Beliefs 8
Budget Process Information 9
Success Stories: Academics 10
Success Stories: Technology 29
Success Stories: Center School 33
Success Stories: Litchfield Intermediate 35
Success Stories: Litchfield Middle 39
Success Stories: Litchfield High 41
Priority #1: Math Curriculum 50
Priority #2: Technology to Support Math 52
Priority #3: Maintain Class Sizes and Offerings 55
Budget Drivers 61
Increases over 2014-2015 Budget 62
Decreases from 2014-2015 Budget 63
Salaries 65
Utilities 69
Budget Summary 71
Comparisons with Other Towns 75

Board of Education
Frank Simone, ChairWayne Shuhi, Vice ChairDonald Falcetti, SecretaryJohn BongiornoGayle CarrDaniel ClockElizabeth FabbriAmy RosserGary Waugh
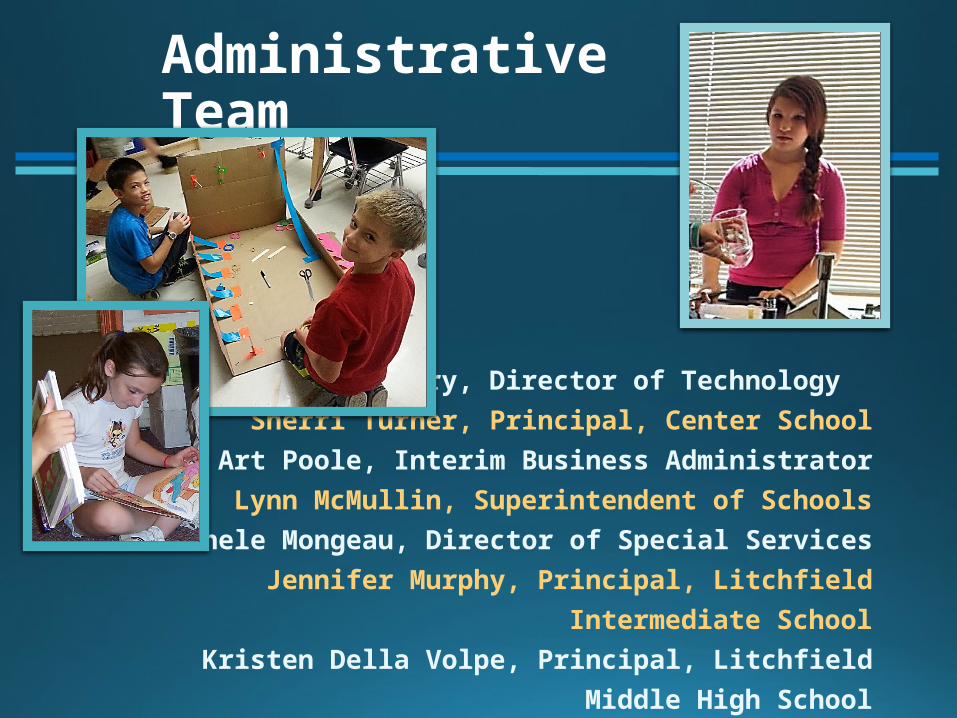
Administrative Team
Jamie Terry, Director of Technology Sherri Turner, Principal, Center School
Art Poole, Interim Business AdministratorLynn McMullin, Superintendent of Schools
Michele Mongeau, Director of Special ServicesJennifer Murphy, Principal, Litchfield Intermediate School
Kristen Della Volpe, Principal, Litchfield Middle High SchoolStephanie Kubisek, Assistant Principal, Litchfield Middle High School

Superintendent’s Letter of Transmittal
Dear Members of the Litchfield Community,
What follows is a celebration of our schools and the Board of Education’s request for the financial resources to continue that success in the 2015 – 2016 school year. It represents a $419,359 increase, or 2.53%. Education is a ‘people business;’ thus 77% of the budget represents salaries and benefits. Fixed costs such as utilities and transportation make up another 13%. The remaining 10% is for the curriculum, supplies, and programming needed in our classrooms and activities, from sheet music to software, from butterfly larvae to baseballs.
The budget builds on what the Litchfield community values – opportunities for individualized programming and the advantages of small class sizes. Additions to the staff, such as a guidance counselor for Center School and a Special-Ed teacher for the Intermediate School, occurred over the past summer and reflect both the educational and contemporary social needs of students and their families. Cafeteria aides, a crossing guard, and an assistant librarian at the high school meet additional student safety or supervision needs.
Two notable increases are for the purchase of a much-needed math curriculum and the technology required to support it. Litchfield’s current math program is aligned to the standards of the CMT, with 26 different content strands each year. We’ve come to call that approach ‘a mile wide and an inch deep.’ The new Common Core State Standards require far fewer concepts per year and a much deeper level of understanding. The new requirements also add ‘math practices’ to the core content expecting teachers and students to change their old methods and incorporate more hands-on problem-solving, more conversation about how and why an answer is right, and greater fluency and facility with number sense.

Any math program worth our investment will support this new CCSS content and approach. Any worthwhile program will also offer rich technology supports such as pre- and post- assessments, online skills work with opportunities for immediate feedback, teacher resources for differentiation at all levels, SmartBoard-ready lessons, and online teacher and parent supports.
This budget is a responsible budget, based on the needs of the schools. It is as clear and forthright as possible and includes line items and expenses not recognized in the previous budget. The ‘student activities’ line includes increases for the PSAT test to be given to sophomores and juniors at LHS on a Wednesday in October (a College Board mandated change), as well as for transportation for all the athletic contests, without banking on canceled games or lost tournament bids. It includes $20,000 for our anticipated loss in the cafeteria (a $46,000 deficit last year, but improvement is expected next year); $40,000 for Kelley Services to achieve 90% substitute coverage; and a $110,000 loan repayment to the town for computer leases. Some increases occur in lines which were under-budgeted for the previous two years: ATT, water, and sewer.
The Board of Education budget is understandably a collection of static numbers with a bottom line. But, more accurately it is the foundation on which we are building our future through the education of our children. So this year, you’ll see slides which illustrate our district-wide accomplishments and celebrate our children and teachers at work. Ours IS a people business, and this budget continues Litchfield’s tradition of supporting the individual growth and development of every child. Simply put, it’s what’s best for kids.
Respectfully submitted,Lynn K. McMullinSuperintendent of Schools
“Education is more than a luxury; it is a responsibility a society owes to itself.”

Our MISSION
The mission of the Litchfield Public Schools is to provide all students with appropriate academic and personal learning experiences within a safe and supportive educational environment. In partnership with our parents and community, we challenge every learner to acquire the knowledge, skills, and personal attributes needed to become productive and self-directed citizens.
A Core Belief … in Presenting this budget
The Litchfield school system is a community jewel. It draws families to the community and
makes them want to stay. Students succeed here; and, in return, their success brings both
pride to Litchfield and measurable advancements to a wider world which builds its future on
the potential contributions of its youngest citizens.
The Litchfield community has dedicated itself to meeting the needs of all its children through
rich and diverse academic programming and a commitment to 21st Century knowledge and
skills, world language, athletic competition, music, and the visual arts. Children also benefit
from programs in which they are provided an opportunity to say ‘thank you’ and give back to
their town through performances, Veteran’s Day programs, community service projects,
food drives, and benefits.
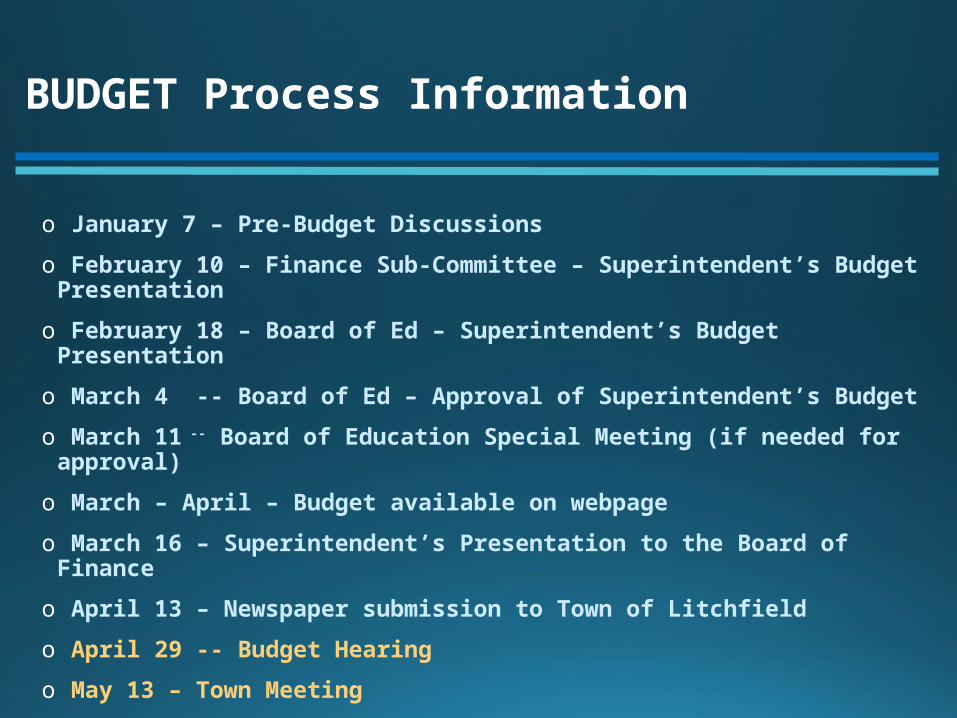
BUDGET Process Information
o January 7 – Pre-Budget Discussions
o February 10 – Finance Sub-Committee – Superintendent’s Budget Presentation
o February 18 – Board of Ed – Superintendent’s Budget Presentation
o March 4 -- Board of Ed – Approval of Superintendent’s Budget
o March 11 -- Board of Education Special Meeting (if needed for approval)
o March – April – Budget available on webpage
o March 16 – Superintendent’s Presentation to the Board of Finance
o April 13 – Newspaper submission to Town of Litchfield
o April 29 -- Budget Hearing
o May 13 – Town Meeting
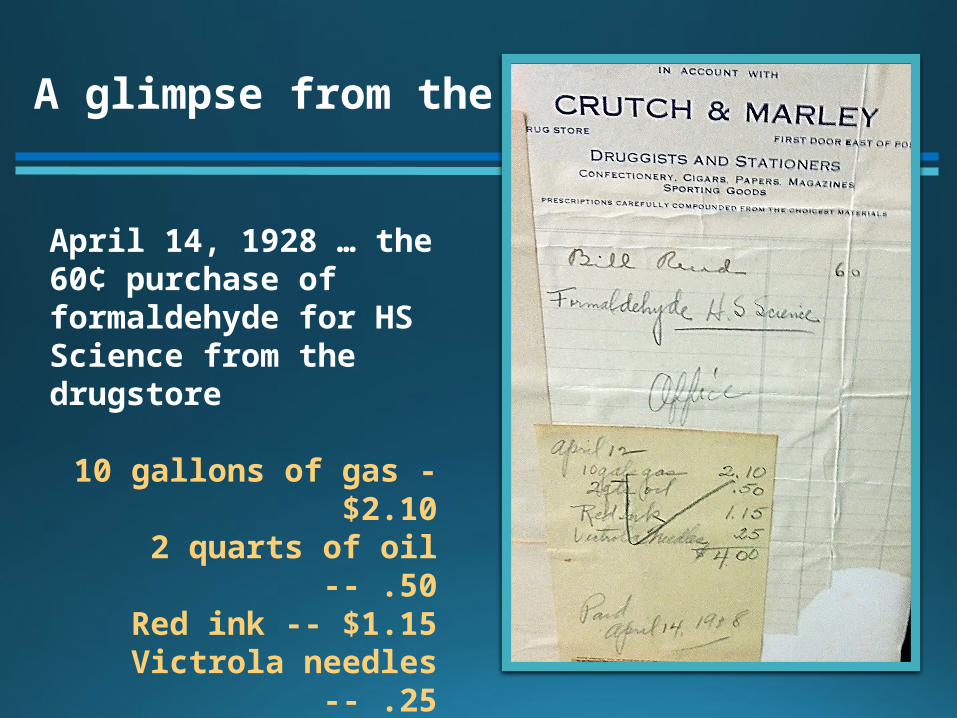
A glimpse from the past….
April 14, 1928 … the 60¢ purchase of formaldehyde for HS Science from the drugstore
10 gallons of gas - $2.102 quarts of oil -- .50
Red ink -- $1.15Victrola needles -- .25
Total bill -- $4.00
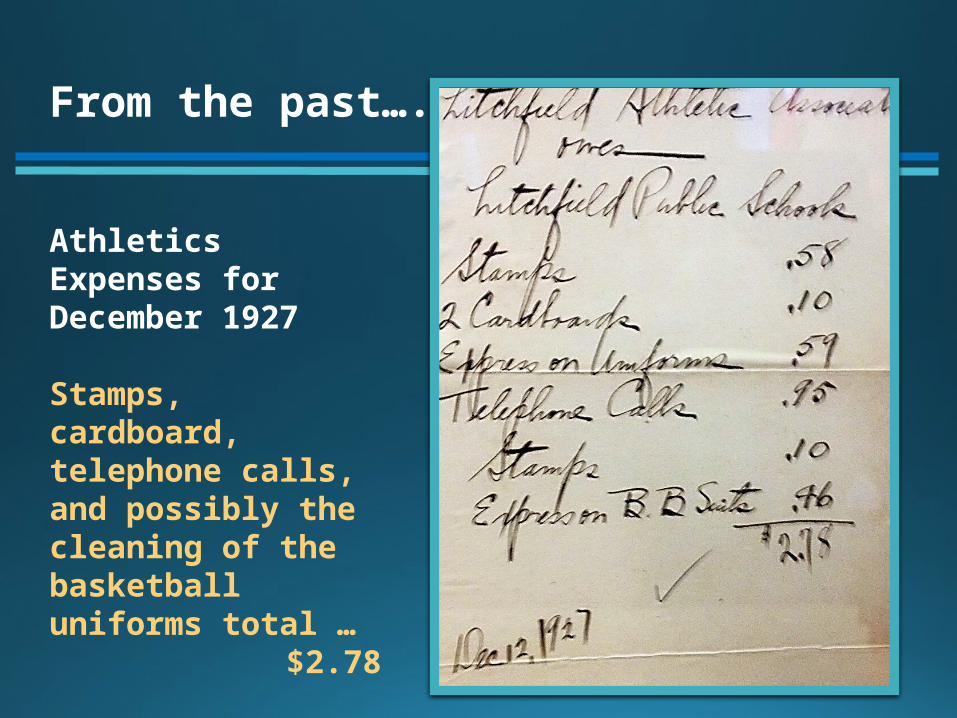
From the past….
Athletics Expenses for December 1927
Stamps, cardboard, telephone calls, and possibly the cleaning of the basketball uniforms total …
$2.78

CONTENT AREA2006
% of Grade 3 at GOAL or above
2011% of Grade 3 at GOAL or above
2013% of Grade 3 at GOAL or above
MATH 55 69 79
READING 67 65 75
WRITING 64 67 73
2006– 2013 SUCCESS STORIES: ACADEMICS
Grade 3 at Goal

CONTENT AREA2006
% of Grade 4 at GOAL or above
2011% of Grade 4 at GOAL or above
2013% of Grade 4 at GOAL or above
MATH 71 80 74
READING 80 78 75
WRITING 81 75 75
2006– 2013 SUCCESS STORIES: ACADEMICS
Grade 4 at Goal

What is DRG?
DRG, or District Reference Group, is a grouping of Connecticut school districts based
on the demographics they share. Seven key variables were considered: income,
education, occupation, family structure, poverty, home language, and district
enrollment. Litchfield was placed in DRG E. The 35 small districts in this group are
ranked 5th in median family income, education level, and percentage in managerial
or professional occupations. They have significantly lower percentage of children
from single-parent families and lower percentage of children in poverty than DRG F,
and both of these figures are similar to those of DRG D. The percentage of families
who do not speak English at home is the lowest of all groups and the average
enrollment of 766 is the smallest of any group. DRG E has 26 elementary districts
and 14 high school districts. Grouping like districts together is useful in order to
make legitimate comparisons of data for everything from testing to budgeting.
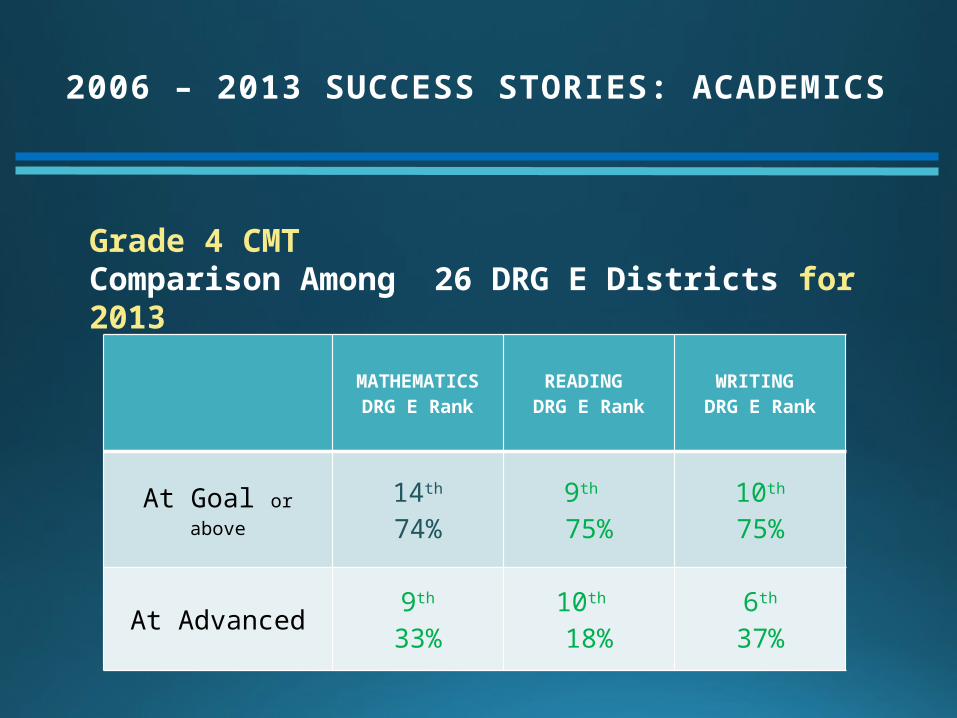
2006 – 2013 SUCCESS STORIES: ACADEMICS
MATHEMATICSDRG E Rank
READING DRG E Rank
WRITING DRG E Rank
At Goal or above14th
74%9th
75%10th
75%
At Advanced 9th
33%10th 18%
6th
37%
Grade 4 CMTComparison Among 26 DRG E Districts for 2013

CONTENT AREA2006
% of Grade 5 at GOAL or above
2011% of Grade 5 at GOAL or above
2013% of Grade 5 at GOAL or above
MATH 72 82 83
READING 77 71 81
WRITING 81 76 82
SCIENCE -- 67 79
2006– 2013 SUCCESS STORIES: ACADEMICS
Grade 5 at Goal

CONTENT AREA2006
% of Grade 6 at GOAL or above
2011% of Grade 6 at GOAL or above
2013% of Grade 6 at GOAL or above
MATH 86 84 89
READING 88 83 90
WRITING 93 70 87
2006– 2013 SUCCESS STORIES: ACADEMICS
Grade 6 at Goal

2006 – 2013 SUCCESS STORIES: ACADEMICS
MATHEMATICS
DRG E Rank
READING DRG E Rank
WRITING DRG E Rank
At Goal or above6th
89%7th
90%4th
87%
At Advanced 8th
45%6th
36%14th
36%
Grade 6 CMTComparison Among 26 DRG E Districts for 2013
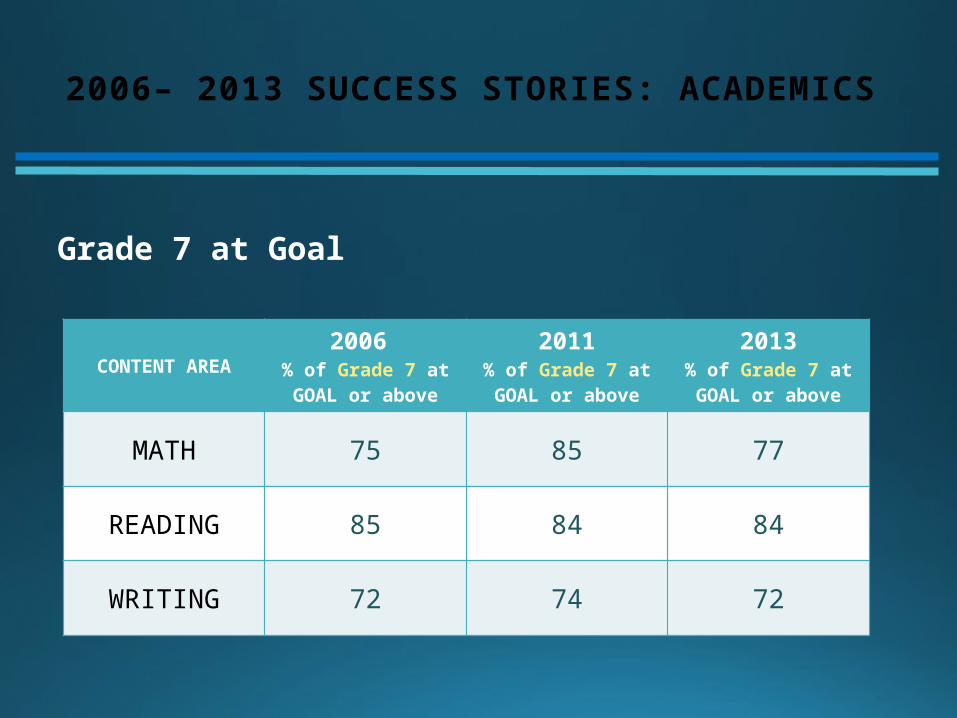
CONTENT AREA2006
% of Grade 7 at GOAL or above
2011% of Grade 7 at GOAL or above
2013% of Grade 7 at GOAL or above
MATH 75 85 77
READING 85 84 84
WRITING 72 74 72
2006– 2013 SUCCESS STORIES: ACADEMICS
Grade 7 at Goal

CONTENT AREA2006
% of Grade 8 at GOAL or above
2011% of Grade 8 at GOAL or above
2013% of Grade 8 at GOAL or above
MATH 79 79 82
READING 74 83 65
WRITING 82 81 76
SCIENCE -- 81 79
Grade 8 at Goal
2006– 2013 SUCCESS STORIES: ACADEMICS

2006 – 2013 SUCCESS STORIES: ACADEMICS
MATHEMATICS
DRG E Rank
READING DRG E Rank
WRITING DRG E Rank
SCIENCE DRG E Rank
At Goal or above
8th 82%
15th
65%16th
76%12th
79%
At Advanced7th
46%13th
37%19th
21%10th
27%
Grade 8 CMTComparison Among 26 DRG E Districts for 2013

CONTENT AREA2006
% of Grade 10 at GOAL or above
2011% of Grade 10 at GOAL or above
2013% of Grade 10 at GOAL or above
MATH 55 63 71
READING 72 59 67
WRITING 61 73 75
SCIENCE 75 60 76
2006– 2013 SUCCESS STORIES: ACADEMICS
Grade 10 at Goal
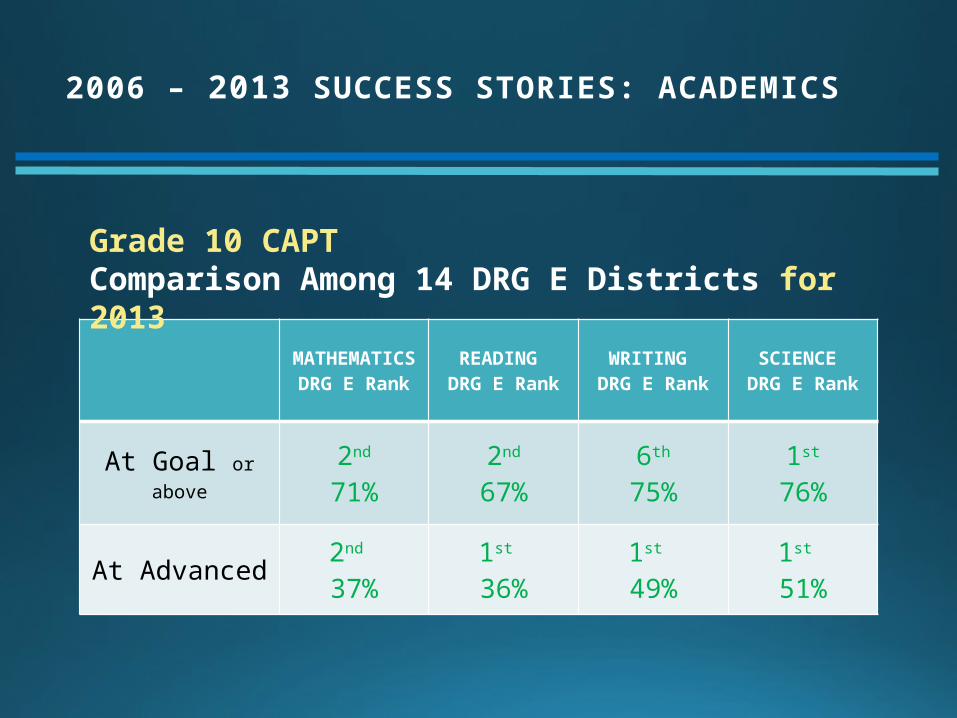
2006 – 2013 SUCCESS STORIES: ACADEMICS
MATHEMATICS
DRG E Rank
READING DRG E Rank
WRITING DRG E Rank
SCIENCE DRG E Rank
At Goal or above
2nd
71%2nd
67%6th
75%1st
76%
At Advanced2nd 37%
1st 36%
1st 49%
1st 51%
Grade 10 CAPTComparison Among 14 DRG E Districts for 2013

Class of 2015Gr. 3 Gr. 4 Gr. 5 Gr. 6 Gr. 7 Gr. 8 CAPT
Reading 67/26 74/24 80/34 89/38 87/56 83/45 67/36
Writing 64/31 59/21 74/37 71/27 73/28 65/19 75/49
Math 55/19 65/29 70/30 87/5790 / 58 79/46 71/37
Science -- -- 69/17 -- -- 81/29 76/51
2006 – 2013 SUCCESS STORIES: ACADEMICS
Class of 2015Growth Over Time At or above Goal / Advanced
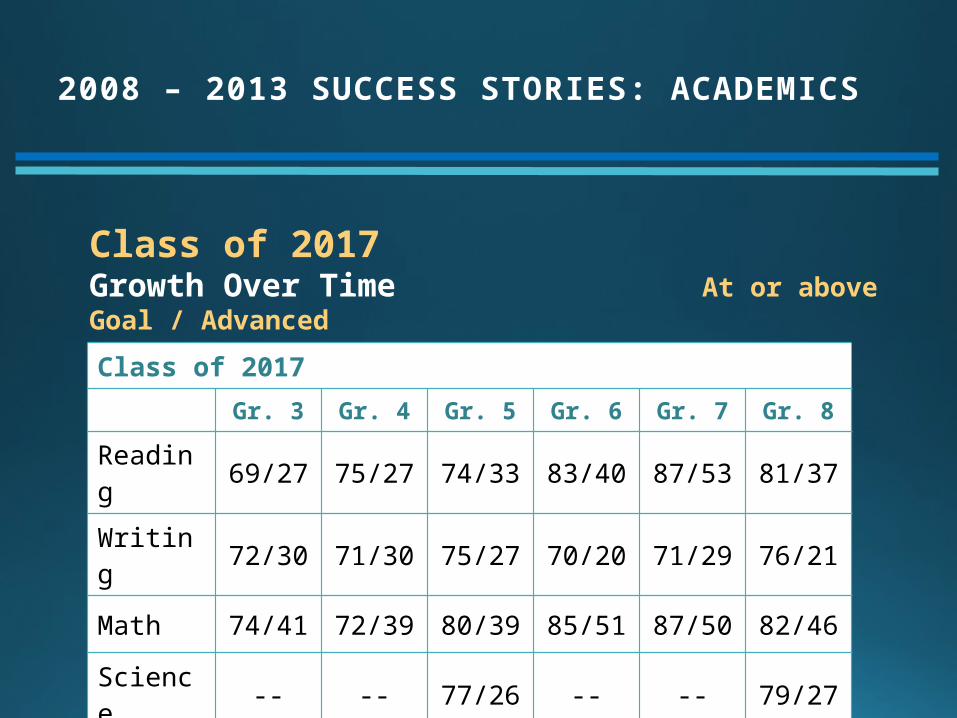
Class of 2017Gr. 3 Gr. 4 Gr. 5 Gr. 6 Gr. 7 Gr. 8
Reading 69/27 75/27 74/33 83/40 87/53 81/37
Writing 72/30 71/30 75/27 70/20 71/29 76/21
Math 74/41 72/39 80/39 85/51 87/50 82/46
Science -- -- 77/26 -- -- 79/27
2008 – 2013 SUCCESS STORIES: ACADEMICS
Class of 2017Growth Over Time At or above Goal / Advanced

Class of 2018
Gr. 3 Gr. 4 Gr. 5 Gr. 6 Gr. 7
Reading 67/15 76/16 71/20 89/35 84/41
Writing 67/27 78/26 76/27 85/38 72/25
Math 77/33 77/29 82/35 85/48 77/36
Science -- -- 67/24 -- --
2009 – 2013 SUCCESS STORIES: ACADEMICS
Class of 2018Growth Over Time At or above Goal / Advanced
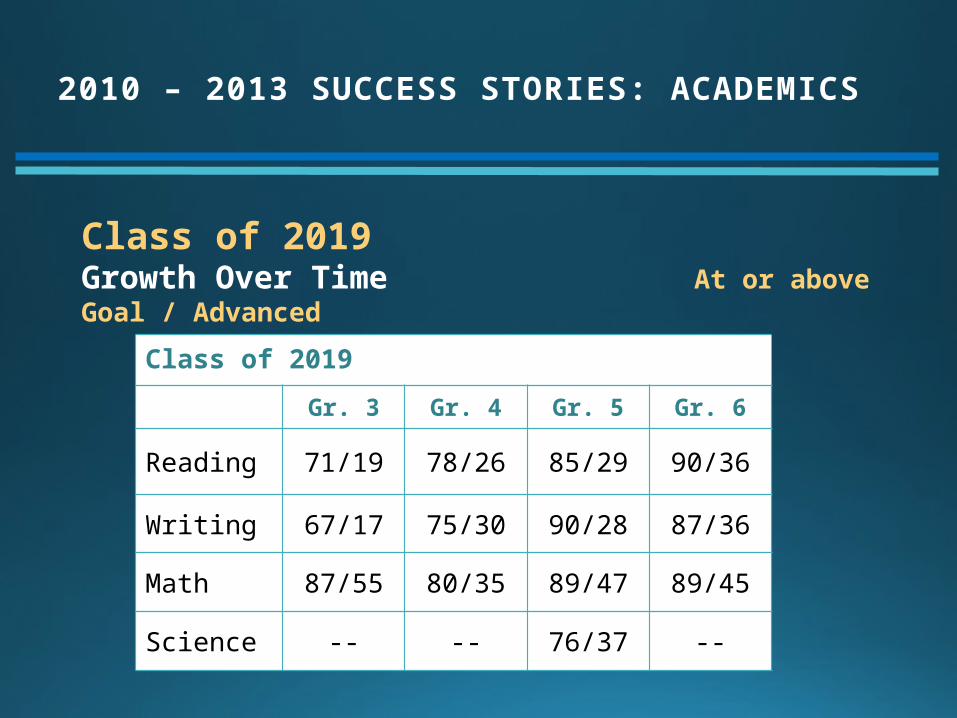
Class of 2019
Gr. 3 Gr. 4 Gr. 5 Gr. 6
Reading 71/19 78/26 85/29 90/36
Writing 67/17 75/30 90/28 87/36
Math 87/55 80/35 89/47 89/45
Science -- -- 76/37 --
2010 – 2013 SUCCESS STORIES: ACADEMICS
Class of 2019Growth Over Time At or above Goal / Advanced
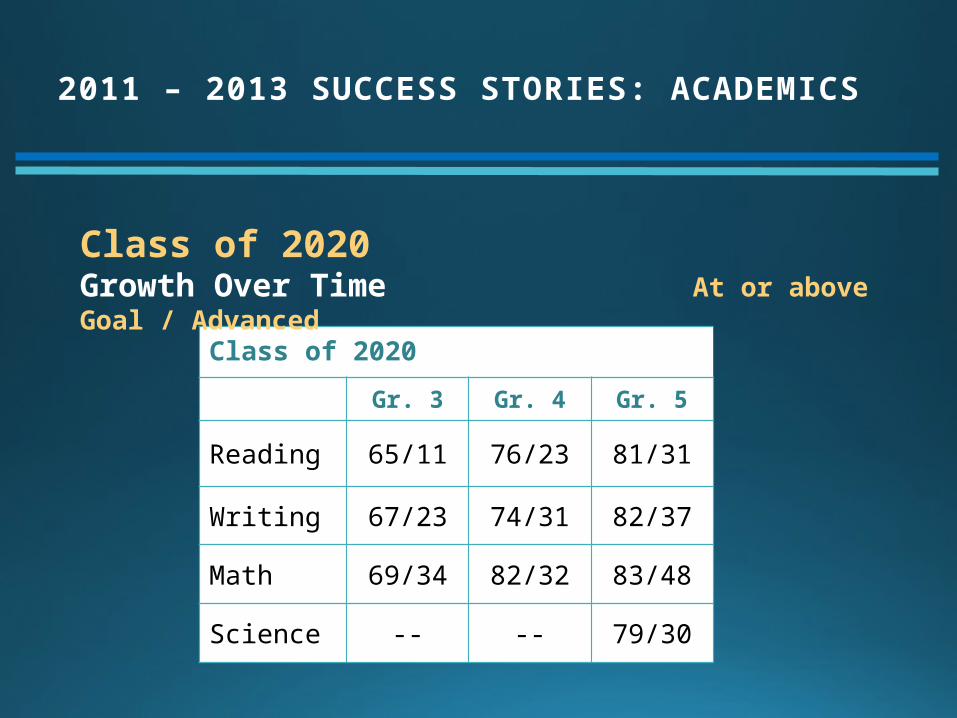
Class of 2020
Gr. 3 Gr. 4 Gr. 5
Reading 65/11 76/23 81/31
Writing 67/23 74/31 82/37
Math 69/34 82/32 83/48
Science -- -- 79/30
2011 – 2013 SUCCESS STORIES: ACADEMICS
Class of 2020Growth Over Time At or above Goal / Advanced
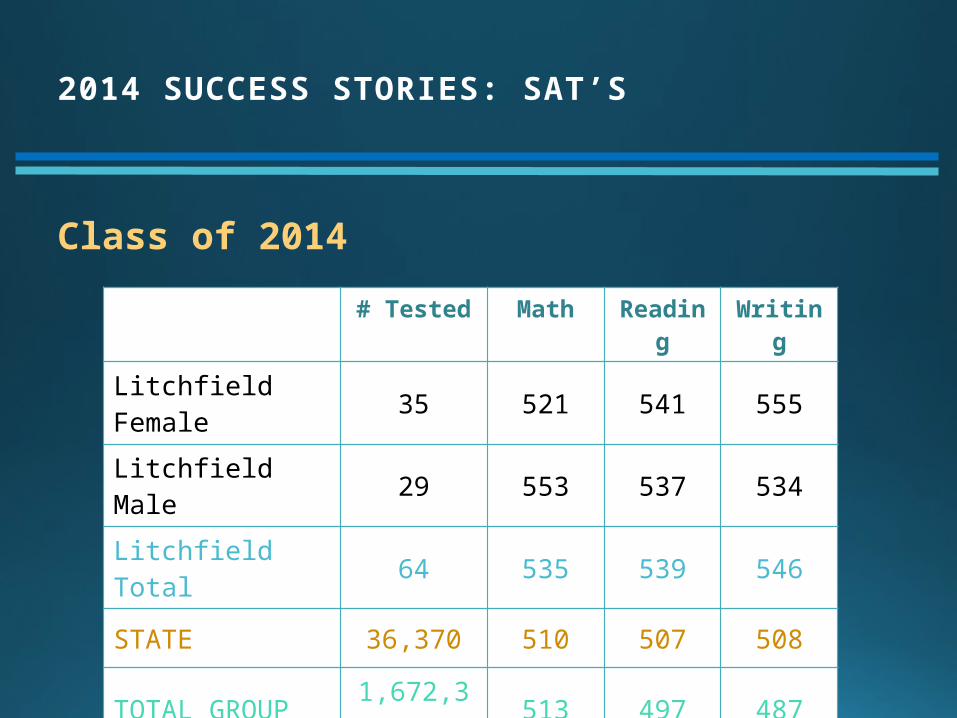
# Tested Math Reading Writing
Litchfield Female 35 521 541 555
Litchfield Male 29 553 537 534
Litchfield Total 64 535 539 546
STATE 36,370 510 507 508
TOTAL GROUP 1,672,395 513 497 487
2014 SUCCESS STORIES: SAT’S
Class of 2014
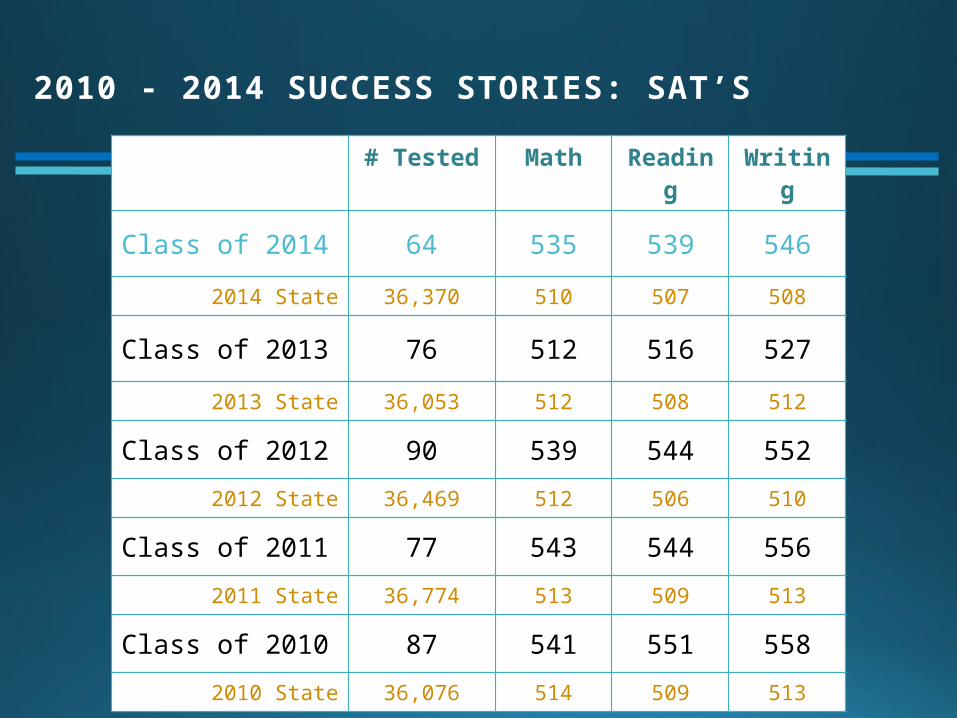
# Tested Math Reading Writing
Class of 2014 64 535 539 546
2014 State 36,370 510 507 508
Class of 2013 76 512 516 527
2013 State 36,053 512 508 512
Class of 2012 90 539 544 552
2012 State 36,469 512 506 510
Class of 2011 77 543 544 556
2011 State 36,774 513 509 513
Class of 2010 87 541 551 558
2010 State 36,076 514 509 513
2010 - 2014 SUCCESS STORIES: SAT’S
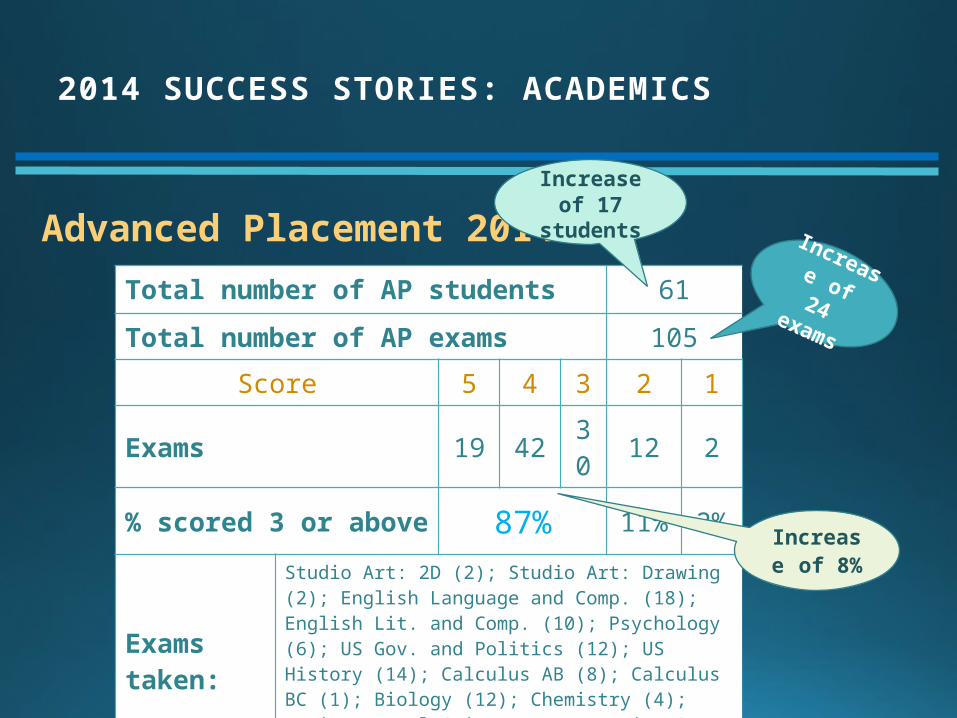
Total number of AP students 61
Total number of AP exams 105Score 5 4 3 2 1
Exams 19 42 30 12 2
% scored 3 or above 87% 11% 2%
Exams taken:
Studio Art: 2D (2); Studio Art: Drawing (2); English Language and Comp. (18); English Lit. and Comp. (10); Psychology (6); US Gov. and Politics (12); US History (14); Calculus AB (8); Calculus BC (1); Biology (12); Chemistry (4); Environmental Science (11); Latin (2); Spanish Lang. and Culture (3)
2014 SUCCESS STORIES: ACADEMICS
Advanced Placement 2014Increase of 24 exams
Increase of 17
students
Increase of 8%

2014 SUCCESS STORIES: ACADEMICS
79%
70%

2007 2008 2009 2010 2011
2014 SUCCESS STORIES: ACADEMICS
Very low attrition rate for students attending post-high school education over the past five years.
• Class of 2011:• 84% attended post-grad education immediately• 75% at four-year colleges• 11% attrition overall; 2% at private colleges• 11% enrolled as new students in 2013
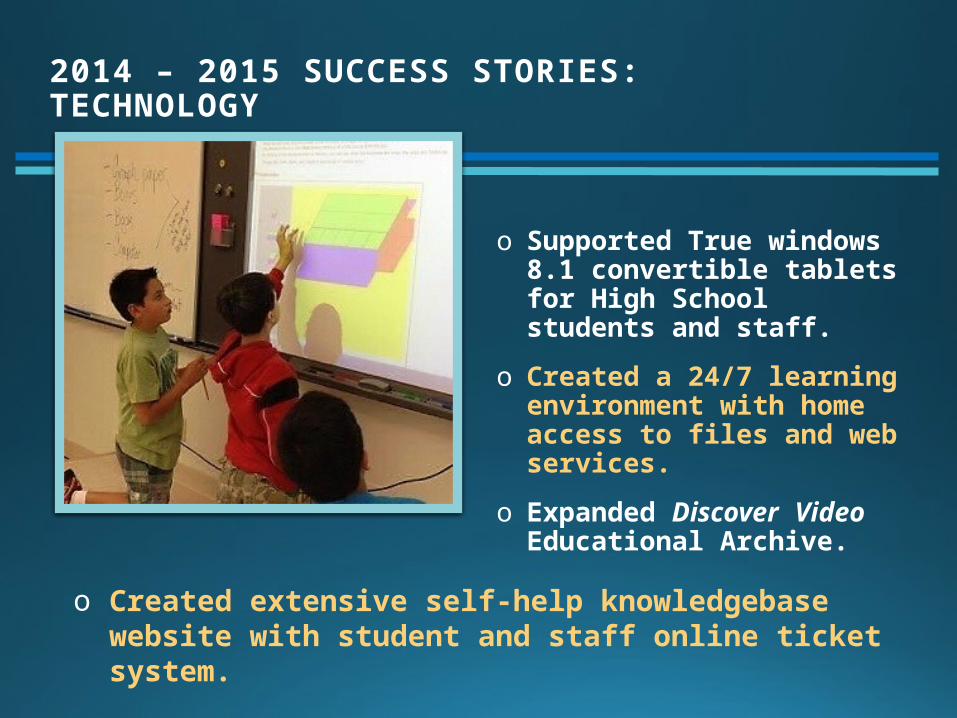
2014 – 2015 SUCCESS STORIES: TECHNOLOGY
o Supported True windows 8.1 convertible tablets for High School students and staff.
o Created a 24/7 learning environment with home access to files and web services.
o Expanded Discover Video Educational Archive.
o Created extensive self-help knowledgebase website with student and staff online ticket system.

2014 – 2015 SUCCESS STORIES: TECHNOLOGY
o Supported Windows 8.1 laptop for 7th & 8th grades.o Added 50 Chromebooks and 15 iPads.
o Fully collaborative electronic environment across multiple platforms (Google, Office 365, Student Share).

2014 – 2015 SUCCESS STORIES: TECHNOLOGY
o Provided hardware access to:
o 3-D Printing, Video Editing, Television Studio, Large Format Printing,
o Digital Microscopes, LabQuest Data Collection Devices,
o SmartBoards in every science, math, social studies classroom.
o Managed District Wide Wireless Access.
o Expanded 10GB Fiber LAN Within District.
o Fully filtered student devices with robust reporting.

2014 – 2015 SUCCESS STORIES: TECHNOLOGY
o Office 365 Online (Outlook, OneNote, Word, Access, Excel, as well as full suite installed on student/staff devices).
Supported software access to:
o Google Apps with Google Siteso LPS Cloud File Access (WebDav)o SmartMusic and Garage Bando Adobe Premier, Corel Video Studio x5,
Adobe Cloud Suite, Dreamweaver web-editing suite, Adobe Photoshop
o TI Calculator Emulation, Smart Notebook
o Quickbooks Accounting Softwareo Computer Assisted Design (CAD)
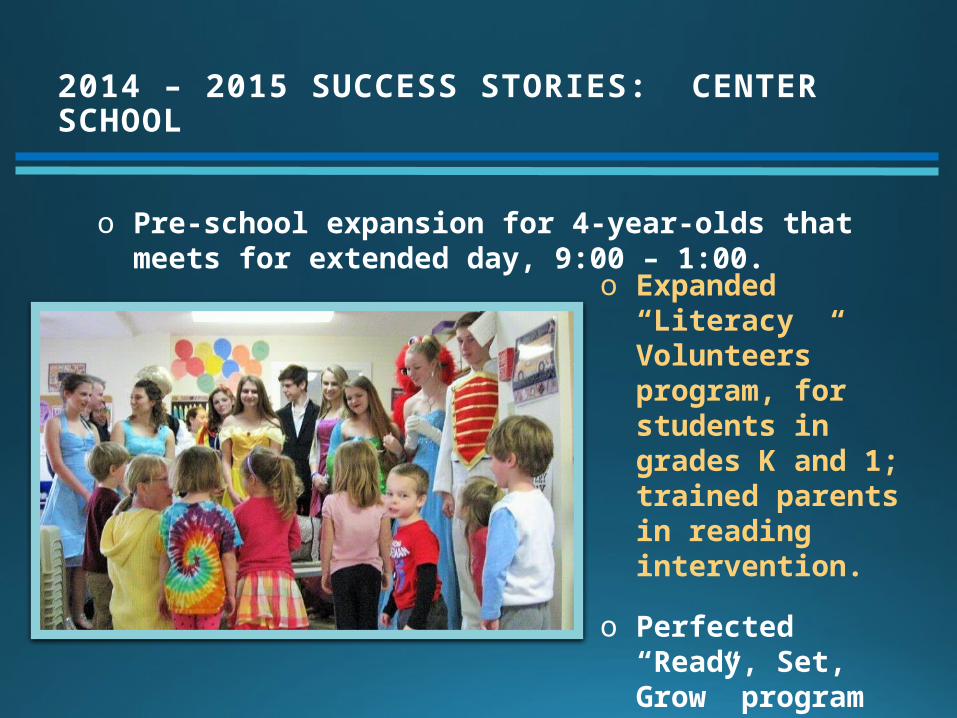
2014 – 2015 SUCCESS STORIES: CENTER SCHOOL
o Pre-school expansion for 4-year-olds that meets for extended day, 9:00 – 1:00.
o Expanded “Literacy Volunteers” program, for students in grades K and 1; trained parents in reading intervention.
o Perfected “Ready, Set, Grow” program for incoming K students and their parents.
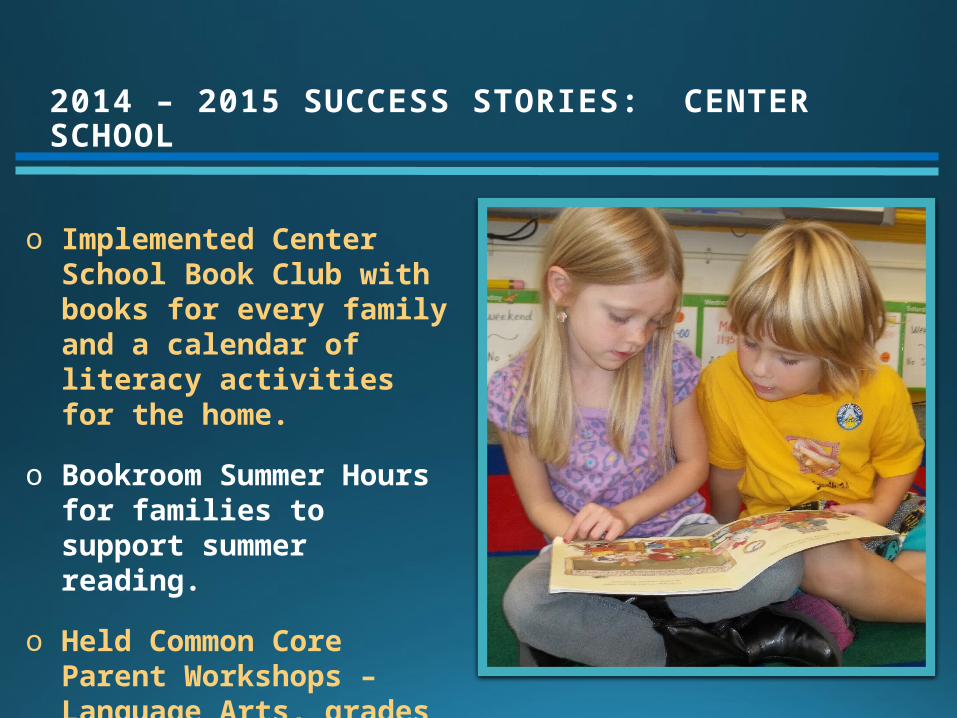
2014 – 2015 SUCCESS STORIES: CENTER SCHOOL
o Implemented Center School Book Club with books for every family and a calendar of literacy activities for the home.
o Bookroom Summer Hours for families to support summer reading.
o Held Common Core Parent Workshops – Language Arts, grades K – 3.

2014 – 2015 SUCCESS STORIES: LITCHFIELD INTERMEDIATE SCHOOL
o Held Immigration Nation through EdConn -- inter-district program to reduce socio-economic isolation through 5 – 6 field trips.
o Hosted Learning Through Moschen Math program -- 100% grant funded.
o Won $2,000 mini-grant from CSDE for UConn to work with teachers on digital literacy strategies.
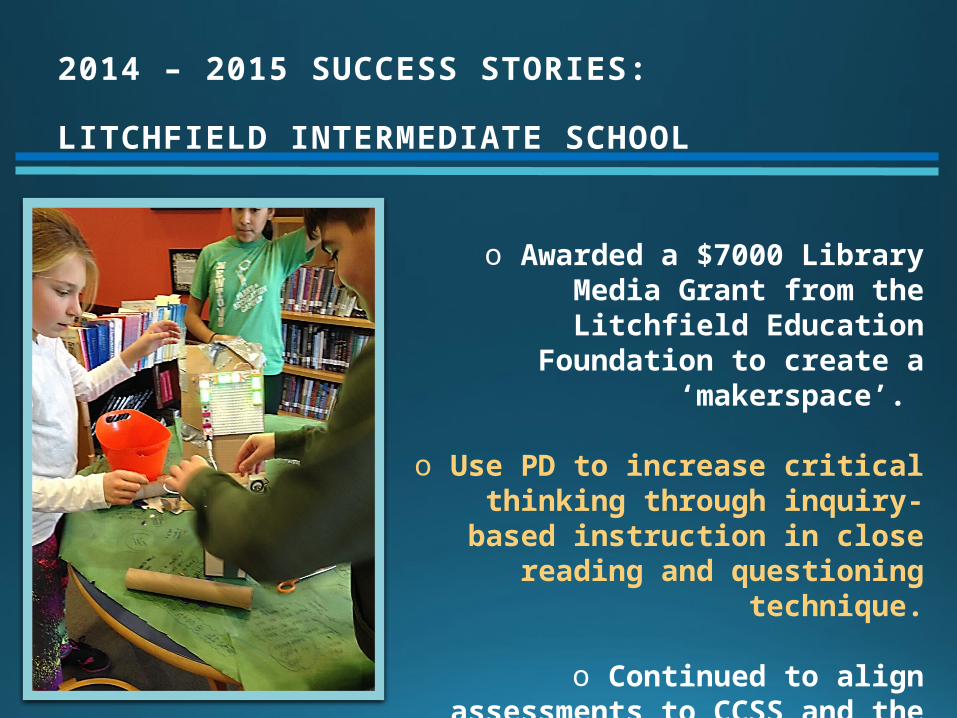
2014 – 2015 SUCCESS STORIES: LITCHFIELD INTERMEDIATE SCHOOL
o Awarded a $7000 Library Media Grant from the Litchfield Education Foundation
to create a ‘makerspace’.
o Use PD to increase critical thinking through inquiry-based instruction in
close reading and questioning technique.
o Continued to align assessments to CCSS and the depth-of-knowledge matrix.
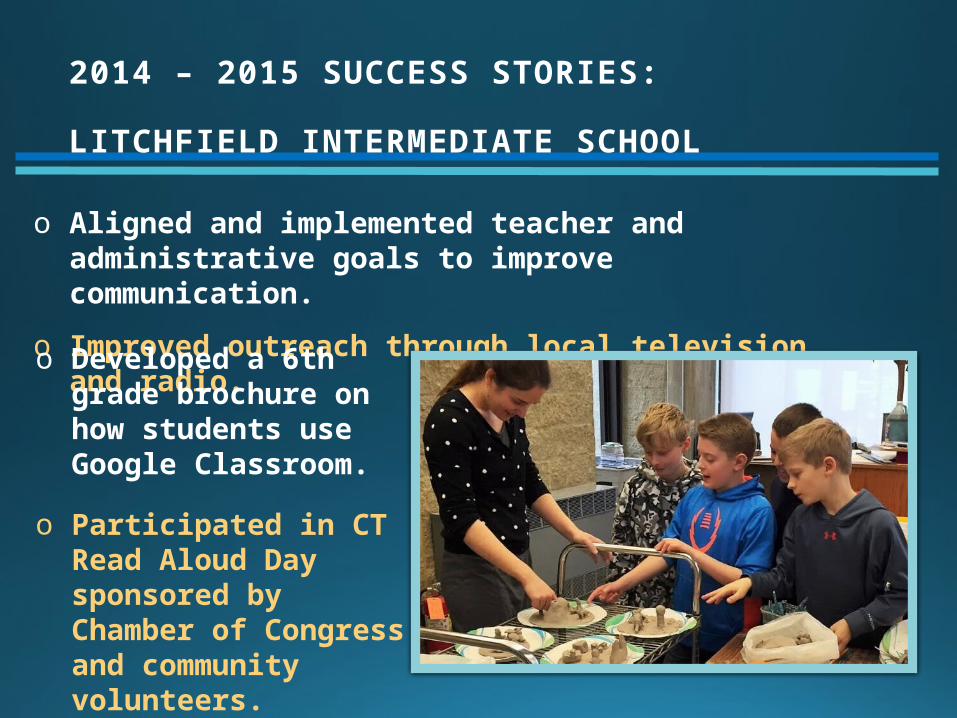
2014 – 2015 SUCCESS STORIES: LITCHFIELD INTERMEDIATE SCHOOL
o Aligned and implemented teacher and administrative goals to improve communication.
o Improved outreach through local television and radio.o Developed a 6th grade
brochure on how students use Google Classroom.
o Participated in CT Read Aloud Day sponsored by Chamber of Congress and community volunteers.
2014 – 2015 SUCCESS STORIES: LITCHFIELD INTERMEDIATE SCHOOL
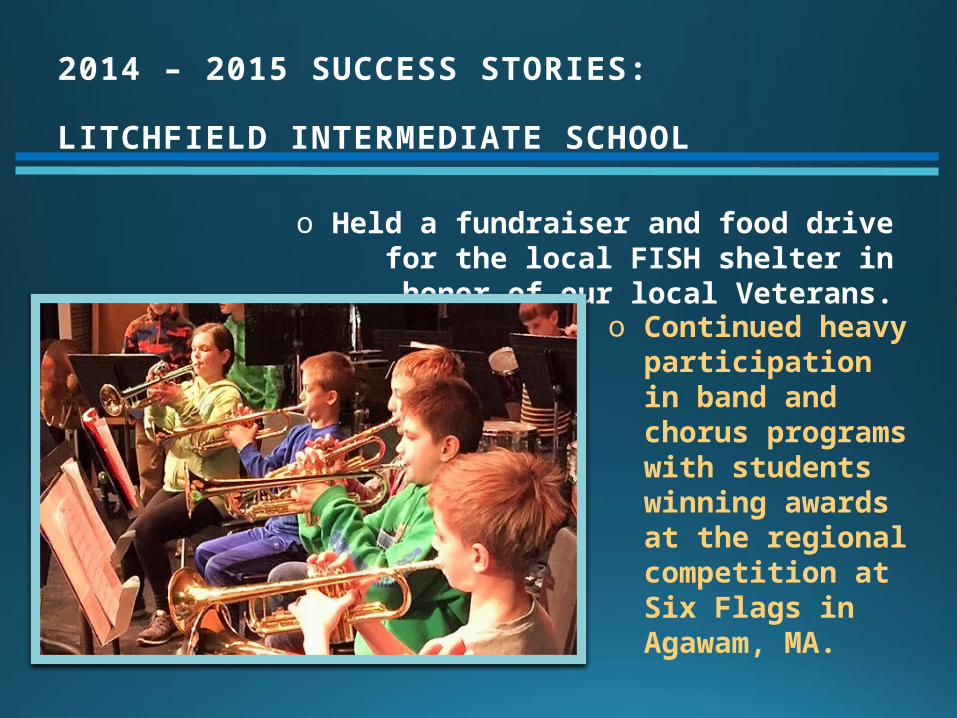
o Held a fundraiser and food drive for the local FISH shelter in honor of our local Veterans.
o Continued heavy participation in band and chorus programs with students winning awards at the regional competition at Six Flags in Agawam, MA.
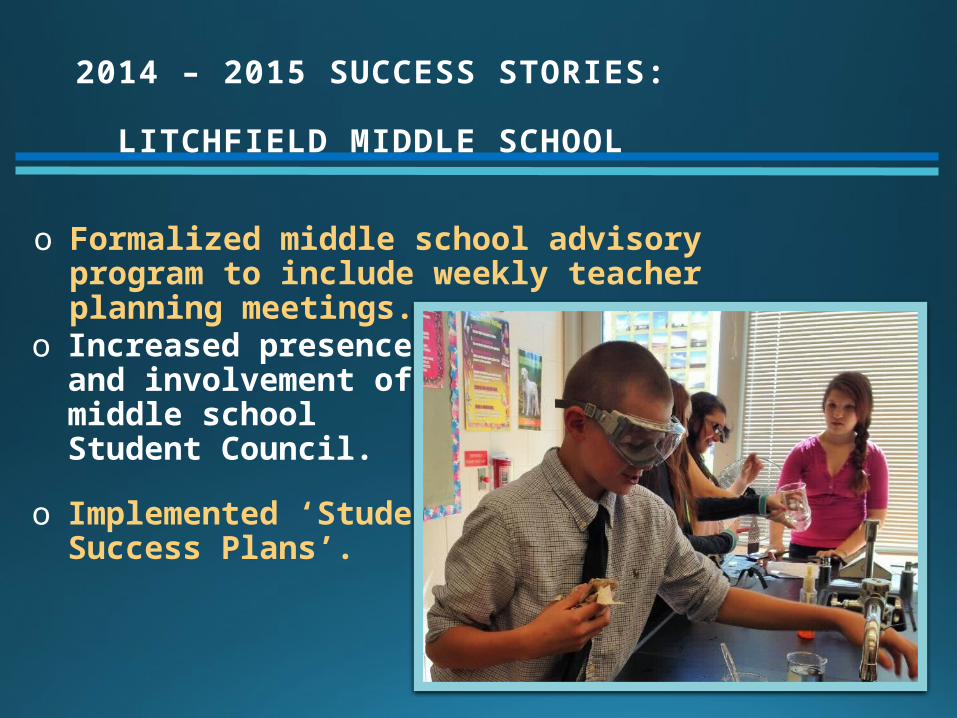
2014 – 2015 SUCCESS STORIES: LITCHFIELD MIDDLE SCHOOL
o Increased presence and involvement of middle school Student Council.
o Implemented ‘Student Success Plans’.
o Formalized middle school advisory program to include weekly teacher planning meetings.
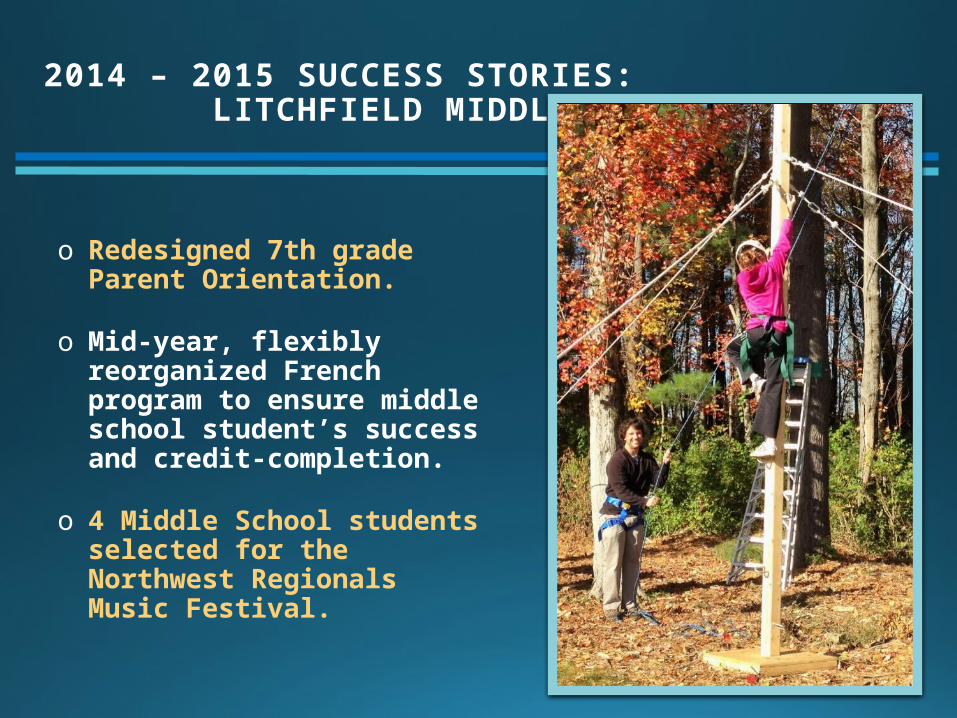
2014 – 2015 SUCCESS STORIES: LITCHFIELD MIDDLE SCHOOL
o Redesigned 7th grade Parent Orientation.
o Mid-year, flexibly reorganized French program to ensure middle school student’s success and credit-completion.
o 4 Middle School students selected for the Northwest Regionals Music Festival.
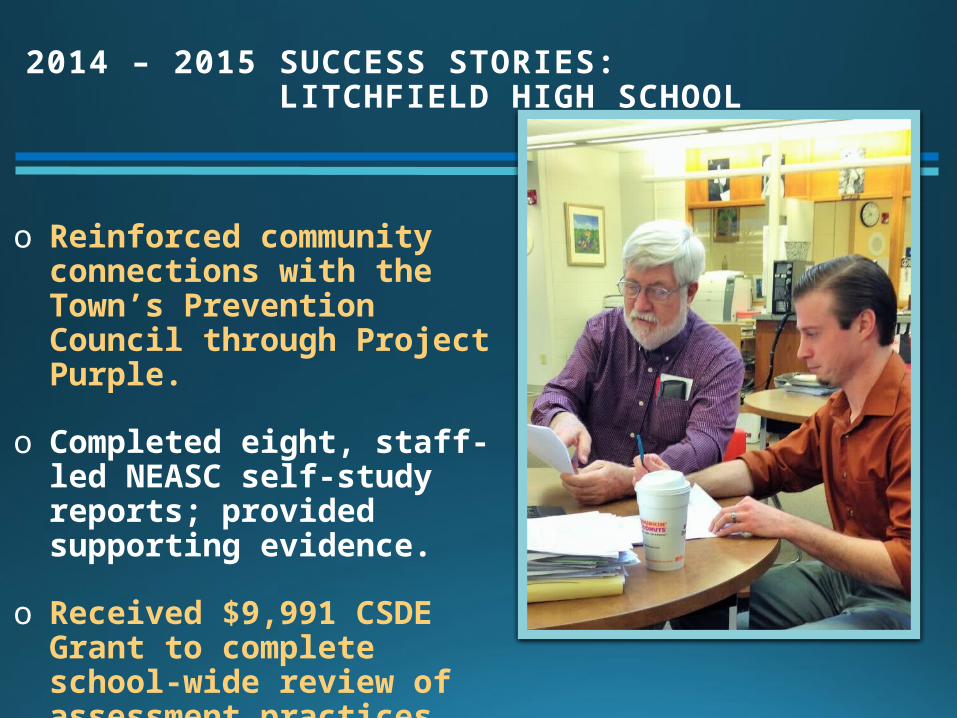
2014 – 2015 SUCCESS STORIES: LITCHFIELD HIGH SCHOOL
o Reinforced community connections with the Town’s Prevention Council through Project Purple.
o Completed eight, staff-led NEASC self-study reports; provided supporting evidence.
o Received $9,991 CSDE Grant to complete school-wide review of assessment practices.

2014 – 2015 SUCCESS STORIES: LITCHFIELD HIGH SCHOOL
o 9 music students grade 9-12 selected for Northern Regional Music Festival.
o LHS Student selected to design Prevention Council website.
o Seven out of ten students in senior class accepted into first college choice.

2014 – 2015 SUCCESS STORIES: LITCHFIELD HIGH SCHOOL
o 2 seniors -- 1st Team All-Berkshire League Boys Soccer & All-State
o 1 junior -- 2nd Team All-Berkshire League Boys Soccer
o 1 junior -- 1st Team All-Berkshire League Cross Country
o 1 junior -- 2nd Team All-Berkshire league Girls Soccer
o 2014 Sportsmanship – Girls Soccer
o 2014 Sportsmanship – Boys Soccer
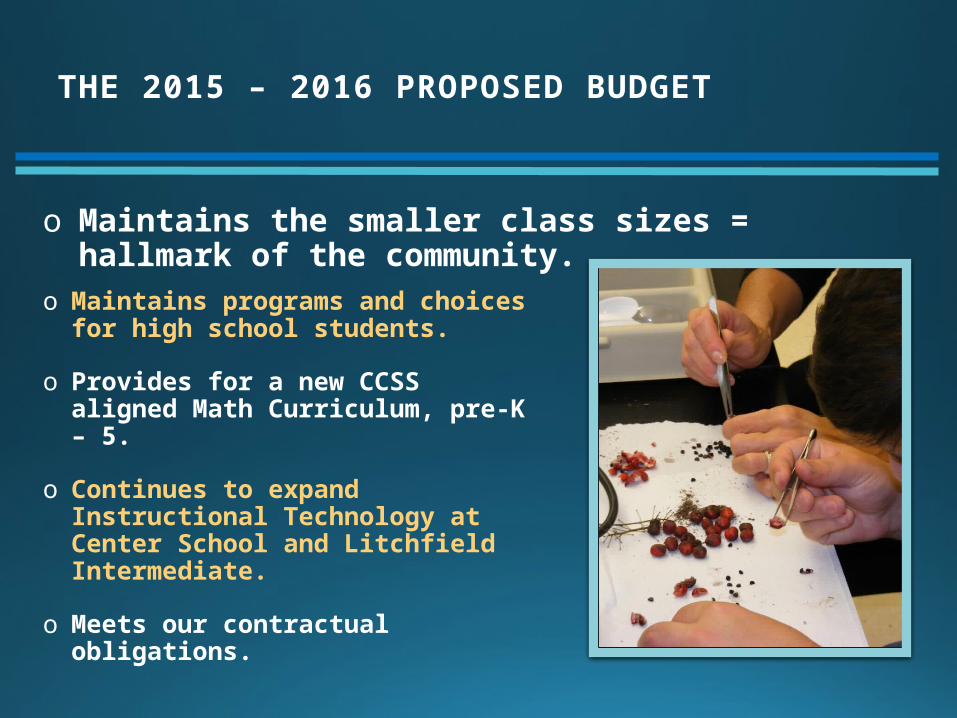
THE 2015 – 2016 PROPOSED BUDGET
o Maintains programs and choices for high school students.
o Provides for a new CCSS aligned Math Curriculum, pre-K – 5.
o Continues to expand Instructional Technology at Center School and Litchfield Intermediate.
o Meets our contractual obligations.
o Maintains the smaller class sizes = hallmark of the community.

2015-2015 PRIORITY #1: MATH CURRICULUM
o Replaces home-grown curriculum in binders.o Replaces old CMT model which had 26 standards per year =
a mile wide and an inch deep.o Implements new CCSS model = deep understanding of fewer
concepts per year.o $80,190 for texts and supplies

2015-2015 PRIORITY #1: MATH CURRICULUM
o New instructional model aligned with current LA instructional model
o Meets CT requirements ensuring all students succeed and are prepared for Smarter Balance
o Higher-level problem-solving and STEM (science-technology-engineering-math activities)
o Student driven vs. teacher-directedo Provides for collaboration and
independence
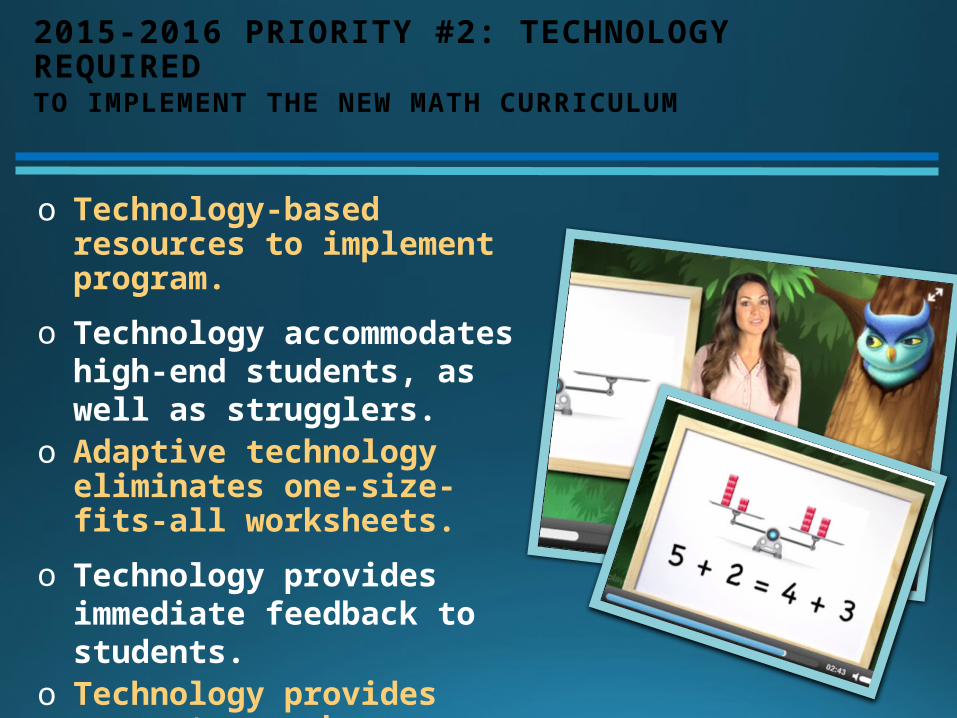
2015-2016 PRIORITY #2: TECHNOLOGY REQUIRED TO IMPLEMENT THE NEW MATH CURRICULUM
o Technology-based resources to implement program.
o Technology accommodates high-end students, as well as strugglers.
o Adaptive technology eliminates one-size-fits-all worksheets.
o Technology provides immediate feedback to students.
o Technology provides supports, such as pre-recorded video snippets for parents and students

Center School
o 75 iPads – 1 cart shared (25) per grades K - 2 o 25 Chromebooks – 1 cart shared Grade 3
2015-2016 PRIORITY #2: TECHNOLOGY REQUIRED TO IMPLEMENT THE NEW MATH CURRICULUM
63% BOE FUNDED37% State Grant Funded

o 2 -- 4th grade shared carts - 52 Chromebooks
o 2 -- 5th grade shared carts - 52 Chromebooks
Litchfield Intermediate School
63% BOE FUNDED37% State Grant Funded
2015-2016 PRIORITY #2: TECHNOLOGY REQUIRED TO IMPLEMENT THE NEW MATH CURRICULUM
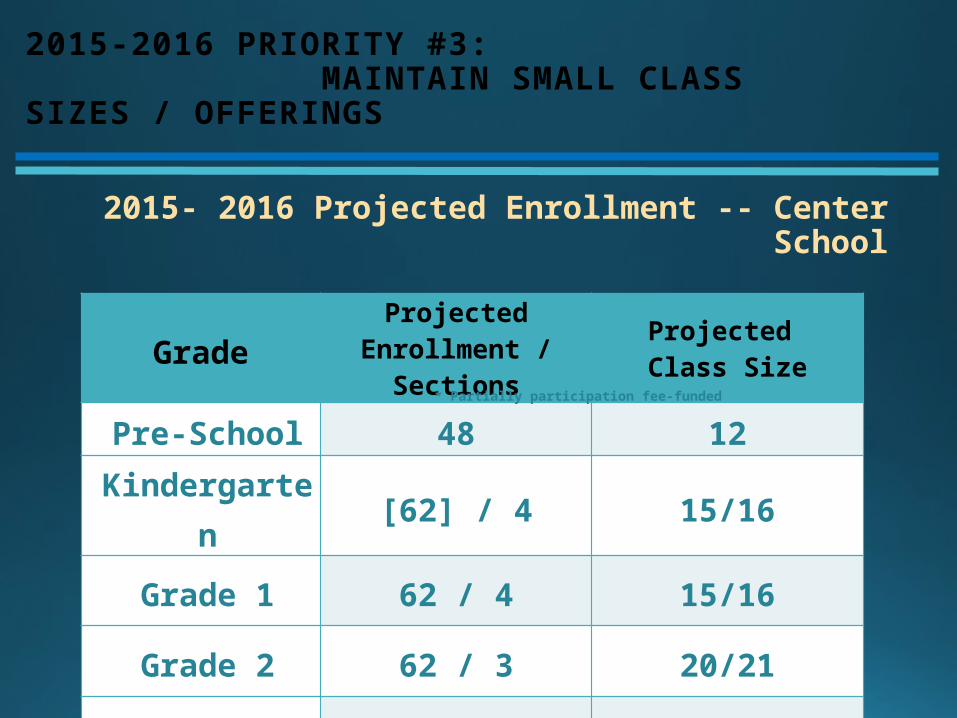
2015- 2016 Projected Enrollment -- Center School
Grade ProjectedEnrollment / Sections
Projected Class Size
Pre-School 48 12
Kindergarten [62] / 4 15/16
Grade 1 62 / 4 15/16
Grade 2 62 / 3 20/21
Grade 3 53 / 3 17/18
* Partially participation fee-funded
2015-2016 PRIORITY #3: MAINTAIN SMALL CLASS SIZES / OFFERINGS

Grade ProjectedEnrollment / Sections
Projected Class Size
Grade 4 69 / 4 17/18
Grade 5 69 / 4 17/18
Grade 6 78 / 4 19/20
2015- 2016 Projected Enrollment – Intermediate School
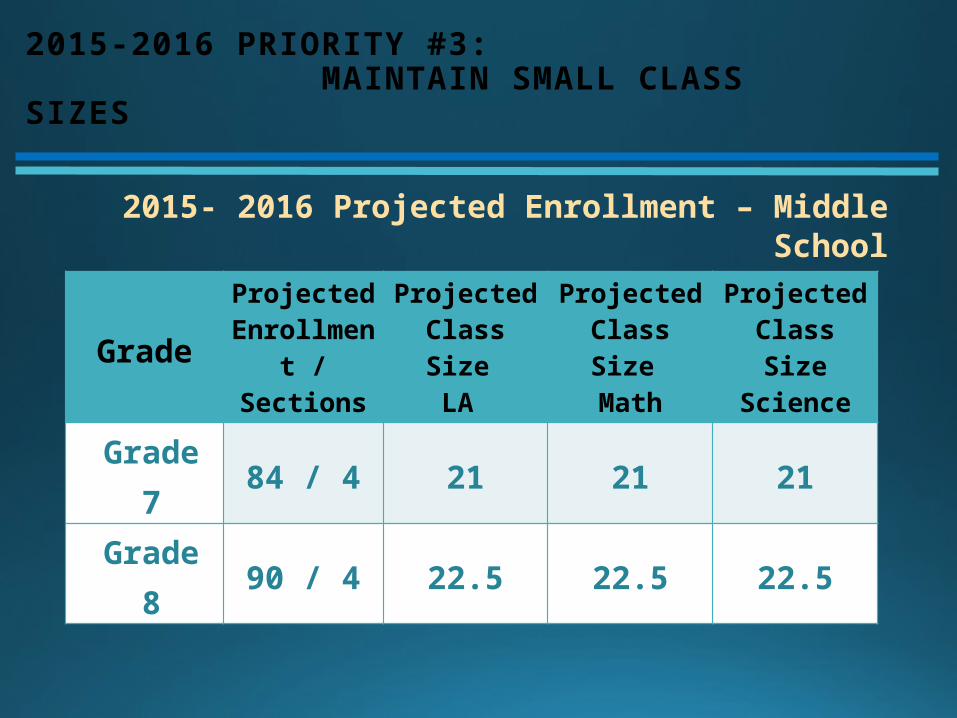
2015-2016 PRIORITY #3: MAINTAIN SMALL CLASS SIZES
GradeProjected
Enrollment / Sections
Projected Class Size
LA
Projected Class Size
Math
Projected Class SizeScience
Grade 7 84 / 4 21 21 21
Grade 8 90 / 4 22.5 22.5 22.5
2015- 2016 Projected Enrollment – Middle School
2015-2016 PRIORITY #3: MAINTAIN SMALL CLASS SIZES

High School Class Sizes
In a small high school such as Litchfield’s, class sizes are driven by several factors that play
with the simple arithmetic. Those factors are: number of students who elect a class,
weighted classes (AP, Honors, and Academic); heavily-enrolled core classes (band and chorus),
and specialty courses with only one section, called singletons (AP classes, Tech-Ed, World
Languages, art).
Consider the junior class, for example, with 84 students. Simple division would yield four
English classes with 21 students each. But, there may be only 12 juniors who elect AP
Language and Composition and 48 students who want Honors English. The schedule then
becomes further complicated when, of the 48 students taking Honors English, 20 are in Band
and cannot take English during that particular block. If 14 of the 20 Honors/Band students are
also taking AP US History, another singleton class, an extra section of English may now be
needed to cover the inflexibilities caused by selecting these three classes.
Litchfield has made a commitment to do the best it possibly can in honoring students’
individual program needs through flexible scheduling and recently through the flexible
(asynchronous) scheduling of a few virtual high school courses.

2014 - 2015 Class Size ACTUALS: LITCHFIELD HIGH SCHOOL
Grade EnrollmentRange
LA Range Math
RangeScience
Grade 9 69 8 - 19 7 - 16 7 - 17
Grade 10 75 9 - 23 11 - 24 7 - 24
Grade 11 84 12 - 20 10 - 17 8 - 19
Grade 12 70 8 - 18 4 - 23 5 - 20
Increase of 18 students next year: 88 freshmen incoming, 70 seniors outgoing
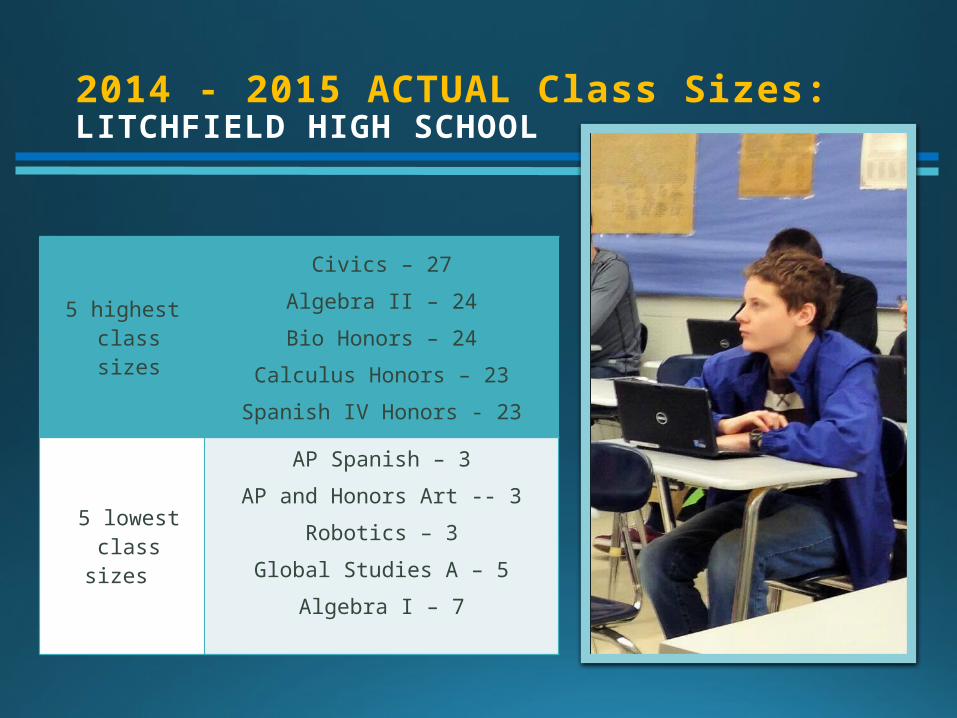
2014 - 2015 ACTUAL Class Sizes: LITCHFIELD HIGH SCHOOL
5 highest class sizes
Civics – 27
Algebra II – 24
Bio Honors – 24
Calculus Honors – 23
Spanish IV Honors - 23
5 lowest class sizes
AP Spanish – 3
AP and Honors Art -- 3
Robotics – 3
Global Studies A – 5
Algebra I – 7
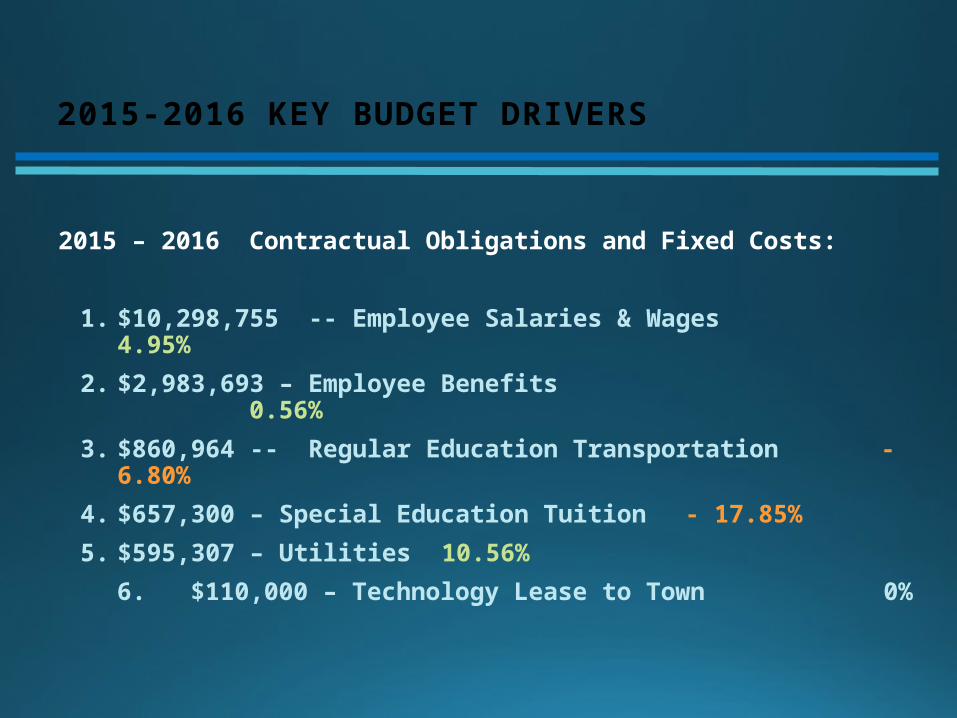
2015-2016 KEY BUDGET DRIVERS
2015 – 2016 Contractual Obligations and Fixed Costs:
1. $10,298,755 -- Employee Salaries & Wages 4.95%
2. $2,983,693 – Employee Benefits 0.56%
3. $860,964 -- Regular Education Transportation - 6.80%
4. $657,300 – Special Education Tuition - 17.85%
5. $595,307 – Utilities 10.56%
6. $110,000 – Technology Lease to Town 0%
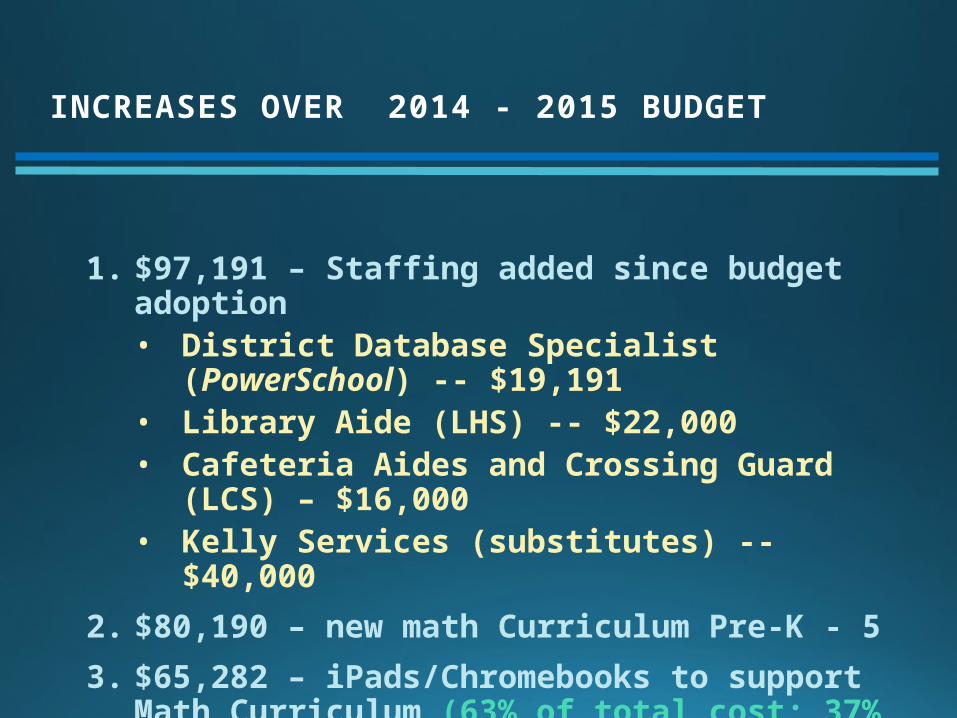
INCREASES OVER 2014 - 2015 BUDGET
1. $97,191 – Staffing added since budget adoption• District Database Specialist (PowerSchool) -- $19,191• Library Aide (LHS) -- $22,000• Cafeteria Aides and Crossing Guard (LCS) – $16,000• Kelly Services (substitutes) -- $40,000
2. $80,190 – new math Curriculum Pre-K - 5
3. $65,282 – iPads/Chromebooks to support Math Curriculum (63% of total cost; 37% grant-funded)
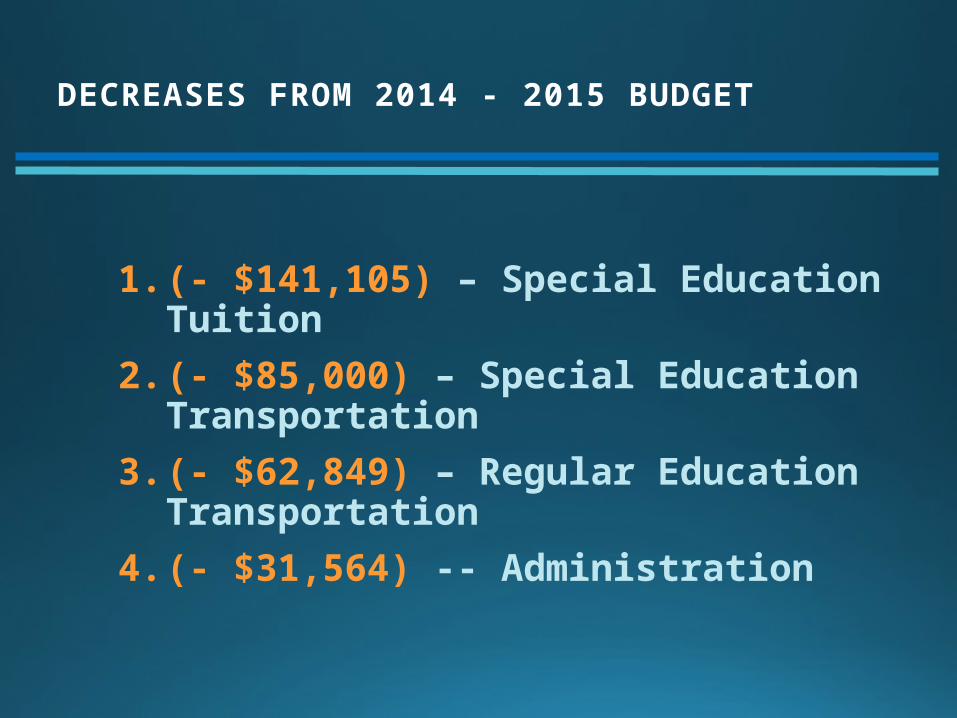
DECREASES FROM 2014 - 2015 BUDGET
1. (- $141,105) – Special Education Tuition2. (- $85,000) – Special Education Transportation3. (- $62,849) – Regular Education Transportation4. (- $31,564) -- Administration

DECREASES TAKEN FEBRUARY 2015
1. (- $28,424) – French -- LHS2. (- $20,000) – Special Education Aide3. (- $1,000) – iPads 4. (- $20,000) – Homebound Instruction5. (- $10,000) – Curriculum Writing6. (- $9,200) – Miscellaneous Supplies7. (- $7,000) – Office Administrative Services
- $95,624
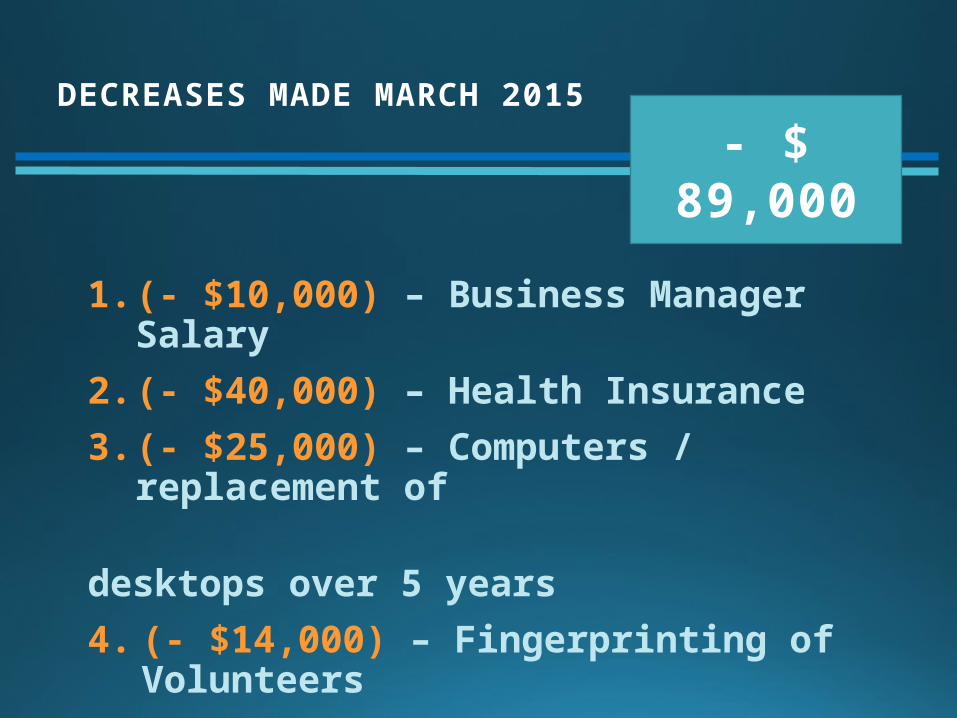
DECREASES MADE MARCH 2015
1. (- $10,000) – Business Manager Salary2. (- $40,000) – Health Insurance3. (- $25,000) – Computers / replacement of desktops over 5 years4. (- $14,000) – Fingerprinting of Volunteers
- $ 89,000

CUTS MADE APRIL 2015
1. (- $51,729) – 1.0 FTE Teacher’s Salary2. (- $20,000) – Intern program3. (- $13,693) – Indoor Track (6 students)4. (- $66,490) – Additional Technology5. (- $40,000) – Pay ½ with end-of-year fund balance6. (- $20,000) – School Lunch subsidy decrease7. (- $14,242) - .5 LIS Secretary8. (- $3,677) – CIS Furniture9. (- $12,500) – Curriculum Update
-$183,981

SALARIES: TEACHERS
Teachers 2014-15 Budget 2015-16Budget % Increase Notes
Regular Instruction
5,670,565.98 5,926,862.32 4.51% Salary increases plus step and track changes; Cut 1.6 FTE
Special Ed Instruction
649,625.00 642,903.32 - 9.99 1.0 FTE (Speech) moved to correct line below; 1.0 FTE SE teacher added 1/2015
Psychologists154,988.00 157,397.00 1.55 Contractual
Speech Pathologists
78,481.44 165,888.50 101.21 1.0 FTE (Speech) moved to correct line
Social Worker105,753.82 + 46,135.13 -56.37 + Correction of salary in this line;
Partial salary moved to Title I grant
Library Services 236,342.00 232,880.19 -1.46 Contractual
Guidance Services260,529.00 348,768.00 33.87 Salary increase and track change
1.0 Guidance for Center School added 7/2014
7,156,285.24 7,520,834.46 5.09
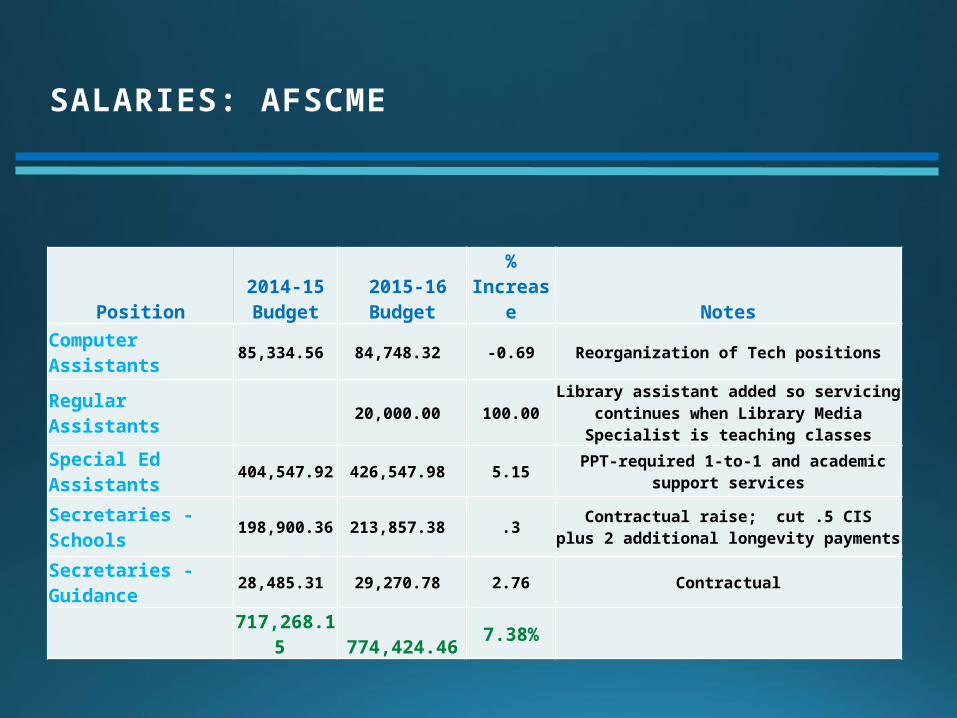
SALARIES: AFSCME
Position2014-15 Budget
2015-16Budget % Increase Notes
Computer Assistants 85,334.56 84,748.32 -0.69 Reorganization of Tech positions
Regular Assistants 20,000.00 100.00 Library assistant added so servicing continues when
Library Media Specialist is teaching classes
Special Ed Assistants 404,547.92 426,547.98 5.15 PPT-required 1-to-1 and academic support services
Secretaries - Schools 198,900.36 213,857.38 .3 Contractual raise; cut .5 CISplus 2 additional longevity payments
Secretaries - Guidance 28,485.31 29,270.78 2.76 Contractual
717,268.15 774,424.46 7.38%

SALARIES: NON-UNION CLASSIFIED
Position2014-15 Budget
2015-16Budget % Increase Notes
Fiscal Services 142,182.36 196,116.00 37.93 Added 1.0 database (PowerSchool) in reorganization of Tech Department
SecretariesCentral Office 59,048.64 60,823.44 3.01 Administrative Assistant to Superintendent
SecretariesSpecial Ed 23,604.84 52,425.88 122.10 Change from .5 Secretary to 1.0 Secretary -
Special Ed
Technology Maintenance 225,814.00 143,212.00 -36.58 Reorganization of Technology Department; moved
1.0 database (PowerSchool) to Fiscal Services
Courier 8,419.96 8,670.42 2.97 Contractual
Nurses 172,002.00 177,163.71 3.00 Contractual
631,071.80 638,411.45 1.16
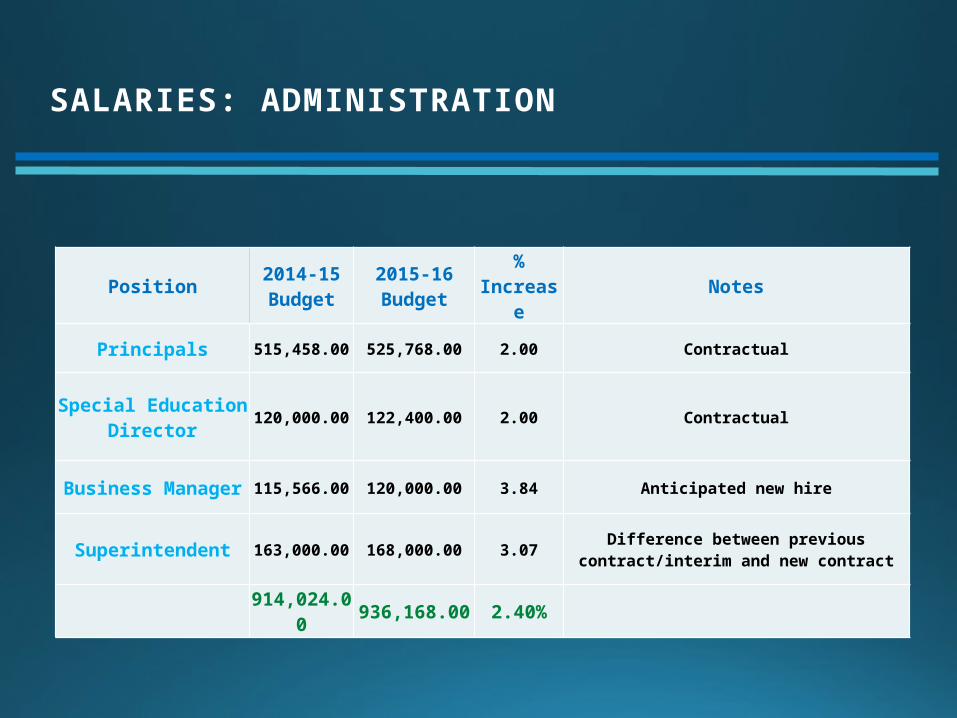
SALARIES: ADMINISTRATION
Position 2014-15 Budget
2015-16Budget % Increase Notes
Principals 515,458.00 525,768.00 2.00 Contractual
Special EducationDirector 120,000.00 122,400.00 2.00 Contractual
Business Manager 115,566.00 120,000.00 3.84 Anticipated new hire
Superintendent 163,000.00 168,000.00 3.07 Difference between previous contract/interim and new contract
914,024.00 936,168.00 2.40%

UTILITIES
Utility 2013-14 Budget
2014-15 Budget
2015-16Projection Difference Notes
Heating Oil $ 221,500.00 $ 221,500.00 $ 200,679.00 $ (20,821.00) 96,000 gallons x $2.0904 per gallon
Electricity $ 192,600.00 $ 192,600.00 $ 256,790.00 $ 64,190.00 1,424,636 khw x $.103 + Delivery Charges
Propane $ 14,800.00 $ 4,200.00 $ 4,110.00 $ (90.00) 2075 units x $1.98 per unit
Water $ 13,100.00 $ 15,000.00 $ 19,800.00 $ 4,800.00 based on actual usage of $19,780 in 2013-14
Medical Waste $ 300.00 $ 300.00 $ 300.00 $ - based on past charges
Prop/Liability Insurance $ 65,400.00 $ 67,000.00 $ 67,000.00 $ -
Sewer $ 14,300.00 $ 18,050.00 $ 18,050.00 $ - based on usage of $16,600 in 2013-14
Alarm Monitor $ 4,200.00 $ 4,200.00 $ 6,200.00 $ 2,000.00 based on additional systems for LHS and LIS
$ 526,200.00 $ 522,850.00 $ 538,450.00 $ 15,600.00

UTILITIES
Utility 2013-14 Budget 2014-15 Budget
Projection 2015-16 Difference Notes
ATT $ 13,000.00 $ 13,000.00 $ 16,500.00 $ 3,500.00 based on $16,327 from 2013-14
ATT Mobility $ 2,200.00 $ 2,600.00 $ 6,600.00 $ 4,000.00 based on $6,539 from 2013-14
$ 15,200.00 $ 15,600.00 $ 23,100.00 $ 7,500.00
Diesel $ 122,500(budgeted as 1 line item)
$ 122,500(budgeted as 1 line item)
$ 87,000.00 29,000 gallons x $3.00 per gallon
Unleaded $ 10,920.00 3,900 gallons x $2.80 per gallon
$ 122,500.00 $122,500.00 $ 97,920.00 ($ 24,580.00)

2015 – 2016 BUDGET SUMMARY
What’s included in….
Regular Education Instruction
Supplies and programs for: Art, Business Education, World Languages, Family Consumer Science, Tech Ed, Language Arts, Math, Music, PE, Science, Social Studies, Kindergarten, Title I, Health
Special EducationInstruction
Supplies and programs for: Learning Centers (Special Ed classroom), Speech & Language, Homebound Instruction, Pre-School
Pupil Services Supplies and programs for psychological services, guidance, health offices, career education, OP/PT services, social work
Library Media, Student Activities, Tech Support
Supplies and programs for library media centers, student activities, and technology support; Cafeteria supplement ($45,000); Free and Reduced lunch
EmployeeSalary, Wages, Benefits
District-wide employee salaries – teachers, specialists, secretaries, counselors, nurses -- and benefits – health insurance, workman’s comp, disability, life insurance, mileage
Administration, Board, Staff Development,
Fiscal ServicesBoard of Education, district-wide administration; Central Office, professional development
for staff; fiscal services
Plant Operations Utilities and technology maintenance; including $110,000 payment for technology lease to Town
Tuition and Transportation Out-of district Special Ed tuitions and transportation; district-wide transportation, athletic transportation, magnet school and Vo-Ag tuitions

2015 – 2016 BUDGET SUMMARY
2012 – 2013Actual
2013 – 2014Actual
2014 – 2015Adopted
2015 – 2016Proposed % Inc.
Regular Education Instruction $198,717 $182,654 $169,090 $243,330 43.91%
Special EducationInstruction $13,870 $21,643 $19,232 $34,260 78.14%
Pupil Services $100,374 $131,494 $117,010 $131,870 12.70%
Library Media, Student Activities, Tech Support $216,666 $170,994 $226,807 $225,591 -0.54%
EmployeeSalary, Wages, Benefits $11,968,957 $12,357,908 $12,779,765 $13,282.447 3.93%
Administration, Board, Staff Development,
Fiscal Services$384,190 $296,129 $280,709 $261,489 -6.85%
Plant Operations $732,969 $680,183 $768,806 $872,087 13.43%
Tuition and Transportation $2,024,085 $2,180,413 $2,219,221 $1,948,924 -12.18%
TOTAL $15,639,827 $15,858,545 $16,600,641 $17,000,000 2.53%
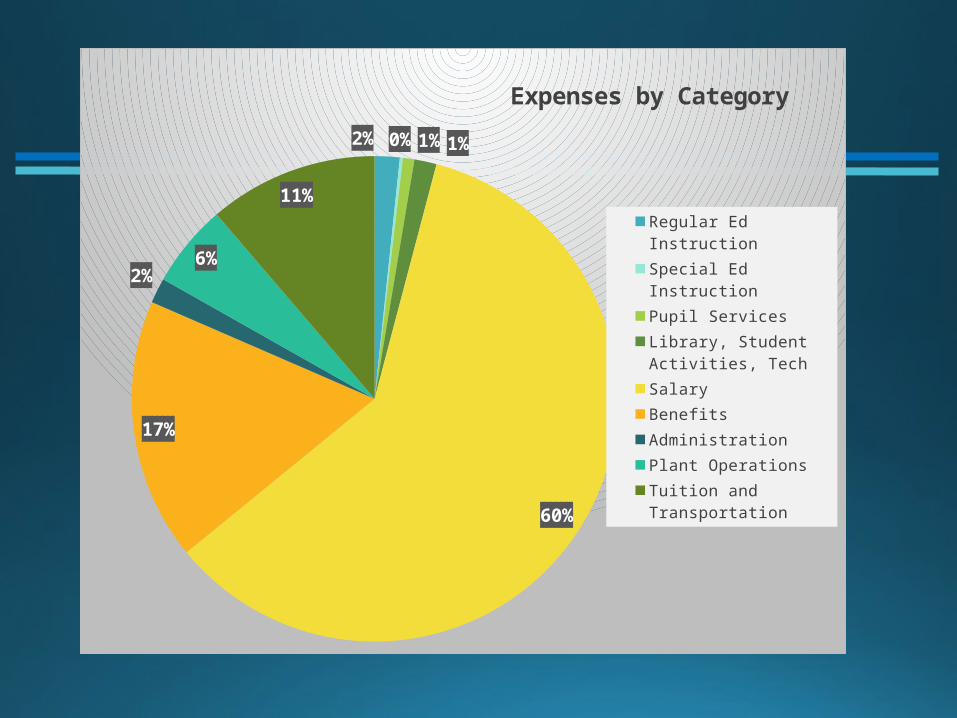
2% 0% 1% 1%
60%
17%
2%
6%
11%
Expenses by Category
Regular Ed Instruction
Special Ed Instruction
Pupil Services
Library, Student Activities, Tech
Salary
Benefits
Administration
Plant Operations
Tuition and Transportation

BUDGET SUMMARY
o 2013–2014 Expended Budget: 1.32%$15,639,827
o 2014–2015 Adopted Budget: 4.68%
$16,580,641
o 2015–2016 BOE Budget: 2.53% $17,000,000
% Year
2.96 2010-11.997 2011-12.99 2012-13
1.32 2013-144.68 2014–15
2.53 2015-16
2.24 Average
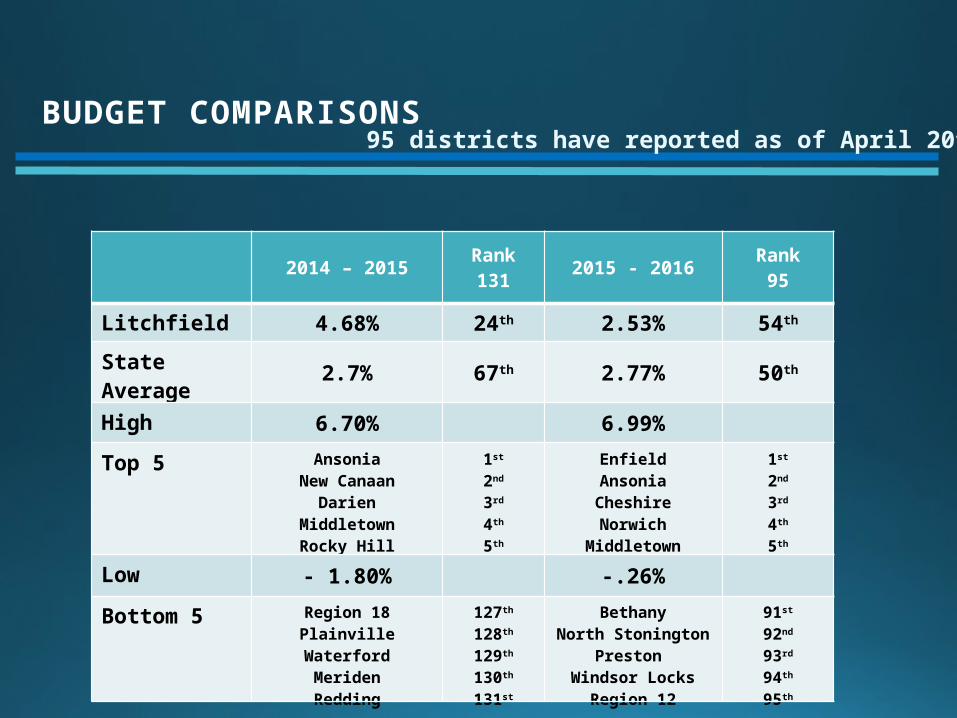
BUDGET COMPARISONS95 districts have reported as of April 20th
2014 – 2015 Rank131 2015 - 2016 Rank
95
Litchfield 4.68% 24th 2.53% 54th
State Average 2.7% 67th 2.77% 50th
High 6.70% 6.99%
Top 5 AnsoniaNew Canaan
DarienMiddletown
Rocky Hill
1st
2nd
3rd
4th
5th
EnfieldAnsoniaCheshireNorwich
Middletown
1st
2nd
3rd
4th
5th
Low - 1.80% -.26%
Bottom 5 Region 18Plainville
WaterfordMeridenRedding
127th
128th
129th
130th
131st
BethanyNorth Stonington
Preston Windsor Locks
Region 12
91st
92nd
93rd
94th
95th
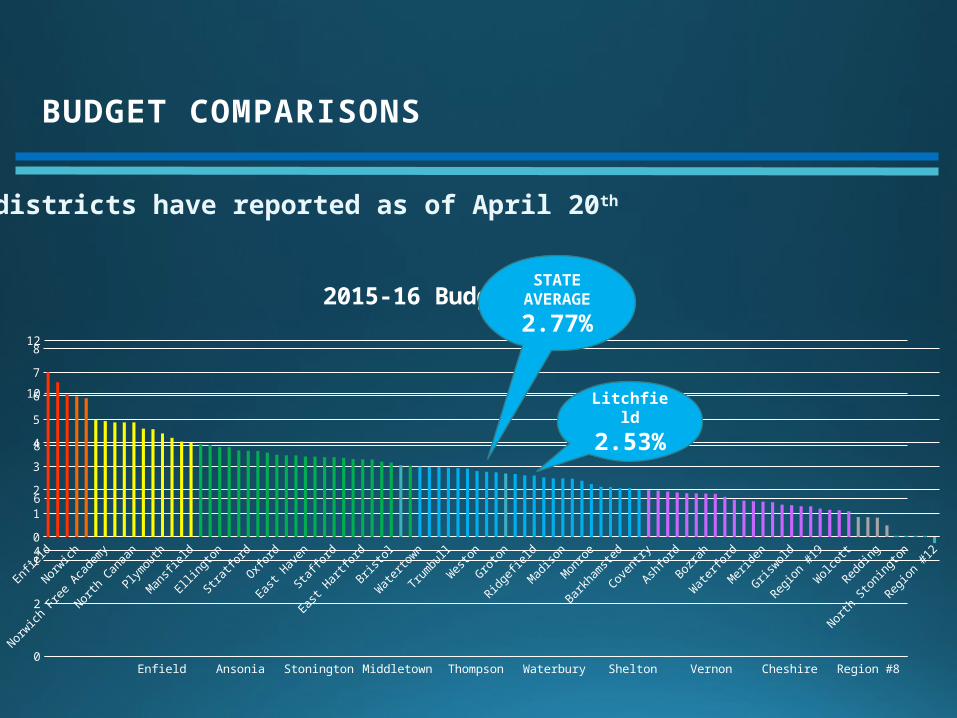
BUDGET COMPARISONS
95 districts have reported as of April 20th
Enfield Ansonia Stonington Middletown Thompson Waterbury Shelton Vernon Cheshire Region #80
2
4
6
8
10
12
2015-16 Budgets (%)
-1
0
1
2
3
4
5
6
7
8
Litchfield
2.53%
STATE AVERAGE
2.77%