2015/16 full year results - delarue.com report/presentation-reports... · de le rue 2015/16 full...
TRANSCRIPT

De Le Rue 2015/16 Full Year Results Page 1
2015/16 Full Year Results
De La Rue plc
24 May 2016
De Le Rue 2015/16 Full Year Results
Disclaimer
Page 2
This presentation has been prepared by De La Rue plc (“De La Rue”). This presentation includes statements that
are, or may be deemed to be, “forward-looking statements”. These forward-looking statements can be identified by
the use of forward-looking terminology, including the terms "believes", "estimates", "anticipates", "expects", "intends",
"plans", "goal", "target", "aim", "may", "will", "would", "could" or "should" or, in each case, their negative or other
variations or comparable terminology. These forward-looking statements include all matters that are not historical
facts. They appear in a number of places throughout this presentation and the information incorporated by reference
into this presentation, and include statements regarding the intentions, beliefs or current expectations of the
directors, De La Rue or the Group concerning, amongst other things, the results of operations, financial condition,
liquidity, prospects, growth, strategies and dividend policy of De La Rue and the industry in which it operates.
By their nature, forward-looking statements involve risks and uncertainties because they relate to events and depend
on circumstances that may or may not occur in the future and may be beyond De La Rue's ability to control or
predict. Forward-looking statements are not guarantees of future performance and hence may prove to be
erroneous. The Group's actual results of operations, financial condition, liquidity, dividend policy and the development
of the industry in which it operates may differ materially from the impression created by the forward-looking
statements contained in this presentation and/or the information incorporated by reference into this presentation. In
addition, even if the results of operations, financial condition, liquidity and dividend policy of the Group and the
development of the industry in which it operates are consistent with the forward-looking statements contained in this
presentation and/or the information incorporated by reference into this presentation, those results or developments
may not be indicative of results or developments in subsequent periods.
Other than in accordance with its legal or regulatory obligations (including under the Listing Rules, the Disclosure and
Transparency Rules and the Prospectus Rules), De La Rue does not undertake any obligation to update or revise
publicly any forward-looking statement, whether as a result of new information, future events or otherwise.

De Le Rue 2015/16 Full Year Results
Agenda
Page 3
Overview
Martin Sutherland
Financial performance
Jitesh Sodha
Operational review and strategic update
Martin Sutherland
Q&A
De Le Rue 2015/16 Full Year Results
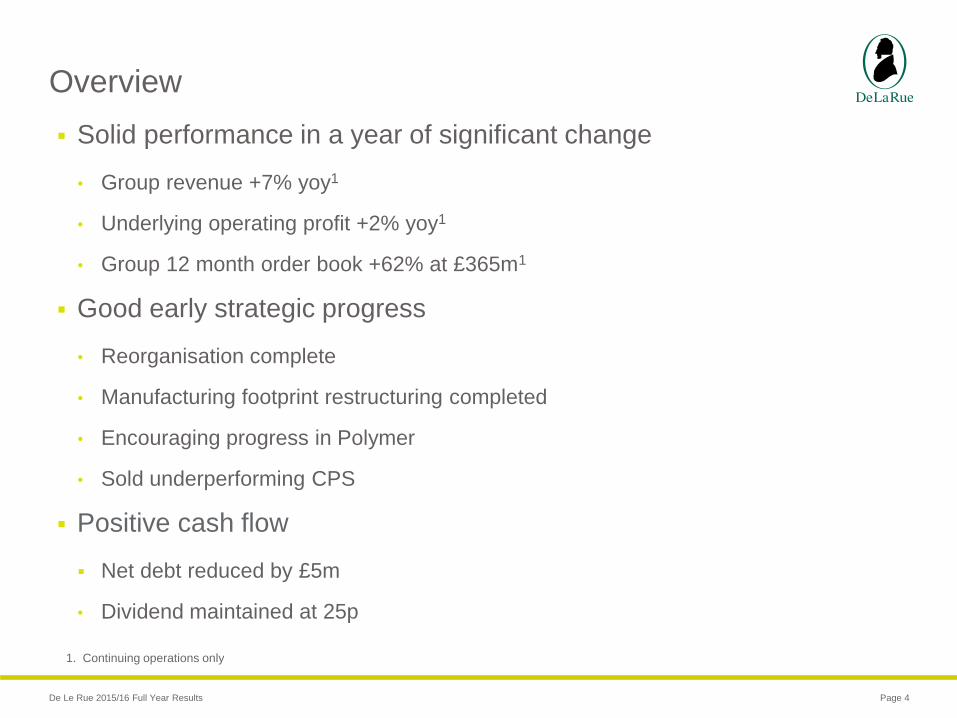
Solid performance in a year of significant change
• Group revenue +7% yoy1
• Underlying operating profit +2% yoy1
• Group 12 month order book +62% at £365m1
Good early strategic progress
• Reorganisation complete
• Manufacturing footprint restructuring completed
• Encouraging progress in Polymer
• Sold underperforming CPS
Positive cash flow
Net debt reduced by £5m
• Dividend maintained at 25p
Page 4
Overview
1. Continuing operations only

De Le Rue 2015/16 Full Year Results
Agenda
Page 5
Overview
Martin Sutherland
Financial performance
Jitesh Sodha
Operational review and strategic update
Martin Sutherland
Q&A

De Le Rue 2015/16 Full Year Results
Financial overview
Page 6
2015/16*
£m
2014/15*
£m
Change
%
Revenue 454.5 422.8 7%
Underlying operating profit** 70.4 69.1 2%
Underlying operating margin** 15.5% 16.3% (80bpts)
Underlying profit before tax** 58.5 57.5 2%
Taxation before exceptionals (8.6) (10.1) -
Underlying profit after tax** 49.9 47.4 5%
Underlying earnings per share** 48.1p 46.1p 4%
Reported earnings per share 46.8p 31.8p 47%
Dividend per share 25.0p 25.0p 0%
7.16.5
2015/16 2014/15
Banknote volumes (bn notes)
H2
H1
10,000 9,400
2015/16 2014/15
Paper volumes (tonnes)
H2
H1
365
226
March 2016 March 2015
Group 12 month order book (£m)
* Continuing operations only
**Before exceptional items
De Le Rue 2015/16 Full Year Results
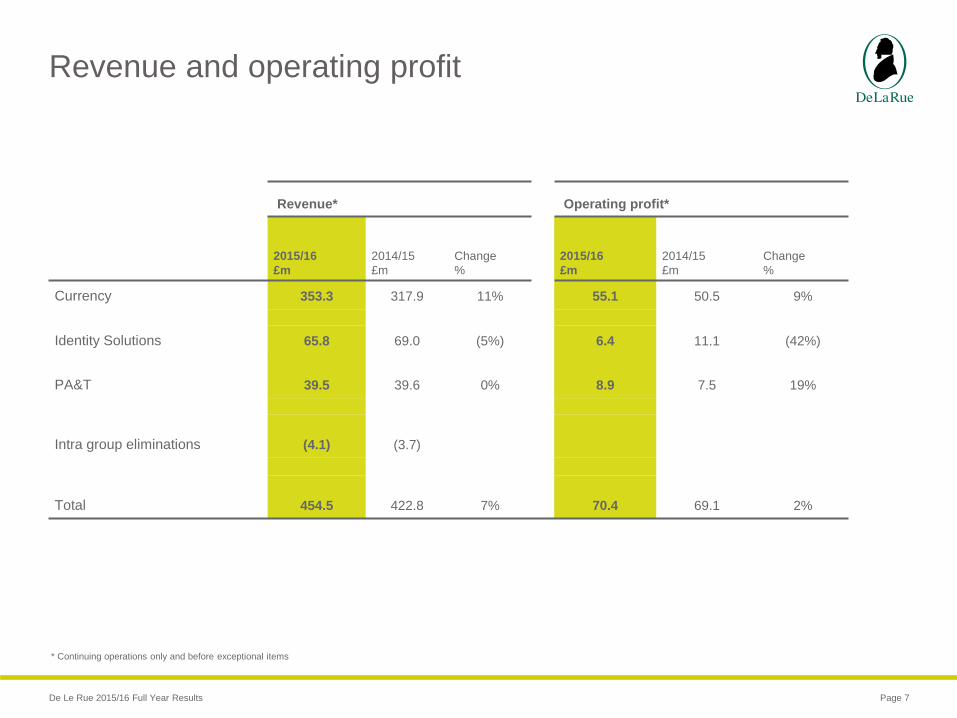
Revenue and operating profit
Page 7
Revenue* Operating profit*
2015/16
£m
2014/15
£m
Change
%
2015/16
£m
2014/15
£m
Change
%
Currency 353.3 317.9 11% 55.1 50.5 9%
Identity Solutions 65.8 69.0 (5%) 6.4 11.1 (42%)
PA&T 39.5 39.6 0% 8.9 7.5 19%
Intra group eliminations (4.1) (3.7)
Total 454.5 422.8 7% 70.4 69.1 2%
* Continuing operations only and before exceptional items
De Le Rue 2015/16 Full Year Results
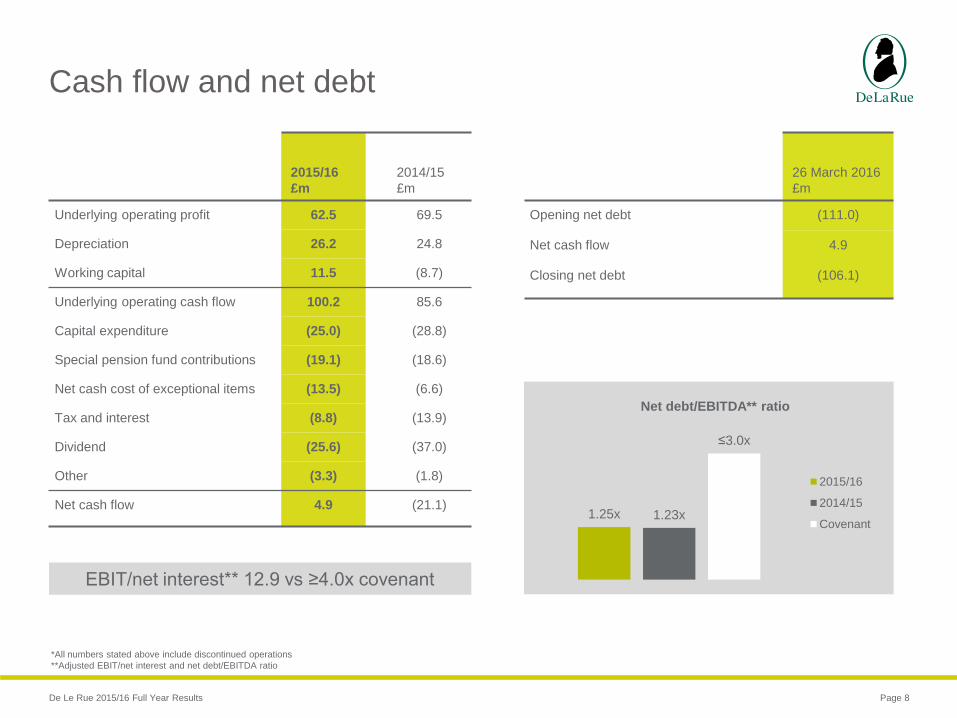
Cash flow and net debt
Page 8
2015/16
£m
2014/15
£m
Underlying operating profit 62.5 69.5
Depreciation 26.2 24.8
Working capital 11.5 (8.7)
Underlying operating cash flow 100.2 85.6
Capital expenditure (25.0) (28.8)
Special pension fund contributions (19.1) (18.6)
Net cash cost of exceptional items (13.5) (6.6)
Tax and interest (8.8) (13.9)
Dividend (25.6) (37.0)
Other (3.3) (1.8)
Net cash flow 4.9 (21.1)
*All numbers stated above include discontinued operations
**Adjusted EBIT/net interest and net debt/EBITDA ratio
26 March 2016
£m
Opening net debt (111.0)
Net cash flow 4.9
Closing net debt (106.1)
EBIT/net interest** 12.9 vs ≥4.0x covenant
1.25x 1.23x
≤3.0x
Net debt/EBITDA** ratio
2015/16
2014/15
Covenant

De Le Rue 2015/16 Full Year Results
Exceptional items on continuing operations
Page 9
Continuing operations2015/16
£m
2014/15
£m
Gain on sale of surplus land 9.5 ─
Release of warranty provision 1.3 3.0
Site relocation and restructuring (9.2) (2.8)
Asset impairment (5.2) (3.8)
Invocation of guarantees ─ (13.3)
Total exceptional items on continuing operations (3.6) (16.9)
Net cash cost of exceptional items for continuing operations (12.5) (4.9)
Tax credit on exceptional items for continuing operations2015/16
£m
2014/15
£m
Credit in the period 1.8 2.4
Prior year tax credit 0.5 ─
Total tax credit on exceptional items 2.3 2.4

De Le Rue 2015/16 Full Year Results
Disposal of CPS
Page 10
Underperformance continued in H2; FY operating loss of £7.9m
Sale of CPS completed on 22 May 2016
Consideration• £2.1m cash consideration upon completion
• £1.5m deferred consideration payable over next two years
• Additional performance related and event driven consideration of maximum
£6.5m
£23.4m non-cash exceptional impairment charges in FY15/16• £5.6m relating to goodwill and software intangibles
• £17.8m relating to inventories
Strategic partnership

De Le Rue 2015/16 Full Year Results
Other finance matters
Page 11
Pension
• Current funding: c£19m in FY16/17, rising by 4% p.a. to 2022
• Triennial valuation process ongoing, expected to complete by July
Dividend
• Full year dividend maintained at 25.0p
• Introducing scrip dividend alternative
De Le Rue 2015/16 Full Year Results
Agenda
Page 12
Overview
Martin Sutherland
Financial performance
Jitesh Sodha
Operational review and strategic update
Martin Sutherland
Q&A
De Le Rue 2015/16 Full Year Results
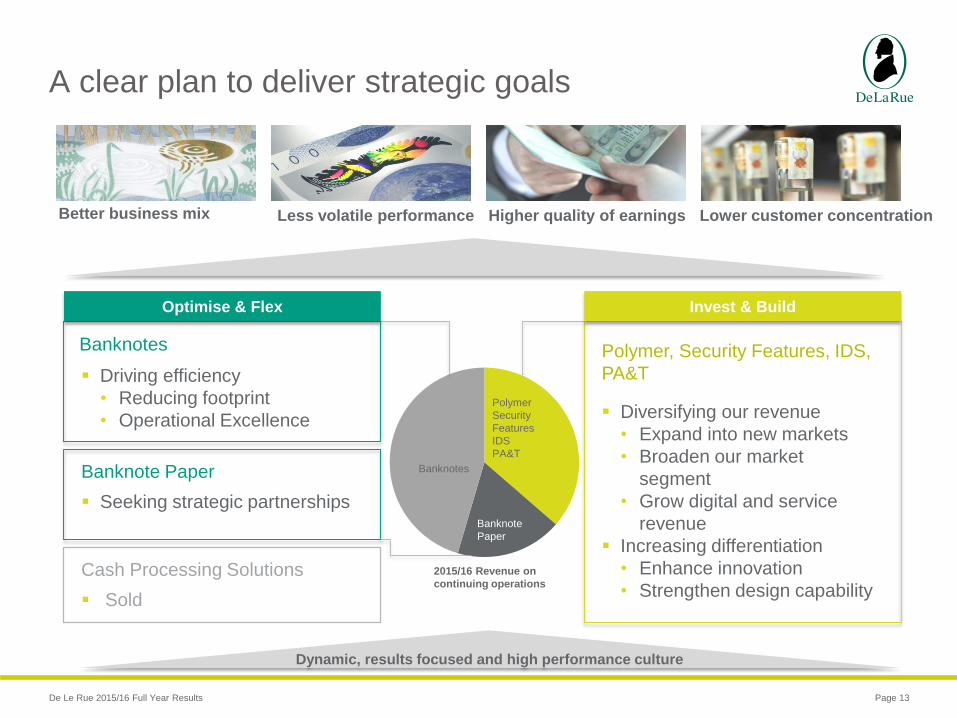
A clear plan to deliver strategic goals
Page 13
Polymer
Security
Features
IDS
PA&T
Banknotes
Cash Processing Solutions
Banknotes
2015/16 Revenue on
continuing operations
Optimise & Flex Invest & Build
Driving efficiency
• Reducing footprint
• Operational Excellence
Sold
Dynamic, results focused and high performance culture
Polymer, Security Features, IDS,
PA&T
Diversifying our revenue
• Expand into new markets
• Broaden our market
segment
• Grow digital and service
revenue
Increasing differentiation
• Enhance innovation
• Strengthen design capability
Better business mix Less volatile performance Lower customer concentrationHigher quality of earnings
Banknote Paper
Seeking strategic partnershipsBanknote
Paper
De Le Rue 2015/16 Full Year Results
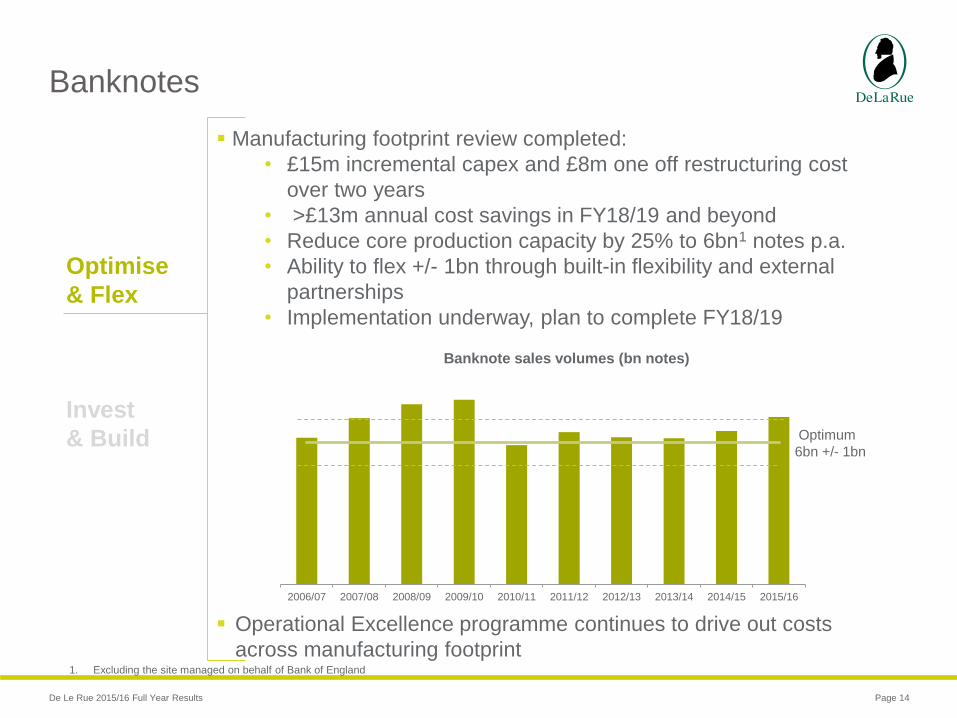
Banknotes
Page 14
Optimise
& Flex
Invest
& Build
Manufacturing footprint review completed:
• £15m incremental capex and £8m one off restructuring cost
over two years
• >£13m annual cost savings in FY18/19 and beyond
• Reduce core production capacity by 25% to 6bn1 notes p.a.
• Ability to flex +/- 1bn through built-in flexibility and external
partnerships
• Implementation underway, plan to complete FY18/19
Operational Excellence programme continues to drive out costs
across manufacturing footprint
2006/07 2007/08 2008/09 2009/10 2010/11 2011/12 2012/13 2013/14 2014/15 2015/16
Banknote sales volumes (bn notes)
Optimum
6bn +/- 1bn
1. Excluding the site managed on behalf of Bank of England

De Le Rue 2015/16 Full Year Results
Banknote Paper
Page 15
Continued to drive out costs to offset pricing pressure
• 14% reduction in headcount
• 10% reduction in unit production costs
• 23% increase in productivity1
Increased machine utilisation, volumes +6% to 10,000 tonnes
Constructive discussions on strategic partnerships ongoing
13%
24%
14%10%
9%
6%
6%
5%
13%
Commercial market by annual issues2
DLR
Peer 1
Peer 2
Peer 3
Peer 4
Peer 5
Peer 6
Peer 7
Other
1. Productivity is measured by tonnes per full time employee
2. De La Rue estimates
Optimise
& Flex
Invest
& Build

De Le Rue 2015/16 Full Year Results
Polymer
Page 16
41%
3%~1-6%
51%
Commercial paper market PolymerOverspill from SPMs State paper mills (SPM)
14Issuing
authorities
17Denominations
issued
Global substrate market1
(c162k tonnes)
1. De La Rue estimates
Optimise
& Flex
Invest
& Build
5%Market
share
Polymer market expected to grow significantly in next ten years;
dedicated sales to capture growth opportunities
Significant three year contract with a large customer; increased DLR
nominal market share to c5%
2015 2020 2025
Polymer market growth by volume1

De Le Rue 2015/16 Full Year Results
Polymer
Page 17
The only vertically
integrated polymer
supplier
Extensive polymer banknote
printing experience
Industry leading design capability
Polymer substrate manufacturing
Polymer-adapted security features
of patent filings in
FY15/16 were
polymer related
50%
Optimise
& Flex
Invest
& Build

De Le Rue 2015/16 Full Year Results
Security Features1
Page 18
Attractive market
• Commercially available
• Fosters long term contracts
• Value within a banknote shifting from print and paper towards
security features
• IP creates high barriers to entry
1. Previously Components
Global banknote market
(c162bn notes)
Optimise
& Flex
Invest
& Build
Commercial security
thread suppliers
15%
31%
30%
10%
5%
4% 5%
DLR
Peer 1
Peer 2
Peer 3
Peer 4
Peer 5
Other
With threads 147bnnotes
Without thread15bnnotes
A material contract came to an end, but good visibility of replacement
contracts
De Le Rue 2015/16 Full Year Results
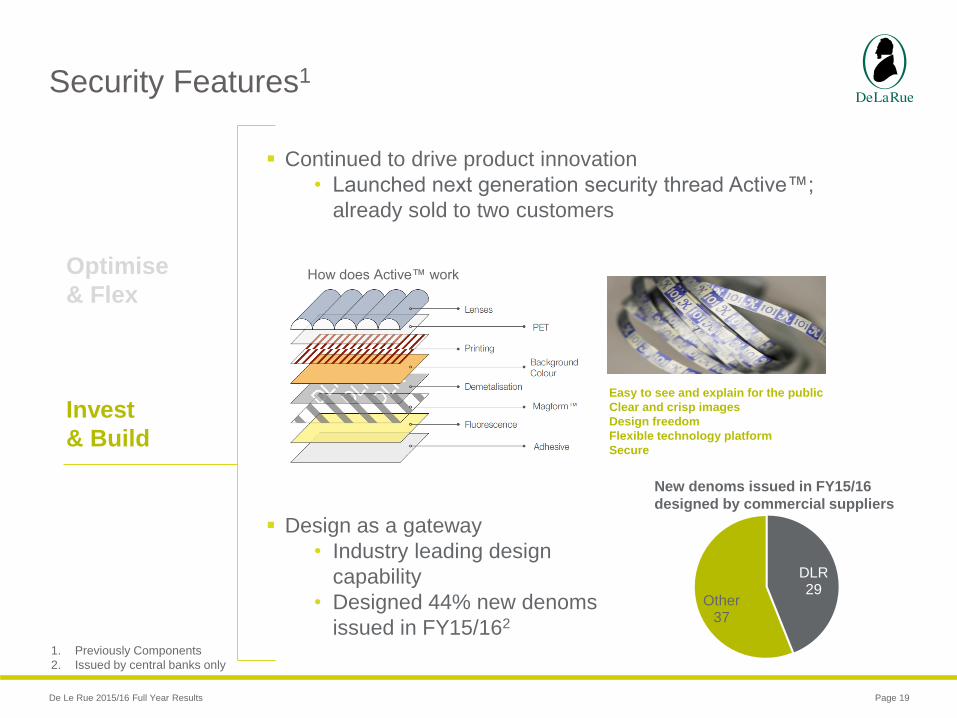
Security Features1
Page 19
1. Previously Components
2. Issued by central banks only
Continued to drive product innovation
• Launched next generation security thread Active™;
already sold to two customers
Easy to see and explain for the public
Clear and crisp images
Design freedom
Flexible technology platform
Secure
DLR29
Other37
New denoms issued in FY15/16
designed by commercial suppliers
Design as a gateway
• Industry leading design
capability
• Designed 44% new denoms
issued in FY15/162
Optimise
& Flex
Invest
& Build
How does Active™ work
De Le Rue 2015/16 Full Year Results
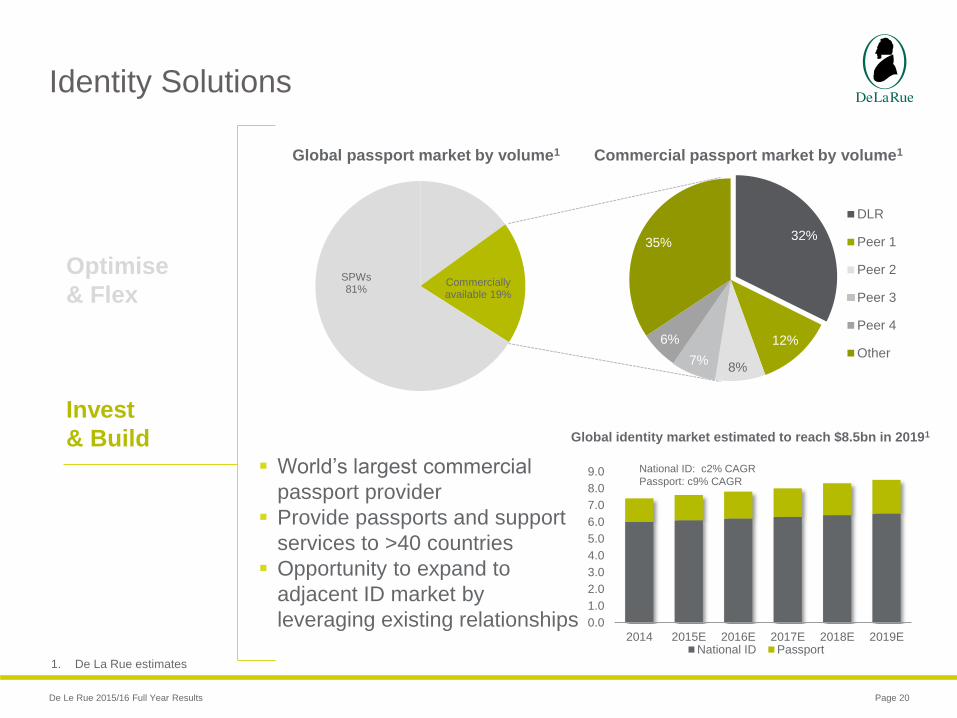
Identity Solutions
Page 20
1. De La Rue estimates
Optimise
& Flex
Invest
& Build World’s largest commercial
passport provider
Provide passports and support
services to >40 countries
Opportunity to expand to
adjacent ID market by
leveraging existing relationships
Commercially available 19%
SPWs 81%
Global passport market by volume1
32%
12%
8%7%
6%
35%
DLR
Peer 1
Peer 2
Peer 3
Peer 4
Other
Commercial passport market by volume1
0.0
1.0
2.0
3.0
4.0
5.0
6.0
7.0
8.0
9.0
2014 2015E 2016E 2017E 2018E 2019ENational ID Passport
National ID: c2% CAGR
Passport: c9% CAGR
Global identity market estimated to reach $8.5bn in 20191
De Le Rue 2015/16 Full Year Results
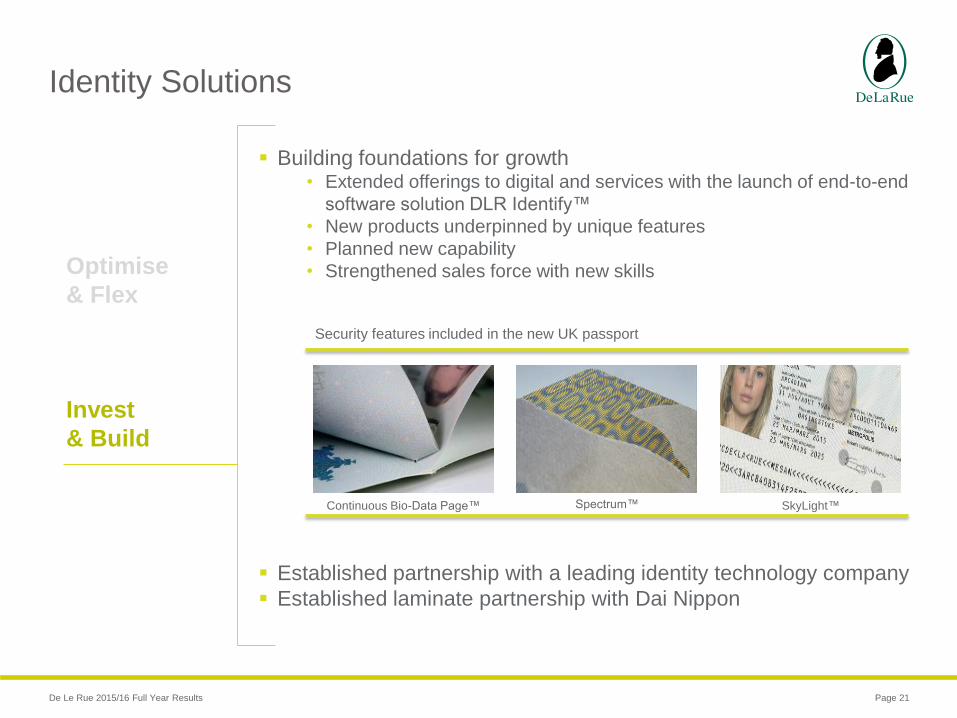
Identity Solutions
Page 21
Optimise
& Flex
Invest
& Build
Building foundations for growth• Extended offerings to digital and services with the launch of end-to-end
software solution DLR Identify™
• New products underpinned by unique features
• Planned new capability
• Strengthened sales force with new skills
Established partnership with a leading identity technology company
Established laminate partnership with Dai Nippon
Security features included in the new UK passport
Continuous Bio-Data Page™ Spectrum™ SkyLight™

De Le Rue 2015/16 Full Year Results
Product Authentication & Traceability1
Page 22
1. Previously Security Products
Optimise
& Flex
Invest
& Build
B2G: protecting tax revenue B2B: protecting product integrity
Continued to drive innovation
• Launched full track and trace solution DLR Certify™
• Converted Spectrum™ for tax stamp
Security print centre of excellence in Malta
• Tobacco
• Alcohol
Leveraging our
knowledge and
relationships with
our existing
customers
• Electronic goods
• Alcohol
• Luxury goods
Expanding into
larger and more
dynamic B2B
market
De Le Rue 2015/16 Full Year Results
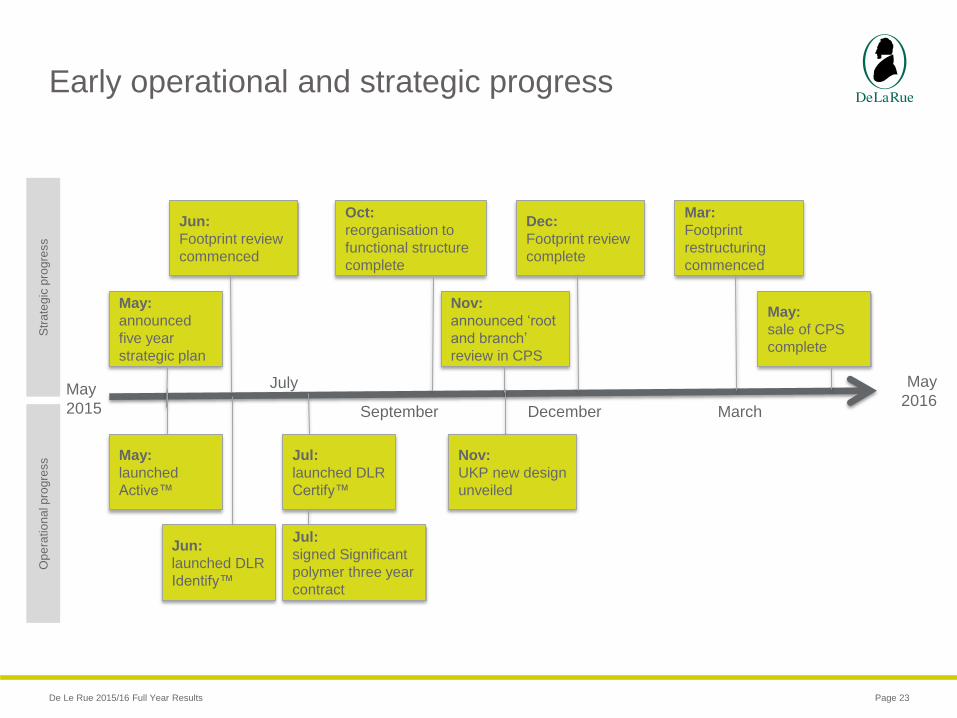
Early operational and strategic progress
Page 23
May
2015
May
2016March
July
September December
May:
announced
five year
strategic plan
Dec:
Footprint review
complete
May:
launched
Active™
Jul:
launched DLR
Certify™
Jun:
launched DLR
Identify™
Nov:
UKP new design
unveiled
May:
sale of CPS
complete
Jun:
Footprint review
commenced
Oct:
reorganisation to
functional structure
complete
Nov:
announced ‘root
and branch’
review in CPS
Str
ate
gic
pro
gre
ss
Op
era
tio
na
l pro
gre
ss
Jul:
signed Significant
polymer three year
contract
Mar:
Footprint
restructuring
commenced
De Le Rue 2015/16 Full Year Results
Summary
Page 24
Solid performance in a year of significant change
Early momentum in strategy implementation - key issues being
addressed
Positive cash flow
Outlook• 12 month closing order book provides good visibility
• Despite a material contract coming to an end, full year expectations
unchanged
De Le Rue 2015/16 Full Year Results
Agenda
Page 25
Overview
Martin Sutherland
Financial performance
Jitesh Sodha
Operational review and strategic update
Martin Sutherland
Q&A

De Le Rue 2015/16 Full Year Results Page 26
Appendices
© De La Rue plc 2016
De Le Rue 2015/16 Full Year Results
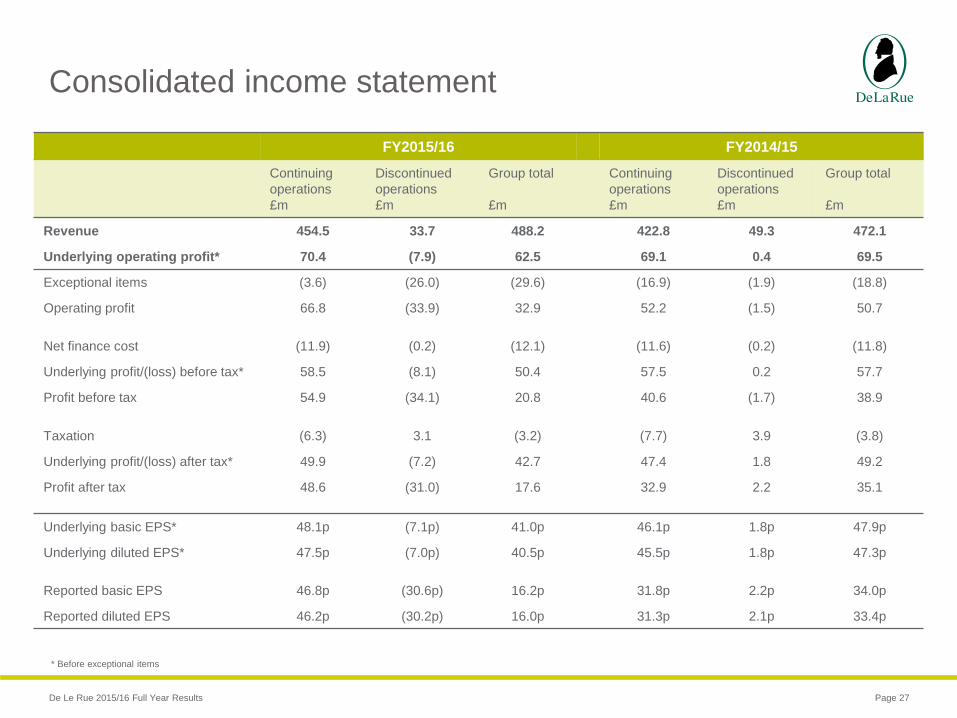
Consolidated income statement
Page 27
FY2015/16 FY2014/15
Continuing
operations
£m
Discontinued
operations
£m
Group total
£m
Continuing
operations
£m
Discontinued
operations
£m
Group total
£m
Revenue 454.5 33.7 488.2 422.8 49.3 472.1
Underlying operating profit* 70.4 (7.9) 62.5 69.1 0.4 69.5
Exceptional items (3.6) (26.0) (29.6) (16.9) (1.9) (18.8)
Operating profit 66.8 (33.9) 32.9 52.2 (1.5) 50.7
Net finance cost (11.9) (0.2) (12.1) (11.6) (0.2) (11.8)
Underlying profit/(loss) before tax* 58.5 (8.1) 50.4 57.5 0.2 57.7
Profit before tax 54.9 (34.1) 20.8 40.6 (1.7) 38.9
Taxation (6.3) 3.1 (3.2) (7.7) 3.9 (3.8)
Underlying profit/(loss) after tax* 49.9 (7.2) 42.7 47.4 1.8 49.2
Profit after tax 48.6 (31.0) 17.6 32.9 2.2 35.1
Underlying basic EPS* 48.1p (7.1p) 41.0p 46.1p 1.8p 47.9p
Underlying diluted EPS* 47.5p (7.0p) 40.5p 45.5p 1.8p 47.3p
Reported basic EPS 46.8p (30.6p) 16.2p 31.8p 2.2p 34.0p
Reported diluted EPS 46.2p (30.2p) 16.0p 31.3p 2.1p 33.4p
* Before exceptional items

De Le Rue 2015/16 Full Year Results
Exceptional items on discontinued operations
Page 28
Discontinued operations
2015/16
£m
2014/15
£m
Site closures and restructuring (2.6) (1.9)
Re-assessment of carrying value following classification as an asset for sale (23.4) ─
Total exceptional items on discontinued operations (26.0) (1.9)
Net cash cost of exceptional items for discontinued operations (1.0) (1.7)
Tax credit on exceptional items for discontinued operations
2015/16
£m
2014/15
£m
Credit in the year 0.3 0.4
Prior year tax credits 1.9 1.9
Total tax credit on exceptional items 2.2 2.3