2015 update of rpu infrastructure study (draft rev1)
TRANSCRIPT

2015 Update of the RPU Infrastructure Study
Rochester Public Utilities
Project No. 82902
June 2015

9400 Ward Parkway \\\\ Kansas City, MO 64114
OOOO 816-333-9400 \\\\ FFFF 816-333-3690 \\\\ burnsmcd.com
June 24, 2015 Mr. Wally Schlink Director of Power Resources & Customer Relations Rochester Public Utilities 4000 East River Road Rochester, MN 55906 Re: 2015 Update to the Rochester Public Utilities Infrastructure Plan Dear Mr. Schlink: Rochester Public Utilities (RPU) retained Burns & McDonnell Engineering Co. (BMcD) to conduct an update to the RPU Infrastructure Plan that was started in 2005. The objective was to analyze the power supply needs of RPU from 2016 through 2035 in order to identify short-term, intermediate-term, and long-term infrastructure requirements for providing reliable, low cost electric power and thermal energy to its customers. The following provides the overall highlights of the infrastructure plan update:
1. Positions RPU for long-term power supply with the expiration of the SMMPA Power Sales Contract (PSC) in 2030
2. Reduces direct dependence from coal resources within the RPU portfolio by 2030 and significantly reduces carbon emissions
3. Meets renewable standards and objectives: 25 percent by 2025 renewable standard, 1.5 percent solar standard, 1.5 percent conservation standard
4. Has the flexibility to accommodate potential sharp increases or decreases in load and energy requirements due to Mayo Clinic, Destination Medical Center development, or customer solar
5. Positions RPU for short-term and long-term compliance with environmental regulations 6. Retires an inefficient resource and modernizes the RPU generation fleet with high
efficiency and low emission units 7. Expands partnership opportunities with the Mayo Clinic and other combined heat and
power prospects
Mr. Wally Schlink Rochester Public Utilities June 24, 2015 Page 2 BMcD is pleased to submit our report to RPU detailing the results of the assessment. It has been a pleasure to assist RPU with this evaluation. If you have any questions regarding the information presented herein, please feel free to contact me at 816-822-3459 or [email protected]. Sincerely,
Mike Borgstadt, PE Manager, Business Consulting MEB/meb 2015 Update of the RPU Infrastructure Plan

2015 Update of the RPU Infrastructure Study
prepared for
Rochester Public Utilities
Rochester, Minnesota
Project No. 82902
June 2015
prepared by
Burns & McDonnell Engineering Company, Inc. Kansas City, Missouri
COPYRIGHT © 2015 BURNS & McDONNELL ENGINEERING COMPANY, INC.

2015 Update of the RPU Infrastructure Study Table of Contents
Rochester Public Utilities TOC-1 Burns & McDonnell
TABLE OF CONTENTS
Page No.
LIST OF ABBREVIATIONS ............................................................................................. I
STATEMENT OF LIMITATIONS ................................................................................... III
EXECUTIVE SUMMARY ................................................................................... 1-1
1.1 Study Objectives .................................................................................................. 1-1
1.2 Review of Power Supply Conditions ................................................................... 1-2
1.2.1 Overall Electricity Industry Trends ...................................................... 1-2
1.2.2 MISO Energy Market ........................................................................... 1-3
1.2.3 RPU Load and Resources ..................................................................... 1-5
1.3 Resource Analysis & Strategy ............................................................................. 1-7
1.3.1 New Resources...................................................................................... 1-7
1.3.2 Power Supply Analysis ......................................................................... 1-7
1.4 Summary .............................................................................................................. 1-8
1.5 Infrastructure Plan Highlights ............................................................................ 1-10
INTRODUCTION ............................................................................................... 2-1
2.1 Rochester Public Utilities Overview .................................................................... 2-1
2.2 Study Objectives .................................................................................................. 2-1
2.3 Study Background ................................................................................................ 2-1
2.4 Study Methodology .............................................................................................. 2-1
2.5 Study Organization .............................................................................................. 2-2
REVIEW OF POWER SUPPLY CONDITIONS ................................................. 3-1
3.1 General Power Supply Assumptions ................................................................... 3-1
3.2 Overall Electricity Industry Trends ..................................................................... 3-1
3.3 MISO Energy Market .......................................................................................... 3-3
3.4 Load Forecast ....................................................................................................... 3-6
3.5 Power Supply Resources...................................................................................... 3-9
3.5.1 RPU Local Power Generating Resources ............................................. 3-9
3.5.2 Southern Minnesota Municipal Power Agency Contract ................... 3-10
3.6 Balance of Loads and Resources ....................................................................... 3-10
3.7 Mayo Clinic Steam ............................................................................................ 3-11
3.8 Forecasts ............................................................................................................ 3-12
3.8.1 Fuel Cost Forecast............................................................................... 3-13
3.8.2 Market Energy Cost Forecast .............................................................. 3-14
3.8.3 Market Capacity Cost Forecast ........................................................... 3-15
3.9 New Generation Resources ................................................................................ 3-15
RESOURCE ANALYSIS & STRATEGY ........................................................... 4-1

2015 Update of the RPU Infrastructure Study Table of Contents
Rochester Public Utilities TOC-2 Burns & McDonnell
4.1 Power Supply Plan Model Development ............................................................. 4-2
4.2 Power Supply Analysis ........................................................................................ 4-2
4.3 Sensitivity Considerations ................................................................................... 4-7
SUMMARY ........................................................................................................ 5-1
5.1 Summary of Key Assumptions and Conclusions................................................. 5-1
5.2 Infrastructure Plan Highlights .............................................................................. 5-2
APPENDIX A – POWER SUPPLY STUDY ASSUMPTIONS
APPENDIX B – NEW RESOURCE TECHNOLOGY ASSESSMENT
APPENDIX C – DISPATCH MODEL RESULTS

2015 Update of the RPU Infrastructure Study Table of Contents
Rochester Public Utilities TOC-3 Burns & McDonnell
LIST OF TABLES
Page No.
Table 1-1: Power Supply Paths and Costs ................................................................................... 1-8
Table 3-1: RPU Historical Energy Conservation and Spending .................................................. 3-9
Table 3-2: New Resource Cost and Performance Summary ..................................................... 3-17
Table 4-1: Power Supply Paths and Costs ................................................................................... 4-4

2015 Update of the RPU Infrastructure Study Table of Contents
Rochester Public Utilities TOC-4 Burns & McDonnell
LIST OF FIGURES
Page No.
Figure 1-1: MISO Energy Market Area .................................................................................... 1-3
Figure 1-2: MISO Energy Resource Mix (2014) ...................................................................... 1-3
Figure 1-3: MISO Local Resource Zones ................................................................................. 1-4
Figure 1-4: MISO Energy Historical LMP Price ...................................................................... 1-5
Figure 1-5: RPU Balance of Loads and Resources ................................................................... 1-6
Figure 3-1: MISO Energy Market Area .................................................................................... 3-3
Figure 3-2: MISO Energy Resource Mix (2014) ...................................................................... 3-4
Figure 3-3: MISO Local Resource Zones ................................................................................. 3-5
Figure 3-4: MISO Energy Historical LMP Price ...................................................................... 3-6
Figure 3-5: RPU Demand Forecast ........................................................................................... 3-7
Figure 3-6: RPU Energy Forecast ............................................................................................. 3-8
Figure 3-7: RPU Balance of Loads and Resources ................................................................. 3-11
Figure 3-8: Mayo Clinic Hourly Steam Requirement Profile ................................................. 3-12
Figure 3-9: Natural Gas Cost Forecast .................................................................................... 3-13
Figure 3-10: Market Energy Cost Forecast ............................................................................... 3-14
Figure 4-1: Total Annual Wholesale Power Supply Costs ....................................................... 4-5
Figure 4-2: Total Fixed Costs (Fixed O&M, Debt Service & Demand Charges) ..................... 4-5
Figure 4-3: Total Variable Costs (Variable O&M & Fuel) ....................................................... 4-6
Figure 4-4: Net Market Interactions (Purchases less Sales) ...................................................... 4-6
2015 Update of the RPU Infrastructure Study List of Abbreviations
Rochester Public Utilities i Burns & McDonnell
LIST OF ABBREVIATIONS
Abbreviation Term/Phrase/Name
BLR balance of loads and resources
BMcD Burns & McDonnell Engineering Co.
Btu British thermal units
CCGT combined cycle gas turbine
CHP combined heat and power
CO2 carbon dioxide
CONE cost of new entry
CPP Clean Power Plan
CROD Contract Rate of Delivery via the SMMPA PSC
DMC Destination Medical Center
DOE Department of Energy
EIA Energy Information Administration
EPA Environmental Protection Agency
FERC Federal Energy Regulatory Commission
GOR gross operating revenues
GW gigawatt
hr hour
IDC interest during construction
kpph kilopound per hour
kWh kilowatt hour
klbs kilopound
Lake Zumbro Lake Zumbro Hydroelectric Plant
lbs pounds
LDC local distribution company
LMP locational marginal pricing
LNG liquefied natural gas
LRZ load resource zone

2015 Update of the RPU Infrastructure Study List of Abbreviations
Rochester Public Utilities ii Burns & McDonnell
Abbreviation Term/Phrase/Name
Mayo Mayo Clinic
MERC Minnesota Energy Resources, Co.
MISO MISO Energy (formerly Midwest Independent System Operator)
MMBtu million British thermal units
MTEP MISO Transmission Expansion Planning
MW megawatt
MWh megawatt hour
NERC North American Reliability Corporation
NNG Northern Natural Gas Company
NPV net present value
O&M operation and maintenance
OEM original equipment manufacturer
OWEF Olmsted Waste-to-Energy Facility
Plant Cascade Creek Combustion Turbine Plant
PSC Power Sales Contract with SMMPA
RPU Rochester Public Utilities
SLP Silver Lake Plant
SMMPA Southern Minnesota Municipal Power Agency
Study 2015 Infrastructure Study
UCAP unforced capacity
U.S. United States

2015 Update of the RPU Infrastructure Study Statement of Limitations
Rochester Public Utilities iii Burns & McDonnell
STATEMENT OF LIMITATIONS
In preparation of this Study, Burns & McDonnell Engineering Co. (BMcD) has relied upon information
provided by Rochester Public Utilities (RPU). While BMcD has no reason to believe that the information
provided, and upon which BMcD has relied, is inaccurate or incomplete in any material respect, BMcD
has not independently verified such information and cannot guarantee its accuracy or completeness.
Estimates and projections prepared by BMcD relating to performance and costs are based on BMcD’s
experience, qualifications, and judgment as a professional consultant. Since BMcD has no control over
weather, cost and availability of labor, material and equipment, labor productivity, contractors’
procedures and methods, unavoidable delays, economic conditions, government regulations and laws
(including interpretation thereof), competitive bidding, and market conditions or other factors affecting
such estimates or projections, BMcD does not guarantee the accuracy of its estimates or predictions.

2015 Update of the RPU Infrastructure Study Executive Summary
Rochester Public Utilities 1-1 Burns & McDonnell
EXECUTIVE SUMMARY
This report section presents a summary of the 2015 Infrastructure Update Study (Study). The Study was
completed by Burns & McDonnell Engineering Company (BMcD) for Rochester Public Utilities (RPU).
The objectives, methodology, and results of the Study are summarized in the following sections.
1.1 Study Objectives
BMcD was retained by RPU to perform this Study building upon the previous infrastructure studies RPU
has conducted in the past. This report provides information on the generation resource planning and other
analyses undertaken to make updated decisions and recommendations on RPU’s short-term and long-term
strategy.
There continues to be significant impacts to utilities within the power industry due to economic
conditions, costs of fuel, and regulatory issues. These impacts require electric utilities to continuously
monitor their infrastructure and power supply requirements to provide reliable, low cost power to their
customers. The objective of this Study was to analyze the power supply needs of RPU from 2016 through
2035 in order to identify short-term, intermediate-term, and long-term infrastructure requirements.
Due to the ever-changing power industry, RPU has monitored its power supply needs regularly by
commissioning infrastructure studies starting in 2005 with updates conducted in 2009 and 2012. These
previous studies included several supply and demand side activities which RPU could pursue. RPU has
continued to aggressively pursue demand side measures that allow customers to reduce their energy
consumption. The reductions have targeted an amount of 1.5 percent of the expected retail energy sales
for the year. The programs include numerous appliance efficiency upgrades, lighting change out, and
direct load control programs.
In addition to continued conservation measures, RPU has a need to address several issues associated with
its electric supply portfolio and resources including the following:
• Consider the addition of a new, efficient resources that can limit RPU’s exposure to market prices
• Ability to accommodate potential sharp increases in load and energy requirements due to the
Destination Medical Center (DMC) and Mayo Clinic (Mayo)
• Position RPU for short-term and long-term compliance with environmental regulations (namely
potential carbon dioxide (CO2) regulations)
• Short-term issues associated with an aging Cascade Creek Unit 1 and potential difficulties
obtaining bi-lateral market capacity contracts

2015 Update of the RPU Infrastructure Study Executive Summary
Rochester Public Utilities 1-2 Burns & McDonnell
• Intermediate-term considerations with the expiration of the steam contract with Mayo in 2025
• Long-term power supply concerns with the expiration of the Southern Minnesota Municipal
Power Agency Power Sales Contract in 2030
1.2 Review of Power Supply Conditions
1.2.1 Overall Electricity Industry Trends
The electricity industry continues to be impacted by numerous trends. The following provides a brief
discussion of the overall trends that are currently impacting electric utilities and generators.
• Environmental regulations: Both federal and state environmental regulating agencies continue to
pursue more stringent environmental regulations regarding emissions from power generating
facilities, specifically coal-fired power plants.
• Low natural gas prices: Natural gas prices remain low as production continues to outpace
demand requirements, however industry forecasts appear to be fairly robust with price increases
around five percent per year.
• Continued renewable development: Many state and federal regulators continue to pursue
increased renewable portfolio and energy requirements.
• Relatively low load growth: While much of the U.S. has seen economic growth since the
economic recession in the 2008 and 2009 timeframe, the recovery of demand and energy has been
much slower. Increased conservation programs has also led to lower load growth.
• Low wholesale market energy prices: The combination of low natural gas prices, increased
renewable development, and relatively low load growth has kept wholesale market energy prices
low compared to historical averages.
• Coal-fired retirements: With the combination of all of the above factors, the investment in costly
environmental compliance solutions at coal-fired power plants has reduced the overall economic
benefit for many coal-fired plants and therefore coal-fired power plants are retiring.
• Increased interest in “firm” capacity: A number of factors have led to the increased interest in
firm capacity including coal-fired retirements, recent extreme winter weather, and increased
dependence of natural gas for the electric industry. If firm natural gas deliveries are required for
power generators, it could increase the cost of production significantly.

2015 Update of the RPU Infrastructure Study Executive Summary
Rochester Public Utilities 1-3 Burns & McDonnell
1.2.2 MISO Energy Market
MISO initiated its energy market in 2005, at about the time of the issuance of the initial Infrastructure
Plan. At the end of 2013, MISO added several utilities within the south, central portion of the U.S. The
MISO market is made up of numerous utilities operating in the 15 states as presented in Figure 1-1.
Figure 1-1: MISO Energy Market Area
The addition of the southern area of the MISO market brought significantly more natural gas-fired
generation resources into MISO. The mix of resources within MISO is shown in Figure 1-2.
Figure 1-2: MISO Energy Resource Mix (2014)
As part of the overall resource adequacy, MISO divided the overall MISO region into sub-regions called
local resource zones (LRZ). Figure 1-3 presents an illustration of the LRZs within MISO. As illustrated
within the graphic, RPU is located within LRZ 1. Though not required, most utilities procure capacity

2015 Update of the RPU Infrastructure Study Executive Summary
Rochester Public Utilities 1-4 Burns & McDonnell
within their own LRZ to ensure they meet their capacity requirements. Capacity procured outside of a
utility’s LRZ may present a risk that the entire capacity is not credited toward their requirements should
transmission limitations exist.
Figure 1-3: MISO Local Resource Zones
Utilities have become more accustomed to the market operations. It is common for utilities today to
acquire all of their energy from the market and sell energy from their resources into the market when it is
accepted for dispatch. In essence, all of the electrical energy RPU distributes above its contract with
Southern Minnesota Municipal Power Agency (SMMPA) is acquired from the MISO market. The cost
for this energy has been affected significantly from the initial operation of the market. The past few years
have seen prices decline significantly from the peak year of 2007. Figure 1-4 provides annual averages of
hourly locational marginal pricing (LMP) for day-ahead energy at the Minnesota Hub for several years.

2015 Update of the RPU Infrastructure Study Executive Summary
Rochester Public Utilities 1-5 Burns & McDonnell
Figure 1-4: MISO Energy Historical LMP Price
The decline in pricing is due to several factors including:
• Economic downturn and relatively slow economic and load growth
• Significant addition of wind resources (approximately 2 gigawatt (GW) in 2008 and now
approximately 13 GW in 2014)
• Low pricing of natural gas
1.2.3 RPU Load and Resources
RPU’s load forecast continues to be significantly below the initial forecast used in the 2005 Infrastructure
Plan. The forecast used in this update is based on recent SMMPA projections, which was performed by a
third-party company, Leidos, in compliance with MISO’s standards. The adjusted forecast can be
attributed to many factors including increased conservation programs and end-user efficiency. Therefore,
it is inherently assumed in the forecast that the aggressive conservation reviewed in the initial
Infrastructure Plan is capturing sufficient demand and energy to result in the SMMPA revised forecast.
In order for RPU to meet its load requirements, RPU has several power supply resources currently being
utilized within its power supply portfolio including both local generation resources under RPU operating
control and power supply contracts with other power generating entities.

2015 Update of the RPU Infrastructure Study Executive Summary
Rochester Public Utilities 1-6 Burns & McDonnell
A balance of loads and resources (BLR) based on the load forecast and resources that RPU will have
available to meet its obligations are presented in Figure 1-5. Based on existing resources and current load
projections, RPU will be capacity deficit both in the short-term and long-term, especially after the
expiration of the SMMPA Power Sales Contract (PSC) Contract Rate of Delivery (CROD).
Figure 1-5: RPU Balance of Loads and Resources
In addition to the power supply contracts, RPU has a steam contract with the Mayo Clinic. Historically,
RPU has provided Mayo with up to 50,000 pounds per hour (pph) of steam from one of the steam units at
the Silver Lake Plant (SLP). As it was originally envisioned, the operation of the SLP on coal would
allow the extraction of this steam for Mayo at a benefit for both parties. After the last Infrastructure Plan
conducted in 2012 illustrated increased environmental regulation costs and dwindling economic benefits,
RPU decided to retire SLP from coal-fired operation and electric generation altogether by the end of
2015. RPU has since elected to operate the existing SLP boilers utilizing natural gas fuel only. RPU will
continue to provide approximately 50,000 pph of steam to Mayo through 2025.
0
100
200
300
400
500
600
2016 2017 2018 2019 2020 2021 2022 2023 2024 2025 2026 2027 2028 2029 2030 2031 2032 2033 2034 2035
Fir
m C
ap
aci
ty (
MW
)
Year
Balance of Loads and Resources - Current Projections
Cascade Creek 1 Cascade Creek 2 CROD
Market Existing Bi-laterals Peak Demand
Peak Demand w/ 7.1% Reserves
2015 Update of the RPU Infrastructure Study Executive Summary
Rochester Public Utilities 1-7 Burns & McDonnell
1.3 Resource Analysis & Strategy
1.3.1 New Resources
The capacity and energy needs of RPU are projected to potentially increase substantially over the study
period. There are two approaches to satisfy the capacity and energy obligations. These could be satisfied
either from resources owned by RPU or contracted for through the market. Current EPA regulations have
removed a new coal-fired power plant from consideration as a new resource. Therefore, gas-fired and
renewable resources are the only realistic resource options that RPU could construct. The following
resources were considered within this assessment:
• Reciprocating engine plant
• Simple cycle gas turbine aeroderivative technology
• Simple cycle gas turbine frame technology
• Combined cycle gas turbine (CCGT) frame technology
• Combined heat and power (CHP) facility
• Wind generation
• Solar generation
When RPU-owned resources were not available or economical, a bi-lateral contract for market capacity
from an accredited resource was used to maintain reserve margins throughout the study period. Market
capacity resources are modeled as temporary supply resources, expiring at the end of each year.
1.3.2 Power Supply Analysis
Utilizing the assumptions herein, BMcD developed future power supply plans utilizing the software
program Strategist. Strategist evaluates thousands of combinations of power supply options for RPU to
meet its load requirements. After Strategist developed several power supply paths, BMcD then evaluated
the paths within the hourly dispatch commitment software of Promod. Table 1-1 presents the results of
the dispatch analysis.
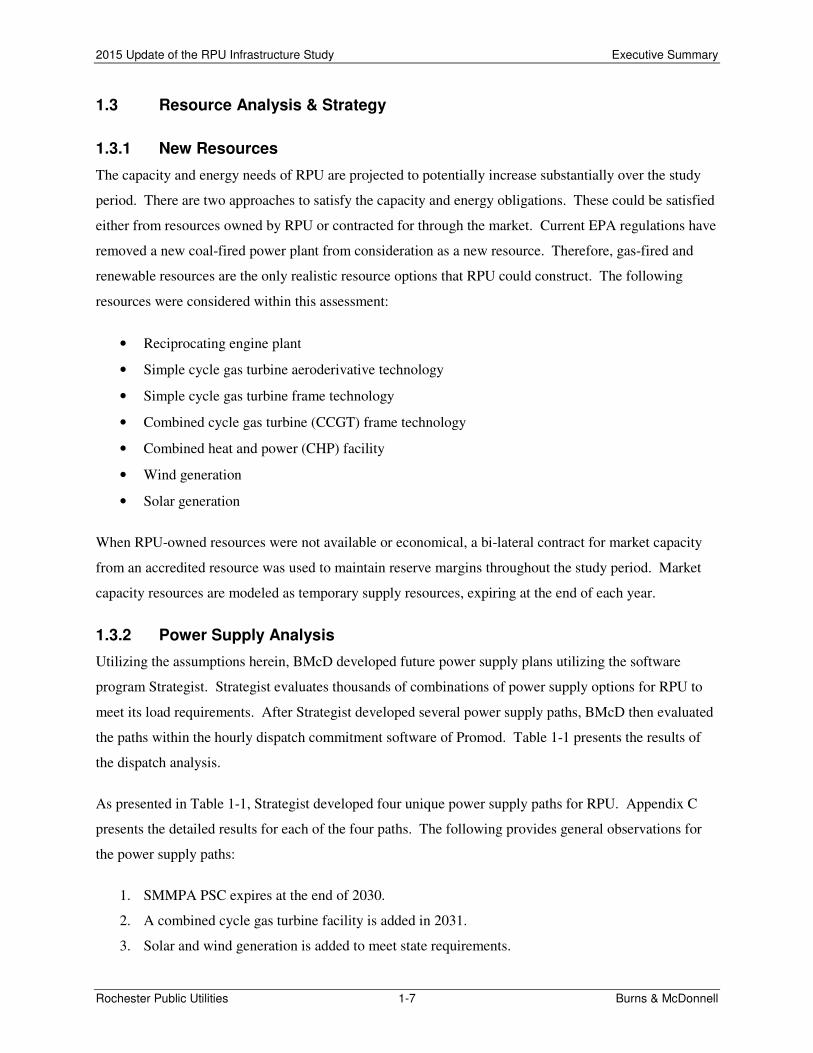
As presented in Table 1-1, Strategist developed four unique power supply paths for RPU. Appendix C
presents the detailed results for each of the four paths. The following provides general observations for
the power supply paths:
1. SMMPA PSC expires at the end of 2030.
2. A combined cycle gas turbine facility is added in 2031.
3. Solar and wind generation is added to meet state requirements.

2015 Update of the RPU Infrastructure Study Executive Summary
Rochester Public Utilities 1-8 Burns & McDonnell
4. Each case relies on purchases of capacity from the market, though the timing and magnitude vary
depending on when each new resource is added.
5. Each case retires Cascade Creek Unit 1 and adds a reciprocating engine facility and CHP facility,
though the timing of the installations is varied across the cases.
6. All four cases are very close in cost as illustrated with the net present value (NPV) for each case
within 1.2 percent.
Table 1-1: Power Supply Paths and Costs
1.4 Summary
Based on the analysis presented herein, BMcD provides the following conclusions and recommendations:
Path No. 1 2 3 4
Plan YearRetire CC1 2023,
Install Peaker 2023
Retire CC1 2018,
Install Peaker 2019
Retire CC1 2018,
Install Peaker 2018
Retire CC1 2018,
Install Peaker 2018,
Install CHP 2026
2016 Solar (500kW) Solar (500kW) Solar (500kW) Solar (500kW)
2017
2018 Retire CC1Retire CC1
Peaker (50MW)
Retire CC1
Peaker (50MW)
2019 Peaker (50MW)
2020
2021 Solar (3MW) Solar (3MW) Solar (3MW) Solar (3MW)
2022
2023Retire CC1
Peaker (50MW)
2024
2025
2026 CHP (30MW)
2027
2028 Solar (3MW) Solar (3MW) Solar (3MW) Solar (3MW)
2029 CHP (30MW) CHP (30MW) CHP (30MW)
2030
2031
Wind (150MW)
CCGT (390MW)
Solar (11MW)
Wind (150MW)
CCGT (390MW)
Solar (11MW)
Wind (150MW)
CCGT (390MW)
Solar (11MW)
Wind (150MW)
CCGT (390MW)
Solar (11MW)
2032
2033 Solar (500kW) Solar (500kW) Solar (500kW) Solar (500kW)
2034
2035 Solar (500kW) Solar (500kW) Solar (500kW) Solar (500kW)
NPV Cost
($000) $1,498,056 $1,506,011 $1,507,624 $1,515,469
% Difference 0.00% 0.53% 0.64% 1.16%

2015 Update of the RPU Infrastructure Study Executive Summary
Rochester Public Utilities 1-9 Burns & McDonnell
1. Environmental groups and agencies continue to aggressively target coal-fired plants in regards to
emissions.
a. This will lead to additional coal-fired plant retirements.
b. Increased retirements are anticipated to reduce market capacity availability and increase
MISO energy prices.
2. With the retirement of SLP from electric generation, RPU lost its “middle of the road” hedge
against MISO energy prices.
3. Due to its advanced age, continued operation of Cascade Creek Unit 1 may present additional
risks
a. Facing increased maintenance costs, inefficiency, lack of original equipment manufacturer
(OEM) support, and questionable availability of spare parts
b. Difficult to participate in MISO energy market
4. The infrastructure plans includes:
a. Voluntary compliance with State of Minnesota renewable mandates
b. Compliance with proposed CO2 regulations
c. Allows RPU to begin the transition away from joint action agency (SMMPA PSC)
d. It may provide partnering opportunities after SMMPA PSC with other utilities
5. The infrastructure plan provides insight to several windows:
a. Short-term: The addition of peaking resource and retirement of Cascade Creek 1 will allow
RPU to maintain an appropriate amount of risk to market capacity pricing while also allowing
RPU to control the retirement of Cascade Creek 1.
b. Intermediate-term: The addition of a CHP facility appears favorable for RPU within its power
supply portfolio and Mayo.
c. Long-term: The likely replacement of SMMPA PSC is a combination of a CCGT unit and
renewable generation.
6. Based on the current economic and market environment, there are several considerations for
earlier development of peaking resource:
a. Interest rates are currently low
b. The current currency exchange rate (Euro to Dollar) is favorable for reciprocating engines
which are primarily priced with the Euro.
c. Controls capacity risk exposure (controls retirement of Cascade Creek 1)
d. The capacity market within MISO has shown decreased availability of capacity and increased
cost.
e. Provides a replacement energy-hedge with the retirement of SLP and Cascade Creek 1

2015 Update of the RPU Infrastructure Study Executive Summary
Rochester Public Utilities 1-10 Burns & McDonnell
f. Protects against exposure of Cost of New Entry (CONE) pricing, which is approximately
$90,000 per megawatt (MW) per year with no benefit of energy revenue or asset investment.
7. RPU should continue to update the analysis of its future resource plans as major changes in the
industry occur or as assumptions change from those used herein.
1.5 Infrastructure Plan Highlights
The following provides the overall highlights of the infrastructure plan update:
1. Positions RPU for long-term power supply with the expiration of the SMMPA Power Sales
Contract (PSC) in 2030
2. Eliminates coal from the RPU portfolio by 2030 and significantly reduces carbon emissions
3. Meets renewable standards and objectives: 25 percent by 2025 renewable standard, 1.5 percent
solar standard, 1.5 percent conservation standard
4. Has the flexibility to accommodate potential sharp increases or decreases in load and energy
requirements due to DMC and customer solar
5. Positions RPU for short-term and long-term compliance with environmental regulations
6. Retires inefficient resource and modernizes the RPU generation fleet with high efficiency and
low emission units
7. Expands partnership opportunities with the Mayo Clinic and other combined heat and power
prospects

2015 Update of the RPU Infrastructure Study Introduction
Rochester Public Utilities 2-1 Burns & McDonnell
INTRODUCTION
Burns & McDonnell Engineering Company (BMcD) was retained by Rochester Public Utilities (RPU) to
perform an Infrastructure Study (Study) building upon the previous infrastructure studies RPU has
conducted in the past. This report provides information on the generation resource planning and other
analyses undertaken to make updated decisions and recommendations on RPU’s short-term and long-term
strategy.
2.1 Rochester Public Utilities Overview
Rochester Public Utilities provides electric and water utilities to approximately 100,000 residents of
Rochester, Minnesota. RPU has approximately 50,000 electric customers with a peak summer load of
approximately 300 megawatt (MW). Additionally, RPU serves the Mayo Clinic (Mayo) providing both a
portion of its electric and steam requirements.
2.2 Study Objectives
There continues to be significant impacts to utilities within the power industry due to the economic
conditions, costs of fuel, and regulatory issues. These impacts require electric utilities to continuously
monitor their infrastructure and power supply requirements to provide reliable, low cost power to their
customers. The objective of this Study was to analyze the power supply needs of RPU from 2016 through
2035 in order to identify short-term, intermediate-term, and long-term infrastructure requirements.
2.3 Study Background
Due to the ever-changing power industry, RPU has monitored its power supply needs regularly by
commissioning infrastructure studies starting in 2005 with updates conducted in 2009 and 2012. These
previous studies included several supply and demand side activities which RPU could pursue. RPU has
continued to aggressively pursue demand side measures that allow customers to reduce their energy
consumption. These reductions have targeted an amount of 1.5 percent of the expected retail energy sales
for the year. The programs include numerous appliance efficiency upgrades, lighting change out and
direct load control programs. This Study provides a discussion of the progress that RPU has made in the
area of demand side management and energy efficiency.
2.4 Study Methodology
The analysis of power supply options and issues required the projection of RPU’s demand and energy
over the study period. The forecast for the energy and demand was provided by RPU. The forecast was
used as the basis for determining when additional resources would be needed to maintain the capacity
2015 Update of the RPU Infrastructure Study Introduction
Rochester Public Utilities 2-2 Burns & McDonnell
reserve margins required by the MISO Energy (MISO, formerly known as Midwest Independent System
Operator) and North American Electric Reliability Corporation (NERC).
The analysis of power supply options was performed using the Strategist resource expansion program and
Promod hourly unit commitment dispatch model. The Strategist program analyzes the capacity and
energy needs of a utility and adds resources from options provided to the software program. Strategist
performs thousands of combinations evaluating the different resource portfolios. The Promod software
program then takes power supply paths developed in Strategist and simulates hourly dispatch each year
over the course of the study period. Various assumptions were developed for such things as capital costs,
fixed operations and maintenance costs, fuel supply costs, and variable operating costs of potential new
resources. In addition, BMcD developed assumptions for market costs at a representative RPU MISO
node. The time frame for the updated resource analysis was from 2016 through 2035.
2.5 Study Organization
This study is organized into several sections as follows:
• Section 1.0: Executive Summary – Provides an executive summary of the Study
• Section 2.0: Introduction – Provides an introduction to the Study
• Section 3.0: Review of Power Supply Conditions – Details of the status of RPU power supply
resources, system, and key forecast.
• Section 4.0: Resource Analysis & Strategy – Details the economic analysis evaluating the
resource plans including the methodology and results.
• Section 5.0: Summary – Provides a summary of the assumptions and conclusions reached within
this Study.

2015 Update of the RPU Infrastructure Study Review of Power Supply Conditions
Rochester Public Utilities 3-1 Burns & McDonnell
REVIEW OF POWER SUPPLY CONDITIONS
This section provides information regarding RPU’s general power supply assumptions, local generating
resources, power supply contracts, and key forecasts utilized within this Study.
3.1 General Power Supply Assumptions
The analysis began with the development of the baseline assumptions and constraints as applicable for
RPU. The following general assumptions are applicable to the analysis:
• The study period covers the years 2016 through 2035.
• The hourly load used in this Study was based on information from 2013.
• The interest rate for RPU for financing terms was 5 percent, with resources financed over 30
years.
• The general escalation rate was assumed to be 2.5 percent.
• The discount rate was assumed to be 5 percent.
3.2 Overall Electricity Industry Trends
The electricity industry continues to be impacted by numerous trends. The following provides a brief
discussion of the overall trends that are currently impacting electric utilities and generators.
• Environmental regulations: Both federal and state environmental regulating agencies continue to
pursue more stringent environmental regulations regarding emissions from power generating
facilities, specifically coal-fired power plants. One of the most recent regulations proposed by the
U.S. Environmental Protection Agency (EPA) was the Clean Power Plan (CPP) specifically
targeting a reduction in carbon dioxide (CO2) emissions from existing coal-fired power plants
through several avenues including performance improvements, fuel switching, and increased
renewables and energy conservation.
• Low natural gas prices: Natural gas prices remain low as production continues to outpace
demand requirements. Increased production is attributable to enhancements in fracking methods
and technology. However, environmentalists and regulators continue to evaluate and debate the
overall impacts on the environment due to fracking, and increased regulations, and thus increased
costs, may be imposed. Furthermore, there is increased interest in developing liquefied natural
gas (LNG) export facilities to allow for the U.S. and Canada to export natural gas to world
markets with 21 proposed LNG export terminals in various stages of development across the U.S.
and Canada (according to information from the Federal Energy Regulatory Commission (FERC)).

2015 Update of the RPU Infrastructure Study Review of Power Supply Conditions
Rochester Public Utilities 3-2 Burns & McDonnell
• Continued renewable development: In addition to the proposed CPP, many States continue to
pursue increased renewable portfolio and energy requirements. Currently the federal government
has tax incentives in place that incentivize renewable development through investment or
production tax credits. While these tax credits are set to expire at the end of 2016, it remains to
be seen if they will be extended as Congress has previously done.
• Relatively low load growth: While much of the U.S. has seen economic growth since the
economic recession in the 2008 and 2009 timeframe, the recovery of demand and energy has been
much slower. Most of the U.S. has experienced relatively low load growth recently, with a few
exceptions revolving around the oil/gas boom. Increased conservation programs have led to
slower load growth as well. RPU has experienced relatively average growth compared to the
U.S. overall which has been around one percent.
• Low wholesale market energy prices: The combination of low natural gas prices, increased
renewable development, and relatively low load growth has kept wholesale market energy prices
low compared to historical averages. Wholesale market energy prices typically do not reflect
fixed cost investments into resources, thus only reflect the variable and fuel cost components of
energy production. With low natural gas prices, renewable generation being “dumped” to the
market, and slower demand growth, market energy prices remain low.
• Coal-fired retirements: With the combination of all of the above factors, the investment in costly
environmental compliance solutions at coal-fired power plants has reduced the overall economic
benefit for many coal-fired plants. With the uncertainty in CO2 regulations and dwindling
economics, many coal-fired power plants have elected to cease coal-fired operation. Estimates of
approximately 70 gigawatt (GW) of coal-fired capacity may be retired by 2020, representing
approximately 25 percent of the entire U.S. coal-fired fleet.
• Increased interest in “firm” capacity: A number of factors have led to the increased interest in
firm capacity including coal-fired retirements, recent extreme winter weather, and increased
dependence of natural gas for the electric industry. As the regulations and economics drive the
electric industry to increase its dependence on natural gas, the ability to provide firm capacity,
especially during winter months, is a concern. Historically, natural gas-fired power plants were
dispatched during the summer to meet increased demand due to air conditioning needs, when
there is little competition for natural gas supply and deliveries. However, with the increased coal-
fired power plant retirements, more natural gas-fired generation is going to be required during
winter months when increased natural gas demand is prevalent due to residential and commercial
heating needs. As such, many of the independent system operators are evaluating the overall
reliability of the bulk electric system, especially during winter months, with increased reliance on
2015 Update of the RPU Infrastructure Study Review of Power Supply Conditions
Rochester Public Utilities 3-3 Burns & McDonnell
natural gas-fired power plants. If firm natural gas deliveries are required for power generators, it
could increase the cost of production significantly.
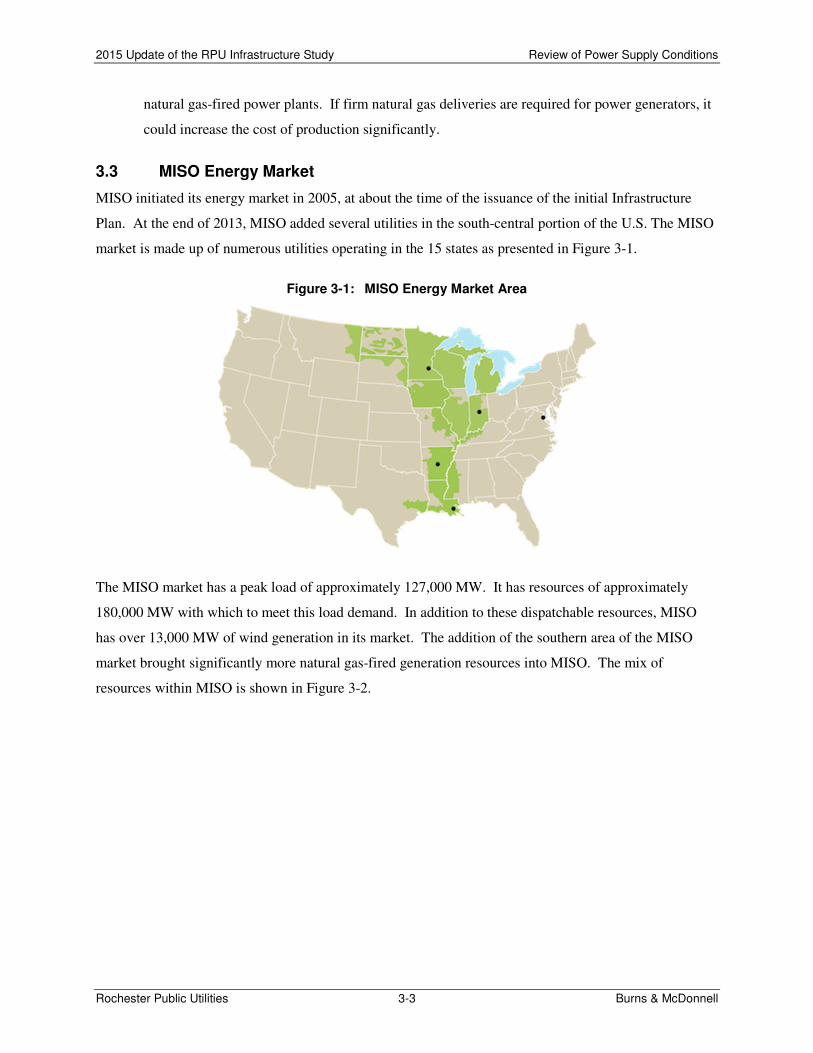
3.3 MISO Energy Market
MISO initiated its energy market in 2005, at about the time of the issuance of the initial Infrastructure
Plan. At the end of 2013, MISO added several utilities in the south-central portion of the U.S. The MISO
market is made up of numerous utilities operating in the 15 states as presented in Figure 3-1.
Figure 3-1: MISO Energy Market Area
The MISO market has a peak load of approximately 127,000 MW. It has resources of approximately
180,000 MW with which to meet this load demand. In addition to these dispatchable resources, MISO
has over 13,000 MW of wind generation in its market. The addition of the southern area of the MISO
market brought significantly more natural gas-fired generation resources into MISO. The mix of
resources within MISO is shown in Figure 3-2.

2015 Update of the RPU Infrastructure Study Review of Power Supply Conditions
Rochester Public Utilities 3-4 Burns & McDonnell
Figure 3-2: MISO Energy Resource Mix (2014)
This market allows utilities to operate as they traditionally have and dispatch units they control to satisfy
their load or to sell energy from their generation resources into the market and to purchase energy to meet
their load requirements from the market. These purchase and sale transactions are performed on a daily
basis. Over time, utilities have transitioned to selling generation into the market and procuring energy
from the market.
Load serving utilities have two basic obligations in the MISO market. The first is to meet the capacity
requirements for peak load demand plus reserve margin. The second is to be able to satisfy the energy
requirements of its customers.
The market has matured and evolved in its business practices and standards for utilities. As a participant
in the MISO market, RPU is subject to the business practices established by MISO and the MISO tariffs.
One of these requirements is to maintain capacity reserves above its peak load obligations. MISO
recently revised its capacity obligation requirements to be a function of a resource’s overall reliability.
Also, MISO recently launched a capacity auction process, however much of the capacity traded between
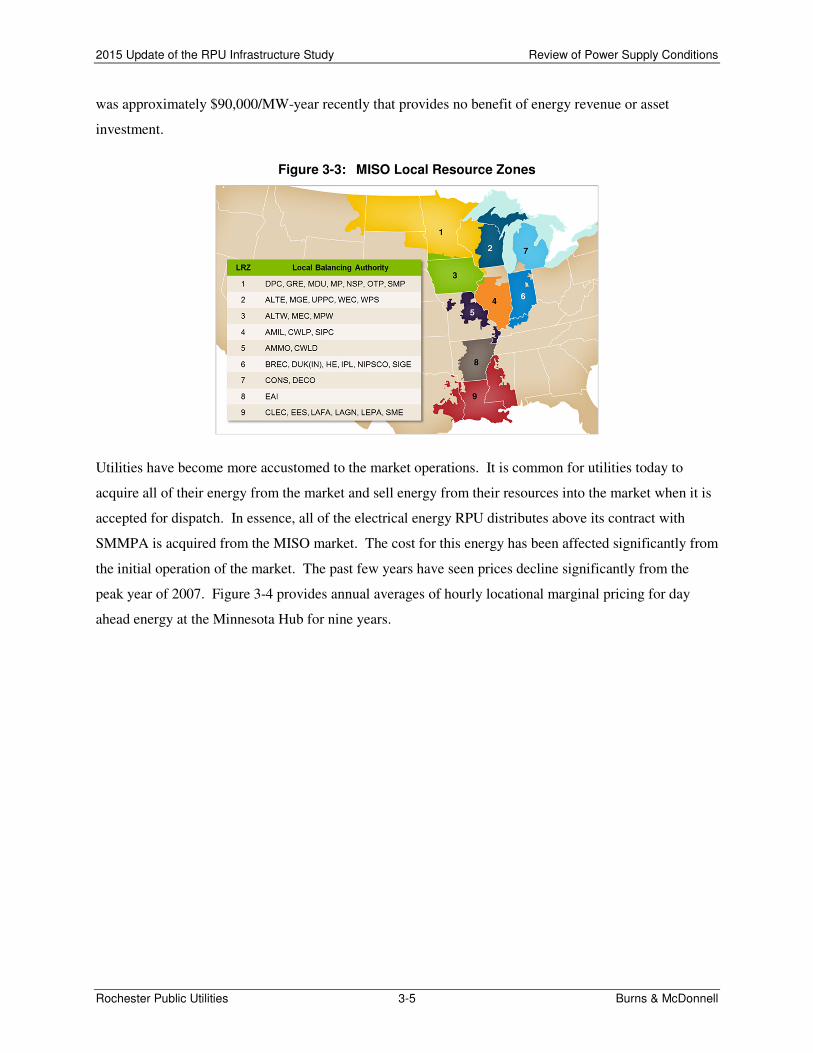
utilities within MISO is still conducted via bi-lateral contracts. As part of the overall resource adequacy,
MISO divided the overall MISO region into sub-regions called local resource zones (LRZ). Figure 3-3
presents an illustration of the LRZs within MISO. As illustrated within the graphic, RPU is located
within LRZ 1. Though not required, most utilities procure capacity within their own LRZ to ensure they
meet their capacity requirements. Capacity procured outside of a utility’s LRZ may present a risk that the
entire capacity is not credited toward their requirements should transmission limitations exist. In the
event a utility does not procure sufficient capacity to meet its requirements, that utility may be exposed to
short-term capacity penalty through MISO represented by the cost of new entry (CONE) pricing, which
2015 Update of the RPU Infrastructure Study Review of Power Supply Conditions
Rochester Public Utilities 3-5 Burns & McDonnell
was approximately $90,000/MW-year recently that provides no benefit of energy revenue or asset
investment.
Figure 3-3: MISO Local Resource Zones
Utilities have become more accustomed to the market operations. It is common for utilities today to
acquire all of their energy from the market and sell energy from their resources into the market when it is
accepted for dispatch. In essence, all of the electrical energy RPU distributes above its contract with
SMMPA is acquired from the MISO market. The cost for this energy has been affected significantly from
the initial operation of the market. The past few years have seen prices decline significantly from the
peak year of 2007. Figure 3-4 provides annual averages of hourly locational marginal pricing for day
ahead energy at the Minnesota Hub for nine years.

2015 Update of the RPU Infrastructure Study Review of Power Supply Conditions
Rochester Public Utilities 3-6 Burns & McDonnell
Figure 3-4: MISO Energy Historical LMP Price
The decline in pricing is due to several factors including:
• Economic downturn and relatively slow economic and load growth
• Significant addition of wind resources (approximately 2 GW in 2008 and now approximately 13
GW in 2014)
• Low pricing of natural gas
Many utilities are able to take advantage of this pricing condition and acquire energy from the market
much more economically than they could from operating their own generating assets. This has led many
utilities to adopt a strategy of either contracting or installing low capital cost assets to meet the capacity
obligations for load and reserves. They then buy energy from the market at a more economical average
cost than is possible if they were to run the resources themselves. When possible, energy is sold from the
resource into the market and this revenue is used to reduce the average power cost of the utility. Due to
the attractive pricing in the MISO market, many small to medium sized utilities, such as RPU, are able to
purchase energy at pricing well below their ability to generate it from their resources.
3.4 Load Forecast
MISO requires that all members conduct an annual load forecast that has a well-defined methodology.
RPU’s annual forecast is developed by a third-party company, Leidos, through SMMPA. The load
2015 Update of the RPU Infrastructure Study Review of Power Supply Conditions
Rochester Public Utilities 3-7 Burns & McDonnell
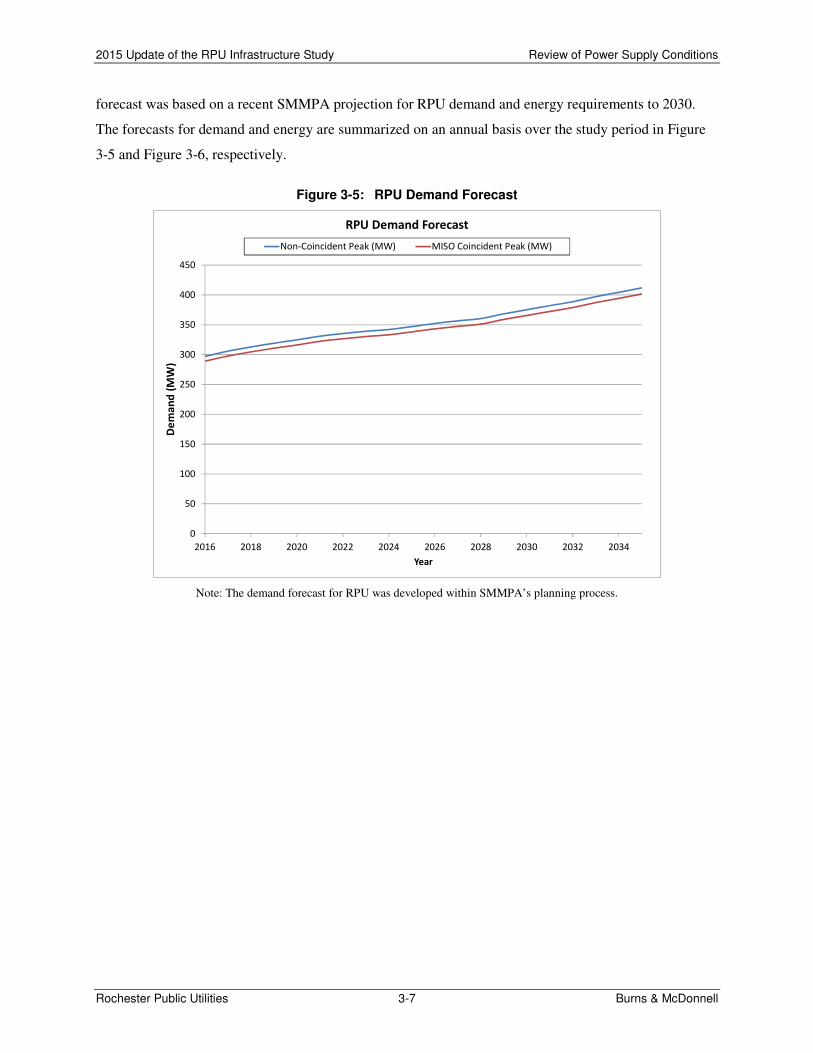
forecast was based on a recent SMMPA projection for RPU demand and energy requirements to 2030.
The forecasts for demand and energy are summarized on an annual basis over the study period in Figure
3-5 and Figure 3-6, respectively.
Figure 3-5: RPU Demand Forecast
Note: The demand forecast for RPU was developed within SMMPA’s planning process.
0
50
100
150
200
250
300
350
400
450
2016 2018 2020 2022 2024 2026 2028 2030 2032 2034
De
ma
nd
(M
W)
Year
RPU Demand Forecast
Non-Coincident Peak (MW) MISO Coincident Peak (MW)

2015 Update of the RPU Infrastructure Study Review of Power Supply Conditions
Rochester Public Utilities 3-8 Burns & McDonnell
Figure 3-6: RPU Energy Forecast
Note: The energy forecast for RPU was developed within SMMPA’s planning process.
RPU’s load forecast continues to be significantly below the initial forecast used in the 2005 Infrastructure
Plan. The forecast used in this update is based on recent SMMPA projections. The adjusted forecast can
be attributed to many factors including increased conservation programs and end-user efficiency.
Therefore, it is inherently assumed in the forecast that the aggressive conservation reviewed in the initial
Infrastructure Plan is capturing sufficient demand and energy to result in the SMMPA revised forecast.
Table 3-1 provides the estimated savings and cost of capturing the conserved energy and demand
reductions.
0
200
400
600
800
1,000
1,200
1,400
1,600
1,800
2,000
2016 2018 2020 2022 2024 2026 2028 2030 2032 2034
En
erg
y (
GW
h)
Year
RPU Energy Forecast
Energy (GWh)

2015 Update of the RPU Infrastructure Study Review of Power Supply Conditions
Rochester Public Utilities 3-9 Burns & McDonnell
Table 3-1: RPU Historical Energy Conservation and Spending
Note: GOR is an abbreviation for gross operating revenues
3.5 Power Supply Resources
RPU has several power supply resources currently being utilized within its power supply portfolio
including both local generation resources under RPU operating control and power supply contracts with
other power generating entities. The following paragraphs provide information regarding these resources.
Additional information regarding these resources is provided in Appendix A.
3.5.1 RPU Local Power Generating Resources
3.5.1.1 Cascade Creek Combustion Turbines
RPU owns and operates the Cascade Creek Combustion Turbines (Plant) located in Rochester that utilizes
both fuel oil and natural gas to generate electricity. Specific details on the performance and costs of the
units are presented in Appendix A.
Unit 1 is a nominal 27 MW combustion turbine that was commercial installed in 1975 and utilizes both
natural gas and fuel oil. By today’s standards Unit 1 is inefficient with a heat rate over 15,000 British
thermal unit (Btu) per kilowatt-hour (kWh). Due to its advanced age, Unit 1 is going to require
significant capital expenditures in the coming years in order to keep it operational. Furthermore, since the
turbine is 40 years of age, the availability of spare parts is questionable moving forward.
Unit 2 consists of a natural gas-fired combustion turbine with a nominal output of approximately 48 MW.
Unit 2 was installed in 2002.
Both combustion turbines are dispatched into the MISO market as peaking resources.
Year Statute Requirement
Requirement
(kWh)
Actual
(kWh)
Percent
to Goal
Required
Spending
Actual
Spending
Percent
to Goal
2002 1.5% of GOR spending 169,000 7,562,201 4475% $1,181,305 $1,115,327 94%
2003 1.5% of GOR spending 6,332,853 7,859,697 124% $1,222,921 $1,327,321 109%
2004 1.5% of GOR spending 8,424,789 9,827,569 117% $1,208,957 $1,167,760 97%
2005 1.5% of GOR spending 8,424,689 7,743,700 92% $1,222,924 $1,213,517 99%
2006 1.5% of GOR spending 9,855,000 10,417,072 106% $1,363,203 $1,377,074 101%
2007 1.5% of GOR spending 11,325,000 15,819,295 140% $1,363,203 $1,995,606 146%
2008 1.5% of GOR spending 12,704,000 13,665,636 108% $1,535,535 $1,698,407 111%
2009 0.75% Savings/1.5% Spending 16,274,333 16,994,220 104% $1,744,800 $2,303,375 132%
2010 1.5% Savings / 1.5% Spending 19,100,443 19,126,719 100% $1,814,398 $3,088,665 170%
2011 1.5% Savings / 1.5% Spending 19,100,443 20,420,120 107% $1,896,508 $2,908,226 153%
2012 1.5% Savings / 1.5% Spending 18,785,066 23,248,077 124% $1,926,061 $3,249,817 169%
2013 1.5% Savings / 1.5% Spending 18,563,927 29,842,896 161% $1,893,582 $2,491,109 132%
2014 1.5% Savings / 1.5% Spending 18,610,704 22,102,056 119% $1,932,964 $2,424,762 125%
Energy Conservation Spending on Conservation Programs

2015 Update of the RPU Infrastructure Study Review of Power Supply Conditions
Rochester Public Utilities 3-10 Burns & McDonnell
The city of Rochester, and the Plant, is served locally by the local distribution company (LDC) Minnesota
Energy Resources, Co (MERC). MERC receives gas from the area interstate pipeline network at a high
pressure. The pressure is reduced and distributed through a network of pipes within Rochester to retail
consumers. Currently, RPU receives natural gas from MERC/Constellation/Northern Natural Gas (NNG)
through an interruptible supply tariff. Historically during cold weather conditions, the gas suppliers have
limited natural gas deliveries to RPU.
3.5.1.2 Lake Zumbro Hydroelectric
Lake Zumbro Hydroelectric Plant (Lake Zumbro) was built in 1920. Lake Zumbro has consistently
provided RPU with a renewable supply of energy. The facility consists of a powerhouse and a 440-foot
spillway built across the Zumbro River. The General Electric generators are driven at 225 revolutions per
minute by 1,800-horsepower, Francis-type hydraulic turbines. This equates to approximately 1,300
kilowatts per wheel, which rates the station at an output of 2.6 MW.
3.5.1.3 Other Local Resources
In addition to the Plant and Lake Zumbro, RPU receives capacity and energy from several other resources
including:
• Olmsted Waste-to-Energy Facility (OWEF): Energy resource only up to 5 MW
• IBM: Peak shaving resource approximately 3.6 MW
3.5.2 Southern Minnesota Municipal Power Agency Contract
In addition to the local power generation facilities described above, RPU has a PSC with SMMPA
through CROD. The PSC with SMMPA is set to expire on December 31, 2030. The accounting of this
energy is provided through the MISO settlement process and the contract with SMMPA. This contract
requires RPU to purchase all of the retail energy it distributes at or below a rate of 216 MW per hour from
SMMPA.
Specific details of the costs of the PSC discussed here are presented in Appendix A.
3.6 Balance of Loads and Resources
As described above, RPU has a number of resources to meet its capacity reserve margin requirements and
renewable energy objectives. RPU meets a significant amount of its power supply obligations through its
contract with SMMPA, which currently runs through 2030.

2015 Update of the RPU Infrastructure Study Review of Power Supply Conditions
Rochester Public Utilities 3-11 Burns & McDonnell
A balance of loads and resources (BLR) based on the load forecast and resources that RPU will have
available to meet its obligations are presented in Figure 3-7. The reserve margin is based on RPU
maintaining a margin of 7.1 percent for its load above CROD and under MISO’s Module E Unforced
Capacity (UCAP) resource adequacy method. As presented in Figure 3-7, Cascade Creek 1 is assumed to
be retired from operation no later than the end of 2022 due to its age. Based on existing resources and
current load projections, RPU will be capacity deficit both in the short-term and long-term, especially
after the expiration of the SMMPA PSC CROD.
Figure 3-7: RPU Balance of Loads and Resources
3.7 Mayo Clinic Steam
In addition to the power supply contracts, RPU has a steam contract with the Mayo Clinic. Historically,
RPU has provided Mayo with up to 50,000 pph of steam from one of the steam units at the Silver Lake
Plant (SLP). As it was originally envisioned, the operation of the SLP on coal would allow the extraction
of this steam for Mayo at a benefit for both parties. After the last Infrastructure Plan conducted in 2012
illustrated increased environmental regulation costs and dwindling economic benefits, RPU decided to
retire the Silver Lake Plant (SLP) from coal-fired operation and electric generation altogether by the end
0
100
200
300
400
500
600
2016 2017 2018 2019 2020 2021 2022 2023 2024 2025 2026 2027 2028 2029 2030 2031 2032 2033 2034 2035
Fir
m C
ap
aci
ty (
MW
)
Year
Balance of Loads and Resources - Current Projections
Cascade Creek 1 Cascade Creek 2 CROD
Market Existing Bi-laterals Peak Demand
Peak Demand w/ 7.1% Reserves

2015 Update of the RPU Infrastructure Study Review of Power Supply Conditions
Rochester Public Utilities 3-12 Burns & McDonnell
of 2015. RPU has since elected to operate the existing SLP boilers utilizing natural gas fuel only. RPU
will continue to provide approximately 50,000 pph of steam to Mayo through 2025.
Overall, Mayo’s internal steam and heat requirements are significantly higher than 50,000 pph and Mayo
currently generates much of its heating requirements with internal power and steam producing equipment.
Figure 3-8 presents a representative overall hourly steam requirement profile for the Mayo clinic.
Figure 3-8: Mayo Clinic Hourly Steam Requirement Profile
As presented in Figure 3-8, Mayo’s steam requirements fluctuate from approximately 100 kilopounds per
hour (kpph) to over 250 kpph. Both RPU and Mayo have indicated willingness to potentially partner with
a combined heat and power (CHP) facility that would provide mutual benefits to both parties.
3.8 Forecasts
In order to conduct a long-term resource planning assessment for power supply, several forecasts have to
be developed for evaluation. For this Study, BMcD developed key forecasts for fuel costs and market
energy costs using reputable publicly available sources. The following paragraphs provide a summary of
the forecasts developed and utilized within this Study. Further details of the forecasts are presented in
Appendix A.

2015 Update of the RPU Infrastructure Study Review of Power Supply Conditions
Rochester Public Utilities 3-13 Burns & McDonnell
3.8.1 Fuel Cost Forecast
As part of its planning process to ensure electric grid reliability, MISO conducts numerous
comprehensive studies of anticipating load, generation, and transmission projects. Part of this planning
process requires MISO to project the cost of fuel and market energy. Within this Study, BMcD utilized
the fuel forecast developed by MISO within MISO’s transmission expansion planning (MTEP). MISO
evaluates numerous futures considering varying levels of environmental regulation, renewable
requirements, and economic growth. Using this data, BMcD developed a fuel forecast to utilize within
this Study.
To compare the MTEP fuel forecast, BMcD also utilized projected information regarding natural gas fuel
cost developed by the Department of Energy’s (DOE) Energy Information Administration (EIA).
Utilizing multiple forecasts that are considerably different provides the ability to assess the resource plan
under varying assumptions. This provides for a more robust evaluation to determine whether one
resource path appears more favorable under a different set of economic forecasts. Figure 3-9 presents
both the MTEP and EIA natural gas forecasts. The MTEP forecast served as a basis for this Study.
Figure 3-9: Natural Gas Cost Forecast
2015 Update of the RPU Infrastructure Study Review of Power Supply Conditions
Rochester Public Utilities 3-14 Burns & McDonnell
As presented in Figure 3-9, in the near term (from 2015 to 2019) both the MTEP and EIA natural gas
forecasts are nearly the same. However, in the long-term (beyond 2020) the MISO MTEP fuel forecast is
higher by approximately 15 to 20 percent.
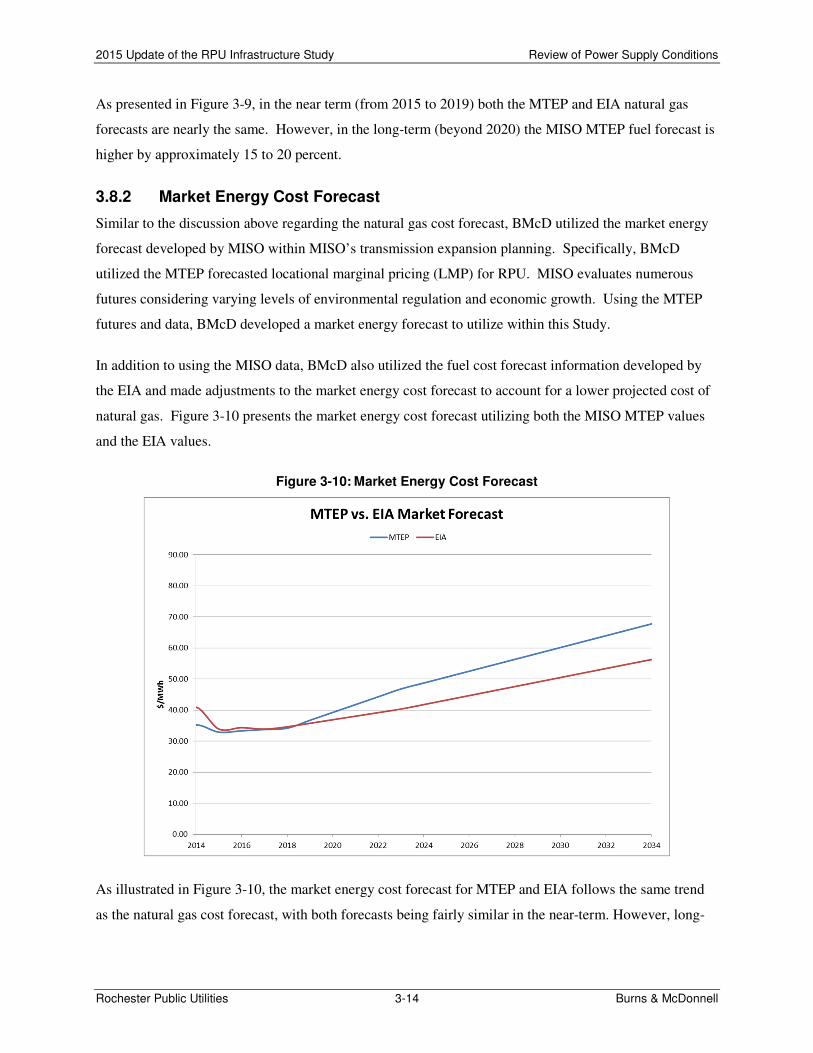
3.8.2 Market Energy Cost Forecast
Similar to the discussion above regarding the natural gas cost forecast, BMcD utilized the market energy
forecast developed by MISO within MISO’s transmission expansion planning. Specifically, BMcD
utilized the MTEP forecasted locational marginal pricing (LMP) for RPU. MISO evaluates numerous
futures considering varying levels of environmental regulation and economic growth. Using the MTEP
futures and data, BMcD developed a market energy forecast to utilize within this Study.
In addition to using the MISO data, BMcD also utilized the fuel cost forecast information developed by
the EIA and made adjustments to the market energy cost forecast to account for a lower projected cost of
natural gas. Figure 3-10 presents the market energy cost forecast utilizing both the MISO MTEP values
and the EIA values.
Figure 3-10: Market Energy Cost Forecast
As illustrated in Figure 3-10, the market energy cost forecast for MTEP and EIA follows the same trend
as the natural gas cost forecast, with both forecasts being fairly similar in the near-term. However, long-

2015 Update of the RPU Infrastructure Study Review of Power Supply Conditions
Rochester Public Utilities 3-15 Burns & McDonnell
term the MTEP forecast is considerably higher by 15 to 20 percent. For this Study, BMcD utilized the
MTEP forecast for market energy prices as the base assumption.
3.8.3 Market Capacity Cost Forecast
Capacity in the MISO market is required for utilities to meet their reserve margin obligations. The MISO
market does include a specific market for capacity. However, utilities are not forced to participate within
the capacity market auction and much of the capacity is traded on a bi-lateral basis between parties.
Utilities can contract from a variety of parties to meet their capacity obligations, but are encouraged to
contract capacity within their LRZ in order to avoid the risk of transmission limitations and not receiving
the full credit for the capacity. In the current MISO capacity construct, this capacity must be sourced
from a specific generating resource capable of supplying the capacity stated in the contract. The capacity
that is credited to the generating resource is also based on the individual generating resource’s
performance in regards to availability and reliability. Resources that operate more reliability will receive
a larger percentage of its generating capability. Conversely, resources that experience significant outages
are de-rated and only receive portion of their maximum output. Under this rule, generators are strongly
encouraged to operate reliably in order to receive the largest portion of their capacity.
The price of capacity within MISO has been historically low and significantly below the cost of a newly
constructed resource. However, with the retirement of additional coal-fired generation, market capacity
has started increasing in cost and the availability of such capacity has decreased as illustrated through
RPU’s recent capacity contracts.
For this Study, BMcD assumed that RPU is still willing to consider purchasing bi-lateral market capacity
to fulfill its resource adequacy requirements as a participant in MISO.
3.9 New Generation Resources
The capacity and energy needs of RPU are projected to potentially increase substantially over the study
period. There are two approaches to satisfy the capacity and energy obligations: either from resources
owned by RPU or contracted for through the market. Current EPA regulations have removed a new coal
fired power plant from consideration as a new resource. Therefore, gas-fired and renewable resources are
the only realistic resource options that RPU could construct. The following resources were considered
within this assessment:
• Reciprocating engine plant
• Simple cycle gas turbine (SCGT) aeroderivative technology
• Simple cycle gas turbine frame technology

2015 Update of the RPU Infrastructure Study Review of Power Supply Conditions
Rochester Public Utilities 3-16 Burns & McDonnell
• Combined cycle gas turbine (CCGT) frame technology
• Combined heat and power facility
• Wind generation
• Solar generation
When owned resources were not available or economical, a contract for market capacity from an
accredited resource was used to maintain reserve margins throughout the study period. Market capacity
resources are modeled as temporary supply resources, expiring at the end of each year.
Table 3-2 presents a summary of the cost and performance estimates for the new resources considered
within this Study for meeting RPU’s future capacity and energy requirements. Further operating and cost
estimate assumptions for the new resources can be found in Appendix B.

2015 Update of the RPU Infrastructure Study Review of Power Supply Conditions
Rochester Public Utilities 3-17 Burns & McDonnell
Table 3-2: New Resource Cost and Performance Summary
Note: Further details of cost and performance estimates including the underlying assumptions are presented in Appendix B.
PROJECT TYPEReciprocating
Engine
Aeroderivative
SCGT
"F-Class"
SCGT
"F-Class"
CCGT
Combined Heat and
Power Facility50 MW Wind Solar
BASE PLANT DESCRIPTION
Number of Gas Turbines, Engines or Boilers 6 1 1 1 1 22 N/A
Fuel Design Natural Gas Natural Gas Natural Gas Natural Gas Natural Gas N/A N/A
Technology Rating Mature Mature Mature Mature Mature Mature Mature
PERFORMANCE
Summer Peak Performance
Total Net Fired Plant Output, kW 54,600 44,900 213,800 412,300 32,200 50,000 500
Total Net Fired Plant Heat Rate, Btu/kWh (HHV) 8,490 9,690 9,890 7,110 4,150 N/A N/A
Total Net Fired Plant Heat Input, MMBtu/h (HHV) 460 440 2,110 2,930 134 N/A N/A
Assumed Firm Capacity Credit for MISO, kW 52,000 43,000 203,000 392,000 31,000 7,000 8% of Output
CAPITAL COSTS
Total Plant Capital Costs
Project Cost, 2015M$ (w/o Owner's Costs) $51 $58 $100 $314 $54 $90 $1.2
Owner's Costs 2015M$ (without Escalation and IDC) $15 $18 $32 $60 $17 Incl. in Project Costs Incl. in Project Costs
Total Capital Cost, 2015M$ $65 $77 $132 $374 $71 $90 $1.2
Total Capital Cost 2015$/kW Avg Annual Fired Output $1,199 $1,712 $615 $912 $2,214 $1,804 $2,440
NON-FUEL OPERATION & MAINTENANCE COSTS
Fixed O&M Cost, 2015$/kW-Yr $10.97 $23.78 $7.18 $12.81 $18.60 $18.45 $11.89
Engine Major Maintenance, 2015$/Start/GT (Note 2 & 3) N/A N/A $15,375 $15,375 N/A N/A N/A
Engine Major Maintenance, 2015$/GT-h (Note 2 & 3) $24 $195 $410 $410 $138 N/A N/A
Engine Major Maintenance, 2015$/MWh (Note 2 & 3) $2.59 $4.34 $1.92 $1.29 $4.30 N/A N/A
Variable O&M, 2015$/MWh (excl. major maintenance) $4.51 $6.66 $0.92 $1.33 $6.66 Incl. In Fixed Incl. In Fixed
Total Non-Fuel Variable O&M, 2015$/MWh $7.10 $11.00 $2.84 $2.63 $10.96 N/A N/A

2015 Update of the RPU Infrastructure Study Resource Analysis & Strategy
Rochester Public Utilities 4-1 Burns & McDonnell
RESOURCE ANALYSIS & STRATEGY
RPU has a need to address several issues associated with its electric supply portfolio and resources
including the following:
• Consider the addition of a new, efficient resource to limit exposure to high MISO market energy
and capacity prices
• Ability to accommodate potential sharp increases in load and energy requirements due to the
Destination Medical Center (DMC) and Mayo
• Position RPU for short-term and long-term compliance with environmental regulations (namely
potential CO2 regulations)
• Short-term issues associated with an aging Cascade Creek Unit 1 and potential capacity deficits
• Intermediate-term considerations with the expiration of the steam contract with Mayo in 2025
• Long-term power supply concerns with the expiration of the SMMPA PSC CROD in 2030
In order to assess options that might be beneficial to pursue with regards to these issues, BMcD
developed scenarios of various resource options that RPU could follow. This part of the report provides a
summary of that analysis.
Various resource planning assumptions and considerations were developed and analyzed using Ventyx’s
Strategist and Promod software programs to study the various futures considered viable for RPU. The
Strategist model is a resource portfolio optimization model that allows an analysis of several different
resources with a variety of characteristics to meet the load requirements and any other defined constraints
over a finite period of time. The model develops potentially thousands of resource combinations based on
the scenario-defined constraints, ranking these combinations by net present value (NPV) over the study
period. This allows the selection of the lowest evaluated cost combination of resources, including optimal
size and implementation schedules for new resources, based on the performance and construction costs
provided. Scenarios were developed to analyze the various approaches which RPU could use to meet its
obligations.
Using the results of the Strategist model, BMcD then selected several power supply futures to evaluate
within Promod, an hourly dispatch commitment program that can simulate the dispatch of RPU’s
resources against both RPU’s load and MISO market energy prices. Promod provides a granular
evaluation of the anticipated operation of RPU’s power supply for each hour of the year over the 20-year
study period.

2015 Update of the RPU Infrastructure Study Resource Analysis & Strategy
Rochester Public Utilities 4-2 Burns & McDonnell
4.1 Power Supply Plan Model Development
In order for Strategist to optimize RPU’s power supply portfolio, several assumptions were included
within the model. The following provides a summary of the major assumptions included within the
model:
1. The load forecast for both demand and energy was utilized for RPU based on SMMPA’s planning
efforts.
2. The MTEP developed forecasts for natural gas costs and market energy prices were utilized as the
basis for this Study.
3. Due to its age, condition, and the potential of limited availability of spare parts, Cascade Creek
Unit 1 was assumed to be retired in the event a new generator was built by RPU.
4. Renewable requirements (Appendix A provides additional information regarding the schedule of
renewable generation)
a. While CROD is in effect, most of RPU’s renewable requirements will be satisfied under the
SMMPA PSC.
b. For renewable requirements over CROD, it has been assumed that RPU will contract for
additional solar capacity and energy.
c. After CROD is terminated, it has been assumed that RPU will meet the State of Minnesota’s
overall goal of 25 percent renewable energy with wind resource contracts and also comply
with the State of Minnesota’s solar requirements.
d. Per MISO, solar and wind resources were given an 8 percent and 14 percent of nameplate
capacity credit, respectively, for resource adequacy requirements.
5. For the purposes of planning, a limit of 52 MW was placed on the amount of capacity that RPU
would acquire from the market through bi-later contracts before a unit would be constructed by
RPU. This limit was selected as it is equal to the overall firm output of the reciprocating engine
resource.
6. For the CHP option, it is assumed that fuel costs are passed through to Mayo at a typical
consumption rate of a natural gas-fired boiler. Remaining fuel that is attributable to power
generation was accounted for within RPU’s power supply costs as well as all capital and
operational costs.
4.2 Power Supply Analysis
Utilizing the assumptions described herein, BMcD developed future power supply plans utilizing the
software program Strategist. After Strategist developed several power supply paths, BMcD then

2015 Update of the RPU Infrastructure Study Resource Analysis & Strategy
Rochester Public Utilities 4-3 Burns & McDonnell
evaluated the paths within the hourly dispatch commitment software of Promod. Table 4-1 presents the
results of the dispatch analysis.
As presented in Table 4-1, Strategist developed four unique power supply paths for RPU. Appendix C
presents the detailed economic results and BLR charts for each of the four paths. Figure 4-1, Figure 4-2,
Figure 4-3, and Figure 4-4 present an illustration of the total annual power supply costs, fixed costs,
variable costs, and net market interactions, respectively, for each power supply path.
The following provides general observations for the power supply paths:
1. CROD expires at the end of 2030.
2. A combined cycle gas turbine facility is added in 2031.
3. Solar generation is added in 2016 at 500 kW, 2021 at 3 MW, 2028 at 3 MW, 2031 at 11.5 MW,
2033 at 0.5 MW, and 2035 at 0.5 MW.
4. Wind generation is added in 2031 at 150 MW total.
5. Each path relies on purchases of capacity from the market, though the timing and magnitude vary
depending on when each new resource is added.
6. Each path retires Cascade Creek Unit 1 and adds a reciprocating engine facility and CHP facility,
though the timing of the installations is varied across the cases.
7. All four paths are very close in costs illustrated with the NPV for each case within 1.2 percent.
a. All four have fairly consistent growth rates of total power supply costs and similar costs in
generation
b. Depending on cost allocations, there is a substantial shift in fixed costs, variable costs, and
net market interactions after the expiration of the SMMPA PSC CROD in 2031. Based on
the cost allocation assumed herein, for all four paths starting in 2031 the fixed costs increase
substantially, variable costs decrease substantially, and MISO market energy purchases
increase substantially [note: most of the renewable costs have been assumed to be fixed cost
components within this evaluation].

2015 Update of the RPU Infrastructure Study Resource Analysis & Strategy
Rochester Public Utilities 4-4 Burns & McDonnell
Table 4-1: Power Supply Paths and Costs
Path No. 1 2 3 4
Plan YearRetire CC1 2023,
Install Peaker 2023
Retire CC1 2018,
Install Peaker 2019
Retire CC1 2018,
Install Peaker 2018
Retire CC1 2018,
Install Peaker 2018,
Install CHP 2026
2016 Solar (500kW) Solar (500kW) Solar (500kW) Solar (500kW)
2017
2018 Retire CC1Retire CC1
Peaker (50MW)
Retire CC1
Peaker (50MW)
2019 Peaker (50MW)
2020
2021 Solar (3MW) Solar (3MW) Solar (3MW) Solar (3MW)
2022
2023Retire CC1
Peaker (50MW)
2024
2025
2026 CHP (30MW)
2027
2028 Solar (3MW) Solar (3MW) Solar (3MW) Solar (3MW)
2029 CHP (30MW) CHP (30MW) CHP (30MW)
2030
2031
Wind (150MW)
CCGT (390MW)
Solar (11MW)
Wind (150MW)
CCGT (390MW)
Solar (11MW)
Wind (150MW)
CCGT (390MW)
Solar (11MW)
Wind (150MW)
CCGT (390MW)
Solar (11MW)
2032
2033 Solar (500kW) Solar (500kW) Solar (500kW) Solar (500kW)
2034
2035 Solar (500kW) Solar (500kW) Solar (500kW) Solar (500kW)
NPV Cost
($000) $1,498,056 $1,506,011 $1,507,624 $1,515,469
% Difference 0.00% 0.53% 0.64% 1.16%

2015 Update of the RPU Infrastructure Study Resource Analysis & Strategy
Rochester Public Utilities 4-5 Burns & McDonnell
Figure 4-1: Total Annual Wholesale Power Supply Costs
Figure 4-2: Total Fixed Costs (Fixed O&M, Debt Service & Demand Charges)
$-
$20,000,000
$40,000,000
$60,000,000
$80,000,000
$100,000,000
$120,000,000
$140,000,000
$160,000,000
$180,000,000
$200,000,000
2016 2017 2018 2019 2020 2021 2022 2023 2024 2025 2026 2027 2028 2029 2030 2031 2032 2033 2034 2035
To
tal
An
nu
al
Co
st
Year
Total Annual Wholesale Power Supply Costs
Path 1 Path 2 Path 3 Path 4
$-
$10,000,000
$20,000,000
$30,000,000
$40,000,000
$50,000,000
$60,000,000
$70,000,000
$80,000,000
$90,000,000
$100,000,000
2016 2017 2018 2019 2020 2021 2022 2023 2024 2025 2026 2027 2028 2029 2030 2031 2032 2033 2034 2035
To
tal
An
nu
al
Co
st
Year
Total Fixed Costs (FOM + Debt Service + Demand Charges)
Path 1 Path 2 Path 3 Path 4

2015 Update of the RPU Infrastructure Study Resource Analysis & Strategy
Rochester Public Utilities 4-6 Burns & McDonnell
Figure 4-3: Total Variable Costs (Variable O&M & Fuel)
Figure 4-4: Net Market Interactions (Purchases less Sales)
$-
$20,000,000
$40,000,000
$60,000,000
$80,000,000
$100,000,000
$120,000,000
2016 2017 2018 2019 2020 2021 2022 2023 2024 2025 2026 2027 2028 2029 2030 2031 2032 2033 2034 2035
To
tal
An
nu
al
Co
st
Year
Total Variable Costs (VOM + Fuel)
Path 1 Path 2 Path 3 Path 4
$(20,000,000)
$(10,000,000)
$-
$10,000,000
$20,000,000
$30,000,000
$40,000,000
$50,000,000
2016 2017 2018 2019 2020 2021 2022 2023 2024 2025 2026 2027 2028 2029 2030 2031 2032 2033 2034 2035
To
tal
An
nu
al
Co
st
Year
Net Market Interaction (Purchases less Sales)
Path 1 Path 2 Path 3 Path 4

2015 Update of the RPU Infrastructure Study Resource Analysis & Strategy
Rochester Public Utilities 4-7 Burns & McDonnell
4.3 Sensitivity Considerations
With any power supply plan, evaluating alternative assumptions is important to determine how the power
supply path may be impacted should key assumptions vary from those in the base case. In this case,
major changes within assumptions for RPU will not greatly impact the infrastructure plan moving
forward. Below provides a discussion of the potential impacts that may occur due to changes within key
assumptions of forecasts.
• Fluctuations in natural gas and energy prices
o Due to EPA regulations, the only future is natural gas and renewables within RPU’s power
supply portfolio (though some MISO market energy will be provided by existing coal
resources outside of RPU).
o For self-build dispatchable resources, RPU will be tied to natural gas fuel regardless of the
path.
o Will not have a large impact on the path forward for RPU meeting its capacity and energy
requirements. However, the magnitude of the overall power supply costs will be affected by
fluctuations in natural gas and energy prices.
• Increased renewable requirement over 25 percent
o The main driver for new resources is capacity; wind and solar generation do not provide
significant capacity.
o Increased renewables requirements will likely require “over” procuring of resources.
• Pace of load growth
o Low load growth (or increased conservation) will avoid energy cost from CROD or MISO
market, but the path forward will be relatively unchanged and will likely lead to procuring
less market capacity/energy.
o High load growth (or new load) may accelerate the need for additional capacity resources,
though the specific path and resources will remain relatively unchanged, but the timing of the
resources may need to be moved forward.
• CO2 costs
o Overall MISO market prices will be affected as MISO market energy is dependent on both
coal-fired and natural gas-fired resources.
o RPU’s new resources will be compliant, efficient, and competitive within the MISO market.

2015 Update of the RPU Infrastructure Study Summary
Rochester Public Utilities 5-1 Burns & McDonnell
SUMMARY
5.1 Summary of Key Assumptions and Conclusions
Based on the analysis presented herein, BMcD provides the following summary of assumptions and
conclusions:
1. Environmental groups and agencies continue to aggressively target coal-fired plants in regards to
emissions.
a. This will lead to additional coal-fired plant retirements.
b. Increased retirements are anticipated to reduce market capacity availability and increase
MISO energy prices.
2. With the retirement of SLP from electric generation, RPU lost its “middle of the road” hedge
against MISO energy prices.
3. Due to its advanced age, continued operation of Cascade Creek Unit 1 may present additional
risks
a. Facing increased maintenance costs, inefficiency, lack of OEM support, and questionable
availability of spare parts
b. Difficult to participate in MISO energy market
4. The infrastructure plans includes:
a. Voluntary compliance with State of Minnesota renewable mandates
b. Compliance with proposed CO2 regulations
c. Allows RPU to begin the transition away from joint action agency (SMMPA PSC)
d. It may provide partnering opportunities after SMMPA PSC with other utilities
5. The infrastructure plan provides insight to several windows:
a. Short-term: The addition of peaking resource and retirement of Cascade Creek 1 will allow
RPU to maintain an appropriate amount of risk to market capacity pricing while also allowing
RPU to control the retirement of Cascade Creek 1.
b. Intermediate-term: The addition of a CHP facility appears favorable for RPU within its power
supply portfolio and Mayo.
c. Long-term: The likely replacement of SMMPA PSC is a combination of CCGT unit and
renewable generation.
6. Based on the current economic and market environment, there are several considerations for
earlier development of peaking resources:
a. Interest rates are currently low

2015 Update of the RPU Infrastructure Study Summary
Rochester Public Utilities 5-2 Burns & McDonnell
b. The current currency exchange rate (Euro to Dollar) is favorable for reciprocating engines
which are primarily priced with the Euro.
c. Controls capacity risk exposure (controls retirement of Cascade Creek 1)
d. The capacity market within MISO has shown decreased availability of capacity and increased
cost.
e. Provides a replacement energy-hedge with the retirement of SLP and Cascade Creek 1
f. Protects against exposure of Cost of New Entry (CONE) pricing, which is approximately
$90,000/MW-year with no benefit of energy revenue or asset investment.
7. RPU should continue to update the analysis of its future resource plans as major changes in the
industry occur or as assumptions change from those used herein.
5.2 Infrastructure Plan Highlights
The following provides the overall highlights of the infrastructure plan update:
1. Positions RPU for long-term power supply with the expiration of the SMMPA Power Sales
Contract (PSC) in 2030
2. Eliminates coal from the RPU portfolio by 2030 and significantly reduces carbon emissions
3. Meets renewable standards and objectives: 25 percent by 2025 renewable standard, 1.5 percent
solar standard, 1.5 percent conservation standard
4. Has the flexibility to accommodate potential sharp increases or decreases in load and energy
requirements due to DMC and customer solar
5. Positions RPU for short-term and long-term compliance with environmental regulations
6. Retires inefficient resource and modernizes the RPU generation fleet with high efficiency and
low emission units
7. Expands partnership opportunities with the Mayo Clinic and other combined heat and power
prospects

APPENDIX A – POWER SUPPLY STUDY ASSUMPTIONS

A-1
FINANCIAL ASSUMPTIONS • Inflation/escalation rate: 2.5 percent • Interest rate: 5.0 percent • Financing Period: 30 years • Discount rate for NPV calculations: 5.0 percent • Actual 2013 hourly load shape used for system profile. This hourly load shape is then adjusted for each
year to meet the peak demand and total annual energy. GENERATION RESOURCES Cascade Creek 1
• Gas fired combustion turbine • Commercial operation on 6/1/1975 • 27 MW summer capacity • 21.2 MW UCAP • 15,112 Btu/kWh heat rate • Fixed O&M $7.86/kW-year, 2015$, escalated at inflation • Variable O&M $1.59/MWh, 2015$, escalated at inflation • 21.3% forced outage rate
Cascade Creek 2
• Gas fired combustion turbine • Commercial operation on 4/1/2002 • 49.9 MW summer capacity • 47.4 MW UCAP • 10,917 Btu/kWh heat rate • Fixed O&M $4.43/kW-year, 2015$, escalated at inflation • Variable O&M $1.59/MWh, 2015$, escalated at inflation • 4.34% forced outage rate
IBM
• Two diesel fired combustion engines • Commercial operation on 10/1/2005 • 3.6 MW summer capacity • 9,589 Btu/kWh heat rate • No variable or fixed O&M costs modeled
Lake Zumbro
• Hydroelectric plant • Commercial operation on 11/1/1984 • 2 MW summer capacity • Fixed O&M $19.70/kW-year, 2015$, escalated at inflation
Olmsted Waste-to-Energy Facility
• Solid waste fired steam turbine • Commercial operation on 4/1/1987 • 2 MW summer capacity • Variable O&M $1.06/MWh, 2015$, no escalation

A-2
SMMPA PSC CROD • 216 MW capacity • Contract expires after 12/31/2030
On-Peak ($/MWh)
Off-Peak ($/MWh)
Demand ($/kW-
mo)
Trans. ($/kW-
mo) 2016 $55.21 $41.27 $10.66 $2.66 2017 $56.32 $42.09 $10.66 $2.66 2018 $57.44 $42.94 $10.66 $2.66 2019 $58.59 $43.80 $10.66 $2.66 2020 $59.76 $44.67 $10.66 $2.66 2021 $60.96 $45.56 $10.66 $2.66 2022 $62.18 $46.48 $10.66 $2.66 2023 $63.42 $47.41 $10.66 $2.66 2024 $64.69 $48.35 $10.66 $2.66 2025 $65.98 $49.32 $10.66 $2.66 2026 $67.30 $50.31 $10.66 $2.66 2027 $68.65 $51.31 $10.66 $2.66 2028 $70.02 $52.34 $10.66 $2.66 2029 $71.42 $53.39 $10.66 $2.66 2030 $72.85 $54.45 $10.66 $2.66
FORECASTS RPU Demand and Energy Forecast
Year
Non-Coincident Peak (MW)
MISO Coincident Peak (MW)
Energy (GWh)
2016 297.0 289.1 1,321.3 2017 305.8 297.7 1,346.4 2018 312.8 304.5 1,372.4 2019 319.1 310.7 1,395.8 2020 324.6 316.1 1,423.3 2021 330.9 322.2 1,445.9 2022 335.3 326.6 1,472.2 2023 339.1 330.3 1,500.1 2024 342.1 333.2 1,531.4 2025 347.0 338.0 1,553.5 2026 352.2 343.2 1,582.0 2027 356.5 347.4 1,609.7 2028 360.3 351.1 1,640.9 2029 368.4 359.0 1,664.2 2030 375.1 365.6 1,691.3 2031 382.0 372.3 1,717.2 2032 388.6 378.8 1,748.0 2033 397.1 387.1 1,772.9 2034 404.3 394.2 1,804.3 2035 411.9 401.6 1,836.4

A-3
Natural Gas
Year EIA Henry Hub
($/MMBtu, nominal) MTEP Henry Hub
($/MMBtu, nominal) 2016 $4.41 $4.91 2017 $4.76 $5.47 2018 $5.27 $6.03 2019 $5.19 $6.43 2020 $4.96 $6.83 2021 $5.37 $7.24 2022 $5.64 $7.64 2023 $5.90 $8.04 2024 $6.20 $8.47 2025 $6.45 $8.90 2026 $6.72 $9.33 2027 $7.00 $9.76 2028 $7.26 $10.19 2029 $7.63 $10.62 2030 $8.12 $11.05 2031 $8.47 $11.48 2032 $8.91 $11.91 2033 $9.41 $12.34 2034 $9.83 $12.77 2035 $10.31 $13.20
MISO Market Energy
MTEP Average Annual Market Prices
Year Off-Peak
($/MWh, nominal) On-Peak
($/MWh, nominal) 2016 $23.70 $42.07 2017 $24.14 $43.48 2018 $24.57 $44.88 2019 $26.07 $48.31 2020 $27.57 $51.73 2021 $29.08 $55.16 2022 $30.58 $58.58 2023 $32.08 $62.01 2024 $33.02 $64.43 2025 $33.95 $66.86 2026 $34.89 $69.28 2027 $35.82 $71.71 2028 $36.76 $74.13 2029 $37.69 $76.56 2030 $38.63 $78.98 2031 $39.56 $81.41 2032 $40.50 $83.83 2033 $41.43 $86.26 2034 $42.37 $88.69 2035 $43.31 $91.11

A-4
RENEWABLE ENERGY INSTALLATION SCHEDULE
Year
Annu
al
Ener
gy
Fore
cast
(G
Wh)
CRO
D En
ergy
(G
Wh)
Ener
gy
Abov
e CR
OD
(GW
h)
Sola
r Re
quire
men
t -
Perc
ent o
f An
nual
En
ergy
(%)
Sola
r Ene
rgy
Requ
irem
ent
(GW
h)
Sola
r Ge
nera
tion
Capa
city
Fa
ctor
Impl
ied
Sola
r Ca
paci
ty
Requ
irem
ent
(MW
)
Sola
r Ge
nera
tion
Inst
all
Sche
dule
(M
W)
Tota
l Sol
ar
Gene
ratio
n In
stal
led
(MW
)
Rene
wab
le
Requ
irem
ent -
Pe
rcen
t of
Annu
al E
nerg
y (%
)
Rene
wab
le
Ener
gy
Requ
irem
ent
(GW
h)
Win
d Ca
paci
ty
Fact
or
Impl
ied
Win
d Ca
paci
ty
Requ
irem
ent
(MW
)20
161,
321
1,26
0
61
0.5
0.5
2017
1,34
6
1,
260
86
0.
520
181,
372
1,26
0
112
0.
520
191,
396
1,26
0
135
0.
520
201,
423
1,26
0
163
0.
520
211,
446
1,26
0
186
1.
5%3
18%
1.8
33.
520
221,
472
1,26
0
212
1.
5%3
18%
2.0
3.5
2023
1,50
0
1,
260
24
0
1.5%
418
%2.
33.
520
241,
531
1,26
0
271
1.
5%4
18%
2.6
3.5
2025
1,55
3
1,
260
29
3
1.5%
418
%2.
83.
520
261,
582
1,26
0
322
1.
5%5
18%
3.1
3.5
2027
1,61
0
1,
260
34
9
1.5%
518
%3.
33.
520
281,
641
1,26
0
381
1.
5%6
18%
3.6
36.
520
291,
664
1,26
0
404
1.
5%6
18%
3.8
6.5
2030
1,69
1
1,
260
43
1
1.5%
618
%4.
16.
520
311,
717
-
1,
717
1.5%
2618
%16
.311
.518
25.0
%42
933
%14
8.5
2032
1,74
8
-
1,74
8
1.
5%26
18%
16.6
1825
.0%
437
33%
151.
220
331,
773
-
1,
773
1.5%
2718
%16
.918
25.0
%44
333
%15
3.3
2034
1,80
4
-
1,80
4
1.
5%27
18%
17.2
1825
.0%
451
33%
156.
020
351,
836
-
1,
836
1.5%
2818
%17
.518
25.0
%45
933
%15
8.8
Sola
r Gen
erat
ion
Sum
mar
yW
ind
Gene
ratio
n Su
mm
ary

APPENDIX B – NEW RESOURCE TECHNOLOGY ASSESSMENT

Rochester Public Utilities
2015 Update of the RPU Infrastructure Plan
Generation Technoogy Assessment
BMcD Project No. 82902
PROJECT TYPE Reciprocating EngineAeroderivative
SCGT
"F-Class"
SCGT
"F-Class"
CCGT
Combined Heat and
Power Facility50 MW Wind Solar
BASE PLANT DESCRIPTION
Number of Gas Turbines, Engines or Boilers 6 1 1 1 1 22 N/A
Number of HRSGs N/A N/A N/A 1 1 N/A N/A
Number of Steam Turbines N/A N/A N/A 1 N/A N/A N/A
Expected Service Life (years) (Note 1) 30 30 30 30 30 30 30
Fuel Design Natural Gas Natural Gas Natural Gas Natural Gas Natural Gas N/A N/A
Heat Rejection Fin-Fan Heat Ex. Fin-Fan Heat Ex. Fin-Fan Heat Ex. Wet Cooling Tower Fin-Fan Heat Ex. N/A N/A
NOx Control SCR Water Injection DLN DLN/SCR Water Injection/SCR N/A N/A
SO2 Control N/A N/A N/A N/A N/A N/A N/A
Particulate ControlGood Combustion
Practice
Good Combustion
Practice
Good Combustion
Practice
Good Combustion
Practice
Good Combustion
PracticeN/A N/A
CO Control CO CatalystGood Combustion
Practice
Good Combustion
PracticeCO Catalyst CO Catalyst N/A N/A
CO2 Control N/A N/A N/A N/A N/A N/A N/A
Technology Rating Mature Mature Mature Mature Mature Mature Mature
PERFORMANCE
Summer Peak Base Load Performance (82°F, 56% RH)
Net Plant Output, kW 54,600 44,900 213,800 317,000 32,200 50,000 500
Net Plant Heat Rate, Btu/kWh (HHV) 8,490 9,690 9,890 6,710 4,150 N/A N/A
Heat Input, MMBtu/h (HHV) 460 440 2,110 2,130 134 N/A N/A
Summer Peak Average Fired Performance
Incremental Duct Firing Net Output, kW N/A N/A N/A 95,300 N/A N/A N/A
Incremental Duct Firing Heat Rate, Btu/kWh (HHV) N/A N/A N/A 8,390 N/A N/A N/A
Incremental Duct Firing Heat Input, MMBtu/h (HHV) N/A N/A N/A 800 N/A N/A N/A
Total Net Fired Plant Output, kW N/A N/A N/A 412,300 N/A N/A N/A
Total Net Fired Plant Heat Rate, Btu/kWh (HHV) N/A N/A N/A 7,110 N/A N/A N/A
Total Net Fired Plant Heat Input, MMBtu/h (HHV) N/A N/A N/A 2,930 N/A N/A N/A
Assumed Firm Capacity Credit for MISO Resource Adequacy, kW 52,000 43,000 203,000 392,000 31,000 7,000 8% of Output
CAPITAL COSTS
Base Plant Capital Costs
Project Cost, 2015M$ (w/o Owner's Costs) $51 $58 $100 $282 $54 $90 $1.2
Owner's Costs 2015M$ (without Escalation and IDC) $15 $18 $32 $58 $17 Incl. in Project Costs Incl. in Project Costs
Total Capital Cost, 2015M$ $65 $77 $132 $340 $71 $90 $1.2
Total Capital Cost 2015$/kW Avg Annual Unfired Output $1,199 $1,712 $615 $1,076 $2,214 $1,804 $2,440
Incremental Duct-Firing Capital Costs
Project Cost, 2015M$ (w/o Owner's Costs) N/A N/A N/A $32 N/A N/A N/A
Owner's Costs 2015M$ (without Escalation and IDC) N/A N/A N/A $2 N/A N/A N/A
Total Capital Cost, 2015M$ N/A N/A N/A $34 N/A N/A N/A
Total Capital Cost 2015$/kW Avg Annual Incremental Fired Output N/A N/A N/A $359 N/A N/A N/A
Total Plant Capital Costs (Base + Duct-Firing)
Project Cost, 2015M$ (w/o Owner's Costs) N/A N/A N/A $314 N/A N/A N/A
Owner's Costs 2015M$ (without Escalation and IDC) N/A N/A N/A $60 N/A N/A N/A
Total Capital Cost, 2015M$ N/A N/A N/A $374 N/A N/A N/A
Total Capital Cost 2015$/kW Avg Annual Fired Output N/A N/A N/A $912 N/A N/A N/A
NON-FUEL OPERATION & MAINTENANCE COSTS
Fixed O&M Cost, 2015$/kW-Yr $10.97 $23.78 $7.18 $12.81 $18.60 $18.45 $11.89
Engine Major Maintenance, 2015$/Start/GT (Note 2 & 3) N/A N/A $15,375 $15,375 N/A N/A N/A
Engine Major Maintenance, 2015$/GT-h (Note 2 & 3) $24 $195 $410 $410 $138 N/A N/A
Engine Major Maintenance, 2015$/MWh (Note 2 & 3) $2.59 $4.34 $1.92 $1.29 $4.30 N/A N/A
Variable O&M, 2015$/MWh (excl. major maintenance) $4.51 $6.66 $0.92 $1.33 $6.66 Incl. In Fixed Incl. In Fixed
Total Non-Fuel Variable O&M, 2015$/MWh $7.10 $11.00 $2.84 $2.63 $10.96 N/A N/A
ESTIMATED EMISSIONS, ppm
NOX 5.0 25.0 9.0 2.0 2.5 N/A N/A
SO2 N/A N/A N/A N/A N/A N/A N/A
CO 15.0 33.0 9.0 2.0 3.3 N/A N/A
CO2 N/A N/A N/A N/A N/A N/A N/A
ESTIMATED EMISSIONS, lb/MMBtu (HHV)
NOX N/A N/A N/A N/A N/A N/A N/A
SO2 < 0.0051 < 0.0051 < 0.0051 < 0.0051 < 0.0051 N/A N/A
CO N/A N/A N/A N/A N/A N/A N/A
CO2 120 120 120 120 120 N/A N/A
NOTES
GENERAL ASSUMPTIONS
The following assumptions govern this analysis:
General
- All estimates in this table are "screening level" and are not to be guaranteed.
- Natural gas fuel is pipeline quality ( .75 grains / 100 SCF sulfur )
- All emission limits are subject to the BACT process.
Capital Cost Estimates
- A multiple contract (MCC) contracting method is assumed for this project.
- All capital cost estimates exclude escalation and are reflective of 2015$.
- Plant capital cost ($/kW) is based on the net output at summer conditions (82°F, 56% RH).
- The plant site is a greenfield site that is clear of trees and wetlands and is reasonably level. There are no existing structures or underground utilities.
- Sufficient laydown area is available.
- Piling is included under heavily loaded foundations.
- All options include a full enclosure, generation building, warehouse, control room, and other typical buildings.
- The LM6000 option includes natural gas compressors. All other options assume gas is available at proper pressure at the site boundary.
Note 3: GE aero units major maintenance is based on operating hours only.
Note 1: Service life is estimated as the expected economic life. Plants may operate longer or shorter in duration, but at the end of the presented durations it may not be economically feasible to maintain the asset depending on how it has been
operated and the energy market at that time.Note 2: For GE frame units, major maintenance cost is calculated based on either individual counts of starts or operating hours. If operating hours is more than or equal to 27 hours/equivalent starts, levelized major maintenance cost in $/hr should
be used to determine major maintenance cost. If operating hours/start is less than 27 hours/equivalent starts, $/start should be used to determine major maintenance cost. Both levelized major maintenance cost in $/hr and $/start represent cost
for gas turbine maintenance only, including accrual for major overhaul, and does not include fuel and other variable consumptions.

Rochester Public Utilities
2015 Update of the RPU Infrastructure Plan
Generation Technoogy Assessment
BMcD Project No. 82902
Owner's Cost
- Owner's costs do not include emissions reduction credits, land, water rights, financing fees, escalation or AFUDC.
Tie-Ins
- On site wells and pipe are included in the owner's costs for raw water supply.
- An on-site switchyard is included in the Owner's costs for all options. Transmission interconnect and lines from the site have been excluded.
- A 5-mile natural gas pipeline is included in the owner's costs.
Performance Estimates
- Output and heat rate estimates are at new & clean conditions.
- Performance estimates provided are based on summer conditions (82°F, 56% RH).
- Evaporative cooling is included for the gas turbine options and operates above ambient conditions of 59°F.
- Combined cycle option is fully fired to a duct burner temperature of 1,600F.
O&M Estimates are based on the following assumptions:
- Fuel costs are not included in the O&M analysis.
- Demineralized and raw water production and treatment costs are included in the variable O&M analysis. Water treatment equipment is included in the capital cost.
- Simple cycle options assume demin trailers (where applicable), while the combined cycle option assumes an on site demineralized water system.
- O&M Costs do not include emissions allowances.
- Fixed O&M includes staffing costs, major maintenance service director fee, standby power, and other office and administration cost.
- Variable O&M includes raw water, consumables, and other O&M such as BOP equipment maintenance and startup cost.
- Owner's costs include project development, operations personnel prior to COD, startup management, construction power, legal costs, permitting and licensing fees, site security, operating spare parts, permanent plant furnishings and
equipment,water and natural gas infrastructure/supply, sales tax and duties, and 5% owners contingency.

APPENDIX C – DISPATCH MODEL RESULTS
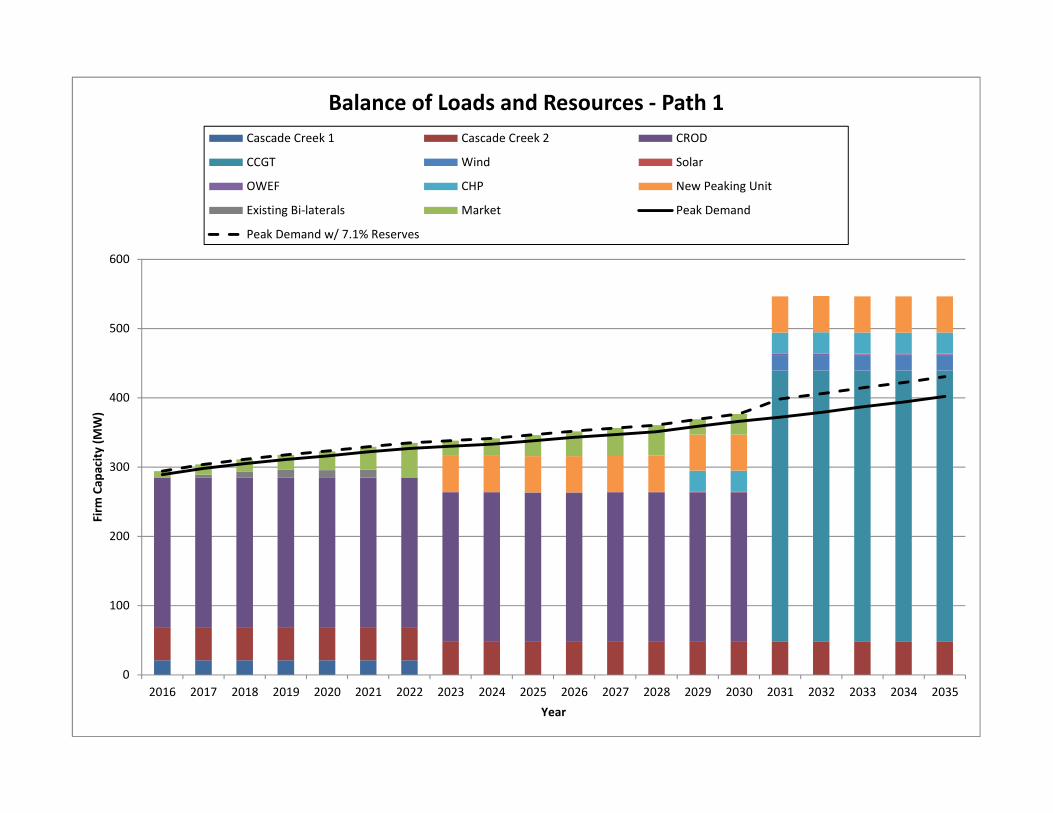
0
100
200
300
400
500
600
2016 2017 2018 2019 2020 2021 2022 2023 2024 2025 2026 2027 2028 2029 2030 2031 2032 2033 2034 2035
Firm
Cap
acity
(MW)
Year
Balance of Loads and Resources ‐ Path 1Cascade Creek 1 Cascade Creek 2 CROD
CCGT Wind Solar
OWEF CHP New Peaking Unit
Existing Bi‐laterals Market Peak Demand
Peak Demand w/ 7.1% Reserves

0
100
200
300
400
500
600
2016 2017 2018 2019 2020 2021 2022 2023 2024 2025 2026 2027 2028 2029 2030 2031 2032 2033 2034 2035
Firm
Cap
acity
(MW)
Year
Balance of Loads and Resources ‐ Path 2Cascade Creek 1 Cascade Creek 2 CROD
CCGT Wind Solar
OWEF CHP New Peaking Unit
Existing Bi‐laterals Market Peak Demand
Peak Demand w/ 7.1% Reserves

0
100
200
300
400
500
600
2016 2017 2018 2019 2020 2021 2022 2023 2024 2025 2026 2027 2028 2029 2030 2031 2032 2033 2034 2035
Firm
Cap
acity
(MW)
Year
Balance of Loads and Resources ‐ Path 3Cascade Creek 1 Cascade Creek 2 CROD
CCGT Wind Solar
OWEF CHP New Peaking Unit
Existing Bi‐laterals Market Peak Demand
Peak Demand w/ 7.1% Reserves
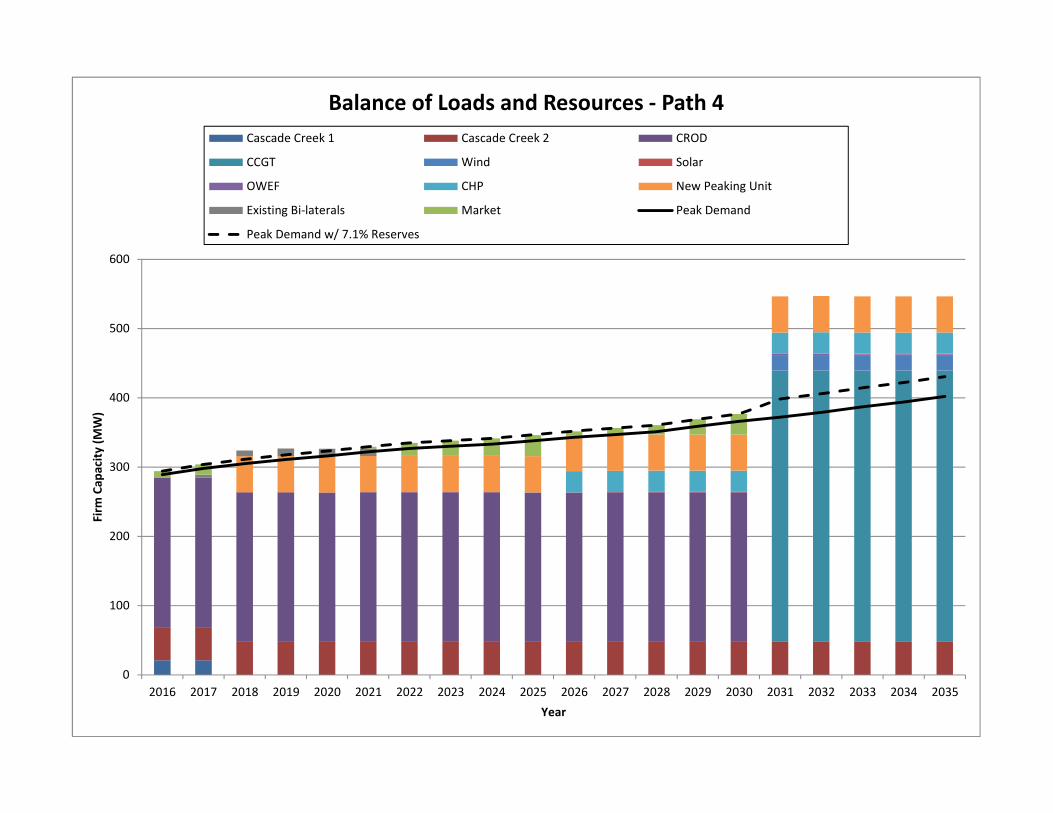
0
100
200
300
400
500
600
2016 2017 2018 2019 2020 2021 2022 2023 2024 2025 2026 2027 2028 2029 2030 2031 2032 2033 2034 2035
Firm
Cap
acity
(MW)
Year
Balance of Loads and Resources ‐ Path 4Cascade Creek 1 Cascade Creek 2 CROD
CCGT Wind Solar
OWEF CHP New Peaking Unit
Existing Bi‐laterals Market Peak Demand
Peak Demand w/ 7.1% Reserves
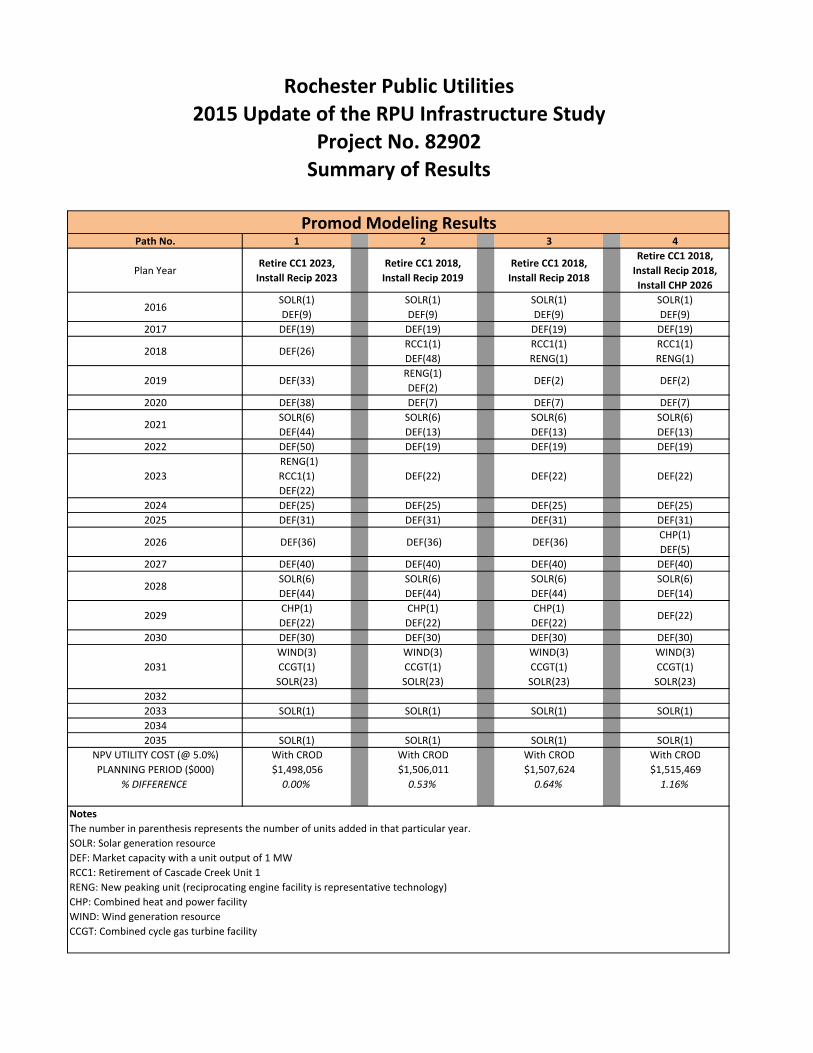
Path No. 1 2 3 4
Plan YearRetire CC1 2023,
Install Recip 2023
Retire CC1 2018,
Install Recip 2019
Retire CC1 2018,
Install Recip 2018
Retire CC1 2018,
Install Recip 2018,
Install CHP 2026
2016SOLR(1)
DEF(9)
SOLR(1)
DEF(9)
SOLR(1)
DEF(9)
SOLR(1)
DEF(9)
2017 DEF(19) DEF(19) DEF(19) DEF(19)
2018 DEF(26)RCC1(1)
DEF(48)
RCC1(1)
RENG(1)
RCC1(1)
RENG(1)
2019 DEF(33)RENG(1)
DEF(2)DEF(2) DEF(2)
2020 DEF(38) DEF(7) DEF(7) DEF(7)
2021SOLR(6)
DEF(44)
SOLR(6)
DEF(13)
SOLR(6)
DEF(13)
SOLR(6)
DEF(13)
2022 DEF(50) DEF(19) DEF(19) DEF(19)
2023
RENG(1)
RCC1(1)
DEF(22)
DEF(22) DEF(22) DEF(22)
2024 DEF(25) DEF(25) DEF(25) DEF(25)
2025 DEF(31) DEF(31) DEF(31) DEF(31)
2026 DEF(36) DEF(36) DEF(36)CHP(1)
DEF(5)
2027 DEF(40) DEF(40) DEF(40) DEF(40)
2028SOLR(6)
DEF(44)
SOLR(6)
DEF(44)
SOLR(6)
DEF(44)
SOLR(6)
DEF(14)
2029CHP(1)
DEF(22)
CHP(1)
DEF(22)
CHP(1)
DEF(22)DEF(22)
2030 DEF(30) DEF(30) DEF(30) DEF(30)
2031
WIND(3)
CCGT(1)
SOLR(23)
WIND(3)
CCGT(1)
SOLR(23)
WIND(3)
CCGT(1)
SOLR(23)
WIND(3)
CCGT(1)
SOLR(23)
2032
2033 SOLR(1) SOLR(1) SOLR(1) SOLR(1)
2034
2035 SOLR(1) SOLR(1) SOLR(1) SOLR(1)
NPV UTILITY COST (@ 5.0%) With CROD With CROD With CROD With CROD
PLANNING PERIOD ($000) $1,498,056 $1,506,011 $1,507,624 $1,515,469
% DIFFERENCE 0.00% 0.53% 0.64% 1.16%
Notes
The number in parenthesis represents the number of units added in that particular year.
SOLR: Solar generation resource
DEF: Market capacity with a unit output of 1 MW
RCC1: Retirement of Cascade Creek Unit 1
RENG: New peaking unit (reciprocating engine facility is representative technology)
CHP: Combined heat and power facility
WIND: Wind generation resource
CCGT: Combined cycle gas turbine facility
Promod Modeling Results
Rochester Public Utilities
2015 Update of the RPU Infrastructure Study
Project No. 82902
Summary of Results

Rochester Public Utilities2015 Update of the RPU Infrastructure StudyProject No. 82902Path 1: Retire CC1 2023, peaking resource added in 2023, CHP added in 2029
2016 2017 2018 2019 2020 2021 2022 2023 2024 2025 2026 2027 2028 2029 2030 2031 2032 2033 2034 2035Annual Energy Requirements (MWh) 1,321,298 1,346,402 1,372,397 1,395,798 1,423,297 1,445,898 1,472,201 1,500,100 1,531,394 1,553,500 1,582,000 1,609,697 1,640,901 1,664,201 1,691,300 1,717,197 1,748,004 1,772,901 1,804,300 1,836,400
Market EnergyMarket Energy Purchases (MWh) 23,583 25,663 26,331 31,408 33,981 41,200 51,301 52,454 55,631 62,315 70,795 78,594 85,667 97,949 111,114 1,717,197 1,744,025 1,772,901 1,804,300 1,836,400 Market Energy Purchases Cost ($) 1,059,558$ 1,260,757$ 1,392,044$ 1,749,565$ 2,029,511$ 2,533,735$ 3,126,625$ 3,490,470$ 3,883,499$ 4,415,727$ 5,133,172$ 5,814,662$ 6,471,221$ 7,563,607$ 8,759,055$ 110,242,103$ 115,122,250$ 120,082,732$ 125,464,083$ 131,180,376$ Average Market Energy Purchase Cost ($/MWh) 44.93$ 49.13$ 52.87$ 55.70$ 59.72$ 61.50$ 60.95$ 66.54$ 69.81$ 70.86$ 72.51$ 73.98$ 75.54$ 77.22$ 78.83$ 64.20$ 66.01$ 67.73$ 69.54$ 71.43$ Market Energy Sales (MWh) 24,528 19,529 17,110 17,459 17,950 22,519 21,988 47,135 46,737 44,730 41,251 41,461 42,548 218,180 216,654 1,024,075 1,011,405 978,518 988,294 985,864 Market Energy Sales Revenue ($) 1,318,762$ 998,988$ 844,014$ 938,775$ 1,051,991$ 1,329,404$ 1,317,305$ 3,998,235$ 4,124,908$ 4,069,759$ 3,787,303$ 4,028,592$ 3,989,341$ 15,445,589$ 15,778,212$ 80,376,603$ 84,155,375$ 81,832,418$ 85,979,915$ 87,538,207$ Average Market Energy Sales Revenue ($/MWh) 53.76$ 51.15$ 49.33$ 53.77$ 58.61$ 59.03$ 59.91$ 84.82$ 88.26$ 90.99$ 91.81$ 97.17$ 93.76$ 70.79$ 72.83$ 78.49$ 83.21$ 83.63$ 87.00$ 88.79$
Market PricingLMP On-Peak Average ($/MWh) 39.72$ 41.02$ 42.28$ 45.36$ 48.58$ 51.75$ 55.00$ 58.18$ 60.29$ 62.50$ 64.78$ 67.01$ 69.34$ 71.55$ 73.62$ 75.85$ 78.16$ 80.49$ 82.73$ 84.93$ LMP Off-Peak Average ($/MWh) 24.37$ 24.82$ 25.30$ 26.99$ 28.53$ 30.12$ 31.61$ 33.18$ 34.33$ 35.29$ 36.28$ 37.29$ 38.14$ 39.17$ 40.37$ 41.30$ 42.30$ 43.15$ 44.14$ 45.15$
Market CapacityMarket Capacity Purchase (MW) 9 15 18 22 27 33 50 22 25 31 36 40 44 22 30 - - - - - Market Capacity Cost ($/kW-mo) 4.00$ 4.08$ 4.16$ 4.24$ 4.33$ 4.42$ 4.50$ 4.59$ 4.69$ 4.78$ 4.88$ 4.97$ 5.07$ 5.17$ 5.28$ 5.38$ 5.49$ 5.60$ 5.71$ 5.83$ Total Market Capacity Cost ($) 439,429$ 724,403$ 913,522$ 1,106,367$ 1,406,845$ 1,763,156$ 2,680,285$ 1,207,732$ 1,413,017$ 1,749,641$ 2,097,753$ 2,395,555$ 2,686,915$ 1,373,243$ 1,876,435$ -$ -$ -$ -$ -$
Unit Operating Capacity (MW)CC1 27 27 27 27 27 27 27 27 - - - - - - - - - - - - CC2 50 50 50 50 50 50 50 50 50 50 50 50 50 50 50 50 50 50 50 50 CCGT - - - - - - - - - - - - - - - 317 317 317 317 317 CHP - - - - - - - - - - - - - 32 32 32 32 32 32 32 RENG - - - - - - - 55 55 55 55 55 55 55 55 55 55 55 55 55 CROD OFF 216 216 216 216 216 216 216 216 216 216 216 216 216 216 216 - - - - - CROD On 216 216 216 216 216 216 216 216 216 216 216 216 216 216 216 - - - - - LZ 3 3 3 3 3 3 3 3 3 3 3 3 3 3 3 3 3 3 3 3 OWEF (PPA) 5 5 5 5 5 5 5 5 5 5 5 5 5 5 5 5 5 5 5 5 SOLAR (PPA) 1 1 1 1 1 4 4 4 4 4 4 4 7 7 7 18 18 21 21 24 WIND (PPA) - - - - - - - - - - - - - - - 150 150 150 150 150
Number of StartsCC1 3 2 1 1 1 - 2 - - - - - - - - - - - - - CC2 37 23 15 16 18 17 16 19 17 16 13 13 9 10 11 12 11 10 11 11 CCGT - - - - - - - - - - - - - - - 122 122 114 116 112 CHP - - - - - - - - - - - - - 13 19 14 15 16 9 17 RENG - - - - - - - 117 123 114 108 104 90 98 94 95 87 83 77 84
Unit Generation (MWh)CC1 432 270 122 122 122 - 270 - - - - - - - - - - - - - CC2 11,277 6,462 4,192 4,541 5,015 4,840 4,017 5,439 4,915 4,516 3,343 3,643 2,720 2,894 2,944 3,169 3,019 2,869 3,069 2,919 CCGT - - - - - - - - - - - - - - - 340,797 329,163 295,258 306,480 296,177 CHP - - - - - - - - - - - - - 176,311 175,538 175,941 174,894 173,349 173,284 173,751 RENG - - - - - - - 23,991 24,101 22,509 20,203 20,093 17,184 17,294 16,470 16,141 14,494 13,176 11,529 14,274 CROD OFF 760,826 773,361 786,601 798,348 812,728 823,817 836,952 850,659 866,233 876,518 890,213 902,920 917,001 925,346 935,701 - - - - - CROD On 542,200 550,225 558,639 566,042 575,009 581,837 589,826 598,046 607,213 613,160 620,908 627,860 635,225 639,430 644,485 - - - - - LZ 11,523 11,504 11,504 11,504 11,517 11,504 11,504 11,504 11,517 11,504 11,504 11,504 11,517 11,504 11,504 11,504 11,517 11,504 11,504 11,504 OWEF (PPA) 479 479 479 479 479 479 479 479 479 479 479 479 479 479 479 18,379 18,441 18,382 18,382 18,382 SOLAR (PPA) 817 814 814 814 818 5,696 5,718 5,722 5,725 5,722 5,722 5,742 10,649 10,600 10,620 29,357 29,445 34,308 34,325 39,137 WIND (PPA) - - - - - - - - - - - - - - - 429,705 431,269 430,573 430,573 430,573
RPU Generation Subtotal (MWh) 23,233 18,236 15,818 16,167 16,654 16,345 15,791 40,935 40,534 38,529 35,051 35,241 31,421 208,003 206,457 547,552 533,088 496,156 505,866 498,625 CROD Subtotal (MWh) 1,303,026 1,323,586 1,345,240 1,364,390 1,387,738 1,405,654 1,426,778 1,448,705 1,473,447 1,489,677 1,511,121 1,530,779 1,552,226 1,564,777 1,580,185 - - - - -
PPA Purchase Subtotal (MWh) 1,296 1,293 1,293 1,293 1,296 6,174 6,197 6,201 6,204 6,201 6,201 6,221 11,127 11,078 11,098 477,441 479,154 483,264 483,281 488,092
Total Unit Generation (MWh) 1,327,555 1,343,115 1,362,350 1,381,849 1,405,688 1,428,173 1,448,766 1,495,840 1,520,184 1,534,407 1,552,372 1,572,240 1,594,774 1,783,858 1,797,740 1,024,993 1,012,242 979,419 989,147 986,718 Capacity Factor
CC1 0.2% 0.1% 0.1% 0.1% 0.1% 0.0% 0.1% 0.0%CC2 2.6% 1.5% 1.0% 1.0% 1.1% 1.1% 0.9% 1.2% 1.1% 1.0% 0.8% 0.8% 0.6% 0.7% 0.7% 0.7% 0.7% 0.7% 0.7% 0.7%CCGT 12.3% 11.9% 10.6% 11.0% 10.7%CHP 62.5% 62.2% 62.4% 62.0% 61.5% 61.4% 61.6%RENG 5.0% 5.0% 4.7% 4.2% 4.2% 3.6% 3.6% 3.4% 3.4% 3.0% 2.7% 2.4% 3.0%
Fuel Cost ($)CC1 36,985$ 25,763$ 12,785$ 13,637$ 14,598$ -$ 35,988$ -$ -$ -$ -$ -$ -$ -$ -$ -$ -$ -$ -$ -$ CC2 709,869$ 453,167$ 320,464$ 370,121$ 435,928$ 444,773$ 390,827$ 556,795$ 527,296$ 511,760$ 396,132$ 449,529$ 349,257$ 389,410$ 412,275$ 459,997$ 454,797$ 446,258$ 493,961$ 485,666$ CCGT -$ -$ -$ -$ -$ -$ -$ -$ -$ -$ -$ -$ -$ -$ -$ 30,814,364$ 30,824,475$ 28,528,309$ 30,771,023$ 30,816,946$ CHP -$ -$ -$ -$ -$ -$ -$ -$ -$ -$ -$ -$ -$ 9,137,309$ 9,459,817$ 9,848,592$ 10,150,009$ 10,421,775$ 10,790,053$ 11,172,540$ RENG -$ -$ -$ -$ -$ -$ -$ 1,924,846$ 2,042,340$ 2,003,099$ 1,886,327$ 1,966,327$ 1,751,071$ 1,837,897$ 1,824,093$ 1,858,811$ 1,732,760$ 1,632,721$ 1,484,180$ 1,887,279$
Total Fuel Costs ($) 746,853$ 478,930$ 333,249$ 383,758$ 450,526$ 444,773$ 426,815$ 2,481,642$ 2,569,637$ 2,514,860$ 2,282,459$ 2,415,855$ 2,100,328$ 11,364,616$ 11,696,185$ 42,981,764$ 43,162,041$ 41,029,064$ 43,539,217$ 44,362,431$ Variable O&M ($)
CC1 714$ 448$ 207$ 211$ 217$ -$ 508$ -$ -$ -$ -$ -$ -$ -$ -$ -$ -$ -$ -$ -$ CC2 18,540$ 10,727$ 7,126$ 7,901$ 8,977$ 8,858$ 7,552$ 10,497$ 9,683$ 9,122$ 6,921$ 7,759$ 5,929$ 6,454$ 6,742$ 7,446$ 7,245$ 7,087$ 7,764$ 7,561$ CCGT -$ -$ -$ -$ -$ -$ -$ -$ -$ -$ -$ -$ -$ -$ -$ 1,327,523$ 1,314,259$ 1,208,355$ 1,285,638$ 1,273,479$ CHP -$ -$ -$ -$ -$ -$ -$ -$ -$ -$ -$ -$ -$ 2,729,701$ 2,785,680$ 2,861,869$ 2,915,968$ 2,962,453$ 3,035,387$ 3,119,654$ RENG -$ -$ -$ -$ -$ -$ -$ 207,636$ 213,801$ 204,669$ 188,295$ 191,954$ 168,261$ 173,570$ 169,437$ 170,200$ 156,653$ 145,972$ 130,919$ 166,142$ CROD OFF 31,398,662$ 32,554,308$ 33,773,894$ 34,963,812$ 36,305,470$ 37,536,838$ 38,898,029$ 40,325,764$ 41,885,356$ 43,230,295$ 44,783,891$ 46,331,575$ 47,995,210$ 49,400,630$ 50,952,483$ -$ -$ -$ -$ -$ CROD On 29,936,295$ 30,986,936$ 32,089,981$ 33,165,541$ 34,364,802$ 35,468,276$ 36,674,429$ 37,929,244$ 39,280,854$ 40,458,821$ 41,789,480$ 43,102,515$ 44,480,296$ 45,670,286$ 46,951,916$ -$ -$ -$ -$ -$
Total Variable O&M Costs ($) 61,354,212$ 63,552,419$ 65,871,208$ 68,137,466$ 70,679,466$ 73,013,972$ 75,580,518$ 78,473,141$ 81,389,694$ 83,902,907$ 86,768,588$ 89,633,804$ 92,649,696$ 97,980,640$ 100,866,258$ 4,367,037$ 4,394,126$ 4,323,867$ 4,459,708$ 4,566,836$ Total Dispatch Cost (Fuel + Variable O&M) ($/MWh)
CC1 87.27$ 97.08$ 106.93$ 113.98$ 121.93$ 135.17$ CC2 64.59$ 71.79$ 78.15$ 83.25$ 88.72$ 93.72$ 99.17$ 104.30$ 109.25$ 115.34$ 120.56$ 125.54$ 130.60$ 136.78$ 142.32$ 147.52$ 153.05$ 158.00$ 163.49$ 168.96$ CCGT 94.31$ 97.64$ 100.71$ 104.60$ 108.35$ CHP 67.31$ 69.76$ 72.24$ 74.71$ 77.21$ 79.78$ 82.26$ RENG 88.89$ 93.61$ 98.08$ 102.69$ 107.41$ 111.69$ 116.31$ 121.04$ 125.71$ 130.36$ 134.99$ 140.09$ 143.86$ CROD OFF 41.27$ 42.09$ 42.94$ 43.80$ 44.67$ 45.56$ 46.48$ 47.41$ 48.35$ 49.32$ 50.31$ 51.31$ 52.34$ 53.39$ 54.45$ CROD On 55.21$ 56.32$ 57.44$ 58.59$ 59.76$ 60.96$ 62.18$ 63.42$ 64.69$ 65.98$ 67.30$ 68.65$ 70.02$ 71.42$ 72.85$
Fixed O&M ($)CC1 314,199$ 317,520$ 325,620$ 333,720$ 342,090$ 350,460$ 359,370$ -$ -$ -$ -$ -$ -$ -$ -$ -$ -$ -$ -$ -$ CC2 226,610$ 229,041$ 234,530$ 240,518$ 246,506$ 252,993$ 258,981$ 265,468$ 272,454$ 278,941$ 285,927$ 293,412$ 300,398$ 307,883$ 315,867$ 323,851$ 331,835$ 339,819$ 348,302$ 357,284$ CCGT -$ -$ -$ -$ -$ -$ -$ -$ -$ -$ -$ -$ -$ -$ -$ 6,028,236$ 6,178,942$ 6,333,415$ 6,491,751$ 6,654,044$ CHP -$ -$ -$ -$ -$ -$ -$ -$ -$ -$ -$ -$ -$ 846,258$ 867,415$ 889,100$ 911,328$ 934,111$ 957,464$ 981,400$ RENG -$ -$ -$ -$ -$ -$ -$ 729,777$ 748,021$ 766,722$ 785,890$ 805,537$ 825,676$ 846,318$ 867,476$ 889,162$ 911,392$ 934,176$ 957,531$ 981,469$ CROD OFF -$ -$ -$ -$ -$ -$ -$ -$ -$ -$ -$ -$ -$ -$ -$ -$ -$ -$ -$ -$ CROD On 31,325,795$ 31,520,589$ 31,792,666$ 32,034,918$ 32,399,314$ 32,563,196$ 32,837,514$ 33,092,167$ 33,446,494$ 33,536,299$ 33,718,273$ 33,881,554$ 34,086,336$ 34,060,265$ 34,078,584$ -$ -$ -$ -$ -$ LZ 52,338$ 53,219$ 54,296$ 55,373$ 56,658$ 57,632$ 58,762$ 59,944$ 61,320$ 62,387$ 63,622$ 64,909$ 66,351$ 67,509$ 68,849$ 70,241$ 71,856$ 73,078$ 74,549$ 76,020$ OWEF (PPA) -$ -$ -$ -$ -$ -$ -$ -$ -$ -$ -$ -$ -$ -$ -$ -$ -$ -$ -$ -$ SOLAR (PPA) 5,946$ 6,060$ 6,208$ 6,366$ 6,996$ 46,778$ 47,987$ 49,206$ 50,694$ 51,696$ 52,939$ 54,911$ 103,945$ 105,907$ 109,678$ 308,203$ 318,166$ 378,035$ 387,382$ 453,820$ WIND (PPA) -$ -$ -$ -$ -$ -$ -$ -$ -$ -$ -$ -$ -$ -$ -$ 3,856,985$ 3,974,434$ 4,052,583$ 4,152,736$ 4,256,038$
Total Fixed O&M Costs ($) 31,924,888$ 32,126,430$ 32,413,321$ 32,670,895$ 33,051,564$ 33,271,059$ 33,562,614$ 34,196,562$ 34,578,983$ 34,696,044$ 34,906,651$ 35,100,322$ 35,382,706$ 36,234,139$ 36,307,869$ 12,365,779$ 12,697,952$ 13,045,217$ 13,369,714$ 13,760,075$ Debt Service & Demand Charge
CCGT -$ -$ -$ -$ -$ -$ -$ -$ -$ -$ -$ -$ -$ -$ -$ 32,862,506$ 32,862,506$ 32,862,506$ 32,862,506$ 32,862,506$ CHP -$ -$ -$ -$ -$ -$ -$ -$ -$ -$ -$ -$ -$ 6,547,864$ 6,547,864$ 6,547,864$ 6,547,864$ 6,547,864$ 6,547,864$ 6,547,864$ RENG -$ -$ -$ -$ -$ -$ -$ 5,199,381$ 5,199,381$ 5,199,381$ 5,199,381$ 5,199,381$ 5,199,381$ 5,199,381$ 5,199,381$ 5,199,381$ 5,199,381$ 5,199,381$ 5,199,381$ 5,199,381$ SOLAR (PPA) 79,363$ 79,363$ 79,363$ 79,363$ 79,363$ 343,604$ 343,604$ 343,604$ 343,604$ 343,604$ 343,604$ 343,604$ 636,870$ 636,870$ 636,870$ 1,812,410$ 1,812,410$ 3,707,998$ 3,707,998$ 5,660,881$ WIND (PPA) -$ -$ -$ -$ -$ -$ -$ -$ -$ -$ -$ -$ -$ -$ -$ 22,119,919$ 22,119,919$ 22,119,919$ 22,119,919$ 22,119,919$
Total Payment 79,363$ 79,363$ 79,363$ 79,363$ 79,363$ 343,604$ 343,604$ 5,542,985$ 5,542,985$ 5,542,985$ 5,542,985$ 5,542,985$ 5,836,251$ 12,384,116$ 12,384,116$ 68,542,080$ 68,542,080$ 70,437,668$ 70,437,668$ 72,390,551$
Total Variable ($, VOM + Fuel) 62,101,065$ 64,031,349$ 66,204,457$ 68,521,224$ 71,129,992$ 73,458,745$ 76,007,333$ 80,954,783$ 83,959,330$ 86,417,767$ 89,051,047$ 92,049,659$ 94,750,024$ 109,345,257$ 112,562,443$ 47,348,801$ 47,556,167$ 45,352,931$ 47,998,925$ 48,929,267$
Total Fixed ($, FOM + Mkt Cap + Debt Service & Demand Charge) 32,443,679$ 32,930,196$ 33,406,206$ 33,856,625$ 34,537,772$ 35,377,819$ 36,586,502$ 40,947,279$ 41,534,985$ 41,988,670$ 42,547,389$ 43,038,862$ 43,905,872$ 49,991,498$ 50,568,419$ 80,907,859$ 81,240,032$ 83,482,885$ 83,807,383$ 86,150,626$ Net Market Purchases (Sales) ($, Purchases less Sales) (259,203)$ 261,769$ 548,030$ 810,791$ 977,520$ 1,204,331$ 1,809,320$ (507,765)$ (241,409)$ 345,968$ 1,345,869$ 1,786,070$ 2,481,880$ (7,881,983)$ (7,019,157)$ 29,865,501$ 30,966,875$ 38,250,315$ 39,484,168$ 43,642,170$
Total Power Supply Cost ($) 94,285,541$ 97,223,314$ 100,158,694$ 103,188,640$ 106,645,285$ 110,040,895$ 114,403,155$ 121,394,297$ 125,252,906$ 128,752,405$ 132,944,305$ 136,874,591$ 141,137,777$ 151,454,772$ 156,111,705$ 158,122,160$ 159,763,073$ 167,086,131$ 171,290,475$ 178,722,062$
Total Power Supply Cost ($/MWh) 71.36$ 72.21$ 72.98$ 73.93$ 74.93$ 76.11$ 77.71$ 80.92$ 81.79$ 82.88$ 84.04$ 85.03$ 86.01$ 91.01$ 92.30$ 92.08$ 91.40$ 94.24$ 94.93$ 97.32$
Net Present Cost ($) 1,498,055,997$

Rochester Public Utilities2015 Update of the RPU Infrastructure StudyProject No. 82902Path 2: Retire CC1 2018, peaking resource added in 2019, CHP added in 2029
2016 2017 2018 2019 2020 2021 2022 2023 2024 2025 2026 2027 2028 2029 2030 2031 2032 2033 2034 2035Annual Energy Requirements (MWh) 1,321,298 1,346,402 1,372,397 1,395,798 1,423,297 1,445,898 1,472,201 1,500,100 1,531,394 1,553,500 1,582,000 1,609,697 1,640,901 1,664,201 1,691,300 1,717,197 1,748,004 1,772,901 1,804,300 1,836,400
Market EnergyMarket Energy Purchases (MWh) 23,583 25,663 26,331 31,408 33,981 41,200 51,301 52,454 55,631 62,315 70,795 78,594 85,667 97,949 111,114 1,717,197 1,744,025 1,772,901 1,804,300 1,836,400 Market Energy Purchases Cost ($) 1,059,558$ 1,260,757$ 1,392,044$ 1,749,565$ 2,029,511$ 2,533,735$ 3,126,625$ 3,490,470$ 3,883,499$ 4,415,727$ 5,133,172$ 5,814,662$ 6,471,221$ 7,563,607$ 8,759,055$ 110,242,103$ 115,122,250$ 120,082,732$ 125,464,083$ 131,180,376$ Average Market Energy Purchase Cost ($/MWh) 44.93$ 49.13$ 52.87$ 55.70$ 59.72$ 61.50$ 60.95$ 66.54$ 69.81$ 70.86$ 72.51$ 73.98$ 75.54$ 77.22$ 78.83$ 64.20$ 66.01$ 67.73$ 69.54$ 71.43$ Market Energy Sales (MWh) 24,528 19,529 16,989 38,584 39,185 45,906 43,678 47,135 45,530 42,644 40,208 40,638 43,646 216,258 214,348 1,024,020 1,010,636 979,945 991,093 983,339 Market Energy Sales Revenue ($) 1,318,762$ 998,988$ 830,954$ 2,661,834$ 2,904,651$ 3,476,647$ 3,403,575$ 3,997,494$ 3,967,697$ 3,810,366$ 3,693,044$ 3,918,083$ 4,120,250$ 15,145,889$ 15,447,455$ 80,377,778$ 84,004,926$ 82,101,413$ 86,442,887$ 87,112,430$ Average Market Energy Sales Revenue ($/MWh) 53.76$ 51.15$ 48.91$ 68.99$ 74.13$ 75.73$ 77.92$ 84.81$ 87.15$ 89.35$ 91.85$ 96.42$ 94.40$ 70.04$ 72.07$ 78.49$ 83.12$ 83.78$ 87.22$ 88.59$
Market PricingLMP On-Peak Average ($/MWh) 39.72$ 41.02$ 42.28$ 45.36$ 48.58$ 51.75$ 55.00$ 58.18$ 60.29$ 62.50$ 64.78$ 67.01$ 69.34$ 71.55$ 73.62$ 75.85$ 78.16$ 80.49$ 82.73$ 84.93$ LMP Off-Peak Average ($/MWh) 24.37$ 24.82$ 25.30$ 26.99$ 28.53$ 30.12$ 31.61$ 33.18$ 34.33$ 35.29$ 36.28$ 37.29$ 38.14$ 39.17$ 40.37$ 41.30$ 42.30$ 43.15$ 44.14$ 45.15$
Market CapacityMarket Capacity Purchase (MW) 9 15 40 - - 2 19 22 25 31 36 40 44 22 30 - - - - - Market Capacity Cost ($/kW-mo) 4.00$ 4.08$ 4.16$ 4.24$ 4.33$ 4.42$ 4.50$ 4.59$ 4.69$ 4.78$ 4.88$ 4.97$ 5.07$ 5.17$ 5.28$ 5.38$ 5.49$ 5.60$ 5.71$ 5.83$ Total Market Capacity Cost ($) 439,429$ 724,403$ 1,974,680$ -$ -$ 125,265$ 1,009,638$ 1,207,732$ 1,413,017$ 1,749,641$ 2,097,753$ 2,395,555$ 2,686,915$ 1,373,243$ 1,876,435$ -$ -$ -$ -$ -$
Unit Operating Capacity (MW)CC1 27 27 - - - - - - - - - - - - - - - - - - CC2 50 50 50 50 50 50 50 50 50 50 50 50 50 50 50 50 50 50 50 50 CCGT - - - - - - - - - - - - - - - 317 317 317 317 317 CHP - - - - - - - - - - - - - 32 32 32 32 32 32 32 RENG - - - 55 55 55 55 55 55 55 55 55 55 55 55 55 55 55 55 55 CROD OFF 216 216 216 216 216 216 216 216 216 216 216 216 216 216 216 - - - - - CROD On 216 216 216 216 216 216 216 216 216 216 216 216 216 216 216 - - - - - LZ 3 3 3 3 3 3 3 3 3 3 3 3 3 3 3 3 3 3 3 3 OWEF (PPA) 5 5 5 5 5 5 5 5 5 5 5 5 5 5 5 5 5 5 5 5 SOLAR (PPA) 1 1 1 1 1 4 4 4 4 4 4 4 7 7 7 18 18 21 21 24 WIND (PPA) - - - - - - - - - - - - - - - 150 150 150 150 150
Number of StartsCC1 3 2 - - - - - - - - - - - - - - - - - - CC2 37 23 15 16 18 17 16 19 17 16 13 13 9 10 11 12 11 10 11 11 CCGT - - - - - - - - - - - - - - - 122 122 114 116 112 CHP - - - - - - - - - - - - - 13 19 14 15 16 9 17 RENG - - - 107 107 116 109 116 122 111 104 100 100 95 88 92 89 82 84 76
Unit Generation (MWh)CC1 432 270 - - - - - - - - - - - - - - - - - - CC2 11,277 6,462 4,192 4,541 5,015 4,840 4,017 5,439 4,915 4,516 3,343 3,643 2,720 2,894 2,944 3,169 3,019 2,869 3,069 2,919 CCGT - - - - - - - - - - - - - - - 340,797 329,163 295,258 306,480 296,177 CHP - - - - - - - - - - - - - 176,311 175,538 175,941 174,894 173,349 173,284 173,751 RENG - - - 21,246 21,356 23,387 21,960 23,991 22,893 20,423 19,160 19,270 18,282 15,372 14,164 16,086 13,725 14,603 14,329 11,749 CROD OFF 760,826 773,361 786,601 798,348 812,728 823,817 836,952 850,659 866,233 876,518 890,213 902,920 917,001 925,346 935,701 - - - - - CROD On 542,200 550,225 558,639 566,042 575,009 581,837 589,826 598,046 607,213 613,160 620,908 627,860 635,225 639,430 644,485 - - - - - LZ 11,523 11,504 11,504 11,504 11,517 11,504 11,504 11,504 11,517 11,504 11,504 11,504 11,517 11,504 11,504 11,504 11,517 11,504 11,504 11,504 OWEF (PPA) 479 479 479 479 479 479 479 479 479 479 479 479 479 479 479 18,379 18,441 18,382 18,382 18,382 SOLAR (PPA) 817 814 814 814 818 5,696 5,718 5,722 5,725 5,722 5,722 5,742 10,649 10,600 10,620 29,357 29,445 34,308 34,325 39,137 WIND (PPA) - - - - - - - - - - - - - - - 429,705 431,269 430,573 430,573 430,573
RPU Generation Subtotal (MWh) 23,233 18,236 15,696 37,292 37,888 39,732 37,481 40,935 39,326 36,443 34,008 34,417 32,519 206,082 204,151 547,497 532,319 497,583 508,666 496,100 CROD Subtotal (MWh) 1,303,026 1,323,586 1,345,240 1,364,390 1,387,738 1,405,654 1,426,778 1,448,705 1,473,447 1,489,677 1,511,121 1,530,779 1,552,226 1,564,777 1,580,185 - - - - -
PPA Purchase Subtotal (MWh) 1,296 1,293 1,293 1,293 1,296 6,174 6,197 6,201 6,204 6,201 6,201 6,221 11,127 11,078 11,098 477,441 479,154 483,264 483,281 488,092
Total Unit Generation (MWh) 1,327,555 1,343,115 1,362,229 1,402,974 1,426,922 1,451,560 1,470,456 1,495,840 1,518,976 1,532,321 1,551,329 1,571,417 1,595,872 1,781,937 1,795,435 1,024,938 1,011,473 980,847 991,947 984,192 Capacity Factor
CC1 0.2% 0.1%CC2 2.6% 1.5% 1.0% 1.0% 1.1% 1.1% 0.9% 1.2% 1.1% 1.0% 0.8% 0.8% 0.6% 0.7% 0.7% 0.7% 0.7% 0.7% 0.7% 0.7%CCGT 12.3% 11.9% 10.6% 11.0% 10.7%CHP 62.5% 62.2% 62.4% 62.0% 61.5% 61.4% 61.6%RENG 4.4% 4.4% 4.9% 4.6% 5.0% 4.8% 4.2% 4.0% 4.0% 3.8% 3.2% 2.9% 3.3% 2.9% 3.0% 3.0% 2.4%
Fuel Cost ($)CC1 36,985$ 25,763$ -$ -$ -$ -$ -$ -$ -$ -$ -$ -$ -$ -$ -$ -$ -$ -$ -$ -$ CC2 709,869$ 453,167$ 320,464$ 370,121$ 435,928$ 444,773$ 390,827$ 556,795$ 527,296$ 511,760$ 396,132$ 449,529$ 349,257$ 389,410$ 412,275$ 459,997$ 454,797$ 446,258$ 493,961$ 485,666$ CCGT -$ -$ -$ -$ -$ -$ -$ -$ -$ -$ -$ -$ -$ -$ -$ 30,814,364$ 30,824,475$ 28,528,309$ 30,771,023$ 30,816,946$ CHP -$ -$ -$ -$ -$ -$ -$ -$ -$ -$ -$ -$ -$ 9,137,309$ 9,459,817$ 9,848,592$ 10,150,009$ 10,421,775$ 10,790,053$ 11,172,540$ RENG -$ -$ -$ 1,366,031$ 1,467,260$ 1,692,672$ 1,666,841$ 1,925,774$ 1,938,761$ 1,820,208$ 1,794,636$ 1,877,056$ 1,865,685$ 1,639,590$ 1,576,736$ 1,853,740$ 1,643,517$ 1,805,871$ 1,833,200$ 1,555,443$
Total Fuel Costs ($) 746,853$ 478,930$ 320,464$ 1,736,152$ 1,903,188$ 2,137,445$ 2,057,669$ 2,482,569$ 2,466,057$ 2,331,968$ 2,190,768$ 2,326,584$ 2,214,943$ 11,166,309$ 11,448,829$ 42,976,692$ 43,072,798$ 41,202,213$ 43,888,237$ 44,030,595$ Variable O&M ($)
CC1 714$ 448$ -$ -$ -$ -$ -$ -$ -$ -$ -$ -$ -$ -$ -$ -$ -$ -$ -$ -$ CC2 18,540$ 10,727$ 7,126$ 7,901$ 8,977$ 8,858$ 7,552$ 10,497$ 9,683$ 9,122$ 6,921$ 7,759$ 5,929$ 6,454$ 6,742$ 7,446$ 7,245$ 7,087$ 7,764$ 7,561$ CCGT -$ -$ -$ -$ -$ -$ -$ -$ -$ -$ -$ -$ -$ -$ -$ 1,327,523$ 1,314,259$ 1,208,355$ 1,285,638$ 1,273,479$ CHP -$ -$ -$ -$ -$ -$ -$ -$ -$ -$ -$ -$ -$ 2,729,701$ 2,785,680$ 2,861,869$ 2,915,968$ 2,962,453$ 3,035,387$ 3,119,654$ RENG -$ -$ -$ 166,585$ 171,632$ 192,656$ 185,420$ 207,636$ 203,086$ 185,700$ 178,574$ 184,087$ 179,013$ 154,284$ 145,716$ 169,621$ 148,346$ 161,786$ 162,713$ 136,748$ CROD OFF 31,398,662$ 32,554,308$ 33,773,894$ 34,963,812$ 36,305,470$ 37,536,838$ 38,898,029$ 40,325,764$ 41,885,356$ 43,230,295$ 44,783,891$ 46,331,575$ 47,995,210$ 49,400,630$ 50,952,483$ -$ -$ -$ -$ -$ CROD On 29,936,295$ 30,986,936$ 32,089,981$ 33,165,541$ 34,364,802$ 35,468,276$ 36,674,429$ 37,929,244$ 39,280,854$ 40,458,821$ 41,789,480$ 43,102,515$ 44,480,296$ 45,670,286$ 46,951,916$ -$ -$ -$ -$ -$
Total Variable O&M Costs ($) 61,354,212$ 63,552,419$ 65,871,001$ 68,303,839$ 70,850,881$ 73,206,628$ 75,765,430$ 78,473,141$ 81,378,979$ 83,883,938$ 86,758,866$ 89,625,937$ 92,660,448$ 97,961,355$ 100,842,537$ 4,366,458$ 4,385,818$ 4,339,681$ 4,491,503$ 4,537,442$ Total Dispatch Cost (Fuel + Variable O&M) ($/MWh)
CC1 87.27$ 97.08$ CC2 64.59$ 71.79$ 78.15$ 83.25$ 88.72$ 93.72$ 99.17$ 104.30$ 109.25$ 115.34$ 120.56$ 125.54$ 130.60$ 136.78$ 142.32$ 147.52$ 153.05$ 158.00$ 163.49$ 168.96$ CCGT 94.31$ 97.64$ 100.71$ 104.60$ 108.35$ CHP 67.31$ 69.76$ 72.24$ 74.71$ 77.21$ 79.78$ 82.26$ RENG 72.14$ 76.74$ 80.61$ 84.35$ 88.92$ 93.56$ 98.22$ 102.99$ 106.96$ 111.84$ 116.70$ 121.61$ 125.79$ 130.55$ 134.74$ 139.29$ 144.03$ CROD OFF 41.27$ 42.09$ 42.94$ 43.80$ 44.67$ 45.56$ 46.48$ 47.41$ 48.35$ 49.32$ 50.31$ 51.31$ 52.34$ 53.39$ 54.45$ CROD On 55.21$ 56.32$ 57.44$ 58.59$ 59.76$ 60.96$ 62.18$ 63.42$ 64.69$ 65.98$ 67.30$ 68.65$ 70.02$ 71.42$ 72.85$
Fixed O&M ($)CC1 314,199$ 317,520$ -$ -$ -$ -$ -$ -$ -$ -$ -$ -$ -$ -$ -$ -$ -$ -$ -$ -$ CC2 226,610$ 229,041$ 234,530$ 240,518$ 246,506$ 252,993$ 258,981$ 265,468$ 272,454$ 278,941$ 285,927$ 293,412$ 300,398$ 307,883$ 315,867$ 323,851$ 331,835$ 339,819$ 348,302$ 357,284$ CCGT -$ -$ -$ -$ -$ -$ -$ -$ -$ -$ -$ -$ -$ -$ -$ 6,028,236$ 6,178,942$ 6,333,415$ 6,491,751$ 6,654,044$ CHP -$ -$ -$ -$ -$ -$ -$ -$ -$ -$ -$ -$ -$ 846,258$ 867,415$ 889,100$ 911,328$ 934,111$ 957,464$ 981,400$ RENG -$ -$ -$ 661,142$ 677,671$ 694,612$ 711,978$ 729,777$ 748,021$ 766,722$ 785,890$ 805,537$ 825,676$ 846,318$ 867,476$ 889,162$ 911,392$ 934,176$ 957,531$ 981,469$ CROD OFF -$ -$ -$ -$ -$ -$ -$ -$ -$ -$ -$ -$ -$ -$ -$ -$ -$ -$ -$ -$ CROD On 31,325,795$ 31,520,589$ 31,792,666$ 32,034,918$ 32,399,314$ 32,563,196$ 32,837,514$ 33,092,167$ 33,446,494$ 33,536,299$ 33,718,273$ 33,881,554$ 34,086,336$ 34,060,265$ 34,078,584$ -$ -$ -$ -$ -$ LZ 52,338$ 53,219$ 54,296$ 55,373$ 56,658$ 57,632$ 58,762$ 59,944$ 61,320$ 62,387$ 63,622$ 64,909$ 66,351$ 67,509$ 68,849$ 70,241$ 71,856$ 73,078$ 74,549$ 76,020$ OWEF (PPA) -$ -$ -$ -$ -$ -$ -$ -$ -$ -$ -$ -$ -$ -$ -$ -$ -$ -$ -$ -$ SOLAR (PPA) 5,946$ 6,060$ 6,208$ 6,366$ 6,996$ 46,778$ 47,987$ 49,206$ 50,694$ 51,696$ 52,939$ 54,911$ 103,945$ 105,907$ 109,678$ 308,203$ 318,166$ 378,035$ 387,382$ 453,820$ WIND (PPA) -$ -$ -$ -$ -$ -$ -$ -$ -$ -$ -$ -$ -$ -$ -$ 3,856,985$ 3,974,434$ 4,052,583$ 4,152,736$ 4,256,038$
Total Fixed O&M Costs ($) 31,924,888$ 32,126,430$ 32,087,701$ 32,998,317$ 33,387,145$ 33,615,212$ 33,915,221$ 34,196,562$ 34,578,983$ 34,696,044$ 34,906,651$ 35,100,322$ 35,382,706$ 36,234,139$ 36,307,869$ 12,365,779$ 12,697,952$ 13,045,217$ 13,369,714$ 13,760,075$ Debt Service & Demand Charge
CCGT -$ -$ -$ -$ -$ -$ -$ -$ -$ -$ -$ -$ -$ -$ -$ 32,862,506$ 32,862,506$ 32,862,506$ 32,862,506$ 32,862,506$ CHP -$ -$ -$ -$ -$ -$ -$ -$ -$ -$ -$ -$ -$ 6,547,864$ 6,547,864$ 6,547,864$ 6,547,864$ 6,547,864$ 6,547,864$ 6,547,864$ RENG -$ -$ -$ 4,710,383$ 4,710,383$ 4,710,383$ 4,710,383$ 4,710,383$ 4,710,383$ 4,710,383$ 4,710,383$ 4,710,383$ 4,710,383$ 4,710,383$ 4,710,383$ 4,710,383$ 4,710,383$ 4,710,383$ 4,710,383$ 4,710,383$ SOLAR (PPA) 79,363$ 79,363$ 79,363$ 79,363$ 79,363$ 343,604$ 343,604$ 343,604$ 343,604$ 343,604$ 343,604$ 343,604$ 636,870$ 636,870$ 636,870$ 1,812,410$ 1,812,410$ 3,707,998$ 3,707,998$ 5,660,881$ WIND (PPA) -$ -$ -$ -$ -$ -$ -$ -$ -$ -$ -$ -$ -$ -$ -$ 22,119,919$ 22,119,919$ 22,119,919$ 22,119,919$ 22,119,919$
Total Payment 79,363$ 79,363$ 79,363$ 4,789,745$ 4,789,745$ 5,053,986$ 5,053,986$ 5,053,986$ 5,053,986$ 5,053,986$ 5,053,986$ 5,053,986$ 5,347,253$ 11,895,117$ 11,895,117$ 68,053,081$ 68,053,081$ 69,948,670$ 69,948,670$ 71,901,552$
Total Variable ($, VOM + Fuel) 62,101,065$ 64,031,349$ 66,191,465$ 70,039,991$ 72,754,069$ 75,344,073$ 77,823,099$ 80,955,710$ 83,845,037$ 86,215,906$ 88,949,634$ 91,952,521$ 94,875,390$ 109,127,664$ 112,291,365$ 47,343,151$ 47,458,616$ 45,541,894$ 48,379,740$ 48,568,036$
Total Fixed ($, FOM + Mkt Cap + Debt Service & Demand Charge) 32,443,679$ 32,930,196$ 34,141,744$ 37,788,063$ 38,176,890$ 38,794,463$ 39,978,845$ 40,458,281$ 41,045,986$ 41,499,672$ 42,058,390$ 42,549,864$ 43,416,874$ 49,502,499$ 50,079,420$ 80,418,860$ 80,751,033$ 82,993,887$ 83,318,384$ 85,661,628$ Net Market Purchases (Sales) ($, Purchases less Sales) (259,203)$ 261,769$ 561,091$ (912,268)$ (875,140)$ (942,912)$ (276,950)$ (507,024)$ (84,198)$ 605,361$ 1,440,128$ 1,896,579$ 2,350,971$ (7,582,283)$ (6,688,400)$ 29,864,326$ 31,117,324$ 37,981,320$ 39,021,197$ 44,067,947$
Total Power Supply Cost ($) 94,285,541$ 97,223,314$ 100,894,300$ 106,915,785$ 110,055,819$ 113,195,624$ 117,524,994$ 120,906,967$ 124,806,825$ 128,320,939$ 132,448,153$ 136,398,964$ 140,643,235$ 151,047,881$ 155,682,386$ 157,626,337$ 159,326,973$ 166,517,101$ 170,719,321$ 178,297,610$
Total Power Supply Cost ($/MWh) 71.36$ 72.21$ 73.52$ 76.60$ 77.32$ 78.29$ 79.83$ 80.60$ 81.50$ 82.60$ 83.72$ 84.74$ 85.71$ 90.76$ 92.05$ 91.79$ 91.15$ 93.92$ 94.62$ 97.09$
Net Present Cost ($) 1,506,011,381$

Rochester Public Utilities2015 Update of the RPU Infrastructure StudyProject No. 82902Path 3: Retire CC1 2018, peaking resource added in 2018, CHP added in 2029
2016 2017 2018 2019 2020 2021 2022 2023 2024 2025 2026 2027 2028 2029 2030 2031 2032 2033 2034 2035Annual Energy Requirements (MWh) 1,321,298 1,346,402 1,372,397 1,395,798 1,423,297 1,445,898 1,472,201 1,500,100 1,531,394 1,553,500 1,582,000 1,609,697 1,640,901 1,664,201 1,691,300 1,717,197 1,748,004 1,772,901 1,804,300 1,836,400
Market EnergyMarket Energy Purchases (MWh) 23,583 25,663 26,331 31,408 33,981 41,200 51,301 52,454 55,631 62,315 70,795 78,594 85,667 97,949 111,114 1,717,197 1,744,025 1,772,901 1,804,300 1,836,400 Market Energy Purchases Cost ($) 1,059,558$ 1,260,757$ 1,392,044$ 1,749,565$ 2,029,511$ 2,533,735$ 3,126,625$ 3,490,470$ 3,883,499$ 4,415,727$ 5,133,172$ 5,814,662$ 6,471,221$ 7,563,607$ 8,759,055$ 110,242,103$ 115,122,250$ 120,082,732$ 125,464,083$ 131,180,376$ Average Market Energy Purchase Cost ($/MWh) 44.93$ 49.13$ 52.87$ 55.70$ 59.72$ 61.50$ 60.95$ 66.54$ 69.81$ 70.86$ 72.51$ 73.98$ 75.54$ 77.22$ 78.83$ 64.20$ 66.01$ 67.73$ 69.54$ 71.43$ Market Energy Sales (MWh) 24,528 19,529 36,917 37,925 40,557 44,424 45,105 45,324 45,475 42,863 42,240 40,583 41,340 215,545 217,971 1,022,154 1,012,118 980,055 989,391 984,437 Market Energy Sales Revenue ($) 1,318,762$ 998,988$ 2,364,633$ 2,616,373$ 3,009,140$ 3,326,705$ 3,563,538$ 3,811,413$ 3,960,818$ 3,858,756$ 3,918,256$ 3,904,611$ 3,785,530$ 15,055,118$ 15,970,450$ 80,065,211$ 84,263,759$ 82,106,215$ 86,180,320$ 87,297,042$ Average Market Energy Sales Revenue ($/MWh) 53.76$ 51.15$ 64.05$ 68.99$ 74.19$ 74.89$ 79.00$ 84.09$ 87.10$ 90.02$ 92.76$ 96.21$ 91.57$ 69.85$ 73.27$ 78.33$ 83.25$ 83.78$ 87.10$ 88.68$
Market PricingLMP On-Peak Average ($/MWh) 39.72$ 41.02$ 42.28$ 45.36$ 48.58$ 51.75$ 55.00$ 58.18$ 60.29$ 62.50$ 64.78$ 67.01$ 69.34$ 71.55$ 73.62$ 75.85$ 78.16$ 80.49$ 82.73$ 84.93$ LMP Off-Peak Average ($/MWh) 24.37$ 24.82$ 25.30$ 26.99$ 28.53$ 30.12$ 31.61$ 33.18$ 34.33$ 35.29$ 36.28$ 37.29$ 38.14$ 39.17$ 40.37$ 41.30$ 42.30$ 43.15$ 44.14$ 45.15$
Market CapacityMarket Capacity Purchase (MW) 9 15 - - - 2 19 22 25 31 36 40 44 22 30 - - - - - Market Capacity Cost ($/kW-mo) 4.00$ 4.08$ 4.16$ 4.24$ 4.33$ 4.42$ 4.50$ 4.59$ 4.69$ 4.78$ 4.88$ 4.97$ 5.07$ 5.17$ 5.28$ 5.38$ 5.49$ 5.60$ 5.71$ 5.83$ Total Market Capacity Cost ($) 439,429$ 724,403$ -$ -$ -$ 125,265$ 1,009,638$ 1,207,732$ 1,413,017$ 1,749,641$ 2,097,753$ 2,395,555$ 2,686,915$ 1,373,243$ 1,876,435$ -$ -$ -$ -$ -$
Unit Operating Capacity (MW)CC1 27 27 - - - - - - - - - - - - - - - - - - CC2 50 50 50 50 50 50 50 50 50 50 50 50 50 50 50 50 50 50 50 50 CCGT - - - - - - - - - - - - - - 317 317 317 317 317 317 CHP - - - - - - - - - - - - - 32 32 32 32 32 32 32 RENG - - 55 55 55 55 55 55 55 55 55 55 55 55 55 55 55 55 55 55 CROD OFF 216 216 216 216 216 216 216 216 216 216 216 216 216 216 216 - - - - - CROD On 216 216 216 216 216 216 216 216 216 216 216 216 216 216 216 - - - - - LZ 3 3 3 3 3 3 3 3 3 3 3 3 3 3 3 3 3 3 3 3 OWEF (PPA) 5 5 5 5 5 5 5 5 5 5 5 5 5 5 5 5 5 5 5 5 SOLAR (PPA) 1 1 1 1 1 4 4 4 4 4 4 4 7 7 7 18 18 21 21 24 WIND (PPA) - - - - - - - - - - - - - - - 150 150 150 150 150
Number of StartsCC1 3 2 - - - - - - - - - - - - - - - - - - CC2 37 23 15 16 18 17 16 19 17 16 13 13 9 10 11 12 11 10 11 11 CCGT - - - - - - - - - - - - - - - 122 122 114 116 112 CHP - - - - - - - - - - - - - 13 19 14 15 16 9 17 RENG - - 106 104 113 114 115 115 123 109 111 101 97 94 95 92 87 86 76 82
Unit Generation (MWh)CC1 432 270 - - - - - - - - - - - - - - - - - - CC2 11,277 6,462 4,192 4,541 5,015 4,840 4,017 5,439 4,915 4,516 3,343 3,643 2,720 2,894 2,944 3,169 3,019 2,869 3,069 2,919 CCGT - - - - - - - - - - - - - - - 340,797 329,163 295,258 306,480 296,177 CHP - - - - - - - - - - - - - 176,311 175,538 175,941 174,894 173,349 173,284 173,751 RENG - - 19,929 20,588 22,729 21,905 23,387 22,180 22,838 20,642 21,191 19,215 15,976 14,658 17,788 14,219 15,207 14,713 12,627 12,847 CROD OFF 760,826 773,361 786,601 798,348 812,728 823,817 836,952 850,659 866,233 876,518 890,213 902,920 917,001 925,346 935,701 - - - - - CROD On 542,200 550,225 558,639 566,042 575,009 581,837 589,826 598,046 607,213 613,160 620,908 627,860 635,225 639,430 644,485 - - - - - LZ 11,523 11,504 11,504 11,504 11,517 11,504 11,504 11,504 11,517 11,504 11,504 11,504 11,517 11,504 11,504 11,504 11,517 11,504 11,504 11,504 OWEF (PPA) 479 479 479 479 479 479 479 479 479 479 479 479 479 479 479 18,379 18,441 18,382 18,382 18,382 SOLAR (PPA) 817 814 814 814 818 5,696 5,718 5,722 5,725 5,722 5,722 5,742 10,649 10,600 10,620 29,357 29,445 34,308 34,325 39,137 WIND (PPA) - - - - - - - - - - - - - - - 429,705 431,269 430,573 430,573 430,573
RPU Generation Subtotal (MWh) 23,233 18,236 35,625 36,633 39,261 38,250 38,909 39,123 39,271 36,663 36,039 34,362 30,213 205,368 207,774 545,630 533,801 497,693 506,964 497,198 CROD Subtotal (MWh) 1,303,026 1,323,586 1,345,240 1,364,390 1,387,738 1,405,654 1,426,778 1,448,705 1,473,447 1,489,677 1,511,121 1,530,779 1,552,226 1,564,777 1,580,185 - - - - -
PPA Purchase Subtotal (MWh) 1,296 1,293 1,293 1,293 1,296 6,174 6,197 6,201 6,204 6,201 6,201 6,221 11,127 11,078 11,098 477,441 479,154 483,264 483,281 488,092
Total Unit Generation (MWh) 1,327,555 1,343,115 1,382,157 1,402,315 1,428,295 1,450,078 1,471,884 1,494,029 1,518,921 1,532,540 1,553,361 1,571,362 1,593,566 1,781,223 1,799,058 1,023,071 1,012,956 980,957 990,245 985,290 Capacity Factor
CC1 0.2% 0.1%CC2 2.6% 1.5% 1.0% 1.0% 1.1% 1.1% 0.9% 1.2% 1.1% 1.0% 0.8% 0.8% 0.6% 0.7% 0.7% 0.7% 0.7% 0.7% 0.7% 0.7%CCGT 0.0% 12.3% 11.9% 10.6% 11.0% 10.7%CHP 62.5% 62.2% 62.4% 62.0% 61.5% 61.4% 61.6%RENG 4.1% 4.3% 4.7% 4.6% 4.9% 4.6% 4.7% 4.3% 4.4% 4.0% 3.3% 3.0% 3.7% 3.0% 3.2% 3.1% 2.6% 2.7%
Fuel Cost ($)CC1 36,985$ 25,763$ -$ -$ -$ -$ -$ -$ -$ -$ -$ -$ -$ -$ -$ -$ -$ -$ -$ -$ CC2 709,869$ 453,167$ 320,464$ 370,121$ 435,928$ 444,773$ 390,827$ 556,795$ 527,296$ 511,760$ 396,132$ 449,529$ 349,257$ 389,410$ 412,275$ 459,997$ 454,797$ 446,258$ 493,961$ 485,666$ CCGT -$ -$ -$ -$ -$ -$ -$ -$ -$ -$ -$ -$ -$ -$ -$ 30,814,364$ 30,824,475$ 28,528,309$ 30,771,023$ 30,816,946$ CHP -$ -$ -$ -$ -$ -$ -$ -$ -$ -$ -$ -$ -$ 9,137,309$ 9,459,817$ 9,848,592$ 10,150,009$ 10,421,775$ 10,790,053$ 11,172,540$ RENG -$ -$ 1,203,956$ 1,327,704$ 1,555,830$ 1,584,949$ 1,783,538$ 1,781,644$ 1,934,120$ 1,841,331$ 1,977,821$ 1,877,404$ 1,634,911$ 1,567,301$ 1,968,479$ 1,640,910$ 1,816,544$ 1,819,451$ 1,618,167$ 1,702,931$
Total Fuel Costs ($) 746,853$ 478,930$ 1,524,419$ 1,697,825$ 1,991,758$ 2,029,722$ 2,174,365$ 2,338,439$ 2,461,417$ 2,353,091$ 2,373,953$ 2,326,933$ 1,984,169$ 11,094,020$ 11,840,571$ 42,763,863$ 43,245,825$ 41,215,793$ 43,673,204$ 44,178,083$ Variable O&M ($)
CC1 714$ 448$ -$ -$ -$ -$ -$ -$ -$ -$ -$ -$ -$ -$ -$ -$ -$ -$ -$ -$ CC2 18,540$ 10,727$ 7,126$ 7,901$ 8,977$ 8,858$ 7,552$ 10,497$ 9,683$ 9,122$ 6,921$ 7,759$ 5,929$ 6,454$ 6,742$ 7,446$ 7,245$ 7,087$ 7,764$ 7,561$ CCGT -$ -$ -$ -$ -$ -$ -$ -$ -$ -$ -$ -$ -$ -$ -$ 1,327,523$ 1,314,259$ 1,208,355$ 1,285,638$ 1,273,479$ CHP -$ -$ -$ -$ -$ -$ -$ -$ -$ -$ -$ -$ -$ 2,729,701$ 2,785,680$ 2,861,869$ 2,915,968$ 2,962,453$ 3,035,387$ 3,119,654$ RENG -$ -$ 152,443$ 161,420$ 182,662$ 180,445$ 197,472$ 191,956$ 202,599$ 187,696$ 197,506$ 183,562$ 156,435$ 147,121$ 182,992$ 149,938$ 164,367$ 163,002$ 143,387$ 149,528$ CROD OFF 31,398,662$ 32,554,308$ 33,773,894$ 34,963,812$ 36,305,470$ 37,536,838$ 38,898,029$ 40,325,764$ 41,885,356$ 43,230,295$ 44,783,891$ 46,331,575$ 47,995,210$ 49,400,630$ 50,952,483$ -$ -$ -$ -$ -$ CROD On 29,936,295$ 30,986,936$ 32,089,981$ 33,165,541$ 34,364,802$ 35,468,276$ 36,674,429$ 37,929,244$ 39,280,854$ 40,458,821$ 41,789,480$ 43,102,515$ 44,480,296$ 45,670,286$ 46,951,916$ -$ -$ -$ -$ -$
Total Variable O&M Costs ($) 61,354,212$ 63,552,419$ 66,023,444$ 68,298,674$ 70,861,911$ 73,194,417$ 75,777,483$ 78,457,462$ 81,378,492$ 83,885,935$ 86,777,798$ 89,625,412$ 92,637,870$ 97,954,192$ 100,879,813$ 4,346,776$ 4,401,840$ 4,340,898$ 4,472,177$ 4,550,222$ Total Dispatch Cost (Fuel + Variable O&M) ($/MWh)
CC1 87.27$ 97.08$ CC2 64.59$ 71.79$ 78.15$ 83.25$ 88.72$ 93.72$ 99.17$ 104.30$ 109.25$ 115.34$ 120.56$ 125.54$ 130.60$ 136.78$ 142.32$ 147.52$ 153.05$ 158.00$ 163.49$ 168.96$ CCGT 94.31$ 97.64$ 100.71$ 104.60$ 108.35$ CHP 67.31$ 69.76$ 72.24$ 74.71$ 77.21$ 79.78$ 82.26$ RENG 68.06$ 72.33$ 76.49$ 80.59$ 84.70$ 88.98$ 93.56$ 98.29$ 102.65$ 107.26$ 112.13$ 116.96$ 120.95$ 125.95$ 130.26$ 134.74$ 139.51$ 144.20$ CROD OFF 41.27$ 42.09$ 42.94$ 43.80$ 44.67$ 45.56$ 46.48$ 47.41$ 48.35$ 49.32$ 50.31$ 51.31$ 52.34$ 53.39$ 54.45$ CROD On 55.21$ 56.32$ 57.44$ 58.59$ 59.76$ 60.96$ 62.18$ 63.42$ 64.69$ 65.98$ 67.30$ 68.65$ 70.02$ 71.42$ 72.85$
Fixed O&M ($)CC1 314,199$ 317,520$ -$ -$ -$ -$ -$ -$ -$ -$ -$ -$ -$ -$ -$ -$ -$ -$ -$ -$ CC2 226,610$ 229,041$ 234,530$ 240,518$ 246,506$ 252,993$ 258,981$ 265,468$ 272,454$ 278,941$ 285,927$ 293,412$ 300,398$ 307,883$ 315,867$ 323,851$ 331,835$ 339,819$ 348,302$ 357,284$ CCGT -$ -$ -$ -$ -$ -$ -$ -$ -$ -$ -$ -$ -$ -$ -$ 6,028,236$ 6,178,942$ 6,333,415$ 6,491,751$ 6,654,044$ CHP -$ -$ -$ -$ -$ -$ -$ -$ -$ -$ -$ -$ -$ 846,258$ 867,415$ 889,100$ 911,328$ 934,111$ 957,464$ 981,400$ RENG -$ -$ 645,017$ 661,142$ 677,671$ 694,612$ 711,978$ 729,777$ 748,021$ 766,722$ 785,890$ 805,537$ 825,676$ 846,318$ 867,476$ 889,162$ 911,392$ 934,176$ 957,531$ 981,469$ CROD OFF -$ -$ -$ -$ -$ -$ -$ -$ -$ -$ -$ -$ -$ -$ -$ -$ -$ -$ -$ -$ CROD On 31,325,795$ 31,520,589$ 31,792,666$ 32,034,918$ 32,399,314$ 32,563,196$ 32,837,514$ 33,092,167$ 33,446,494$ 33,536,299$ 33,718,273$ 33,881,554$ 34,086,336$ 34,060,265$ 34,078,584$ -$ -$ -$ -$ -$ LZ 52,338$ 53,219$ 54,296$ 55,373$ 56,658$ 57,632$ 58,762$ 59,944$ 61,320$ 62,387$ 63,622$ 64,909$ 66,351$ 67,509$ 68,849$ 70,241$ 71,856$ 73,078$ 74,549$ 76,020$ OWEF (PPA) -$ -$ -$ -$ -$ -$ -$ -$ -$ -$ -$ -$ -$ -$ -$ -$ -$ -$ -$ -$ SOLAR (PPA) 5,946$ 6,060$ 6,208$ 6,366$ 6,996$ 46,778$ 47,987$ 49,206$ 50,694$ 51,696$ 52,939$ 54,911$ 103,945$ 105,907$ 109,678$ 308,203$ 318,166$ 378,035$ 387,382$ 453,820$ WIND (PPA) -$ -$ -$ -$ -$ -$ -$ -$ -$ -$ -$ -$ -$ -$ -$ 3,856,985$ 3,974,434$ 4,052,583$ 4,152,736$ 4,256,038$
Total Fixed O&M Costs ($) 31,924,888$ 32,126,430$ 32,732,718$ 32,998,317$ 33,387,145$ 33,615,212$ 33,915,221$ 34,196,562$ 34,578,983$ 34,696,044$ 34,906,651$ 35,100,322$ 35,382,706$ 36,234,139$ 36,307,869$ 12,365,779$ 12,697,952$ 13,045,217$ 13,369,714$ 13,760,075$ Debt Service & Demand Charge
CCGT -$ -$ -$ -$ -$ -$ -$ -$ -$ -$ -$ -$ -$ -$ -$ 32,862,506$ 32,862,506$ 32,862,506$ 32,862,506$ 32,862,506$ CHP -$ -$ -$ -$ -$ -$ -$ -$ -$ -$ -$ -$ -$ 6,547,864$ 6,547,864$ 6,547,864$ 6,547,864$ 6,547,864$ 6,547,864$ 6,547,864$ RENG -$ -$ 4,595,495$ 4,595,495$ 4,595,495$ 4,595,495$ 4,595,495$ 4,595,495$ 4,595,495$ 4,595,495$ 4,595,495$ 4,595,495$ 4,595,495$ 4,595,495$ 4,595,495$ 4,595,495$ 4,595,495$ 4,595,495$ 4,595,495$ 4,595,495$ SOLAR (PPA) 79,363$ 79,363$ 79,363$ 79,363$ 79,363$ 343,604$ 343,604$ 343,604$ 343,604$ 343,604$ 343,604$ 343,604$ 636,870$ 636,870$ 636,870$ 1,812,410$ 1,812,410$ 3,707,998$ 3,707,998$ 5,660,881$ WIND (PPA) -$ -$ -$ -$ -$ -$ -$ -$ -$ -$ -$ -$ -$ -$ -$ 22,119,919$ 22,119,919$ 22,119,919$ 22,119,919$ 22,119,919$
Total Payment 79,363$ 79,363$ 4,674,858$ 4,674,858$ 4,674,858$ 4,939,099$ 4,939,099$ 4,939,099$ 4,939,099$ 4,939,099$ 4,939,099$ 4,939,099$ 5,232,366$ 11,780,230$ 11,780,230$ 67,938,194$ 67,938,194$ 69,833,782$ 69,833,782$ 71,786,665$
Total Variable ($, VOM + Fuel) 62,101,065$ 64,031,349$ 67,547,864$ 69,996,499$ 72,853,670$ 75,224,139$ 77,951,848$ 80,795,901$ 83,839,909$ 86,239,026$ 89,151,751$ 91,952,346$ 94,622,038$ 109,048,212$ 112,720,384$ 47,110,638$ 47,647,665$ 45,556,691$ 48,145,380$ 48,728,305$
Total Fixed ($, FOM + Mkt Cap + Debt Service & Demand Charge) 32,443,679$ 32,930,196$ 37,407,576$ 37,673,175$ 38,062,003$ 38,679,576$ 39,863,958$ 40,343,393$ 40,931,099$ 41,384,784$ 41,943,503$ 42,434,976$ 43,301,986$ 49,387,612$ 49,964,533$ 80,303,973$ 80,636,146$ 82,879,000$ 83,203,497$ 85,546,740$ Net Market Purchases (Sales) ($, Purchases less Sales) (259,203)$ 261,769$ (972,589)$ (866,808)$ (979,628)$ (792,970)$ (436,913)$ (320,943)$ (77,319)$ 556,971$ 1,214,916$ 1,910,051$ 2,685,691$ (7,491,511)$ (7,211,395)$ 30,176,892$ 30,858,491$ 37,976,517$ 39,283,763$ 43,883,335$
Total Power Supply Cost ($) 94,285,541$ 97,223,314$ 103,982,850$ 106,802,866$ 109,936,044$ 113,110,745$ 117,378,893$ 120,818,351$ 124,693,689$ 128,180,780$ 132,310,171$ 136,297,373$ 140,609,716$ 150,944,313$ 155,473,523$ 157,591,503$ 159,142,302$ 166,412,207$ 170,632,640$ 178,158,380$
Total Power Supply Cost ($/MWh) 71.36$ 72.21$ 75.77$ 76.52$ 77.24$ 78.23$ 79.73$ 80.54$ 81.42$ 82.51$ 83.63$ 84.67$ 85.69$ 90.70$ 91.93$ 91.77$ 91.04$ 93.86$ 94.57$ 97.02$
Net Present Cost ($) 1,507,624,305$

Rochester Public Utilities2015 Update of the RPU Infrastructure StudyProject No. 82902Path 4: Retire CC1 2018, peaking resource added in 2018, CHP added in 2026
2016 2017 2018 2019 2020 2021 2022 2023 2024 2025 2026 2027 2028 2029 2030 2031 2032 2033 2034 2035Annual Energy Requirements (MWh) 1,321,298 1,346,402 1,372,397 1,395,798 1,423,297 1,445,898 1,472,201 1,500,100 1,531,394 1,553,500 1,582,000 1,609,697 1,640,901 1,664,201 1,691,300 1,717,197 1,748,004 1,772,901 1,804,300 1,836,400
Market EnergyMarket Energy Purchases (MWh) 23,583 25,663 26,331 31,408 33,981 41,200 51,301 52,454 55,631 62,315 70,795 78,594 85,667 97,949 111,114 1,717,197 1,744,025 1,772,901 1,804,300 1,836,400 Market Energy Purchases Cost ($) 1,059,558$ 1,260,757$ 1,392,044$ 1,749,565$ 2,029,511$ 2,533,735$ 3,126,625$ 3,490,470$ 3,883,499$ 4,415,727$ 5,133,172$ 5,814,662$ 6,471,221$ 7,563,607$ 8,759,055$ 110,242,103$ 115,122,250$ 120,082,732$ 125,464,083$ 131,180,376$ Average Market Energy Purchase Cost ($/MWh) 44.93$ 49.13$ 52.87$ 55.70$ 59.72$ 61.50$ 60.95$ 66.54$ 69.81$ 70.86$ 72.51$ 73.98$ 75.54$ 77.22$ 78.83$ 64.20$ 66.01$ 67.73$ 69.54$ 71.43$ Market Energy Sales (MWh) 24,528 19,529 36,917 38,584 39,185 45,906 43,678 47,135 45,530 42,644 218,065 217,931 220,681 216,548 215,056 1,024,069 1,011,216 980,638 991,270 982,437 Market Energy Sales Revenue ($) 1,318,762$ 998,988$ 2,364,633$ 2,661,834$ 2,904,651$ 3,476,647$ 3,403,575$ 3,997,494$ 3,967,697$ 3,810,366$ 13,999,241$ 14,630,160$ 15,178,205$ 15,204,051$ 15,484,642$ 80,389,154$ 84,081,654$ 82,143,325$ 86,479,560$ 86,878,293$ Average Market Energy Sales Revenue ($/MWh) 53.76$ 51.15$ 64.05$ 68.99$ 74.13$ 75.73$ 77.92$ 84.81$ 87.15$ 89.35$ 64.20$ 67.13$ 68.78$ 70.21$ 72.00$ 78.50$ 83.15$ 83.77$ 87.24$ 88.43$
Market PricingLMP On-Peak Average ($/MWh) 39.72$ 41.02$ 42.28$ 45.36$ 48.58$ 51.75$ 55.00$ 58.18$ 60.29$ 62.50$ 64.78$ 67.01$ 69.34$ 71.55$ 73.62$ 75.85$ 78.16$ 80.49$ 82.73$ 84.93$ LMP Off-Peak Average ($/MWh) 24.37$ 24.82$ 25.30$ 26.99$ 28.53$ 30.12$ 31.61$ 33.18$ 34.33$ 35.29$ 36.28$ 37.29$ 38.14$ 39.17$ 40.37$ 41.30$ 42.30$ 43.15$ 44.14$ 45.15$
Market CapacityMarket Capacity Purchase (MW) 9 15 - - - 2 19 22 25 31 5 10 14 22 30 - - - - - Market Capacity Cost ($/kW-mo) 4.00$ 4.08$ 4.16$ 4.24$ 4.33$ 4.42$ 4.50$ 4.59$ 4.69$ 4.78$ 4.88$ 4.97$ 5.07$ 5.17$ 5.28$ 5.38$ 5.49$ 5.60$ 5.71$ 5.83$ Total Market Capacity Cost ($) 439,429$ 724,403$ -$ -$ -$ 125,265$ 1,009,638$ 1,207,732$ 1,413,017$ 1,749,641$ 307,880$ 569,884$ 824,732$ 1,373,243$ 1,876,435$ -$ -$ -$ -$ -$
Unit Operating Capacity (MW)CC1 27 27 - - - - - - - - - - - - - - - - - - CC2 50 50 50 50 50 50 50 50 50 50 50 50 50 50 50 50 50 50 50 50 CCGT - - - - - - - - - - - - - - 317 317 317 317 317 317 CHP - - - - - - - - - - 32 32 32 32 32 32 32 32 32 32 RENG - - 55 55 55 55 55 55 55 55 55 55 55 55 55 55 55 55 55 55 CROD OFF 216 216 216 216 216 216 216 216 216 216 216 216 216 216 216 - - - - - CROD On 216 216 216 216 216 216 216 216 216 216 216 216 216 216 216 - - - - - LZ 3 3 3 3 3 3 3 3 3 3 3 3 3 3 3 3 3 3 3 3 OWEF (PPA) 5 5 5 5 5 5 5 5 5 5 5 5 5 5 5 5 5 5 5 5 SOLAR (PPA) 1 1 1 1 1 4 4 4 4 4 4 4 7 7 7 18 18 21 21 24 WIND (PPA) - - - - - - - - - - - - - - - 150 150 150 150 150
Number of StartsCC1 3 2 - - - - - - - - - - - - - - - - - - CC2 37 23 15 16 18 17 16 19 17 16 13 13 9 10 11 12 11 10 11 11 CCGT - - - - - - - - - - - - - - - 122 122 114 116 112 CHP - - - - - - - - - - 13 19 14 15 16 10 17 19 15 14 RENG - - - 107 107 116 109 116 122 111 104 100 100 95 88 92 89 82 84 76
Unit Generation (MWh)CC1 432 270 - - - - - - - - - - - - - - - - - - CC2 11,277 6,462 4,192 4,541 5,015 4,840 4,017 5,439 4,915 4,516 3,343 3,643 2,720 2,894 2,944 3,169 3,019 2,869 3,069 2,919 CCGT - - - - - - - - - - - - - - - 340,797 329,163 295,258 306,480 296,177 CHP - - - - - - - - - - 178,774 178,098 177,937 176,617 176,263 175,989 175,538 174,057 173,204 172,914 RENG - - 19,929 21,246 21,356 23,387 21,960 23,991 22,893 20,423 19,160 19,270 18,282 15,372 14,164 16,086 13,725 14,603 14,329 11,749 CROD OFF 760,826 773,361 786,601 798,348 812,728 823,817 836,952 850,659 866,233 876,518 890,213 902,920 917,001 925,346 935,701 - - - - - CROD On 542,200 550,225 558,639 566,042 575,009 581,837 589,826 598,046 607,213 613,160 620,908 627,860 635,225 639,430 644,485 - - - - - LZ 11,523 11,504 11,504 11,504 11,517 11,504 11,504 11,504 11,517 11,504 11,504 11,504 11,517 11,504 11,504 11,504 11,517 11,504 11,504 11,504 OWEF (PPA) 479 479 479 479 479 479 479 479 479 479 479 479 479 479 479 18,379 18,441 18,382 18,382 18,382 SOLAR (PPA) 817 814 814 814 818 5,696 5,718 5,722 5,725 5,722 5,722 5,742 10,648 10,600 10,620 29,357 29,445 34,308 34,325 39,137 WIND (PPA) - - - - - - - - - - - - - - - 429,705 431,269 430,573 430,573 430,573
RPU Generation Subtotal (MWh) 23,233 18,236 35,625 37,292 37,888 39,732 37,481 40,935 39,326 36,443 212,782 212,515 210,456 206,388 204,875 547,545 532,963 498,292 508,586 495,263 CROD Subtotal (MWh) 1,303,026 1,323,586 1,345,240 1,364,390 1,387,738 1,405,654 1,426,778 1,448,705 1,473,447 1,489,677 1,511,121 1,530,779 1,552,226 1,564,777 1,580,185 - - - - -
PPA Purchase Subtotal (MWh) 1,296 1,293 1,293 1,293 1,296 6,174 6,197 6,201 6,204 6,201 6,201 6,221 11,127 11,078 11,098 477,441 479,154 483,264 483,281 488,092
Total Unit Generation (MWh) 1,327,555 1,343,115 1,382,157 1,402,974 1,426,922 1,451,560 1,470,456 1,495,840 1,518,976 1,532,321 1,730,104 1,749,515 1,773,809 1,782,243 1,796,159 1,024,986 1,012,117 981,555 991,866 983,355 Capacity Factor
CC1 0.2% 0.1%CC2 2.6% 1.5% 1.0% 1.0% 1.1% 1.1% 0.9% 1.2% 1.1% 1.0% 0.8% 0.8% 0.6% 0.7% 0.7% 0.7% 0.7% 0.7% 0.7% 0.7%CCGT 0.0% 12.3% 11.9% 10.6% 11.0% 10.7%CHP 63.4% 63.1% 63.1% 62.6% 62.5% 62.4% 62.2% 61.7% 61.4% 61.3%RENG 4.1% 4.4% 4.4% 4.9% 4.6% 5.0% 4.8% 4.2% 4.0% 4.0% 3.8% 3.2% 2.9% 3.3% 2.9% 3.0% 3.0% 2.4%
Fuel Cost ($)CC1 36,985$ 25,763$ -$ -$ -$ -$ -$ -$ -$ -$ -$ -$ -$ -$ -$ -$ -$ -$ -$ -$ CC2 709,869$ 453,167$ 320,464$ 370,121$ 435,928$ 444,773$ 390,827$ 556,795$ 527,296$ 511,760$ 396,132$ 449,529$ 349,257$ 389,410$ 412,275$ 459,997$ 454,797$ 446,258$ 493,961$ 485,666$ CCGT -$ -$ -$ -$ -$ -$ -$ -$ -$ -$ -$ -$ -$ -$ -$ 30,814,364$ 30,824,475$ 28,528,309$ 30,771,023$ 30,816,946$ CHP -$ -$ -$ -$ -$ -$ -$ -$ -$ -$ 8,143,875$ 8,483,159$ 8,848,042$ 9,141,207$ 9,498,316$ 9,848,550$ 10,186,951$ 10,454,806$ 10,793,291$ 11,126,425$ RENG -$ -$ 1,203,956$ 1,366,031$ 1,467,260$ 1,692,672$ 1,666,841$ 1,925,774$ 1,938,761$ 1,820,208$ 1,794,636$ 1,877,056$ 1,865,685$ 1,639,590$ 1,576,736$ 1,853,740$ 1,643,517$ 1,805,871$ 1,833,200$ 1,555,443$
Total Fuel Costs ($) 746,853$ 478,930$ 1,524,419$ 1,736,152$ 1,903,188$ 2,137,445$ 2,057,669$ 2,482,569$ 2,466,057$ 2,331,968$ 10,334,643$ 10,809,743$ 11,062,984$ 11,170,207$ 11,487,327$ 42,976,651$ 43,109,740$ 41,235,245$ 43,891,475$ 43,984,480$ Variable O&M ($)
CC1 714$ 448$ -$ -$ -$ -$ -$ -$ -$ -$ -$ -$ -$ -$ -$ -$ -$ -$ -$ -$ CC2 18,540$ 10,727$ 7,126$ 7,901$ 8,977$ 8,858$ 7,552$ 10,497$ 9,683$ 9,122$ 6,921$ 7,759$ 5,929$ 6,454$ 6,742$ 7,446$ 7,245$ 7,087$ 7,764$ 7,561$ CCGT -$ -$ -$ -$ -$ -$ -$ -$ -$ -$ -$ -$ -$ -$ -$ 1,327,523$ 1,314,259$ 1,208,355$ 1,285,638$ 1,273,479$ CHP -$ -$ -$ -$ -$ -$ -$ -$ -$ -$ 2,570,213$ 2,624,504$ 2,687,685$ 2,734,437$ 2,797,177$ 2,862,655$ 2,926,705$ 2,974,560$ 3,033,977$ 3,104,623$ RENG -$ -$ 152,443$ 166,585$ 171,632$ 192,656$ 185,420$ 207,636$ 203,086$ 185,700$ 178,574$ 184,087$ 179,013$ 154,284$ 145,716$ 169,621$ 148,346$ 161,786$ 162,713$ 136,748$ CROD OFF 31,398,662$ 32,554,308$ 33,773,894$ 34,963,812$ 36,305,470$ 37,536,838$ 38,898,029$ 40,325,764$ 41,885,356$ 43,230,295$ 44,783,891$ 46,331,575$ 47,995,210$ 49,400,630$ 50,952,483$ -$ -$ -$ -$ -$ CROD On 29,936,295$ 30,986,936$ 32,089,981$ 33,165,541$ 34,364,802$ 35,468,276$ 36,674,429$ 37,929,244$ 39,280,854$ 40,458,821$ 41,789,480$ 43,102,515$ 44,480,296$ 45,670,286$ 46,951,916$ -$ -$ -$ -$ -$
Total Variable O&M Costs ($) 61,354,212$ 63,552,419$ 66,023,444$ 68,303,839$ 70,850,881$ 73,206,628$ 75,765,430$ 78,473,141$ 81,378,979$ 83,883,938$ 89,329,079$ 92,250,441$ 95,348,132$ 97,966,091$ 100,854,034$ 4,367,244$ 4,396,556$ 4,351,788$ 4,490,093$ 4,522,410$ Total Dispatch Cost (Fuel + Variable O&M) ($/MWh)
CC1 87.27$ 97.08$ CC2 64.59$ 71.79$ 78.15$ 83.25$ 88.72$ 93.72$ 99.17$ 104.30$ 109.25$ 115.34$ 120.56$ 125.54$ 130.60$ 136.78$ 142.32$ 147.52$ 153.05$ 158.00$ 163.49$ 168.96$ CCGT 94.31$ 97.64$ 100.71$ 104.60$ 108.35$ CHP 59.93$ 62.37$ 64.83$ 67.24$ 69.76$ 72.23$ 74.71$ 77.15$ 79.83$ 82.30$ RENG 68.06$ 72.14$ 76.74$ 80.61$ 84.35$ 88.92$ 93.56$ 98.22$ 102.99$ 106.96$ 111.84$ 116.70$ 121.61$ 125.79$ 130.55$ 134.74$ 139.29$ 144.03$ CROD OFF 41.27$ 42.09$ 42.94$ 43.80$ 44.67$ 45.56$ 46.48$ 47.41$ 48.35$ 49.32$ 50.31$ 51.31$ 52.34$ 53.39$ 54.45$ CROD On 55.21$ 56.32$ 57.44$ 58.59$ 59.76$ 60.96$ 62.18$ 63.42$ 64.69$ 65.98$ 67.30$ 68.65$ 70.02$ 71.42$ 72.85$
Fixed O&M ($)CC1 314,199$ 317,520$ -$ -$ -$ -$ -$ -$ -$ -$ -$ -$ -$ -$ -$ -$ -$ -$ -$ -$ CC2 226,610$ 229,041$ 234,530$ 240,518$ 246,506$ 252,993$ 258,981$ 265,468$ 272,454$ 278,941$ 285,927$ 293,412$ 300,398$ 307,883$ 315,867$ 323,851$ 331,835$ 339,819$ 348,302$ 357,284$ CCGT -$ -$ -$ -$ -$ -$ -$ -$ -$ -$ -$ -$ -$ -$ -$ 6,028,236$ 6,178,942$ 6,333,415$ 6,491,751$ 6,654,044$ CHP -$ -$ -$ -$ -$ -$ -$ -$ -$ -$ 785,835$ 805,481$ 825,618$ 846,258$ 867,415$ 889,100$ 911,328$ 934,111$ 957,464$ 981,400$ RENG -$ -$ 645,017$ 661,142$ 677,671$ 694,612$ 711,978$ 729,777$ 748,021$ 766,722$ 785,890$ 805,537$ 825,676$ 846,318$ 867,476$ 889,162$ 911,392$ 934,176$ 957,531$ 981,469$ CROD OFF -$ -$ -$ -$ -$ -$ -$ -$ -$ -$ -$ -$ -$ -$ -$ -$ -$ -$ -$ -$ CROD On 31,325,795$ 31,520,589$ 31,792,666$ 32,034,918$ 32,399,314$ 32,563,196$ 32,837,514$ 33,092,167$ 33,446,494$ 33,536,299$ 33,718,273$ 33,881,554$ 34,086,336$ 34,060,265$ 34,078,584$ -$ -$ -$ -$ -$ LZ 52,338$ 53,219$ 54,296$ 55,373$ 56,658$ 57,632$ 58,762$ 59,944$ 61,320$ 62,387$ 63,622$ 64,909$ 66,351$ 67,509$ 68,849$ 70,241$ 71,856$ 73,078$ 74,549$ 76,020$ OWEF (PPA) -$ -$ -$ -$ -$ -$ -$ -$ -$ -$ -$ -$ -$ -$ -$ -$ -$ -$ -$ -$ SOLAR (PPA) 5,946$ 6,060$ 6,208$ 6,366$ 6,996$ 46,778$ 47,987$ 49,206$ 50,694$ 51,696$ 52,939$ 54,911$ 103,945$ 105,907$ 109,678$ 308,203$ 318,166$ 378,035$ 387,382$ 453,820$ WIND (PPA) -$ -$ -$ -$ -$ -$ -$ -$ -$ -$ -$ -$ -$ -$ -$ 3,856,985$ 3,974,434$ 4,052,583$ 4,152,736$ 4,256,038$
Total Fixed O&M Costs ($) 31,924,888$ 32,126,430$ 32,732,718$ 32,998,317$ 33,387,145$ 33,615,212$ 33,915,221$ 34,196,562$ 34,578,983$ 34,696,044$ 35,692,486$ 35,905,803$ 36,208,324$ 36,234,139$ 36,307,869$ 12,365,779$ 12,697,952$ 13,045,217$ 13,369,714$ 13,760,075$ Debt Service & Demand Charge
CCGT -$ -$ -$ -$ -$ -$ -$ -$ -$ -$ -$ -$ -$ -$ -$ 32,862,506$ 32,862,506$ 32,862,506$ 32,862,506$ 32,862,506$ CHP -$ -$ -$ -$ -$ -$ -$ -$ -$ -$ 6,080,343$ 6,080,343$ 6,080,343$ 6,080,343$ 6,080,343$ 6,080,343$ 6,080,343$ 6,080,343$ 6,080,343$ 6,080,343$ RENG -$ -$ 4,595,495$ 4,595,495$ 4,595,495$ 4,595,495$ 4,595,495$ 4,595,495$ 4,595,495$ 4,595,495$ 4,595,495$ 4,595,495$ 4,595,495$ 4,595,495$ 4,595,495$ 4,595,495$ 4,595,495$ 4,595,495$ 4,595,495$ 4,595,495$ SOLAR (PPA) 79,363$ 79,363$ 79,363$ 79,363$ 79,363$ 343,604$ 343,604$ 343,604$ 343,604$ 343,604$ 343,604$ 343,604$ 636,870$ 636,870$ 636,870$ 1,812,410$ 1,812,410$ 3,707,998$ 3,707,998$ 5,660,881$ WIND (PPA) -$ -$ -$ -$ -$ -$ -$ -$ -$ -$ -$ -$ -$ -$ -$ 22,119,919$ 22,119,919$ 22,119,919$ 22,119,919$ 22,119,919$
Total Payment 79,363$ 79,363$ 4,674,858$ 4,674,858$ 4,674,858$ 4,939,099$ 4,939,099$ 4,939,099$ 4,939,099$ 4,939,099$ 11,019,442$ 11,019,442$ 11,312,708$ 11,312,708$ 11,312,708$ 67,470,673$ 67,470,673$ 69,366,261$ 69,366,261$ 71,319,143$
Total Variable ($, VOM + Fuel) 62,101,065$ 64,031,349$ 67,547,864$ 70,039,991$ 72,754,069$ 75,344,073$ 77,823,099$ 80,955,710$ 83,845,037$ 86,215,906$ 99,663,722$ 103,060,184$ 106,411,117$ 109,136,298$ 112,341,361$ 47,343,895$ 47,506,296$ 45,587,032$ 48,381,568$ 48,506,890$
Total Fixed ($, FOM + Mkt Cap + Debt Service & Demand Charge) 32,443,679$ 32,930,196$ 37,407,576$ 37,673,175$ 38,062,003$ 38,679,576$ 39,863,958$ 40,343,393$ 40,931,099$ 41,384,784$ 47,019,807$ 47,495,129$ 48,345,764$ 48,920,091$ 49,497,012$ 79,836,452$ 80,168,625$ 82,411,478$ 82,735,975$ 85,079,219$ Net Market Purchases (Sales) ($, Purchases less Sales) (259,203)$ 261,769$ (972,589)$ (912,268)$ (875,140)$ (942,912)$ (276,950)$ (507,024)$ (84,198)$ 605,361$ (8,866,069)$ (8,815,498)$ (8,706,984)$ (7,640,445)$ (6,725,587)$ 29,852,949$ 31,040,596$ 37,939,408$ 38,984,523$ 44,302,083$
Total Power Supply Cost ($) 94,285,541$ 97,223,314$ 103,982,850$ 106,800,898$ 109,940,932$ 113,080,737$ 117,410,107$ 120,792,080$ 124,691,938$ 128,206,051$ 137,817,461$ 141,739,815$ 146,049,897$ 150,415,944$ 155,112,786$ 157,033,295$ 158,715,516$ 165,937,918$ 170,102,067$ 177,888,192$
Total Power Supply Cost ($/MWh) 71.36$ 72.21$ 75.77$ 76.52$ 77.24$ 78.21$ 79.75$ 80.52$ 81.42$ 82.53$ 87.12$ 88.05$ 89.01$ 90.38$ 91.71$ 91.45$ 90.80$ 93.60$ 94.28$ 96.87$
Net Present Cost ($) 1,515,469,156$

Burns & McDonnell World Headquarters 9400 Ward Parkway Kansas City, MO 64114
OOOO 816-333-9400 FFFF 816-333-3690
www.burnsmcd.com