2015 ryan white part a charlotte transitional grant area (tga) · national snapshot of hiv/aids...
TRANSCRIPT

2015 Ryan White Part A Charlotte Transitional Grant Area (TGA)
Questions???
PLWHA
Testing
New Infections
OverviewHIV/AIDS Surveillance Data Update
Donna E Smith, MSPHEpidemiology SpecialistMecklenburg County Health Department
September 6, 2016

National Snapshot of HIV/AIDS
More than 1.2 million people in the US are living
with HIV
44,000 people were newly diagnosed in 2014
Source: CDC. Diagnoses of HIV infection in the United States and dependent areas, 2014. HIV Surveillance Report 2015;26.

Rates of HIV Diagnoses Among Adults and Adolescents in the US in 2014, by State
Source: CDC. Diagnoses of HIV infection in the United States and dependent areas, 2014. HIV Surveillance Report 2015;26.
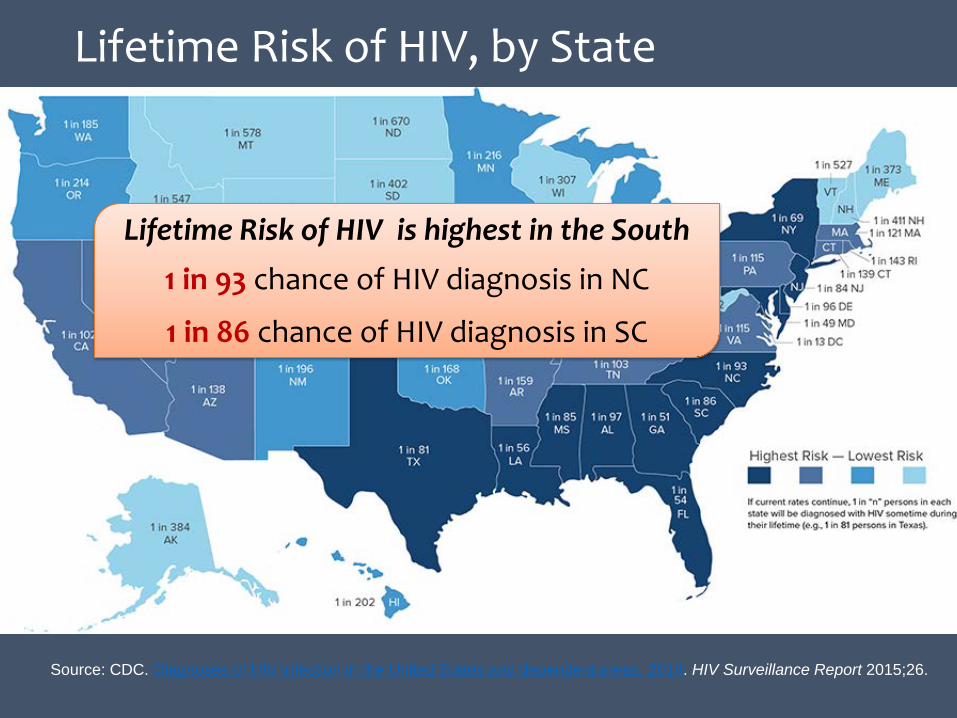
Lifetime Risk of HIV, by State
Source: CDC. Diagnoses of HIV infection in the United States and dependent areas, 2014. HIV Surveillance Report 2015;26.
Lifetime Risk of HIV is highest in the South
1 in 93 chance of HIV diagnosis in NC
1 in 86 chance of HIV diagnosis in SC

Ryan White Program: Charlotte TGA• Includes 5 counties in NC
• Anson• Cabarrus• Gaston• Mecklenburg• Union
• Includes 1 county in SC• York
• Nearly 2.3 million people live in the region.
Large Metropolitan Statistical Area (MSA) Population Growth Trends
Source: US Census 2010
2015 Ryan White Part A Epi Update: OVERVIEW

Number of Newly Diagnosed Persons with HIV* in the Charlotte Transitional Grant Area, 2011 - 2015
413
331 314
396375
0
50
100
150
200
250
300
350
400
450
2011 2012 2013 2014 2015
Num
ber o
f Per
sons
Year of Diagnosis
2015 New HIV Diagnoses by County
(Percent of Total )
Anson 1%
Cabarrus 3%
Gaston 8%
Mecklenburg 77%
Union 5%
York, SC 6%
*All persons diagnosed with HIV infection by year of first diagnosis, regardless of the stage of infection (HIV or AIDS)
Source: NC DHHS, HIV/STD Prevention and Care UnitSC DHEC, HIV/AIDS Surveillance Unit
Prepared by: MCHD Epidemiology Program 08/2016
2015 Ryan White Part A Epi Update: New Infections

2011 – 2015 Rate of Newly Diagnosed Persons with HIV*(per 100,000) in the Charlotte Transitional Grant Area, NC and SC
Year of Diagnosis
*All persons diagnosed with HIV infection by year of first diagnosis, regardless of the stage of infection (HIV or AIDS)
Source: NC DHHS, HIV/STD Prevention and Care UnitSC DHEC, HIV/AIDS Surveillance Unit
Prepared by: MCHD Epidemiology Program 08/2016
2015 Ryan White Part A Epi Update: New Infections
24.5
19.2 18.2
22.120.8
15.313 13.4 13.3 13.4
16.1 15.2 15.3 16.1 15.4
2011 2012 2013 2014 2015
Charlotte TGA North Carolina South Carolina
Rate
of N
ew In
fect
ions
Pe
r 100
,000

2015 HIV Testing Efforts at Public Health Funded Counseling and Testing Sites by County
Source: NC DHHS, HIV/STD Prevention and Care UnitSC DHEC, HIV/AIDS Surveillance Unit
Prepared by: MCHD Epidemiology Program 08/2016
2015 Ryan White Part A Epi Update: Testing Efforts
County Number of Tests
Overall Positivity Rate
% New Positives
Anson, NC 880 0.3% 0.1%
Cabarrus, NC 2,024 0.5% 0.4%
Gaston, NC 6,912 0.8% 0.3%
Mecklenburg, NC 17,332 2.5% 1.3%
Union, NC 1,479 0.9% 0.6%
York, SC 858 1.2% ---
TOTAL TGA 29,485 1.8% 0.9%

Persons Living with HIV* in Charlotte TGA as of 12/31/2015 by County of Current Residence
Anson83
Cabarrus372
Gaston648
Meck.6,283
Union265
York, SC455
Persons Living with HIV in TGA
8,106
Source: NC DHHS, HIV/STD Prevention and Care UnitSC DHEC, HIV/AIDS Surveillance Unit
Prepared by: MCHD Epidemiology Program 08/2016

Persons Living with HIV* in Charlotte TGA as of 12/31/2015 by County of Current Residence
Source: NC DHHS, HIV/STD Prevention and Care UnitSC DHEC, HIV/AIDS Surveillance Unit Prepared by: MCHD Epidemiology Program 08/2016
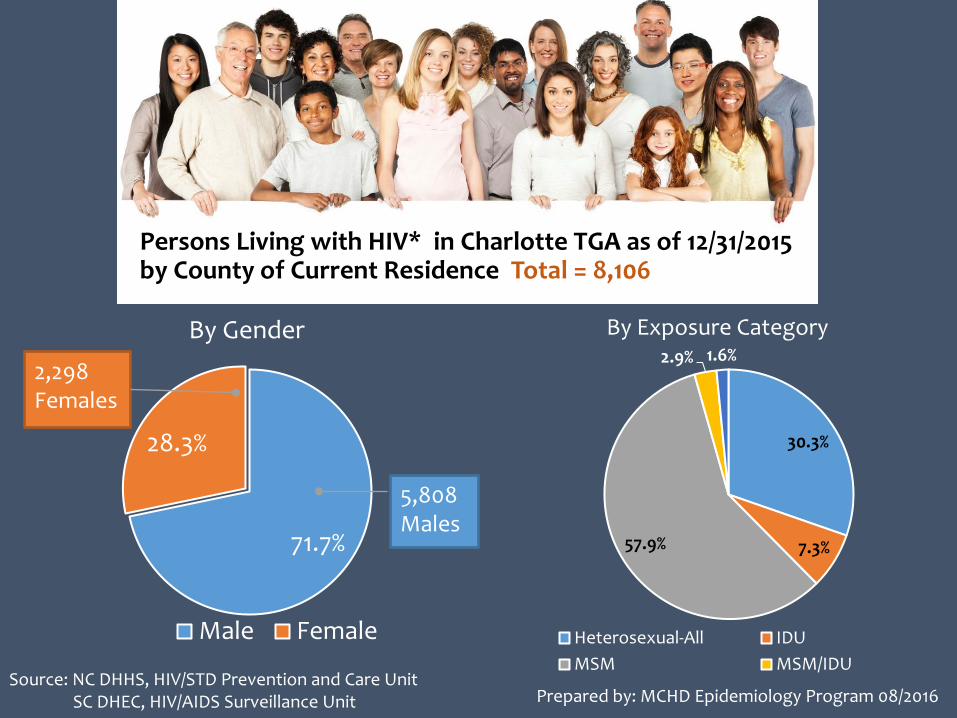
Persons Living with HIV* in Charlotte TGA as of 12/31/2015 by County of Current Residence Total = 8,106
Source: NC DHHS, HIV/STD Prevention and Care UnitSC DHEC, HIV/AIDS Surveillance Unit
71.7%
28.3%
By Gender
Male Female
5,808 Males
2,298 Females
Prepared by: MCHD Epidemiology Program 08/2016
30.3%
7.3%57.9%
2.9% 1.6%
Heterosexual-All IDUMSM MSM/IDU
By Exposure Category

Racial and Ethnic Differences among Persons Living with HIV in Charlotte TGA
0.5%
67.0%6.5%
22.8%
2.9%
Asian/Pacific Islander Black/African American
Hispanic/Latino White/Caucasian
Multiple Race
Persons Living with HIV in Charlotte TGA by Race/Ethnicity
Total= 8,1063.0%
21.7%
9.4%63.5%
1.9%
Asian/Pacific Islander Black/African American
Hispanic/Latino White/Caucasian
Multiple Race
Persons Living Residing in Charlotte TGA by Race/EthnicityTotal= 2,298,915
Source: NC DHHS, HIV/STD Prevention and Care UnitSC DHEC, HIV/AIDS Surveillance UnitUS Census Bureau Prepared by: MCHD Epidemiology Program 08/2016

Syphilis Cases Increase Across TGA
0
2
7
5
24
0
8
11
7
22
3
26
24
15
23
ANSON
CABARRUS
GASTON
UNION
YORK, SC
2015 2014 2013
2013 – 2015 Newly Diagnosed Early Syphilis (Primary, Secondary, Early Latent) Cases
149
274
405
0 50 100 150 200 250 300 350 400 450
2013
2014
2015
Mecklenburg, NC
• Between 2013 and 2015 Early Syphilis cases increased by 14% in the TGA
• Increases were most noted in Cabarrus, Gaston, Union and Mecklenburg.
Source: NC DHHS, HIV/STD Prevention and Care UnitSC DHEC, HIV/AIDS Surveillance Unit

Additional HIV Surveillance Data
Online at: http://epi.publichealth.nc.gov/cd/stds/figures/std15rpt.pdf
Online at: www.scdhec.gov/Health/DiseasesandConditions/InfectiousDiseases/HIVandSTDs/DataandReports/