2015 results - lloyds banking group
TRANSCRIPT

2015 RESULTSNews Release
BASIS OF PRESENTATION This release covers the results of Lloyds Banking Group plc together with its subsidiaries (the Group) for the year ended 31 December 2015. Statutory basis: Statutory information is set out on pages 59 to 94. However, a number of factors have had a significant effect on the comparability of the Group’s financial position and results. As a result, comparison on a statutory basis of the 2015 results with 2014 is of limited benefit. Underlying basis: Underlying basis information is set out on pages 1 to 31. In order to present a more meaningful view of business performance, the results are presented on an underlying basis excluding items that in management’s view would distort the comparison of performance between periods. Based on this principle the following items are excluded from underlying profit: – asset sales and other items, which includes the effects of certain asset sales, the impact of liability management
actions, the volatility relating to the Group’s own debt and hedging arrangements as well as that arising in the insurance businesses, insurance gross up, the amortisation of purchased intangible assets and the unwind of acquisition-related fair value adjustments, and certain past service pensions credits or charges in respect of the Group’s defined benefit pension arrangements;
– Simplification costs, which for 2015 are limited to redundancy costs relating to the programme announced in October 2014. Costs in 2014 include severance, IT and business costs relating to the programme started in 2011;
– TSB build and dual running costs and the loss relating to the TSB sale; and – payment protection insurance and other conduct provisions. Unless otherwise stated, income statement commentaries throughout this document compare the year ended 31 December 2015 to the year ended 31 December 2014, and the balance sheet analysis compares the Group balance sheet as at 31 December 2015 to the Group balance sheet as at 31 December 2014. TSB: On 24 March 2015 the Group sold a 9.99 per cent interest in TSB reducing its holding to 40 per cent. This sale resulted in a loss of control over TSB and its deconsolidation. Accordingly, the Group’s results in 2015 include TSB for the first quarter only. To facilitate meaningful period-on-period comparison, the operating results of TSB have been reported separately within underlying profit in all periods. The sale of the remaining interest was completed in the second quarter of the year.
FORWARD LOOKING STATEMENTS
This document contains certain forward looking statements with respect to the business, strategy and plans of Lloyds Banking Group and its current goals and expectations relating to its future financial condition and performance. Statements that are not historical facts, including statements about Lloyds Banking Group’s or its directors’ and/or management’s beliefs and expectations, are forward looking statements. By their nature, forward looking statements involve risk and uncertainty because they relate to events and depend upon circumstances that will or may occur in the future. Factors that could cause actual business, strategy, plans and/or results to differ materially from the plans, objectives, expectations, estimates and intentions expressed in such forward looking statements made by the Group or on its behalf include, but are not limited to: general economic and business conditions in the UK and internationally; market related trends and developments; fluctuations in exchange rates, stock markets and currencies; the ability to access sufficient sources of capital, liquidity and funding when required; changes to the Group’s credit ratings; the ability to derive cost savings; changing customer behaviour including consumer spending, saving and borrowing habits; changes to borrower or counterparty credit quality; instability in the global financial markets, including Eurozone instability, the potential for one or more countries to exit the Eurozone or European Union (EU) (including the UK as a result of a referendum on its EU membership) and the impact of any sovereign credit rating downgrade or other sovereign financial issues; technological changes and risks to cyber security; natural, pandemic and other disasters, adverse weather and similar contingencies outside the Group’s control; inadequate or failed internal or external processes or systems; acts of war, other acts of hostility, terrorist acts and responses to those acts, geopolitical, pandemic or other such events; changes in laws, regulations, accounting standards or taxation, including as a result of further Scottish devolution; changes to regulatory capital or liquidity requirements and similar contingencies outside the Group’s control; the policies, decisions and actions of governmental or regulatory authorities or courts in the UK, the EU, the US or elsewhere including the implementation and interpretation of key legislation and regulation; the ability to attract and retain senior management and other employees; requirements or limitations imposed on the Group as a result of HM Treasury’s investment in the Group; actions or omissions by the Group’s directors, management or employees including industrial action; changes to the Group’s post-retirement defined benefit scheme obligations; the provision of banking operations services to TSB Banking Group plc; the extent of any future impairment charges or write-downs caused by, but not limited to, depressed asset valuations, market disruptions and illiquid markets; the value and effectiveness of any credit protection purchased by the Group; the inability to hedge certain risks economically; the adequacy of loss reserves; the actions of competitors, including non-bank financial services and lending companies; and exposure to regulatory or competition scrutiny, legal, regulatory or competition proceedings, investigations or complaints. Please refer to the latest Annual Report on Form 20-F filed with the US Securities and Exchange Commission for a discussion of certain factors together with examples of forward looking statements. Except as required by any applicable law or regulation, the forward looking statements contained in this document are made as of today’s date, and Lloyds Banking Group expressly disclaims any obligation or undertaking to release publicly any updates or revisions to any forward looking statements.

CONTENTS
Page
Key highlights 1
Consolidated income statement 2
Balance sheet and key ratios 2
Summary consolidated balance sheet 3
Group Chief Executive’s statement 4
Chief Financial Officer’s review of financial performance 8
Underlying basis segmental analysis 15
Underlying basis quarterly information 16
Divisional highlights
Retail 17
Commercial Banking 19
Consumer Finance 21
Insurance 23
Run-off and Central items 26
Additional information
Reconciliation between statutory and underlying basis results 27
Banking net interest margin 28
Other operating income 29
Volatility arising in the insurance businesses 29
Return on required equity 30
Number of employees (full-time equivalent) 30
Remuneration 31
Risk management
Principal risks and uncertainties 32
Credit risk portfolio 35
Funding and liquidity management 46
Capital management 51
Statutory information
Primary statements 59
Consolidated income statement 60
Consolidated statement of comprehensive income 61
Consolidated balance sheet 62
Consolidated statement of changes in equity 64
Consolidated cash flow statement 66
Notes to the consolidated financial statements 67
Contacts 95

LLOYDS BANKING GROUP PLC 2015 FULL-YEAR RESULTS
Page 1 of 95
RESULTS FOR THE FULL YEAR
‘We made a strong start in 2015 to the next phase of our strategy and have delivered a robust financial performance, enabling increased dividend payments. Our differentiated, UK focused, retail and commercial business model continues to deliver, with our financial strength, cost leadership and lower risk focus positioning us well in the face of current market uncertainty. We remain confident in our ability to become the best bank for customers and shareholders, while continuing to support the economy and helping Britain prosper.’
António Horta-Osório Group Chief Executive
Robust financial performance with increased underlying profits and returns
Underlying profit of £8.1 billion, up 5 per cent (up 10 per cent excluding TSB); underlying return on equity of 15.0 per cent (2014: 13.6 per cent)
Total income up 1 per cent to £17.6 billion
− Net interest income of £11.5 billion, up 5 per cent, driven by further margin improvement to 2.63 per cent
− Other income 5 per cent lower at £6.2 billion, largely due to disposals and run-off, with expected recovery in the last quarter despite impact of weather related insurance claims (c.£60 million)
Operating costs lower at £8.3 billion despite additional investment and Simplification costs; market-leading cost:income ratio further improved by 0.5 percentage points to 49.3 per cent
Impairment charge down 48 per cent to £568 million; asset quality ratio improved by 9 basis points to 0.14 per cent
Statutory profit before tax of £1.6 billion (2014: £1.8 billion), with increased PPI charge
PPI provision of £4.0 billion includes additional £2.1 billion in fourth quarter reflecting action on proposed time-bar
Capital generation in year of 300 basis points pre dividend and PPI costs
Strong balance sheet with pro forma common equity tier 1 (CET1) ratio of 13.0 per cent (2014: 12.8 per cent), 13.9 per cent before 2015 dividends; pro forma leverage ratio of 4.8 per cent (2014: 4.9 per cent)
Tangible net assets per share post dividend of 52.3 pence, 53.8 pence pre dividend (31 Dec 2014: 54.9 pence). Significant improvement post year end and now estimated at 55.6 pence at 19 February
Our differentiated UK focused business model continues to deliver
Improving customer satisfaction while helping Britain prosper through sustainable growth in targeted segments: net lending to SMEs up 5 per cent, and supporting 1 in 4 first-time buyers
Simpler and more efficient; accelerated delivery of cost initiatives and targeting further efficiency savings
Low risk business model and cost discipline provide security and competitive advantage
Simple, UK focused, multi-brand model and actively responding to lower for longer interest rates
Completion of sale of TSB to Banco Sabadell
UK government stake reduced to approximately 9 per cent
Guidance reflects improved business performance, low risk business model and lower interest rate environment
Net interest margin for 2016 expected to increase to around 2.70 per cent
Asset quality ratio for 2016 expected to be around 20 basis points
Continue to target return on required equity of 13.5 to 15.0 per cent and around 45 per cent cost:income ratio with reductions every year; based on current interest rate assumptions, we now expect these to be delivered in 2018 and as we exit 2019, respectively
Capital generation guidance improved; now expect to generate around 2 percentage points of CET1 per annum, pre dividend
Increased ordinary dividend with payment of a special dividend
The Board has recommended a final ordinary dividend of 1.5 pence per share, making a total ordinary dividend for the year of 2.25 pence per share, in line with our progressive and sustainable ordinary dividend policy
In addition, the Board has recommended a capital distribution in the form of a special dividend of 0.5 pence per share

LLOYDS BANKING GROUP PLC 2015 FULL-YEAR RESULTS
Page 2 of 95
CONSOLIDATED INCOME STATEMENT − UNDERLYING BASIS
2015 2014 Change £ million £ million % Net interest income 11,482 10,975 5
Other income 6,155 6,467 (5)
Total income 17,637 17,442 1
Operating costs (8,311) (8,322) −
Operating lease depreciation (764) (720) (6)
Total costs (9,075) (9,042) −
Impairment (568) (1,102) 48
Underlying profit excluding TSB 7,994 7,298 10
TSB 118 458
Underlying profit 8,112 7,756 5 Asset sales and other items (716) (1,345)
Simplification costs (170) (966)
TSB costs (745) (558)
Payment protection insurance provision (4,000) (2,200)
Other conduct provisions (837) (925)
Profit before tax – statutory 1,644 1,762 (7)
Taxation (688) (263)
Profit for the year 956 1,499 (36)
Underlying earnings per share 8.5p 8.1p 0.4p
Earnings per share 0.8p 1.7p (0.9)p Dividends per share – ordinary 2.25p 0.75p
– special 0.5p −
Total 2.75p 0.75p
Banking net interest margin1 2.63% 2.40% 23bp
Average interest-earning banking assets1 £442bn £461bn (4)
Cost:income ratio1 49.3% 49.8% (0.5)pp
Asset quality ratio1 0.14% 0.23% (9)bp
Return on risk-weighted assets 3.53% 3.02% 51bp
Return on assets 0.98% 0.92% 6bp
Underlying return on required equity 15.0% 13.6% 1.4pp
Statutory return on required equity 1.5% 3.0% (1.5)pp
BALANCE SHEET AND KEY RATIOS
At 31 Dec
2015 At 31 Dec
2014 Change
% Loans and advances to customers2,3 £455bn £456bn −
Customer deposits3 £418bn £423bn (1)Loan to deposit ratio3 109% 108% 1pp
Pro forma common equity tier 1 ratio4 13.0% 12.8% 0.2pp
Common equity tier 1 ratio 12.8% 12.8% −
Transitional total capital ratio 21.5% 22.0% (0.5)pp Risk-weighted assets £223bn £240bn (7)Pro forma leverage ratio4 4.8% 4.9% (0.1)pp
Tangible net assets per share 52.3p 54.9p (2.6)p 1 Excluding TSB. 2 Excludes reverse repos of £nil (31 December 2014: £5.1 billion). 3 Comparatives restated to exclude TSB. 4 Including Insurance dividend relating to 2015, paid in 2016. Excluding the Insurance dividend the leverage ratio was the same at
4.8 per cent.
LLOYDS BANKING GROUP PLC 2015 FULL-YEAR RESULTS
Page 3 of 95
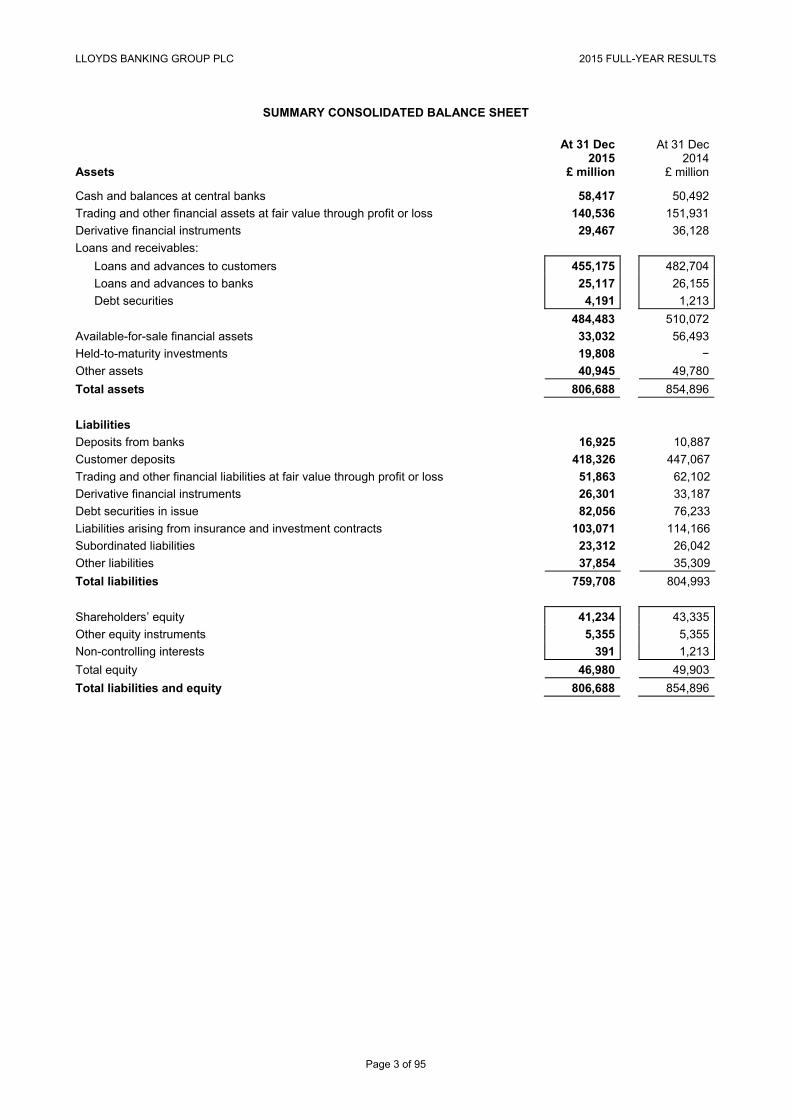
SUMMARY CONSOLIDATED BALANCE SHEET
At 31 Dec
2015 At 31 Dec
2014 Assets £ million £ million
Cash and balances at central banks 58,417 50,492
Trading and other financial assets at fair value through profit or loss 140,536 151,931
Derivative financial instruments 29,467 36,128
Loans and receivables:
Loans and advances to customers 455,175 482,704
Loans and advances to banks 25,117 26,155
Debt securities 4,191 1,213
484,483 510,072
Available-for-sale financial assets 33,032 56,493
Held-to-maturity investments 19,808 −
Other assets 40,945 49,780
Total assets 806,688 854,896
Liabilities
Deposits from banks 16,925 10,887
Customer deposits 418,326 447,067
Trading and other financial liabilities at fair value through profit or loss 51,863 62,102
Derivative financial instruments 26,301 33,187
Debt securities in issue 82,056 76,233
Liabilities arising from insurance and investment contracts 103,071 114,166
Subordinated liabilities 23,312 26,042
Other liabilities 37,854 35,309
Total liabilities 759,708 804,993
Shareholders’ equity 41,234 43,335
Other equity instruments 5,355 5,355
Non-controlling interests 391 1,213
Total equity 46,980 49,903
Total liabilities and equity 806,688 854,896
LLOYDS BANKING GROUP PLC 2015 FULL-YEAR RESULTS
Page 4 of 95
GROUP CHIEF EXECUTIVE’S STATEMENT
Highlights
2015 was a milestone year for Lloyds Banking Group. In a year in which we celebrated the 250th anniversary of Lloyds
Bank and the 200th anniversary of Scottish Widows, we also continued to make strong progress in the next phase of our
strategy to become the best bank for customers and shareholders. We improved customer experience, increased net
lending in key customer segments, and delivered on key targets within the Helping Britain Prosper Plan. At the same
time our financial performance has continued to improve, with an increase in underlying profitability and returns as well
as a further strengthening of our already strong capital position, in spite of additional PPI provisions reflecting the
Financial Conduct Authority’s (FCA) consultation on time barring. This delivery has, in turn, enabled us to increase the
ordinary dividend and to return surplus capital through a special dividend. As a result of our ongoing progress, the UK
government has made further substantial progress in returning the Group to full private ownership.
The economic and regulatory environment
As a UK retail and commercial bank, we are well placed to continue to support and benefit from the sustainable recovery
in the UK economy. While the current prolonged period of low interest rates and increasing competition have created
challenges for profitability across the UK banking sector, we are well positioned, given our cost leadership position and
low risk business model. The underlying health of the UK economy, to which we are inextricably linked, also remains
resilient. This is reflected in strong employment levels, reduced levels of household and corporate indebtedness, and
increased house prices, amongst other things, which provide a positive backdrop and underpin the Group’s future
prospects. In the face of current market volatility and uncertainties including the forthcoming EU referendum, our strong
balance sheet and low risk approach positions us well, while our differentiated business model continues to provide
competitive advantage.
We remain well positioned in a regulatory environment that continues to evolve. 2015 brought greater clarity on a number
of issues that are significant for the Group and the wider banking sector. We support the aims of the Competition and
Markets Authority (CMA) in ensuring that small business customers and consumers have effective choice and are
adequately protected, and we welcome the publication of its notice of possible remedies to ensure these objectives are
achieved. Our simple, UK focused business model positions us well for ring-fencing and the Minimum Requirements for
own funds and Eligible Liabilities (MREL).
In line with its broader aim of creating a safer and more stable UK banking sector, in December the Financial Policy
Committee clarified its views on the future capital requirements for the industry. Importantly, these views for the industry
as a whole are broadly consistent with the amount of capital we wish to retain to grow the business, meet regulatory
requirements and cover uncertainties. This, in turn, supports the Group’s expectation to be able to distribute a significant
proportion of the capital it generates going forward. Finally, we welcome the decision of the FCA to consult on a deadline
for PPI complaints and the certainty that this will bring for both customers and shareholders.
Financial performance and balance sheet strength
The Group has delivered another robust financial performance in the year, with underlying profit increasing by 5 per cent
to £8,112 million, or by 10 per cent excluding TSB, leading to an improvement in our underlying return on required equity
to 15.0 per cent. This improvement was driven by net interest income, reflecting the strengthening of our net interest
margin, lower operating costs and a significant reduction in impairment charges, which more than offset the more
subdued outturn for other income. Statutory profit before tax was 7 per cent lower at £1,644 million, after additional
charges that we have taken for PPI.
In 2015, we strengthened our provision for PPI by £4.0 billion, with a £2.1 billion increase taken in the fourth quarter
primarily reflecting our interpretation of the FCA’s consultation on a proposed time bar as well as the Plevin case. We
also charged £745 million in relation to the disposal of TSB, bringing the total cost of delivering this commitment to the
EU, which is now complete, to £2.4 billion over the past five years.

LLOYDS BANKING GROUP PLC 2015 FULL-YEAR RESULTS
Page 5 of 95
GROUP CHIEF EXECUTIVE’S STATEMENT (continued)
During the year, we have continued to strengthen our balance sheet, with our strong capital generation enabling us to
increase our common equity tier 1 (CET1) ratio to 13.0 per cent, after increased dividend payments. This and our other
capital and leverage ratios remain among the strongest of our major banking peers worldwide, in turn positioning us well
for evolving regulatory capital requirements. In addition, the Group’s liquidity position remains strong, with our total
wholesale funding of £120 billion at the end of 2015 more than covered by our liquid assets of £123 billion.
The progress we have made in successfully executing our differentiated, simple and low risk business model is now
being increasingly recognised, with the major credit rating agencies of Fitch, Moody’s and Standard & Poor’s having all
either strengthened or reaffirmed the Bank’s credit ratings during the course of the year. The transformation of the
Group’s risk profile has also been reflected in our credit default swap spread, which remains the lowest of our major UK
banking peers. This and our cost:income ratio, which, at 49.3 per cent, is also the lowest of our major UK peers, remain
ongoing sources of competitive advantage in line with the strategic plan presented to the market in June 2011.
Strategic progress
In 2015, we have made good progress in the three strategic objectives that we outlined at our strategic update in October
2014: creating the best customer experience; becoming simpler and more efficient; and delivering sustainable growth.
Creating the best customer experience
As a customer-focused business, we are committed to meeting our customers’ evolving needs and preferences
effectively through our multi-brand and multi-channel approach. In an environment where the pace of digital adoption is
accelerating, we now have the largest digital bank, with our online customer base amounting to over 11.5 million
customers and our mobile banking customer base of 6.6 million customers able to access the UK’s no.1 rated banking
app. Our strategic commitments for digital also remain on track, with c.55 per cent of customer needs being met digitally
in 2015. We remain focused, however, on our integrated, multi-channel approach that our clients value and have
continued to enhance and optimise the branch network to ensure that it meets our customers’ evolving needs. In
particular, we have now introduced Wi-fi connectivity and automated solutions for more simple customer transactions in
nearly 70 per cent of branches. In addition, we have now launched our remote advice proposition, enabling customers to
interact with us from the comfort of their own homes. In 2015 we also enhanced a number of customer processes, having
launched an online feature which enables customers to obtain a mortgage agreement in principle in real time, and piloted
a new process which has halved the time to open a new business bank account. Our progress in creating the best
customer experience has been reflected in our net promoter score across the Group, which has continued to improve in
2015 and is now over 50 per cent higher than at the end of 2011. Group reportable banking complaints (excluding PPI)
also remain significantly lower than the average of our major banking peers.
Becoming simpler and more efficient
Our cost leadership position remains a key source of competitive advantage and strategic priority for the Group. We
continue to invest significantly in IT with a focus on ensuring that our systems and processes are both efficient and
resilient and that our customers’ experiences are improved through the end-to-end automation of key customer journeys.
In addition, we achieved over £150 million of run-rate savings in third party spend in the year by managing demand more
efficiently and negotiating better rates with our suppliers. Through these and other efficiency initiatives, we have to date
delivered total run rate savings of £373 million in the second phase of our Simplification programme, and we remain
ahead of target in achieving total run-rate savings of £1 billion by the end of 2017. In addition, we are actively responding
to prolonged lower interest rates and have accelerated our cost savings delivery while also targeting further efficiency
initiatives. The combination of this absolute focus on cost management and the resilience of our income generation has
enabled us to improve our market-leading cost:income ratio to 49.3 per cent from 49.8 per cent in 2014.

LLOYDS BANKING GROUP PLC 2015 FULL-YEAR RESULTS
Page 6 of 95
GROUP CHIEF EXECUTIVE’S STATEMENT (continued)
Delivering sustainable growth
The Group aims to deliver growth across its key customer segments that is sustainable and consistent with its low risk
business model. In 2015 we continued to make good progress in growing above the market in areas where we are
underrepresented. Net lending to our SME customers increased by over £1 billion or 5 per cent in the year, continuing
the trend of the last five years of significantly outperforming the market overall. Our Consumer Finance business is also
generating strong growth with an ahead of plan 17 per cent year-on-year increase in UK lending, with motor finance
continuing to deliver double digit growth and our credit card balances growing by approximately 4 per cent compared
with the market growth rate of less than 2 per cent. We continue to support first-time buyers and remain the largest
lender to this important customer group, providing 1 in 4 first-time buyer mortgages in 2015. We have taken the
conscious decision, however, to balance margin considerations with volume growth in the mortgage business, growing
our open book by around 1 per cent versus a market that grew by around 2.5 per cent. We believe this is the right
approach as the leader in what is, at the moment, a low growth market where growth is predominantly coming from
Buy-to-let.
Government stake and TSB sale
The combination of the significant progress we have made towards our strategic objectives and our robust financial
performance has also enabled the UK government to make further substantial progress in returning the Group to full
private ownership during the course of 2015. The government has now reduced its stake from 43 per cent to around
9 per cent, returning approximately £16 billion to the UK taxpayer above their ‘in price’, on top of the dividends paid in
2015. We will continue to support the proposed retail offer, but following the government’s announcement on 28 January
2016, this has been deferred until it determines that the market conditions are appropriate. Separately, the completion of
the sale of our interest in TSB to Banco Sabadell in June 2015 represents the continued delivery of our commitment to
the European Commission under the terms of the state aid agreement.
Dividend
In line with our progressive and sustainable ordinary dividend policy, the Board has recommended a final ordinary
dividend of 1.5 pence, taking the total ordinary dividend declared for the year to 2.25 pence per ordinary share.
In addition, the Board has recommended a special dividend of 0.5 pence per share, representing the distribution of
surplus capital over and above the Board’s view of the current level of capital required to grow the business, meet
regulatory requirements and cover uncertainties.
Helping Britain Prosper and delivering growth in our key customer segments
As a customer-focused UK centric bank, our prospects are inextricably linked to the strength of the UK economy, which
we continue to support through our strategic net lending targets in our key customer segments and the targets we have
set through our Helping Britain Prosper Plan.
In our Retail division we continue to be a lead supporter of the UK government’s Help to Buy scheme and have
exceeded our lending target to small businesses within the Helping Britain Prosper Plan by supporting over 1 in 5 new
business start-ups. In Commercial Banking we continue to play a lead role in supporting the UK economy and remain
the largest net lender to SMEs in the UK government’s Funding for Lending scheme. Our Consumer Finance business
also continues to deliver strong growth within our low risk appetite, increasing its market share, with the division also
making a number of improvements to our customer propositions across motor finance and credit cards. In Insurance,
following the completion of our first bulk annuity transaction with the Scottish Widows With-Profits fund in the first half, we
have also successfully completed our first open market transaction in the fourth quarter and will continue to participate in
this attractive market.
We continue to successfully deliver against our Helping Britain Prosper Plan targets to people, businesses and
communities across the UK. Amongst these targets, in 2015 we donated £17 million to the Banks’ four independent
charitable foundations to tackle disadvantage, while also providing more than £1 million of additional funding to support
credit unions and more than 320,000 colleague volunteering hours to support community projects.

LLOYDS BANKING GROUP PLC 2015 FULL-YEAR RESULTS
Page 7 of 95
GROUP CHIEF EXECUTIVE’S STATEMENT (continued)
Building the best team
We recognise the strategic importance of colleague engagement and the role that this plays in ensuring the continued
delivery of our strategic priorities. The latest colleague survey results show that colleague engagement has continued to
improve to the highest level to date and that our performance excellence score is above the UK ‘high performance norm’.
We have also made good progress with our target for gender diversity in senior management, with women now
representing 31 per cent of senior managers, up from 28 per cent two years ago. These encouraging results
demonstrate the Group’s success in embedding a customer-focused culture and that our colleagues are committed to
our aim of creating the best experience for our customers.
Outlook
Our strong strategic progress and good financial performance position the Group well for future success, with our
business model allowing us to respond effectively to the challenges of the lower for longer interest rate environment and
the current market volatility. We remain committed to our financial targets for return on required equity and cost:income
ratio, although in light of the implementation of the corporation tax surcharge for banks and the lower for longer interest
rate environment, we now expect to deliver a return on required equity of 13.5 to 15.0 per cent in 2018 and a cost:income
ratio of around 45 per cent as we exit 2019, with improvements every year. Our capital generation will remain strong and
we are increasing our guidance for annual pre dividend CET1 capital generation to around 2 per cent. In 2016, we expect
an increased net interest margin of around 2.70 per cent and, in light of our low risk approach, a full year asset quality
ratio of around 20 basis points, significantly lower than our medium-term guidance.
Summary In our milestone year we made a strong start to the next phase of our strategy and have delivered a robust financial
performance. The combination of this strategic and financial performance with our simple, low risk business model
positions us well in the face of uncertainties regarding the global economic, political, competitive and regulatory
environment and underpins our confidence in the Group’s future prospects. From these firm foundations, we believe we
are well placed to support the UK economy and become the best bank for customers, while delivering superior and
sustainable returns for our shareholders.
António Horta-Osório
Group Chief Executive
LLOYDS BANKING GROUP PLC 2015 FULL-YEAR RESULTS
Page 8 of 95
CHIEF FINANCIAL OFFICER’S REVIEW OF FINANCIAL PERFORMANCE
Overview: robust financial performance with increased underlying profits and returns; strong balance sheet
The Group’s underlying profit increased by 5 per cent in the year to £8,112 million, driven by a 1 per cent increase in total income, lower operating costs despite increased investment in the business and a 48 per cent improvement in impairments. Statutory profit before tax was £1,644 million (2014: £1,762 million) after provisions for PPI of £4,000 million (2014: £2,200 million) including an additional £2,100 million charged in the fourth quarter. Statutory profit after tax was £956 million compared to £1,499 million in 2014.
Total loans and advances to customers were £455 billion compared with £456 billion (excluding TSB) at 31 December 2014, with growth in the key customer segments offset by further reductions in run-off and portfolios closed to new business. Customer deposits were £418 billion compared with £423 billion (excluding TSB), a reduction of £5 billion, or 1 per cent, compared with 31 December 2014, largely due to a planned reduction in tactical deposits.
The combination of good underlying profitability and continued reduction in risk-weighted assets resulted in an improvement in the Group’s common equity tier 1 ratio on a pro forma basis to 13.9 per cent before taking account of dividends in respect of 2015 and 13.0 per cent after dividends (31 December 2014: 12.8 per cent). The pro forma leverage ratio was 4.8 per cent (31 December 2014: 4.9 per cent).
Total income 2015 2014 Change £ million £ million %
Net interest income 11,482 10,975 5
Other income 6,155 6,467 (5)
Total income 17,637 17,442 1
Banking net interest margin 2.63% 2.40% 23bp
Average interest-earning banking assets £441.9bn £461.1bn (4)
Average interest-earning banking assets excluding run-off £427.5bn £431.2bn (1)
Further detail on net interest income and other income is included on pages 28 and 29.
Total income of £17,637 million was 1 per cent higher than 2014, with growth in net interest income partly offset by lower other income.
Net interest income increased 5 per cent to £11,482 million, reflecting the improved net interest margin. Net interest margin of 2.63 per cent was up 23 basis points, driven by a combination of lower deposit and wholesale funding costs, partly offset by continued pressure on asset prices. Average interest-earning banking assets fell by £19 billion, or 4 per cent, to £442 billion, largely as a result of the reduction of £15.6 billion in run-off assets. Excluding run-off, average interest-earning banking assets were 1 per cent lower with lending growth in key customer segments offset by reductions in portfolios closed to new business.
The Group expects the net interest margin for the 2016 full year will be around 2.70 per cent, despite continued low base rates, benefiting from further improvements in deposit and wholesale funding costs, including the impact of the ECN exchange, partly offset by continued pressure on asset prices.
Other income was 5 per cent lower at £6,155 million largely as a result of the reduction in run-off business. Excluding run-off, other income was in line with 2014. Fees and commissions were lower than 2014 mainly due to a reduction in current account and credit card transaction related net income, and the impact of changes in the regulatory environment. This was partly offset by income generated by the Insurance business from its entry into the bulk annuity market and the increase in operating lease income. As expected, other income recovered in the fourth quarter, and at £1,528 million, was 11 per cent ahead of the third quarter and 1 per cent higher than in the same period last year, despite insurance claims as a result of December’s floods and storms of £58 million.

LLOYDS BANKING GROUP PLC 2015 FULL-YEAR RESULTS
Page 9 of 95
CHIEF FINANCIAL OFFICER’S REVIEW OF FINANCIAL PERFORMANCE (continued)
Costs 2015 2014 Change £ million £ million %
Operating costs 8,311 8,322 −
Cost:income ratio 49.3% 49.8% (0.5)pp
Simplification savings annual run-rate1 £373m 1 Run-rate savings achieved from phase II of the Simplification programme.
Operating costs of £8,311 million were lower than in 2014 despite now including costs relating to the next phase of
Simplification, with a £466 million increase in investment (including strategic initiatives and Simplification), and
£143 million for pay, inflation and other costs, offset by £491 million of incremental savings from the Simplification
programmes and £129 million of reductions from business disposals.
Phase II of the Simplification programme has delivered £373 million of annual run-rate savings to date and we are ahead
of target in achieving £1 billion of Simplification savings by the end of 2017. The Group has a proven track record in cost
management and given the lower interest rate environment, is responding through the accelerated delivery of cost
initiatives and targeting further efficiency savings.
The cost:income ratio improved to 49.3 per cent from 49.8 per cent in 2014 and remains one of the lowest of our major
UK banking peers. We remain committed to achieving annual improvements in the cost:income ratio with a target ratio of
around 45 per cent and based on current interest rate assumptions we now expect to achieve this target as we exit 2019.
Operating lease depreciation increased 6 per cent to £764 million driven by the continued growth in the Lex Autolease
business.
Impairment 2015 2014 Change
£ million £ million %
Continuing business impairment charge 560 899 38
Run-off impairment charge 8 203 96
Total impairment charge 568 1,102 48
Asset quality ratio 0.14% 0.23% (9)bp
Impaired loans as a % of closing advances 2.1% 2.9% (0.8)pp
Provisions as a % of impaired loans 46.1% 56.4% (10.3)pp
Provisions as a % of impaired loans excluding run-off 43.0% 44.6% (1.6)pp
The impairment charge was £568 million, 48 per cent lower than in 2014 as a result of the significant reduction in run-off
business and improvements in all divisions. The charge is net of significant provision releases and write-backs, although
at lower levels than seen in 2014. The asset quality ratio improved to 14 basis points from 23 basis points in 2014.
Impaired loans as a percentage of closing advances reduced to 2.1 per cent from 2.9 per cent at the end of December 2014, driven by reductions within both the continuing and the run-off portfolios including the impact of the sale of Irish commercial loans in the third quarter. Provisions as a percentage of impaired loans reduced from 56.4 per cent to 46.1 per cent reflecting the disposal of highly covered run-off assets during the year. The continuing business coverage ratio reduced slightly to 43.0 per cent (31 December 2014: 44.6 per cent) but remains strong.
In 2016, the Group expects to benefit from its continued disciplined approach to the management of credit and the resilient UK economy. The asset quality ratio for the 2016 full year is expected to be around 20 basis points, comprising a marginally lower level of gross impairments at around 25 basis points, compared with 28 basis points in 2015 and a much reduced level of write-backs and provision releases.
LLOYDS BANKING GROUP PLC 2015 FULL-YEAR RESULTS
Page 10 of 95
CHIEF FINANCIAL OFFICER’S REVIEW OF FINANCIAL PERFORMANCE (continued)
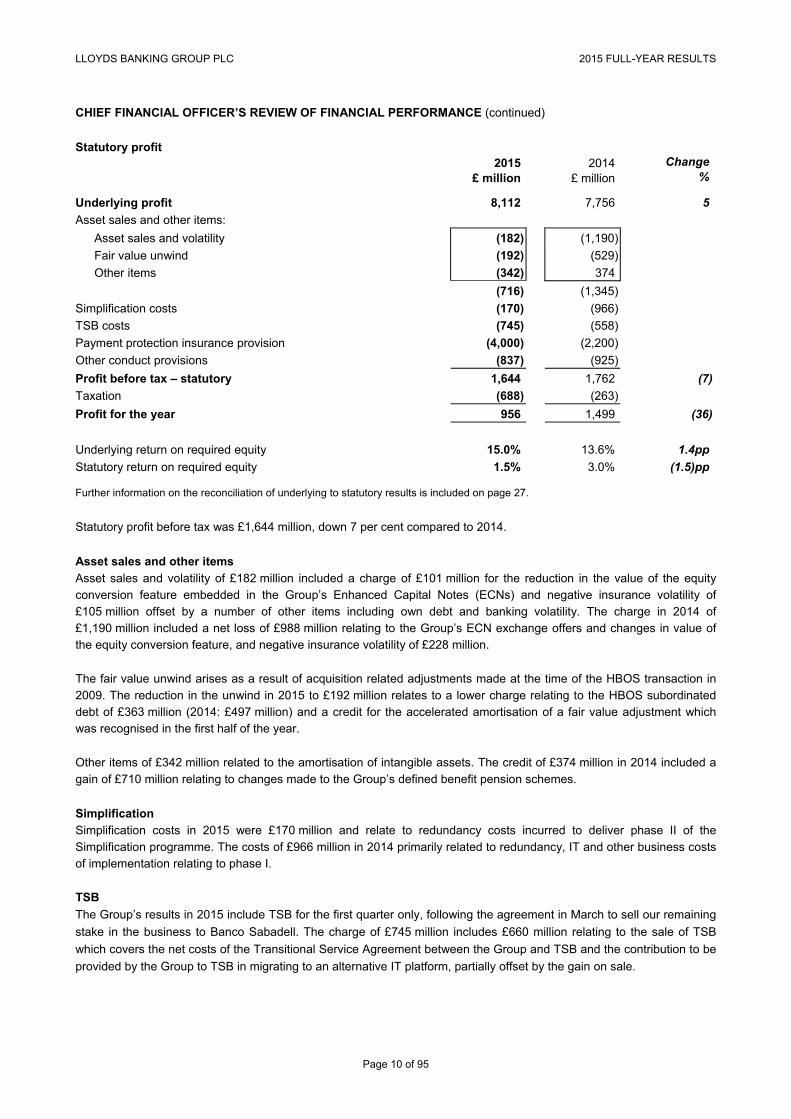
Statutory profit 2015 2014 Change £ million £ million % Underlying profit 8,112 7,756 5
Asset sales and other items:
Asset sales and volatility (182) (1,190)
Fair value unwind (192) (529)
Other items (342) 374
(716) (1,345)
Simplification costs (170) (966)
TSB costs (745) (558)
Payment protection insurance provision (4,000) (2,200)
Other conduct provisions (837) (925)
Profit before tax – statutory 1,644 1,762 (7)
Taxation (688) (263)
Profit for the year 956 1,499 (36)
Underlying return on required equity 15.0% 13.6% 1.4pp
Statutory return on required equity 1.5% 3.0% (1.5)pp
Further information on the reconciliation of underlying to statutory results is included on page 27.
Statutory profit before tax was £1,644 million, down 7 per cent compared to 2014.
Asset sales and other items
Asset sales and volatility of £182 million included a charge of £101 million for the reduction in the value of the equity conversion feature embedded in the Group’s Enhanced Capital Notes (ECNs) and negative insurance volatility of £105 million offset by a number of other items including own debt and banking volatility. The charge in 2014 of £1,190 million included a net loss of £988 million relating to the Group’s ECN exchange offers and changes in value of the equity conversion feature, and negative insurance volatility of £228 million.
The fair value unwind arises as a result of acquisition related adjustments made at the time of the HBOS transaction in 2009. The reduction in the unwind in 2015 to £192 million relates to a lower charge relating to the HBOS subordinated debt of £363 million (2014: £497 million) and a credit for the accelerated amortisation of a fair value adjustment which was recognised in the first half of the year.
Other items of £342 million related to the amortisation of intangible assets. The credit of £374 million in 2014 included a gain of £710 million relating to changes made to the Group’s defined benefit pension schemes.
Simplification
Simplification costs in 2015 were £170 million and relate to redundancy costs incurred to deliver phase II of the Simplification programme. The costs of £966 million in 2014 primarily related to redundancy, IT and other business costs of implementation relating to phase I.
TSB
The Group’s results in 2015 include TSB for the first quarter only, following the agreement in March to sell our remaining
stake in the business to Banco Sabadell. The charge of £745 million includes £660 million relating to the sale of TSB
which covers the net costs of the Transitional Service Agreement between the Group and TSB and the contribution to be
provided by the Group to TSB in migrating to an alternative IT platform, partially offset by the gain on sale.

LLOYDS BANKING GROUP PLC 2015 FULL-YEAR RESULTS
Page 11 of 95
CHIEF FINANCIAL OFFICER’S REVIEW OF FINANCIAL PERFORMANCE (continued)
PPI
The Group increased the provision for PPI costs by a further £4.0 billion in 2015, bringing the total amount provided to
£16.0 billion. This included an additional £2.1 billion in the fourth quarter, largely to reflect the impact of our interpretation
of the proposals contained within the Financial Conduct Authority’s (FCA) consultation paper regarding a potential time
bar and the Plevin case. As at 31 December 2015, £3.5 billion or 22 per cent of the total provision, remained unutilised
with approximately £3.0 billion relating to reactive complaints and associated administration costs.
The volume of reactive PPI complaints has continued to fall, with an 8 per cent reduction in 2015 compared with 2014, to
approximately 8,000 complaints per week. Whilst direct customer complaint levels fell 30 per cent year-on-year, those
from Claims Management Companies (CMCs) have remained broadly stable and as a result, CMCs now account for
over 70 per cent of complaints.
Assuming current FCA proposals are implemented and an average of approximately 10,000 complaints per week,
including those related to Plevin, the outstanding provision should be sufficient to cover all future PPI related complaints
and associated administration costs through to mid-2018.
Weekly complaint trends could vary significantly throughout this period, given they are likely to be impacted by a number
of factors including the potential impact of the FCA’s proposed communication campaign as well as changes in the
regulation of CMCs.
Other conduct provisions
In 2015, the Group incurred a charge of £837 million, of which £302 million was recognised in the fourth quarter relating
to a number of non-material items including packaged bank accounts and a number of other product rectifications
primarily in Retail, Insurance and Commercial Banking. Within the full year charge, £720 million of provisions related to
potential claims and remediation in respect of products sold through the branch network and continuing investigation of
matters highlighted through industry wide regulatory reviews, as well as legacy product sales and historical systems and
controls such as those governing legacy incentive schemes. This includes a full year charge of £225 million in respect of
complaints relating to packaged bank accounts. The full year charge also included the previously announced settlement
of £117 million that the Group reached with the FCA with regard to aspects of its PPI complaint handling process during
the period March 2012 to May 2013.
Taxation
The tax charge for the year to 31 December 2015 was £688 million (2014: £263 million), representing an effective tax
rate of 42 per cent (2014: 15 per cent).
The effective tax rate was higher than the UK corporation tax rate largely due to the introduction in 2015 of restrictions on
the deductibility of conduct related provisions which resulted in an additional tax charge of £459 million. Adjusting for this
charge, the effective tax rate would have been 14 per cent reflecting a number of positive one-off items including
non-taxable and relieved gains and a small prior year adjustment. Going forward we do not expect these positive one-off
items to continue and now expect a medium-term effective tax rate of around 27 per cent, including the forthcoming 8 per
cent surcharge on banking profits. This is lower than our previous guidance of around 30 per cent, reflecting actions on
PPI.

LLOYDS BANKING GROUP PLC 2015 FULL-YEAR RESULTS
Page 12 of 95
CHIEF FINANCIAL OFFICER’S REVIEW OF FINANCIAL PERFORMANCE (continued)
Return on required equity1
At 31 Dec
2015 At 31 Dec
2014 Change
% Underlying return on required equity 15.0% 13.6% 1.4pp
Statutory return on required equity 1.5% 3.0% (1.5)pp 1 For basis of calculation see page 30.
Underlying return on required equity has improved in the year reflecting the improvement in underlying profit together
with a reduction in the required equity which has been driven by the fall in risk-weighted assets. The statutory return was
lower, largely as a result of higher conduct related provisions and the restriction on their tax deductibility.
At the time of the strategic update in October 2014, we anticipated achieving a sustainable return on required equity, of
around 13.5 to 15.0 per cent by the end of 2017. Since this time, the expected level of interest rates over the plan period
has reduced significantly, required equity has increased to 12 per cent and the new bank tax surcharge of 8 per cent will
come into effect from 1 January 2016. We continue to target 13.5 to 15.0 per cent but, based on current interest rate
assumptions, we now expect to deliver this in 2018.
Balance sheet At 31 Dec
2015 At 31 Dec
2014 Change
%
Loans and advances to customers1 £455bn £456bn −
Customer deposits1 £418bn £423bn (1)
Wholesale funding £120bn £116bn 3
Wholesale funding <1 year maturity £38bn £41bn (8)
Of which money-market funding <1 year maturity2 £22bn £19bn 13
Loan to deposit ratio1 109% 108% 1pp
Liquidity coverage ratio – eligible assets £123bn 1 Comparatives restated to exclude TSB. As at 31 December 2014, loans and advances to customers including TSB were £478 billion,
customer deposits including TSB were £447 billion and the loan to deposit ratio was 107 per cent. 2 Excludes balances relating to margins of £2.5 billion (31 December 2014: £2.8 billion) and settlement accounts of £1.4 billion
(31 December 2014: £1.4 billion).
Total loans and advances to customers were £455 billion compared with £456 billion (excluding TSB) at 31 December
2014. Mortgage lending increased by 1 per cent, slightly below the market growth of 2.5 per cent, reflecting our focus on
protecting margin in a highly competitive low growth environment. UK loan growth in Consumer Finance was strong at
17 per cent and SME lending growth was 5 per cent, both outperforming the market. This growth was offset by further
reductions in run-off and other lending portfolios which are closed to new business.
Total deposits were £418 billion compared with £423 billion (excluding TSB) at 31 December 2014, largely due to a
planned reduction in tactical deposits.
Wholesale funding was £120 billion, of which £38 billion, or 32 per cent, had a maturity of less than one year
(31 December 2014: £41 billion, representing 35 per cent).
The Group’s liquidity position remains strong, with liquidity coverage ratio (LCR) eligible assets of £123 billion. LCR
eligible assets represent almost 5.7 times the Group’s money-market funding with a maturity of less than one year and
were in excess of total wholesale funding at 31 December 2015 thus providing a substantial buffer in the event of market
dislocation. The Group’s LCR ratio already exceeds regulatory requirements and is greater than 100 per cent.
LLOYDS BANKING GROUP PLC 2015 FULL-YEAR RESULTS
Page 13 of 95
CHIEF FINANCIAL OFFICER’S REVIEW OF FINANCIAL PERFORMANCE (continued)
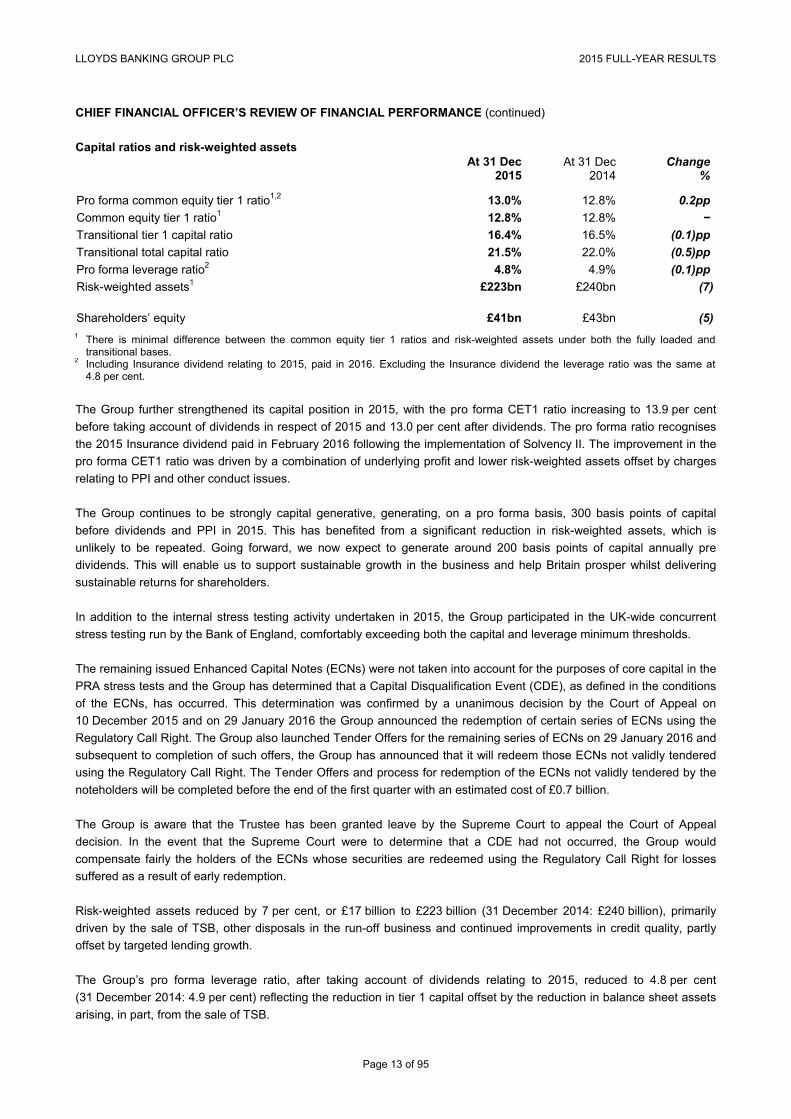
Capital ratios and risk-weighted assets At 31 Dec
2015 At 31 Dec
2014 Change
%
Pro forma common equity tier 1 ratio1,2 13.0% 12.8% 0.2pp
Common equity tier 1 ratio1 12.8% 12.8% −
Transitional tier 1 capital ratio 16.4% 16.5% (0.1)pp
Transitional total capital ratio 21.5% 22.0% (0.5)pp
Pro forma leverage ratio2 4.8% 4.9% (0.1)pp
Risk-weighted assets1 £223bn £240bn (7)
Shareholders’ equity £41bn £43bn (5) 1 There is minimal difference between the common equity tier 1 ratios and risk-weighted assets under both the fully loaded and
transitional bases. 2 Including Insurance dividend relating to 2015, paid in 2016. Excluding the Insurance dividend the leverage ratio was the same at
4.8 per cent.
The Group further strengthened its capital position in 2015, with the pro forma CET1 ratio increasing to 13.9 per cent
before taking account of dividends in respect of 2015 and 13.0 per cent after dividends. The pro forma ratio recognises
the 2015 Insurance dividend paid in February 2016 following the implementation of Solvency II. The improvement in the
pro forma CET1 ratio was driven by a combination of underlying profit and lower risk-weighted assets offset by charges
relating to PPI and other conduct issues.
The Group continues to be strongly capital generative, generating, on a pro forma basis, 300 basis points of capital
before dividends and PPI in 2015. This has benefited from a significant reduction in risk-weighted assets, which is
unlikely to be repeated. Going forward, we now expect to generate around 200 basis points of capital annually pre
dividends. This will enable us to support sustainable growth in the business and help Britain prosper whilst delivering
sustainable returns for shareholders.
In addition to the internal stress testing activity undertaken in 2015, the Group participated in the UK-wide concurrent
stress testing run by the Bank of England, comfortably exceeding both the capital and leverage minimum thresholds.
The remaining issued Enhanced Capital Notes (ECNs) were not taken into account for the purposes of core capital in the
PRA stress tests and the Group has determined that a Capital Disqualification Event (CDE), as defined in the conditions
of the ECNs, has occurred. This determination was confirmed by a unanimous decision by the Court of Appeal on
10 December 2015 and on 29 January 2016 the Group announced the redemption of certain series of ECNs using the
Regulatory Call Right. The Group also launched Tender Offers for the remaining series of ECNs on 29 January 2016 and
subsequent to completion of such offers, the Group has announced that it will redeem those ECNs not validly tendered
using the Regulatory Call Right. The Tender Offers and process for redemption of the ECNs not validly tendered by the
noteholders will be completed before the end of the first quarter with an estimated cost of £0.7 billion.
The Group is aware that the Trustee has been granted leave by the Supreme Court to appeal the Court of Appeal
decision. In the event that the Supreme Court were to determine that a CDE had not occurred, the Group would
compensate fairly the holders of the ECNs whose securities are redeemed using the Regulatory Call Right for losses
suffered as a result of early redemption.
Risk-weighted assets reduced by 7 per cent, or £17 billion to £223 billion (31 December 2014: £240 billion), primarily
driven by the sale of TSB, other disposals in the run-off business and continued improvements in credit quality, partly
offset by targeted lending growth.
The Group’s pro forma leverage ratio, after taking account of dividends relating to 2015, reduced to 4.8 per cent
(31 December 2014: 4.9 per cent) reflecting the reduction in tier 1 capital offset by the reduction in balance sheet assets
arising, in part, from the sale of TSB.

LLOYDS BANKING GROUP PLC 2015 FULL-YEAR RESULTS
Page 14 of 95
CHIEF FINANCIAL OFFICER’S REVIEW OF FINANCIAL PERFORMANCE (continued)
Dividend
The Board has recommended a final ordinary dividend of 1.5 pence per share, together with a capital distribution in the
form of a special dividend of 0.5 pence per share. This is in addition to the interim ordinary dividend of 0.75 pence per
share (2014: nil) that was announced at our 2015 half-year results.
The total ordinary dividend per share for 2015 of 2.25 pence has increased from 0.75 pence in 2014, in line with our
progressive and sustainable dividend policy, and we continue to expect ordinary dividends to increase over the medium
term with a dividend payout ratio of at least 50 per cent of sustainable earnings.
The special dividend of 0.5 pence per share represents the distribution of surplus capital over and above the Board’s
view of the current level of capital required to grow the business, meet regulatory requirements and cover uncertainties.
This level is consistent with our capital requirement guidance of around 12 per cent plus an amount broadly equivalent to
a further year’s ordinary dividend.
The amount of capital we believe is appropriate to hold is likely to vary from time to time depending on circumstances
and the Board will give due consideration, subject to the situation at the time, to the distribution of any surplus capital
through the use of special dividends or share buy backs. By its nature, there can be no guarantee that this level of
special dividend or any surplus capital distribution will be appropriate in future years.
Conclusion
The Group has delivered a robust underlying performance in 2015, driven by higher income, lower operating costs and
reduced impairment and further improved underlying returns. Statutory profit before tax of £1.6 billion was lower, due to
the impact of PPI, where an additional charge of £2.1 billion was taken in the fourth quarter largely to reflect our
interpretation of the impact of the proposals contained within the FCA consultation paper regarding a potential time bar
and the Plevin case.
As a result of the strategic and financial progress, the Board has recommended the payment of an increased ordinary
dividend and a special dividend and we are enhancing our guidance for the 2016 net interest margin and annual capital
generation. Although the delivery of the cost:income ratio and return on required equity guidance has been deferred, we
remain confident in the Group’s prospects and its ability to generate capital and believe the Group is well positioned to
deliver sustainable growth and superior returns.
George Culmer
Chief Financial Officer
LLOYDS BANKING GROUP PLC 2015 FULL-YEAR RESULTS
Page 15 of 95
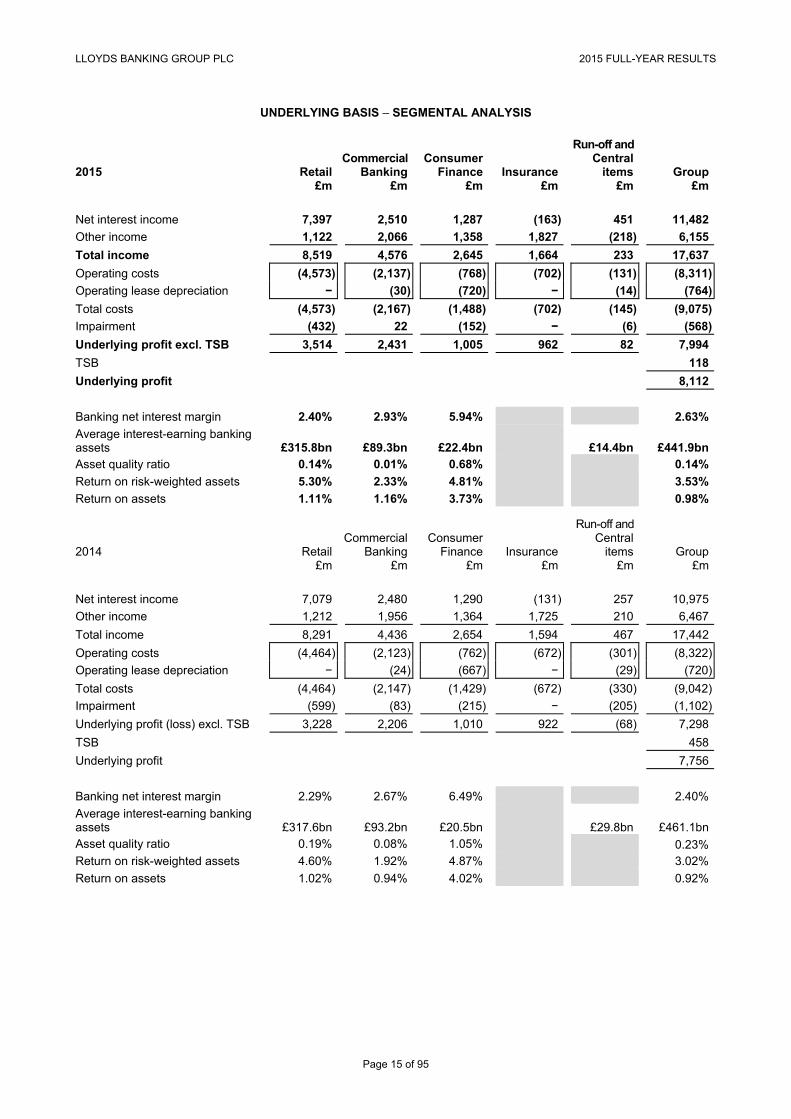
UNDERLYING BASIS – SEGMENTAL ANALYSIS
2015 Retail Commercial
Banking Consumer
Finance Insurance
Run-off and Central
items Group £m £m £m £m £m £m
Net interest income 7,397 2,510 1,287 (163) 451 11,482
Other income 1,122 2,066 1,358 1,827 (218) 6,155
Total income 8,519 4,576 2,645 1,664 233 17,637
Operating costs (4,573) (2,137) (768) (702) (131) (8,311)
Operating lease depreciation − (30) (720) − (14) (764)
Total costs (4,573) (2,167) (1,488) (702) (145) (9,075)
Impairment (432) 22 (152) − (6) (568)
Underlying profit excl. TSB 3,514 2,431 1,005 962 82 7,994
TSB 118
Underlying profit 8,112
Banking net interest margin 2.40% 2.93% 5.94% 2.63%
Average interest-earning banking assets £315.8bn £89.3bn £22.4bn £14.4bn £441.9bn Asset quality ratio 0.14% 0.01% 0.68% 0.14%
Return on risk-weighted assets 5.30% 2.33% 4.81% 3.53%
Return on assets 1.11% 1.16% 3.73% 0.98%
2014 Retail Commercial
Banking Consumer
Finance Insurance
Run-off and Central
items Group £m £m £m £m £m £m
Net interest income 7,079 2,480 1,290 (131) 257 10,975
Other income 1,212 1,956 1,364 1,725 210 6,467
Total income 8,291 4,436 2,654 1,594 467 17,442
Operating costs (4,464) (2,123) (762) (672) (301) (8,322)
Operating lease depreciation − (24) (667) − (29) (720)
Total costs (4,464) (2,147) (1,429) (672) (330) (9,042)
Impairment (599) (83) (215) − (205) (1,102)
Underlying profit (loss) excl. TSB 3,228 2,206 1,010 922 (68) 7,298
TSB 458
Underlying profit 7,756
Banking net interest margin 2.29% 2.67% 6.49% 2.40%
Average interest-earning banking assets £317.6bn £93.2bn £20.5bn £29.8bn £461.1bn Asset quality ratio 0.19% 0.08% 1.05% 0.23% Return on risk-weighted assets 4.60% 1.92% 4.87% 3.02%
Return on assets 1.02% 0.94% 4.02% 0.92%
LLOYDS BANKING GROUP PLC 2015 FULL-YEAR RESULTS
Page 16 of 95
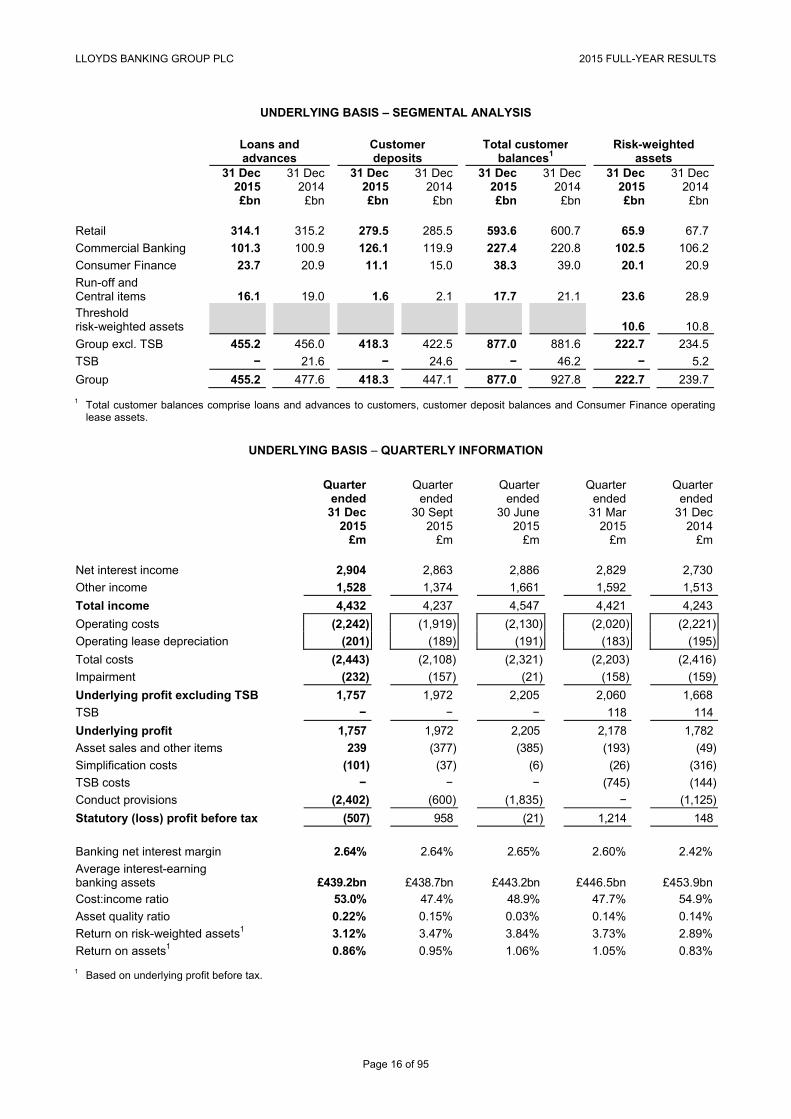
UNDERLYING BASIS – SEGMENTAL ANALYSIS
Loans and advances
Customerdeposits
Total customer balances1
Risk-weighted assets
31 Dec
2015 31 Dec
2014 31 Dec
2015 31 Dec
2014 31 Dec
2015 31 Dec
2014 31 Dec
2015 31 Dec
2014 £bn £bn £bn £bn £bn £bn £bn £bn Retail 314.1 315.2 279.5 285.5 593.6 600.7 65.9 67.7
Commercial Banking 101.3 100.9 126.1 119.9 227.4 220.8 102.5 106.2
Consumer Finance 23.7 20.9 11.1 15.0 38.3 39.0 20.1 20.9
Run-off and Central items 16.1 19.0 1.6 2.1 17.7 21.1 23.6 28.9 Threshold risk-weighted assets 10.6 10.8
Group excl. TSB 455.2 456.0 418.3 422.5 877.0 881.6 222.7 234.5
TSB − 21.6 − 24.6 − 46.2 − 5.2
Group 455.2 477.6 418.3 447.1 877.0 927.8 222.7 239.7 1 Total customer balances comprise loans and advances to customers, customer deposit balances and Consumer Finance operating
lease assets.
UNDERLYING BASIS – QUARTERLY INFORMATION
Quarterended
31 Dec 2015
Quarter ended
30 Sept 2015
Quarter ended
30 June 2015
Quarter ended
31 Mar 2015
Quarter ended
31 Dec 2014
£m £m £m £m £m Net interest income 2,904 2,863 2,886 2,829 2,730
Other income 1,528 1,374 1,661 1,592 1,513
Total income 4,432 4,237 4,547 4,421 4,243
Operating costs (2,242) (1,919) (2,130) (2,020) (2,221)
Operating lease depreciation (201) (189) (191) (183) (195)
Total costs (2,443) (2,108) (2,321) (2,203) (2,416)
Impairment (232) (157) (21) (158) (159)
Underlying profit excluding TSB 1,757 1,972 2,205 2,060 1,668
TSB − − − 118 114
Underlying profit 1,757 1,972 2,205 2,178 1,782
Asset sales and other items 239 (377) (385) (193) (49)
Simplification costs (101) (37) (6) (26) (316)
TSB costs − − − (745) (144)
Conduct provisions (2,402) (600) (1,835) − (1,125)
Statutory (loss) profit before tax (507) 958 (21) 1,214 148
Banking net interest margin 2.64% 2.64% 2.65% 2.60% 2.42%
Average interest-earning banking assets
£439.2bn £438.7bn £443.2bn £446.5bn £453.9bn
Cost:income ratio 53.0% 47.4% 48.9% 47.7% 54.9%
Asset quality ratio 0.22% 0.15% 0.03% 0.14% 0.14%
Return on risk-weighted assets1 3.12% 3.47% 3.84% 3.73% 2.89%
Return on assets1 0.86% 0.95% 1.06% 1.05% 0.83% 1 Based on underlying profit before tax.
LLOYDS BANKING GROUP PLC 2015 FULL-YEAR RESULTS
Page 17 of 95
DIVISIONAL HIGHLIGHTS
RETAIL
Retail offers a broad range of financial service products, including current accounts, savings and mortgages, to UK
personal customers, including Wealth and small business customers. It is also a distributor of insurance, and a range of
long-term savings and investment products. Our aim is to be the best bank for customers in the UK, by building deep and
enduring relationships that deliver value to customers, and by providing them with greater choice and flexibility. We will
maintain our multi-brand and multi-channel strategy, and continue to simplify the business and provide more transparent
products, helping to improve service levels and reduce conduct risks.
Progress against strategic initiatives
Continued development of our digital capability. Our online user base has increased to over 11.5 million customers,
with over 6.6 million active users on mobile and 2.9 million on tablets.
Enhanced proposition for investment customers, becoming one of the first UK banks to offer investment advice
through video conferencing and screen sharing.
Invested in the branch network with 230 refurbishments in 2015, 70 per cent of branches are now Wi-Fi enabled with
an additional 470 self-service devices, giving customers flexibility to choose how they do their banking.
Continued to attract new customers through positive switching activity, particularly through the Halifax challenger
brand which has attracted more than 1 in 5 customers switching in 2015.
Continued product developments including improvements to the Club Lloyds proposition and consolidation of savings
products reducing portfolio complexity and aligning rates and features to create a simpler, more transparent product
range for customers.
Leading the way on the government’s drive for improved financial inclusion by providing over 1 in 4 basic bank
accounts to disadvantaged and low income customers in 2015.
Provided 1 in 4 mortgages to first-time buyers. Retail continues to be a leading supporter of the UK government’s
Help to Buy scheme, with lending of £3.5 billion under the mortgage guarantee element of the scheme since launch
and the launch of a market-leading ‘Help to Buy ISA’ in December.
Supported more than 1 in 5 new business start-ups. Improved our proposition to small business customers, launching
a range of new to market products and services.
Financial performance
Underlying profit increased 9 per cent to £3,514 million.
Net interest income increased 4 per cent. Margin has increased 11 basis points to 2.40 per cent, driven by improved
deposit margin and mix, more than offsetting reduced lending rates.
Other income down 7 per cent driven by current account transaction related income and regulatory changes, in
particular, impacting the Wealth business.
Total costs increased 2 per cent to £4,573 million, reflecting continued business investment and simplification to
improve customer experiences and enable staff numbers to be reduced by 7 per cent in 2015.
Impairment reduced 28 per cent to £432 million, reflecting continued low risk underwriting discipline, strong portfolio
management and a favourable credit environment.
Return on risk-weighted assets increased 70 basis points driven by the 9 per cent increase to underlying profit and a
3 per cent decrease in risk-weighted assets.
Loans and advances to customers were £314.1 billion (31 December 2014: £315.2 billion) with the open mortgage
book (excluding specialist mortgage book and Intelligent Finance) increasing 1 per cent slightly below market growth
reflecting actions to protect the net interest margin in a highly competitive, low growth environment. This is offset by a
reduction in the portfolios closed to new business.
Customer deposits decreased 2 per cent to £279.5 billion, with more expensive tactical balances down 20 per cent to
£30.2 billion, reflecting actions to protect interest margins.
Risk-weighted assets decreased by £1.8 billion to £65.9 billion, driven by an improvement in the credit quality of
assets and a modest contraction to lending balances, partly offset by an increased allocation of operational risk risk-
weighted assets.

LLOYDS BANKING GROUP PLC 2015 FULL-YEAR RESULTS
Page 18 of 95
RETAIL (continued)
2015 2014 Change £m £m %
Net interest income 7,397 7,079 4
Other income 1,122 1,212 (7)
Total income 8,519 8,291 3
Operating costs (4,573) (4,464) (2)
Operating lease depreciation − −
Total costs (4,573) (4,464) (2)
Impairment (432) (599) 28
Underlying profit 3,514 3,228 9
Banking net interest margin 2.40% 2.29% 11bp
Average interest-earning banking assets £315.8bn £317.6bn (1)
Asset quality ratio 0.14% 0.19% (5)bp
Return on risk-weighted assets 5.30% 4.60% 70bp
Return on assets 1.11% 1.02% 9bp
Key balance sheet items At 31 Dec
2015 At 31 Dec
2014 Change £bn £bn %
Loans and advances excluding closed portfolios 286.8 284.7 1
Closed portfolios 27.3 30.5 (10)
Loans and advances to customers 314.1 315.2 −
Relationship balances 249.3 247.9 1
Tactical balances 30.2 37.6 (20)
Customer deposits 279.5 285.5 (2)
Total customer balances 593.6 600.7 (1)
Risk-weighted assets 65.9 67.7 (3)

LLOYDS BANKING GROUP PLC 2015 FULL-YEAR RESULTS
Page 19 of 95
COMMERCIAL BANKING
Commercial Banking has been supporting British business for 250 years. It has a client-led, low risk, capital efficient
strategy, helping UK-based clients and international clients with a link to the UK. Through our four customer facing
divisions - SME, Mid Markets, Global Corporates and Financial Institutions – we provide clients with a range of products
and services such as lending, transactional banking, working capital management, risk management, debt capital
markets services, as well as access to private equity through Lloyds Development Capital.
Progress against strategic initiatives
Continued to support the UK economy and Help Britain Prosper globally.
Increased lending to SMEs by 5 per cent year-on-year, outperforming the market; remain the largest net lender to
SMEs under the Funding for Lending Scheme (FLS), with over £6 billion of gross lending in 2015.
Raised £540 million to date through our Environmental, Social and Governance (ESG) programmes to finance SMEs,
healthcare providers and renewable energy projects in the most economically disadvantaged areas of the UK.
Continued to attract new Mid Markets clients, increasing client advocacy and investing in relationship manager
capability; supported British universities and housing associations in accessing £1 billion of bond financing.
Exceeded our funding commitment by providing £1.4 billion of support to UK manufacturing and opened the
Advanced Manufacturing Training Centre as part of a five year programme to help increase manufacturing skills in
the UK.
Strong income growth in Global Corporates with continued discipline in capital management; ranked first in Sterling
capital markets financing for UK corporates in 2015. Enhanced our proposition to UK linked International clients doing
business globally with strong growth in our UK linked US client franchise and the opening of a regional office in
Singapore.
Facilitated £11.3 billion of financing to support UK infrastructure projects, including the Thames Tideway Tunnel that
is expected to create c.9,000 new jobs and Galloper Wind Farm that will provide clean energy to c.336,000 homes.
Strong growth in our Financial Institution franchise benefiting from London as the world’s leading financial centre and
supporting the Financial Services industry in the UK. In 2015 we have helped our clients raise over £60 billion of
funding.
Continued to invest in next generation digital capabilities to transform clients’ experiences, with the pilot underway on
the new ‘CB Online’ transaction banking platform.
Increased return on risk-weighted assets to 2.33 per cent, exceeding our 2013 strategic commitment of returns of
greater than 2 per cent and on track to exceed 2.40 per cent by the end of 2017. This reflected income growth and
cost management in challenging markets, with disciplined capital and credit management as recognised by the award
of Credit Portfolio Manager of the Year by Risk Awards.
Awarded Business Bank of the Year at the FD’s excellence Awards for the 11th consecutive year.
Financial performance
Underlying profit up 10 per cent to £2,431 million with broad based Core Client Franchise income growth and strong
increases in Lending, Capital Markets and Financial Markets helped by substantial impairment reductions and
disciplined cost management resulting in positive jaws.
Net interest margin increased by 26 basis points due to higher lending margins and controlled deposit pricing.
Other income increase driven by refinancing support provided to Global Corporate clients and increases in Mid
Markets.
Impairments release of £22 million reflects lower gross charges and a number of write-backs and releases.
Increased lending to SME and Mid Markets companies reflecting the strength of our locally based relationship
managers.
Deposits up 5 per cent with growth in SME, Mid Markets and Global Corporates transactional deposits underpinned
by continued investment in the transaction banking platform and the improved credit rating of Lloyds Bank, offset by
the optimisation of Financial Institutions deposits.
3 per cent decrease in risk-weighted assets despite increased lending to SMEs and Mid Market clients, driven by
continued optimisation initiatives, improved credit quality and reduced operational risk risk-weighted assets.
.

LLOYDS BANKING GROUP PLC 2015 FULL-YEAR RESULTS
Page 20 of 95
COMMERCIAL BANKING (continued)
2015 2014 Change £m £m %
Net interest income 2,510 2,480 1
Other income 2,066 1,956 6
Total income 4,576 4,436 3
Operating costs (2,137) (2,123) (1)
Operating lease depreciation (30) (24) (25)
Total costs (2,167) (2,147) (1)Impairment release/(charge) 22 (83)
Underlying profit 2,431 2,206 10
Banking net interest margin 2.93% 2.67% 26bp
Average interest-earning banking assets £89.3bn £93.2bn (4)
Asset quality ratio 0.01% 0.08% (7)bp
Return on risk-weighted assets 2.33% 1.92% 41bp
Return on assets 1.16% 0.94% 22bp
Key balance sheet items At 31 Dec
2015 At 31 Dec
2014 Change £bn £bn %
SME 29.2 27.9 5
Other 72.1 73.0 (1)
Loans and advances to customers 101.3 100.9 −
Customer deposits 126.1 119.9 5
Total customer balances 227.4 220.8 3
Risk-weighted assets 102.5 106.2 (3)
LLOYDS BANKING GROUP PLC 2015 FULL-YEAR RESULTS
Page 21 of 95
CONSUMER FINANCE
Consumer Finance provides a range of products including motor finance, credit cards, and European mortgages and
deposit taking, aiming to deliver sustainable growth within risk appetite. Motor Finance seeks to achieve this through
improving customer service by building digital capability and continuing to create innovative propositions. Credit Cards
aims to attract customers through better use of Group customer relationships and insight, underpinned by improvements
to customer experience.
Progress against strategic initiatives
Investing in growth:
− Exceeded UK customer assets growth targets, whilst improving portfolio credit quality.
− Developed a broader and more competitive Cards product range, investing in digital reach and core capabilities to
deliver new business and customer service improvements.
− Implemented enhanced application processes in Black Horse for motor dealers, leading to more efficient
customer service; launched a new direct to consumer online secured car finance proposition to serve the needs of
internet banking customers; and implemented further capabilities in the light commercial vehicle sector to improve
the offering to Lex Autolease customers.
Focus on new business in a competitive market:
− Leading issuer of new credit cards in 2015, with a 22 per cent increase in average advances to new customers
and a 20 per cent increase in the number of existing customers transferring balances in from competitors.
− Black Horse grew its market share through an 18 per cent increase in new lending, through improved dealer
motor finance penetration and the Jaguar Land Rover (JLR) partnership.
− Lex Autolease fleet size up 7 per cent with leads from existing bank relationships up 13 per cent.
Growing balances in under-represented markets:
− Credit Cards balances increased 4 per cent compared with market growth of less than 2 per cent.
− Black Horse loans up 34 per cent outperforming a strong market and benefiting from the continued strength of the
JLR relationship, while leading the industry in embedding significant Consumer Credit regulatory change.
− Lex Autolease operating lease assets grew 13 per cent driven by new SME customer activity.
Financial performance
Underlying profit of £1,005 million with growth in better quality but lower margin lending resulting in broadly flat
income but lower impairments. This was offset by increased cost of investment in growth initiatives.
Net interest income in line with prior year at £1,287 million (2014: £1,290 million) with 9 per cent growth in average
interest-earning banking assets offset by a lower net interest margin down 55 basis points to 5.94 per cent.
Net interest margin was down due to the acquisition of lower risk but lower margin new business, an increased
proportion of Cards interest free balance transfer balances as we grow the business and the impact of the planned
reduction in deposits in line with Group’s balance sheet funding strategy. Despite this, return on risk-weighted assets
was down only 6 basis points reflecting the portfolio quality.
Other income of £1,358 million (2014: £1,364 million) with higher income from Lex Autolease fleet growth offset by
the impact of lower interchange income in Credit Cards as a result of the recent EU ruling.
Operating costs increased by 1 per cent, to £768 million as efficiency savings were more than offset by continued
investment spend. Operating lease depreciation increased 8 per cent driven by Lex Autolease fleet growth.
Impairment charges reduced by 29 per cent to £152 million, driven by the continued improvement in portfolio quality,
supported by the sale of Credit Card recoveries assets; asset quality ratio improved by 37 basis points to 0.68 per
cent.
Net lending increased by 13 per cent driven by Black Horse and Credit Cards. UK Consumer Finance lending growth
of 17 per cent year-on-year.
Customer deposits reduced by 26 per cent, of which 4 per cent was due to foreign exchange movements, to
£11.1 billion driven by the Group’s funding strategy.
Risk-weighted assets down 4 per cent despite a 13 per cent increase in customer assets reflecting the continued
improvement in portfolio quality and a reduced allocation of operational risk risk-weighted assets.

LLOYDS BANKING GROUP PLC 2015 FULL-YEAR RESULTS
Page 22 of 95
CONSUMER FINANCE (continued)
2015 2014 Change £m £m %
Net interest income 1,287 1,290 −
Other income 1,358 1,364 −
Total income 2,645 2,654 −
Operating costs (768) (762) (1)
Operating lease depreciation (720) (667) (8)
Total costs (1,488) (1,429) (4)Impairment (152) (215) 29
Underlying profit 1,005 1,010 −
Banking net interest margin 5.94% 6.49% (55)bp
Average interest-earning banking assets £22.4bn £20.5bn 9
Asset quality ratio 0.68% 1.05% (37)bp
Impaired loans as % of closing advances 2.3% 3.4% (1.1)pp
Return on risk-weighted assets 4.81% 4.87% (6)bp
Return on assets 3.73% 4.02% (29)bp
Key balance sheet items At 31 Dec
2015 At 31 Dec
2014 Change £bn £bn %
Loans and advances to customers 23.7 20.9 13
Of which UK 18.7 16.0 17
Operating lease assets 3.5 3.1 13
Total customer assets 27.2 24.0 13
Of which UK 22.2 19.1 16
Customer deposits 11.1 15.0 (26)
Total customer balances 38.3 39.0 (2)
Risk-weighted assets 20.1 20.9 (4)

LLOYDS BANKING GROUP PLC 2015 FULL-YEAR RESULTS
Page 23 of 95
INSURANCE
The Insurance division is committed to providing a range of trusted and value for money products to meet the needs of
our customers. Scottish Widows, in its 200th year, is helping almost six million customers protect what they value most
and plan financially for the future. In addition, the general insurance business is protecting the homes, belongings, cars
and businesses of over three million customers.
Progress against strategic initiatives
Against a backdrop of continued regulatory change, Insurance has made good progress against its strategic initiatives.
Increased Corporate Pensions funds under management by £1.4 billion to £28.4 billion through supporting a further
1,600 employers and 30,000 employees into auto-enrolment.
Helped 215,000 customers to understand their additional retirement choices introduced by Pensions Freedoms in
April through our dedicated retirement planning website and customer hub. Around 27,000 of these customers
benefited from a personalised appointment.
Launched a new non-advised pension drawdown product to support customers through the additional retirement
choices introduced by Pensions Freedoms in April.
Successfully delivered our first external bulk annuity transaction with a £0.4 billion deal in the fourth quarter, building
on the £2.4 billion Scottish Widows With-Profits deal earlier in the year.
Secured a further £1.4 billion of high yielding long-dated assets to improve investment returns for assets backing
annuity liabilities, with over £5 billion acquired in the past four years through collaboration with the Commercial
Banking Division.
Launched a protection proposition into the Independent Financial Adviser (IFA) channel, complementing the
protection offering to customers of the Bank, which is now available online through a quick and easy digital journey.
Continued to grow Home Insurance sales through online channels, whilst developing an enhanced, more flexible,
digitally enabled product expected to launch in the first half of 2016.
Helped more than 5,000 customers who were impacted by the floods and storms in December 2015.
Received approval from the PRA for our Solvency II internal model, on which ongoing capital requirements will be
based.
Completed, through a Part VII transfer, the consolidation of eight UK Life companies into a single combined entity,
significantly simplifying the business.
Financial performance
Underlying profit increased by 4 per cent to £962 million, driven by increased new business from bulk annuity deals
as well as the net benefit from a number of assumption updates. These have been partially offset by increased costs
reflecting significant investment spend, adverse economics and reduced general insurance income.
Building on the £1 billion of dividends remitted in 2014, the division paid a further £0.5 billion of dividends to the
Group in February 2016.
Operating cash generation reduced by £61 million, primarily reflecting reduced general insurance income and
increased new business strain following our entry into the attractive bulk annuities market, partially offset by
increased cash generation from the long-term investments strategy.
LP&I sales (PVNBP) increased by 10 per cent in the year, boosted by £2,783 million from bulk annuity deals.
Excluding this, PVNBP fell by 22 per cent, driven by significant regulatory and market change including increased
auto enrolment driven sales in 2014.
General Insurance Gross Written Premiums (GWP) decreased 4 per cent, reflecting the competitive market
environment and the run-off of products closed to new customers.
Capital
Our internal model for Solvency II was successfully implemented on 1 January 2016 with the capital position
remaining robust. The estimated solvency ratio for the insurance business at 1 January 2016 was 148 per cent
before allowing for dividends.

LLOYDS BANKING GROUP PLC 2015 FULL-YEAR RESULTS
Page 24 of 95
INSURANCE (continued)
Performance summary 2015 2014 Change £m £m % Net interest income (163) (131) (24)Other income 1,827 1,725 6
Total income 1,664 1,594 4 Total costs (702) (672) (4)
Underlying profit 962 922 4
Operating cash generation 676 737 (8)UK LP&I sales (PVNBP)1 9,460 8,601 10 General Insurance total GWP2 1,148 1,197 (4)General Insurance combined ratio 83% 76% 7pp 1 Present value of new business premiums. 2 Gross written premiums.
Profit by product group
1 ‘Other’ is primarily income from return on free assets, interest expense plus certain provisions. 2 Full 2014 comparator tables for the profit and cash disclosures can be found on the Lloyds Banking Group investor site.
New business income increased by £58 million, with the primary driver being the new bulk annuity business. This was
offset by a reduction in Protection income, following the removal of face-to-face advice in branch standalone protection
sales and reduced annuity income following the introduction of Pensions Freedoms in 2015. Corporate pension income
remained robust despite lower sales following the auto enrolment driven increases in 2014.
The fall in existing business income reflects a reduction in the expected rate of return used to calculate life and pensions
income. The rate of return is largely set by reference to an average 15 year swap rate (2.57 per cent in 2015 and
3.48 per cent in 2014).
Long-term investment strategy includes the benefit from the successful acquisition of a further £1.4 billion of higher
yielding assets to match long duration annuity liabilities.
2015 2014
Pensions & investments
Protection & retirement
Bulk annuities
General Insurance
Other1
Total Total
£m £m £m £m £m £m £m
New business income 168 33 125 − − 326 268 Existing business income 630 122 − − 28 780 882
Long-term investment strategy − 73 102 − − 175 160 Assumption changes and experience variances (208) 240 30 − (2) 60 (134)General Insurance income net of claims − − − 323 − 323 418 Total income 590 468 257 323 26 1,664 1,594 Total costs (414) (133) (10) (145) − (702) (672)
Underlying profit 2015 176 335 247 178 26 962 922
Underlying profit 20142 236 344 − 274 68 922

LLOYDS BANKING GROUP PLC 2015 FULL-YEAR RESULTS
Page 25 of 95
INSURANCE (continued)
Assumption changes and experience variances include an adverse impact of £208 million in pensions and investments
as a result of the strengthening of lapse assumptions on the pensions book to allow for the impact of the recent pension
reforms. This was more than offset by the £240 million of benefit recognised within Protection and Retirement, primarily
as a result of changes to assumptions on longevity. These longevity changes reflect both experience in the annuity
portfolio and the adoption of a new industry model reflecting an updated view of future life expectancy.
General Insurance income net of claims has fallen by £95 million. This reflects the run-off of products closed to new
customers, the impact of becoming a sole underwriter of the home insurance business (which has resulted in a short
term reduction from the loss of commission recognised upfront) and the impact of adverse weather. The anticipated
launch in early 2016 of a more flexible Home product is expected to lead to an improvement in general insurance sales
going forward.
Costs are £30 million higher, reflecting significant investment spend as part of an ongoing programme of growth and
simplification initiatives. In 2015 this included the launch of Protection to IFAs and our bulk annuities business alongside
the Part VII transfer as well as a significant regulatory change agenda in particular to support pensions freedoms and
transition to Solvency II. Excluding investment related expenditure, underlying costs fell by 3 per cent during 2015
reflecting ongoing operational efficiencies.
Operating cash generation
1 Derived from underlying profit by removing the effect of movements in intangible (non-cash) items and assumption changes. For 2015
reporting this measure has been refined to include the cash benefits from the ‘long-term investments strategy’. 2 Intangible items include the value of in-force life business, deferred acquisition costs and deferred income reserves.
The Insurance business generated £676 million of operating cash in 2015, £61 million lower than the prior year. The
initial cash strain from writing new bulk annuity business, reduced volumes within General Insurance and a reduction in
the expected rate of return used to calculate life and pensions income, drove the reduction in cash generated in the year.
These impacts have been partly offset by £185 million of cash benefits recognised in respect of the acquisition of
attractive higher yielding assets to match long duration annuity liabilities and a £48 million benefit from the sale of a
reinsurance asset.
2015 2014
Pensions & investments
Protection & retirement
Bulk annuities
General Insurance
Other
Total Total
£m £m £m £m £m £m £m
Cash invested in new business (178) (30) (129) − − (337) (288)
Cash generated from existing business 531 166 110 − 28 835 751 Cash generated from General Insurance − − − 178 − 178 274
Operating cash generation1 353 136 (19) 178 28 676 737
Intangibles and other adjustments2 (177) 199 266 − (2) 286 185
Underlying profit 176 335 247 178 26 962 922
Operating cash generation 2014 230 139 − 274 94 737

LLOYDS BANKING GROUP PLC 2015 FULL-YEAR RESULTS
Page 26 of 95
RUN-OFF AND CENTRAL ITEMS
RUN-OFF
2015 2014 £m £m
Net interest income (88) (116)
Other income 145 451
Total income 57 335
Operating costs (150) (279)
Operating lease depreciation (14) (29)
Total costs (164) (308)
Impairment (8) (203)
Underlying loss (115) (176)
2015 2014 £bn £bn
Loans and advances to customers 10.3 14.4
Total assets 12.2 16.9
Risk-weighted assets 10.2 16.8
The reduction in income and costs largely reflects the impact of disposals made in 2014 including the sale of
Scottish Widows Investment Partnership.
The reduction in the impairment charge reflects the continued success in managing down the run-off portfolios.
Run-off now represents 2 per cent of total loans and advances to customers and less than 5 per cent of the Group’s
risk-weighted assets.
CENTRAL ITEMS
2015 2014 £m £m
Total income 176 132
Total costs 19 (22)
Impairment release (charge) 2 (2)
Underlying profit 197 108
Central items include income and expenditure not recharged to divisions, including the costs of certain central and
head office functions.

LLOYDS BANKING GROUP PLC 2015 FULL-YEAR RESULTS
Page 27 of 95
ADDITIONAL INFORMATION 1. Reconciliation between statutory and underlying basis results
The tables below set out the reconciliation from the statutory results to the underlying basis results, the principles of
which are set out on the inside front cover.
Removal of:
2015
Lloyds Banking
Group statutory
Asset sales and other
items1 Simplification2 TSB3Insurance gross up
PPI and other conduct
provisions Underlying
basis £m £m £m £m £m £m £m
Net interest income 11,318 318 − (192) 38 − 11,482
Other income, net of insurance claims 6,103 214 − (36) (126) − 6,155 Total income 17,421 532 − (228) (88) − 17,637 Operating expenses4 (15,387) 381 170 836 88 4,837 (9,075)Impairment (390) (197) − 19 − − (568)TSB − − − 118 − − 118
Profit before tax 1,644 716 170 745 − 4,837 8,112
Removal of:
2014
Lloyds Banking
Group statutory
Asset sales and other
items5 Simplification6 TSB7Insurance gross up
PPI and other conduct
provisions Underlying
basis £m £m £m £m £m £m £m
Net interest income 10,660 619 − (786) 482 − 10,975
Other income, net of insurance claims 5,739 1,460 22 (140) (614) − 6,467 Total income 16,399 2,079 22 (926) (132) − 17,442 Operating expenses4 (13,885) (286) 944 928 132 3,125 (9,042)Impairment (752) (448) − 98 − − (1,102)TSB − − − 458 − − 458
Profit before tax 1,762 1,345 966 558 − 3,125 7,756 1 Comprises the effects of asset sales (gain of £54 million), volatile items (loss of £208 million), liability management (loss of
£28 million), the fair value unwind (loss of £192 million) and the amortisation of purchased intangibles (£342 million). 2 Comprises the redundancy costs related to phase II of the Simplification programme. 3 Comprises the underlying results of TSB, dual running and build costs and the charge related to the disposal of TSB. 4 On an underlying basis, this is described as total costs. 5 Comprises the effects of asset sales (gain of £138 million), volatile items (gain of £58 million), liability management (loss of
£1,386 million), the past service pension credit (£710 million), the fair value unwind (loss of £529 million) and the amortisation of purchased intangibles (£336 million).
6 Comprises redundancy, IT and other business costs of implementation. 7 Comprises the underlying results of TSB, dual running and build costs.

LLOYDS BANKING GROUP PLC 2015 FULL-YEAR RESULTS
Page 28 of 95
ADDITIONAL INFORMATION (continued)
2. Banking net interest margin
Banking net interest margin is calculated by dividing banking net interest income by average interest-earning banking
assets. A reconciliation of banking net interest income to Group net interest income showing the items that are excluded
in determining banking net interest income follows:
2015 2014 £m £m
Banking net interest income – underlying basis 11,630 11,058
Insurance division (163) (131)
Other net interest income (including trading activity) 15 48
Group net interest income – underlying basis 11,482 10,975
Asset sales and other items (318) (619)
TSB 192 786
Insurance gross up (38) (482)
Group net interest income – statutory 11,318 10,660
Average interest-earning banking assets are gross of impairment allowances and comprise solely of customer and
product balances in the banking businesses on which interest is earned or paid. Non-banking assets largely relate to fee
based loans and advances within Commercial Banking and loans sold by Commercial Banking and Retail to Insurance to
back annuitant liabilities. Other non-banking includes pooling arrangements where interest is received from or paid to
customers based on the net of their lending and deposit balances but these balances cannot be netted on the Group
balance sheet.
Quarter
ended 31 Dec
2015
Quarterended
30 Sept 2015
Quarter ended 30 Jun
2015
Quarterended 31 Mar
2015 £bn £bn £bn £bn
Net loans and advances to customers 455.2 455.0 452.3 455.1
Impairment provision and fair value adjustments 4.4 4.9 7.0 7.4
Non-banking items:
Fee based loans and advances (10.1) (8.0) (7.2) (6.4)
Sale of assets to Insurance (5.7) (5.3) (5.2) (4.7)
Other non-banking (5.6) (6.2) (5.5) (6.6)
Gross loans and advances (banking) 438.2 440.4 441.4 444.8
Averaging 1.0 (1.7) 1.8 1.7
Average interest-earning banking assets 439.2 438.7 443.2 446.5
Continuing businesses 427.8 425.5 427.4 429.5
Run-off 11.4 13.2 15.8 17.0
439.2 438.7 443.2 446.5
Average interest-earning banking assets (year to date) 441.9 442.8 444.8 446.5
LLOYDS BANKING GROUP PLC 2015 FULL-YEAR RESULTS
Page 29 of 95
ADDITIONAL INFORMATION (continued)
3. Other operating income
2015 2014 Change £ million £ million %
Fees and commissions: Retail 876 998 (12)Commercial Banking 1,562 1,605 (3)Consumer Finance 247 308 (20)Central items (81) (132) 39
2,604 2,779 (6)Insurance income1:
Life and pensions 1,367 1,368 − Bulk annuities 257 − General insurance 462 576 (20)
2,086 1,944 7 Operating lease income 1,130 1,071 6 Other 190 222 (14)
Other income excluding run-off 6,010 6,016 − Run-off 145 451 (68)
Other income 6,155 6,467 (5) 1 Includes insurance income reported by Retail and Consumer Finance.
4. Volatility arising in insurance businesses
The Group’s statutory result before tax included negative volatility totalling £105 million compared to negative volatility of
£228 million in 2014.
Volatility comprises the following: 2015 2014 £m £m
Insurance volatility (303) (219)
Policyholder interests volatility 87 17
Total volatility (216) (202)
Insurance hedging arrangements 111 (26)
Total (105) (228)
Insurance volatility
The Group’s insurance business has policyholder liabilities that are supported by substantial holdings of investments.
IFRS requires that the changes in both the value of the liabilities and investments are reflected within the income
statement. The value of the liabilities does not move exactly in line with changes in the value of the investments. As the
investments are substantial, movements in their value can have a significant impact on the profitability of the Group.
Management believes that it is appropriate to disclose the division’s results on the basis of an expected return in addition
to results based on the actual return. The impact of the actual return on these investments differing from the expected
return is included within insurance volatility.

LLOYDS BANKING GROUP PLC 2015 FULL-YEAR RESULTS
Page 30 of 95
ADDITIONAL INFORMATION (continued)
The expected gross investment returns used to determine the underlying profit of the business are based on prevailing
market rates and published research into historical investment return differentials for the range of assets held. Where
appropriate, rates are updated throughout the year to reflect changing market conditions and changes in the asset mix.
In 2015 the basis for calculating these expected returns has been enhanced to reflect an average of the 15 year swap
rate over the preceding 12 months and rates were updated throughout the year to reflect changing market conditions.
The negative insurance volatility during 2015 of £303 million primarily reflects lower equity returns than expected,
widening credit spreads and low returns on cash investments.
Policyholder interests volatility
Accounting standards require that tax on policyholder investment returns should be included in the Group’s tax charge
rather than being offset against the related income. The result is, therefore, to either increase or decrease profit before
tax with a related change in the tax charge. Timing and measurement differences exist between provisions for tax and
charges made to policyholders. Consistent with the expected approach taken in respect of insurance volatility,
differences in the expected levels of the policyholder tax provision and policyholder charges are adjusted through
policyholder interests volatility. In 2015, the statutory results before tax included a credit to other income which relates to
policyholder interests volatility totalling £87 million (2014: £17 million) reflecting offsetting movements in equity, bond and
gilt returns.
Insurance hedging arrangements
The Group purchased put option contracts in 2015 to protect against deterioration in equity market conditions and the
consequent negative impact on the value of in-force business on the Group balance sheet. These were financed by
selling some upside potential from equity market movements. A gain of £111 million was recognised in relation to these
contracts in 2015.
5. Return on required equity
Underlying return on required equity is the underlying profit after tax at the standard UK corporation tax rate less the
post-tax profit attributable to other equity holders divided by the average required equity for the period. Required equity
comprises shareholders’ equity and non-controlling interests and is the amount required to achieve a common equity
tier 1 ratio of 12.0 per cent after allowing for regulatory adjustments and deductions. An adjustment is also made to
reflect the notional earnings on any excess or shortfall in equity.
Statutory return on required equity is the statutory profit after tax less the post-tax profit attributable to other equity
holders divided by the average required equity for the period. An adjustment is also made to reflect the notional earnings
on any excess or shortfall in equity.
6. Number of employees (full-time equivalent)
2015 2014
Retail 33,304 35,854
Commercial Banking 6,457 6,133
Consumer Finance 3,480 3,484
Insurance 1,885 2,015
Group operations and other 32,439 31,663
TSB − 7,685
77,565 86,834
Agency staff, interns and scholar (2,259) (2,344)
Total number of employees 75,306 84,490
Total number of employees excluding TSB 75,306 76,978

LLOYDS BANKING GROUP PLC 2015 FULL-YEAR RESULTS
Page 31 of 95
ADDITIONAL INFORMATION (continued)
7. Remuneration
Our approach to reward is intended to provide a clear link between remuneration and delivery of the Group’s key
strategic objectives, supporting the aim of becoming the best bank for customers, and through that, for shareholders.
Despite better underlying financial results in 2015, the Group’s total bonus outcome has reduced year-on-year to
£353.7 million (from £369.5m in 2014). This includes a 26 per cent collective performance adjustment applied to the
Group’s total bonus outcome, reflecting additional conduct-related provisions which impacted negatively on profitability
and shareholder returns. As previously announced, £30 million was deducted to recognise the impact of failing to deliver
the highest levels of customer service in PPI complaint handling. As a percentage of pre-bonus underlying profit, the total
bonus outcome has decreased to 4.2 per cent.

LLOYDS BANKING GROUP PLC 2015 FULL-YEAR RESULTS
Page 32 of 95
RISK MANAGEMENT
PRINCIPAL RISKS AND UNCERTAINTIES
The most significant risks we face which could impact the delivery of our strategy, together with key mitigating actions,
are outlined below including newly added:
Insurance risk, reflecting that we are increasing our exposure to longevity risk, following our entry into the bulk
annuity market in 2015 and;
Governance risk, given increasing societal and regulatory focus on governance arrangements.
Credit risk – The risk that customers to whom we have lent money or other counterparties with whom we have
contracted, fail to meet their financial obligations, resulting in loss to the Group. Adverse changes in the economic and
market environment we operate in or the credit quality and/or behaviour of our customers and counterparties could
reduce the value of our assets and potentially increase our write downs and allowances for impairment losses, adversely
impacting profitability.
Mitigating actions
Credit policy, incorporating prudent lending criteria, aligned with Board approved risk appetite, to effectively manage
risk.
Robust risk assessment and credit sanctioning, with clearly defined levels of authority to ensure we lend
appropriately and responsibly.
Extensive and thorough credit processes and controls to ensure effective risk identification, management and
oversight.
Effective, well-established governance process supported by independent credit risk assurance.
Early identification of signs of stress leading to prompt action in engaging the customer.
Regulatory and legal risk – The risks of changing legislation, regulation, policies, voluntary codes of practice and their
interpretation in the markets in which we operate can have a significant impact on the Group’s operations, business
prospects, structure, costs and/or capital requirements and ability to enforce contractual obligations.
Mitigating actions
The Legal, Regulatory and Mandatory Change Committee ensures we develop plans for delivery of all legal and
regulatory changes and tracks their progress. Groupwide projects implemented to address significant impacts.
Continued investment in people, processes, training and IT to assess impact and help meet our legal and regulatory
commitments.
Engage with regulatory authorities and relevant industry bodies on forthcoming regulatory changes, market reviews
and Competition and Markets Authority investigations.
Conduct risk – Conduct risk can arise from a number of areas including selling products to customers which do not
meet their needs; failing to deal with customers’ complaints effectively; not meeting customers’ expectations; and
exhibiting behaviours which do not meet market or regulatory standards.
Mitigating actions
Customer focused conduct strategy implemented to ensure customers are at the heart of everything we do.
Product approval, review processes and outcome testing supported by conduct management information.
Clear customer accountabilities for colleagues, with rewards driven by customer-centric metrics.
Learning from past mistakes, through root cause analysis of crystallised issues.

LLOYDS BANKING GROUP PLC 2015 FULL-YEAR RESULTS
Page 33 of 95
PRINCIPAL RISKS AND UNCERTAINTIES (continued)
Operational risk – We face significant operational risks which may result in financial loss, disruption or damage to our
reputation. These include the availability, resilience and security of our core IT systems and the potential for failings in
our customer processes.
Mitigating actions
Continual review of our IT environment to ensure that systems and processes can effectively support the delivery of
services to customers.
Addressing the observations and associated resilience risks raised in the Independent IT Resilience Review (2013),
with independent verification of progress on an annual basis.
Investing in enhanced cyber controls to protect against external threats to the confidentiality or integrity of electronic
data, or the availability of systems. Responding to findings from third party industry testing.
People risk – Key people risks include the risk that the Group fails to lead responsibly in an increasingly competitive
marketplace, particularly with the introduction of the Senior Managers and Certification Regime (SM&CR) in 2016. This
may dissuade capable individuals from taking up senior positions within the industry.
Mitigating actions
Focused action on strategy to attract, retain and develop high calibre people.
Maintain compliance with legal and regulatory requirements relating to SM&CR, embedding compliant and
appropriate colleague behaviours.
Continued focus on our culture, delivering initiatives which reinforce behaviours to generate the best long-term
outcomes for customers and colleagues.
Maintain organisational people capability and capacity levels in response to increasing volumes of organisational and
external market changes.
Insurance risk – Key insurance risks within the Insurance business are longevity, persistency and property insurance.
Longevity risk is expected to increase with the 2015 entry into the bulk annuity market. Longevity is also the key
insurance risk in the Group’s Defined Benefit Schemes.
Mitigating actions
Insurance processes on underwriting, claims management, pricing and product design seek to control exposure to
these risks. A team of longevity and bulk pricing experts has been built to support the new bulk annuity proposition.
The merits of longevity risk transfer and hedging solutions are regularly reviewed for both the Insurance business and
the Group’s Defined Benefit Pension Schemes.
Property insurance exposure to accumulations of risk and possible catastrophes is mitigated by a broad reinsurance
programme.
Capital risk – The risk that we have a sub-optimal amount or quality of capital or that capital is inefficiently deployed
across the Group.
Mitigating actions
A comprehensive capital management framework that sets and monitors capital risk appetite using a number of key
metrics.
Close monitoring of capital and leverage ratios to ensure we meet current and future regulatory requirements.
Comprehensive stress testing analysis to evidence sufficient levels of capital adequacy under various adverse
scenarios. Accumulation of retained profits and managing dividend policy appropriately.

LLOYDS BANKING GROUP PLC 2015 FULL-YEAR RESULTS
Page 34 of 95
PRINCIPAL RISKS AND UNCERTAINTIES (continued)
Funding and liquidity risk – The risk that we have insufficient financial resources to meet our commitments as they fall
due, or can only secure them at excessive cost.
Mitigating actions
Holding a large portfolio of unencumbered LCR eligible liquid assets to meet cash and collateral outflows and
regulatory requirements and maintaining a further large pool of secondary assets that can be used to access central
bank liquidity facilities.
Undertaking daily monitoring against a number of market and Group-specific early warning indicators and regular
stress tests.
Maintaining a contingency funding plan detailing management actions and strategies available in stressed conditions.
Governance risk – Against a background of increased regulatory focus on governance and risk management the most
significant challenges arise from the SM&CR in force from March 2016 and the requirement to improve the resolvability
of the Group and to ring-fence core UK financial services and activities from January 2019.
Mitigating actions
Our response to SM&CR is managed through a programme with work streams addressing each of the major
components.
A programme is in place to address the requirements of ring-fencing and resolution and the Group is in close and
regular contact with regulators to develop the plans for our anticipated operating and legal structures.
Our aim is to ensure that evolving risk and governance arrangements continue to be appropriate across the range of
business in the Group in order to comply with regulatory objectives.
Market risk – The risk that our capital or earnings profile is affected by adverse market rates, in particular interest rates
and credit spreads in the Banking business and equity and credit spreads in the Insurance business and the Group’s
Defined Benefit Pension Schemes.
Mitigating actions
Structural hedge programmes have been implemented to manage liability margins and margin compression, and the
Group’s exposure to Bank Base Rate.
Equity and credit spread risks are inherent within Insurance products and are closely monitored to ensure they
remain within risk appetite. Where appropriate asset liability matching is undertaken to mitigate risk.
The allocation to credit assets has been increased and equity holdings reduced within the Group’s Defined Benefit
Pension Schemes. A hedging programme is also in place to minimise exposure to nominal rates/inflation.
Stress and scenario testing of Group risk exposures.

LLOYDS BANKING GROUP PLC 2015 FULL-YEAR RESULTS
Page 35 of 95
CREDIT RISK PORTFOLIO
Significant reduction in impairments and impaired assets
The impairment charge decreased by 48 per cent to £568 million in 2015 compared to £1,102 million in 2014. The
impairment charge is lower across all divisions benefiting from provision releases but at lower levels than seen during
2014.
The reduction reflects lower levels of new impairment as a result of effective risk management, a favourable credit
environment, improving UK economic conditions and continued low interest rates.
The impairment charge as a percentage of average loans and advances to customers improved to 0.14 per cent
compared to 0.23 per cent during 2014.
At the Group Strategic Update in October 2014, we outlined that, although it would be lower between 2015 and 2017,
we expect the Group asset quality ratio to be c.40 basis points through the economic cycle.
In 2016, the Group expects to benefit from its continued disciplined approach to the management of credit and the
resilient UK economy. Write-backs and provision releases, however, are expected to be at a lower level and as a
result, the Group expects the asset quality ratio for the 2016 full year to be around 20 basis points.
Impaired loans as a percentage of closing loans and advances reduced to 2.1 per cent at 31 December 2015, from
2.9 per cent at 31 December 2014 driven by reductions within the continuing and run-off portfolios, including the sale
of Irish commercial loans during the third quarter. Provisions as a percentage of impaired loans reduced from
56.4 per cent to 46.1 per cent reflecting the disposal of highly covered assets during the year.
Retail Division impairment provisions as a percentage of impaired loans have increased to 40.4 per cent from
38.8 per cent at 31 December 2014, with Secured increasing by 0.5 percentage points to 37.5 per cent. Consumer
Finance Division impairment provisions as a percentage of impaired loans have increased to 72.8 per cent from
70.5 per cent at 31 December 2014, with Credit Cards increasing by 5.3 percentage points to 81.8 per cent and
Asset Finance UK decreasing by 2.8 percentage points to 67.2 per cent.
Low risk culture and prudent risk appetite
The Group is delivering sustainable lending growth by maintaining its lower risk origination discipline and underwriting
standards despite terms and conditions in some of the Group’s markets being impacted by increased competition.
The overall quality of the portfolio has improved over the last 12 months.
Credit performance of the UK Retail secured portfolio has been good, with improvements in loan to values (LTVs),
arrears, impaired loans and impairment charge on both Mainstream and Buy-to-let portfolios. Loans and advances to
mainstream customers were broadly flat during the year at £227.3 billion with the Buy-to-let portfolio growing by 4 per
cent to £55.6 billion. The closed Specialist portfolio has continued to run-off, reducing by 10 per cent to £19.5 billion.
The Group’s UK Direct Real Estate gross lending (defined internally as exposure which is directly supported by cash
flows from property activities) at 31 December 2015 in Commercial Banking, Wealth (within Retail division) and
Run-off divisions was £19.5 billion (31 December 2014: gross £21.6 billion). The portfolio continues to reduce
significantly, and the higher risk Run-off element of the book has reduced from gross £3.3 billion to gross £1.1 billion
during 2015. The remaining gross lending of £18.4 billion (31 December 2014: £18.3 billion) is the lower risk element
in Commercial Banking and Wealth, where the Group continues to write new business within conservative risk
appetite parameters.
Our Commercial Banking portfolios continue to benefit from our robust focus on credit origination and our through the
cycle risk appetite.
Sector concentrations within the lending portfolios are closely monitored and controlled, with mitigating actions taken.
Sector and product caps limit exposure to certain higher risk sectors and asset classes.
The Group’s extensive and thorough credit processes and controls ensure effective risk management, including early
identification and management of potential concern customers and counterparties.
Re-shaping of the Group is substantially complete
The run-off portfolio has materially reduced through de-risking and the strategic desire to exit the residual portfolio
still remains. There was a 38 per cent reduction in gross loans and advances in 2015 to £11,422 million
(31 December 2014: £18,316 million).
Run-off net external assets have reduced from £16,857 million to £12,154 million during 2015. The portfolio now
represents only 2.3 per cent of the overall Group’s loans and advances (31 December 2014: 3.0 per cent).

LLOYDS BANKING GROUP PLC 2015 FULL-YEAR RESULTS
Page 36 of 95
CREDIT RISK PORTFOLIO (continued)
Impairment charge by division 2015 2014 Change £m £m % Retail:
Secured 98 281 65
Loans and overdrafts 311 279 (11)
Other 23 39 41
432 599 28 Commercial Banking:
SME (22) 15
Other − 68
(22) 83 Consumer Finance:
Credit Cards 129 186 31
Asset Finance UK1 22 30 27
Asset Finance Europe2 1 (1)
152 215 29 Run-off:
Ireland retail (5) (6) (17)
Ireland corporate and CRE 72 314 77
Corporate real estate and other corporate 21 (28)
Specialist finance (45) 22
Other (35) (99) (65)
8 203 96
Central items (2) 2
Total impairment charge 568 1,102 48 Impairment charge as a % of average advances 0.14% 0.23% (9)bps 1 Asset Finance UK comprises the UK motor finance portfolios, principally Black Horse and Lex Autolease. 2 Asset Finance Europe comprises Netherlands mortgages and German Consumer Finance products.
Total impairment charge comprises: 2015 2014 Change
£m £m % Loans and advances to customers 621 1,085 43
Debt securities classified as loans and receivables (2) 2 −
Available-for-sale financial assets 4 5 20
Other credit risk provisions (55) 10 −
Total impairment charge 568 1,102 48

LLOYDS BANKING GROUP PLC 2015 FULL-YEAR RESULTS
Page 37 of 95
CREDIT RISK PORTFOLIO (continued) Group impaired loans and provisions
At 31 December 2015
Loans and advances to
customers Impaired
Loans
Impaired loans as % of closing advances
Impairment provisions1
Impairmentprovision
as % of impaired
loans2
£m £m % £m %
Retail:
Secured 302,413 3,818 1.3 1,431 37.5
Loans and overdrafts 9,917 578 5.8 197 81.1
Other 3,706 98 2.6 42 60.0
316,036 4,494 1.4 1,670 40.4
Commercial Banking:
SME 29,393 1,149 3.9 213 18.5
Other 73,042 1,379 1.9 874 63.4
102,435 2,528 2.5 1,087 43.0
Consumer Finance:
Credit Cards 9,425 366 3.9 153 81.8
Asset Finance UK3 9,582 134 1.4 90 67.2
Asset Finance Europe4 4,931 43 0.9 22 51.2
23,938 543 2.3 265 72.8
Run-off:
Ireland retail 4,040 132 3.3 120 90.9
Ireland corporate and CRE 37 5 13.5 −
Corporate real estate and other corporate 1,873 1,410 75.3 745 52.8 Specialist finance 4,190 361 8.6 189 52.4
Other 1,282 117 9.1 96 82.1
11,422 2,025 17.7 1,150 56.8
Reverse repos and other items5 5,798
Total gross lending 459,629 9,590 2.1 4,172 46.1
Impairment provisions (4,172)
Fair value adjustments6 (282)
Total Group 455,175 1 Impairment provisions include collective unidentified impairment provisions. 2 Impairment provisions as a percentage of impaired loans are calculated excluding Retail and Consumer Finance loans in recoveries
(£335 million in Retail loans and overdrafts, £28 million in Retail other and £179 million in Consumer Finance credit cards). 3 Asset Finance UK comprises the UK motor finance portfolios, principally Black Horse and Lex Autolease. 4 Asset Finance Europe comprises Netherlands mortgages and German Consumer Finance products. 5 Includes £5.7 billion of lower risk loans sold by Commercial Banking and Retail to Insurance to back annuitant liabilities. 6 The fair value adjustments relating to loans and advances were made on the acquisition of HBOS to reflect the fair value of the
acquired assets and took into account both the expected losses and market liquidity at the date of acquisition. The unwind relating tofuture impairment losses requires management judgement to assess whether the losses incurred in the current period were expectedat the date of the acquisition and assessing whether the remaining losses expected at date of the acquisition will still be incurred. Theelement relating to market liquidity unwinds to the income statement over the estimated expected lives of the related assets, althoughif an asset is written-off or suffers previously unexpected impairment then this element of the fair value will no longer be considered atiming difference (liquidity) but permanent (impairment). The fair value unwind in respect of impairment losses incurred was£97 million for the year ended 31 December 2015 (31 December 2014: £251 million). The fair value unwind in respect of loans andadvances is expected to continue to decrease in future years as fixed-rate periods on mortgages expire, loans are repaid orwritten-off, and will reduce to zero over time.

LLOYDS BANKING GROUP PLC 2015 FULL-YEAR RESULTS
Page 38 of 95
CREDIT RISK PORTFOLIO (continued) Group impaired loans and provisions (continued)
At 31 December 2014
Loans and advances to
customers Impaired
Loans
Impaired loans as %
of closing advances
Impairment provisions1
Impairment provision
as % of impaired
loans2
£m £m % £m %
Retail:
Secured 303,121 3,911 1.3 1,446 37.0
Loans and overdrafts 10,395 695 6.7 220 85.3
Other 3,831 321 8.4 68 23.1
317,347 4,927 1.6 1,734 38.8
Commercial Banking:
SME 28,256 1,546 5.5 398 25.7
Other 74,203 1,695 2.3 1,196 70.6
102,459 3,241 3.2 1,594 49.2
Consumer Finance:
Credit Cards 9,119 499 5.5 166 76.5
Asset Finance UK3 7,204 160 2.2 112 70.0
Asset Finance Europe4 4,950 61 1.2 31 50.8
21,273 720 3.4 309 70.5
Run-off:
Ireland retail 4,464 120 2.7 141 117.5
Ireland corporate and CRE 3,436 3,052 88.8 2,480 81.3
Corporate real estate and other corporate 3,947 1,548 39.2 911 58.9 Specialist finance 4,835 364 7.5 254 69.8
Other 1,634 131 8.0 141 107.6
18,316 5,215 28.5 3,927 75.3
TSB 21,729 205 0.9 88 42.9
Reverse repos and other items5 9,635
Total gross lending 490,759 14,308 2.9 7,652 56.4
Impairment provisions (7,652)
Fair value adjustments (403)
Total Group 482,704 1 Impairment provisions include collective unidentified impairment provisions. 2 Impairment provisions as a percentage of impaired loans are calculated excluding Retail and Consumer Finance loans in recoveries
(£437 million in Retail loans and overdrafts, £26 million in Retail other and £282 million in Consumer Finance credit cards). 3 Asset Finance UK comprises the UK motor finance portfolios, principally Black Horse and Lex Autolease. 4 Asset Finance Europe comprises Netherlands mortgages and German Consumer Finance products. 5 Includes £4.4 billion of lower risk loans sold by Commercial Banking to Insurance to back annuitant liabilities.
LLOYDS BANKING GROUP PLC 2015 FULL-YEAR RESULTS
Page 39 of 95
CREDIT RISK PORTFOLIO (continued) Retail The impairment charge was £432 million in 2015, a decrease of 28 per cent against 2014. The decrease reflects
continued low risk underwriting discipline, strong portfolio management and a favourable credit environment with low
unemployment, increasing house prices and continued low interest rates.
The impairment charge, as a percentage of average loans and advances to customers, improved to 14 basis points
in 2015 from 19 basis points in 2014.
Impaired loans decreased by £433 million in 2015 to £4,494 million which represented 1.4 per cent of closing loans
and advances to customers at 31 December 2015 (31 December 2014: 1.6 per cent).
Impairment coverage has increased to 40.4 per cent from 38.8 per cent at the end of 2014, with secured coverage
increasing by 0.5 per cent to 37.5 per cent. Secured
The impairment charge was £98 million, a decrease of 65 per cent against 2014. The impairment charge as a
percentage of average loans and advances to customers improved to 3 basis points from 9 basis points in 2014.
Loans and advances to mainstream customers were broadly flat during the year at £227.3 billion with the Buy-to-let
portfolio growing by 4 per cent to £55.6 billion. The closed specialist portfolio has continued to run-off, reducing by
10 per cent to £19.5 billion.
Impaired loans reduced by £93 million to £3,818 million at 31 December 2015, with reductions in both the
Mainstream and Buy-to-let portfolios. Impairment provisions as a percentage of impaired loans increased to 37.5 per
cent from 37.0 per cent at 31 December 2014.
The value of mortgages greater than three months in arrears (excluding repossessions) decreased by £439 million to
£5,905 million at 31 December 2015 (31 December 2014: £6,344 million), with reductions in both the Mainstream and
Buy-to-let portfolios.
The average indexed LTV of the residential mortgage portfolio at 31 December 2015 decreased to 46.1 per cent
compared with 49.2 per cent at 31 December 2014. The percentage of closing loans and advances with an indexed
LTV in excess of 100 per cent decreased to 1.1 per cent at 31 December 2015, compared with 2.2 per cent at
31 December 2014.
The average LTV for new residential mortgages written in 2015 was 64.7 per cent compared with 64.8 per cent for
2014. Loans and overdrafts
The impairment charge was £311 million, an increase of 11 per cent against 2014.
The impairment charge as a percentage of average loans and advances to customers increased to 3.0 per cent in
2015 from 2.6 per cent in 2014.
Impaired loans reduced by £117 million in 2015 to £578 million representing 5.8 per cent of closing loans and
advances to customers, compared with 6.7 per cent at 31 December 2014. Retail secured and unsecured loans and advances to customers
At 31 Dec
2015 At 31 Dec
2014 £m £m
Mainstream 227,267 228,176 Buy-to-let 55,598 53,322 Specialist1 19,548 21,623
302,413 303,121 Loans 7,889 8,204 Overdrafts 2,028 2,191 Wealth 2,811 2,962 Retail Business Banking 895 869
13,623 14,226 Total 316,036 317,347 1 Specialist lending has been closed to new business since 2009.

LLOYDS BANKING GROUP PLC 2015 FULL-YEAR RESULTS
Page 40 of 95
CREDIT RISK PORTFOLIO (continued) Retail (continued) Retail mortgages greater than three months in arrears (excluding repossessions)
Number of cases Total mortgage
accounts % Value of loans1 Total mortgage
balances % 2015 2014 2015 2014 2015 2014 2015 2014 Cases Cases % % £m £m % % Mainstream 34,850 37,849 1.6 1.7 3,803 4,102 1.7 1.8
Buy-to-let 5,021 5,077 1.0 1.1 626 658 1.1 1.2
Specialist 8,777 9,429 6.4 6.3 1,476 1,584 7.6 7.3
Total 48,648 52,355 1.7 1.8 5,905 6,344 2.0 2.1 1 Value of loans represents total gross book value of mortgages more than three months in arrears. The stock of repossessions decreased to 654 cases at 31 December 2015 compared to 1,740 cases at 31 December 2014. Period end and average LTVs across the Retail mortgage portfolios At 31 December 2015 Mainstream Buy-to-let Specialist Total Unimpaired Impaired % % % % % %
Less than 60% 52.2 45.4 43.7 50.4 50.7 30.9
60% to 70% 19.1 26.8 19.7 20.6 20.6 17.5
70% to 80% 15.5 15.0 15.5 15.4 15.4 16.9
80% to 90% 9.0 8.0 11.6 9.0 8.9 13.3
90% to 100% 3.2 3.9 5.5 3.5 3.4 9.5
Greater than 100% 1.0 0.9 4.0 1.1 1.0 11.9
Total 100.0 100.0 100.0 100.0 100.0 100.0
Outstanding loan value (£m) 227,267 55,598 19,548 302,413 298,595 3,818 Average loan to value:1
Stock of residential mortgages 43.6 56.3 53.3 46.1
New residential lending 65.2 63.0 n/a 64.7
Impaired mortgages 55.6 74.6 66.8 60.0 At 31 December 2014 Mainstream Buy-to-let Specialist Total Unimpaired Impaired % % % % % %
Less than 60% 44.6 32.4 31.4 41.5 41.7 22.5
60% to 70% 19.9 27.3 19.5 21.2 21.3 15.3
70% to 80% 18.5 21.8 19.8 19.2 19.2 17.8
80% to 90% 10.6 9.4 14.9 10.7 10.6 16.7
90% to 100% 4.5 6.8 8.7 5.2 5.2 11.9
Greater than 100% 1.9 2.3 5.7 2.2 2.0 15.8
Total 100.0 100.0 100.0 100.0 100.0 100.0
Outstanding loan value (£m) 228,176 53,322 21,623 303,121 299,210 3,911 Average loan to value:1
Stock of residential mortgages 46.3 61.3 59.2 49.2
New residential lending 65.3 62.7 n/a 64.8
Impaired mortgages 60.1 81.0 72.6 64.9 1 Average loan to value is calculated as total gross loans and advances as a percentage of the indexed total collateral of these loans
and advances.

LLOYDS BANKING GROUP PLC 2015 FULL-YEAR RESULTS
Page 41 of 95
CREDIT RISK PORTFOLIO (continued)
Commercial Banking
There was a net impairment release of £22 million in 2015, compared to a charge of £83 million in 2014. This has
been driven by lower levels of new impairment as a result of effective risk management, improving UK economic
conditions and the continued low interest rate environment; as well as write-backs and provision releases, but at
lower levels than seen during 2014.
The credit quality of the portfolio and new business remains good. Surplus market liquidity continues to lead to some
relaxation of credit conditions in the marketplace, although the Group remains disciplined within its low risk appetite
approach.
Impaired loans reduced by 22 per cent to £2,528 million at 31 December 2015 compared with 31 December 2014
(£3,241 million) and as a percentage of closing loans and advances reduced to 2.5 per cent from 3.2 per cent at
31 December 2014.
Impairment provisions reduced to £1,087 million at 31 December 2015 (31 December 2014: £1,594 million) and
includes collective unidentified impairment provisions of £229 million (31 December 2014: £338 million). Provisions
as a percentage of impaired loans reduced from 49.2 per cent to 43.0 percent, predominantly due to the change in
the mix of impaired assets during 2015, with newly impaired connections having lower coverage levels compared to
the portfolio average. The decrease is also partly due to the reduction in the collective unidentified impairment
provisions fund during the year as a result of improved conditions.
The Group expects to benefit from its continued disciplined approach to the management of credit, and sustained UK
economic growth. Nevertheless, market volatility and the uncertain global economic outlook such as the continued
slowdown in Chinese economic growth and the fall in commodity prices may impact the Commercial portfolios.
The Group manages and limits exposure to certain sectors and asset classes, and closely monitors credit quality,
sector and single name concentrations. This together with our conservative through the cycle risk appetite approach,
means our portfolios are well positioned.
SME
The SME Banking portfolio continues to grow within prudent credit risk appetite parameters.
Portfolio credit quality has remained stable or improved across all key metrics.
There was a net impairment release of £22 million compared to a net charge of £15 million in 2014 with lower new
impairment offset by write-backs and releases.
Other Commercial Banking
Other Commercial Banking comprises £73,042 million of gross loans and advances to customers in Mid Markets,
Global Corporates and Financial Institutions.
In the Mid Markets portfolio, credit quality has remained stable. The portfolio is focused on UK businesses and
dependent on the performance of the domestic economy and to some extent, the global economy. The oil and gas
services element of the portfolio has been reviewed given ongoing low oil prices and this review has not revealed any
material concerns with portfolio quality at this time.

LLOYDS BANKING GROUP PLC 2015 FULL-YEAR RESULTS
Page 42 of 95
CREDIT RISK PORTFOLIO (continued)
Commercial Banking (continued)
Other Commercial Banking (continued)
The Global Corporate business continues to have a predominance of investment grade clients, primarily UK based.
As a result of this profile, allied to our conservative risk appetite, our portfolio remains of good quality despite the
current global economic headwinds particularly relating to the energy and mining sectors. We continue to monitor the
portfolio closely to ensure there is no material deterioration.
The real estate business within the Group’s Mid Markets and Global Corporate portfolio is focused on clients
operating in the UK commercial property market ranging in size from medium sized private real estate entities up to
publicly listed property companies. The market for UK real estate has been buoyant and credit quality remains good
with minimal impairments/stressed loans. All asset classes are attracting investment but, recognising this is a cyclical
sector, appropriate caps are in place to control exposure and business propositions continue to be written in line
with prudent risk appetite with conservative LTV, strong quality of income and proven management teams.
Financial Institutions serves predominantly investment grade counterparties with whom relationships are either client
focused or held to support the Group’s funding, liquidity or general hedging requirements.
Trading exposures continue to be predominantly short-term and/or collateralised with inter-bank activity mainly
undertaken with acceptable investment grade counterparties.
The Group continues to adopt a conservative stance across the Eurozone maintaining close portfolio scrutiny and
oversight particularly given the current macro environment and horizon risks. Commercial Banking UK Direct Real Estate LTV analysis
The Group classifies Direct Real Estate as exposure which is directly supported by cash flows from property activities
(as opposed to trading activities, such as hotels, care homes and housebuilders).
The Group manages its exposures to Direct Real Estate across a number of different coverage segments.
Approximately 70 per cent of loans and advances to UK Direct Real Estate relate to commercial real estate with the
remainder residential real estate.
The Group makes use of a variety of methodologies to assess the value of property collateral where external
valuations are not available. These include use of market indices, models and subject matter expert judgement.
The LTV profile of the UK Direct Real Estate portfolio in Commercial Banking continues to improve. LTV – UK Direct Real Estate At 31 December 20151 At 31 December 20141 Unimpaired Impaired Total Unimpaired Impaired Total £m £m £m % £m £m £m % UK exposures >£5 m Less than 60% 4,989 72 5,061 63.7 3,985 52 4,037 47.8 60% to 70% 1,547 6 1,553 19.5 1,644 62 1,706 20.2 70% to 80% 610 13 623 7.9 964 17 981 11.6 80% to 100% 75 36 111 1.4 66 211 277 3.3 100% to 120% − 8 8 0.1 − − − − 120% to 140% − − − − 130 6 136 1.6 Greater than 140% 5 100 105 1.3 − 95 95 1.1 Unsecured 487 − 487 6.1 1,222 − 1,222 14.4
7,713 235 7,948 100.0 8,011 443 8,454 100.0 UK exposures <£5 m 9,656 508 10,164 8,833 644 9,477
Total 17,369 743 18,112 16,844 1,087 17,931 1 Exposures exclude £0.3 billion (31 December 2014: £0.4 billion) of gross UK Direct Real Estate lending in Wealth (within Retail
division) and £1.1 billion (31 December 2014: £3.3 billion) of UK Direct Real Estate lending in run-off. Also excludes social housing and housebuilder lending.
LLOYDS BANKING GROUP PLC 2015 FULL-YEAR RESULTS
Page 43 of 95
CREDIT RISK PORTFOLIO (continued)
Consumer Finance
The impairment charge reduced by 29 per cent to £152 million from £215 million in 2014. The reduction was driven
by a continued underlying improvement in portfolio quality, supported by an increased level of write-backs from the
sale of recoveries assets in the Credit Cards portfolio.
Impairment provision as a percentage of impaired loans have increased to 72.8 per cent from 70.5 per cent at
31 December 2014, with Credit Cards increasing by 5.3 percentage points to 81.8 per cent and Asset Finance UK
decreasing by 2.8 percentage points to 67.2 per cent.
Loans and advances increased by £2,665 million to £23,938 million during 2015. The growth was achieved in both
the Asset Finance UK and Credit Cards portfolio with no relaxation in risk appetite and underwriting standards.
Impaired loans decreased by £177 million in 2015 to £543 million which represented 2.3 per cent of closing loans and
advances to customers (31 December 2014: 3.4 per cent).
Run-off
With the exception of a small residual book (£37 million of which £5 million is impaired), the Irish Wholesale book
(which contained the Commercial Real Estate portfolio), is now effectively exited following completion of the
divestment announced on 30 July 2015. The Ireland Retail portfolio has reduced from £4,464 million at 31 December
2014 to £4,040 million at 31 December 2015.
The Corporate real estate and other corporate portfolio has continued to reduce significantly ahead of expectations.
Net loans and advances reduced by £1,908 million, from £3,036 million to £1,128 million for 2015.
Net loans and advances for the Specialist finance asset based run-off portfolio stood at £4,001 million at
31 December 2015 (gross £4,190 million), and include Ship Finance, Aircraft Finance and Infrastructure, with around
half of the remaining lending in the lower risk leasing sector. Including the reducing Treasury Asset legacy investment
portfolio, and operating leases, total net external assets reduced to £5,552 million at 31 December 2015 (gross
£5,742 million).

LLOYDS BANKING GROUP PLC 2015 FULL-YEAR RESULTS
Page 44 of 95
CREDIT RISK PORTFOLIO (continued)
Forbearance
The Group operates a number of schemes to assist borrowers who are experiencing financial stress. Forbearance
policies are disclosed in Note 54 of the Group’s 2014 Annual Report and Accounts, pages 305 to 314.
Retail forbearance
At 31 December 2015, UK Secured loans and advances currently or recently subject to forbearance were 1.0 per cent
(31 December 2014: 1.4 per cent) of total UK Secured loans and advances. The reduction in forbearance is due to the
overall improvement of credit quality in the portfolio.
At 31 December 2015, Loans and Overdrafts loans and advances currently or recently subject to forbearance were
1.5 per cent (31 December 2014: 1.6 per cent) of total Loans and Overdrafts loans and advances.
Total loans and advances which are
forborne1
Total forborne loans and advances which are
impaired1
Impairment provisions as % of loans and
advances which are forborne1
At Dec
2015 At Dec
2014 At Dec
2015 At Dec
2014 At Dec
2015 At Dec
2014 £m £m £m £m % % UK Secured:
Temporary forbearance arrangements
Reduced contractual monthly payment − 146 − 29 − 6.0 Reduced payment arrangements 414 552 41 69 4.2 3.4
414 698 41 98 4.2 4.0 Permanent treatments Repair and term extensions 2,688 3,696 132 168 4.2 3.5
Total 3,102 4,394 173 266 4.2 3.5 Loans and Overdrafts: 147 162 119 139 40.0 39.4 1 Includes accounts where the customer is currently benefiting from a forbearance treatment or the treatment has recently ended.
Commercial Banking forbearance
At 31 December 2015, £3,514 million (31 December 2014: £5,137 million) of total loans and advances were forborne of
which £2,528 million (December 2014: £3,241 million) were impaired. Impairment provisions as a percentage of forborne
loans and advances decreased marginally from 31.0 per cent at 31 December 2014 to 30.9 per cent at 31 December
2015.
Unimpaired forborne loans and advances were £986 million at 31 December 2015 (31 December 2014: £1,896 million).
The table below sets out the Group’s largest unimpaired forborne loans and advances to commercial customers
(exposures over £5 million) as at 31 December 2015 by type of forbearance:

LLOYDS BANKING GROUP PLC 2015 FULL-YEAR RESULTS
Page 45 of 95
CREDIT RISK PORTFOLIO (continued)
31 Dec
2015 31 Dec
2014 £m £m Type of unimpaired forbearance:
Exposures > £5m1
Covenants 310 1,018
Extensions/alterations 350 426
Multiple 9 6
669 1,450
Exposures < £5m1 317 446
Total 986 1,896 1 Material portfolios only.
Consumer Finance forbearance
At 31 December 2015, Consumer Credit Cards loans and advances currently or recently subject to forbearance were
2.4 per cent (31 December 2014: 2.6 per cent) of total Consumer Credit Cards loans and advances. At 31 December
2015, Asset Finance UK Retail loans and advances on open portfolios currently subject to forbearance were 1.4 per cent
(31 December 2014: 2.1 per cent) of total Asset Finance UK Retail loans and advances.
Total loans and advances which are
forborne1
Total forborne loans and advances which are
impaired1
Impairment provisions as % of loans and
advances which are forborne1
31 Dec
2015 31 Dec
2014 31 Dec
2015 31 Dec
2014 31 Dec
2015 31 Dec
2014 £m £m £m £m % %
Consumer Credit Cards 225 234 120 140 26.8 29.1
Asset Finance UK Retail 100 109 51 53 25.5 20.5 1 Includes accounts where the customer is currently benefiting from a forbearance treatment or the treatment has recently ended.
Run-off forbearance
Ireland retail
At 31 December 2015, £169 million or 4.2 per cent (31 December 2014: £280 million or 6.3 per cent) of Irish retail
secured loans and advances were subject to current or recent forbearance. Of this amount £26 million (31 December
2014: £41 million) were impaired.
Ireland commercial real estate and corporate
The Irish Wholesale book (which contained the Commercial Real Estate portfolio), is now effectively exited following
completion of the divestment announced on 30 July 2015.
Run-off Corporate real estate, other corporate and Specialist Finance
At 31 December 2015 £1,780 million (31 December 2014: £1,998 million of total loans and advances were forborne of
which £1,771 million (31 December 2014: £1,912 million) were impaired. Impairment provisions as a percentage of
forborne loans and advances decreased from 58.3 per cent at 31 December 2014 to 52.5 per cent at 31 December 2015.
Unimpaired forborne loans and advances were £9 million at December 2015 (December 2014: £86 million).

LLOYDS BANKING GROUP PLC 2015 FULL-YEAR RESULTS
Page 46 of 95
FUNDING AND LIQUIDITY MANAGEMENT
During 2015, the Group has maintained its strong funding and liquidity position, with a loan to deposit ratio of 109 per
cent, LCR eligible liquid assets broadly equal total wholesale funding and over five times the level of Money Market
funding less than one year to maturity at 31 December 2015. The Group has a diverse funding platform which comprises
a strong customer deposit base along with wholesale funding comprised of a range of secured and unsecured funding
products.
Total funded assets reduced by £22.2 billion to £471.2 billion. Loans and advances to customers, excluding reverse
repos, reduced by £22.4 billion. Mortgage lending increased by 1 per cent, slightly below market growth, reflecting the
Group’s focus on protecting margin in a low growth environment. UK loan growth in Consumer Finance was strong at
17 per cent and SME lending growth was 5 per cent, both outperforming the market. The growth was offset by the sale of
TSB, the further reduction in run-off and other lending portfolios which are closed to new business. Total customer
deposits fell by £28.8 billion to £418.3 billion at 31 December 2015, largely due to the sale of TSB and the planned
reduction in tactical deposits.
Wholesale funding has increased by £3.4 billion to £119.9 billion, with the volume with a residual maturity less than one
year falling to £37.9 billion (£41.1 billion at 31 December 2014). The Group’s term funding ratio (wholesale funding with a
remaining life of over one year as a percentage of total wholesale funding) increased to 68 per cent (65 per cent at
31 December 2014). In 2015 the Group’s term issuance costs were lower than 2014 and significantly lower than previous
years.
In 2015, Standard and Poor’s (S&P), Moody’s and Fitch completed their exceptional reviews of Lloyds Bank's ratings
following the UK implementation of the EU Bank Recovery and Resolution Directive. In all cases, Lloyds Bank’s ratings
were either affirmed or upgraded due to the delivery of our strategy to be a low risk, customer focused UK bank and/or
recognition of the protection Lloyds’ sizeable subordinated debt buffer provides to senior creditors. In particular, Fitch
upgraded Lloyds Bank to ‘A+’ from ‘A’ and revised the outlook to ‘Stable’ from ‘Negative’. Moody’s affirmed Lloyds’ rating
at ‘A1’ with a ‘Positive’ outlook. S&P affirmed Lloyds’ rating at ‘A’ with a ‘Stable’ outlook. Following these rating actions,
Lloyds Bank's median rating has improved to ‘A+’ (previously ‘A’). The effects of a potential downgrade from all three
rating agencies are included in the Group liquidity stress testing.
The LCR became the Pillar 1 standard for liquidity in the UK in October 2015. The Group comfortably meets the
requirements and has a robust and well governed reporting framework in place for both regulatory reporting and internal
management information. The Net Stable Funding Ratio (NSFR) is due to become a minimum standard from January
2018. The Group continues to monitor the requirements and expects to meet the minimum requirements once these are
confirmed by the PRA.
The combination of a strong balance sheet and access to a wide range of funding markets, including government and
central bank schemes, provides the Group with a broad range of options with respect to funding the balance sheet.

LLOYDS BANKING GROUP PLC 2015 FULL-YEAR RESULTS
Page 47 of 95
FUNDING AND LIQUIDITY MANAGEMENT (continued)
Group funding position
At 31 Dec
2015 At 31 Dec
2014 Change £bn £bn % Funding requirement
Loans and advances to customers1 455.2 477.6 (5)
Loans and advances to banks2 3.4 3.0 13
Debt securities 4.2 1.2
Reverse repurchase agreements 1.0 − −
Available-for-sale financial assets – non-LCR eligible3 2.7 8.0 (66)
Cash and balances at central bank – non LCR eligible4 4.7 3.6 31
Funded assets 471.2 493.4 (4)
Other assets5 234.2 265.2 (12)
705.4 758.6 (7)
On balance sheet LCR eligible liquidity assets6
Reverse repurchase agreements − 7.0
Cash and balances at central banks4 53.7 46.9 14
Available-for-sale financial assets 30.3 48.5 (38)
Held-to-maturity financial assets 19.8 −
Trading and fair value through profit and loss 3.0 (6.1)
Repurchase agreements (5.5) −
101.3 96.3 5
Total Group assets 806.7 854.9 (6)
Less: other liabilities5 (221.5) (240.3) (8)
Funding requirement 585.2 614.6 (5)
Funded by
Customer deposits 418.3 447.1 (6)
Wholesale funding7 119.9 116.5 3
538.2 563.6 (5)
Repurchase agreements − 1.1
Total equity 47.0 49.9 (6)
Total funding 585.2 614.6 (5) 1 Excludes £nil (31 December 2014: £5.1 billion) of reverse repurchase agreements. 2 Excludes £20.8 billion (31 December 2014: £21.3 billion) of loans and advances to banks within the Insurance business and
£0.9 billion (31 December 2014: £1.9 billion) of reverse repurchase agreements. 3 Non LCR eligible liquid assets comprise a diversified pool of highly rated unencumbered collateral (including retained issuance). 4 Cash and balances at central banks are combined in the Group's balance sheet. 5 Other assets and other liabilities primarily include balances in the Group's Insurance business and the fair value of derivative assets
and liabilities. 6 2014 comparators are on an Individual Liquidity Adequacy Standards basis. 7 The Group’s definition of wholesale funding aligns with that used by other international market participants; including interbank
deposits, debt securities in issue and subordinated liabilities.

LLOYDS BANKING GROUP PLC 2015 FULL-YEAR RESULTS
Page 48 of 95
FUNDING AND LIQUIDITY MANAGEMENT (continued)
Reconciliation of Group funding to the balance sheet
At 31 December 2015
Included in funding
analysis
Reposand cash collateral received
by Insurance
Fair value and other
accounting methods
Balance sheet
£bn £bn £bn £bn
Deposits from banks 8.5 8.4 − 16.9
Debt securities in issue 88.1 − (6.0) 82.1
Subordinated liabilities 23.3 − − 23.3
Total wholesale funding 119.9 8.4
Customer deposits 418.3 − − 418.3
Total 538.2 8.4
At 31 December 2014
Included in funding
analysis
Repos and cash collateral received
by Insurance
Fair value and other
accounting methods
Balance sheet
£bn £bn £bn £bn
Deposits from banks 9.8 1.1 − 10.9
Debt securities in issue 80.6 − (4.4) 76.2
Subordinated liabilities 26.1 − (0.1) 26.0
Total wholesale funding 116.5 1.1
Customer deposits 447.1 − − 447.1
Total 563.6 1.1 Analysis of 2015 total wholesale funding by residual maturity
Less than one
month
One to three
months
Three to six
months
Six to nine
months
Ninemonths
to one year
One to two
years
Two to five
years
More than five
years
Totalat
31 Dec 2015
Total at
31 Dec 2014
£bn £bn £bn £bn £bn £bn £bn £bn £bn £bn
Deposit from banks 6.7 0.8 0.5 0.1 0.1 − − 0.3 8.5 9.8
Debt securities in issue:
Certificates of deposit 1.0 4.3 2.0 2.5 0.8 − − − 10.6 6.8
Commercial paper 3.7 2.3 0.3 0.2 0.1 − − − 6.6 7.3
Medium-term notes1 0.9 0.6 2.0 0.9 0.5 5.2 13.6 13.9 37.6 29.2
Covered bonds − − 1.2 1.1 0.5 5.3 7.4 10.3 25.8 25.2
Securitisation 0.4 − 0.8 0.2 0.2 3.6 0.9 1.4 7.5 12.1
6.0 7.2 6.3 4.9 2.1 14.1 21.9 25.6 88.1 80.6
Subordinated liabilities − 0.2 0.2 0.5 2.3 0.9 7.6 11.6 23.3 26.1
Total wholesale funding2 1 12.7 8.2 7.0 5.5 4.5 15.0 29.5 37.5 119.9 116.5
Of which issued by Lloyds Banking Group plc3 − − − − 0.3 − − 3.1 3.4 2.6 1 Medium-term notes include funding from the National Loan Guarantee Scheme (31 December 2015: £1.4 billion; 31 December 2014:
£1.4 billion). 2 The Group’s definition of wholesale funding aligns with that used by other international market participants; including interbank
deposits, debt securities in issue and subordinated liabilities. 3 Comprises £3.4 billion of subordinated liabilities (31 December 2014: £2.0 billion) and £nil of medium term notes (31 December 2014:
£0.6 billion) issued by the holding company, Lloyds Banking Group plc.

LLOYDS BANKING GROUP PLC 2015 FULL-YEAR RESULTS
Page 49 of 95
FUNDING AND LIQUIDITY MANAGEMENT (continued) Analysis of 2015 term issuance
Sterling US Dollar Euro Other
currencies Total £bn £bn £bn £bn £bn
Securitisation 1.0 1.2 0.3 − 2.5
Medium-term notes 0.3 4.8 3.3 1.2 9.6
Covered bonds 1.7 − 2.0 − 3.7
Private placements1 1.0 2.1 2.3 − 5.4
Subordinated liabilities − 0.3 − − 0.3
Total issuance 4.0 8.4 7.9 1.2 21.5
Of which issued by Lloyds Banking Group plc2 − 0.3 − − 0.3 1 Private placements include structured bonds and term repurchase agreements (repos). 2 Comprises £0.3 billion of subordinated liabilities issued by the holding company, Lloyds Banking Group plc. In addition, Lloyds
Banking Group plc issued c.£1.2 billion of subordinated liabilities as part of an exchange of outstanding operating company securitiesfor new holding company securities.
Term issuance for 2015 totalled £21.5 billion. The Group continued to maintain a diversified approach to markets with
trades in public and private format, secured and unsecured products and a wide range of currencies and markets. For
2016, the Group will continue to maintain this diversified approach to funding including capital and funding from the
holding company Lloyds Banking Group plc as needed to optimise the capital and funding position to transition towards
final UK Minimum Requirements for own funds and Eligible Liabilities (MREL) requirements which is still being consulted
on in the UK. Continued use of the UK government’s Funding for Lending Scheme (FLS) has further underlined the
Group’s support to the UK economic recovery and the Group remains committed to passing the benefits of this low cost
funding on to its customers. In 2015 the Group drew down £12.1 billion under the FLS, bringing total drawings under the
FLS to £32.1 billion. The maturities for the FLS are fully factored into the Group’s funding plan.

LLOYDS BANKING GROUP PLC 2015 FULL-YEAR RESULTS
Page 50 of 95
FUNDING AND LIQUIDITY MANAGEMENT (continued)
Liquidity portfolio
The UK regulator adopted the EU delegated act on 1 October 2015. Prior to this, liquidity was managed on an Individual
Liquidity Adequacy Standards (ILAS) basis where liquid assets were divided into Primary and Secondary categories.
Post 1 October 2015, liquid assets are classed as LCR eligible or non-eligible. At 31 December 2015, the Banking
business had £123.4 billion of highly liquid unencumbered LCR eligible assets of which £122.9 billion is LCR level 1
eligible and £0.5 billion is LCR level 2 eligible. These are available to meet cash and collateral outflows and PRA
regulatory requirements. A separate liquidity portfolio to mitigate any insurance liquidity risk is managed within the
Insurance business. LCR eligible liquid assets represent 5.7 times the Group’s money market funding less than one year
maturity (excluding derivative collateral margins and settlement accounts) and is broadly equivalent to total wholesale
funding, and thus provides a substantial buffer in the event of continued market dislocation. During 2015 the Group has
increased regulatory liquidity to strengthen the overall liquidity position.
LCR eligible liquid assets At 31 Dec
2015 Average
20151
£bn £bn Level 1
Cash and central bank reserves 53.7 57.2
High quality government/MDB/agency bonds2 65.8 63.0
High quality covered bonds 3.4 3.3
Total 122.9 123.5 Level 23 0.5 0.7
Total LCR eligible assets 123.4 124.2 1 Average for Q4 2015 only. 2 Designated multilateral development bank (MDB). Includes eligible government guaranteed bonds. 3 Includes Level 2A and Level 2B.
The Banking business also had £98.9 billion of secondary non-LCR eligible liquidity, the vast majority of which however
is eligible for use in a range of central bank or similar facilities and the Group routinely makes use of as part of its normal
liquidity management practices. Future use of such facilities will be based on prudent liquidity management and
economic considerations, having regard for external market conditions.
The Group considers diversification across geography, currency, markets and tenor when assessing appropriate
holdings of primary and secondary liquid assets. This liquidity is managed as a single pool in the centre and is under the
control of the function charged with managing the liquidity of the Group. It is available for deployment at immediate
notice, subject to complying with regulatory requirements, and is a key component of the Group’s liquidity management
process.
Encumbered assets
The Board and Group Asset & Liability Committee monitor and manage total balance sheet encumbrance via a number
of risk appetite metrics. At 31 December 2015, the Group had £77.4 billion (31 December 2014: £105.2 billion) of
externally encumbered on balance sheet assets with counterparties other than central banks. The reduction in
encumbered assets was caused by securitisation and covered bond maturities. The Group also had £573.7 billion
(31 December 2014: £641.8 billion) of unencumbered on balance sheet assets and £155.6 billion (31 December 2014:
£107.8 billion) of pre-positioned and encumbered assets held with central banks. Primarily the Group encumbers
mortgages, unsecured lending and credit card receivables through the issuance programmes and tradable securities
through securities financing activity. The Group mainly positions mortgage assets at central banks.

LLOYDS BANKING GROUP PLC 2015 FULL-YEAR RESULTS
Page 51 of 95
CAPITAL MANAGEMENT
The continued strengthening of the Group’s capital position during 2015, through a combination of increased underlying
profits, net of PPI and other conduct charges, and a reduction in risk-weighted assets, provided the Group with the ability
to pay both an interim dividend at half year and to recommend the payment of both a full year ordinary dividend and a
special dividend whilst maintaining strong capital ratios.
The CET1 ratio before dividends in respect of 2015 increased 0.9 percentage points from 12.8 per cent to
13.7 per cent.
The CET1 ratio after dividends in respect of 2015 was unchanged at 12.8 per cent, increasing to 13.0 per cent on a
pro forma basis upon recognition of the dividend paid by the Insurance business in February 2016 in relation to its
2015 earnings.
The leverage ratio after dividends in respect of 2015 reduced from 4.9 per cent to 4.8 per cent.
The transitional total capital ratio after dividends in respect of 2015 reduced 0.5 percentage points from 22.0 per cent
to 21.5 per cent.
Dividends
The Group has established a dividend policy that is both progressive and sustainable. We expect ordinary dividends to
increase over the medium term to a dividend payout ratio of at least 50 per cent of sustainable earnings.
The ability of Lloyds Banking Group plc (‘the Company’) to sustain dividend payments is dependent upon the continued
receipt of dividends from its subsidiaries.
During 2014 and 2015 the Group has undertaken significant capital management actions in order to simplify the Group’s
internal capital structure and to ensure that profits generated by subsidiary entities can be more easily remitted to the
Company. These activities relate to a number of subsidiary entities, and include the court approved capital reductions by
HBOS plc and Bank of Scotland plc, the part VII transfers within Insurance businesses and obtaining PRA approval for
our internal model, which will support the Solvency II capital regime for the Insurance subsidiaries with effect from
1 January 2016.
The Group remains strongly capitalised, increasing its CET1 capital ratio from 12.8 per cent at 31 December 2014 to
13.7 per cent (pre 2015 dividends) at 31 December 2015. The interim and recommended final dividends totalling
2.25 pence per ordinary share and the special dividend of 0.5 pence per ordinary share reduce the Group’s CET1 ratio to
12.8 per cent. Recognising the 2015 Insurance dividend, paid in February 2016 following the implementation of Solvency
II, this rises to 13.0 per cent on a pro forma basis.
Regulatory capital developments
The Group has received updated Individual Capital Guidance (ICG) from the PRA. The ICG reflects a point in time
estimate by the PRA, which may change over time, of the amount of capital that is needed in relation to risks not covered
by Pillar 1. The Group’s ICG has increased, such that at 31 December 2015 it represented 4.6 per cent of risk-weighted
assets of which 2.6 per cent had to be covered by CET1 capital. The Group believes that the increase reflects the impact
of market and economic factors and the reduction in risk-weighted assets rather than any fundamental changes to the
nature of the underlying risks. However the Group is not permitted by the PRA to give any further details of the quantum
of the individual components.
During the year capital regulations have continued to evolve with, in particular, the finalisation of UK leverage ratio
requirements, a revised Pillar 2 framework and clarification of the UK regulatory capital buffer framework. Final revisions
to the market risk framework following the Basel Committee’s Fundamental Review of the Trading Book and the Bank of
England’s proposals for the application of both the European Commission’s MREL (minimum requirements for own funds
and eligible liabilities) and systemic risk buffers within the UK have recently been published.

LLOYDS BANKING GROUP PLC 2015 FULL-YEAR RESULTS
Page 52 of 95
CAPITAL MANAGEMENT (continued)
In December 2015, the FPC published a document alongside its Financial Stability Report in which it expressed its views
on the overall calibration of the capital requirements framework for the UK banking system together with a description of
how it expected the framework to transition from its current state to its end point in 2019 as well as ongoing work to refine
capital requirements during that transitional period.
Looking ahead to potential future changes, the Basel Committee is continuing to review the treatment of the standardised
risk-weighted asset frameworks for credit risk and operational risk and the credit valuation adjustment risk framework. It
is also to finalise recommendations for the capital treatment of interest rate risk in the banking book (IRRBB), the
calibration of leverage ratio requirements and continues to consider the treatment of sovereign risk and the setting of
additional constraints on the use of internally modelled approaches, including the design of a new capital floors
framework.
The Group continues to monitor these developments very closely, analysing the potential capital impacts to ensure that,
through organic capital generation, the Group continues to maintain a strong capital position that exceeds the minimum
regulatory requirements and the Group’s risk appetite and is consistent with market expectations.
Stress testing
In addition to the internal stress testing activity undertaken in 2015, the Group participated in the UK-wide concurrent
stress testing run by the Bank of England, comfortably exceeding both the capital and leverage minimum thresholds.
Capital position at 31 December 2015
The Group’s capital position as at 31 December 2015 is presented in the following section applying CRD IV transitional
arrangements, as implemented in the UK by the PRA, and also on a fully loaded CRD IV basis.
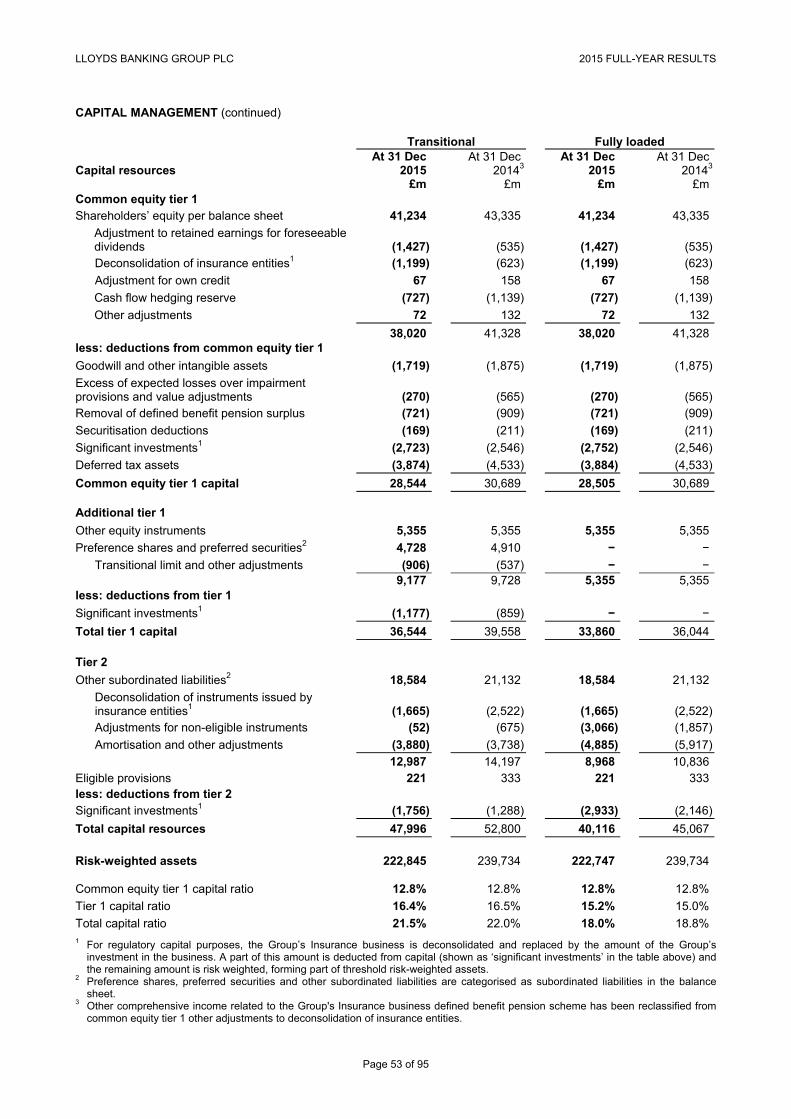
LLOYDS BANKING GROUP PLC 2015 FULL-YEAR RESULTS
Page 53 of 95
CAPITAL MANAGEMENT (continued) Transitional Fully loaded
Capital resources At 31 Dec
2015 At 31 Dec
20143At 31 Dec
2015 At 31 Dec
20143
£m £m £m £m Common equity tier 1 Shareholders’ equity per balance sheet 41,234 43,335 41,234 43,335
Adjustment to retained earnings for foreseeable dividends (1,427) (535) (1,427) (535)Deconsolidation of insurance entities1 (1,199) (623) (1,199) (623)
Adjustment for own credit 67 158 67 158
Cash flow hedging reserve (727) (1,139) (727) (1,139)
Other adjustments 72 132 72 132
38,020 41,328 38,020 41,328 less: deductions from common equity tier 1
Goodwill and other intangible assets (1,719) (1,875) (1,719) (1,875)
Excess of expected losses over impairment provisions and value adjustments (270) (565) (270) (565)Removal of defined benefit pension surplus (721) (909) (721) (909)
Securitisation deductions (169) (211) (169) (211)
Significant investments1 (2,723) (2,546) (2,752) (2,546)
Deferred tax assets (3,874) (4,533) (3,884) (4,533)
Common equity tier 1 capital 28,544 30,689 28,505 30,689 Additional tier 1
Other equity instruments 5,355 5,355 5,355 5,355
Preference shares and preferred securities2 4,728 4,910 − −
Transitional limit and other adjustments (906) (537) − − 9,177 9,728 5,355 5,355
less: deductions from tier 1
Significant investments1 (1,177) (859) − −
Total tier 1 capital 36,544 39,558 33,860 36,044 Tier 2
Other subordinated liabilities2 18,584 21,132 18,584 21,132
Deconsolidation of instruments issued by insurance entities1 (1,665) (2,522) (1,665)
(2,522)
Adjustments for non-eligible instruments (52) (675) (3,066) (1,857)
Amortisation and other adjustments (3,880) (3,738) (4,885) (5,917)
12,987 14,197 8,968 10,836 Eligible provisions 221 333 221 333 less: deductions from tier 2 Significant investments1 (1,756) (1,288) (2,933) (2,146)
Total capital resources 47,996 52,800 40,116 45,067 Risk-weighted assets 222,845 239,734 222,747 239,734 Common equity tier 1 capital ratio 12.8% 12.8% 12.8% 12.8%
Tier 1 capital ratio 16.4% 16.5% 15.2% 15.0%
Total capital ratio 21.5% 22.0% 18.0% 18.8% 1 For regulatory capital purposes, the Group’s Insurance business is deconsolidated and replaced by the amount of the Group’s
investment in the business. A part of this amount is deducted from capital (shown as ‘significant investments’ in the table above) andthe remaining amount is risk weighted, forming part of threshold risk-weighted assets.
2 Preference shares, preferred securities and other subordinated liabilities are categorised as subordinated liabilities in the balancesheet.
3 Other comprehensive income related to the Group's Insurance business defined benefit pension scheme has been reclassified fromcommon equity tier 1 other adjustments to deconsolidation of insurance entities.

LLOYDS BANKING GROUP PLC 2015 FULL-YEAR RESULTS
Page 54 of 95
CAPITAL MANAGEMENT (continued)
The key differences between the transitional capital calculation as at 31 December 2015 and the fully loaded equivalent
are as follows:
Capital securities that previously qualified as tier 1 or tier 2 capital, but do not fully qualify under CRD IV, can be
included in tier 1 or tier 2 capital (as applicable) up to specified limits which reduce by 10 per cent per annum
until 2022.
The significant investment deduction from additional tier 1 (AT1) will gradually transition to tier 2.
The movements in the transitional CET1, AT1, tier 2 and total capital positions in the period are provided below.
Common
Equity Tier 1 Additional
Tier 1 Tier 2 Total
capital £m £m £m £m
At 31 December 2014 30,689 8,869 13,242 52,800
Profit attributable to ordinary shareholders1 434 434
Eligible minority interest (470) (470)Adjustment to retained earnings for foreseeable dividends (1,427) (1,427)Dividends paid out on ordinary shares during the year (1,070) (1,070)Movement in treasury shares and employee share schemes (537) (537)Pension movements:
Removal of defined benefit pension surplus 188 188
Movement through other comprehensive income (194) (194)
Available-for-sale reserve (371) (371)
Deferred tax asset 659 659
Goodwill and other intangible assets 156 156
Excess of expected losses over impairment provisions and value adjustments 295 295 Significant investments (177) (318) (468) (963)
Eligible provisions (112) (112)
Subordinated debt movements:
Repurchases, redemptions and other (551) (2,516) (3,067)
Issuances 1,306 1,306
Other movements 369 369
At 31 December 2015 28,544 8,000 11,452 47,996 1 Under the regulatory framework, profits made by Insurance are removed from CET1 capital. However, when dividends are paid to the
Group by Insurance these can then be recognised as CET1 capital.
CET1 capital resources have reduced by £2,145 million in the year largely as a result of dividends paid out during the
year and the accrual of the full year ordinary dividend and special dividend, representing returns to ordinary shareholders
following strong underlying profit generation. Other reductions to CET1 capital primarily reflected the removal of eligible
minority interest related to TSB and movements in treasury shares, employee share schemes and the AFS reserve.
These reductions in CET 1 capital were partially offset by reductions in both the deferred tax asset deduction and the
excess of expected losses over impairment provisions and value adjustments.
AT1 capital resources have reduced by £869 million in the year, primarily reflecting the annual reduction in the
transitional limit applied to grandfathered AT1 capital instruments and an increase in the significant investments
deduction.

LLOYDS BANKING GROUP PLC 2015 FULL-YEAR RESULTS
Page 55 of 95
CAPITAL MANAGEMENT (continued)
Tier 2 capital resources have reduced by £1,790 million in the year largely reflecting calls and redemptions, amortisation
of dated instruments, foreign exchange movements and an increase in the significant investments deduction, partly offset
by the issuance of new tier 2 instruments.
Risk-weighted assets At 31 Dec
2015 At 31 Dec
2014 £m £m Foundation Internal Ratings Based (IRB) Approach 68,990 72,393 Retail IRB Approach 63,912 72,886 Other IRB Approach 18,661 15,324
IRB Approach 151,563 160,603 Standardised Approach 20,443 25,444 Contributions to the default fund of a central counterparty 488 515
Credit risk 172,494 186,562 Counterparty credit risk 7,981 9,108 Credit valuation adjustment risk 1,684 2,215 Operational risk 26,123 26,279 Market risk 3,775 4,746
Underlying risk-weighted assets 212,057 228,910 Threshold risk-weighted assets1 10,788 10,824
Total risk-weighted assets 222,845 239,734 Movement to fully loaded risk-weighted assets2 (98) −
Fully loaded risk-weighted assets 222,747 239,734
Risk-weighted assets movement by key driver
Credit risk3
Counterparty
credit risk3Market
risk Operational
risk Total £m £m £m £m £mRisk-weighted assets at 31 December 2014 186,562 11,323 4,746 26,279 228,910 Management of the balance sheet 1,772 (474) (838) − 460 Disposals (8,582) (115) − − (8,697)External economic factors (6,370) (518) 80 − (6,808)Model and methodology changes (888) (551) (213) − (1,652)Other − − − (156) (156)
Risk-weighted assets 172,494 9,665 3,775 26,123 212,057
Threshold risk-weighted assets1 10,788
Total risk-weighted assets 222,845 Movement to fully loaded risk-weighted assets2 (98)
Fully loaded risk-weighted assets 222,747 1 Threshold risk-weighted assets reflect the element of significant investments and deferred tax assets that are permitted to be
risk-weighted instead of being deducted from CET1 capital. Significant investments primarily arise from investment in the Group’s Insurance business.
2 Differences may arise between transitional and fully loaded threshold risk-weighted assets where deferred tax assets reliant on future profitability and arising from temporary timing differences and significant investments exceed the fully loaded threshold limit, resultingin an increase in amounts deducted from CET1 capital rather than being risk-weighted. At 31 December 2014 the fully loaded threshold was not exceeded and therefore no further adjustment was applied to the transitional threshold risk-weighted assets.
3 Credit risk includes movements in contributions to the default fund of central counterparties and counterparty credit risk includes the movements in credit valuation adjustment risk.
The risk-weighted assets movement tables provide analyses of the reduction in risk-weighted assets in the period by risk
type and an insight into the key drivers of the movements. The key driver analysis is compiled on a monthly basis
through the identification and categorisation of risk-weighted asset movements and is subject to management judgment.

LLOYDS BANKING GROUP PLC 2015 FULL-YEAR RESULTS
Page 56 of 95
CAPITAL MANAGEMENT (continued)
Credit risk-weighted asset reductions of £14.1 billion were driven by the following key movements:
Management of the balance sheet includes risk-weighted asset movements arising from new lending and asset
run-off. During 2015, credit risk-weighted assets increased by £1.8 billion, primarily as a result of targeted net lending
growth in core businesses, as well as an increase in risk-weighted assets for the Group’s strategic equity
investments.
Disposals include risk-weighted asset reductions arising from the sale of assets, portfolios and businesses. Disposals
reduced credit risk-weighted assets by £8.6 billion, primarily driven by the completion of the sale of TSB as well as
disposals in the run-off business.
External economic factors capture movements driven by changes in the economic environment. The reduction in
credit risk-weighted assets of £6.4 billion is mainly due to improvements in credit quality, which primarily impacted the
Retail and Consumer Finance businesses, and favourable movements in HPI that benefited retail mortgage
portfolios.
Model and methodology reductions of £0.9 billion include the movement in credit risk-weighted assets arising from
model and methodology refinements and changes in credit risk approach applied to certain portfolios. Counterparty credit risk and CVA risk reductions of £1.7 billion are principally driven by trading activity and
compressions, hedging and yield curve movements.
Risk-weighted assets related to market risk reduced by £1.0 billion primarily due to active portfolio management and
model and methodology refinements.

LLOYDS BANKING GROUP PLC 2015 FULL-YEAR RESULTS
Page 57 of 95
CAPITAL MANAGEMENT (continued) Leverage ratio
In January 2015 the existing CRD IV rules on the calculation of the leverage ratio were amended to align with the
European Commission’s interpretation of the revised Basel III leverage ratio framework. The Group’s leverage ratio has
been calculated in accordance with the amended CRD IV rules on leverage.
Fully loaded
At 31 Dec
2015 At 31 Dec
20141
£m £m Total tier 1 capital for leverage ratio
Common equity tier 1 capital 28,505 30,689
Additional tier 1 capital 5,355 5,355
Total tier 1 capital 33,860 36,044 Exposure measure Statutory balance sheet assets
Derivative financial instruments 29,467 36,128
Securities financing transactions (SFTs) 34,136 43,772
Loans and advances and other assets 743,085 774,996
Total assets 806,688 854,896 Deconsolidation adjustments2
Derivative financial instruments (1,510) (1,663)
Securities financing transactions (SFTs) (441) 1,655
Loans and advances and other assets (133,975) (144,114)
Total deconsolidation adjustments (135,926) (144,122) Derivatives adjustments
Adjustments for regulatory netting (16,419) (24,187)
Adjustments for cash collateral (6,464) (1,024)
Net written credit protection 682 425
Regulatory potential future exposure 12,966 12,722
Total derivatives adjustments (9,235) (12,064) Counterparty credit risk add-on for SFTs 3,361 1,364 Off-balance sheet items 56,424 50,980 Regulatory deductions and other adjustments (9,112) (10,362) Total exposure 712,200 740,692 Leverage ratio 4.8% 4.9% 1 Restated to align with the amended CRD IV rules on leverage implemented in January 2015. 2 Deconsolidation adjustments predominantly reflect the deconsolidation of assets related to Group subsidiaries that fall outside the
scope of the Group’s regulatory capital consolidation (primarily the Group’s insurance entities).
Key movements
The Group’s fully loaded leverage ratio reduced by 0.1 per cent to 4.8 per cent reflecting the impact of the reduction in
tier 1 capital offset by the £28.5 billion reduction in the exposure measure, the latter largely reflecting the reduction in
balance sheet assets arising, in part, from the disposal of TSB.
The derivatives exposure measure, representing derivative financial instruments per the balance sheet net of
deconsolidation and derivatives adjustments, reduced by £3.7 billion reflecting a combination of market movements,
trading activity and trade compressions and the recognition and subsequent deduction of receivables assets for eligible
cash variation margin provided in derivatives transactions.

LLOYDS BANKING GROUP PLC 2015 FULL-YEAR RESULTS
Page 58 of 95
CAPITAL MANAGEMENT (continued)
The SFT exposure measure, representing SFTs per the balance sheet inclusive of deconsolidation adjustments and
counterparty credit risk add-on, reduced by £9.7 billion primarily reflecting active balance sheet management and
reduced trading volumes.
Off-balance sheet items increased by £5.4 billion, primarily reflecting an increase in new corporate lending facilities and
corporate customer limits and an increase in new residential mortgage offers placed.

LLOYDS BANKING GROUP PLC 2015 FULL-YEAR RESULTS
Page 59 of 95
STATUTORY INFORMATION
Page
Condensed consolidated financial statements
Consolidated income statement 60
Consolidated statement of comprehensive income 61
Consolidated balance sheet 62
Consolidated statement of changes in equity 64
Consolidated cash flow statement 66
Notes
1 Accounting policies, presentation and estimates 67
2 Segmental analysis 68
3 Operating expenses 70
4 Impairment 71
5 Taxation 71
6 Earnings per share 72
7 Trading and other financial assets at fair value through profit or loss 72
8 Derivative financial instruments 73
9 Loans and advances to customers 73
10 Allowance for impairment losses on loans and receivables 74
11 Debt securities in issue 74
12 Post-retirement defined benefit schemes 75
13 Provisions for liabilities and charges 76
14 Contingent liabilities and commitments 79
15 Fair values of financial assets and liabilities 82
16 Credit quality of loans and advances 89
17 Related party transactions 90
18 Disposal of interest in TSB Banking Group plc 91
19 Dividends on ordinary shares 92
20 Events since the balance sheet date 92
21 Future accounting developments 92
22 Other information 94
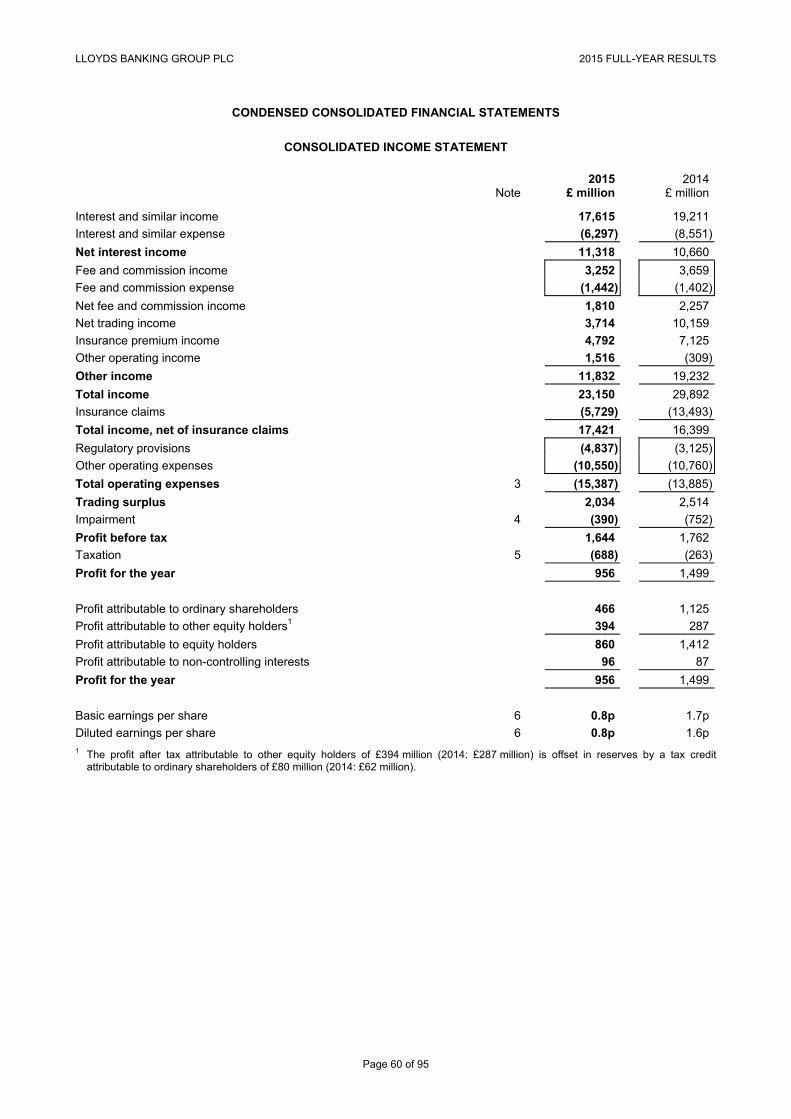
LLOYDS BANKING GROUP PLC 2015 FULL-YEAR RESULTS
Page 60 of 95
CONDENSED CONSOLIDATED FINANCIAL STATEMENTS
CONSOLIDATED INCOME STATEMENT
2015 2014 Note £ million £ million
Interest and similar income 17,615 19,211
Interest and similar expense (6,297) (8,551)
Net interest income 11,318 10,660
Fee and commission income 3,252 3,659
Fee and commission expense (1,442) (1,402)
Net fee and commission income 1,810 2,257
Net trading income 3,714 10,159
Insurance premium income 4,792 7,125
Other operating income 1,516 (309)
Other income 11,832 19,232
Total income 23,150 29,892
Insurance claims (5,729) (13,493)
Total income, net of insurance claims 17,421 16,399
Regulatory provisions (4,837) (3,125)
Other operating expenses (10,550) (10,760)
Total operating expenses 3 (15,387) (13,885)
Trading surplus 2,034 2,514
Impairment 4 (390) (752)
Profit before tax 1,644 1,762
Taxation 5 (688) (263)
Profit for the year 956 1,499
Profit attributable to ordinary shareholders 466 1,125
Profit attributable to other equity holders1 394 287
Profit attributable to equity holders 860 1,412
Profit attributable to non-controlling interests 96 87
Profit for the year 956 1,499
Basic earnings per share 6 0.8p 1.7p
Diluted earnings per share 6 0.8p 1.6p 1 The profit after tax attributable to other equity holders of £394 million (2014: £287 million) is offset in reserves by a tax credit
attributable to ordinary shareholders of £80 million (2014: £62 million).

LLOYDS BANKING GROUP PLC 2015 FULL-YEAR RESULTS
Page 61 of 95
CONDENSED CONSOLIDATED FINANCIAL STATEMENTS (continued)
CONSOLIDATED STATEMENT OF COMPREHENSIVE INCOME
2015 2014
£ million £ million
Profit for the year 956 1,499
Other comprehensive income
Items that will not subsequently be reclassified to profit or loss:
Post-retirement defined benefit scheme remeasurements (note 12):
Remeasurements before taxation (274) 674
Taxation 59 (135)
(215) 539
Items that may subsequently be reclassified to profit or loss:
Movements in revaluation reserve in respect of available-for-sale financial assets:
Change in fair value (318) 690
Income statement transfers in respect of disposals (51) (131)
Income statement transfers in respect of impairment 4 2
Taxation (6) (13)
(371) 548
Movements in cash flow hedging reserve:
Effective portion of changes in fair value 537 3,896
Net income statement transfers (956) (1,153)
Taxation 7 (549)
(412) 2,194
Currency translation differences (tax: nil) (42) (3)
Other comprehensive income for the year, net of tax (1,040) 3,278
Total comprehensive income for the year (84) 4,777
Total comprehensive income attributable to ordinary shareholders (574) 4,403
Total comprehensive income attributable to other equity holders 394 287
Total comprehensive income attributable to equity holders (180) 4,690
Total comprehensive income attributable to non-controlling interests 96 87
Total comprehensive income for the year (84) 4,777
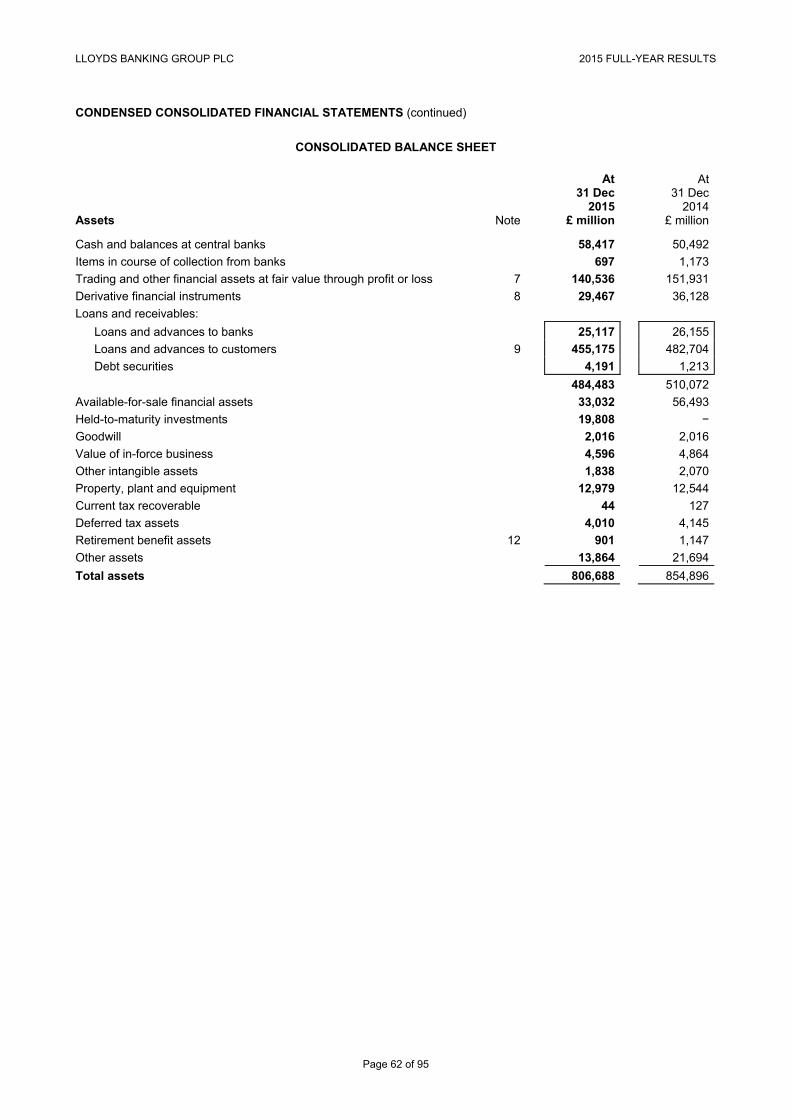
LLOYDS BANKING GROUP PLC 2015 FULL-YEAR RESULTS
Page 62 of 95
CONDENSED CONSOLIDATED FINANCIAL STATEMENTS (continued)
CONSOLIDATED BALANCE SHEET
At 31 Dec
2015
At 31 Dec
2014 Assets Note £ million £ million
Cash and balances at central banks 58,417 50,492
Items in course of collection from banks 697 1,173
Trading and other financial assets at fair value through profit or loss 7 140,536 151,931
Derivative financial instruments 8 29,467 36,128
Loans and receivables:
Loans and advances to banks 25,117 26,155
Loans and advances to customers 9 455,175 482,704
Debt securities 4,191 1,213
484,483 510,072
Available-for-sale financial assets 33,032 56,493
Held-to-maturity investments 19,808 −
Goodwill 2,016 2,016
Value of in-force business 4,596 4,864
Other intangible assets 1,838 2,070
Property, plant and equipment 12,979 12,544
Current tax recoverable 44 127
Deferred tax assets 4,010 4,145
Retirement benefit assets 12 901 1,147
Other assets 13,864 21,694
Total assets 806,688 854,896
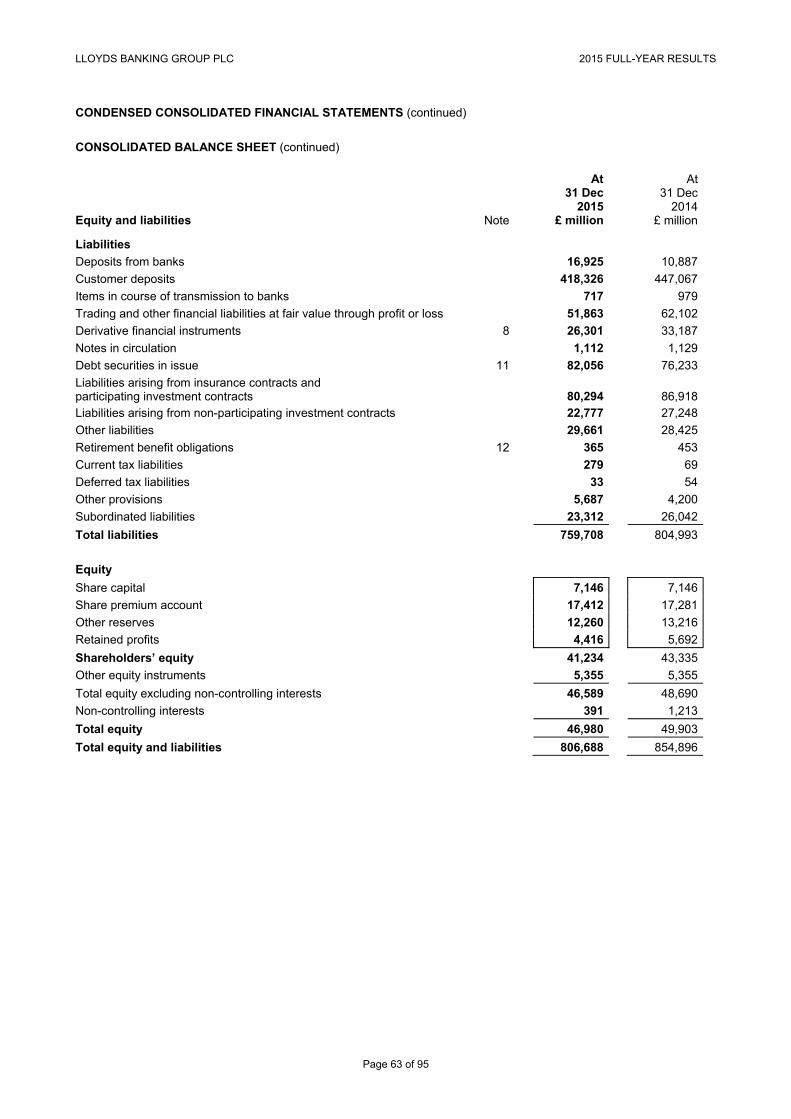
LLOYDS BANKING GROUP PLC 2015 FULL-YEAR RESULTS
Page 63 of 95
CONDENSED CONSOLIDATED FINANCIAL STATEMENTS (continued)
CONSOLIDATED BALANCE SHEET (continued)
At 31 Dec
2015
At 31 Dec
2014 Equity and liabilities Note £ million £ million
Liabilities
Deposits from banks 16,925 10,887
Customer deposits 418,326 447,067
Items in course of transmission to banks 717 979
Trading and other financial liabilities at fair value through profit or loss 51,863 62,102
Derivative financial instruments 8 26,301 33,187
Notes in circulation 1,112 1,129
Debt securities in issue 11 82,056 76,233
Liabilities arising from insurance contracts and participating investment contracts 80,294 86,918 Liabilities arising from non-participating investment contracts 22,777 27,248
Other liabilities 29,661 28,425
Retirement benefit obligations 12 365 453
Current tax liabilities 279 69
Deferred tax liabilities 33 54
Other provisions 5,687 4,200
Subordinated liabilities 23,312 26,042
Total liabilities 759,708 804,993
Equity
Share capital 7,146 7,146
Share premium account 17,412 17,281
Other reserves 12,260 13,216
Retained profits 4,416 5,692
Shareholders’ equity 41,234 43,335
Other equity instruments 5,355 5,355
Total equity excluding non-controlling interests 46,589 48,690
Non-controlling interests 391 1,213
Total equity 46,980 49,903
Total equity and liabilities 806,688 854,896

LLOYDS BANKING GROUP PLC 2015 FULL-YEAR RESULTS
Page 64 of 95
CONDENSED CONSOLIDATED FINANCIAL STATEMENTS (continued)
CONSOLIDATED STATEMENT OF CHANGES IN EQUITY
Attributable to equity shareholders
Share capital
and premium
Other reserves
Retained profits Total
Other equity
instruments
Non-
controlling interests Total
£ million £ million £ million £ million £ million £ million £ million
Balance at 1 January 2015 24,427 13,216 5,692 43,335 5,355 1,213 49,903
Comprehensive income
Profit for the year – − 860 860 – 96 956
Other comprehensive income
Post-retirement defined benefit scheme remeasurements, net of tax – – (215) (215) – – (215)
Movements in revaluation reserve in respect of available-for-sale financial assets, net of tax – (371) – (371) – – (371)Movements in cash flow hedging reserve, net of tax – (412) – (412) – – (412)Currency translation differences (tax: nil) – (42) – (42) – – (42)
Total other comprehensive income – (825) (215) (1,040) – – (1,040)
Total comprehensive income – (825) 645 (180) – 96 (84)
Transactions with owners
Dividends (note 19) – − (1,070) (1,070) – (52) (1,122)
Distributions on other equity instruments, net of tax – – (314) (314) – – (314)Redemption of preference shares 131 (131) – – – – – Movement in treasury shares – – (816) (816) – – (816)
Value of employee services:
Share option schemes – – 107 107 – – 107
Other employee award schemes – – 172 172 – – 172
Adjustment on sale of interest in TSB Banking Group plc (TSB) (note 18) – – – – – (825) (825)Other changes in non-controlling interests – – – – – (41) (41)
Total transactions with owners 131 (131) (1,921) (1,921) – (918) (2,839)Balance at 31 December 2015 24,558 12,260 4,416 41,234 5,355 391 46,980

LLOYDS BANKING GROUP PLC 2015 FULL-YEAR RESULTS
Page 65 of 95
CONDENSED CONSOLIDATED FINANCIAL STATEMENTS (continued)
CONSOLIDATED STATEMENT OF CHANGES IN EQUITY (continued)
Attributable to equity shareholders
Share capital
and premium
Other reserves
Retained profits Total
Other equity
instruments
Non-
controlling interests Total
£ million £ million £ million £ million £ million £ million £ million
Balance at 1 January 2014 24,424 10,477 4,088 38,989 – 347 39,336
Comprehensive income
Profit for the year – − 1,412 1,412 – 87 1,499
Other comprehensive income
Post-retirement defined benefit scheme remeasurements, net of tax – – 539 539 – – 539
Movements in revaluation reserve in respect of available-for-sale financial assets, net of tax – 548 – 548 – – 548 Movements in cash flow hedging reserve, net of tax – 2,194 – 2,194 – – 2,194 Currency translation differences (tax: nil) – (3) – (3) – – (3)
Total other comprehensive income – 2,739 539 3,278 – – 3,278
Total comprehensive income – 2,739 1,951 4,690 – 87 4,777
Transactions with owners
Dividends – − − − – (27) (27)
Distributions on other equity instruments, net of tax – – (225) (225) – – (225)Issue of ordinary shares 3 – – 3 – – 3
Issue of Additional Tier 1 securities – – (21) (21) 5,355 – 5,334 Movement in treasury shares – – (286) (286) – – (286)
Value of employee services:
Share option schemes – – 123 123 – – 123
Other employee award schemes – – 233 233 – – 233
Adjustment on sale of non-controlling interest in TSB – − (171) (171) – 805 634 Other changes in non-controlling interests – – – – – 1 1
Total transactions with owners 3 – (347) (344) 5,355 779 5,790
Balance at 31 December 2014 24,427 13,216 5,692 43,335 5,355 1,213 49,903

LLOYDS BANKING GROUP PLC 2015 FULL-YEAR RESULTS
Page 66 of 95
CONDENSED CONSOLIDATED FINANCIAL STATEMENTS (continued)
CONSOLIDATED CASH FLOW STATEMENT
2015 2014 £ million £ million
Profit before tax 1,644 1,762
Adjustments for:
Change in operating assets 34,700 (872)
Change in operating liabilities (11,985) 11,992
Non-cash and other items (7,808) (2,496)
Tax paid (179) (33)
Net cash provided by operating activities 16,372 10,353
Cash flows from investing activities
Purchase of financial assets (19,354) (11,533)
Proceeds from sale and maturity of financial assets 22,000 4,668
Purchase of fixed assets (3,417) (3,442)
Proceeds from sale of fixed assets 1,537 2,043
Acquisition of businesses, net of cash acquired (5) (1)
Disposal of businesses, net of cash disposed (4,071) 543
Net cash used in investing activities (3,310) (7,722)
Cash flows from financing activities
Dividends paid to ordinary shareholders (1,070) −
Distributions on other equity instruments (394) (287)
Dividends paid to non-controlling interests (52) (27)
Interest paid on subordinated liabilities (1,840) (2,205)
Proceeds from issue of subordinated liabilities 338 629
Proceeds from issue of ordinary shares − 3
Repayment of subordinated liabilities (3,199) (3,023)
Changes in non-controlling interests (41) 635
Net cash used in financing activities (6,258) (4,275)
Effects of exchange rate changes on cash and cash equivalents 2 (6)
Change in cash and cash equivalents 6,806 (1,650)
Cash and cash equivalents at beginning of year 65,147 66,797
Cash and cash equivalents at end of year 71,953 65,147
Cash and cash equivalents comprise cash and balances at central banks (excluding mandatory deposits) and amounts
due from banks with a maturity of less than three months.

LLOYDS BANKING GROUP PLC 2015 FULL-YEAR RESULTS
Page 67 of 95
1. Accounting policies, presentation and estimates
These condensed consolidated financial statements as at and for the year to 31 December 2015 have been prepared in
accordance with the Listing Rules of the Financial Conduct Authority (FCA) relating to Preliminary Announcements and
comprise the results of Lloyds Banking Group plc (the Company) together with its subsidiaries (the Group). They do not
include all of the information required for full annual financial statements. Copies of the 2015 Annual Report and
Accounts will be published on the Group’s website and will be available upon request from Investor Relations, Lloyds
Banking Group plc, 25 Gresham Street, London EC2V 7HN, in March 2016.
The British Bankers’ Association’s Code for Financial Reporting Disclosure (the Disclosure Code) sets out disclosure
principles together with supporting guidance in respect of the financial statements of UK banks. The Group has adopted
the Disclosure Code and these condensed consolidated financial statements have been prepared in compliance with the
Disclosure Code’s principles. Terminology used in these financial statements is consistent with that used in the Group’s
2014 Annual Report and Accounts where a glossary of terms can be found.
The accounting policies are consistent with those applied by the Group in its 2014 Annual Report and Accounts.
During the year to 31 December 2015, government debt securities with a carrying value of £19,938 million, previously
classified as available-for-sale, were reclassified to held-to-maturity. Unrealised gains on the transferred securities of
£194 million previously taken to equity continue to be held in the available-for-sale revaluation reserve and are being
amortised to the income statement over the remaining lives of the securities using the effective interest method or until
the assets become impaired.
Future accounting developments
Details of those IFRS pronouncements which will be relevant to the Group but which are not effective at 31 December
2015 and which have not been applied in preparing these financial statements are set out in note 21.
Critical accounting estimates and judgements
The preparation of the Group’s financial statements requires management to make judgements, estimates and
assumptions that impact the application of accounting policies and the reported amounts of assets, liabilities, income and
expenses. Due to the inherent uncertainty in making estimates, actual results reported in future periods may include
amounts which differ from those estimates. Estimates, judgements and assumptions are continually evaluated and are
based on historical experience and other factors, including expectations of future events that are believed to be
reasonable under the circumstances. There have been no significant changes in the basis upon which estimates have
been determined, compared to that applied at 31 December 2014.
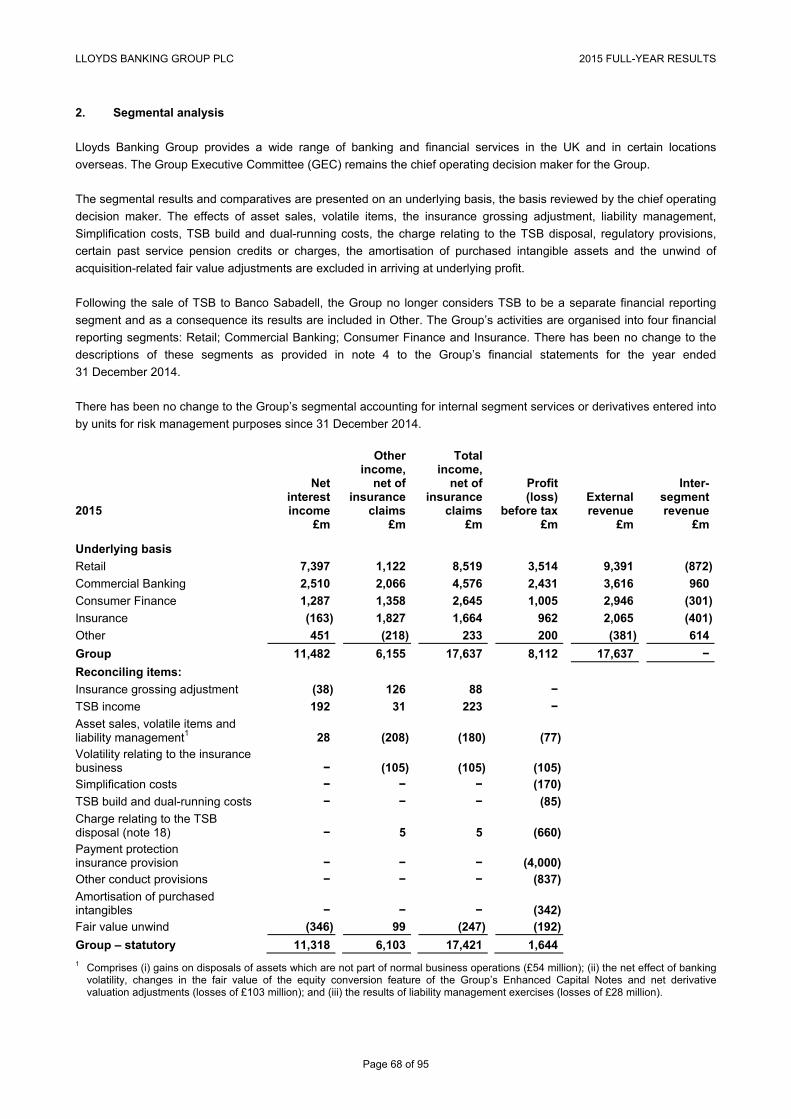
LLOYDS BANKING GROUP PLC 2015 FULL-YEAR RESULTS
Page 68 of 95
2. Segmental analysis
Lloyds Banking Group provides a wide range of banking and financial services in the UK and in certain locations
overseas. The Group Executive Committee (GEC) remains the chief operating decision maker for the Group.
The segmental results and comparatives are presented on an underlying basis, the basis reviewed by the chief operating
decision maker. The effects of asset sales, volatile items, the insurance grossing adjustment, liability management,
Simplification costs, TSB build and dual-running costs, the charge relating to the TSB disposal, regulatory provisions,
certain past service pension credits or charges, the amortisation of purchased intangible assets and the unwind of
acquisition-related fair value adjustments are excluded in arriving at underlying profit.
Following the sale of TSB to Banco Sabadell, the Group no longer considers TSB to be a separate financial reporting
segment and as a consequence its results are included in Other. The Group’s activities are organised into four financial
reporting segments: Retail; Commercial Banking; Consumer Finance and Insurance. There has been no change to the
descriptions of these segments as provided in note 4 to the Group’s financial statements for the year ended
31 December 2014.
There has been no change to the Group’s segmental accounting for internal segment services or derivatives entered into
by units for risk management purposes since 31 December 2014.
2015
Net interest income
Otherincome,
net of insurance
claims
Totalincome,
net of insurance
claims
Profit (loss)
before tax External revenue
Inter- segment revenue
£m £m £m £m £m £m Underlying basis
Retail 7,397 1,122 8,519 3,514 9,391 (872)
Commercial Banking 2,510 2,066 4,576 2,431 3,616 960
Consumer Finance 1,287 1,358 2,645 1,005 2,946 (301)
Insurance (163) 1,827 1,664 962 2,065 (401)
Other 451 (218) 233 200 (381) 614
Group 11,482 6,155 17,637 8,112 17,637 −
Reconciling items:
Insurance grossing adjustment (38) 126 88 −
TSB income 192 31 223 −
Asset sales, volatile items and liability management1 28 (208) (180) (77) Volatility relating to the insurance business − (105) (105) (105) Simplification costs − − − (170)
TSB build and dual-running costs − − − (85)
Charge relating to the TSB disposal (note 18) − 5 5 (660) Payment protection insurance provision − − − (4,000) Other conduct provisions − − − (837)
Amortisation of purchased intangibles − − − (342) Fair value unwind (346) 99 (247) (192)
Group – statutory 11,318 6,103 17,421 1,644 1 Comprises (i) gains on disposals of assets which are not part of normal business operations (£54 million); (ii) the net effect of banking
volatility, changes in the fair value of the equity conversion feature of the Group’s Enhanced Capital Notes and net derivativevaluation adjustments (losses of £103 million); and (iii) the results of liability management exercises (losses of £28 million).

LLOYDS BANKING GROUP PLC 2015 FULL-YEAR RESULTS
Page 69 of 95
2. Segmental analysis (continued)
2014
Net interest income
Other income,
net of insurance
claims
Total income,
net of insurance
claims
Profit (loss)
before tax External revenue
Inter- segment revenue
£m £m £m £m £m £m Underlying basis
Retail 7,079 1,212 8,291 3,228 9,034 (743)
Commercial Banking 2,480 1,956 4,436 2,206 3,800 636
Consumer Finance 1,290 1,364 2,654 1,010 2,803 (149)
Insurance (131) 1,725 1,594 922 1,206 388
Other 257 210 467 390 599 (132)
Group 10,975 6,467 17,442 7,756 17,442 –
Reconciling items:
Insurance grossing adjustment (482) 614 132 –
TSB income 786 140 926 −
Asset sales, volatile items and liability management1 7 (1,119) (1,112) (962) Volatility relating to the insurance business – (228) (228) (228) Simplification costs – (22) (22) (966)
TSB build and dual-running costs – – – (558)
Payment protection insurance provision – – – (2,200) Other conduct provisions – – – (925)
Past service credit2 – – – 710
Amortisation of purchased intangibles – – – (336) Fair value unwind (626) (113) (739) (529)
Group – statutory 10,660 5,739 16,399 1,762 1 Comprises (i) gains on disposals of assets which are not part of normal business operations (£138 million); (ii) the net effect of
banking volatility, changes in the fair value of the equity conversion feature of the Group’s Enhanced Capital Notes and net derivative valuation adjustments (gain of £286 million); and (iii) the results of liability management exercises (losses of £1,386 million).
2 This represents the curtailment credit of £843 million following the Group’s decision to reduce the cap on pensionable pay (see note 3) partly offset by the cost of other changes to the pay, benefits and reward offered to employees.
Segment external
assets Segment customer
deposits Segment external
liabilities
At 31 Dec
2015
At 31 Dec
2014
At31 Dec
2015
At 31 Dec
2014
At 31 Dec
2015
At 31 Dec
2014 £m £m £m £m £m £m
Retail 316,343 317,246 279,559 285,539 284,882 295,880
Commercial Banking 178,189 241,754 126,158 119,882 220,182 231,400
Consumer Finance 28,694 25,646 11,082 14,955 15,437 18,581
Insurance 143,217 150,615 − – 137,233 144,921
Other 140,245 119,635 1,527 26,691 101,974 114,211
Total Group 806,688 854,896 418,326 447,067 759,708 804,993
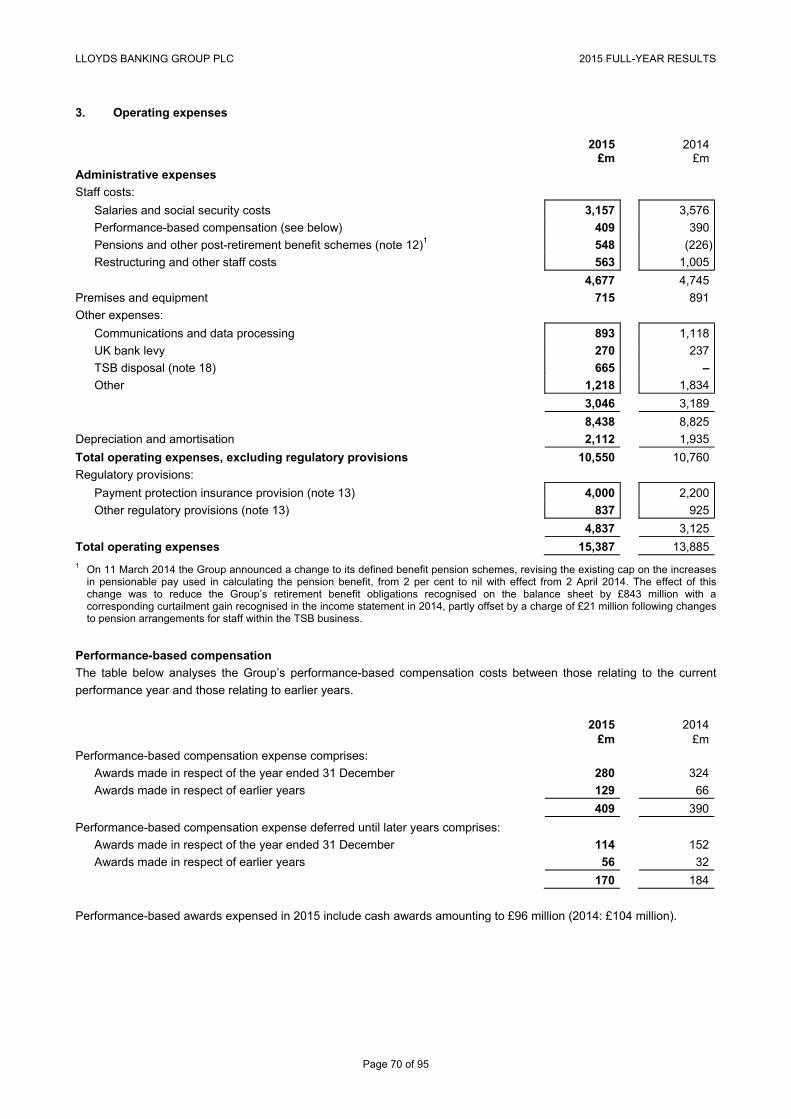
LLOYDS BANKING GROUP PLC 2015 FULL-YEAR RESULTS
Page 70 of 95
3. Operating expenses
2015 2014 £m £m Administrative expenses
Staff costs:
Salaries and social security costs 3,157 3,576
Performance-based compensation (see below) 409 390
Pensions and other post-retirement benefit schemes (note 12)1 548 (226)
Restructuring and other staff costs 563 1,005
4,677 4,745
Premises and equipment 715 891
Other expenses:
Communications and data processing 893 1,118
UK bank levy 270 237
TSB disposal (note 18) 665 –
Other 1,218 1,834
3,046 3,189
8,438 8,825
Depreciation and amortisation 2,112 1,935
Total operating expenses, excluding regulatory provisions 10,550 10,760
Regulatory provisions:
Payment protection insurance provision (note 13) 4,000 2,200
Other regulatory provisions (note 13) 837 925
4,837 3,125
Total operating expenses 15,387 13,885 1 On 11 March 2014 the Group announced a change to its defined benefit pension schemes, revising the existing cap on the increases
in pensionable pay used in calculating the pension benefit, from 2 per cent to nil with effect from 2 April 2014. The effect of thischange was to reduce the Group’s retirement benefit obligations recognised on the balance sheet by £843 million with acorresponding curtailment gain recognised in the income statement in 2014, partly offset by a charge of £21 million following changesto pension arrangements for staff within the TSB business.
Performance-based compensation
The table below analyses the Group’s performance-based compensation costs between those relating to the current
performance year and those relating to earlier years.
2015 2014 £m £m Performance-based compensation expense comprises:
Awards made in respect of the year ended 31 December 280 324
Awards made in respect of earlier years 129 66
409 390
Performance-based compensation expense deferred until later years comprises:
Awards made in respect of the year ended 31 December 114 152
Awards made in respect of earlier years 56 32
170 184
Performance-based awards expensed in 2015 include cash awards amounting to £96 million (2014: £104 million).
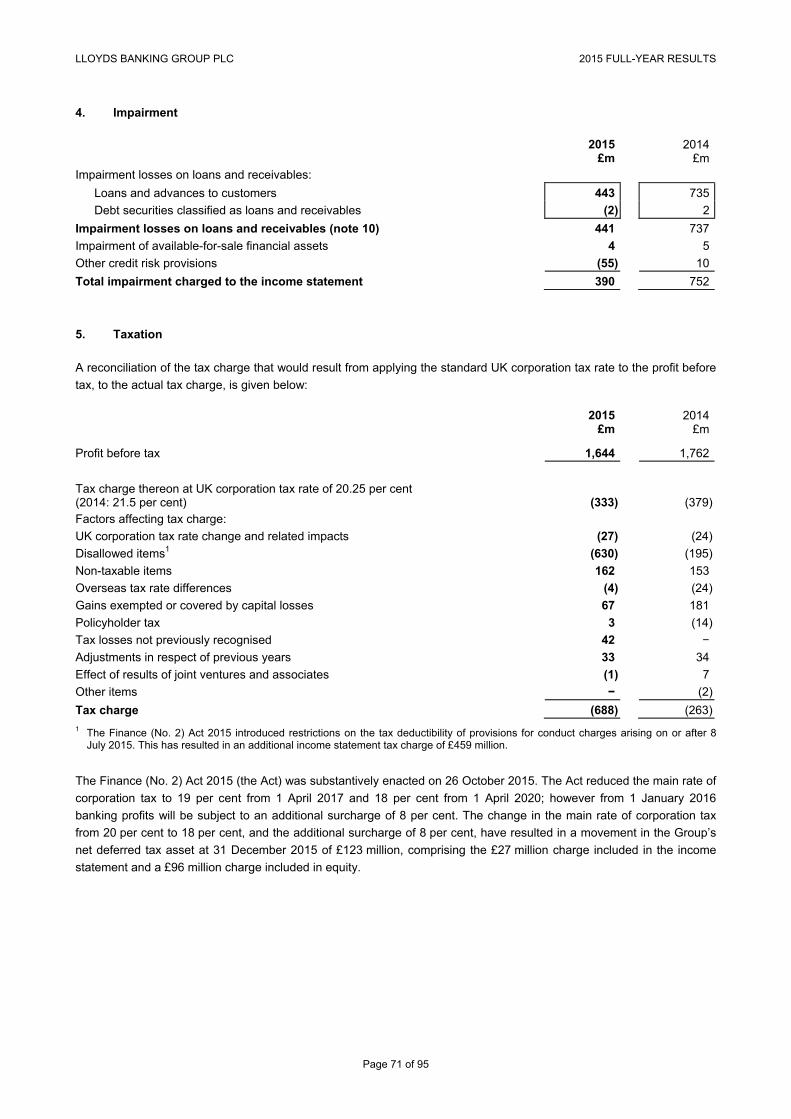
LLOYDS BANKING GROUP PLC 2015 FULL-YEAR RESULTS
Page 71 of 95
4. Impairment
2015 2014 £m £m Impairment losses on loans and receivables:
Loans and advances to customers 443 735
Debt securities classified as loans and receivables (2) 2
Impairment losses on loans and receivables (note 10) 441 737
Impairment of available-for-sale financial assets 4 5
Other credit risk provisions (55) 10
Total impairment charged to the income statement 390 752
5. Taxation
A reconciliation of the tax charge that would result from applying the standard UK corporation tax rate to the profit before
tax, to the actual tax charge, is given below: 2015 2014 £m £m
Profit before tax 1,644 1,762
Tax charge thereon at UK corporation tax rate of 20.25 per cent (2014: 21.5 per cent) (333) (379)Factors affecting tax charge:
UK corporation tax rate change and related impacts (27) (24)
Disallowed items1 (630) (195)
Non-taxable items 162 153
Overseas tax rate differences (4) (24)
Gains exempted or covered by capital losses 67 181
Policyholder tax 3 (14)
Tax losses not previously recognised 42 −
Adjustments in respect of previous years 33 34
Effect of results of joint ventures and associates (1) 7
Other items − (2)
Tax charge (688) (263) 1 The Finance (No. 2) Act 2015 introduced restrictions on the tax deductibility of provisions for conduct charges arising on or after 8
July 2015. This has resulted in an additional income statement tax charge of £459 million.
The Finance (No. 2) Act 2015 (the Act) was substantively enacted on 26 October 2015. The Act reduced the main rate of
corporation tax to 19 per cent from 1 April 2017 and 18 per cent from 1 April 2020; however from 1 January 2016
banking profits will be subject to an additional surcharge of 8 per cent. The change in the main rate of corporation tax
from 20 per cent to 18 per cent, and the additional surcharge of 8 per cent, have resulted in a movement in the Group’s
net deferred tax asset at 31 December 2015 of £123 million, comprising the £27 million charge included in the income
statement and a £96 million charge included in equity.

LLOYDS BANKING GROUP PLC 2015 FULL-YEAR RESULTS
Page 72 of 95
6. Earnings per share 2015 2014 £m £m Profit attributable to ordinary shareholders – basic and diluted 466 1,125
Tax credit on distributions to other equity holders 80 62
546 1,187 2015 2014 million million Weighted average number of ordinary shares in issue – basic 71,272 71,350
Adjustment for share options and awards 1,068 1,097
Weighted average number of ordinary shares in issue – diluted 72,340 72,447
Basic earnings per share 0.8p 1.7p
Diluted earnings per share 0.8p 1.6p
7. Trading and other financial assets at fair value through profit or loss
At 31 Dec
2015
At 31 Dec
2014 £m £m
Trading assets 42,661 48,494
Other financial assets at fair value through profit or loss:
Treasury and other bills 74 22
Debt securities 37,330 41,839
Equity shares 60,471 61,576
97,875 103,437
Total trading and other financial assets at fair value through profit or loss 140,536 151,931
Included in the above is £90,492 million (31 December 2014: £94,314 million) of assets relating to the insurance
businesses.

LLOYDS BANKING GROUP PLC 2015 FULL-YEAR RESULTS
Page 73 of 95
8. Derivative financial instruments
31 December 2015 31 December 2014
Fair valueof assets
Fair valueof liabilities
Fair value of assets
Fair value of liabilities
£m £m £m £m Hedging
Derivatives designated as fair value hedges 1,624 831 2,472 962
Derivatives designated as cash flow hedges 1,062 1,606 1,761 2,654
2,686 2,437 4,233 3,616
Trading and other
Exchange rate contracts 7,188 6,081 7,034 6,950
Interest rate contracts 17,458 16,231 22,506 20,374
Credit derivatives 295 407 279 1,066
Embedded equity conversion feature 545 − 646 −
Equity and other contracts 1,295 1,145 1,430 1,181
26,781 23,864 31,895 29,571
Total recognised derivative assets/liabilities 29,467 26,301 36,128 33,187
The embedded equity conversion feature of £545 million (31 December 2014: £646 million) reflects the value of the
equity conversion feature contained in the Enhanced Capital Notes issued by the Group in 2009; a loss of £101 million
arose from the change in fair value in 2015 (2014: gain of £401 million) and is included within net trading income (see
also note 20).
9. Loans and advances to customers
At 31 Dec
2015
At 31 Dec
2014 £m £m
Agriculture, forestry and fishing 6,924 6,586
Energy and water supply 3,247 3,853
Manufacturing 5,953 6,000
Construction 4,952 6,425
Transport, distribution and hotels 13,526 15,112
Postal and communications 2,563 2,624
Property companies 32,228 36,682
Financial, business and other services 43,072 44,979 Personal:
Mortgages 312,877 333,318
Other 20,579 23,123
Lease financing 2,751 3,013
Hire purchase 9,536 7,403
458,208 489,118
Allowance for impairment losses on loans and advances (note 10) (3,033) (6,414)
Total loans and advances to customers 455,175 482,704
Loans and advances to customers include advances securitised under the Group's securitisation and covered bond
programmes.

LLOYDS BANKING GROUP PLC 2015 FULL-YEAR RESULTS
Page 74 of 95
10. Allowance for impairment losses on loans and receivables
Year ended 31 Dec
2015
Year ended 31 Dec
2014 £m £m
Opening balance 6,540 12,091
Exchange and other adjustments (246) (401)
Adjustment on disposal of businesses (82) −
Advances written off (4,235) (6,442)
Recoveries of advances written off in previous years 768 681
Unwinding of discount (56) (126)
Charge to the income statement (note 4) 441 737
Balance at end of year 3,130 6,540 In respect of: Loans and advances to customers (note 9) 3,033 6,414
Debt securities 97 126
Balance at end of year 3,130 6,540
11. Debt securities in issue
31 December 2015 31 December 2014
At fair valuethrough profit or
loss
At amortised
cost Total
At fair value through profit or
loss
At amortised
cost Total £m £m £m £m £m £m
Medium-term notes issued 7,878 29,329 37,207 6,739 22,728 29,467
Covered bonds − 27,200 27,200 − 27,191 27,191
Certificates of deposit − 11,101 11,101 − 7,033 7,033
Securitisation notes − 7,763 7,763 − 11,908 11,908
Commercial paper − 6,663 6,663 − 7,373 7,373
7,878 82,056 89,934 6,739 76,233 82,972
The notes issued by the Group’s securitisation and covered bond programmes are held by external parties and by
subsidiaries of the Group.
Securitisation programmes
At 31 December 2015, external parties held £7,763 million (31 December 2014: £11,908 million) and the Group’s
subsidiaries held £29,303 million (31 December 2014: £38,149 million) of total securitisation notes in issue of
£37,066 million (31 December 2014: £50,057 million). The notes are secured on loans and advances to customers and
debt securities classified as loans and receivables amounting to £58,090 million (31 December 2014: £75,970 million), the
majority of which have been sold by subsidiary companies to bankruptcy remote structured entities. The structured
entities are consolidated fully and all of these loans are retained on the Group's balance sheet.
Covered bond programmes
At 31 December 2015, external parties held £27,200 million (31 December 2014: £27,191 million) and the Group’s
subsidiaries held £4,197 million (31 December 2014: £6,339 million) of total covered bonds in issue of £31,397 million
(31 December 2014: £33,530 million). The bonds are secured on certain loans and advances to customers that have
been assigned to bankruptcy remote limited liability partnerships. These loans are retained on the Group's balance
sheet.
Cash deposits of £8,383 million (31 December 2014: £11,251 million) held by the Group are restricted in use to repayment
of the debt securities issued by the structured entities, the term advances relating to covered bonds and other legal
obligations.

LLOYDS BANKING GROUP PLC 2015 FULL-YEAR RESULTS
Page 75 of 95
12. Post-retirement defined benefit schemes
The Group’s post-retirement defined benefit scheme obligations are comprised as follows:
At 31 Dec
2015
At 31 Dec
2014 £m £m Defined benefit pension schemes: - Fair value of scheme assets 37,639 38,133
- Present value of funded obligations (36,903) (37,243)
Net pension scheme asset 736 890
Other post-retirement schemes (200) (196)
Net retirement benefit asset 536 694
Recognised on the balance sheet as: Retirement benefit assets 901 1,147
Retirement benefit obligations (365) (453)
Net retirement benefit asset 536 694
The movement in the Group’s net post-retirement defined benefit scheme asset during the year was as follows: £m
At 1 January 2015 694
Exchange and other adjustments (2)
Income statement charge (315)
Employer contributions 433
Remeasurement (274)
At 31 December 2015 536
The charge to the income statement in respect of pensions and other post-retirement benefit schemes is comprised as
follows: 2015 2014 £m £m Past service credit (note 3) − (822)
Current service cost 315 344
Defined benefit pension schemes 315 (478)
Defined contribution schemes 233 252
Total charge to the income statement (note 3) 548 (226)
The principal assumptions used in the valuations of the defined benefit pension scheme were as follows:
At 31 Dec
2015
At 31 Dec
2014 % %
Discount rate 3.87 3.67 Rate of inflation:
Retail Prices Index 2.99 2.95
Consumer Price Index 1.99 1.95
Rate of salary increases 0.00 0.00
Weighted-average rate of increase for pensions in payment 2.58 2.59
The application of the revised assumptions as at 31 December 2015 to the Group’s principal post-retirement defined benefit
schemes has resulted in a remeasurement loss of £274 million which has been recognised in other comprehensive income,
net of deferred tax of £59 million.

LLOYDS BANKING GROUP PLC 2015 FULL-YEAR RESULTS
Page 76 of 95
13. Provisions for liabilities and charges
Payment protection insurance
The Group increased the provision for PPI costs by a further £4,000 million in 2015, bringing the total amount provided to
£16,025 million. This included an additional £2,100 million in the fourth quarter, largely to reflect the impact of our
interpretation of the proposals contained within the Financial Conduct Authority’s (FCA) consultation paper regarding a
potential time bar and the Plevin case. As at 31 December 2015, £3,458 million or 22 per cent of the total provision,
remained unutilised with £2,950 million relating to reactive complaints and associated administration costs.
The volume of reactive PPI complaints has continued to fall, with an 8 per cent reduction in 2015 compared with 2014, to
approximately 8,000 complaints per week. Whilst direct customer complaint levels fell 30 per cent year-on-year, those
from Claims Management Companies (CMCs) have remained broadly stable and as a result, CMCs now account for
over 70 per cent of complaints.
On 26 November 2015, the FCA published a consultation paper (CP15/39: Rules and guidance on payment protection
insurance complaints) proposing (i) the introduction of a deadline by which consumers would need to make their PPI
complaints including an FCA led communications campaign, and (ii) rules and guidance about how firms should handle
PPI complaints in light of the Supreme Court’s decision in Plevin v Paragon Personal Finance Limited [2014] UKSC
61 (Plevin).
Based on recent trends, and in light of the proposals from the FCA, the Group now expects a higher level of complaints
than previously assumed including those related to Plevin. As a result the Group has increased the total expected
reactive complaint volumes to 4.7 million with approximately 1.3 million still expected to be received. This is equivalent to
approximately 10,000 net complaints per week on average through to the proposed time bar of mid-2018.
Monthly complaints trends could vary significantly throughout this period, given they are likely to be impacted by a
number of factors including the potential impact of the FCA’s proposed communication campaign as well as changes in
the regulation of CMCs.
The provision includes an estimate to cover redress that would be payable under the FCA’s proposed new rules and
guidance in light of Plevin.
Quarter
Average monthlyreactive complaint
volume Quarter on quarter
% Year on year
%
Q1 2013 61,259 (28%)
Q2 2013 54,086 (12%)
Q3 2013 49,555 (8%)
Q4 2013 37,457 (24%)
Q1 2014 42,259 13% (31%)
Q2 2014 39,426 (7%) (27%)
Q3 2014 40,624 3% (18%)
Q4 2014 35,910 (12%) (4%)
Q1 2015 37,791 5% (11%)
Q2 2015 36,957 (2%) (6%)
Q3 2015 37,586 2% (7%)
Q4 2015 33,998 (10%) (5%)

LLOYDS BANKING GROUP PLC 2015 FULL-YEAR RESULTS
Page 77 of 95
13. Provisions for liabilities and charges (continued)
The Group continues to progress the re-review of previously handled cases and expects this to be substantially complete
by the end of the first quarter of 2016. During the year the scope has been extended by 0.5 million to 1.7 million cases
relating largely to previously redressed cases, in addition to which, higher overturn rates and average redress have been
experienced. At the end of January 2016, 77 per cent of cases had been reviewed and 77 per cent of all cash payments
made.
The Group has completed its Past Business Review (PBR) where it has been identified that there was a risk of potential
mis-sale for certain customers, albeit monitoring continues. No further change has been made to the amount provided.
The Group expects to maintain the PPI operation on its current scale for longer than previously anticipated given the
update to volume related assumptions and the re-review of previously handled cases continuing into the first quarter of
2016. The estimate for administrative expenses, which comprise complaint handling costs and costs arising from cases
subsequently referred to the FOS, is included in the provision increase outlined above.
Sensitivities
The Group estimates that it has sold approximately 16 million policies since 2000. These include policies that were not
mis-sold. Since the commencement of the PPI redress programme in 2011 the Group estimates that it has contacted,
settled or provided for almost 49 per cent of the policies sold since 2000, covering both customer-initiated complaints and
actual and PBR mailings undertaken by the Group.
The total amount provided for PPI represents the Group’s best estimate of the likely future cost. However a number of
risks and uncertainties remain in particular with respect to future volumes. The cost could differ materially from the
Group’s estimates and the assumptions underpinning them, and could result in a further provision being required. There
is significant uncertainty around the impact of the proposed FCA media campaign and CMC and customer activity in the
lead up to the proposed time bar.
Key metrics and sensitivities are highlighted in the table below:
Sensitivities1
To date unless
noted Future
Sensitivity
Customer initiated complaints since origination (m)2 3.4 1.3 0.1 = £200m
Average uphold rate per policy3 76% 89% 1% = £35m
Average redress per upheld policy4 £1,810 £1,400 £100 = £170m
Administrative expenses (£m) 2,710 665 1 case = £450 1 All sensitivities exclude claims where no PPI policy was held. 2 Sensitivity includes complaint handling costs. Future volume includes complaints falling into the Plevin rules and guidance. As a
result, the sensitivity per 100,000 complaints includes cases where the average redress would be lower than historical trends. 3 The percentage of complaints where the Group finds in favour of the customer excluding PBR. The 76 per cent uphold rate per policy
is based on the six months to 31 December 2015. Future uphold rate and sensitivities are influenced by a proportion of complaintsfalling under the Plevin rules and guidance which would otherwise be defended.
4 The amount that is paid in redress in relation to a policy found to have been mis-sold, comprising, where applicable, the refund ofpremium, compound interest charged and interest at 8 per cent per annum. Actuals are based on the six months to 31 December2015. Future average redress is influenced by expected compensation payments for complaints falling under the Plevin rules andguidance.

LLOYDS BANKING GROUP PLC 2015 FULL-YEAR RESULTS
Page 78 of 95
13. Provisions for liabilities and charges (continued)
Other regulatory provisions
Customer claims in relation to insurance branch business in Germany
The Group has received a number of claims from customers relating to policies issued by Clerical Medical Investment
Group Limited (recently renamed Scottish Widows Limited) but sold by independent intermediaries in Germany,
principally during the late 1990s and early 2000s. Following decisions in July 2012 from the Federal Court of Justice
(FCJ) in Germany the Group recognised provisions totalling £520 million during the period to 31 December 2014. Recent
experience has been slightly adverse to expectations and the Group has noted decisions of the FCJ in 2014 and 2015
involving German insurers in relation to a German industry-wide issue regarding notification of contractual ‘cooling off’
periods. Accordingly, a provision increase of £25 million has been recognised giving a total provision of £545 million. The
remaining unutilised provision as at 31 December 2015 is £124 million (31 December 2014: £199 million).
The validity of the claims facing the Group depends upon the facts and circumstances in respect of each claim. As a
result the ultimate financial effect, which could be significantly different from the current provision, will only be known
once all relevant claims have been resolved.
Interest rate hedging products
In June 2012, a number of banks, including the Group, reached agreement with the FSA (now FCA) to carry out a review
of sales made since 1 December 2001 of interest rate hedging products (IRHP) to certain small and medium-sized
businesses. As at 31 December 2015 the Group had identified 1,735 sales of IRHPs to customers within scope of the
agreement with the FCA which have opted in and are being reviewed and, where appropriate, redressed. The Group
agreed that it would provide redress to any in-scope customers where appropriate. The Group continues to review the
remaining cases within the scope of the agreement with the FCA and has met all of the regulator’s requirements to date.
During 2015, the Group has charged a further £40 million in respect of redress and related administration costs,
increasing the total amount provided for redress and related administration costs for in-scope customers to £720 million
(31 December 2014: £680 million). As at 31 December 2015, the Group has utilised £652 million (31 December 2014:
£571 million), with £68 million (31 December 2014: £109 million) of the provision remaining.
FCA review of complaint handling
On 5 June 2015 the FCA announced a settlement with the Group totalling £117 million following its investigation into
aspects of the Group’s PPI complaint handling process during the period March 2012 to May 2013. The FCA did not find
that the Group acted deliberately. The Group has reviewed all customer complaints fully defended during the Relevant
Period. The remediation costs of reviewing these affected cases are not materially in excess of existing provisions.
Other legal actions and regulatory matters
In the course of its business, the Group is engaged in discussions with the PRA, FCA and other UK and overseas
regulators and other governmental authorities on a range of matters. The Group also receives complaints and claims
from customers in connection with its past conduct and, where significant, provisions are held against the costs expected
to be incurred as a result of the conclusions reached. During 2015, the Group charged an additional £655 million (2014:
£430 million), including £225 million (2014: £nil) in response to complaints concerning packaged bank accounts and
£282 million (2014: £318 million) in respect of other matters within the Retail division. In addition, the Group has charged
a further £148 million (2014: £112 million) in respect of a number of product rectifications primarily in Insurance and
Commercial Banking.
At 31 December 2015, provisions for other legal actions and regulatory matters of £813 million (31 December 2014:
£521 million) remained unutilised, principally in relation to the sale of bancassurance products and packaged bank
accounts and other Retail provisions.
LLOYDS BANKING GROUP PLC 2015 FULL-YEAR RESULTS
Page 79 of 95
14. Contingent liabilities and commitments
Interchange fees
With respect to multi-lateral interchange fees (MIFs), the Group is not directly involved in the on-going investigations and
litigation (as described below) which involve card schemes such as Visa and MasterCard. However, the Group is a
member of Visa and MasterCard and other card schemes.
− The European Commission continues to pursue certain competition investigations into MasterCard and Visa probing,
amongst other things, MIFs paid in respect of cards issued outside the EEA;
− Litigation continues in the English Courts against both Visa and MasterCard. This litigation has been brought by
several retailers who are seeking damages for allegedly ‘overpaid’ MIFs. From publicly available information, it is
understood these damages claims are running to different timescales with respect to the litigation process, and their
outcome remains uncertain. It is also possible that new claims may be issued.
On 2 November 2015, Visa Inc announced its proposed acquisition of Visa Europe, which remains subject to completion.
As set out in the announcement by the Group on 2 November, the Group’s share of the sale proceeds will comprise
upfront consideration of cash (the amount of which remains subject to adjustment prior to completion) and preferred
stock. The preferred stock will be convertible into Class A Common Stock of Visa Inc or its equivalent upon occurrence of
certain events. As part of this transaction, the Group and certain other UK banks also entered into a Loss Sharing
Agreement (LSA) with Visa Inc, which clarifies how liabilities will be allocated between the parties should the litigation
referred to above result in Visa Inc being liable for damages payable by Visa Europe. Visa Inc may only have recourse to
the LSA once €1 billion of damages have been applied to the value of the UK preferred stock received by Visa UK
members (including the Group) as part of the consideration to the transaction. The value of the preferred stock will be
reduced (by making a downward adjustment to the conversion rate) in an amount equal to any covered losses. The
maximum amount of liability to which the Group may be subject under the LSA is capped at the cash consideration to be
received by the Group. Visa Inc may also have recourse to a general indemnity, currently in place under Visa Europe’s
Operating Regulations, for damages claims concerning inter or intra-regional MIF setting activities.
The ultimate impact on the Group of the above investigations and the litigation against Visa and MasterCard cannot be
known before the conclusion of these matters.
LIBOR and other trading rates
In July 2014, the Group announced that it had reached settlements totalling £217 million (at 30 June 2014 exchange
rates) to resolve with UK and US federal authorities legacy issues regarding the manipulation several years ago of Group
companies’ submissions to the British Bankers’ Association (BBA) London Interbank Offered Rate (LIBOR) and Sterling
Repo Rate. The Group continues to cooperate with various other government and regulatory authorities, including the
Serious Fraud Office, the Swiss Competition Commission, and a number of US State Attorneys General, in conjunction
with their investigations into submissions made by panel members to the bodies that set LIBOR and various other
interbank offered rates.
Certain Group companies, together with other panel banks, have also been named as defendants in private lawsuits,
including purported class action suits, in the US in connection with their roles as panel banks contributing to the setting of
US Dollar, Japanese Yen and Sterling LIBOR. The lawsuits, which contain broadly similar allegations, allege violations of
the Sherman Antitrust Act, the Racketeer Influenced and Corrupt Organizations Act and the Commodity Exchange Act,
as well as various state statutes and common law doctrines. Certain of the plaintiffs’ claims, including those asserted
under US anti-trust laws, have been dismissed by the US Federal Court for Southern District of New York (the District
Court). That court’s dismissal of plaintiffs’ anti-trust claims has been appealed to the New York Federal Court of Appeal.
The OTC and Exchange – Based plaintiffs’ claims were dismissed in November 2015 for lack of personal jurisdiction
against the Group.

LLOYDS BANKING GROUP PLC 2015 FULL-YEAR RESULTS
Page 80 of 95
14. Contingent liabilities and commitments (continued)
Certain Group companies are also named as defendants in UK based claims raising LIBOR manipulation allegations in
connection with interest rate hedging products.
It is currently not possible to predict the scope and ultimate outcome on the Group of the various outstanding regulatory
investigations not encompassed by the settlements, any private lawsuits or any related challenges to the interpretation or
validity of any of the Group’s contractual arrangements, including their timing and scale.
UK shareholder litigation
In August 2014, the Group and a number of former directors were named as defendants in a claim filed in the English
High Court by a number of claimants who held shares in Lloyds TSB Group plc (LTSB) prior to the acquisition of HBOS
plc, alleging breaches of fiduciary and tortious duties in relation to information provided to shareholders in connection
with the acquisition and the recapitalisation of LTSB. It is currently not possible to determine the ultimate impact on the
Group (if any), but the Group intends to defend the claim vigorously.
Financial Services Compensation Scheme
The Financial Services Compensation Scheme (FSCS) is the UK’s independent statutory compensation fund of last
resort for customers of authorised financial services firms and pays compensation if a firm is unable or likely to be unable
to pay claims against it. The FSCS is funded by levies on the authorised financial services industry. Each deposit-taking
institution contributes towards the FSCS levies in proportion to their share of total protected deposits on 31 December of
the year preceding the scheme year, which runs from 1 April to 31 March.
Following the default of a number of deposit takers in 2008, the FSCS borrowed funds from HM Treasury to meet the
compensation costs for customers of those firms. At 31 March 2015, the end of the latest FSCS scheme year, the
principal balance outstanding on these loans was £15,797 million (31 March 2014: £16,591 million). Although the
substantial majority of this loan will be repaid from funds the FSCS receives from asset sales, surplus cash flow or other
recoveries in relation to the assets of the firms that defaulted, any shortfall will be funded by deposit-taking participants
of the FSCS. The amount of future levies payable by the Group depends on a number of factors including the amounts
recovered by the FSCS from asset sales, the Group’s participation in the deposit-taking market at 31 December, the
level of protected deposits and the population of deposit-taking participants.
Tax authorities
The Group provides for potential tax liabilities that may arise on the basis of the amounts expected to be paid to tax
authorities including open matters where Her Majesty's Revenue and Customs (HMRC) adopt a different interpretation
and application of tax law. The Group has an open matter in relation to a claim for group relief of losses incurred in its
former Irish banking subsidiary, which ceased trading on 31 December 2010. In 2013 HMRC informed the Group that
their interpretation of the UK rules, permitting the offset of such losses, denies the claim; if HMRC’s position is found to
be correct management estimate that this would result in an increase in current tax liabilities of approximately
£600 million and a reduction in the Group’s deferred tax asset of approximately £400 million. The Group does not agree
with HMRC's position and, having taken appropriate advice, does not consider that this is a case where additional tax will
ultimately fall due. There are a number of other open matters on which the Group is in discussion with HMRC; none of
these is expected to have a material impact on the financial position of the Group.
Residential mortgage repossessions
In August 2014, the Northern Ireland High Court handed down judgment in favour of the borrowers in relation to three
residential mortgage test cases, concerning certain aspects of the Group’s practice with respect to the recalculation of
contractual monthly instalments of customers in arrears. The FCA has indicated that it will issue a Consultation Paper in
relation to industry practice in this area in February 2016. The Group will respond as appropriate to this and any
investigations, proceedings, or regulatory action that may in due course be instigated as a result of these issues.
LLOYDS BANKING GROUP PLC 2015 FULL-YEAR RESULTS
Page 81 of 95
14. Contingent liabilities and commitments (continued)
The Financial Conduct Authority’s announcement on time-barring for PPI complaints and Plevin v Paragon
Personal Finance Limited
On 26 November 2015 the FCA issued a Consultation Paper on the introduction of a deadline by which consumers
would need to make their PPI complaints or else lose their right to have them assessed by firms or the Financial
Ombudsman Service, and proposed rules and guidance concerning the handling of PPI complaints in light of the
Supreme Court’s decision in Plevin v Paragon Personal Finance Limited [2014] UKSC 61 (Plevin). The Financial
Ombudsman Service is also considering the implications of Plevin for PPI complaints. The implications of potential
time-barring and the Plevin decision in terms of the scope of any court proceedings or regulatory action remain uncertain.
Other legal actions and regulatory matters
In addition, during the ordinary course of business the Group is subject to other complaints and threatened or actual legal
proceedings (including class or group action claims) brought by or on behalf of current or former employees, customers,
investors or other third parties, as well as legal and regulatory reviews, challenges, investigations and enforcement
actions, both in the UK and overseas. All such material matters are periodically reassessed, with the assistance of
external professional advisers where appropriate, to determine the likelihood of the Group incurring a liability. In those
instances where it is concluded that it is more likely than not that a payment will be made, a provision is established to
management's best estimate of the amount required at the relevant balance sheet date. In some cases it will not be
possible to form a view, for example because the facts are unclear or because further time is needed properly to assess
the merits of the case, and no provisions are held in relation to such matters. However the Group does not currently
expect the final outcome of any such case to have a material adverse effect on its financial position, operations or cash
flows.
Contingent liabilities and commitments arising from the banking business
At 31 Dec
2015
At 31 Dec
2014 £m £m Contingent liabilities
Acceptances and endorsements 52 59
Other:
Other items serving as direct credit substitutes 458 330
Performance bonds and other transaction-related contingencies 2,123 2,293
2,581 2,623
Total contingent liabilities 2,633 2,682
Commitments
Documentary credits and other short-term trade-related transactions − 101
Forward asset purchases and forward deposits placed 421 162
Undrawn formal standby facilities, credit lines and other commitments to lend:
Less than 1 year original maturity:
Mortgage offers made 9,995 8,809
Other commitments 57,809 64,015
67,804 72,824
1 year or over original maturity 44,691 34,455
Total commitments 112,916 107,542
Of the amounts shown above in respect of undrawn formal standby facilities, credit lines and other commitments to lend,
£63,086 million (31 December 2014: £55,029 million) was irrevocable.

LLOYDS BANKING GROUP PLC 2015 FULL-YEAR RESULTS
Page 82 of 95
15. Fair values of financial assets and liabilities
The valuations of financial instruments have been classified into three levels according to the quality and reliability of
information used to determine those fair values. Note 51 to the Group’s 2014 financial statements describes the
definitions of the three levels in the fair value hierarchy.
Valuation control framework Key elements of the valuation control framework, which covers processes for all levels in the fair value hierarchy including level 3 portfolios, include model validation (incorporating pre-trade and post-trade testing), product implementation review and independent price verification. Formal committees meet quarterly to discuss and approve valuations in more judgemental areas. Transfers into and out of level 3 portfolios Transfers out of level 3 portfolios arise when inputs that could have a significant impact on the instrument’s valuation become market observable; conversely, transfers into the portfolios arise when consistent sources of data cease to be available.
Valuation methodology For level 2 and level 3 portfolios, there is no significant change to what was disclosed in the Group’s 2014 Annual Report and Accounts in respect of the valuation methodology (techniques and inputs) applied to such portfolios. The table below summarises the carrying values of financial assets and liabilities presented on the Group’s balance sheet. The fair values presented in the table are at a specific date and may be significantly different from the amounts which will actually be paid or received on the maturity or settlement date.
31 December 2015 31 December 2014
Carrying
value Fair
value Carrying
value Fair
value £m £m £m £m Financial assets
Trading and other financial assets at fair value through profit or loss 140,536 140,536 151,931 151,931 Derivative financial instruments 29,467 29,467 36,128 36,128
Loans and receivables:
Loans and advances to banks 25,117 25,130 26,155 26,031
Loans and advances to customers 455,175 454,797 482,704 480,631
Debt securities 4,191 4,107 1,213 1,100
Available-for-sale financial instruments 33,032 33,032 56,493 56,493
Held-to-maturity investments 19,808 19,851 − −
Financial liabilities
Deposits from banks 16,925 16,934 10,887 10,902
Customer deposits 418,326 418,512 447,067 450,038
Trading and other financial liabilities at fair value through profit or loss 51,863 51,863 62,102 62,102 Derivative financial instruments 26,301 26,301 33,187 33,187
Debt securities in issue 82,056 85,093 76,233 80,244
Liabilities arising from non-participating investment contracts 22,777 22,777 27,248 27,248 Financial guarantees 48 48 51 51
Subordinated liabilities 23,312 26,818 26,042 30,175 The carrying amount of the following financial instruments is a reasonable approximation of fair value: cash and balances at central banks, items in the course of collection from banks, items in course of transmission to banks and notes in circulation.
LLOYDS BANKING GROUP PLC 2015 FULL-YEAR RESULTS
Page 83 of 95
15. Fair values of financial assets and liabilities (continued) The Group manages valuation adjustments for its derivative exposures on a net basis; the Group determines their fair values on the basis of their net exposures. In all other cases, fair values of financial assets and liabilities measured at fair value are determined on the basis of their gross exposures.
The following tables provide an analysis of the financial assets and liabilities of the Group that are carried at fair value in
the Group’s consolidated balance sheet, grouped into levels 1 to 3 based on the degree to which the fair value is
observable.
Financial assets Level 1 Level 2 Level 3 Total £m £m £m £mAt 31 December 2015
Trading and other financial assets at fair value through profit or loss: Loans and advances to customers − 30,109 − 30,109
Loans and advances to banks − 3,065 − 3,065
Debt securities 20,919 22,504 3,389 46,812
Equity shares 58,457 292 1,727 60,476
Treasury and other bills 74 − − 74
Total trading and other financial assets at fair value through profit or loss 79,450 55,970 5,116 140,536
Available-for-sale financial assets:
Debt securities 25,266 6,518 55 31,839
Equity shares 43 521 629 1,193
Total available-for-sale financial assets 25,309 7,039 684 33,032
Derivative financial instruments 43 27,955 1,469 29,467
Total financial assets carried at fair value 104,802 90,964 7,269 203,035
At 31 December 2014
Trading and other financial assets at fair value through profit or loss: Loans and advances to customers − 28,513 − 28,513
Loans and advances to banks − 8,212 − 8,212
Debt securities 24,230 24,484 3,457 52,171
Equity shares 59,607 322 1,647 61,576
Treasury and other bills 1,459 − − 1,459
Total trading and other financial assets at fair value through profit or loss 85,296 61,531 5,104 151,931
Available-for-sale financial assets:
Debt securities 47,437 7,151 − 54,588
Equity shares 45 727 270 1,042
Treasury and other bills 852 11 − 863
Total available-for-sale financial assets 48,334 7,889 270 56,493
Derivative financial instruments 94 33,263 2,771 36,128
Total financial assets carried at fair value 133,724 102,683 8,145 244,552
LLOYDS BANKING GROUP PLC 2015 FULL-YEAR RESULTS
Page 84 of 95
15. Fair values of financial assets and liabilities (continued)
Financial liabilities Level 1 Level 2 Level 3 Total £m £m £m £mAt 31 December 2015 Trading and other financial liabilities at fair value through profit or loss: Liabilities held at fair value through profit or loss − 7,878 1 7,879
Trading liabilities 4,153 39,831 − 43,984
Total trading and other financial liabilities at fair value through profit or loss 4,153 47,709 1 51,863
Derivative financial instruments 41 25,537 723 26,301
Financial guarantees − − 48 48
Total financial liabilities carried at fair value 4,194 73,246 772 78,212
At 31 December 2014
Trading and other financial liabilities at fair value through profit or loss: Liabilities held at fair value through profit or loss − 6,739 5 6,744
Trading liabilities 2,700 52,658 − 55,358
Total trading and other financial liabilities at fair value through profit or loss 2,700 59,397 5 62,102
Derivative financial instruments 68 31,663 1,456 33,187
Financial guarantees − − 51 51
Total financial liabilities carried at fair value 2,768 91,060 1,512 95,340
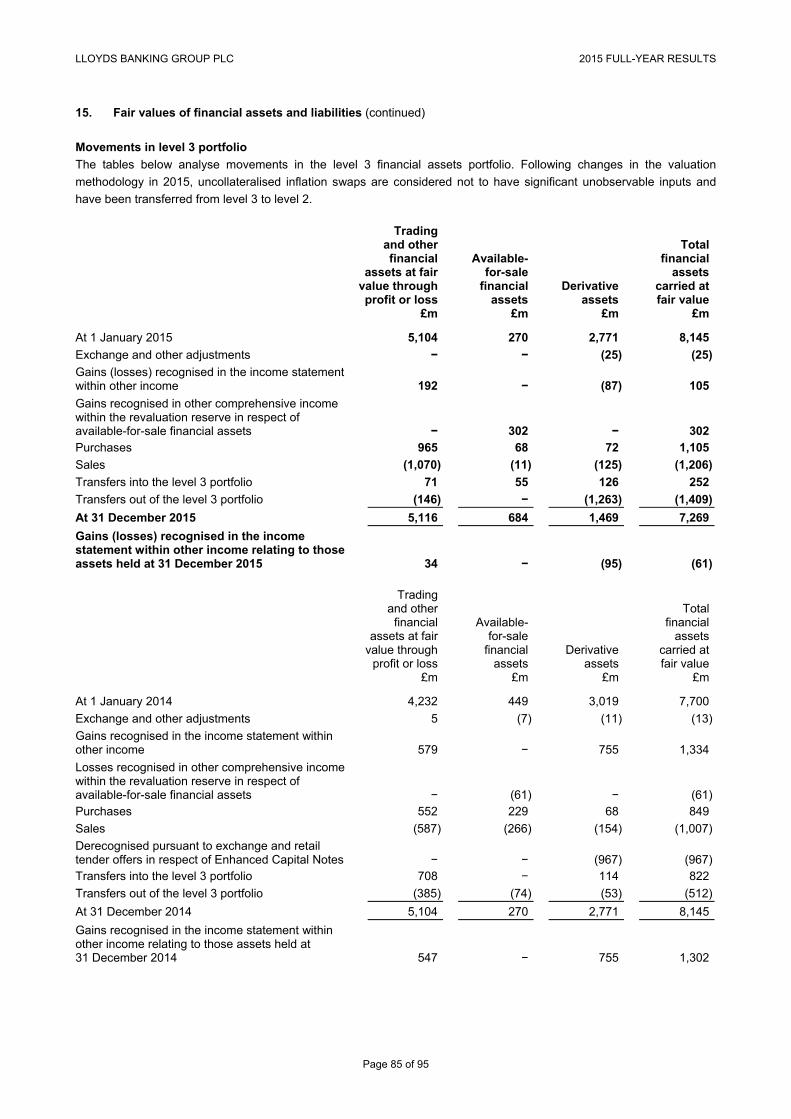
LLOYDS BANKING GROUP PLC 2015 FULL-YEAR RESULTS
Page 85 of 95
15. Fair values of financial assets and liabilities (continued)
Movements in level 3 portfolio
The tables below analyse movements in the level 3 financial assets portfolio. Following changes in the valuation
methodology in 2015, uncollateralised inflation swaps are considered not to have significant unobservable inputs and
have been transferred from level 3 to level 2.
Tradingand other financial
assets at fair value through profit or loss
Available- for-sale
financial assets
Derivative assets
Total financial
assets carried at fair value
£m £m £m £m
At 1 January 2015 5,104 270 2,771 8,145
Exchange and other adjustments − − (25) (25)
Gains (losses) recognised in the income statement within other income 192 − (87) 105
Gains recognised in other comprehensive income within the revaluation reserve in respect of available-for-sale financial assets − 302 − 302 Purchases 965 68 72 1,105
Sales (1,070) (11) (125) (1,206)
Transfers into the level 3 portfolio 71 55 126 252
Transfers out of the level 3 portfolio (146) − (1,263) (1,409)
At 31 December 2015 5,116 684 1,469 7,269
Gains (losses) recognised in the income statement within other income relating to those assets held at 31 December 2015 34 − (95) (61)
Trading and other
financial assets at fair
value through profit or loss
Available- for-sale
financial assets
Derivative assets
Total financial
assets carried at fair value
£m £m £m £m
At 1 January 2014 4,232 449 3,019 7,700
Exchange and other adjustments 5 (7) (11) (13)
Gains recognised in the income statement within other income 579 − 755 1,334
Losses recognised in other comprehensive income within the revaluation reserve in respect of available-for-sale financial assets − (61) − (61)Purchases 552 229 68 849
Sales (587) (266) (154) (1,007)
Derecognised pursuant to exchange and retail tender offers in respect of Enhanced Capital Notes − − (967) (967)Transfers into the level 3 portfolio 708 − 114 822
Transfers out of the level 3 portfolio (385) (74) (53) (512)
At 31 December 2014 5,104 270 2,771 8,145
Gains recognised in the income statement within other income relating to those assets held at 31 December 2014 547 − 755 1,302

LLOYDS BANKING GROUP PLC 2015 FULL-YEAR RESULTS
Page 86 of 95
15. Fair values of financial assets and liabilities (continued)
The tables below analyse movements in the level 3 financial liabilities portfolio.
Trading andother financial
liabilities at fair value
through profit or loss
Derivative liabilities
Financial guarantees
Total financial liabilities carried at fair value
£m £m £m £m
At 1 January 2015 5 1,456 51 1,512
Exchange and other adjustments − (18) − (18)
Losses (gains) recognised in the income statement within other income − 36 (3) 33 Additions − 74 − 74 Redemptions (4) (120) − (124)
Transfers into the level 3 portfolio − 114 − 114
Transfers out of the level 3 portfolio − (819) − (819)
At 31 December 2015 1 723 48 772
Losses (gains) recognised in the income statement within other income relating to those liabilities held at 31 December 2015 − 12 (3) 9
Trading and other financial
liabilities at fair value
through profit or loss
Derivative liabilities
Financial guarantees
Total financial liabilities
carried at fair value
£m £m £m £m
At 1 January 2014 39 986 50 1,075
Exchange and other adjustments − (4) − (4)
(Gains) losses recognised in the income statement within other income (5) 375 1 371 Additions − 59 − 59 Redemptions (29) (66) − (95)
Transfers into the level 3 portfolio − 110 − 110
Transfers out of the level 3 portfolio − (4) − (4)
At 31 December 2014 5 1,456 51 1,512 Losses recognised in the income statement within other income relating to those liabilities held at 31 December 2014 − 376 1 377

LLOYDS BANKING GROUP PLC 2015 FULL-YEAR RESULTS
Page 87 of 95
15. Fair values of financial assets and liabilities (continued)
The tables below set out the effects of reasonably possible alternative assumptions for categories of level 3 financial
assets and financial liabilities.
At 31 December 2015
Effect of reasonably possible alternative
assumptions1
Valuation technique(s)
Significant unobservable inputs Range2
Carrying value
Favourable changes
Unfavourable changes
£m £m £mTrading and other financial assets at fair value through profit or loss: Equity and venture capital investments
Market approach Earnings multiple 1.0/17.5 2,279 72 (72)
Unlisted equities and debt securities, property partnerships in the life funds
Underlying asset/net asset value (incl. property prices)3
n/a n/a
2,538 − (48)
Other 299
5,116
Available for sale financial assets 684
Derivative financial assets: Embedded equity conversion feature
Lead manager or broker quote
Equity conversion feature spread 171/386 545 14 (14)
Interest rate derivatives
Option pricing model
Interest rate volatility 1%/63% 924 20 (19)
1,469
Financial assets carried at fair value 7,269
Trading and other financial liabilities at fair value through profit or loss 1
Derivative financial liabilities: Interest rate derivatives
Option pricing model
Interest rate volatility
1%/63% 723
723
Financial guarantees 48
Financial liabilities carried at fair value 772 1 Where the exposure to an unobservable input is managed on a net basis, only the net impact is shown in the table. 2 The range represents the highest and lowest inputs used in the level 3 valuations. 3 Underlying asset/net asset values represent fair value.

LLOYDS BANKING GROUP PLC 2015 FULL-YEAR RESULTS
Page 88 of 95
15. Fair values of financial assets and liabilities (continued)
At 31 December 2014
Effect of reasonably possible
alternative assumptions1
Valuation technique(s)
Significant unobservable inputs Range2
Carrying value
Favourable changes
Unfavourable changes
£m £m £m Trading and other financial assets at fair value through profit or loss: Equity and venture capital investments
Market approach Earnings multiple 4/14 2,214 75 (75)
Unlisted equities and debt securities, property partnerships in the life funds
Underlying asset/net asset value (incl. property prices)3
n/a n/a
2,617 4 (2)Other 273 5,104
Available for sale financial assets 270
Derivative financial assets: Embedded equity conversion feature
Lead manager or broker quote
Equity conversion feature spread 175/432 646 21 (21)
Interest rate derivatives
Discounted cash flow
Inflation swap rate – funding component (bps) 3/167 1,382 17 (16)
Option pricing model
Interest rate volatility 4%/120% 743 6 (6)
2,771
Financial assets carried at fair value 8,145
Trading and other financial liabilities at fair value through profit or loss 5
Derivative financial liabilities: Interest rate derivatives
Discounted cash flow
Inflation swap rate – funding component (bps) 3/167 807
Option pricing model
Interest rate volatility 4%/120% 649
1,456
Financial guarantees 51
Financial liabilities carried at fair value 1,512 1 Where the exposure to an unobservable input is managed on a net basis, only the net impact is shown in the table. 2 The range represents the highest and lowest inputs used in the level 3 valuations. 3 Underlying asset/net asset values represent fair value.
Unobservable inputs
Significant unobservable inputs affecting the valuation of debt securities, unlisted equity investments and derivatives are
unchanged from those described in the Group’s 2014 financial statements.
Reasonably possible alternative assumptions
Valuation techniques applied to many of the Group’s level 3 instruments often involve the use of two or more inputs
whose relationship is interdependent. The calculation of the effect of reasonably possible alternative assumptions
included in the table above reflects such relationships and are unchanged from those described in the Group’s 2014
financial statements.

LLOYDS BANKING GROUP PLC 2015 FULL-YEAR RESULTS
Page 89 of 95
16. Credit quality of loans and advances
The table below sets out those loans that are (i) neither past due nor impaired, (ii) past due but not impaired, (iii) impaired, not requiring a provision and (iv) impaired requiring a provision. The disclosures in the table below are produced under the underlying basis used for the Group’s segmental reporting. The Group believes that, for reporting periods following a significant acquisition such as the acquisition of HBOS in 2009, this underlying basis, which includes the allowance for loan losses at the acquisition date on a gross basis, more fairly reflects the underlying provisioning status of the loans. The analysis of lending between retail and commercial has been prepared based upon the type of exposure and not the business segment in which the exposure is recorded. Included within retail are exposures to personal customers and small businesses, whilst included within commercial are exposures to corporate customers and other large institutions.
Loans and advances
Banks
Customers Designatedat fair value
through profit or
loss Retail –
mortgages Retail –
other Commercial Total £m £m £m £m £m £m
At 31 December 2015 Good quality 24,670 301,403 33,589 63,453 33,156 Satisfactory quality 311 527 4,448 28,899 15 Lower quality 4 27 476 7,210 3
Below standard, but not impaired 21 106 373 439 − Neither past due nor impaired1 25,006 302,063 38,886 100,001 440,950 33,174 0-30 days 111 4,066 276 248 4,590 − 30-60 days − 1,732 81 100 1,913 − 60-90 days − 1,065 9 52 1,126 − 90-180 days − 1,370 8 19 1,397 − Over 180 days − − 19 44 63 − Past due but not impaired2 111 8,233 393 463 9,089 − Impaired – no provision required − 732 690 1,092 2,514 − – provision held − 3,269 911 2,896 7,076 − Gross lending 25,117 314,297 40,880 104,452 459,629 33,174
At 31 December 2014 Good quality 25,654 318,967 30,993 65,106 36,482 Satisfactory quality 263 1,159 5,675 28,800 238 Lower quality 49 72 623 11,204 5
Below standard, but not impaired 37 126 595 1,658 − Neither past due nor impaired1 26,003 320,324 37,886 106,768 464,978 36,725 0-30 days 152 4,854 453 198 5,505 − 30-60 days − 2,309 110 51 2,470 − 60-90 days − 1,427 90 139 1,656 − 90-180 days − 1,721 5 38 1,764 − Over 180 days − − 16 62 78 − Past due but not impaired2 152 10,311 674 488 11,473 − Impaired – no provision required − 578 938 847 2,363 − – provision held − 3,766 1,109 7,070 11,945 − Gross lending 26,155 334,979 40,607 115,173 490,759 36,725 1 The definitions of good quality, satisfactory quality, lower quality and below standard, but not impaired applying to retail and
commercial are not the same, reflecting the different characteristics of these exposures and the way they are managed internally, andconsequently totals are not provided. Commercial lending has been classified using internal probability of default rating modelsmapped so that they are comparable to external credit ratings. Good quality lending comprises the lower assessed defaultprobabilities, with other classifications reflecting progressively higher default risk. Classifications of retail lending incorporate expectedrecovery levels for mortgages, as well as probabilities of default assessed using internal rating models.
2 A financial asset is ‘past due’ if a counterparty has failed to make a payment when contractually due.
LLOYDS BANKING GROUP PLC 2015 FULL-YEAR RESULTS
Page 90 of 95
17. Related party transactions
UK government
In January 2009, the UK government through HM Treasury became a related party of the Company following its
subscription for ordinary shares issued under a placing and open offer. As at 31 December 2015, HM Treasury held an
interest of 9.14 per cent in the Company’s ordinary share capital, with its interest having fallen below 20 per cent on
11 May 2015. As a consequence of HM Treasury no longer being considered to have a significant influence, it ceased to
be a related party of the Company for IAS 24 purposes at that date.
In accordance with IAS 24, UK government-controlled entities were related parties of the Group until 11 May 2015. The
Group also regarded the Bank of England and entities controlled by the UK government, including The Royal Bank of
Scotland Group plc (RBS), NRAM plc and Bradford & Bingley plc, as related parties.
During the year ended 31 December 2015, the Group has participated in a number of schemes operated by the UK
government and central banks and made available to eligible banks and building societies.
National Loan Guarantee Scheme
The Group participates in the UK government’s National Loan Guarantee Scheme, providing eligible UK businesses with
discounted funding based on the Group’s existing lending criteria. Eligible businesses who have taken up the funding
benefit from a 1 per cent discount on their funding rate for a pre-agreed period of time.
Funding for Lending
The Funding for Lending Scheme represents a further source of cost effective secured term funding available to the
Group. The initiative supports a broad range of UK based customers, focussing primarily on providing small businesses
with cheaper finance to invest and grow. In November 2015, the Bank of England announced that the deadline for banks
to draw down their borrowing allowance would be extended for a further two years until 31 January 2018. At
31 December 2015, the Group had drawn down £32 billion (31 December 2014: £20 billion) under the Scheme.
Enterprise Finance Guarantee Scheme
The Group participates in the Enterprise Finance Guarantee Scheme which supports viable businesses with access to
lending where they would otherwise be refused a loan due to a lack of lending security. The Department for Business,
Innovation and Skills provides the lender with a guarantee of up to 75 per cent of the capital of each loan subject to the
eligibility of the customer. As at 31 December 2015, the Group had offered 6,509 loans to customers, worth over
£550 million. Under the most recent renewal of the terms of the scheme, Lloyds Bank plc and Bank of Scotland plc, on
behalf of the Group, contracted with The Secretary of State for Business, Innovation and Skills.
Help to Buy
The Help to Buy Scheme is a scheme promoted by the UK government and is aimed to encourage participating lenders
to make mortgage loans available to customers who require higher loan-to-value mortgages. Halifax and Lloyds are
currently participating in the Scheme whereby customers borrow between 90 per cent and 95 per cent of the purchase
price. In return for the payment of a commercial fee, HM Treasury has agreed to provide a guarantee to the lender to
cover a proportion of any loss made by the lender. £3,133 million of outstanding loans at 31 December 2015
(31 December 2014: £1,950 million) had been advanced under this scheme.
Business Growth Fund
The Group has invested £176 million (31 December 2014: £118 million) in the Business Growth Fund (under which an
agreement was entered into with RBS amongst others) and, as at 31 December 2015, carries the investment at a fair
value of £170 million (31 December 2014: £105 million). Big Society Capital
The Group has invested £36 million (31 December 2014: £31 million) in the Big Society Capital Fund under which an
agreement was entered into with RBS amongst others.

LLOYDS BANKING GROUP PLC 2015 FULL-YEAR RESULTS
Page 91 of 95
17. Related party transactions (continued)
Housing Growth Partnership
The Group has committed to invest up to £50 million into the Housing Growth Partnership under which an agreement
was entered into with the Homes and Communities Agency.
Central bank facilities
In the ordinary course of business, the Group may from time to time access market-wide facilities provided by central banks. Other government-related entities
Other than the transactions referred to above, there were no significant transactions with the UK government and UK
government-controlled entities (including UK government-controlled banks) during the year that were not made in the
ordinary course of business or that were unusual in their nature or conditions.
Other related party transactions
Other related party transactions for the year ended 31 December 2015 are similar in nature to those for the year ended
31 December 2014.
18. Disposal of interest in TSB Banking Group plc
On 20 March 2015 the Group announced that it had agreed to sell a 9.99 per cent interest in TSB Banking Group plc
(TSB) to Banco de Sabadell S.A. (Banco Sabadell) and that it had entered into an irrevocable undertaking to accept
Banco Sabadell’s recommended cash offer in respect of its remaining 40.01 per cent interest in TSB. The offer by Banco
Sabadell was conditional upon, amongst other things, regulatory approval.
The sale of the 9.99 per cent interest completed on 24 March 2015, reducing the Group’s holding in TSB to 40.01 per
cent; this sale led to a loss of control and the deconsolidation of TSB. The Group’s residual investment in 40.01 per cent
of TSB was then recorded at fair value, as an asset held for sale. The Group recognised a loss of £660 million reflecting
the net costs of the Transitional Service Agreement between Lloyds and TSB, the contribution to be provided by Lloyds
to TSB in moving to alternative IT provision and the net result on sale of the 9.99 per cent interest and fair valuation of
the residual investment.
The Group announced on 30 June 2015 that all relevant regulatory clearances had been received and that the sale was
therefore unconditional in all respects; the proceeds were received on 10 July 2015.
At 31 December 2015, the Group held a £2,349 million interest in Cape Funding No.1 PLC, a securitisation funding
vehicle set up by TSB.

LLOYDS BANKING GROUP PLC 2015 FULL-YEAR RESULTS
Page 92 of 95
19. Dividends on ordinary shares
The directors have recommended a final dividend, which is subject to approval by the shareholders at the Annual
General Meeting, of 1.5 pence per share (2014: 0.75 pence per share) totalling £1,070 million (2014: £535 million). The
directors have also recommended a special dividend of 0.5 pence per share (2014: nil) totalling £357 million (2014: £nil).
These financial statements do not reflect these recommended dividends.
Shareholders who have already joined the dividend reinvestment plan will automatically receive shares instead of the
cash dividend. Key dates for the payment of the dividends are:
Shares quoted ex-dividend 7 April 2016
Record date 8 April 2016
Final date for joining or leaving the dividend reinvestment plan 22 April 2016
Dividends paid 17 May 2016
The dividend in respect of 2014 of 0.75 pence per ordinary share was paid to shareholders on 19 May 2015 and an
interim dividend for 2015 of 0.75 pence per ordinary share was paid on 28 September 2015; these dividends totalled
£1,070 million.
20. Events since the balance sheet date
In 2015, the Group participated in the UK-wide concurrent stress testing run by the Bank of England; the Enhanced
Capital Notes (ECNs) in issue were not taken into account for the purposes of core capital in the PRA stress tests and
the Group has determined that a Capital Disqualification Event (CDE), as defined in the conditions of the ECNs, has
occurred. This determination was confirmed by a unanimous decision by the Court of Appeal on 10 December 2015 and
on 29 January 2016 the Group announced the redemption of certain series of ECNs using the Regulatory Call Right. The
Group also launched tender offers for the remaining series of ECNs on 29 January 2016 and has announced that,
subsequent to completion of such offers, it will redeem those ECNs not validly tendered using the Regulatory Call Right.
The offers and redemptions will be completed before the end of the first quarter, resulting in a net loss to the Group
currently estimated to be approximately £700 million, principally comprising the write-off of the embedded equity
conversion feature and premiums paid under the terms of the transaction.
The trustee of the ECNs has been granted leave by the Supreme Court to appeal the Court of Appeal decision. In the
event that the Supreme Court were to determine that a CDE had not occurred, the Group would compensate fairly the
holders of the ECNs whose securities are redeemed using the Regulatory Call Right for losses suffered as a result of
early redemption.
21. Future accounting developments
The following pronouncements are not applicable for the year ending 31 December 2015 and have not been applied in
preparing these financial statements. Save as disclosed below, the full impact of these accounting changes is being
assessed by the Group. As at 24 February 2016, these pronouncements are awaiting EU endorsement.
IFRS 9 Financial Instruments
IFRS 9 replaces IAS 39 Financial Instruments: Recognition and Measurement. IFRS 9 requires financial assets to be
classified into one of three measurement categories, fair value through profit or loss, fair value through other
comprehensive income and amortised cost, on the basis of the objectives of the entity’s business model for managing its
financial assets and the contractual cash flow characteristics of the instruments. These changes are not expected to
have a significant impact on the Group.

LLOYDS BANKING GROUP PLC 2015 FULL-YEAR RESULTS
Page 93 of 95
21. Future accounting developments (continued)
IFRS 9 also replaces the existing ‘incurred loss’ impairment approach with an expected credit loss approach, resulting in
earlier recognition of credit losses. The IFRS 9 impairment model has three stages. Entities are required to recognise a
12 month expected loss allowance on initial recognition (stage 1) and a lifetime expected loss allowance when there has
been a significant increase in credit risk (stage 2). The assessment of whether a significant increase in credit risk has
occurred is a key aspect of the IFRS 9 methodology and involves quantitative measures, such as forward looking
probabilities of default, and qualitative factors and therefore requires considerable management judgement. Stage 3
requires objective evidence of impairment which is similar to the guidance on incurred losses in IAS 39. IFRS 9 requires
the use of more forward looking information including reasonable and supportable forecasts of future economic
conditions. The need to consider multiple economic scenarios and how they could impact the loss allowance is a very
subjective feature of the IFRS 9 impairment model. Loan commitments and financial guarantees not measured at fair
value through profit or loss are also in scope.
These changes may result in a material increase in the Group’s balance sheet provisions for credit losses although the
extent of any increase will depend upon, amongst other things, the composition of the Group’s lending portfolios and
forecast economic conditions at the date of implementation. The requirement to transfer assets between stages and to
incorporate forward looking data into the expected credit loss calculation, including multiple economic scenarios, is likely
to result in impairment charges being more volatile when compared to the current IAS 39 impairment model.
The IFRS 9 expected credit loss model differs from the regulatory models in a number of ways, for example stage 2
assets under IFRS 9 carry a lifetime expected loss amount whereas regulatory models generate 12 month expected
losses for non defaulted loans. In addition, different assets are in scope of each reporting base and therefore the size of
the regulatory expected losses should not be taken as a proxy to the size of the loss allowance under IFRS 9.
In 2015, the Basel Committee on Banking Supervision published finalised guidance on credit risk and accounting for
expected credit losses. The paper sets out supervisory guidance on how expected credit loss accounting models should
interact with a bank’s credit risk practices. The existing impairment processes, controls and governance will be reviewed
and changed where necessary to reflect the increased demands of an expected credit loss impairment model.
The hedge accounting requirements of IFRS 9 are more closely aligned with risk management practices and follow a
more principle-based approach than IAS 39. The accounting policy choice to continue with IAS 39 hedge accounting is
still being considered by the Group.
The Group has an established IFRS 9 programme to ensure a high quality implementation in compliance with the
standard and regulatory guidance. The programme involves Finance and Risk functions across the Group with Divisional
and Group steering committees providing oversight. The key responsibilities of the programme include defining IFRS 9
methodology and accounting policy, identifying data and system requirements, and establishing an appropriate operating
model and governance framework. The impairment workstreams have developed methodologies for many of the IFRS 9
requirements, although additional validation of these decisions will be on-going to reflect the uncertainty around
regulatory and audit expectations. Some risk model build has started and detailed plans, including resource needs, are in
place. We expect the majority of model build to be completed in 2016 to allow robust testing and the development of
management information to take place in 2017.
IFRS 9 is effective for annual periods beginning on or after 1 January 2018.

LLOYDS BANKING GROUP PLC 2015 FULL-YEAR RESULTS
Page 94 of 95
21. Future accounting developments (continued)
IFRS 15 Revenue from Contracts with Customers
IFRS 15 replaces IAS 18 Revenue and IAS 11 Construction Contracts. Financial instruments, leases and insurance
contracts are out of scope and so this standard is not expected to have a significant impact on the Group.
IFRS 15 is effective for annual periods beginning on or after 1 January 2018.
IFRS 16 Leases
On 13 January 2016 the IASB issued IFRS 16 to replace IAS 17 Leases. IFRS 16 requires lessees to recognise a right of
use asset and a liability for future payments arising from a lease contract. Lessor accounting requirements remain
aligned to the current approach under IAS 17.
IFRS 16 is effective for annual periods beginning on or after 1 January 2019.
Amendments to IAS 7 Statement of Cash Flows and IAS 12 Income Taxes
In January 2016, the IASB issued amendments to IAS 7 Statement of Cash Flows which require additional disclosure
about an entity’s financing activities and IAS 12 Income Taxes which clarify when a deferred tax asset should be
recognised for unrealised losses. These revised requirements, which are effective for annual periods beginning on or
after 1 January 2017, are not expected to have a significant impact on the Group.
22. Other information
The financial information included in this news release does not constitute statutory accounts within the meaning of
section 434 of the Companies Act 2006. Statutory accounts for the year ended 31 December 2015 were approved by the
directors on 24 February 2016 and will be delivered to the Registrar of Companies following publication in March 2016.
The auditors’ report on those accounts was unqualified and did not include a statement under sections 498(2)
(accounting records or returns inadequate or accounts not agreeing with records and returns) or 498(3) (failure to obtain
necessary information and explanations) of the Companies Act 2006.

LLOYDS BANKING GROUP PLC 2015 FULL-YEAR RESULTS
Page 95 of 95
CONTACTS
For further information please contact:
INVESTORS AND ANALYSTS
Douglas Radcliffe
Group Investor Relations Director
020 7356 1571
Mike Butters
Director of Investor Relations
020 7356 1187
Duncan Heath
Director of Investor Relations
020 7356 1585
CORPORATE AFFAIRS
Matthew Young
Group Corporate Affairs Director
020 7356 2231
Ed Petter
Group Media Relations Director
020 8936 5655
Copies of this news release may be obtained from:
Investor Relations, Lloyds Banking Group plc, 25 Gresham Street, London EC2V 7HN
The full news release can also be found on the Group’s website – www.lloydsbankinggroup.com
Registered office: Lloyds Banking Group plc, The Mound, Edinburgh, EH1 1YZ
Registered in Scotland no. 95000