2015 - oregon's official state economic development … · wells fargo since 2012, wells ......
TRANSCRIPT

2015 U.S. CLEAN TECH LEADERSHIP INDEXState & Metro / June 2015

© 2015 Clean Edge, Inc. (www.cleanedge.com). This report, and the models and analysis contained herein, are the property of Clean Edge and may not be reproduced, published, or summarized for distribution or incorporation into a report or other document without prior approval. 22015 U.S. CLEAN TECH LEADERSHIP INDEX
REPORT PARTNERS
Wells FargoSince 2012, Wells Fargo has provided more than $37 billion in
environmental financing to environmentally beneficial businesses.
In 2014 alone, Wells Fargo provided nearly $15 billion in capital
to support renewable energy, energy efficiency, greener buildings, conservation,
water management, sustainable transportation, resource-efficient products, sus-
tainable foods, and more. This includes investments of more than $140 million of
tax equity in wind and solar projects. Wells Fargo has reduced its greenhouse gas
emissions by 24 percent from 2008 levels and increased energy efficiency by 24
percent, water efficiency by 38 percent, and waste diversion by 65 percent since
2012. Additionally in 2014, the Wells Fargo Innovation Incubator (IN2) program
was launched; a five-year, $10 million grant initiative that provides resources to
startups that are developing sustainable commercial buildings technologies. This
SUPPORTING PARTNERS
LEAD PARTNER
program is administered by the National Renewable Energy Lab (NREL). To learn
more please visit: blogs.wellsfargo.com/environment/.
Wells Fargo & Company (NYSE: WFC) is a nationwide, diversified, community-
based financial services company with $1.7 trillion in assets. Founded in 1852
and headquartered in San Francisco, Wells Fargo provides banking, insurance,
investments, mortgage, and consumer and commercial finance through more
than 8,700 locations, 12,500 ATMs, and the Internet (wellsfargo.com), and has
offices in 36 countries to support customers who conduct business in the global
economy. With approximately 265,000 team members, Wells Fargo serves one in
three households in the United States. Wells Fargo & Company was ranked No. 29
on Fortune’s 2014 rankings of America’s largest corporations. Wells Fargo’s vision
is to satisfy all our customers’ financial needs and help them succeed financially.

© 2015 Clean Edge, Inc. (www.cleanedge.com). This report, and the models and analysis contained herein, are the property of Clean Edge and may not be reproduced, published, or summarized for distribution or incorporation into a report or other document without prior approval. 32015 U.S. CLEAN TECH LEADERSHIP INDEX
04 OVERVIEW 04 Product Description 05 The U.S. Clean Tech Market
07 STATE INDEX 08 State Index Map & Ranking List 09 2015 State Index Results
27 METRO INDEX 28 Metro Index Map & Ranking List 29 2015 U.S. Metro Index Results
43 METHODOLOGY 43 Metro Index Methodology
11 TECHNOLOGY 11 Technology Map & Ranking List 12 Technology Overview
31 GREEN BUILDINGS 31 Green Buildings Map & Ranking List 32 Green Buildings Overview
45 ADDITIONAL INFO 45 Data Sources 49 Subscription Info / About Clean Edge
16 POLICY 16 Policy Map & Ranking List 17 Policy Overview 18 Policy Checklist
34 ADVANCED TRANSPORTATION 34 Advanced Transportation Map & Ranking List 35 Advanced Transportation Overview
20 CAPITAL 20 Capital Map & Ranking List 21 Capital Overview
37 CLEAN ELECTRICITY & CARBON MANAGEMENT 37 Clean Electricity & Carbon Management Map & Ranking List 38 Clean Electricity & Carbon Management Overview
24 METHODOLOGY 24 State Index Methodology
40 CLEAN-TECH INVESTMENT, INNOVATION & WORKFORCE 40 Clean-Tech Investment, Innovation & Workforce Map & Ranking List 41 Clean-Tech Investment, Innovation & Workforce Overview
TABLE OF CONTENTS

© 2015 Clean Edge, Inc. (www.cleanedge.com). This report, and the models and analysis contained herein, are the property of Clean Edge and may not be reproduced, published, or summarized for distribution or incorporation into a report or other document without prior approval. 42015 U.S. CLEAN TECH LEADERSHIP INDEX
PRODUCTDESCRIPTIONWhat is the U.S. Clean Tech Leadership Index?This U.S. CLEAN TECH LEADERSHIP INDEX report contains findings from the 2015 edi-
tions of Clean Edge’s State and Metro Indexes, which track activity in the U.S. based
on a diverse set of underlying industry indicators at state and metro levels. Indicator
performances are grouped into separate categories (for index weighting purposes)
and ultimately used to calculate regional leadership scores. The STATE INDEX offers
scores for all 50 states, derived from more than 70 state-based indicators. The METRO
INDEX uses more than 20 metro-based indicators to calculate scores for the 50 larg-
est U.S. metropolitan statistical areas. Organizational structures of both indexes are
shown at the right, and more information can be found later in the report (State
Index methodology on page 24; Metro Index methodology on page 43).
The objective of the Leadership Index is to serve as a tool for regional comparative
research, a source for aggregated industry data, and a jumping-off point for deep,
data-driven analysis of the U.S. clean-energy market. This is the sixth edition of the
State Index, the fourth annual Metro Index, and the third year that topline index
rankings and scores have been released as a public report.
Full Data Subscription Packages AvailablePrivate subscription options, which provide access to all of the underlying datasets, are available for economic development agencies, policymakers, NGOs, investors, corporations, and other stakeholders. For more information please see page 49.
STATE INDEXPOLICYRegulations & MandatesIncentives
18 INDICATORS
18 INDICATORS
TECHNOLOGYClean ElectricityClean TransportationEnergy Intelligence & Green Building
12 INDICATORS
7 INDICATORS
10 INDICATORS
CAPITALFinancial CapitalHuman & Intellectual Capital
6 INDICATORS
5 INDICATORS
METRO INDEX
GREEN BUILDINGS 5 INDICATORS
ADVANCED TRANSPORTATION 8 INDICATORS
CLEAN ELECTRICITY & CARBON MANAGEMENT 7 INDICATORS
CLEAN-TECH INVESTMENT, INNOVATION, & WORKFORCE 6 INDICATORS

© 2015 Clean Edge, Inc. (www.cleanedge.com). This report, and the models and analysis contained herein, are the property of Clean Edge and may not be reproduced, published, or summarized for distribution or incorporation into a report or other document without prior approval. 52015 U.S. CLEAN TECH LEADERSHIP INDEX
cisco, San Jose, and San Diego (along with much smaller cities like Burlington, Vt.,
Georgetown, Tex., and Greensburg, Kans.) have renewable energy goals of 100%.
And lawmakers in Hawaii, a state that’s back in the top 10 in this year’s Index,
made the biggest splash of all in May, establishing the nation’s first statewide
100% renewables target (by 2045). That audacious goal passed the two houses of
Hawaii’s state legislature by a combined vote of 74-2 and was awaiting Governor
Source: U.S. Clean Tech Leadership Index, Clean Edge. Inc.
The United States has seen a significant shift in its energy landscape since Clean
Edge began publishing its clean-tech leadership index five years ago. The transition
to a clean tech and energy efficiency-based economy, based on the many indica-
tors we track, is well underway. Solar and wind power, along with natural gas
and energy efficiency, are now the mainstream choices for meeting the nation’s
electricity needs; coal-fired and nuclear power, the dominant choices of the 20th
century, have become the marginalized “alternatives.”
In 2014, utility-scale wind energy (27%) and solar power (20%) combined for
47% of U.S. generation capacity additions (this figure does not include distributed
solar and wind installations less than 1 MW in size), according to the Federal En-
ergy Regulatory Commission. Add in natural gas plants’ share of 49% and these
three sources were responsible for 96% of the nation’s new utility-scale generation
capacity. The clean-energy trend became even more dramatic in the first quarter of
2015, with non-hydro renewables contributing 70% of the new added capacity in
the U.S. (wind 49%, solar 17%, and geothermal 4%).
Against this national backdrop, the top states and metro areas tracked by our 2015
U.S. Clean Tech Leadership Index are accelerating their clean-energy goals to levels
once believed unthinkable. In California, the #1 state in the Index for six consecutive
years, Governor Jerry Brown set a target of 50% generation from renewables by
2030 in his January 2015 State of the State address. The California cities of San Fran-
THE U.S. CLEAN TECH MARKET
2010 2011 2012 2013 2014 201520
19
18
17
16
15
14
13
12
11
10
9
8
7
6
5
4
3
2
1
10987654321 California
MassachusettsOregonColoradoNew YorkVermontConnecticutIllinoisWashingtonHawaii
2015 TOP 10 STATES (INCLUDING HISTORICAL RANKINGS)

© 2015 Clean Edge, Inc. (www.cleanedge.com). This report, and the models and analysis contained herein, are the property of Clean Edge and may not be reproduced, published, or summarized for distribution or incorporation into a report or other document without prior approval. 62015 U.S. CLEAN TECH LEADERSHIP INDEX
David Ige’s expected signature as this report went to press; the Aloha State is
currently at about 20% renewables.
Making these goals possible, in addition to the significant expansion of wind
power over the past decade, is the recent surge in the growth of solar energy. The
U.S. added more than 6 GW of new solar capacity in 2014, a 30% growth rate.
California became the first state to exceed 5% generation from utility-scale solar,
and that doesn’t even include the state’s hundreds of megawatts of rooftop solar
working behind the residential and commercial customer meter. Utility-scale solar
also contributed more than 2.5% of total generation in Nevada and Arizona.
Our tracking of states’ clean-tech performance since our first Index in 2010 puts
this momentum in perspective. Last year, 11 states generated at least 10% of their
electricity from clean sources (excluding hydro and biomass); in 2009, it was just
three. And in 2014, three states exceeded 20% for the first time, led by Iowa at
28.5%. Add in hydro and biomass, and five states exceeded 60% clean electricity
in 2014. As the EPA’s Clean Power Plan rolls out in the months and years ahead –
and 100% clean-energy targets move from pipe dream to achievable goal – such
state-by-state tracking of clean electricity sources, energy efficiency measures such
as green buildings, and the move toward the electrification of transportation will
be increasingly important.
2015 TOP 10 METRO AREAS (INCLUDING HISTORICAL RANKINGS)
Source: U.S. Clean Tech Leadership Index, Clean Edge. Inc.
2012 2013 2014 2015
San Francisco, CA
San Jose, CA
Portland, OR
San Diego, CA
Washington, DC
Los Angeles, CA
Seattle, WA
Boston, MA
Austin, TX
Chicago, IL
12
11
10
9
8
7
6
5
4
3
2
1
10
9
8
7
6
5
4
3
2
1

© 2015 Clean Edge, Inc. (www.cleanedge.com). This report, and the models and analysis contained herein, are the property of Clean Edge and may not be reproduced, published, or summarized for distribution or incorporation into a report or other document without prior approval. 72015 U.S. CLEAN TECH LEADERSHIP INDEX: STATE INDEX
STATE INDEX2015 U.S. Clean Tech Leadership Index
Full State Index Datasets AvailableClean Edge offers subscription access to the full State and Metro Index datasets. These include data for all 50 states on clean-energy generation, energy storage installations, green building deployment, energy efficiency expenditures, VC investments, clean-energy patents, and much more. For more information on subscriptions, please see page 49.

© 2015 Clean Edge, Inc. (www.cleanedge.com). This report, and the models and analysis contained herein, are the property of Clean Edge and may not be reproduced, published, or summarized for distribution or incorporation into a report or other document without prior approval. 82015 U.S. CLEAN TECH LEADERSHIP INDEX: STATE INDEX
CaliforniaMassachusettsOregonColoradoNew YorkVermontConnecticutIllinoisWashingtonHawaiiNew MexicoNew HampshireMichiganNew JerseyMinnesotaMarylandRhode IslandDelawareNevadaTexasPennsylvaniaMaineNorth CarolinaIowaArizonaOhioUtahGeorgiaVirginiaWisconsinMontanaIndianaMissouriTennesseeIdahoKansasSouth CarolinaOklahomaSouth DakotaLouisianaKentuckyArkansasFloridaWyomingAlabamaWest VirginiaNorth DakotaAlaskaMississippiNebraska
94.078.872.067.165.162.959.959.657.556.554.550.650.349.349.046.345.744.241.640.139.738.738.535.134.934.433.333.132.029.428.825.825.425.223.723.322.822.722.020.519.519.018.215.815.310.210.110.0
9.78.6
00000330
-22
-541
-304
-43
-2-2571
-1-324
-3-2
-1120841
-2-2-102
-12
-131
-23001
-4
123456789
1011121314151617181920212223242526272829303132333435363738394041424344454647484950
LOWER RANKING HIGHER RANKING
+/-RANK STATE LEADERSHIP SCORE
STATE INDEX

© 2015 Clean Edge, Inc. (www.cleanedge.com). This report, and the models and analysis contained herein, are the property of Clean Edge and may not be reproduced, published, or summarized for distribution or incorporation into a report or other document without prior approval. 92015 U.S. CLEAN TECH LEADERSHIP INDEX: STATE INDEX
2015 STATE INDEX RESULTSCalifornia leads all states by a wide margin for the sixth consecutive year, its overall
Index score of 94 holding steady with its prior year score of 93.7. The Golden
State, #1 in the Technology and Capital categories and #2 in Policy, slightly upped
its overall score lead over second-place Massachusetts to 15.2 points from 14.3
last year. The rest of the top five states in last year’s Index – Oregon, Colorado, and
New York – repeated their respective rankings from 2014. All of the top five states
have been ranked #6 or higher every year since the inaugural Index in 2010.
Places six through 10, however, showed some notable movement from last year.
Fellow New England states Vermont and Connecticut each jumped three places
to #6 and #7, respectively. Illinois held steady at #8 for the third straight year, but
Washington fell two spots to ninth, its third consecutive yearly drop since ranking
#4 in 2012. Hawaii moved up two places to rejoin the top 10. The Aloha State has
climbed in the ranks significantly since ranking just 19th back in 2010.
The Top 10 StatesThe Technology category leader for six years running, CALIFORNIA tops
the field in all three subcategories of clean-technology deployment:
electricity; transportation; and energy intelligence/green buildings. The
Golden State also captured the #1 spot in Capital this year after trailing
Massachusetts in the previous five years of the Index, while finishing
second to Massachusetts in Policy. With 55,000 people employed in its booming
solar industry alone, a carbon market in place with its AB32 trading scheme, and
a 50% renewables goal by 2030 set by Governor Jerry Brown, California sets
the pace for what a clean-energy economy looks like. Showing the correlation
between the State and Metro Indexes, California is home to three of the top four
metro areas.
MASSACHUSETTS remains #2 for the third straight year, after
swapping places with #3 Oregon in the 2013 Index. Its overall score
dropped slightly this year to 78.8 from last year’s 79.4. Although losing its top spot
in Capital to California, Massachusetts jumped up four spots into the Top 10 in
Technology at #8, reflecting a major policy and industry push to deploy more clean
energy under the administration of former Governor Deval Patrick. Massachusetts
repeats as the #1 state in Policy, boasting 31 of the 35 possible policies tracked by
the Index.
OREGON retained its #3 rank for the third straight year, but enjoyed
the highest score increase of any top 10 state, up to 72 points from 67
last year when it barely edged out Colorado. Oregon trails only California in the
Technology category, with perennial strength in hybrid vehicles, electric vehicles,
plug-in hybrids, charging infrastructure, and green buildings. But the Beaver State
was most improved in Policy and Capital, jumping to sixth place in both categories
after placing 11th in both a year ago. Oregon was #2 in the Regulations and
Mandates portion of Policy, trailing only Massachusetts.

© 2015 Clean Edge, Inc. (www.cleanedge.com). This report, and the models and analysis contained herein, are the property of Clean Edge and may not be reproduced, published, or summarized for distribution or incorporation into a report or other document without prior approval. 102015 U.S. CLEAN TECH LEADERSHIP INDEX: STATE INDEX
COLORADO moved up to fourth place in the 2014 Index and stayed
there this year, with a virtually identical score of 67, after ranking #5 in
the first four years of the Index. The home state of the National Renewable Energy
Laboratory ranks #4 in Capital and #6 in Technology. Colorado is particularly strong
in the Energy Intelligence & Green Buildings subcategory of Technology, placing
#2 behind California. The state ranks 10th in Policy, with particular strength in
Incentives at #5.
Despite placing just 19th in Technology, NEW YORK repeats its #5
overall ranking from a year ago with a score of 65. The Empire State
shows clear policy leadership with a fourth-place rank in that category. Among its
credentials are a Green Bank and one of the nation’s most comprehensive utility
regulatory overhauls called Reforming the Energy Vision (REV), which emphasizes
distributed assets and demand side management.
VERMONT jumped three places from ninth in 2014, upping its score from
58.6 to 63, continuing its impressive climb from just 15th in the overall
Index two years ago. The tiny state (ranking 49th in population with less
than a million people) is the highest-placing eastern state in Technology at #5.
Always a pacesetter in efficiency and its financing, Vermont lands at #3 in the
Energy Intelligence & Green Buildings subcategory of Technology.
Fellow New England state CONNECTICUT (with a 59.9 score) also
moved up three places from last year, when it entered the top 10 for
the first time since 2011. The state is something of a study in contrasts, ranking
26th in Technology but #3 in Policy. Having established the nation’s first full-scale
Green Bank in 2011, Connecticut has continued that policy leadership, and ties
Massachusetts for the most Incentives policies (15) tracked by the Index.
ILLINOIS saw its score drop slightly from 61.5 to 59.6, but continued its
steady track record with a third consecutive #8 ranking (and a #7 in 2012).
Like Connecticut and New York, Illinois overcomes a low rank in Technology
(21st) with a strong showing in Policy (#8) and is also #8 in Capital. The only
Midwestern state in the top 10, Illinois is one of just four states that’s home to a DOE
Lab, clean-energy incubator or accelerator, and a top-ranked green Master’s program.
WASHINGTON fell two places from last year’s Index, its score dropping
from 61.6 to 57.5. Placing #4 or #6 in the first three years of our Index,
Washington’s rank has dropped each year since 2013. With one of the nation’s
lowest-carbon energy mixes, as well as high clean-powered vehicle ownership,
Washington excels in the Technology category at fourth place. But the state is just
15th in both the Policy (down from #7 last year) and Capital categories.
HAWAII rejoins the top 10 in 2015 after dropping to 12th last year.
The Aloha State improved its score by nearly five points in this year’s
Index to 56.5. Other than last year, Hawaii has climbed steadily up
the ranks since placing 19th in our inaugural Index in 2010. Hawaii is an impressive
#3 in Technology this year, trailing only California and Oregon. Its small island
geography makes it ideal for electric vehicles. And with its legislature passing the
nation’s first statewide 100% renewable energy mandate (by 2045) in May of this
year, Hawaii signaled its desire to be a leading clean-tech state for many years to
come.

TECHNOLOGY
LOWER RANKING HIGHER RANKING
© 2015 Clean Edge, Inc. (www.cleanedge.com). This report, and the models and analysis contained herein, are the property of Clean Edge and may not be reproduced, published, or summarized for distribution or incorporation into a report or other document without prior approval. 112015 U.S. CLEAN TECH LEADERSHIP INDEX: STATE INDEX
CaliforniaOregonHawaiiWashingtonVermontColoradoNevadaMassachusettsUtahArizonaSouth DakotaIowaMinnesotaIdahoMaineOklahomaVirginiaMarylandNew YorkGeorgiaIllinoisNew MexicoTexasNew HampshireDelawareConnecticutKansasWisconsinMichiganRhode IslandNorth DakotaPennsylvaniaNorth CarolinaNew JerseyMontanaAlaskaIndianaWyomingFloridaOhioNebraskaMissouriTennesseeSouth CarolinaKentuckyArkansasAlabamaLouisianaWest VirginiaMississippi
100.069.066.061.258.756.355.351.347.246.546.245.044.844.542.538.938.138.037.837.336.535.234.533.532.532.529.229.128.427.927.426.725.725.521.921.721.221.120.319.919.418.417.917.910.2
9.16.62.92.41.5
123456789
1011121314151617181920212223242526272829303132333435363738394041424344454647484950
RANK STATE LEADERSHIP SCORE

© 2015 Clean Edge, Inc. (www.cleanedge.com). This report, and the models and analysis contained herein, are the property of Clean Edge and may not be reproduced, published, or summarized for distribution or incorporation into a report or other document without prior approval. 122015 U.S. CLEAN TECH LEADERSHIP INDEX: STATE INDEX
TECHNOLOGY OVERVIEWThe Technology category tracks the progress of states’ deployment across three
subcategories:
• Clean Electricity (renewable energy generation, energy storage, and fuel cell
deployment)
• Clean Transportation (use of electric vehicles, hybrids, plug-in hybrids,
biofuels, natural gas vehicles, and charging/fueling infrastructure)
• Energy Intelligence & Green Building (green building projects, smart grid
deployment, grid modernization, and efficient energy use)
The three subcategories are weighted equally.
The 2015 State Index marks the fourth straight year in which California has led the
nation in all three Technology subcategories, resulting in a dominating performance
with its top score of 100 eclipsing the rest of the pack by more than 30 points (#2
Oregon came in at 69 in Technology this year). After California and Oregon, five
other states among the overall top 10 – Colorado, Washington, Vermont, Mas-
sachusetts, and Hawaii – make the top 10 in Technology.
But Technology leadership also includes states that that don’t necessarily score
highly in other areas or in the overall Index – thanks to an abundance and exploita-
tion of clean-energy resources. Nevada and Arizona, #2 and #3 in the U.S. in
utility-scale solar power as a percentage of total generation, crack the Technology
UTILITY-SCALE CLEAN ELECTRICITY GENERATION: WIND, SOLAR, GEOTHERMAL, HYDRO, BIOMASS (2014)
STATE RANK % OF TOTAL GENERATION THOUSAND MWH
IDAHO 1 82.94% 12,587
WASHINGTON 2 76.05% 87,729
OREGON 3 73.37% 43,813
SOUTH DAKOTA 4 72.99% 8,416
MAINE 5 60.25% 7,925
MONTANA 6 43.58% 13,181
CALIFORNIA 7 30.16% 59,633
IOWA 8 30.06% 17,172
ALASKA 9 28.25% 1,737
VERMONT 10 27.48% 1,923
Source: EIA with Clean Edge analysis. Clean electricity sources include wind, solar PV and thermal, geothermal, hydro, and biomass. EIA electricity generation data is gathered from monthly surveys of power plants with peak capacity of at least 1 MW, meaning sub-1 MW solar installations do not count toward generation totals.Full dataset available to subscription clients.
top 10 despite respective overall rankings of 19th and 25th. The top two wind
power states (on a percentage basis), Iowa and South Dakota, reach the top 12 in
Technology; overall, they rank 24th and 39th respectively.
The top four Technology states either border the Pacific Ocean or are surrounded
by it, and four others in the top 10 are also west of the Great Plains. But Vermont
achieved the highest Technology category ranking by an eastern state in the Index’s
six years, at #5, and Massachusetts also made the top 10 for the first time at #8.
© 2015 Clean Edge, Inc. (www.cleanedge.com). This report, and the models and analysis contained herein, are the property of Clean Edge and may not be reproduced, published, or summarized for distribution or incorporation into a report or other document without prior approval. 132015 U.S. CLEAN TECH LEADERSHIP INDEX: STATE INDEX
UTILITY-SCALE SOLAR ELECTRICITY GENERATION (2014)STATE RANK % OF TOTAL GENERATION THOUSAND MWH
CALIFORNIA 1 5.00% 9,891
NEVADA 2 2.84% 1,028
ARIZONA 3 2.76% 3,101
NEW MEXICO 4 1.69% 543
MASSACHUSETTS 5 1.35% 419
NEW JERSEY 6 1.00% 677
DELAWARE 7 0.77% 59
NORTH CAROLINA 8 0.72% 922
COLORADO 9 0.50% 268
HAWAII 10 0.48% 48
Source: EIA data with Clean Edge analysis. EIA electricity generation data is gathered from monthly surveys of power plants with peak capacity of at least 1 MW, meaning sub-1 MW solar installations do not count toward generation totals.Full dataset available to subscription clients.
UTILITY-SCALE WIND ELECTRICITY GENERATION (2014)STATE RANK % OF TOTAL GENERATION THOUSAND MWH
IOWA 1 28.53% 16,295
SOUTH DAKOTA 2 25.29% 2,916
KANSAS 3 21.67% 10,844
IDAHO 4 18.31% 2,778
NORTH DAKOTA 5 17.58% 6,349
OKLAHOMA 6 16.87% 11,862
MINNESOTA 7 15.94% 9,060
COLORADO 8 13.61% 7,351
OREGON 9 12.69% 7,580
TEXAS 10 9.00% 39,371
Source: EIA data with Clean Edge analysis. EIA electricity generation data is gathered from monthly surveys of power plants with peak capacity of at least 1 MW, meaning sub-1 MW solar installations do not count toward generation totals.Full dataset available to subscription clients.
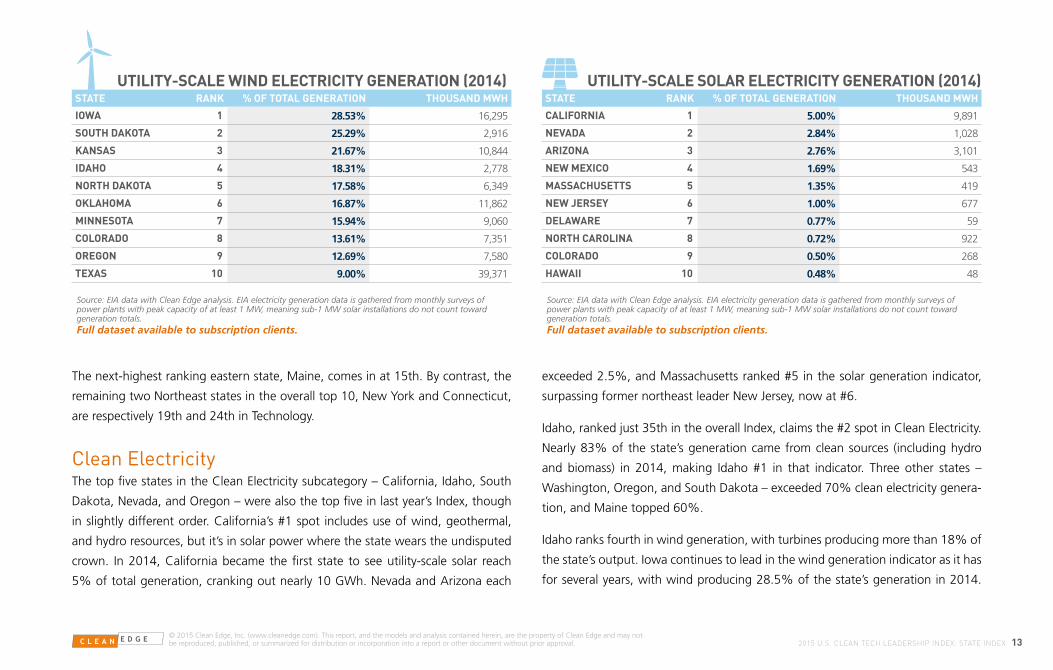
exceeded 2.5%, and Massachusetts ranked #5 in the solar generation indicator,
surpassing former northeast leader New Jersey, now at #6.
Idaho, ranked just 35th in the overall Index, claims the #2 spot in Clean Electricity.
Nearly 83% of the state’s generation came from clean sources (including hydro
and biomass) in 2014, making Idaho #1 in that indicator. Three other states –
Washington, Oregon, and South Dakota – exceeded 70% clean electricity genera-
tion, and Maine topped 60%.
Idaho ranks fourth in wind generation, with turbines producing more than 18% of
the state’s output. Iowa continues to lead in the wind generation indicator as it has
for several years, with wind producing 28.5% of the state’s generation in 2014.
The next-highest ranking eastern state, Maine, comes in at 15th. By contrast, the
remaining two Northeast states in the overall top 10, New York and Connecticut,
are respectively 19th and 24th in Technology.
Clean ElectricityThe top five states in the Clean Electricity subcategory – California, Idaho, South
Dakota, Nevada, and Oregon – were also the top five in last year’s Index, though
in slightly different order. California’s #1 spot includes use of wind, geothermal,
and hydro resources, but it’s in solar power where the state wears the undisputed
crown. In 2014, California became the first state to see utility-scale solar reach
5% of total generation, cranking out nearly 10 GWh. Nevada and Arizona each

© 2015 Clean Edge, Inc. (www.cleanedge.com). This report, and the models and analysis contained herein, are the property of Clean Edge and may not be reproduced, published, or summarized for distribution or incorporation into a report or other document without prior approval. 142015 U.S. CLEAN TECH LEADERSHIP INDEX: STATE INDEX
HYBRID ELECTRIC VEHICLES (REGISTERED VEHICLES, 2014)
STATE RANK HEVS PER 1M PEOPLE TOTAL HEVS
CALIFORNIA 1 20,379.3 790,769
WASHINGTON 2 17,039.2 120,323
OREGON 3 16,998.7 67,489
VERMONT 4 16,016.0 10,035
VIRGINIA 5 13,811.8 115,001
HAWAII 6 13,675.4 19,413
NEW HAMPSHIRE 7 13,347.8 17,710
MASSACHUSETTS 8 13,146.3 88,677
MARYLAND 9 12,700.9 75,906
COLORADO 10 11,971.2 64,116
Source: IHS Automotive data with Clean Edge analysis. IHS Automotive data is a snapshot of every vehicle in operation as of January 1, 2015.Full dataset available to subscription clients.
ELECTRIC VEHICLES (REGISTERED VEHICLES, 2014)STATE RANK EVS PER 1M PEOPLE TOTAL EVS
CALIFORNIA 1 1,812.3 70,322
HAWAII 2 1,708.3 2,425
GEORGIA 3 1,342.9 13,560
WASHINGTON 4 1,282.3 9,055
OREGON 5 882.3 3,503
ARIZONA 6 649.3 4,371
VERMONT 7 416.6 261
COLORADO 8 390.0 2,089
FLORIDA 9 341.7 6,798
UTAH 10 339.1 998
Source: IHS Automotive data with Clean Edge analysis. IHS Automotive data is a snapshot of every vehicle in operation as of January 1, 2015. In prior years, this indicator included plug-in hybrid electric vehicles like the Chevy Volt. However, plug-in vehicles are now tracked in a separate indicator. Full dataset available to subscription clients.
million people. Hawaii, Oregon, and Vermont lead in EV charging infrastructure,
and Utah’s #2 rank in the subcategory stems from its leadership in natural gas
vehicles and compressed natural gas fueling stations. Utah has more than 1,250
NGVs per million people; #2 Oklahoma has less than 800.
Four states – California, Hawaii, Georgia, and Washington – now have more than
1,000 EVs per million people, and two, California and Vermont, have more than
1,000 plug-in hybrids. California, where Tesla Motors is the state’s largest auto
industry employer, has nearly 950,000 clean-powered cars (including NGVs) on the
road and should pass the 1 million-vehicle milestone this year.
Both South Dakota and Kansas exceed 20%; overall, nine states received more
than 12% of their in-state power from the wind. Texas is the leader in total wind
generation; its nearly 40 GWh in 2014 was 9% of its total generation.
Clean TransportationThe top five states in the Clean Transportation subcategory have remained un-
changed for the past three years – California, Utah, Hawaii, Washington, and
Oregon – although Washington and Oregon swapped fourth and fifth places in
2014. California, with a 100 score, has a substantial lead over Utah (81.8) and
Hawaii (81.1). California leads in hybrid, plug-in hybrid, and all-electric vehicles per

© 2015 Clean Edge, Inc. (www.cleanedge.com). This report, and the models and analysis contained herein, are the property of Clean Edge and may not be reproduced, published, or summarized for distribution or incorporation into a report or other document without prior approval. 152015 U.S. CLEAN TECH LEADERSHIP INDEX: STATE INDEX
LEED BUILDING DEPLOYMENT (2014)
STATE
RANKPROJECTS PER
1M PEOPLETOTAL
PROJECTSPLATINUM PROJECTS
GOLD PROJECTS
SILVER PROJECTS
COLORADO 1 129.7 695 48 309 216
VERMONT 2 128.6 81 7 31 25
WASHINGTON 3 114.3 807 40 343 295
OREGON 4 113.6 451 58 229 107
MARYLAND 5 112.5 673 27 292 240
NEW MEXICO 6 110.0 230 7 100 99
VIRGINIA 7 104.1 867 32 311 346
MASSACHUSETTS 8 100.4 678 48 317 189
HAWAII 9 88.0 125 13 57 37
CALIFORNIA 10 85.4 3315 312 1422 1038
Source: USGBC data with Clean Edge analysis. USGBC data is gathered from the LEED project registration database and includes all projects certified through 12/31/2014. This does not include LEED for Homes projects.Full dataset available to subscription clients.
Energy Intelligence and Green BuildingCalifornia’s leadership margin in this subcategory is akin to that of Clean Trans-
portation, roughly 20 points over #2 Colorado (82.06); rounding out the top five
are Vermont, Massachusetts, and Maryland. The top 10 states in the subcategory
include three from outside the overall Index top 10 – Maryland, #7 Nevada, and #9
Arizona – for different reasons.
Maryland is fifth in LEED-certified projects per million people, many of them fed-
eral government buildings on or near the Capital Beltway; federal green building
mandates also help Virginia earn seventh place in that indicator. Nevada, as in past
years, benefits from its very large green building projects in Las Vegas, leading all
states in the LEED-certified square feet per capita indicator. Nevada is also #2 in
the nation in smart-meter market penetration at 94.8%; Maine leads with 97.5%.
Arizona, where utilities have come under fire from the rooftop solar industry for
new fees and other actions, is a leader in smart meter deployment as well; the
state placed sixth in that indicator with 72.2% market penetration.
Nevada and Arizona both make the top 10 in the 2014 Gridwise Modernization
Index (GMI), a new indicator reflecting the importance of grid infrastructure up-
grade and reform in enabling a state’s leadership in clean tech. The GMI is a state
benchmarking index from the Gridwise Alliance, a consortium of leading utilities,
grid operators, smart grid technology providers, and other key stakeholders. The
GMI top 10 includes energy-efficiency leaders like California and Illinois, but also
efficiency laggards Texas (which ties California for the top score), Idaho, and Vir-
ginia – showing the multi-faceted nature of Technology leadership for states in
clean tech.
SMART METER MARKET PENETRATION (2013)STATE RANK % OF SMART METERS TOTAL SMART METERS
MAINE 1 97.52% 739,583
NEVADA 2 94.83% 1,125,193
GEORGIA 3 84.61% 3,771,777
CALIFORNIA 4 83.82% 12,427,747
VERMONT 5 80.37% 271,526
ARIZONA 6 72.19% 2,091,766
DELAWARE 7 71.83% 307,904
TEXAS 8 69.07% 7,840,588
IDAHO 9 68.57% 548,969
NEW HAMPSHIRE 10 66.63% 156,960
Source: EIA data with Clean Edge analysis.Full dataset available to subscription clients.

POLICY
LOWER RANKING HIGHER RANKING
© 2015 Clean Edge, Inc. (www.cleanedge.com). This report, and the models and analysis contained herein, are the property of Clean Edge and may not be reproduced, published, or summarized for distribution or incorporation into a report or other document without prior approval. 162015 U.S. CLEAN TECH LEADERSHIP INDEX: STATE INDEX
MassachusettsCaliforniaConnecticutNew YorkMinnesotaOregonNew MexicoIllinoisMarylandColoradoNew JerseyHawaiiRhode IslandNew HampshireWashingtonDelawareVermontMichiganNevadaMissouriArizonaOhioPennsylvaniaNorth CarolinaKentuckyWisconsinMaineUtahLouisianaArkansasMontanaIowaIndianaTexasFloridaGeorgiaSouth CarolinaOklahomaMississippiTennesseeVirginiaKansasAlabamaWyomingSouth DakotaWest VirginiaAlaskaIdahoNebraskaNorth Dakota
100.091.990.290.181.180.980.178.475.673.973.970.369.367.664.860.157.757.751.249.649.547.945.945.945.245.144.844.243.442.542.239.438.037.829.729.129.027.327.226.324.324.323.522.618.212.6
8.16.34.51.8
123456789
1011121314151617181920212223242526272829303132333435363738394041424344454647484950
RANK STATE LEADERSHIP SCORE

© 2015 Clean Edge, Inc. (www.cleanedge.com). This report, and the models and analysis contained herein, are the property of Clean Edge and may not be reproduced, published, or summarized for distribution or incorporation into a report or other document without prior approval. 172015 U.S. CLEAN TECH LEADERSHIP INDEX: STATE INDEX
POLICY OVERVIEWThe Policy category of the State Index is slightly different from the Technology
and Capital categories in that it is not based on quantitative industry metrics, but
rather on each state’s implementation of important clean-tech policies. The category
includes two subcategories. Regulations & Mandates covers renewable portfolio
standards (RPS), transportation policies, building codes, and climate change targets,
representing the metaphorical “sticks.” Incentives are the figurative “carrots,”
including state-level loans and rebates for renewable energy and energy efficiency,
vehicle purchasing rebates, and utility performance incentives. Most policy indicators
are scored on a yes or no basis – either a given policy exists in a state or it doesn’t.
Massachusetts leads all other states in this year’s Policy category for the third year
running, with 31 of 35 possible policies in place. The state shares the top spot in
Regulations & Mandates (16) with Oregon, and ties with neighboring Connecticut
for the top spot in Incentives (15). Rounding out the top five states for policy are
California, Connecticut, New York, and Minnesota, which rejoins the top five after
a one-year absence. The top five Regulations rankings also include California, New
York, and New Mexico, while California and New York tied for third in Incentives,
with Minnesota, Illinois, Colorado, and New Jersey all tied for fifth.
Not surprisingly, many of the top 10 states in the two subcategories are the same:
seven states that are ranked in the top 10 in Regulations & Mandates (which has a
three-way tie for 10th) are also in the top 10 in Incentives. There are differences in
the two lists, though. Oregon, Maryland, Delaware, Rhode Island, and Washington
are top 10 Regulations & Mandates states that fall outside the top 10 for Incentives;
Delaware (#7 in Regulations & Mandates) in particular suffers from a low Incentives
score (just 32nd). On the other hand, Incentives top 10 states New Jersey, Colorado,
Hawaii, and New Hampshire all rank in the teens in Regulations & Mandates.
Although it can be tricky to make a direct correlation between a state’s policy choices
and its clean-tech deployment, we can see some connections between the two.
As the top-ranked Policy state for the sixth straight year, Massachusetts receives
credit for most of the policy indicators tracked in the Index. And it’s perhaps no
coincidence that it also scores well in Energy Intelligence & Green Building, and has
seen an increase in solar deployment numbers. At the other end of the spectrum
are states like Oklahoma and Utah, which fare poorly overall in Policy (#28 and
#38, respectively), but have enacted specific policies such as tax credits and rebates
to encourage deployment in natural gas vehicles (NGVs). And it shows: Utah and
Oklahoma are #1 and #2 respectively in both NGVs and NGV fueling stations.
Several indicators in the Policy category judge states for how well they encourage
distributed generation (DG). For the first time, this year’s Index rates states on
the strength of their interconnection policies (the rules by which customers can
connect DG systems to the electric grid) and net metering rules (the arrangements
by which customers sell self-generated power back to the grid). A strong rating
is considered an A or B grade in the “Freeing the Grid” report from the Interstate
Renewable Energy Council (IREC) and Vote Solar. Just over half (26) of all states
received the highest or second-highest ratings on interconnection, while 35 states
received one of the two top ratings for their net metering programs.

© 2015 Clean Edge, Inc. (www.cleanedge.com). This report, and the models and analysis contained herein, are the property of Clean Edge and may not be reproduced, published, or summarized for distribution or incorporation into a report or other document without prior approval. 182015 U.S. CLEAN TECH LEADERSHIP INDEX: STATE INDEX
0 5 10 15 20 25 30 35
Massachusetts
California
Connecticut
New York
Minnesota
Oregon
New Mexico
Illinois
Maryland
Colorado
New Jersey
Hawaii
Rhode Island
New Hampshire
Washington
Delaware
Michigan
Vermont
Nevada
Missouri
Arizona
Ohio
North Carolina
Pennsylvania
Kentucky
Regulations & Mandates
Incentives
15
14
15
14
13
11
12
13
11
13
13
12
11
12
10
8
11
11
8
10
9
11
8
8
11
16
15
14
15
14
16
15
13
14
11
12
11
13
11
13
14
10
8
12
8
9
6
11
10
5
NUMBER OF CLEAN TECH POLICIES ENACTED BY STATE (TOP 25)
Note: The above table and rankings are based on the “Regulations & Mandates” and “Incentives” subcategories of the U.S. Clean Tech Leadership Index, which include indicators such as renewable portfolio standards (RPS), utility on-bill financing, net metering, energy efficiency budgets, and building codes. See pages 25-26 for the full list of indicators. Sources include ACEEE, the Building Codes Assistance Project, C2ES, the Coalition for Green Capital, DSIRE, the DOE, EQ Research, IREC, and Vote Solar. For Interconnection Law/Policy, Net Metering Law/Policy, Commercial Building Energy Policy, and Residential Building Energy Policy, credit is given to states scoring “2” or higher on 0-4 scale. Subscribers to Clean Edge’s Leadership Index have access to the full dataset and policy checklist.

© 2015 Clean Edge, Inc. (www.cleanedge.com). This report, and the models and analysis contained herein, are the property of Clean Edge and may not be reproduced, published, or summarized for distribution or incorporation into a report or other document without prior approval. 192015 U.S. CLEAN TECH LEADERSHIP INDEX: STATE INDEX
0 5 10 15 20 25 30 35
Wisconsin
Maine
Utah
Louisiana
Arkansas
Montana
Iowa
Indiana
Texas
Florida
Georgia
South Carolina
Oklahoma
Mississippi
Tennessee
Kansas
Virginia
Alabama
Wyoming
South Dakota
West Virginia
Alaska
Idaho
Nebraska
North Dakota
Regulations & Mandates
Incentives
10
6
10
11
10
7
6
10
8
7
10
9
10
9
9
6
6
8
8
8
5
5
5
4
4
7
12
6
5
6
11
11
5
7
6
2
3
2
1
6
5
3
2
1
4
2
2
3
1
NUMBER OF CLEAN TECH POLICIES ENACTED BY STATE (BOTTOM 25)
Note: The above table and rankings are based on the “Regulations & Mandates” and “Incentives” subcategories of the U.S. Clean Tech Leadership Index, which include indicators such as renewable portfolio standards (RPS), utility on-bill financing, net metering, energy efficiency budgets, and building codes. See pages 25-26 for the full list of indicators. Sources include ACEEE, the Building Codes Assistance Project, C2ES, the Coalition for Green Capital, DSIRE, the DOE, EQ Research, IREC, and Vote Solar. For Interconnection Law/Policy, Net Metering Law/Policy, Commercial Building Energy Policy, and Residential Building Energy Policy, credit is given to states scoring “2” or higher on 0-4 scale. Subscribers to Clean Edge’s Leadership Index have access to the full dataset and policy checklist.

CAPITAL
LOWER RANKING HIGHER RANKING
© 2015 Clean Edge, Inc. (www.cleanedge.com). This report, and the models and analysis contained herein, are the property of Clean Edge and may not be reproduced, published, or summarized for distribution or incorporation into a report or other document without prior approval. 202015 U.S. CLEAN TECH LEADERSHIP INDEX: STATE INDEX
CaliforniaMassachusettsVermontColoradoNew YorkOregonMichiganIllinoisConnecticutNew HampshireNew JerseyNew MexicoTexasPennsylvaniaWashingtonNorth CarolinaDelawareRhode IslandOhioVirginiaHawaiiGeorgiaTennesseeMaineMarylandMontanaSouth CarolinaMinnesotaIowaIdahoIndianaNevadaKansasAlabamaWest VirginiaLouisianaWisconsinArizonaUtahMissouriArkansasFloridaWyomingKentuckyNebraskaOklahomaSouth DakotaNorth DakotaMississippiAlaska
90.285.272.371.067.466.164.763.857.150.848.348.348.046.746.443.940.039.835.533.633.332.931.428.825.222.421.621.120.820.318.318.216.315.815.815.113.9
8.88.58.25.34.53.73.12.12.01.81.30.50.2
123456789
1011121314151617181920212223242526272829303132333435363738394041424344454647484950
RANK STATE LEADERSHIP SCORE

© 2015 Clean Edge, Inc. (www.cleanedge.com). This report, and the models and analysis contained herein, are the property of Clean Edge and may not be reproduced, published, or summarized for distribution or incorporation into a report or other document without prior approval. 212015 U.S. CLEAN TECH LEADERSHIP INDEX: STATE INDEX
CAPITAL OVERVIEWThe Capital category consists of two subcategories: Financial Capital, which mea-
sures clean-tech investment activity; and Human and Intellectual Capital, which
gauges patent activity and the presence of top-rated educational and research
institutions and industry incubators. In the 2015 Index, for the first time in the
Index’s six years, Massachusetts was dethroned as the #1 Capital state, with Cali-
fornia moving up from #2 in 2014 to take its place. Massachusetts, the biggest
hub of clean-tech venture capital outside of California, retained its spot atop the
Financial Capital subcategory, while the Golden State supplanted New York (#2 in
this year’s Index) as the #1 state in the Human and Intellectual Capital subcategory.
The rest of the top 10 Capital states remained largely unchanged: only Oregon
(up five spots to #6) and New Hampshire (up eight to #10) are newcomers to the
top 10, replacing New Mexico and New Jersey. The two subcategories each saw
three new entrants to their top 10 rankings: Montana (#6), Illinois (#9), and New
York (#10) in Financial Capital; and Oregon (#6), Massachusetts (#9), and New
Hampshire (#10) in Human & Intellectual Capital.
In the Financial Capital subcategory, overall VC investment in clean tech in the U.S.
saw an uptick in 2014. Approximately $5.5 billion in VC dollars were invested in
clean-tech companies in 2014 (a figure that includes companies in renewables,
storage, efficiency, smart grid, recycling, and advanced transportation technology),
a 28% jump from $4.3 billion in 2013. This increase came despite 55 fewer deals
being completed in 2014. In 2013, 71% of all deals went to the top 10 states in
CLEAN ENERGY VENTURE CAPITAL INVESTMENT (DOLLARS PER CAPITA, 2014)
STATE
RANK
DOLLARS INVESTED PER
CAPITATOTAL DOLLARS ($,
MILLIONS) TOTAL DEALS
CALIFORNIA 1 $72.13 $2,798.9 219
MASSACHUSETTS 2 $55.11 $371.7 56
VERMONT 3 $50.31 $31.5 4
COLORADO 4 $32.11 $172.0 36
MONTANA 5 $29.77 $30.5 3
TEXAS 6 $25.12 $677.2 36
WASHINGTON 7 $24.85 $175.5 18
MISSOURI 8 $20.38 $123.6 12
ILLINOIS 9 $15.35 $197.7 20
NORTH CAROLINA 10 $14.22 $141.4 11
Source: Cleantech Group data with Clean Edge analysis. Cleantech Group investment data used includes venture and growth financing rounds in the following sectors: Advanced Materials, Agriculture & Food, Air, Biofuels & Biomaterials, Biomass Generation, Energy Efficiency, Energy Storage, Fuel Cells & Hydrogen, Geothermal, Hydro & Marine Power, Recycling & Waste, Smart Grid, Solar, Transportation, Water & Wastewater, Wind, and Other Cleantech.Full dataset available to subscription clients.
total deals; in 2014, that number increased to 79%. California alone contributed
half of all total VC dollars and more than one-third of total deals.
In contrast to the rise in VC investments, the number of total clean-energy patents
(part of the Human and Intellectual Capital subcategory) barely budged in 2014.
On a per-capita basis, the top 10 states in clean-energy patents granted in 2014

© 2015 Clean Edge, Inc. (www.cleanedge.com). This report, and the models and analysis contained herein, are the property of Clean Edge and may not be reproduced, published, or summarized for distribution or incorporation into a report or other document without prior approval. 222015 U.S. CLEAN TECH LEADERSHIP INDEX: STATE INDEX
Source: Cleantech Group data with Clean Edge analysis. Full dataset available to subscription clients.
remained almost entirely intact from 2013, with the only
new entrant being Arizona (which nudged neighboring
New Mexico out of the top 10). Delaware, despite being
awarded only 43 patents in 2014, continued to punch far
above its weight on a per-capita basis. It leads the pack
in this measure for the third consecutive year by a wide
margin. The Index separately tracks patents awarded over
a longer timeframe (2002-2014), and here, too, Delaware
is #1, wresting the top spot from Michigan. Much of
Delaware’s success in clean energy patent activity can be
traced to DuPont, which is headquartered in the state and
has a long research and development tradition in solar PV
and fuel cells.
In addition to patents, the Human and Intellectual sub-
category tracks the presence of clean-energy incubators,
top-ranked green MBA and Master’s programs, and De-
partment of Energy research labs in each state. The lists of
states receiving credit under these indicators are remark-
ably similar. States on the West Coast and in the Northeast
(particularly New England) have several of each type of
institution, with smaller concentrations seen in the Rust
Belt and mid-Atlantic states. DOE labs, however, are more
geographically dispersed. In all, five states – California,
Colorado, Oregon, Illinois, and New York – receive credit
for having an incubator, top green Master’s program, and
Department of Energy research facility, while 15 additional
states receive credit on two out of those three indicators.
MONCNYPACOWAILMATXCA
Water & Wastewater
Wind
Other Cleantech
Energy Efficiency
Energy Storage
Fuel Cells & Hydrogen
Geothermal
Hydro & Marine Power
Recycling & Waste
Smart Grid
Solar
Transportation
Advanced Materials
Agriculture & Food
Air
Biofuels & Biochemicals
Biomass Generation
$0
$500
$1,000
$1,500
$2,000
$2,500
$3,000
2014 CLEAN ENERGY VENTURE CAPITAL - TOP 10 STATES BY TOTAL INVESTMENT ($US MILLIONS)

© 2015 Clean Edge, Inc. (www.cleanedge.com). This report, and the models and analysis contained herein, are the property of Clean Edge and may not be reproduced, published, or summarized for distribution or incorporation into a report or other document without prior approval. 232015 U.S. CLEAN TECH LEADERSHIP INDEX: STATE INDEX
Source: Data from Heslin Rothenberg Farley & Mesiti P.C. with Clean Edge analysis. Full dataset available to subscription clients.
CLEAN ENERGY PATENTS GRANTED (2014)
STATE
RANKPATENTS PER 1
MILLION PEOPLETOTAL
PATENTS
DELAWARE 1 45.7 43
MICHIGAN 2 22.9 227
NEW HAMPSHIRE 3 13.5 18
VERMONT 4 11.1 7
CALIFORNIA 5 9.9 385
CONNECTICUT 6 8.3 30
MASSACHUSETTS 7 8.1 55
COLORADO 8 7.1 38
NEW YORK 9 6.7 132
ARIZONA 10 5.9 40
Source: Data from Heslin Rothenberg Farley & Mesiti P.C. with Clean Edge analysis.Full dataset available to subscription clients.
0
50
100
150
200
250
300
350
400
PAAZDEILMAOHTXNYMICA
Hydro
Geothermal
Biofuels
Tidal/Wave
Hybrid/Electric
Solar
Wind
Fuel Cells
2014 TOTAL CLEAN-ENERGY PATENTS GRANTEDTOP 10 STATES

© 2015 Clean Edge, Inc. (www.cleanedge.com). This report, and the models and analysis contained herein, are the property of Clean Edge and may not be reproduced, published, or summarized for distribution or incorporation into a report or other document without prior approval. 242015 U.S. CLEAN TECH LEADERSHIP INDEX: STATE INDEX
STATE INDEX METHODOLOGYHow is the State Index constructed?The structure of the State Index includes four distinct layers. The top layer, the
State Index itself, is a set of 50 state scores which evaluates each state based on
involvement and leadership in clean technology. Results of the top layer are derived
from performance in three equally weighted categories – technology, policy, and
capital – that each play an important role in a state’s positioning in the clean-tech
industry. Each of these categories is composed of two or three subcategories,
which themselves include a set of individual indicators. Some minor methodology
changes were made in this edition of the State Index, but generally the structure
remains the same as in previous years.
How is the State Index calculated?The overall State Index measures each state on a 100-point scale and is the result
of many calculations made at the indicator, subcategory, and category levels.
First, INDICATOR SCORES are calculated on a scale of 0 to 100. The best-performing
state in an individual indicator receives a score of 100; the worst-performing state
gets a 0. All other states receive scores based on where they fall between the best
and worst-performing states.
To put states on an even playing field, all quantitative indicators are adjusted for
state size using metrics such as state population, state GDP, electricity generation
capacity, etc. By reporting in terms of per capita or percent of state totals, smaller
states are not punished for having relatively smaller economies.
Several indicators, like those related to policy, are qualitative rather than quantita-
tive. In this case, qualifying states receive indicator scores of 100 and non-qualifying
states get 0.
SUBCATEGORY SCORES range from 0 to 100 and are calculated in the same fashion
as individual indicators, with a score of 100 given to the state with the best aver-
age indicator score in each subcategory, and the state with the lowest average
indicator score receiving a 0. All other states receive scores between 0 and 100
based on performance relative to the best and worst-performing states.
CATEGORY SCORES are calculated from a simple averaging of underlying subcat-
egory scores; and the ultimate STATE CLEAN ENERGY INDEX SCORES are calculated
from averaging the three equally weighted category scores
Data SourcesAlong with an extensive level of clean-energy data mining from sources in the pub-
lic domain, Clean Edge has also teamed up with private data providers to offer the
highest level of industry intelligence. Private data partners include Cleantech Group,
EQ Research LLC, Heslin Rothenberg Farley & Mesiti P.C., and IHS Automotive.

© 2015 Clean Edge, Inc. (www.cleanedge.com). This report, and the models and analysis contained herein, are the property of Clean Edge and may not be reproduced, published, or summarized for distribution or incorporation into a report or other document without prior approval. 252015 U.S. CLEAN TECH LEADERSHIP INDEX: STATE INDEX
TECHNOLOGY
The following is a list of indicators used to calculate the State Index. Indicators
are grouped by subcategory and are shaded according to which category they are
included in.
POLICY
CLEAN ELECTRICITYUtility-Scale Clean Electricity Generation (2014, MWh % of Total)
Utility-Scale Clean Electricity Generation incl. Hydro & Biomass (2014, MWh % of Total)
Utility-Scale Wind Electricity Generation (2014, % of Total)
Utility-Scale Solar Electricity Generation (2014, % of Total)
Utility-Scale Geothermal Electricity Generation (2014, % of Total)
Utility-Scale Hydro Electricity Generation (2014, % of Total)
Utility-Scale Biomass Electricity Generation (2014, MWh % of Total)
Installed Wind Capacity (2014, % of Total)
Installed Solar Capacity (2013, % of Total)
Installed Geothermal Capacity (2014, % of Total)
Installed Fuel Cell Capacity (2014, % of Total)
Installed Energy Storage Capacity (2014, % of Total)
CLEAN TRANSPORTATIONHybrid Electric Vehicles Per 1M People (as of 1/1/15)
Electric Vehicles Per 1M People (as of 1/1/15)
Plug-In Hybrid Electric Vehicles Per 1M People (as of 1/1/15)
Natural Gas Vehicles Per 1M People (as of 1/1/15)
Electric Vehicle Charging Stations Per 1M People (as of 12/31/14)
E85 & B20 Fueling Stations Per 1M People (as of 12/31/14)
CNG Fueling Stations Per 1M People (as of 12/31/14)
ENERGY INTELLIGENCE & GREEN BUILDINGElectricity Consumption Per Capita (2014, Annual kWh)
Electric Productivity (2013, State GDP Dollars Per kWh Consumed)
LEED-Certified Projects Per 1M People (as of 12/31/14)
LEED-Certified Square Feet Per Capita (as of 12/31/14)
Energy Star Buildings & Plants Per 1M People (as of 12/31/14)
Energy Star Buildings & Plants Square Feet Per Capita (as of 12/31/14)
Energy Star Homes Per 1K People (as of 12/31/14)
Smart Meter Market Penetration (2013, % of Total Meters)
ACEEE 2014 State Energy Efficiency Scorecard Performance
Gridwise Alliance 2014 Grid Modernization Index Performance
REGULATIONS & MANDATESRenewable Portfolio Standard
Strong RPS: At least 20% by 2020 or 25% by 2025
Smart RPS: No Clean Coal
Smart RPS: No Nuclear
Smart RPS: Solar/DG Provision
Energy Efficiency Resource Standard
State Renewable Fuel Standard
Climate Action Plan
GHG Reduction Target
Membership in Active Cap-and-Trade Market
Low Carbon Fuel Standard
State Fleet High Efficiency Vehicle Requirement
Zero-Emissions Vehicle (ZEV) Requirement
Mandated Green Power Purchasing Option
Interconnection Law/Policy
Net Metering Law/Policy
Commercial Building Energy Policy
Residential Building Energy Policy

© 2015 Clean Edge, Inc. (www.cleanedge.com). This report, and the models and analysis contained herein, are the property of Clean Edge and may not be reproduced, published, or summarized for distribution or incorporation into a report or other document without prior approval. 262015 U.S. CLEAN TECH LEADERSHIP INDEX: STATE INDEX
CAPITALPOLICY (CONT.)INCENTIVESGrants - Renewable Energy
Grants - Energy Efficiency
Loans - Renewable Energy
Loans - Energy Efficiency
Rebates - Renewable Energy
Rebates - Energy Efficiency
Bonds - Renewable Energy
Bonds - Energy Efficiency
Clean-Tech Vehicle Purchasing Incentive
Utility Revenue Decoupling - Electricity
Utility Revenue Decoupling - Natural Gas
Utility Performance Incentives - Electricity
Utility Performance Incentives - Natural Gas
Utility On-Bill Financing
Green Bank
PACE Legislation
Third Party Ownership
Community Renewables
FINANCIAL CAPITALVenture Capital Investment ($ Per Capita, 2012-2014)
Venture Capital Investment (Deals Per 1 M People, 2012-2014)
Venture Capital Investment ($ Per Capita, 2014)
Venture Capital Investment (Deals Per 1M People, 2014)
Utility Energy Efficiency Program Budget ($ Per Capita, 2013)
State Clean Energy Fund or Public Benefit Fund
HUMAN & INTELLECTUAL CAPITALClean Energy Patents (Patents Per 1M People, 2014)
Clean Energy Patents (Patents Per 1M People, 2002-2014)
Presence of DOE Lab
Presence of Clean Energy Incubator and/or Accelerator
Presence of Top-Ranked Green Master's Program

© 2015 Clean Edge, Inc. (www.cleanedge.com). This report, and the models and analysis contained herein, are the property of Clean Edge and may not be reproduced, published, or summarized for distribution or incorporation into a report or other document without prior approval. 272015 U.S. CLEAN TECH LEADERSHIP INDEX: METRO INDEX
METRO INDEX2015 U.S. Clean Tech Leadership Index
Full Metro Index Datasets AvailableClean Edge offers subscription access to the full State and Metro Index datasets. These include data for the top 50 Metro Area regions on green building deployment, electric and hybrid vehicles, large facility carbon emissions, VC investments, clean-energy patents, and much more. For more information on subscriptions, please see page 49.

© 2015 Clean Edge, Inc. (www.cleanedge.com). This report, and the models and analysis contained herein, are the property of Clean Edge and may not be reproduced, published, or summarized for distribution or incorporation into a report or other document without prior approval. 282015 U.S. CLEAN TECH LEADERSHIP INDEX: METRO INDEX
San Francisco, CASan Jose, CAPortland, ORSan Diego, CAWashington, DC Los Angeles, CA Seattle, WABoston, MA Austin, TX Chicago, IL Denver, CO Sacramento, CAMinneapolis, MNNew York, NYAtlanta, GARiverside, CAPhiladelphia, PASalt Lake City, UT Dallas, TX Detroit, MI Columbus, OH Houston, TX Phoenix, AZOklahoma City, OK Pittsburgh, PABaltimore, MD Charlotte, NC Nashville, TNKansas City, MORaleigh, NC Las Vegas, NV Hartford, CT Milwaukee, WIIndianapolis, IN Cleveland, OH Providence, RIVirginia Beach, VABuffalo, NY St. Louis, MOSan Antonio, TXCincinnati, OH Richmond, VA Louisville, KY Miami, FLOrlando, FLTampa, FLJacksonville, FL Memphis, TNNew Orleans, LABirmingham, AL
86.580.659.755.555.253.852.249.246.445.843.542.737.836.436.434.832.528.928.928.427.527.327.025.224.424.223.722.721.721.721.620.620.620.519.619.418.518.417.417.215.614.513.312.311.910.0
7.36.25.02.5
LOWER RANKING HIGHER RANKING
METRO INDEX001
-1314
-202
-1-729164
-1-6-111-83
-63
102
-12
-63
-12-8-45
-31
-35
-311
-22
-6-11
-100
123456789
1011121314151617181920212223242526272829303132333435363738394041424344454647484950
+/-RANK METRO AREA LEADERSHIP SCORE
Denver
San AntonioAustin
Houston
Kansas CitySt. Louis
Atlanta
CharlotteRaleigh
Virginia Beach
BaltimoreWashington, DC
New York
BostonProvidence
Philadelphia
Richmond
Hartford
Louisville
Orlando
Miami
Birmingham
New Orleans
Los Angeles
San Francisco
Portland
Seattle
Sacramento
San Diego
Riverside
Las Vegas
Salt Lake City
Phoenix
Oklahoma City
Minneapolis
MemphisNashville
MilwaukeeDetroit
Jacksonville
Tampa
Indianapolis
Pittsburgh
Buffalo
Cleveland
Chicago
San Jose Cincinnati
Dallas
Columbus

© 2015 Clean Edge, Inc. (www.cleanedge.com). This report, and the models and analysis contained herein, are the property of Clean Edge and may not be reproduced, published, or summarized for distribution or incorporation into a report or other document without prior approval. 292015 U.S. CLEAN TECH LEADERSHIP INDEX: METRO INDEX
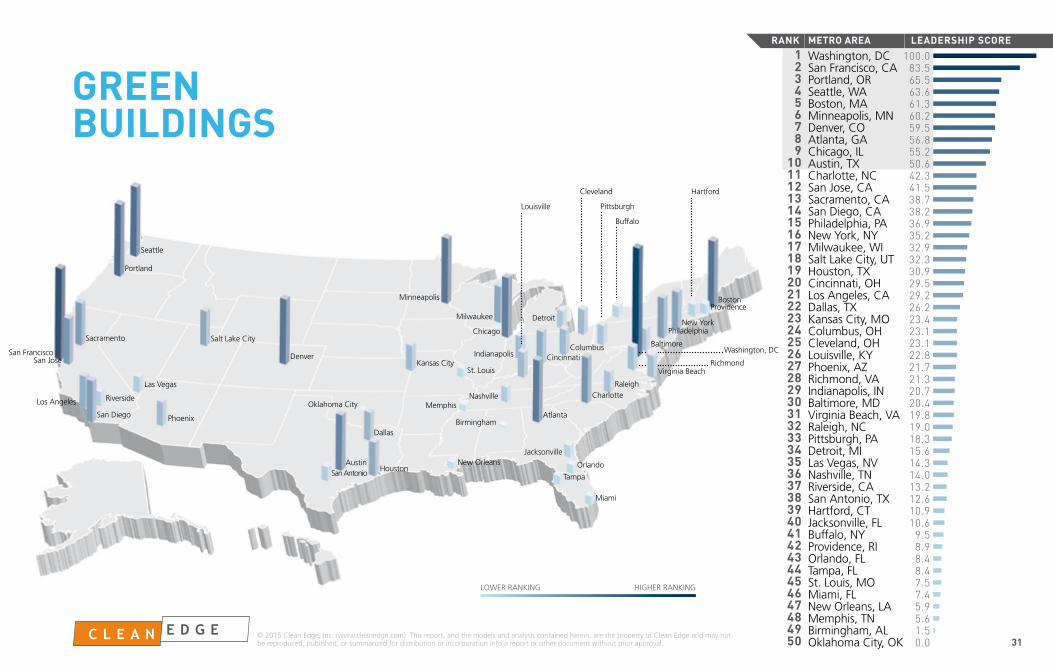
2014 METRO INDEX RESULTSAs has been the case since our first Metro Index in 2012, the San Francisco Bay
Area remains the nexus of top clean-tech leadership in the U.S. The San Francisco
metro area is #1 in the Index for the third straight year with southern neighbor San
Jose in second place, although the rankings grew tighter this year. San Francisco’s
nearly 15-point lead a year ago shrunk to about six points, with an overall score
of 86.5 to San Jose’s 80.6. But both remained well ahead of #3 Portland at 59.7.
As in the past two years, four metros in the #1 state of California dominate the
top of the Metro Index; San Diego dropped from third to fourth this year while Los
Angeles rose from #7 to #6. But Sacramento, ranking #5 in 2014, dropped out of
the top 10 to #12 this year due mainly to a big drop in the Clean Electricity and
Carbon Management category from #1 last year to #18. Denver (10th last year)
also fell off the leaderboard to 11th. Seattle, out of the top 10 last year for the first
time, rebounded to place seventh. Tenth-place Chicago joins the top 10 for the
first time after placing 12th in each of the first three years of the Index.
The Top 10 Metro Areas SAN FRANCISCO, CA – Although its score fell from 94.4 to 86.5, San Francisco
continued as the leading clean-tech metro with high rankings in the four Metro
Index categories. Across the categories, the City by the Bay notches a #1 place-
ment (in Advanced Transportation), two seconds, and a third. The undisputed hub
of the U.S. clean-tech industry along with San Jose, San Francisco excels in public
and private-sector leadership, as well as green consumer choices such as electric
and hybrid vehicle ownership.
SAN JOSE, CA – San Jose holds down the #2 spot among metros for the third
straight year, improving its 2014 score of 79.7 to 80.6. The core of its leadership is
the Clean-Tech Investment, Innovation & Workforce category, where its top score
of 100 outpaces #2 San Francisco by nearly 30 points. First in VC dollars and deals
and second in patents, the Silicon Valley metro continues to epitomize the innova-
tion/finance ecosystem driving clean-tech lab breakthroughs to commercialization.
PORTLAND, OR – Portland places #3 for the third time in four years, nudging
ahead of 2014 third-place finisher San Diego. The Rose City leads all metros in
Clean Electricity & Carbon Management, thanks to strong hydroelectric power
resources, low carbon emissions from large facilities, and a strong commitment
to climate protection and reporting. Portland also ranks #3 in the Green Buildings
category, a sector where the metro area has traditionally led in design services as
well as deployment.
SAN DIEGO, CA – San Diego’s goal to establish a thriving clean-tech ecosystem
took it from a #11 ranking in 2012 to the top tier of metros. Clean Tech San Diego
is arguably the sector’s preeminent regional industry association, with nearly 900
member companies. Although down one place from last year, San Diego (with a
55.5 score) is a top 10 metro in three of four Index categories; its best showing is
#4 in Clean Electricity and Carbon Management.

© 2015 Clean Edge, Inc. (www.cleanedge.com). This report, and the models and analysis contained herein, are the property of Clean Edge and may not be reproduced, published, or summarized for distribution or incorporation into a report or other document without prior approval. 302015 U.S. CLEAN TECH LEADERSHIP INDEX: METRO INDEX
WASHINGTON, DC – The nation’s capital metro jumped three places to its
best-ever finish in the Index, improving its 53.6 score last year to 55.2, just barely
behind San Diego. Washington’s only top 10 category is Green Buildings, but it’s
#1 in that category (as in all four years of the Index) by nearly 20 points over #2
San Francisco. The metro places in the top 15 in the three other categories, and is
the highest-ranking metro in the East.
LOS ANGELES, CA – The most populous top 10 metro with 13.3 million people
(second in size to New York), Los Angeles continued its consistency with a #6
ranking; it has placed between fifth and seventh in every year of the Index. Los
Angeles places second behind Portland in Clean Electricity and Carbon Manage-
ment, in a region without major hydroelectric resources. Its #3 rank in Advanced
Transportation includes a tie for the eighth best score in the public transportation
ridership indicator – an encouraging sign in the iconic land of freeways.
SEATTLE, WA – Seattle leapt four places to #7, adding four points to last year’s
score of 48.2 for its highest ranking since placing fifth in the Index’s inaugural
year of 2012. A #4 ranking in Green Buildings and top 10 placement in two other
categories offset a #19 rank in Clean-Tech Investment, Innovation & Workforce.
Symbolizing Seattle’s green building leadership is the Bullitt Center in the city’s
Central District, the net-zero energy structure considered by many to be the na-
tion’s greenest commercial building.
BOSTON, MA – Boston dropped two spots from last year, its score falling from
58.3 to 49.2, but still posted its second-highest ranking in the four years of the
Index. Boston held the #3 rank in Clean-Tech Investment, Innovation and Work-
force from last year and also posted a #5 placement in Green Buildings. The Boston
metro is home to MIT’s myriad clean-tech breakthroughs and business spinoffs,
and innovators like Greentown Labs, an incubator/accelerator with more than 40
member companies.
AUSTIN, TX – The only Top 10 metro (besides Washington, DC) not located in a
Top 10 state, Austin has consistently ranked ninth or 10th in the Index’s four
years. Like San Jose with a similar metro population under two million, Austin has
developed a strong clean-tech ecosystem among government, industry, finance,
academia, and its progressive municipal utility, Austin Energy. Austin repeats its
#5 rank from last year in Clean-Tech Investment, Innovation & Workforce, and
improved from ninth to sixth in Clean Electricity and Carbon Management.
CHICAGO, IL – After three years at #12, the Windy City makes the top 10 for
the first time, upping its 41.1 score last year to 45.8. Chicago earns a top 10 spot
in three of the four Index categories, its highest rank a #7 in Clean-Tech Invest-
ment, Innovation & Workforce. In a city considered the birthplace of the modern
skyscraper, Mayor Rahm Emanuel has made clean tech a priority with programs
such as the Chicago Infrastructure Trust, a green bank for energy efficiency im-
provements now looking to finance solar power projects as well.
© 2015 Clean Edge, Inc. (www.cleanedge.com). This report, and the models and analysis contained herein, are the property of Clean Edge and may not be reproduced, published, or summarized for distribution or incorporation into a report or other document without prior approval. 312015 U.S. CLEAN TECH LEADERSHIP INDEX: METRO INDEX
GREENBUILDINGS
LOWER RANKING HIGHER RANKING
Washington, DC San Francisco, CAPortland, ORSeattle, WABoston, MA Minneapolis, MNDenver, CO Atlanta, GAChicago, IL Austin, TX Charlotte, NC San Jose, CASacramento, CASan Diego, CAPhiladelphia, PANew York, NYMilwaukee, WISalt Lake City, UT Houston, TX Cincinnati, OH Los Angeles, CA Dallas, TX Kansas City, MOColumbus, OH Cleveland, OH Louisville, KY Phoenix, AZRichmond, VA Indianapolis, IN Baltimore, MD Virginia Beach, VARaleigh, NC Pittsburgh, PADetroit, MI Las Vegas, NV Nashville, TNRiverside, CASan Antonio, TXHartford, CT Jacksonville, FL Buffalo, NY Providence, RIOrlando, FLTampa, FLSt. Louis, MOMiami, FLNew Orleans, LAMemphis, TNBirmingham, AL Oklahoma City, OK
100.083.565.563.661.360.259.556.855.250.642.341.538.738.236.935.232.932.330.929.529.226.223.423.123.122.821.721.320.720.419.819.018.315.614.314.013.212.610.910.6
9.58.98.48.47.57.45.95.61.50.0
123456789
1011121314151617181920212223242526272829303132333435363738394041424344454647484950
RANK METRO AREA LEADERSHIP SCORE
Cleveland
Denver
San AntonioAustin
Houston
Kansas CitySt. Louis
Atlanta
CharlotteRaleigh
Virginia Beach
Baltimore
New York
BostonProvidence
Philadelphia
Cincinnati
Orlando
Miami
Birmingham
New Orleans
San Jose
Los Angeles
San Francisco
Portland
Seattle
Sacramento
San Diego
Riverside
Las Vegas
Salt Lake City
Phoenix
Oklahoma City
Minneapolis
Milwaukee
Chicago
Detroit
Jacksonville
Tampa
Indianapolis
Pittsburgh
Buffalo
Louisville
Washington, DC
MemphisNashville
Dallas
Columbus
Richmond
Hartford

© 2015 Clean Edge, Inc. (www.cleanedge.com). This report, and the models and analysis contained herein, are the property of Clean Edge and may not be reproduced, published, or summarized for distribution or incorporation into a report or other document without prior approval. 322015 U.S. CLEAN TECH LEADERSHIP INDEX: METRO INDEX
GREEN BUILDINGS OVERVIEWThe Green Buildings category of the Metro Clean Tech Index uses five equally
weighted indicators to evaluate leadership in each metro area. Two of these in-
dicators come from the U.S. Green Building Council (USGBC). Using the USGBC’s
Leadership in Energy and Environmental Design (LEED) project database, the Index
calculates the number of projects and square feet per capita for each of the 50
largest metro areas. Cities and urban areas are a key part of the LEED market in
the U.S., with more than half of all certified projects and two-thirds of all square
footage located in the 50 metropolitan statistical areas covered in the Metro Index.
Two other indicators track the U.S. Environmental Protection Agency’s standard
registry of Energy Star-qualified buildings – the EPA’s rating system for energy ef-
ficiency – by the number of projects and square feet per capita in each metro area.
A fifth indicator, added in this year’s Index, is a policy metric tracking whether a
metro’s principal city requires energy use disclosure for its buildings.
This category shows strong correlation with overall metro leadership, with seven
of the top 10 metros in Green Buildings also ranking in the top 10 in the overall
Index. The exceptions are Denver (#11 overall), Minneapolis (#13), and Atlanta
(#15). Eight of the top 10 Green Buildings metros return from last year, although
only the top two, Washington, DC and San Francisco, repeat the same ranking.
Both Denver (#3) and Boston (#5) jumped four places from the 2014 Index. Join-
ing the top 10 this year are #9 Chicago and #10 Austin, while San Diego and
Sacramento, ranking sixth and seventh last year, dropped into the teens. The top
10 shows good regional diversity, with metros from the East and West Coasts,
South, Midwest, and Rocky Mountains. Public-sector buildings generally lead the
way in this sector, and five of the top 10 metros include state capitals, with the
nation’s capital topping the field.
Perennial category leader Washington, DC increased its lead over #2 San Francisco
from last year’s Index, to nearly 17 points. The nation’s capital metro added nearly
500 new LEED-certified projects in 2014 for a total of 1,327, or nearly 220 projects
LEED CERTIFIED PROJECTS (2014)METRO AREA RANK PROJECTS PER 1M PEOPLE TOTAL PROJECTS
WASHINGTON, DC 1 219.9 1,327
SAN FRANCISCO, CA 2 170.2 782
SAN JOSE, CA 3 164.4 321
PORTLAND, OR 4 149.0 350
SEATTLE, WA 5 148.7 546
DENVER, CO 6 132.5 365
SAN DIEGO, CA 7 125.9 411
BOSTON, MA 8 122.1 578
BALTIMORE, MD 9 119.2 332
SALT LAKE CITY, UT 10 110.1 127
Source: USGBC data with Clean Edge analysis. USGBC data is gathered from the LEED project registration database and includes all projects certified through 12/31/2014. This does not include LEED for Homes projects.Full dataset available to subscription clients.

© 2015 Clean Edge, Inc. (www.cleanedge.com). This report, and the models and analysis contained herein, are the property of Clean Edge and may not be reproduced, published, or summarized for distribution or incorporation into a report or other document without prior approval. 332015 U.S. CLEAN TECH LEADERSHIP INDEX: METRO INDEX
per million people. Washington’s raw total actually leads the U.S, topping that of the
three most populous metros – New York, Los Angeles, and Chicago. Of the top 10
in this indicator, six other metros – San Francisco, Seattle, Denver, San Diego, Boston,
and Baltimore – each added more than 100 LEED-certified projects during the year.
Energy Star’s energy-specific requirements differ from LEED’s broader overall green
building criteria, and track only commercial and multi-unit residential projects,
resulting in a different metro area leadership mix. Charlotte takes the top spot
here, moving up from #4 last year with 188.2 projects per million people. Denver
remained at #2 while Sacramento dropped from first to third. All of last year’s
top 10 metros made the leaderboard again in 2015, in a slightly different order.
Leaders in this indicator include manufacturing centers such as Milwaukee (just
17th in the overall Index) and Louisville (26th).
To reflect the importance of transparency in a building’s energy performance over
its lifespan, not just when it’s constructed, the 2015 Index added the building
energy-use disclosure requirement indicator. Tracked by the non-profit Institute
for Market Transformation in Washington, DC, this metric credits metros whose
principal city has adopted a mandate that large buildings publicly disclose their
energy-use data. Austin and Washington DC were the first to do so in 2008 and
nine others have followed, including Atlanta and Portland earlier this year. Not
surprisingly, this indicator is a strong proxy for overall Green Buildings leadership.
Nine of the 11 metros receiving credit are in the category top 10; New York and
Philadelphia are the others.
BUILDING ENERGY USE DISCLOSURE REQUIREMENTMETRO AREA YEAR ENACTED
AUSTIN, TX 2008
WASHINGTON, DC 2008
NEW YORK, NY 2009
SAN FRANCISCO, CA 2011
PHILADELPHIA, PA 2012
SEATTLE, WA 2012
BOSTON, MA 2013
CHICAGO, IL 2013
MINNEAPOLIS, MN 2013
ATLANTA, GA 2015
PORTLAND, OR 2015
Source: Institute for Market Transformation. This table lists all of the primary cities in the Metro Index that have enacted a benchmarking and disclosure ordinance. Berkeley, CA (part of the San Francisco MSA) and Cambridge, MA (part of the Boston MSA) are the two other U.S. cities with building energy use disclosure requirements.Full dataset available to subscription clients.
ENERGY STAR BUILDINGS AND PLANTS (2014)METRO AREA RANK PROJECTS PER 1M PEOPLE TOTAL PROJECTS
CHARLOTTE, NC 1 188.2 448
DENVER, CO 2 181.5 500
SACRAMENTO, CA 3 174.7 392
WASHINGTON, DC 4 171.5 1035
SAN FRANCISCO, CA 5 160.9 739
SAN DIEGO, CA 6 150.5 491
LOUISVILLE, KY 7 143.3 182
MILWAUKEE, WI 8 138.0 217
MINNEAPOLIS, MN 9 137.3 480
PORTLAND, OR 10 135.8 319
Source: Energy Star with Clean Edge analysis. Energy Star Buildings and Plants includes all projects that have qualified for Energy Star accreditation through 2014. This does not include Energy Star certification for new homes.Full dataset available to subscription clients.

© 2015 Clean Edge, Inc. (www.cleanedge.com). This report, and the models and analysis contained herein, are the property of Clean Edge and may not be reproduced, published, or summarized for distribution or incorporation into a report or other document without prior approval. 342015 U.S. CLEAN TECH LEADERSHIP INDEX: METRO INDEX
ADVANCED TRANSPORTATION
LOWER RANKING HIGHER RANKING
San Francisco, CASan Jose, CALos Angeles, CA Riverside, CASan Diego, CASeattle, WASacramento, CASalt Lake City, UT Portland, OROklahoma City, OK Phoenix, AZMinneapolis, MNNashville, TNWashington, DC New York, NYChicago, IL Atlanta, GADenver, CO Boston, MA Indianapolis, IN Austin, TX Milwaukee, WIBaltimore, MD Detroit, MI Buffalo, NY Kansas City, MOHartford, CT St. Louis, MORaleigh, NC Columbus, OH Dallas, TX Orlando, FLPhiladelphia, PAProvidence, RIPittsburgh, PALas Vegas, NV Louisville, KY Tampa, FLCincinnati, OH Virginia Beach, VACharlotte, NC Miami, FLRichmond, VA San Antonio, TXHouston, TX Birmingham, AL Cleveland, OH Jacksonville, FL Memphis, TNNew Orleans, LA
100.094.768.264.463.057.355.454.651.444.439.737.836.034.432.932.231.730.029.327.927.627.527.526.425.723.422.422.422.321.721.720.318.218.017.516.215.214.313.913.612.912.411.611.411.1
8.56.34.10.40.0
123456789
1011121314151617181920212223242526272829303132333435363738394041424344454647484950
RANK METRO AREA LEADERSHIP SCORE
Denver
San AntonioAustin
Houston
Dallas
Kansas CitySt. Louis
Atlanta
CharlotteRaleigh
Virginia Beach
BaltimoreWashington, DC
New York
BostonProvidence
Philadelphia
Louisville
Columbus
Orlando
Miami
Birmingham
New Orleans
San Francisco
Portland
Seattle
Las Vegas
Salt Lake City
Phoenix
Oklahoma City
Minneapolis
MemphisNashville
MilwaukeeDetroit
Jacksonville
Tampa
Indianapolis
Pittsburgh
Buffalo
Cleveland
Chicago
San Jose
Los Angeles
San Diego
Riverside
Cincinnati
Sacramento
Richmond
Hartford

© 2015 Clean Edge, Inc. (www.cleanedge.com). This report, and the models and analysis contained herein, are the property of Clean Edge and may not be reproduced, published, or summarized for distribution or incorporation into a report or other document without prior approval. 352015 U.S. CLEAN TECH LEADERSHIP INDEX: METRO INDEX
ADVANCED TRANSPORTATION OVERVIEWThe Advanced Transportation category combines eight indicators to benchmark
U.S. metro areas in the transportation sector, which in many cities is a leading
source of CO2 emissions. Advanced Transportation indicators cover four types
of advanced vehicles, their related charging or fueling infrastructure, and public
transportation ridership. For the 2015 Index, we have begun tracking plug-in
electric hybrids such as the Chevy Volt, which had previously been included in the
electric vehicles indicator, in their own indicator.
West Coast metro areas once again dominate the top of this category. Coming
in first and second, just as in last year’s Index, are the neighboring metros of San
Francisco and San Jose. These two areas increased their lead over the rest of the
field this year, though San Francisco’s lead over San Jose has narrowed by eight
points. Three other California metros – Los Angeles (up five places from 2014),
Riverside (rising six spots), and San Diego (down one position) – take the next three
slots, while Sacramento holds steady at #7. The Pacific Northwest’s Seattle (#6,
down one) and Portland (#9, down three) also make an appearance. The only two
top-10 metros not located on the Pacific Coast are Salt Lake City (which tumbled
five spots this year to eighth, due largely to a poor showing in the new indicator
of plug-in electric hybrid registrations) and Oklahoma City (down one to 10th).
Readers should note that the vehicle registration data has one methodological
anomaly. The data is reported by Designated Market Area (DMA), and these geo-
graphic areas do not exactly align with the Metropolitan Statistical Area (MSA)
designations used in the other parts of the Metro Index. Practically speaking, this
affects only San Francisco/San Jose and Los Angeles/Riverside, which are respec-
tively combined into one DMA; they are separate and distinct MSAs throughout
the rest of the Index. Between them, these two DMAs combine for more than
650,000 advanced transportation vehicles on the road.
HYBRID ELECTRIC VEHICLES IN USE (2014)METRO AREA RANK HEVS PER 1K PEOPLE TOTAL HEVS
SAN FRANCISCO, CA 1 30.70 223,331
SAN JOSE, CA 2 30.70 223,331
SAN DIEGO, CA 3 21.37 69,469
LOS ANGELES, CA 4 20.35 331,211
RIVERSIDE, CA 5 20.35 331,211
SEATTLE, WA 6 19.85 100,538
WASHINGTON, DC 7 17.62 120,535
PORTLAND, OR 8 17.29 56,419
SACRAMENTO, CA 9 16.40 71,601
BOSTON, MA 10 13.84 90,391
Source: IHS Automotive data with Clean Edge analysis. IHS Automotive data is a snapshot of every vehicle in operation as of January 1, 2015. For this indicator the San Francisco and San Jose metro areas are combined, as are the Los Angeles and Riverside areas.Full dataset available to subscription clients.

© 2015 Clean Edge, Inc. (www.cleanedge.com). This report, and the models and analysis contained herein, are the property of Clean Edge and may not be reproduced, published, or summarized for distribution or incorporation into a report or other document without prior approval. 362015 U.S. CLEAN TECH LEADERSHIP INDEX: METRO INDEX
ELECTRIC VEHICLES IN USE (2014)METRO AREA RANK EVS PER 1K PEOPLE TOTAL EVS
SAN FRANCISCO, CA 1 3.77 27,417
SAN JOSE, CA 2 3.77 27,417
SAN DIEGO, CA 3 1.95 6,329
ATLANTA, GA 4 1.94 13,017
SEATTLE, WA 5 1.63 8,234
LOS ANGELES, CA 6 1.55 25,156
RIVERSIDE, CA 7 1.55 25,156
SACRAMENTO, CA 8 1.18 5,146
PORTLAND, OR 9 1.04 3,396
PHOENIX, AZ 10 0.72 3,825
Source: IHS Automotive data with Clean Edge analysis. IHS Automotive data is a snapshot of every vehicle in operation as of January 1, 2015. For this indicator the San Francisco and San Jose metro areas are combined, as are the Los Angeles and Riverside areas. In prior years, this indicator included plug-in hybrid electric vehicles like the Chevy Volt. However, plug-in vehicles are now tracked in a separate indicator. Full dataset available to subscription clients.
ELECTRIC VEHICLE CHARGING STATIONS (2014)
METRO AREA RANKEV CHARGING STATIONS
PER 1M PEOPLETOTAL EV CHARGING
STATIONS
PORTLAND, OR 1 112.9 265
SAN JOSE, CA 2 105.0 205
SAN FRANCISCO, CA 3 103.6 476
SEATTLE, WA 4 100.5 369
NASHVILLE, TN 5 86.5 155
SACRAMENTO, CA 6 76.2 171
SAN DIEGO, CA 7 71.7 234
ORLANDO, FL 8 65.5 152
HARTFORD, CT 9 61.8 75
AUSTIN, TX 10 58.7 114
Source: Clean Edge analysis of data gathered from the U.S. DOE Alternative Fuels & Advanced Vehicles Data Center. As of 12/31/2014.Full dataset available to subscription clients.
Registration numbers for the advanced vehicles (per thousand people) indicators
reflect the geographical make-up of the overall category rankings. The six California
metros each show up in the top-10 lists for electric vehicles (EVs), plug-in electric
vehicles (PHEVs), and hybrid electric vehicles (HEVs), as do Seattle and Portland. No
other metros can make this claim; in fact, only six other metros (Atlanta, Baltimore,
Boston, Detroit, Phoenix, and Washington DC) appear even once in the top-10
rankings for any of these three vehicle types. The San Francisco/San Jose DMA
leads all three indicators by healthy margins.
The list of metros hosting the most EV charging stations (per million people),
however, does not show the same geographic homogeneity. Many of the usual
suspects – including indicator leader Portland, San Jose, San Francisco, Seattle,
Sacramento, and San Diego – are there, but they are joined by Nashville (#5),
Orlando (#8), Hartford (#9), and Austin (#10). None of these metros seems poised
to make a leap up the vehicle rankings, but having the infrastructure in place could
promote growth in vehicle registrations.
The natural gas vehicle (NGV) numbers paint a different picture. As it did last year,
Salt Lake City leads the country in NGVs. It is once again followed by Oklahoma City,
though the gap between the two has narrowed significantly. These are the only
two metros with at least one NGV per thousand people. The remainder of the top
10 in this indicator is rounded out by the six California cities, along with St. Louis
and Dallas. Utah, Oklahoma, Missouri, and Texas all have incentives to purchase or
convert vehicles to natural gas, which could help explain NGVs’ prominence there,
as could the oil and gas extraction industries in Texas and Oklahoma. Salt Lake City
and Oklahoma City lead the nation in NGV stations per million, but here again cities
such as Birmingham, Buffalo, Kansas City, Milwaukee, and Pittsburgh show up as
top-10 NGV station metros despite having weak NGV vehicle registration numbers.

Chicago
© 2015 Clean Edge, Inc. (www.cleanedge.com). This report, and the models and analysis contained herein, are the property of Clean Edge and may not be reproduced, published, or summarized for distribution or incorporation into a report or other document without prior approval. 372015 U.S. CLEAN TECH LEADERSHIP INDEX: METRO INDEX
CLEAN ELECTRICITY & CARBON MANAGEMENT
LOWER RANKING HIGHER RANKING
Portland, ORLos Angeles, CA San Francisco, CASan Diego, CASan Jose, CAAustin, TX Seattle, WABoston, MA Dallas, TX Chicago, IL Columbus, OH Washington, DC Philadelphia, PARiverside, CAOklahoma City, OK Denver, CO Las Vegas, NV Sacramento, CAHouston, TX New York, NYMinneapolis, MNPhoenix, AZPittsburgh, PABaltimore, MD St. Louis, MOBuffalo, NY Atlanta, GASan Antonio, TXCleveland, OH Detroit, MI Raleigh, NC Indianapolis, IN Nashville, TNCharlotte, NC Providence, RIMiami, FLKansas City, MORichmond, VA Salt Lake City, UT Virginia Beach, VAMilwaukee, WIHartford, CT Memphis, TNCincinnati, OH Orlando, FLTampa, FLLouisville, KY New Orleans, LAJacksonville, FL Birmingham, AL
100.094.091.886.686.273.170.266.165.463.663.062.861.261.056.256.054.754.352.246.846.142.539.038.237.737.635.435.335.332.832.431.230.329.928.528.026.923.323.121.821.521.018.617.416.716.615.214.314.2
0.0
123456789
1011121314151617181920212223242526272829303132333435363738394041424344454647484950
RANK METRO AREA LEADERSHIP SCORE
Denver
San AntonioAustin
Houston
Kansas CitySt. Louis
Atlanta
CharlotteRaleigh
Virginia Beach
New York
BostonProvidence
Philadelphia
Louisville
CincinnatiColumbus
Orlando
Miami
Birmingham
New Orleans
San Francisco
Portland
Seattle
Salt Lake City
Phoenix
Minneapolis
MemphisNashville
MilwaukeeDetroit
Jacksonville
Tampa
IndianapolisSan Jose
Sacramento
Dallas
Oklahoma City
Pittsburgh
Buffalo
Cleveland
Los Angeles
San Diego
Riverside
Washington, DC
Las Vegas
Baltimore
Richmond
Hartford

© 2015 Clean Edge, Inc. (www.cleanedge.com). This report, and the models and analysis contained herein, are the property of Clean Edge and may not be reproduced, published, or summarized for distribution or incorporation into a report or other document without prior approval. 382015 U.S. CLEAN TECH LEADERSHIP INDEX: METRO INDEX
CLEAN ELECTRICITY & CARBON MANAGEMENT OVERVIEWThe top 10 metro areas in the Clean Electricity & Carbon Management category
remain quite similar from the 2014 Index, with eight of last year’s top 10 showing
up again this year. The top-ranked metro, Portland, jumped five spots into the
pole position, with four California metros – Los Angeles, San Francisco, San Diego,
and San Jose – rounding out the top five. The two new entrants into the top 10
are Seattle (#7) and Chicago (#10), which displace Sacramento (last year’s #1) and
Oklahoma City.
The Clean Electricity & Carbon Management category has undergone several
changes since last year’s Index. In an effort to better measure a metro region’s
clean electricity mix, the former Regional Electricity Mix indicator and methodology
has been replaced with two indicators that use state-level data as a proxy for local
clean energy generation. In addition, there is a new indicator that rewards cities’
commitments to combatting climate change by measuring and reducing their
carbon emissions, as assessed by whether they participate in any of three different
national or global reporting and reduction commitments.
The two Regional Electricity Mix indicators are akin to those in the Clean Electricity
subcategory of the State Index. One indicator includes solar, wind, and geothermal
generation; metros with high penetrations of solar and wind, such as the six Califor-
nia metros and Oklahoma City, dominate here. The second indicator adds biomass
and hydro to the mix; metros with large amounts of hydro – such as Seattle, Portland,
REGIONAL ELECTRICITY MIX (2014)
METRO AREA RANKPERCENT OF TOTAL GENERATION FROM SOLAR,
WIND, GEOTHERMAL, HYDRO, & BIOMASS
SEATTLE, WA 1 76.0%
PORTLAND, OR 2 73.9%
LOS ANGELES, CA 3 30.2%
RIVERSIDE, CA 3 30.2%
SACRAMENTO, CA 3 30.2%
SAN DIEGO, CA 3 30.2%
SAN FRANCISCO, CA 3 30.2%
SAN JOSE, CA 3 30.2%
BUFFALO, NY 9 23.5%
NEW YORK, NY 10 21.8%
OKLAHOMA CITY, OK 11 19.5%
LAS VEGAS, NV 12 18.7%
DENVER, CO 13 17.5%
MINNEAPOLIS, MN 14 16.8%
NASHVILLE, TN 15 13.3%
Source: EIA and U.S. Census with Clean Edge analysis. This indicator uses state-level electricity data reported to the EIA as a proxy for the electricity fuel mix of each metropolitan statistical area. For MSAs that cross state boundaries, this indicator is calculated based on the percentage of each state’s residents that reside in the MSA.Full dataset available to subscription clients.

© 2015 Clean Edge, Inc. (www.cleanedge.com). This report, and the models and analysis contained herein, are the property of Clean Edge and may not be reproduced, published, or summarized for distribution or incorporation into a report or other document without prior approval. 392015 U.S. CLEAN TECH LEADERSHIP INDEX: METRO INDEX
Buffalo, and New York – reign in this category. Six metros with high percentages of
renewable generation can be found in the top 10 overall Index rankings.
Another indicator in this category measures the amount of per-capita carbon emis-
sions from large emitters in 2013 (the last year for which data is available). Raleigh
takes the top spot this year, as it did last year; nine of this year’s top 10 metro areas
with the lowest emissions are the same as in last year’s Index (the exception being
Charlotte, which has been replaced by Hartford). The lowest-ranked performers
in this indicator, such as Birmingham and New Orleans, are home to large fossil
fuel-generation power plants and/or oil and natural gas production, transmission,
and refining facilities.
Three new indicators in this category reward cities for their leadership in com-
batting climate change. They include signing the U.S. Conference of Mayors’
Climate Protection Agreement (which most major cities have done); measuring
and reporting greenhouse gases through the CDP or carbonn Climate Registry;
and membership in the C40 or the STAR Community Rating System. In all, 19 cities
received credit for all three criteria, while 19 more were credited for meeting two
out of three.
The final Clean Electricity indicator awards credit to any metro area that has a
top-30-ranked local government green power purchaser in the EPA’s Green Power
Partnership program. The list of metros receiving credit under this indicator is
identical to last year, with exception of Sacramento, which has been supplanted
by Columbus. The City of Houston, as in last year’s Index, purchased the most
green power, which is interesting given that its total carbon emissions from large
facilities far outweigh any other metro area in the Index. (As in last year’s Index,
CARBON EMISSIONS FROM LARGE FACILITIES (2013)
METRO AREARANK
(LOW TO HIGH)METRIC TONS CO2E
PER CAPITAMETRIC TONS
CO2E*
RALEIGH, NC 1 0.23 290,238
SEATTLE, WA 2 0.67 2,442,519
COLUMBUS, OH 3 0.68 1,352,711
SACRAMENTO, CA 4 1.42 3,191,702
SAN DIEGO, CA 5 1.49 4,849,601
PORTLAND, OR 6 1.55 3,643,821
HARTFORD, CT 7 1.90 2,304,787
SAN JOSE, CA 8 1.93 3,763,437
NEW YORK, NY 9 1.94 39,024,592
VIRGINIA BEACH, VA 10 2.05 3,523,070
RICHMOND, VA 41 9.83 12,380,126
SAN ANTONIO, TX 42 10.93 25,450,558
OKLAHOMA CITY, OK 43 11.82 15,795,503
KANSAS CITY, MO 44 14.26 29,532,074
CINCINNATI, OH 45 16.46 35,382,824
HOUSTON, TX 46 19.66 127,583,727
LOUISVILLE, KY 47 19.85 25,202,341
PITTSBURGH, PA 48 21.50 50,659,760
BIRMINGHAM, AL 49 28.54 32,642,295
NEW ORLEANS, LA 50 28.77 36,016,095
Source: EPA with Clean Edge analysis. *CO2e = carbon dioxide equivalentFull dataset available to subscription clients.
Leas
t Em
issi
ons
Mos
t Em
issi
ons
San Francisco receives credit here due to its use of on-site green power generation.
The city is not a part of the Green Power Partnership, but Clean Edge credited the
city for indexing purposes.)

© 2015 Clean Edge, Inc. (www.cleanedge.com). This report, and the models and analysis contained herein, are the property of Clean Edge and may not be reproduced, published, or summarized for distribution or incorporation into a report or other document without prior approval. 402015 U.S. CLEAN TECH LEADERSHIP INDEX: METRO INDEX
CLEAN-TECH INVESTMENT, INNOVATION & WORKFORCE
LOWER RANKING HIGHER RANKING
San Jose, CASan Francisco, CABoston, MA Detroit, MI Austin, TX San Diego, CAChicago, IL New York, NYDenver, CO Hartford, CT Los Angeles, CA Washington, DC Pittsburgh, PASacramento, CAProvidence, RIPortland, ORAtlanta, GAVirginia Beach, VASeattle, WAHouston, TX Cleveland, OH Philadelphia, PAKansas City, MORaleigh, NC Baltimore, MD Nashville, TNCharlotte, NC San Antonio, TXMinneapolis, MNSalt Lake City, UT Phoenix, AZColumbus, OH Indianapolis, IN Dallas, TX Orlando, FLSt. Louis, MORichmond, VA Cincinnati, OH Las Vegas, NV Miami, FLBuffalo, NY Tampa, FLMilwaukee, WIRiverside, CAJacksonville, FL Oklahoma City, OK Memphis, TNLouisville, KY Birmingham, AL New Orleans, LA
100.070.740.038.934.334.132.230.728.428.223.623.622.822.622.322.121.618.718.015.113.813.613.113.010.910.6
9.89.36.85.53.92.32.32.12.11.91.81.51.41.20.90.70.50.50.30.30.30.10.10.0
123456789
1011121314151617181920212223242526272829303132333435363738394041424344454647484950
RANK METRO AREA LEADERSHIP SCORE
Denver
San AntonioAustin
Houston
Dallas
Kansas CitySt. Louis
Atlanta
CharlotteRaleigh
Virginia Beach
BaltimoreWashington, DC
New York
BostonProvidence
Philadelphia
Louisville
CincinnatiColumbus
Orlando
Miami
Birmingham
New Orleans
San Francisco
Portland
Seattle
Sacramento
Las Vegas
Salt Lake City
Phoenix
Oklahoma City
Minneapolis
MemphisNashville
MilwaukeeDetroit
Jacksonville
Tampa
Pittsburgh
Buffalo
Cleveland
Chicago
San Jose
Los Angeles
San Diego
Riverside
Indianapolis
Richmond
Hartford

© 2015 Clean Edge, Inc. (www.cleanedge.com). This report, and the models and analysis contained herein, are the property of Clean Edge and may not be reproduced, published, or summarized for distribution or incorporation into a report or other document without prior approval. 412015 U.S. CLEAN TECH LEADERSHIP INDEX: METRO INDEX
CLEAN-TECH INVESTMENT, INNOVATION, & WORKFORCE OVERVIEWThe Clean-Tech Investment, Innovation, and Workforce category measures a metro
area’s financial, human, and intellectual capital. It tracks indicators such as venture
capital investments in clean tech, clean-energy patent activity, and the presence
of U.S. Department of Energy labs, clean-energy incubators, and top-rated green
Master’s programs. It mirrors the Capital category in the State Index fairly closely,
and eight of the top 10 metro areas are located in top 10 Capital states.
A top story of this year’s Investment, Innovation, and Workforce category is the
dominance of one particular metro area: San Jose. The area known as Silicon
Valley retains its #1 category ranking from last year, but the distance between it
and #2 San Francisco has grown to nearly 30 points. San Jose leads the pack in
venture capital dollars and deals per capita, and jumps to second in patents per
capita. It is also home to a clean-tech incubator, as well as a university (Stanford)
that places on two of the three lists used to compile the top green Master’s pro-
grams indicator.
The remaining top 10 metro areas in the category are Boston in third, with Detroit,
Austin, San Diego, Chicago, New York, Denver, and Hartford rounding out the list.
The top 10 is identical to last year’s, with the exception that New York and Denver
have switched spots at eighth and ninth. The distance between #2 San Francisco
and #3 Boston has dwindled some, but remains large at just over 30 points. All of
the top 10 metros except San Jose have seen their scores decline, a testament to
San Jose’s growing leadership in the category.
Take venture capital, where San Jose remains the #1 metro. Three-year VC in-
vestment trends for the 50 metro areas are a mixed bag: total dollars invested
in the 2012-2014 period declined by about 11% (nearly $1.7 billion) from the
2011-2013 period, yet total deals increased by more than 100. San Jose increased
CLEAN TECH VENTURE CAPITAL (2012 - 2014)
METRO AREA
RANKDOLLARS PER
CAPITATOTAL DOLLARS
(MILLIONS)TOTAL DEALS
SAN JOSE, CA 1 $1,281.10 $2,501.83 169
SAN FRANCISCO, CA 2 $575.83 $2,645.39 317
BOSTON, MA 3 $282.46 $1,336.64 173
SAN DIEGO, CA 4 $271.71 $886.71 76
AUSTIN, TX 5 $242.42 $471.09 57
HOUSTON, TX 6 $104.79 $680.10 35
DENVER, CO 7 $103.03 $283.78 44
WASHINGTON, DC 8 $80.01 $482.78 26
SEATTLE, WA 9 $78.82 $289.39 59
LOS ANGELES, CA 10 $71.80 $952.24 94
Source: Cleantech Group data with Clean Edge analysis.Full dataset available to subscription clients.

© 2015 Clean Edge, Inc. (www.cleanedge.com). This report, and the models and analysis contained herein, are the property of Clean Edge and may not be reproduced, published, or summarized for distribution or incorporation into a report or other document without prior approval. 422015 U.S. CLEAN TECH LEADERSHIP INDEX: METRO INDEX
its lead over second-place San Francisco by greater than $250 per capita, while
San Francisco’s edge over third-place Boston shrunk but remains healthy. Those
three were the only metros that received more than $1 billion in total clean-tech
VC dollars during the three-year period. In last year’s Index, Los Angeles also had
a three-year investment total exceeding $1 billion, but this year’s Index shows VC
activity in the City of Angels dropped by more than $600 million; thus L.A. fell from
#7 in dollars per capita in the 2014 Index to #10 this year.
VC deals per capita rankings mirrors the VC dollars rankings: San Jose increased its
lead over the field, while third-place Boston fell further behind #2 San Francisco.
One San Jose-based company, energy-efficient data center solutions provider Nu-
tanix, accounted for two of the nation’s largest clean-tech VC deals in 2014, with
a combined $241 million. The top five metros in this category (with Austin and San
Diego rounding out the top five) remained the same from last year. While there
was some switching of places in the #6-9 slots, the only new metro in the top 10
is Portland, which displaced Providence for 10th. But this was due more to a drop
in VC deals in Providence than increased activity in Portland.
The clean-tech patents indicator measures patent activity from 2002 through
2014. But leadership in intellectual capital does not necessarily yield financial
capital, as several leading patent activity metros are not hotbeds of VC investment.
Among those is Detroit, the #1 patents-per-capita metro. The bulk of Detroit’s
clean-tech patents have gone to big auto companies such as Ford and General
Motors. Hartford, the #3 patents-per-capita metro, has seen a great deal of activity
in fuel cells and advanced aerospace technologies, while the #6 entry, Cleveland,
is home to patent holders in energy-efficient technology manufacturing. San Jose,
on the other hand, proves the success of the clean-tech nexus between Silicon
Valley technology and Sand Hill Road financing.
As was the case last year, only three metro areas – San Francisco, Chicago, and
New York – can lay claim to all three institutions tracked by the final indicator: a
DOE lab, a clean-energy incubator, and a top-ranked green Master’s program. Of
the 13 additional metros receiving credit for two out of three, 10 of them qualify
with an incubator and a green Master’s program, while three (Denver, Pittsburgh,
and Virginia Beach) have a DoE lab and a green Master’s program. Twelve metro
areas receive credit for one of the three, while 22 metros have none.
CLEAN ENERGY PATENTS GRANTED (2002 - 2014)METRO AREA RANK PATENTS PER 1M PEOPLE TOTAL PATENTS
DETROIT, MI 1 424.8 1,825
SAN JOSE, CA 2 407.1 795
HARTFORD, CT 3 257.8 313
SAN FRANCISCO, CA 4 135.2 621
BOSTON, MA 5 61.7 292
CLEVELAND, OH 6 51.4 106
PHILADELPHIA, PA 7 45.8 277
DENVER, CO 8 43.9 121
MINNEAPOLIS, MN 9 42.6 149
SAN DIEGO, CA 10 40.1 131
Source: Data from Heslin Rothenberg Farley & Mesiti P.C. with Clean Edge analysis. Full dataset available to subscription clients.

© 2015 Clean Edge, Inc. (www.cleanedge.com). This report, and the models and analysis contained herein, are the property of Clean Edge and may not be reproduced, published, or summarized for distribution or incorporation into a report or other document without prior approval. 432015 U.S. CLEAN TECH LEADERSHIP INDEX: METRO INDEX
METRO INDEX METHODOLOGYHow is the Metro Index constructed?The Metro Index consists of three layers. The top layer, the Metro Index itself, is a
set of 50 metro area scores which evaluates each MSA based on involvement and
leadership in clean tech. Results of the top layer are derived from performance
in four equally weighted categories – green buildings; advanced transportation;
clean electricity & carbon management; and clean-tech investment, innovation, &
workforce – with each category composed of a set of individual indicators.
How is the Metro Index calculated?The overall Metro Index evaluates the 50 largest metro areas on a 100-point scale,
deriving each score from category and individual indicator performance. The score
calculation process works as follows:
INDICATOR SCORES are given on a scale of 0 to 100. The best-performing metro area
in an individual indicator receives a score of 100; the worst-performing metro area
gets a 0. All other metro areas receive scores based on where they fall between
the best and worst-performing regions. To put each metro area on an even playing
field, all quantitative indicators are adjusted for region size. By reporting in terms of
per capita or percent of metro totals, smaller regions are not punished for having
relatively smaller economies.
Several indicators, like the presence of a top-ranked green MBA program, are
qualitative rather than quantitative. In this case, qualifying states receive indicator
scores of 100 and non-qualifying states get 0.
CATEGORY SCORES are calculated in a similar fashion as individual indicators. Based on
metro areas’ average indicator scores within each corresponding category, category
scores of 100 are given to the metro area with the best average indicator score; the
metro area with the lowest average indicator score in a category receives a 0.
Finally, the METRO CLEAN TECH INDEX SCORE is calculated by averaging the four
equally-weighted category scores.
Data SourcesAlong with an extensive level of data mining from clean-energy sources in the
public domain, Clean Edge has also teamed up with private data providers to offer
U.S. Metro Index subscribers the highest level of industry intelligence. Private data
partners include Cleantech Group, EQ Research LLC, Heslin Rothenberg Farley &
Mesiti P.C., and IHS Automotive.

© 2015 Clean Edge, Inc. (www.cleanedge.com). This report, and the models and analysis contained herein, are the property of Clean Edge and may not be reproduced, published, or summarized for distribution or incorporation into a report or other document without prior approval. 442015 U.S. CLEAN TECH LEADERSHIP INDEX: METRO INDEX
GREEN BUILDINGS CLEAN ELECTRICITY & CARBON MANAGEMENT
ADVANCED TRANSPORTATION
CLEAN-TECH INVESTMENT, INNOVATION, & WORKFORCE
The following is a list of all indicators used to calculate the Metro Index. Indicators
are grouped by category.
GREEN BUILDINGSLEED Certified Projects Per 1M People (as of 12/31/14)
LEED Certified Square Feet Per Capita (as of 12/31/14)
Energy Star Buildings & Plants Per 1M People (2014)
Energy Star Buildings & Plants Square Feet Per Capita (2014)
Building Energy Use Benchmarking Policy
CLEAN ELECTRICITY & CARBON MANAGEMENTRegional Electricity Mix (2014, MWh % of Total)
Regional Electricity Mix incl. Hydro & Biomass (2014, MWh % of Total)
Presence of Top Local Government Green Power Purchaser
GHG Emissions from Large Facilities (Per Capita, CO2e MT)
Mayor's Climate Protection Agreement Signatory
Reporting to CDP (Carbon Disclosure Project) or carbonn Climate Registry
Member of C40 or STAR Community Rating System
CLEAN-TECH INVESTMENT, INNOVATION, & WORKFORCEVenture Capital Investment ($ Per Capita, 2012-2014)
Venture Capital Investment (Deals Per 1M People, 2012-2014)
Clean Energy Patents (Per 1M people, 2002-2014)
Presence of DOE Lab
Presence of Clean Energy Incubator and/or Accelerator
Presence of Top-Ranked Green Master's Program
ADVANCED TRANSPORTATIONElectric Vehicles Per 1K People (as of 1/1/15)
Hybrid Electric Vehicles Per 1K People (as of 1/1/15)
Plug-In Hybrid Electric Vehicles Per 1K People (as of 1/1/15)
Natural Gas Vehicles Per 1K People (as of 1/1/15)
Electric Vehicle Charging Stations Per 1M People (as of 12/31/14)
CNG Fueling Stations Per 1M People (as of 12/31/14)
E85 & B20 Fueling Stations Per 1M People (as of 12/31/14)
Public Transit: Avg Weekday Trips (Per Capita, 2014)

© 2015 Clean Edge, Inc. (www.cleanedge.com). This report, and the models and analysis contained herein, are the property of Clean Edge and may not be reproduced, published, or summarized for distribution or incorporation into a report or other document without prior approval. 452015 U.S. CLEAN TECH LEADERSHIP INDEX
DATASOURCESAlong with an extensive level of data mining from clean-tech sources in the public
domain, Clean Edge has also teamed up with private data providers to offer Index
subscribers the highest level of industry intelligence.
DATA PARTNERS
CLEANTECH GROUP helps clients find, connect with, and
embed innovation. The company’s i3 platform allows sub-
scribers to discover companies and explore cleantech trends
strategically with proprietary real-time data. Cleantech Forums bring together
thought leaders and innovators in the cleantech and sustainability ecosystem.
Cleantech Group’s Advisory services leverage expertise in designing and executing
corporate strategies for sustainable growth and innovation sourcing. For more
info, please visit www.cleantech.com.
EQ RESEARCH LLC provides policy research and expert
witness services to the clean energy sector. Our
areas of expertise include state legislation, state regulatory policy and proceed-
ings, government and utility financial incentives, net metering, and utility rate
cases. EQ also offers customized tracking services to help industry stakehold-
ers stay on top of legislative, regulatory, and utility rate case developments.
www.eq-research.com
HESLIN ROTHENBERG FARLEY & MESITI P.C. (HRFM) is a leading
New York-based law firm devoted exclusively to Intellectual
property law. The firm helps clients obtain and enforce in-
tellectual property rights, including patents, trademarks, trade dress, trade secrets,
and copyrights, along with related litigation. For the State and Metro Indexes,
Clean Edge leverages data from the firm’s Clean Energy Patent Growth Index. For
information on HRFM services visit www.hrfmlaw.com.
IHS AUTOMOTIVE, driven by POLK, is a globally
recognized provider of automotive intelligence
and marketing solutions to the automotive world and its related industries. For the
State Index, Clean Edge is using R.L. Polk’s hybrid, electric, and compressed natural
gas vehicle registration data. For information on Polk research visit www.polk.com.

© 2015 Clean Edge, Inc. (www.cleanedge.com). This report, and the models and analysis contained herein, are the property of Clean Edge and may not be reproduced, published, or summarized for distribution or incorporation into a report or other document without prior approval. 462015 U.S. CLEAN TECH LEADERSHIP INDEX
OTHER INDEX DATA SOURCES
AMERICAN COUNCIL FOR AN ENERGY–EFFICIENT ECONOMY (ACEEE)
AMERICAN PUBLIC TRANSPORTATION ASSOCIATION (APTA)
AMERICAN WIND ENERGY ASSOCIATION (AWEA)
BUILDING CODES ASSISTANCE PROJECT
C40
CDP (CARBON DISCLOSURE PROJECT)
CARBONN CLIMATE REGISTRY
THE CENTER FOR CLIMATE AND ENERGY SERVICES
THE COALITION FOR GREEN CAPITAL
DATABASE OF STATE INCENTIVES FOR RENEWABLE ENERGY (DSIRE)
ENERGY STAR
FUEL CELLS 2000
GEOTHERMAL ENERGY ASSOCIATION (GEA)
GRIDWISE ALLIANCE
INSTITUTE FOR MARKET TRANSFORMATION
INTERSTATE RENEWABLE ENERGY COUNCIL, INC.
KANTAR MEDIA
MAYOR’S CLIMATE PROTECTION CENTER
NATIONAL RENEWABLE ENERGY LABORATORY (NREL)
NET IMPACT
THE PRINCETON REVIEW
STAR COMMUNITIES
U.S. BUREAU OF ECONOMIC ANALYSIS (BEA)
U.S. BUREAU OF LABOR STATISTICS (BLS)
U.S. CENSUS BUREAU
U.S. DEPARTMENT OF ENERGY (DOE)
U.S. ENERGY INFORMATION ADMINISTRATION (EIA)
U.S. ENVIRONMENTAL PROTECTION AGENCY (EPA)
U.S. GREEN BUILDING COUNCIL (USGBC)
U.S. NEWS & WORLD REPORT
VOTE SOLAR
DISCLAIMER: Clean Edge makes no guarantee about the accuracy of data provided by third party sources. Sponsors did not participate in the preparation of this report and are not responsible for the information contained herein. In addition, sponsors may have relationships with the entities discussed in this report. Information contained in this report is not intended to be investment advice or used as a guide to investing and no recommendation is intended to be made as to any particular company in this report.

© 2015 Clean Edge, Inc. (www.cleanedge.com). This report, and the models and analysis contained herein, are the property of Clean Edge and may not be reproduced, published, or summarized for distribution or incorporation into a report or other document without prior approval. 472015 U.S. CLEAN TECH LEADERSHIP INDEX
A partnership of philanthropic investors promoting clean energy technology
www.ef.org
Dennis Schroeder/NREL
For more information, visit sustainabledc.org
The District of Columbia is proud to be one of the greenest, healthiest, and most livable cities in the United States.
• 1st in U.S. in LEED and ENERGY STAR certified projects per capita• One of the strongest Green Construction Codes in the U.S.• #1 EPA green power community in the U.S.• 4 Stars awarded by the STAR Community Rating System
2015
Los Angeles County Leading Location for Advanced Transportation
-Targeted business incentives -Unparalleled grant & contracting opportunities
-Tailored workforce programs -Complimentary business assistance
Join the conversa tion LAEDC Website or @laedc

© 2015 Clean Edge, Inc. (www.cleanedge.com). This report, and the models and analysis contained herein, are the property of Clean Edge and may not be reproduced, published, or summarized for distribution or incorporation into a report or other document without prior approval. 482015 U.S. CLEAN TECH LEADERSHIP INDEX
BUILDING GREEN. MANY CITIES TALK ABOUT IT. WE ACTUALLY DO IT.
WeBuildGreenCities.com
CONTACT: Pam Neal - [email protected]
LET’S WORK TOGETHER.
www.masscec.com@MassCEC
JOIN OUR GROWING $10 BILLION INDUSTRY
HOME OF INNOVATION

REPORT CARDS FOR ALL 50 STATES AND TOP 50 METROS
PERFORMANCE TABLES FOR DOZENS OF CLEAN-ENERGY AND CLIMATE-RELATED DATASETS
FOR MORE INFORMATION CONTACT: BRYCE YONKER | Director Business Development [email protected] | 503.206.8448
State & Metro Leadership Indexes
Subscription Price: $7,500
Complete Data Tables (PDF)Raw Datasets (Excel)Customized Webinar Presentation10 Hours Advisory SupportData Sharing Permission
STANDARD DATA SUBSCRIPTION
Metro & State Level Datasets
Entire Leadership Index datasets, including performance tables and report cards in designed PDF and raw data tables in Excel.
Custom Webinar
Live, customized webinar on Index findings and support to use the Index datasets.
Advisory Support
Clean Edge analysts help subscribers apply datasets to their own initiatives and strategies.
Data Sharing Permission
Subscribers can use Leadership Index datasets for both internal and external purposes.
SUBSCRIBER BENEFIT DETAILS
Clean Edge, founded in 2000, is the world’s first research and advisory firm devoted to the clean-tech sector. For more than a decade, the firm has delivered timely data, expert analysis, and comprehensive insights to key industry stakeholders. The company offers an unparalleled suite of indexing, benchmarking, and advisory services.
Get the Full PictureClean Edge subscribers gain access to all the data behind the Indexes, as well as custom analysis and briefings tailored to their strategic needs. The Clean Tech Leadership Index datasets (State & Metro) provide an unparalleled look at state- and metro-level clean-energy and climate-related markets, from solar PV and electric vehicle deployment to venture investments and patents.
© 2013 Clean Edge, Inc. (www.cleanedge.com). This report, and the models and analysis contained herein, are the property of Clean Edge and may not
be reproduced, published, or summarized for distribution or incorporation into a report or other document without prior approval.
171
2013 U.S. CLEAN TECH LEADERSHIP INDEX: STATE INDEX DATASETS
OREGON (CONT.)
GHG Reduction Target
l
Membership in Active Regional Climate Initiative
l
Low Carbon Fuel StandardState Fleet High Efficiency Vehicle RequirementMandated Green Power Purchasing Option
l
Interconnection Law/Policy
l
Net Metering Law/Policy
l
Commercial Building Energy Policy
2
Residential Building Energy Policy
2
*See page 13 for definition of building energy policy indicators.
ENERGY INTELLIGENCE & GREEN BUILDINGDATA RANK +/-
Electricity Consumption Per Capita (2012, Annual kWh)11,959 21 1
Electric Productivity (2011, State GDP Dollars Per kWh Consumed) $4.13 17 4
LEED-Certified Projects Per 1M People91.8 2 -1
LEED-Certified Projects
358 16 -3
LEED-Certified Square Feet Per Capita12.9 6 -1
LEED-Certified Square Feet (Thousand Sq Ft)50,111 13 0
Energy Star Buildings & Plants Per 1M People71.3 17 -5
Energy Star Buildings & Plants
278 22 -1
Energy Star Buildings & Plants Square Feet Per Capita10.0 13 0
Energy Star Buildings & Plants Square Feet (Thousand Sq Ft) 38,936 22 -1
Energy Star Homes Per 1K People5.2 11 0
Energy Star Homes
20,196 16 0
Smart Meter Market Penetration (2012, % of Total Meters) 51.20% 8 -6
Smart Meters Installed
960,151 8 1
ACEEE 2012 State Energy Efficiency Scorecard Performance 37.5 4 0REGULATIONS & MANDATES
DATA
Renewable Portfolio Standard
l
Strong RPS: At least 20% by 2020 or 25% by 2025
l
Smart RPS: No Clean Coal
l
Smart RPS: No Nuclear
l
Smart RPS: No Large Hydro
l
Smart RPS: Solar/DG Provision
l
Energy Efficiency Resource StandardState Renewable Fuel StandardClimate Action Plan
INCENTIVES
DATA
Grants - Renewable Energy
l
Grants - Energy Efficiency
l
Loans - Renewable Energy
l
Loans - Energy Efficiency
l
Rebates - Renewable Energy
l
Rebates - Energy Efficiency
l
Bonds - Renewable EnergyBonds - Energy EfficiencyClean-Tech Vehicle Purchasing IncentiveUtility Revenue Decoupling - Electricity
l
Utility Revenue Decoupling - Natural Gas
l
Utility Performance Incentives - Electricity Utility Performance Incentives - Natural GasUtility On-Bill Financing
l
SCORE: 72.8
SCORE: 78.3
SCORE: 82.1
SCORE: 57.9#6
#6
#2
#3
© 2013 Clean Edge, Inc. (www.cleanedge.com). This report, and the models and analysis contained herein, are the property of Clean Edge and may not
be reproduced, published, or summarized for distribution or incorporation into a report or other document without prior approval.
1702013 U.S. CLEAN TECH LEADERSHIP INDEX: STATE INDEX DATASETS
OREGON
OVERALL
POLICY
CAPITAL
TECHNOLOGY
TOP SCORE: 91.7
MEDIAN: 36.9
TOP SCORE: 100
MEDIAN: 50.5
TOP SCORE: 89.3
MEDIAN: 25.5
TOP SCORE: 100
MEDIAN: 14.3
CLEAN ELECTRICITYDATA RANK +/-
Utility-Scale Clean Electricity Generation (2012, MWh % of Total) 10.11% 10 1
Utility-Scale Clean Electricity Generation incl. Hydro & Biomass
(2012, MWh % of Total)
76.29% 3 0
Utility-Scale Wind Electricity Generation (2012, % of Total) 10.05% 9 0
Utility-Scale Wind Electricity Generation (2012, GWh) 6,066 8 1
Utility-Scale Solar Electricity Generation (2012, % of Total) 0.02% 15 5
Utility-Scale Solar Electricity Generation (2012, GWh) 12 17 3
Utility-Scale Geothermal Electricity Generation (2012, % of Total) 0.04% 7 -1
Utility-Scale Geothermal Electricity Generation (2012, GWh) 25 7 -1
Utility-Scale Hydro Electricity Generation (2012, % of Total) 65.03% 3 0
Utility-Scale Hydro Electricity Generation (2012, GWh) 39,257 2 0
Utility-Scale Biomass Electricity Generation (2012, MWh % of Total) 1.16% 26 2
Utility-Scale Biomass Electricity Generation (2012, GWh) 698 22 3
Installed Wind Capacity (2012, % of Total) 21.00% 4 2
Installed Wind Capacity (2012, MW)3,153 5 2
Installed Solar Capacity (2012, % of Total) 0.37% 14 1
Installed Solar Capacity (2012, MW)55.7 16 -1
Installed Geothermal Capacity (2012, % of Total) 0.22% 6 2
Installed Geothermal Capacity (2012, MW)33.3 5 0
CLEAN TRANSPORTATIONDATA RANK +/-
Hybrid Electric Vehicles Per 1M People (as of 10/1/12) 12,866 4 -1
Hybrid Electric Vehicles In Use (as of 10/1/12) 50,169 16 0
Electric Vehicles Per 1M People (as of 10/1/12) 249.3 5 3
Electric Vehicles In Use (as of 10/1/12)972 8 0
Natural Gas Vehicles Per 1M People (as of 10/1/12) 46.7 13 16
Natural Gas Vehicles In Use (as of 10/1/12)182 19 9
Electric Vehicle Charging Stations Per 1M People (as of 4/15/13) 87.7 2 -1
Electric Vehicle Charging Stations (as of 4/15/13) 342 5 1
E85 & B20 Fueling Stations Per 1M People (as of 4/15/13) 8.5 25 -5
E85 & B20 Fueling Stations (as of 4/15/13)33 29 -3
CNG Fueling Stations Per 1M People (as of 4/15/13) 3.6 16 -1
CNG Fueling Stations (as of 4/15/13)14 24 -3
Ethanol Operating Capacity Per Sq Mi Land
(2012, Thousand Gallons)
0.4 23 0
Ethanol Operating Capacity (2012, Million Gallons) 41 21 1
© 2013 Clean Edge, Inc. (www.cleanedge.com). This report, and the models and analysis contained herein, are the property of Clean Edge and may not
be reproduced, published, or summarized for distribution or incorporation into a report or other document without prior approval.
103
2013 U.S. CLEAN TECH LEADERSHIP INDEX: METRO INDEX DATASETS
PORTLAND, ORPORTLAND-VANCOUVER-HILLSBORO, OR-WA
GREEN BUILDINGS
DATA RANK +/-
LEED Certified Projects Per 1M People 109.18 2 -1
LEED Certified Projects
250 9 0
LEED Certified Square Feet Per Capita 18.68 6 -1
LEED Certified Square Feet (Thousand Sq Ft)42,762 13 -1
Energy Star Buildings & Plants Per 1M People 121.41 8 7
Energy Star Buildings & Plants 278 19 4
Energy Star Buildings & Plants Square Feet Per Capita 17.58 10
Energy Star Buildings & Plants (Thousand Sq Ft)40,244 17
ADVANCED TRANSPORTATIONDATA RANK +/-
Electric Vehicles Per 1K People0.45 9 1
Electric Vehicles in Use (as of 10/1/12) 1,408 13 -2
Hybrid Electric Vehicles Per 1K People13.08 8 0
Hybrid Electric Vehicles in Use (as of 10/1/12) 40,951 14 2
Natural Gas Vehicles Per 1K People0.05 20 13
Natural Gas Vehicles in Use (as of 10/1/12) 169 22 10
Electric Vehicle Charging Stations Per 1M People (as of 4/15/2013) 98.70 1 0
Electric Vehicle Charging Stations (as of 4/15/2013) 226 6 0
CNG Fueling Stations Per 1M People (as of 4/15/2013) 3.49 25 4
CNG Fueling Stations (as of 4/15/2013) 8 24 3
E85 & B20 Fueling Stations Per 1M People (as of 4/15/2013) 9.17 16 -1
E85 & B20 Fueling Stations (as of 4/15/2013) 21 19 -3
Public Transit: Avg Weekly Trips (Per Capita, 2012) 0.14 9 -1
Public Transit: Avg Weekly Trips (Thousands, 2012) 317 12 0
CLEAN ELECTRICITY & CARBON MANAGEMENTDATA RANK +/-
Regional Electricity Mix (0=Dirtiest; 5=Cleanest)4
Presence of Top Local Government Green Power Purchaser l
GHG Emissions from Large Facilities (Per Capita, CO2e MT) 0.91 4 2
GHG Emissions from Large Facilities (CO2e MMT, 2011) 2.1 5 2
CLEAN-TECH INVESTMENT, INNOVATION, & WORKFORCE DATA RANK +/-
Venture Capital Investment ($ Per Capita, 2010-2012) $78.86 9 -2
Venture Capital Investment ($ Millions, 2010-2012) $180.57 16 -6
Venture Capital Investment (Deals Per 1M People, 2010-2012) 8.73 8 -1
Venture Capital Investment (Total Deals, 2010-2012)20 15 -5
Clean Economy Jobs (% of all employment, 2011)2.7% 3
Clean Economy Jobs (2011)27,489 15
Clean Energy Patents (Per 1M people, 2002-2012)10 26 -1
Clean Energy Patents (2002-2012)23 25 0
Licensable University Clean Technologies (Per 1M People) 0.0 25
Licensable University Clean Technologies (Total, 2011)0 25
Presence of DOE Lab
Presence of Clean Energy Alliance Incubator
Presence of Top-Ranked Green MBA Programl
OVERALL
SCORE:
TOP SCORE: 89.2
MEDIAN: 28.7
The top overall score of 89.2 is held by San Francisco, CA.
GREEN BUILDINGS
TOP SCORE: 100MEDIAN: 28.7
SCORE:
ADVANCED TRANSPORTATION
TOP SCORE: 100MEDIAN: 26.4
SCORE:
CLEAN-TECH INVESTMENT, INNOVATION, & WORKFORCE
TOP SCORE: 100MEDIAN: 36.7
SCORE:
CLEAN ELECTRICITY & CARBON MANAGEMENT
TOP SCORE: 100MEDIAN: 24.7
SCORE:
© 2013 Clean Edge, Inc. (www.cleanedge.com). This report, and the models and analysis contained herein, are the property of Clean Edge and may not
be reproduced, published, or summarized for distribution or incorporation into a report or other document without prior approval.
102
2013 U.S. CLEAN TECH LEADERSHIP INDEX: METRO INDEX DATASETS
PORTLAND, OR
PORTLAND-VANCOUVER-HILLSBORO, OR-WA
#16
23.0
62.8
73.9
61.0
93.2
#4#7#4
#3
© 2013 Clean Edge, Inc. (www.cleanedge.com). This report, and the models and analysis contained herein, are the property of Clean Edge and may not
be reproduced, published, or summarized for distribution or incorporation into a report or other document without prior approval.
16
2013 U.S. CLEAN TECH LEADERSHIP INDEX: METRO INDEX DATASETS
ADVANCED TRANSPORTATIONELECTRIC VEHICLES
EVS PER 1K PEOPLE (AS OF 10/1/2012) TOTAL EVSMSA
RANKRANK
CHANGE DATA RANK DATA
SAN FRANCISCO, CA 1 0 1.53 3 10,776*
SAN JOSE, CA1 0 1.53 3 10,776*
SAN DIEGO, CA3 3 1.14 8 3,527
LOS ANGELES, CA4 -1 0.94 1 16,567**
RIVERSIDE, CA4 -1 0.94 1 16,567**
SACRAMENTO, CA6 -1 0.88 7 3,533
PHOENIX, AZ7 0 0.71 6 3,539
SEATTLE, WA8 0 0.60 9 2,893
PORTLAND, OR9 1 0.45 13 1,408
DETROIT, MI10 15 0.45 10 2,160
ORLANDO, FL11 -2 0.37 14 1,358
NASHVILLE, TN12 0 0.36 21 952
BALTIMORE, MD13 17 0.32 22 931
BUFFALO, NY14 0 0.29 28 468
AUSTIN, TX15 3 0.29 27 533
WASHINGTON, DC16 7 0.27 11 1,702
BOSTON, MA17 15 0.27 12 1,680
TAMPA, FL18 -1 0.23 19 995
MIAMI, FL19 -6 0.22 20 967
MINNEAPOLIS, MN20 23 0.22 18 1,012
RALEIGH, NC21 -2 0.22 26 652
OKLAHOMA CITY, OK 22 -1 0.22 33 392
NEW YORK, NY23 -7 0.21 5 4,405
DENVER, CO24 -2 0.21 24 841
ATLANTA, GA25 -4 0.20 16 1,256
ELECTRIC VEHICLES
EVS PER 1K PEOPLE (AS OF 10/1/2012) TOTAL EVSMSA
RANKRANK
CHANGE DATA RANK DATA
JACKSONVILLE, FL 26 -1 0.18 39 307
COLUMBUS, OH27 6 0.16 32 394
LAS VEGAS, NV28 -8 0.16 36 314
HARTFORD, CT29 18 0.15 31 401
SALT LAKE CITY, UT 30 4 0.14 29 424
PHILADELPHIA, PA 31 7 0.14 17 1,111
CHARLOTTE, NC32 -3 0.14 30 403
CHICAGO, IL33 3 0.13 15 1,295
CINCINNATI, OH34 7 0.13 37 310
DALLAS, TX35 -7 0.13 23 901
MILWAUKEE, WI36 10 0.11 41 263
ST. LOUIS, MO37 5 0.11 34 358
PROVIDENCE, RI38 12 0.11 46 174
INDIANAPOLIS, IN39 -2 0.11 38 309
PITTSBURGH, PA40 5 0.11 40 300
HOUSTON, TX41 -1 0.11 25 662
KANSAS CITY, MO42 2 0.10 42 237
MEMPHIS, TN43 -1 0.10 44 175
SAN ANTONIO, TX44 -1 0.09 43 230
VIRGINIA BEACH, VA 45 -1 0.09 44 175
CLEVELAND, OH46 -6 0.09 35 355
NEW ORLEANS, LA 47 -21 0.09 48 144
BIRMINGHAM, AL48 -9 0.08 47 156
RICHMOND, VA49 0 0.06 50 88
LOUISVILLE, KY50 -2 0.05 49 92
Source: R.L. Polk with Clean Edge analysis. PHEV reported as HEV, not EV. *San Francisco and San Jose data
combined for this indicator. **LA and Riverside data combined for this indicator.
© 2013 Clean Edge, Inc. (www.cleanedge.com). This report, and the models and analysis contained herein, are the property of Clean Edge and may not
be reproduced, published, or summarized for distribution or incorporation into a report or other document without prior approval.
152013 U.S. CLEAN TECH LEADERSHIP INDEX: METRO INDEX DATASETS
GREEN BUILDINGS
ENERGY STAR SQUARE FEETSQUARE FEET
PER CAPITA, 2012TOTAL (THOUSAND
SQ FT, 2012)
MSARANK DATA RANK DATA
WASHINGTON, DC 1 31.93 3 187,136
SAN FRANCISCO, CA 2 28.25 6 125,852
MINNEAPOLIS, MN 3 26.23 9 89,759
DENVER, CO 4 25.77 11 68,171
ATLANTA, GA 5 22.45 7 122,528
HOUSTON, TX 6 20.89 5 129,064
CHICAGO, IL7 19.47 4 185,363
BOSTON, MA 8 18.90 10 87,690
MILWAUKEE, WI 9 18.89 23 29,593
PORTLAND, OR 10 17.58 17 40,244
CHARLOTTE, NC 11 16.94 18 38,910
SEATTLE, WA 12 16.20 13 57,555
LOS ANGELES, CA 13 16.07 2 209,709
DALLAS, TX 14 15.82 8 106,021
CINCINNATI, OH 15 15.48 19 32,942
KANSAS CITY, MO 16 15.34 22 31,272
SAN DIEGO, CA 17 14.90 16 47,339
AUSTIN, TX 18 14.77 25 27,097
SACRAMENTO, CA 19 14.41 21 31,647
INDIANAPOLIS, IN 20 14.12 24 27,245
DETROIT, MI 21 13.08 14 56,158
CLEVELAND, OH 22 12.69 26 26,183
HARTFORD, CT 23 12.23 35 14,852
NEW ORLEANS, LA 24 11.81 36 14,492
COLUMBUS, OH 25 11.22 28 21,802
ENERGY STAR SQUARE FEETSQUARE FEET
PER CAPITA, 2012TOTAL (THOUSAND
SQ FT, 2012)
MSARANK DATA RANK DATA
RICHMOND, VA 26 11.07 38 13,633
SALT LAKE CITY, UT 27 11.00 41 12,361
PHOENIX, AZ 28 10.98 15 47,530
NEW YORK, NY 29 10.97 1 217,583
LOUISVILLE, KY 30 10.72 39 13,418
PHILADELPHIA, PA 31 10.03 12 60,356
SAN JOSE, CA 32 9.89 31 18,732
BUFFALO, NY 33 8.77 44 9,949
SAN ANTONIO, TX 34 8.70 30 19,435
JACKSONVILLE, FL 35 7.99 43 11,011
NASHVILLE, TN 36 7.60 40 13,123
ORLANDO, FL 37 7.19 33 15,979
RALEIGH, NC 38 7.16 46 8,514
TAMPA, FL 39 7.01 29 19,915
VIRGINIA BEACH, VA 40 6.64 42 11,290
PITTSBURGH, PA 41 6.32 34 14,910
ST. LOUIS, MO 42 5.74 32 16,045
MIAMI, FL43 5.68 20 32,714
PROVIDENCE, RI 44 5.46 45 8,738
RIVERSIDE, CA 45 5.38 27 23,386
BALTIMORE, MD 46 5.21 37 14,333
BIRMINGHAM, AL 47 4.91 49 5,586
MEMPHIS, TN 48 4.70 48 6,308
LAS VEGAS, NV 49 3.64 47 7,274
OKLAHOMA CITY, OK 50 2.51 50 3,250
Source: Energy Star with Clean Edge analysis
© 2013 Clean Edge, Inc. (www.cleanedge.com). This report, and the models and analysis contained herein, are the property of Clean Edge and may not
be reproduced, published, or summarized for distribution or incorporation into a report or other document without prior approval.
45
2013 U.S. CLEAN TECH LEADERSHIP INDEX: STATE INDEX DATASETS
POLICY CHECKLIST (1-25)
Commercial and Residential Building Energy Policies are scored based on their relation to ASHRAE and IECC standards. Scores are broken into four tiers and represented by circles: fully shaded (strongest); 2/3 shaded (2nd tier); 1/3 shaded (3rd tier);
unshaded (weakest or no codes). See page 13 for a full definition of these indicators.
MA CA NY MN IL OR NM MI WA CT WI CO MD NH NJ NC HI RI AZ PA IN KY DE TX OH
Quali- fying
States POLICY CATEGORY RANK1 2 3 4 5 6 7 8 9 10 11 12 13 14 15 16 17 18 19 20 21 22 23 24 25
29 Renewable Portfolio Standardl l l l l l l l l l l l l l l l l l l l l l l
15 Strong RPS: At least 20% by 2020 or 25% by 2025 l l l l l l l l l l ll
26 Smart RPS: No Clean Coall l l l l l l l l l l l l l l l l l
l l
28 Smart RPS: No Nuclearl l l l l l l l l l l l l l l l l l l l l l
14 Smart RPS: No Large Hydrol l
l l l l l l ll
19 Smart RPS: Solar/DG Provisionl l l l l l l l l l l l l l l l l
24 Energy Efficiency Resource Standardl l l l l l l l l l l l l l l l l l l l l
11 State Renewable Fuel Standardl l l l l
l l
36 Climate Action Planl l l l l l l l l l l l l l l l l l l l l l
19 GHG Reduction Targetl l l l l l l l l l l l l l l
l
10 Membership in Active Regional Climate Initiative l l ll l l
ll
1 Low Carbon Fuel Standardl
30 State Fleet High Efficiency Vehicle Requirement l l l l l l l l l ll l l l l l l l l
8 Mandated Green Power Purchasing Optionl l l l
44 Interconnection Law/Policyl l l l l l l l l l l l l l l l l l l l l l l l l
46 Net Metering Law/Policyl l l l l l l l l l l l l l l l l l l l l l l l l
n/a Commercial Building Energy Policy2 2 2 1 3 2 2 2 2 2 2 0 3 2 2 2 1 2 0 2 2 2 2 2 2
n/a Residential Building Energy Policy2 2 2 1 3 2 2 2 2 2 1 0 3 2 2 2 1 2 0 2 2 2 2 1 2
21 Grants - Renewable Energyl l l l l l l l l l l l l l
21 Grants - Energy Efficiencyl l l l l l l l l l l l
l l l
46 Loans - Renewable Energyl l l l l l l l l l l l l l l l l l l l l l l
47 Loans - Energy Efficiencyl l l l l l l l l l l l l l l l l l l l l l l
47 Rebates - Renewable Energyl l l l l l l l l l l l l l l l l l l l l l l l
50 Rebates - Energy Efficiencyl l l l l l l l l l l l l l l l l l l l l l l l l
3 Bonds - Renewable Energy
l l
2 Bonds - Energy Efficiency
l l
19 Clean-Tech Vehicle Purchasing Incentivel l
l l l ll l l l
14 Utility Revenue Decoupling - Electricityl l l l l l l l l
l ll l
16 Utility Revenue Decoupling - Natural Gas l l l l l l l l l l ll
26 Utility Performance Incentives - Electricity l l l l l l l l l l l l l l l l l l
16 Utility Performance Incentives - Natural Gas l l l l l l l l ll
l
31 Utility On-Bill Financingl l l l l l l l l l l l l l l l l l l
REG
ULA
TIO
NS
& M
AN
DA
TES
INC
ENTI
VES
POLICY
© 2013 Clean Edge, Inc. (www.cleanedge.com). This report, and the models and analysis contained herein, are the property of Clean Edge and may not
be reproduced, published, or summarized for distribution or incorporation into a report or other document without prior approval.
21
2013 U.S. CLEAN TECH LEADERSHIP INDEX: STATE INDEX DATASETS
TECHNOLOGY: CLEAN ELECTRICITYUTILITY-SCALE WIND ELECTRICITY GENERATIONPERCENT OF TOTAL GENERATION, 2012 GWH,
2012
STATERANK
RANK CHANGE DATA RANK DATA
IOWA
11 24.50%
2 13,945
SOUTH DAKOTA2
-1 23.95%15 2,914
NORTH DAKOTA3
0 14.69%10 5,316
MINNESOTA4
0 14.32%6 7,529
KANSAS
52 11.43%
11 5,119
COLORADO6
0 11.28%9 6,045
IDAHO
71 11.26%
18 1,821
OKLAHOMA8
2 10.52%4 8,234
OREGON
90 10.05%
8 6,066
WYOMING10
-5 8.82%12 4,394
TEXAS
110 7.39%
1 31,860
NEW MEXICO12
0 6.09%16 2,226
MAINE
131 5.87%
26884
WASHINGTON14
-1 5.77%7 6,688
CALIFORNIA15
1 4.94%3 9,937
MONTANA16
-1 4.47%23 1,238
ILLINOIS17
0 3.90%5 7,708
NEBRASKA18
1 3.68%21 1,275
HAWAII19
-1 3.64%28
367
INDIANA20
0 2.76%13 3,163
WISCONSIN21
1 2.40%19 1,546
NEW YORK22
-1 2.21%14 3,033
UTAH
230 1.80%
27712
WEST VIRGINIA24
0 1.75%20 1,286
VERMONT25
3 1.62%33
109
UTILITY-SCALE WIND ELECTRICITY GENERATION (CONT.)PERCENT OF TOTAL GENERATION, 2012 GWH, 2012
STATERANK
RANK CHANGE DATA RANK DATA
MISSOURI26
-1 1.35%22 1,245
NEW HAMPSHIRE27
3 1.35%30
260
MICHIGAN28
1 1.02%24 1,108
PENNSYLVANIA29
-3 0.98%17 2,208
MARYLAND30
-3 0.83%29
314
OHIO
312 0.76%
25988
NEVADA32
7 0.36%32
129
MASSACHUSETTS33
1 0.24%34
85
ARIZONA34
-2 0.23%31
255
ALASKA35
-4 0.20%36
14
TENNESSEE36
-1 0.06%35
47
NEW JERSEY37
1 0.02%37
13
ALABAMA38
1 0.00%38
0
ARKANSAS38
1 0.00%38
0
CONNECTICUT38
1 0.00%38
0
DELAWARE38
-2 0.00%38
0
FLORIDA38
1 0.00%38
0
GEORGIA38
1 0.00%38
0
KENTUCKY38
1 0.00%38
0
LOUISIANA38
1 0.00%38
0
MISSISSIPPI38
1 0.00%38
0
NORTH CAROLINA38
1 0.00%38
0
RHODE ISLAND38
-1 0.00%38
0
SOUTH CAROLINA38
1 0.00%38
0
VIRGINIA38
1 0.00%38
0
Source: EIA with Clean Edge analysis