2015 october 20-21 hilton chicago...
TRANSCRIPT
2015 october 20-21hilton chicagodowntown

A. Elizabeth Sloan, Ph.D
President and CEO
Catherine Adams Hutt,
Ph.D., R.D., C.F.S.
Chief Science and Regulatory Officer
11:30am – Noon
Pet Health - How Going to the Dogs can Drive Business Success
Sloan Trends, Inc.
www.sloantrend.com
760-741-9611
A. Elizabeth Sloan, Ph.D.
Catherine Adams Hutt, Ph.D., R.D., C.F.S.
Petfood 2.0
Chicago, Illinois
Oct. 20, 2014
Pet Health - How Going to the Dogs Can
Drive Business Success

Supplements, Conditions
Re-defining Natural
Culinary Cues
12
34 Regulatory

Liz’s Winston & Churchill 100 Yrs
Young

Catherine’s Kids – Some of Them!

One I Wish Were Mine!

54% Households Parented Pets 2014;
More Households have Dogs > Kids, Yeah!
Owners Age
Type of Pet
• More pet owners HH > $100K
• 5 years; 3M more cats, 3.1M dogs
• 36% owners better off financially
• Uptick multiple pet HH
• Ownership up Millennials
% All US Households Own Pet
Minority Pet Owners
+17% 2010- 2014;
Hispanic #1,
Health Conscious,
Small Dogs
½ Pop. > Age 50 2019
Packaged Facts, U.S. Pet Market Outlook, 2015-16, April 2015; U.S. Census Bureau, Sloan Trends, Inc.

Humanization, Premiumization,
Health & Wellness, CustomizationProj. U.S. Pet Food Retail Channel Sales $29B → $35B by 2019
Billions $
Packaged Facts, U.S. Pet Market Outlook 4/2015
New Product TrialLast 6 Months Bought
New Pet Nutrition Brands
Dog Cat
Dry food 53% 53%
Can/wet 56% 61%
Treat 61% 57%
Share Pet Food Spending 2014
Primal Pet Foods Dog Alternative Proteins

Dollar Volume
FZ/RFG DOG FOOD 22.7% 23.7%
FZ/RFG CAT FOOD 21.6% 24.6%
CAT TREATS 7.7% 10.2%
DOG BISCUITS/TREATS/
BEVERAGES 6.4% 0.5%
WET CAT FOOD 1.5% 0.9%
WET DOG FOOD 1.2% 0.6%
RAWHIDE DOG CHEWS (0.7%) (3.5%)
SEMIMOIST DOG FOOD (0.7%) (1.6%)
DOG/CAT NEEDS (0.7%) (3.8%)
DRY CAT FOOD (1.3%) (1.2%)
DRY DOG FOOD (2.7%) (1.9%)
SEMIMOIST CAT FOOD (32.8%) (24.6%)
Pet Treats
On Fire!
$5.5B to
$7.3B 2019,
CAGR
6.1% to 2019
IRI MULO Data on Mass Market Dollar
Volume Pet Food Segments, 2014
Packaged Facts, U.S. Pet Market Outlook 4/2015; Packaged Facts, Pet Treats & Chews in the U.S. 6/2015

51% Dog, 44% Cat Pet Parents Bought
Specialty Pet Nutrition Products 2014
Packaged Facts, U.S. Pet Market Outlook 4/2015
Use Specialty Pet Nutrition Products, Type
2014
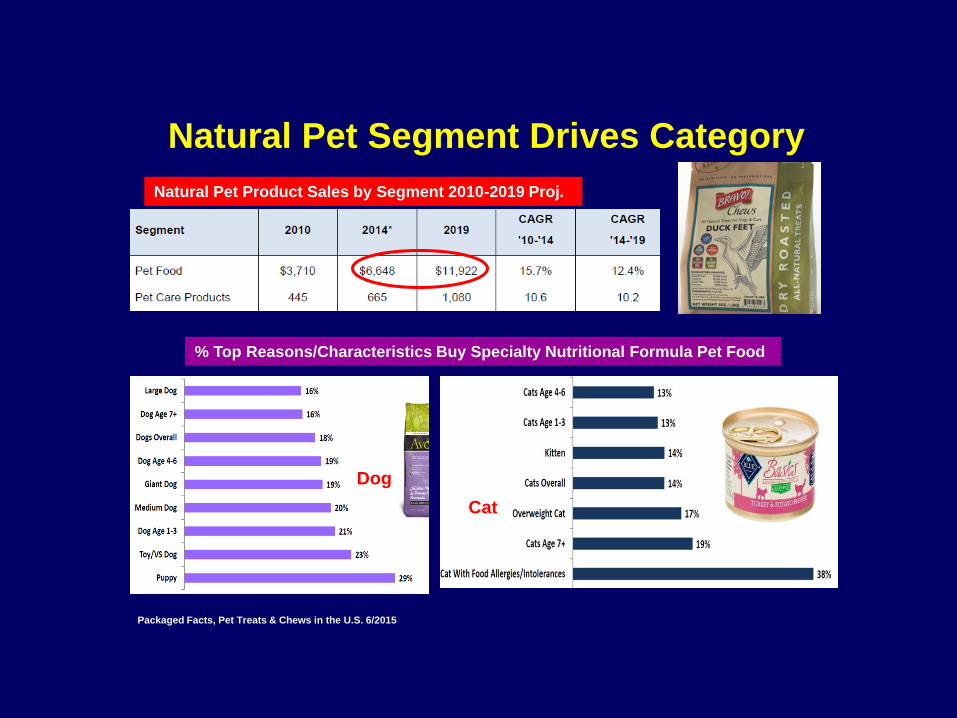
Natural Pet Segment Drives Category
% Top Reasons/Characteristics Buy Specialty Nutritional Formula Pet Food
Cat
Dog
Natural Pet Product Sales by Segment 2010-2019 Proj.
Packaged Facts, Pet Treats & Chews in the U.S. 6/2015
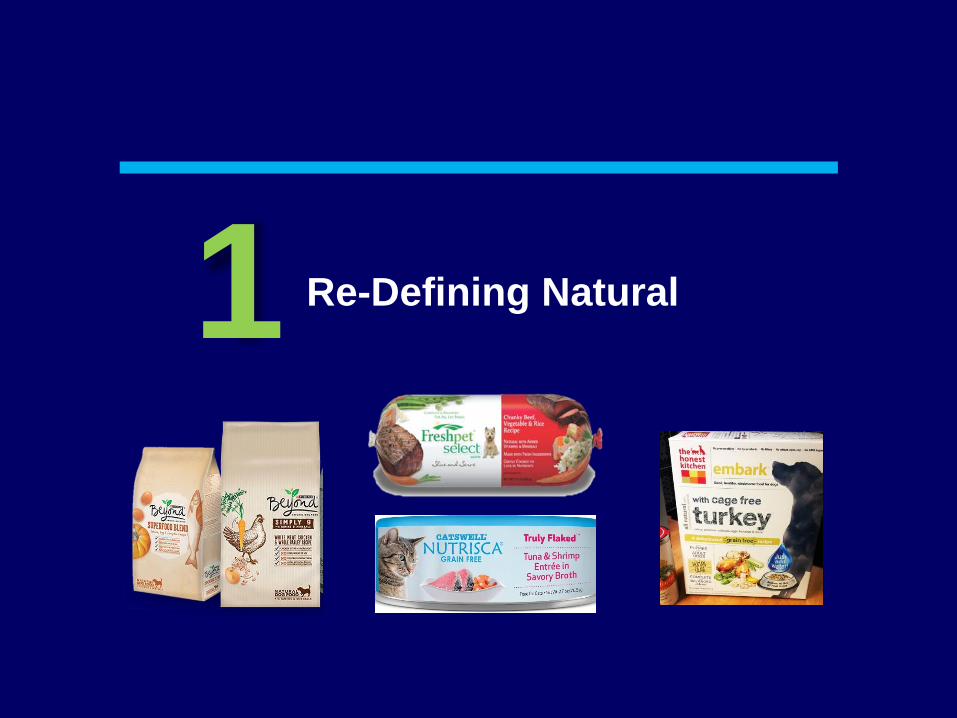
Re-Defining Natural 1

Fresh, Minimally Processed: Lifestyle
78% Strong Effort Eat Fresh > Processed
NPD Group, National Eating Trends, 2014; Technomic, Healthy Eating Consumer Trend Rpt, 2014; FMI, U.S. Grocery Shopper Trends, 2015; NRA, What’s Hot Chef Survey, 2014
+20%
Fresh Eatings +20% 10 Yrs,+6%
‘19
• 87% fresh = healthier, 80% tastier2
• 44% more fresh ingredients
• 47% cook more from scratch
• #5 hot culinary trend overall 2015
Fresh +7% to Outpace
Grocery 3%, Foodservice 4%
→2018
Consumer
LifestylesFood that is ____ is healthy…
30%
Stron
g
Effort
Eat
More
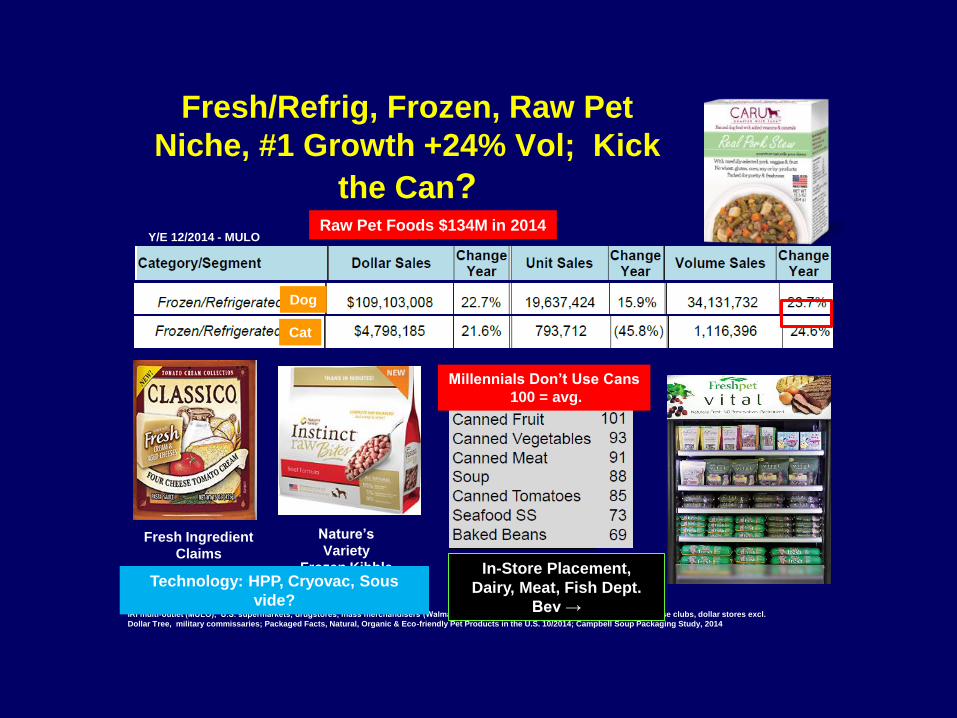
Fresh/Refrig, Frozen, Raw Pet
Niche, #1 Growth +24% Vol; Kick
the Can?
IRI multi-outlet (MULO), U.S. supermarkets, drugstores, mass merchandisers (Walmart, Target, Kmart, & Shopko), Sam’s Club, BJ’s warehouse clubs, dollar stores excl.
Dollar Tree, military commissaries; Packaged Facts, Natural, Organic & Eco-friendly Pet Products in the U.S. 10/2014; Campbell Soup Packaging Study, 2014
Dog
Cat
Fresh Ingredient
ClaimsIn-Store Placement,
Dairy, Meat, Fish Dept.
Bev →
Y/E 12/2014 - MULO
Nature’s
Variety
Frozen KibbleTechnology: HPP, Cryovac, Sous
vide?
Millennials Don’t Use Cans
100 = avg.
Raw Pet Foods $134M in 2014

Clean Food Label Mentions # Clean
Descriptors Bought Past 3 MonthsTotal
%
All natural, no artificial ingredients 30
Recognizable ingredients 30
No artificial preservatives 27
Organic 21
Short list of ingredients 21
Non-GMO 9
Gluten-free 11
IFIC, 2015 Food & Health Survey; 2013 Gallup Study of Clean Food & Beverage Labels; Technomic, Healthy Consumer Trend Report, 2014.
Chemicals #1 Fear +13%, No Artificial
43% Bought Clean Supplements, 70% Food
Concern Food Additives 2012-14
(Top 2 Box)
Food that is ____ is healthy (Top 2 Box)
Most Important Food Safety Issue
Chemical
Concern
+13%
2014-15
23% 2014
Not as
Much
Food

New Natural
Hierarchy
Humans 2015
Claims
Sought
U.S.
Food
Shoppers
2015
FMI, U.S. Grocery Shopper Trends, 2015; Packaged Facts, Natural, Organic & Eco-friendly Pet Products in the U.S. 10/2014
% Human Consumers
Buying More 2014
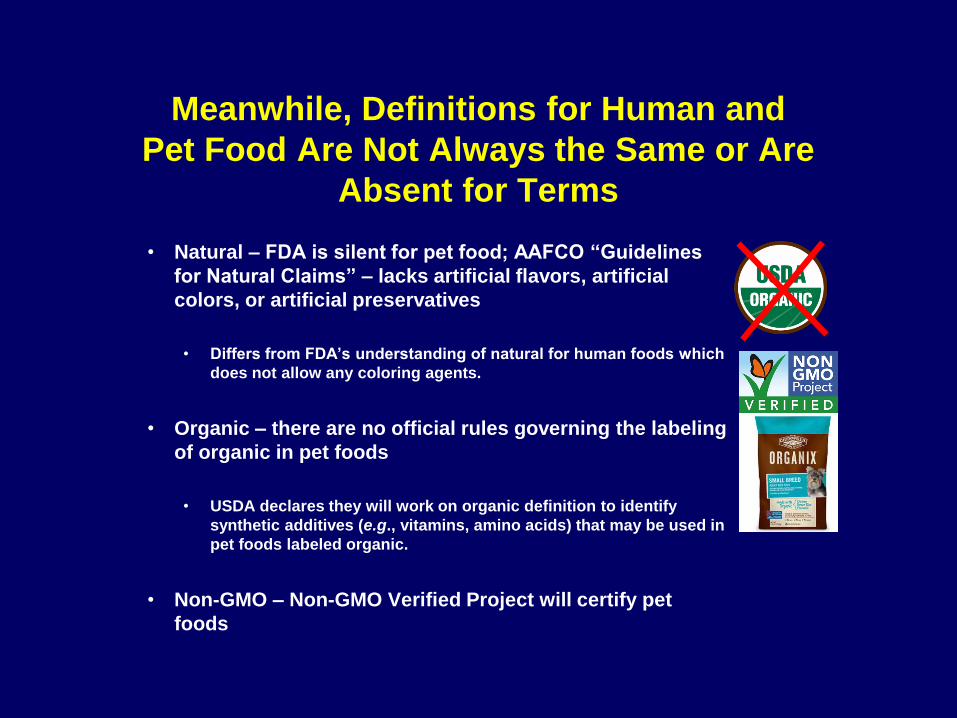
Meanwhile, Definitions for Human and
Pet Food Are Not Always the Same or Are
Absent for Terms
• Natural – FDA is silent for pet food; AAFCO “Guidelines
for Natural Claims” – lacks artificial flavors, artificial
colors, or artificial preservatives
• Differs from FDA’s understanding of natural for human foods which
does not allow any coloring agents.
• Organic – there are no official rules governing the labeling
of organic in pet foods
• USDA declares they will work on organic definition to identify
synthetic additives (e.g., vitamins, amino acids) that may be used in
pet foods labeled organic.
• Non-GMO – Non-GMO Verified Project will certify pet
foods

Pet Treat Formulations, Packaged Facts 2015
64% Dog, 63% Cat
owners have used
an alternative
formulation treat
Safety Top of Mind 56%
Dog, 44% Cat Owners
Purchasing
Sprinkle, Form & Function Trends in Pet Treats, 2015; Packaged Facts, Natural, Organic & Eco-friendly Pet
Products in the U.S. 10/2014; Wellness Natural Pet Food Study, 2014; FMI, Power of Meat, 2015.
Very Interested Meat/
Poultry Raised in USA
Pet Food Look for:
59% natural ingred.
52% no by-products
47% seek real meat
42% digestive benefit
40% no artificial flav,
colors, preserv
24% no corn, wheat,
soy
12% unique ingred.
Influences 9 in 10
Food Shoppers
Pet Food & Treat “Natural” Hierarchy 2014

Organic Food $35B, +11%, All Sectors Way Up
4.7% Dog Owners, 3.9% Cat Buy Organic Pet Food
73% Buy Occasionally, 9% Daily
29% Adults Buy Organic to Avoid GMOs;
Millennials, Parents #1 Users, Align Pets
NBJ, 2015; OTA; 2015; SFA, State-of-the-Specialty Food Industry, 2015; Hartman Group Organic & Natural,
2014
15% Cat and 21% Dog Owners
Buy Organic Treats
Claims 3 Years GMO > Natural, Organic?
74% Use Occasionally, 9% “Daily
Down slightly 5 yrs
Walmart
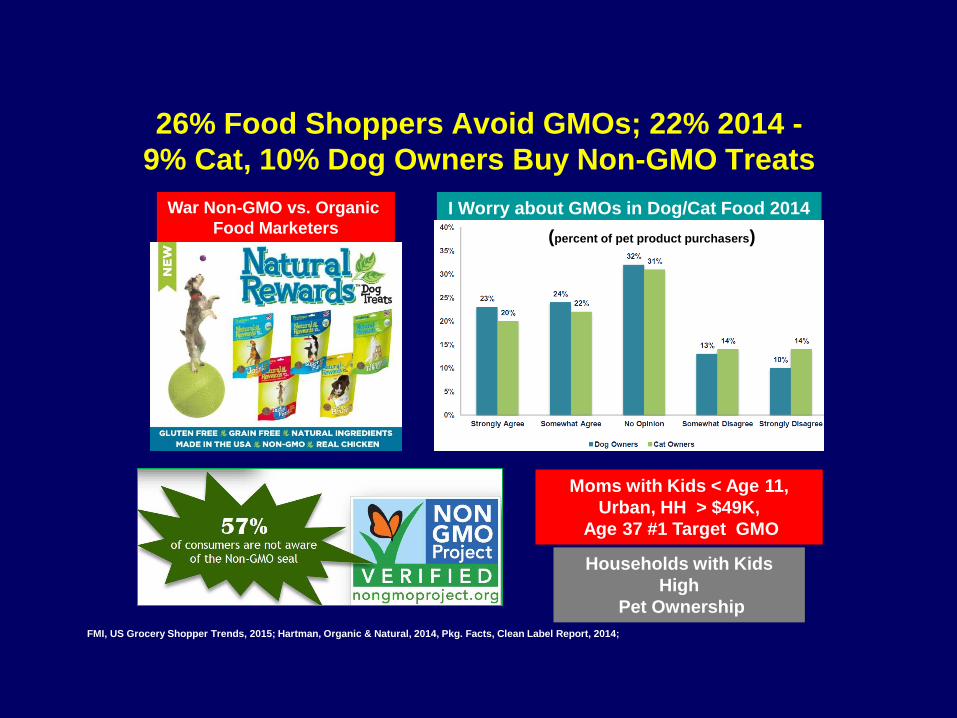
26% Food Shoppers Avoid GMOs; 22% 2014 -
9% Cat, 10% Dog Owners Buy Non-GMO Treats
Moms with Kids < Age 11,
Urban, HH > $49K,
Age 37 #1 Target GMO
I Worry about GMOs in Dog/Cat Food 2014War Non-GMO vs. Organic
Food Marketers
FMI, US Grocery Shopper Trends, 2015; Hartman, Organic & Natural, 2014, Pkg. Facts, Clean Label Report, 2014;
Households with Kids
High
Pet Ownership
(percent of pet product purchasers)
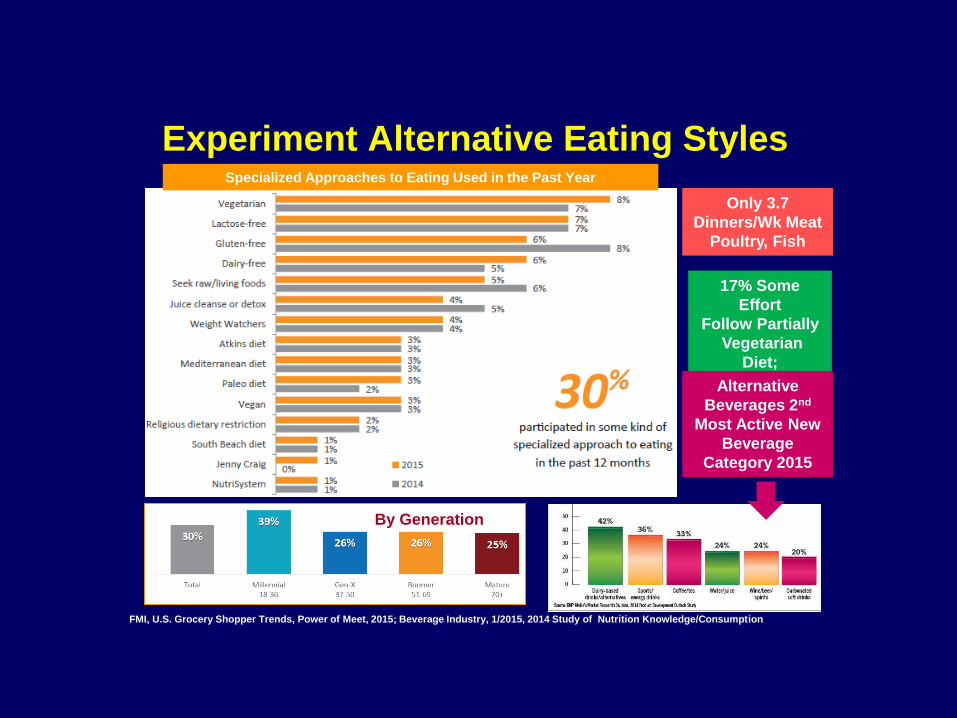
Specialized Approaches to Eating Used in the Past Year
FMI, U.S. Grocery Shopper Trends, Power of Meet, 2015; Beverage Industry, 1/2015, 2014 Study of Nutrition Knowledge/Consumption
Experiment Alternative Eating Styles
17% Some
Effort
Follow Partially
Vegetarian
Diet;
2% VeganAlternative
Beverages 2nd
Most Active New
Beverage
Category 2015
Only 3.7
Dinners/Wk Meat
Poultry, Fish
By Generation
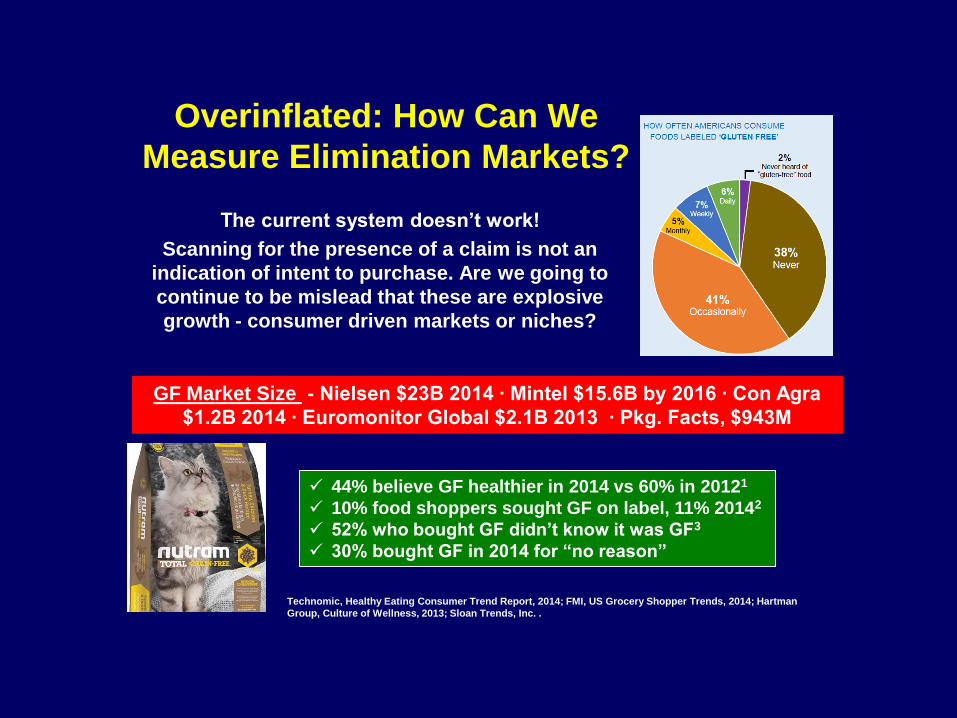
Overinflated: How Can We
Measure Elimination Markets?
The current system doesn’t work!
Scanning for the presence of a claim is not an
indication of intent to purchase. Are we going to
continue to be mislead that these are explosive
growth - consumer driven markets or niches?
Technomic, Healthy Eating Consumer Trend Report, 2014; FMI, US Grocery Shopper Trends, 2014; Hartman
Group, Culture of Wellness, 2013; Sloan Trends, Inc. .
GF Market Size - Nielsen $23B 2014 ∙ Mintel $15.6B by 2016 ∙ Con Agra
$1.2B 2014 ∙ Euromonitor Global $2.1B 2013 ∙ Pkg. Facts, $943M
44% believe GF healthier in 2014 vs 60% in 20121
10% food shoppers sought GF on label, 11% 20142
52% who bought GF didn’t know it was GF3
30% bought GF in 2014 for “no reason”

TrendSense™ Predictive Model: Gluten-
Free
Peaked in Early 2013, Celiac Remains
Strong
0
500
1000
1500
2000
2500
3000
00 01 02 03 04 05 06 07 08 09 10 11 12 13 14 15
Gluten & AllergyGluten & DigestionGluten & Celiac
Medical
Threshold
0
200
400
600
800
1000
1200
00 01 02 03 04 05 06 07 08 09 10 11 12 13 14 15
Gluten & Allergy Gluten & Digestion
Gluten & Celiac Gluten & Kids
Gluten & Health Gluten & Weight
Commercialization – Level 1
Popularizatio
n
Copyright Sloan Trends, Inc. 2015 NOT TO BE COPIED, PUBLISHED, DIVULGED WITHOUT PRIOR WRITTEN PERMISSION FROM SLOAN TRENDS
Commercialization – Level 20
5000
10000
00 01 02 03 04 05 06 07 08 09 10 11 12 13 14 15Gluten
Medical/Nutrition
0
2000
4000
00 01 02 03 04 05 06 07 08 09 10 11 12 13 14 15Gluten
Consumer Commercialization – Level 2
Commercialization – Level 1

Supplements
Condition-Specific2

2014 Supplement Sales & Growth
Core users say they are limiting the
number supplements they take daily, with
goal minimize supplement use altogether:
Belief that the quality & benefit
of nutrients in food is best
Pervasive doubts about the
bioavailability of even the
highest quality supplements
Vitamins $11.7B 3.0%
Herbals $6.4 6.8%
Minerals $2.6 5.0%
Sports $4.9 7.9%
Meal Supp.$4.3 7.9%
Specialty $6.9 3.8%
• Whole food supplements $1.7B to
$2.7B by 2017
• Fruit/veg supplement $117M, 3 years
double digit gains
2014 Gallup Study of the U.S. Market for Vitamins & Other Dietary Supplements
fielded 1/2015; Hartman Ethnographic Research, 10 years 2013.
Cut Back Supplement Use, Eating So
Many Fortified Foods
Human: Whole Food & Sports Fastest Growth Supplements 2014; Supplement Use Falling

Pet Supplements $541M, +3.9% 2014;
→ $697M 2019, CAGR 5.4%Condition-Specific Pet Suppl. Purchased 2015
70% Pet Supplement
Users Give 1X/day
Packaged Facts, Pet Supplements in the U.S., 2/2015
Pet Suppl. Market → 2019
Use Pet Supplements: Type → 2019
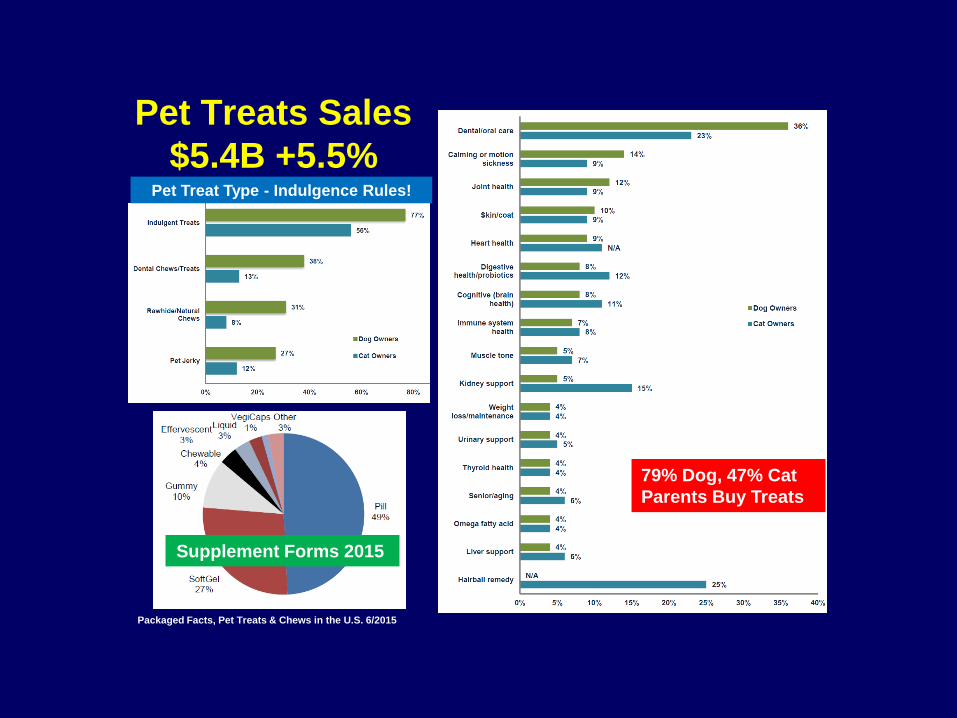
Pet Treats Sales
$5.4B +5.5% Pet Treat Type - Indulgence Rules!
Supplement Forms 2015
79% Dog, 47% Cat
Parents Buy Treats
Packaged Facts, Pet Treats & Chews in the U.S. 6/2015
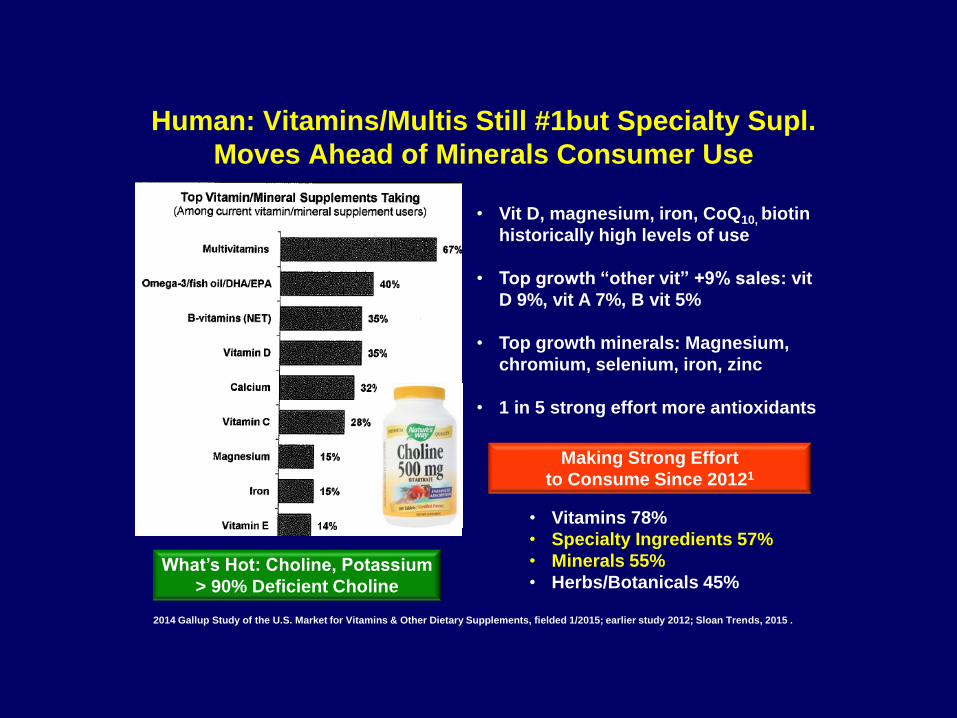
Human: Vitamins/Multis Still #1but Specialty Supl.
Moves Ahead of Minerals Consumer Use
• Vit D, magnesium, iron, CoQ10, biotin
historically high levels of use
• Top growth “other vit” +9% sales: vit
D 9%, vit A 7%, B vit 5%
• Top growth minerals: Magnesium,
chromium, selenium, iron, zinc
• 1 in 5 strong effort more antioxidants
2014 Gallup Study of the U.S. Market for Vitamins & Other Dietary Supplements, fielded 1/2015; earlier study 2012; Sloan Trends, 2015 .
Making Strong Effort
to Consume Since 20121
• Vitamins 78%
• Specialty Ingredients 57%
• Minerals 55%
• Herbs/Botanicals 45% What’s Hot: Choline, Potassium
> 90% Deficient Choline

Herbs 10 Years Growth $6.4B, +6.8%
2014
Best selling Mass Market : Horehound
followed by yohimbe, cranberry, black
cohosh, senna, cinnamon, flaxseed/oil,
echinacea, valerian, saw palmetto.
Best-selling Natural Channel -
Turmeric, followed by grass (wheat
and/or barley), flaxseed/oil, aloe vera,
spirulina, blue green algae, milk
thistle, elderberry, echinacea, mace
and saw palmetto
0
0.02
0.04
0.06
0.08
0.1
0
2000
4000
6000
80002
00
4
20
05
20
06
20
07
20
08
20
09
20
10
20
11
20
12
20
13
20
14
20
15
e
20
16
e
20
17
e
Sales Growth
Biggest Gains Awareness 2 Yrs
Turmeric = 35%, Goji berry 28%,
Garcinia cambogia 21%
2014 Gallup Study of the U.S. Market for Vitamins & Other Dietary Supplements, Herbalgram No.103. Aug/Oct. 2015.CRN Supplement Survey,
2014.
US Herb/Botanical Sales &
Growth to 2017
Awareness Herbs
Most Used 2014
Nutrition Business Journal, 2015 Datasheets; 2014 Gallup Study of the U.S. Market for Vitamins & Other Dietary Supplements
Fastest Growing Supplements to 2018
2015e 2016e 13-16 CAGR
Vitamin K, H, Other 1,661 1,806 8.9%
Milk Thistle 131 136 4.2%
Tumeric 197 235 21.5%
Magnesium 733 818 13.0%
Iron 409 438 7.1%
Vitamin D 832 902 8.5%
Vitamin B 2,210 2,414 10.2%
Probiotics 1,517 1,727 16.2%
Digestive Enzymes 273 291 6.3%
Melatonin 458 533 19.8%
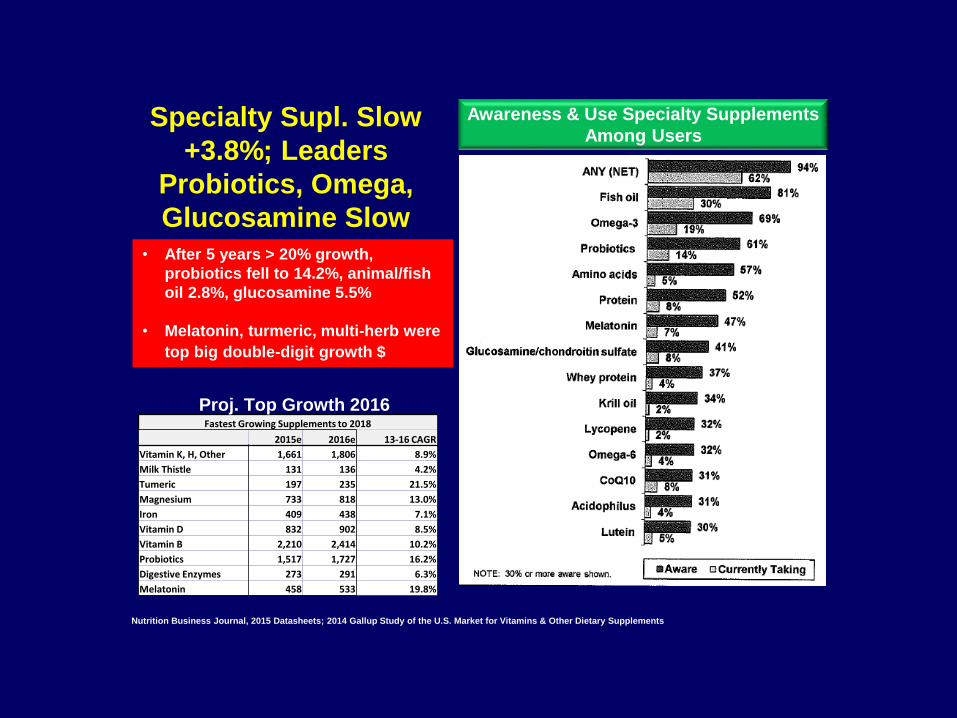
Awareness & Use Specialty Supplements
Among UsersSpecialty Supl. Slow
+3.8%; Leaders
Probiotics, Omega,
Glucosamine Slow• After 5 years > 20% growth,
probiotics fell to 14.2%, animal/fish
oil 2.8%, glucosamine 5.5%
• Melatonin, turmeric, multi-herb were
top big double-digit growth $
Proj. Top Growth 2016
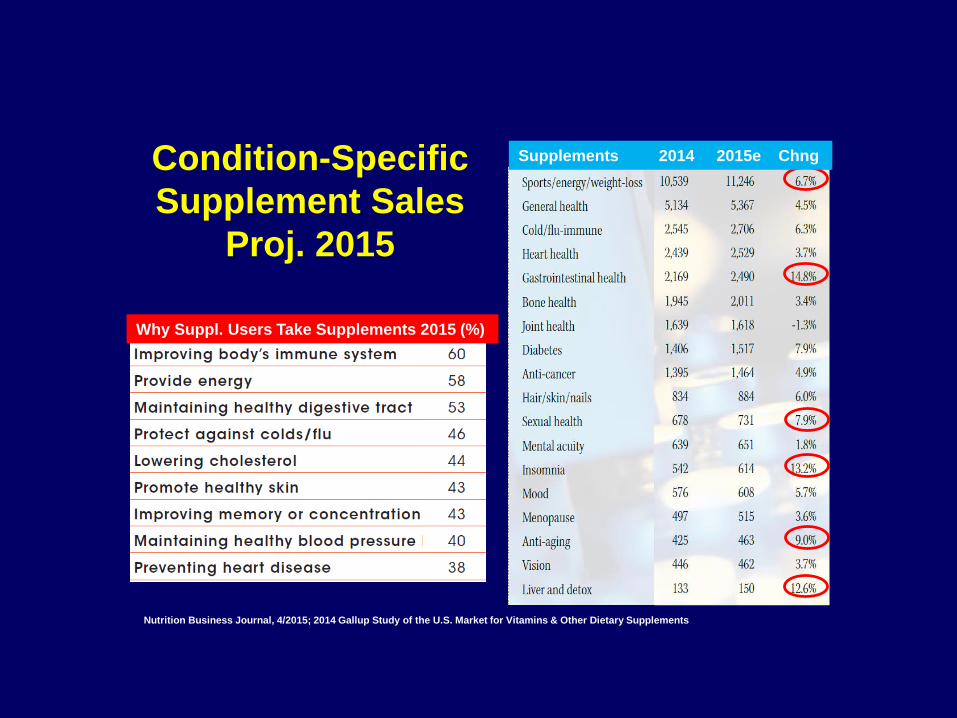
Condition-Specific
Supplement Sales
Proj. 2015
Nutrition Business Journal, 4/2015; 2014 Gallup Study of the U.S. Market for Vitamins & Other Dietary Supplements
Supplements 2014 2015e Chng
Why Suppl. Users Take Supplements 2015 (%)
33
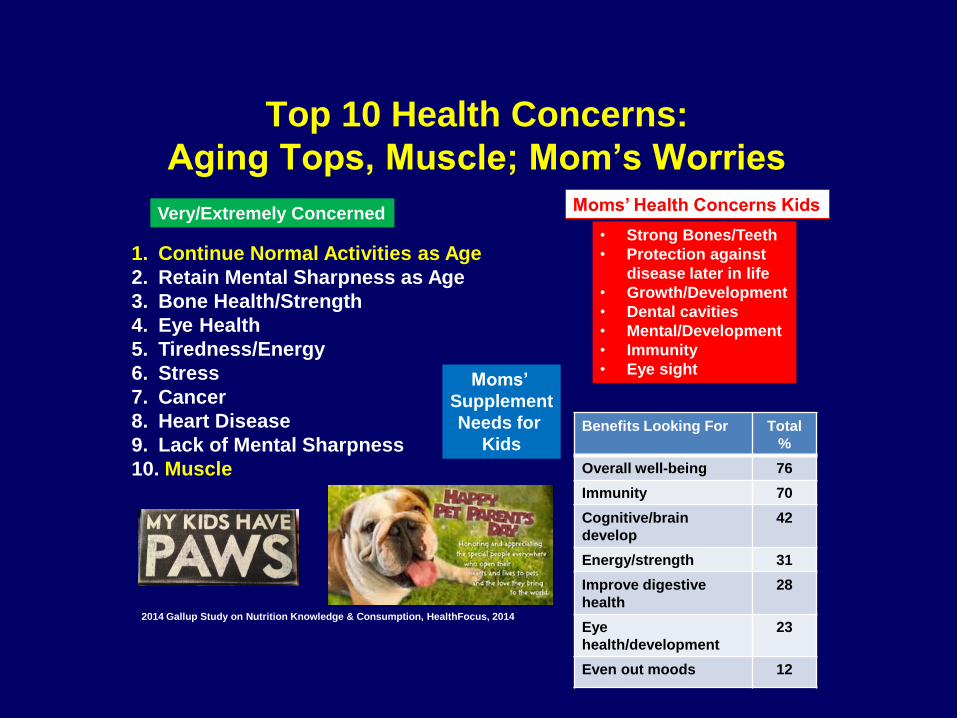
Top 10 Health Concerns:
Aging Tops, Muscle; Mom’s Worries
2014 Gallup Study on Nutrition Knowledge & Consumption, HealthFocus, 2014
Very/Extremely Concerned
Benefits Looking For Total
%
Overall well-being 76
Immunity 70
Cognitive/brain
develop
42
Energy/strength 31
Improve digestive
health
28
Eye
health/development
23
Even out moods 12
• Strong Bones/Teeth
• Protection against
disease later in life
• Growth/Development
• Dental cavities
• Mental/Development
• Immunity
• Eye sight
1. Continue Normal Activities as Age
2. Retain Mental Sharpness as Age
3. Bone Health/Strength
4. Eye Health
5. Tiredness/Energy
6. Stress
7. Cancer
8. Heart Disease
9. Lack of Mental Sharpness
10. Muscle
Moms’ Health Concerns Kids
Moms’
Supplement
Needs for
Kids

Humans, Pets Serious Conditions Rising2014 Avg. Cost Initial Vet
Diagnosis/Treatment
Cause Death Cats
Vet Compass, 2014, Vet Meds, Int’l, 2014
Fast Growth Human
Conditions
• Diabetes 1.2M new cases/yr
• Liver #10 cause death men
• 100M high blood pressure
• Heart disease - 87M have
• stroke
• IBS over self-diagnosed
• Thyroid, weight issues
• Digestive - 110M take antacid
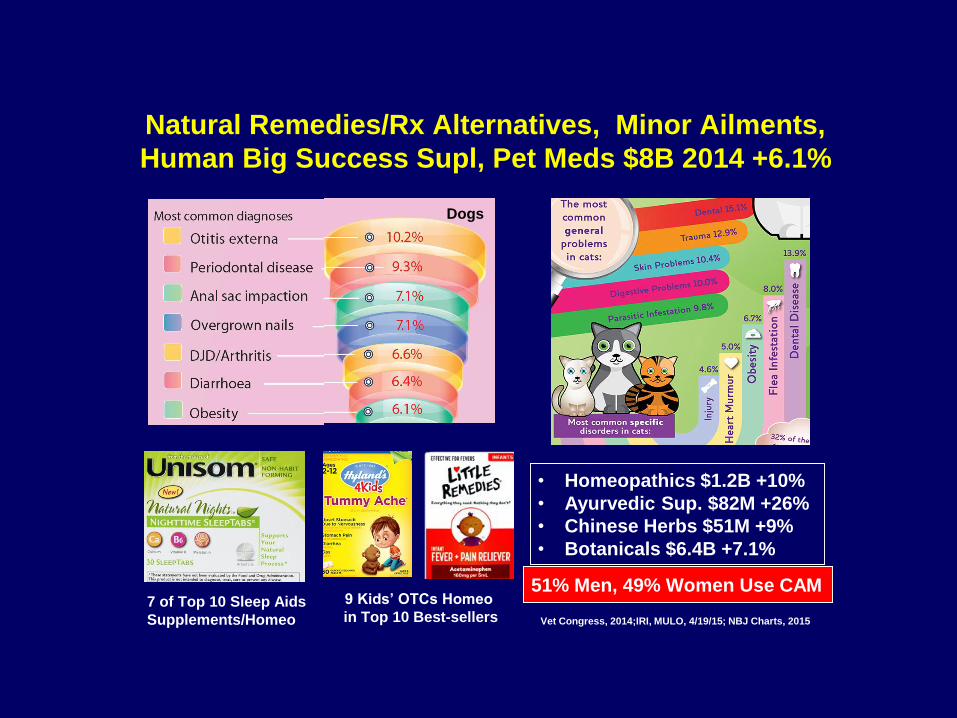
Natural Remedies/Rx Alternatives, Minor Ailments,
Human Big Success Supl, Pet Meds $8B 2014 +6.1%
Vet Congress, 2014;IRI, MULO, 4/19/15; NBJ Charts, 2015
7 of Top 10 Sleep Aids
Supplements/Homeo
• Homeopathics $1.2B +10%
• Ayurvedic Sup. $82M +26%
• Chinese Herbs $51M +9%
• Botanicals $6.4B +7.1%
9 Kids’ OTCs Homeo
in Top 10 Best-sellers
51% Men, 49% Women Use CAM
Dogs
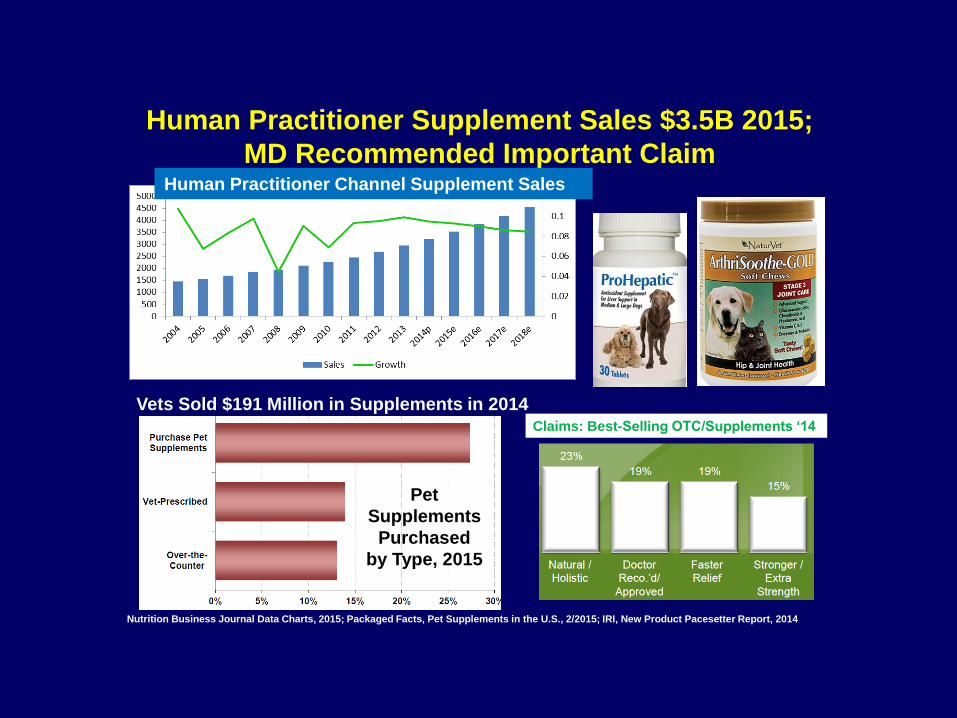
Human Practitioner Supplement Sales $3.5B 2015;
MD Recommended Important Claim
Claims: Best-Selling OTC/Supplements ‘14
Put Physicians Name on Bottles
Nutrition Business Journal Data Charts, 2015; Packaged Facts, Pet Supplements in the U.S., 2/2015; IRI, New Product Pacesetter Report, 2014
Human Practitioner Channel Supplement Sales
Pet
Supplements
Purchased
by Type, 2015
Vets Sold $191 Million in Supplements in 2014

37
Top 3 Benefits Want from SNP
KEY BENEFITS SOUGHT
Energy boost (49%)
Weight management (48%)
Build lean muscle (37%)
Replace nutrients lost during
exercise (37%)
Exercise is Up!: +12% Men, 10% Women,
$31B Sports Nutrition Section Mainstreams
Market Splits Everyday, High Performance
Recreational Sports, Gym Workout
Weekend Warriors
Women: Fitness/Weight
Packaged Facts, U.S. Weight Loss Market, 2014; National Sporting Goods Assn., 2014; NBJ, 2015; Gallup 2013 Study of Sports Nutrition
49% Men, 52% Women
Exercise Regularly
Exercise Walking
Exercising with Equip.
Camping
Bicycle Riding
Aerobic Exercising
Hiking
Workout at Club
Running/Jogging
95.8
55.3
44.7
39.8
38.5
37.7
36.3
35.5
Sports Nutrition 2014 Bil $

Weight Loss Up, Men = 68% Growth
Dogs (53%) & 55M (58%) Cats Overweight
High Protein Weight Loss Drinks:
#1 or #2 Fastest Growing CPG
Product Last 5 Years
Pkg. Facts, Weight Management, 8/2015; Pkg. Facts, Pet Treats & Chews in the U.S., June 2015; Assn. for Pet Obesity Prevention; 2014
Men 18-34 Drive Weight Maintenance;
+34% 5 Years & Health Risk Dieting
% Owners Use Pet Food/Treats for
Weight
%Growth Watching Diet for Weight% Growth Humans Watching Diet for Weight
Weight Loss $ Bil 2014
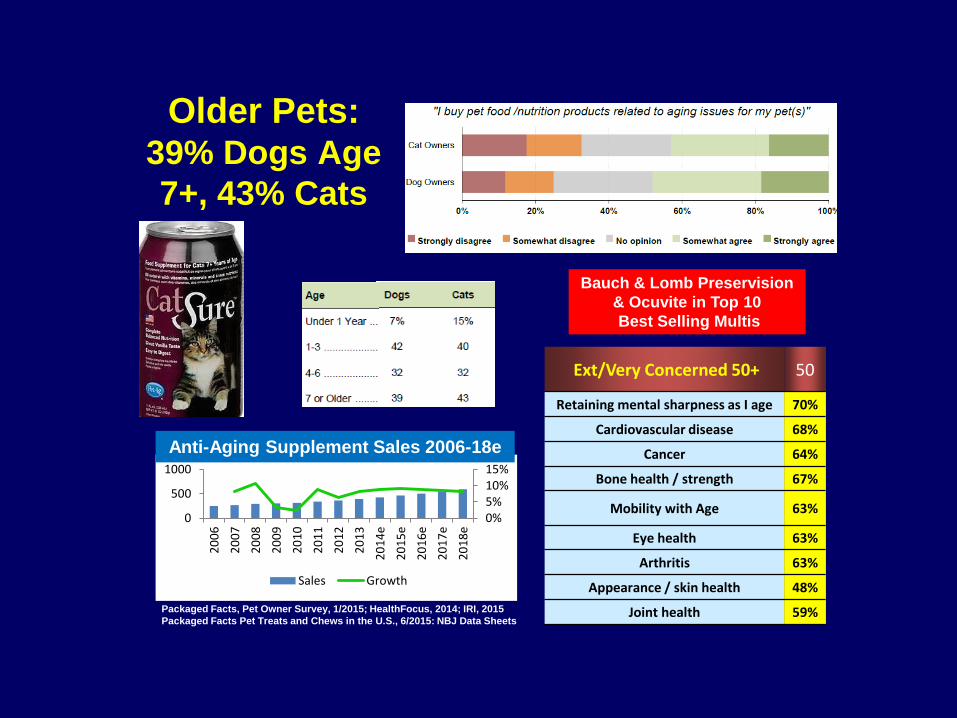
Older Pets:39% Dogs Age
7+, 43% Cats
Packaged Facts, Pet Owner Survey, 1/2015; HealthFocus, 2014; IRI, 2015
Packaged Facts Pet Treats and Chews in the U.S., 6/2015: NBJ Data Sheets
0%5%10%15%
0
500
1000
20
06
20
07
20
08
20
09
20
10
20
11
20
12
20
13
20
14
e
20
15
e
20
16
e
20
17
e
20
18
e
Sales Growth
Anti-Aging Supplement Sales 2006-18e
Ext/Very Concerned 50+ 50
Retaining mental sharpness as I age 70%
Cardiovascular disease 68%
Cancer 64%
Bone health / strength 67%
Mobility with Age 63%
Eye health 63%
Arthritis 63%
Appearance / skin health 48%
Joint health 59%
Bauch & Lomb Preservision
& Ocuvite in Top 10
Best Selling Multis

Human: Probiotic Supp. 2014 $1.4B,
+14.2% vs. +20% for Last 5 Years
0%5%10%15%20%25%30%
-
500
1,000
1,500
2,000
2,500
20
04
20
05
20
06
20
07
20
08
20
09
20
10
20
11
20
12
20
13
20
14
e2
01
5e
20
16
e2
01
7e
Sales Growth
Probiotics Sales & Growth, 2004-17e
0%
5%
10%
15%
20%
$0
$100
$200
$300
$400
20042005200620072008200920102011201220132014e2015e2016e2017eSales Growth
Awareness/Use Probiotics 2014
Digestive Enzymes Suppl. $251M ‘14
10% Kitties Suffer
Digestive Issues
Nutrition Business Journal, 2015 Data Sheets; 2014 Gallup Study of the U.S. Market for Vitamins & Other Dietary Supplements

AM Top Nutrition Time, Market to
DaypartsWellness Relevant Dietary Goals by Daypart
Motivators for AM Eating - #1 Dieters
Energy, Mental, Weight, Feel Full
FMI, U.S. Grocery Shopper Trends, 2014
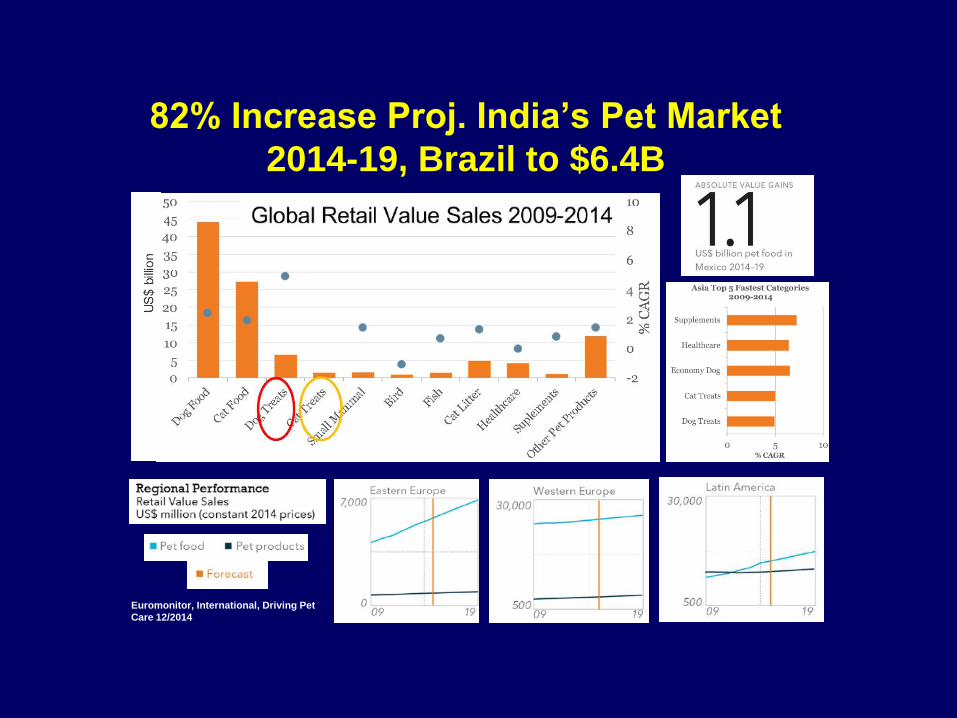
82% Increase Proj. India’s Pet Market
2014-19, Brazil to $6.4B
Euromonitor, International, Driving Pet
Care 12/2014
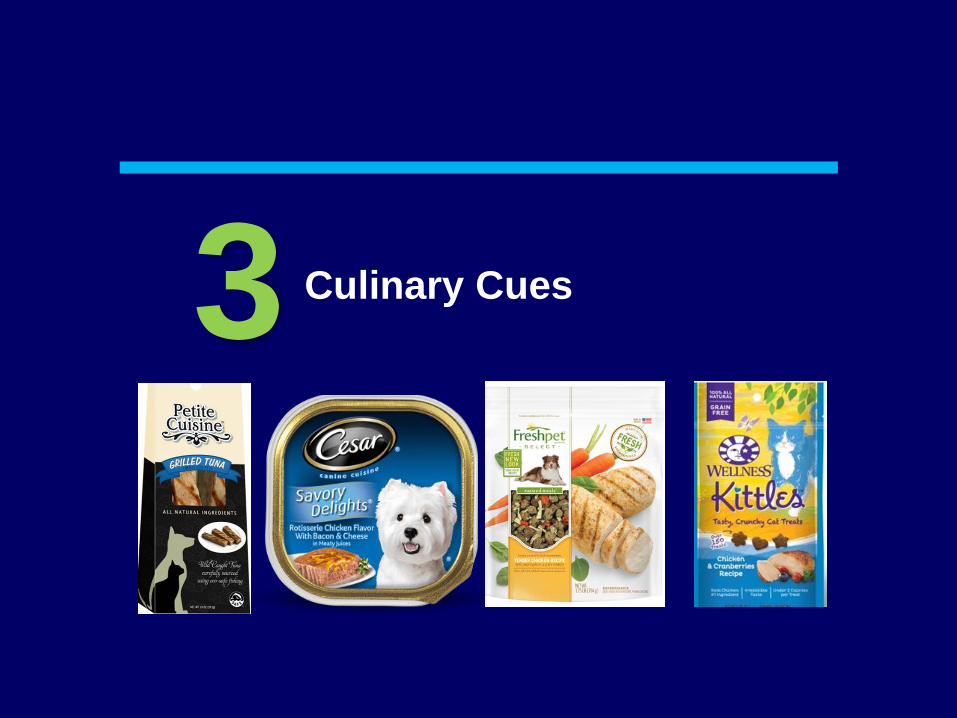
Culinary Cues3

1.The Hartman Group, Modern Eating Report, 2013; 2. FMI, U.S. Grocery Shopper Trends, 2014
Top 10 Eating Occasions
New Upscale Eating Occasion, 48%
Foodies;145M Buy Specialty Foods, 96M Everyday Use
1. Rice
2. Chinese
Food
3. Salads
4. Eggs
5. Beans
6. Hamburger
7. Potatoes
8. Vegetables
9. Sweets
10.Meat Cuts
Top 10 Savoring Demand:
Upgrade
36% Buy Gourmet Everyday Snacking1
• Instrumental afternoon snack 10.5%
• Instrumental lunch 10.1%
• Instrumental dinner 9.6%
• Instrumental breakfast 9.4
• Savoring dinner 9.3%
• Savoring after dinner snack 7.1%
• Instrumental after dinner snack 6.3%
• Instrumental morning snack 5.9%
• Savoring lunch 5.8%
• Savoring breakfast 5.3
41% Adult, 33% Snack & 29% Kids’ Eating
Occasions Involve More Sophisticated
Eating Experience – More Fresh
Foodie Narratives, Unique Flavors2
Discovery is a New
Food Attribute
Specialty Food Sales
$105B + 22% - 2 Yrs2

Center-of-the-Plate Hot Side Dishes
NRA, What’s Hot for 2015 Chef Survey, 10/2014
Hot Ingredients
‘152
Specialty Foods, Hot Culinary Trend
Times Buy Prepared
Meals Grocery,
C-Store, Other/Month
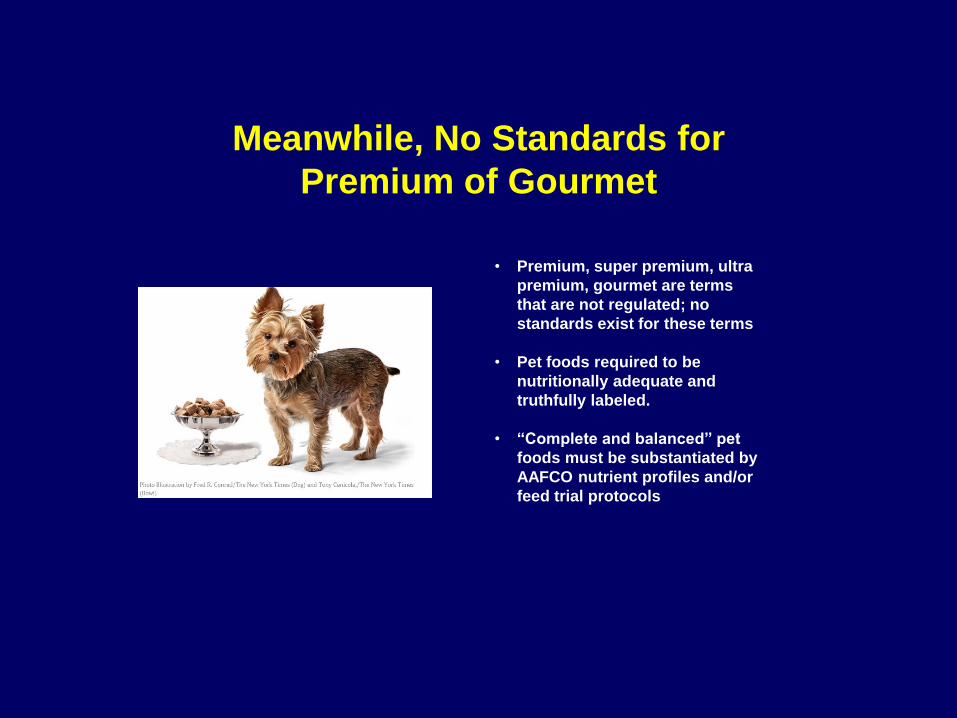
Meanwhile, No Standards for
Premium of Gourmet
• Premium, super premium, ultra
premium, gourmet are terms
that are not regulated; no
standards exist for these terms
• Pet foods required to be
nutritionally adequate and
truthfully labeled.
• “Complete and balanced” pet
foods must be substantiated by
AAFCO nutrient profiles and/or
feed trial protocols

Regulatory4

New Regulations Are in Effect by FDA
Proposed Rule – October 2013
Paralleled similar preventive control rule for human foods
Supplemental Notice of Proposed Rulemaking – September
2014
Final Rule – September 17, 2015
Food Safety Modernization Act:
Current Good Manufacturing
Practices, Hazard Analysis, and
Preventive Controls for Food for
Animals

Preventive Controls for Animal FoodRequires implementation of food safety system
with a written food safety plan.
www.fda.gov/Food/GuidanceRegulation/FSMA/ucm366510.htm

Preventive Controls for Animal Food
Supply chain controls are included, but are more
flexible than for human food.
www.fda.gov/Food/GuidanceRegulation/FSMA/ucm366510.htm
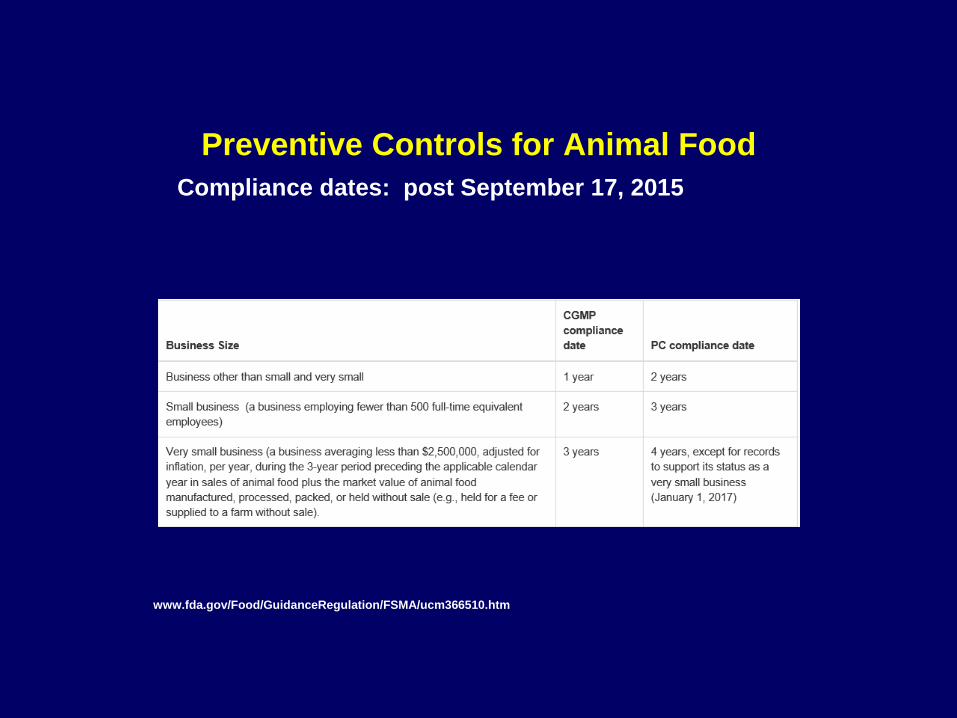
Preventive Controls for Animal Food
Compliance dates: post September 17, 2015
www.fda.gov/Food/GuidanceRegulation/FSMA/ucm366510.htm

Opportunities
HUNTING for Opportunities? Got Your EYES on
Something?
LOOKING for the Perfect
Pumpkin Patch?
• Fresh and Frozen
• Natural
• “Clean Label”
• Active – mobility
• Aging well, Weight,
Sports, New Conditions
• Upscale

Drug Stores- Follow
the Meds, Integrate
into Other Depts
Vet-provided Supplements
Upfront Impulse Buy
Pet Treats, Single Serve
On-the-Go, C-stores
Self-diagnosis on
RiseVitamin Waters
New Ops, Looking For Innovation!
Cross-over Human-pet Branding Weight Management
Meal Replacement

Heatable/Re-heatable
Primary Household Shopper
46% Food Shopper HH
Men
Dads
54%
Kick the Can: Complete & Balanced
Pouches & “Appetizers”
Keep Up with
# of Claims
Exercise
“Recovery”/Joint
Health
Beverages
Professional
Services Go Home
7% Pets “Other”,
Backyard Chickens
New Ops, Looking for Innovation!

Sloan Trends, Inc. 20+ Years of Identifying
Emerging Food/Beverage
Opportunities
Dr. A. Elizabeth Sloan
Trends, Markets,
Predictions
760-822-4321 (cell)
Dr. Catherine Adams Hutt
Science, Safety,
Regulatory
630-605-3022 (cell)
A Holistic Approach
760-741-9611
www.sloantrend.com