2015 - d3kex6ty6anzzh.cloudfront.net · methodologies used and information about the expert...
TRANSCRIPT

2015 YEAR-END EDITION Outside Counsel Fees for M&A Activity Surge
Enterprise Legal Management Trends Report
2015
CounselLink®Powered by:


32015 CounselLink Enterprise Legal Management | Trends Report
Enterprise Legal Management Trends ReportPowered by LexisNexis® CounselLink®
2015 YEAR-END EDITION
Billing rates for the most experienced M&A lawyers have increased substantially
Highlights
Exec
utive
Executive HighlightsBased on data derived from outside counsel invoices processed through the CounselLink platform. Information is based on the trailing 12 months ending December 31, 2015, unless otherwise noted.
• Outside counsel fees for Mergers and Acquisitions activity surge Outside counsel fees spent on M&A transactions in 2014 and 2015 were more than twice those reported in 2012.
• Billing rates for experienced lawyers have risen considerably Partners on the high end of the hourly rate scale (presumably those with high levels of expertise in their fields) have had large increases in rates in the last two years.
• The overall blended rate on M&A matters is the highest, exhibiting one of the largest increases on a three-year basis The three-year compound annual growth rate (CAGR) for the median matter rate is 3 percent. While other matter categories have had higher year-over-year median rate increases, this is one of the highest CAGRs for the groupings of matters we report on. Litigation has seen similar growth (4 percent).
• The majority of companies aren’t hiring new law firms New data analyzed in the current report provides evidence that most legal departments are forgoing hiring new firms to handle significant legal matters. 31 percent of companies hired a new law firm for M&A work in 2015.

4 2015 CounselLink Enterprise Legal Management | Trends Report
Introd
uctio
nThe Trends Report presents a snapshot of data available via the CounselLink Enterprise Legal Management platform. The collective stream of data and processed invoices aggregated since 2009 currently comprises more than $21 billion in legal spending, nearly five million invoices, and well over one million matters.
LexisNexis published the first edition of the Enterprise Legal Management Trends Report in October 2013. That report established and analyzed a set of key metrics related to the legal services industry. We have published subsequent Trends reports twice a year since then, compiling an increasingly more detailed and comprehensive historical view of how legal market dynamics are evolving over time. Individually, and in aggregate, the reports provide insights corporate counsel and law firms can use to guide their decisions and actions.
Mid-year reports focus solely on refreshing the data associated with the original six key metrics. End-of-year reports, such as this one, not only refresh the six key metrics, but also include a deeper assessment of market conditions to highlight noteworthy trends.
Please refer to the end of the report for details about the definitions and methodologies used and information about the expert contributors who have conducted the analysis.
Table of ContentsExecutive Highlights
Introduction
Market Insights – Outside Counsel Fees for M&A Activity Surge
Market Insights – Most Legal Departments Not Hiring New Firms
The Key Metrics
#1: Blended Hourly Rate for Matters – by Practice Area
#2: Law Firm Consolidation - Number of Legal Vendors Used by Corporations
#3a: Alternative Fee Arrangement (AFA) Usage – Matters
#3b: Alternative Fee Arrangement (AFA) Usage – Billings
#4: Partner Hourly Rate Growth – Overall
#5a: Partner Hourly Rate Growth – by Location (City)
#5b: Partner Hourly Rate Growth – by Location (State)
#6: Partner Hourly Rate Growth – by Practice Area
About the Trends Report
Expert Contributors
345
10
1416171819
2021
222425

52015 CounselLink Enterprise Legal Management | Trends Report
Market Insights: Outside Counsel Fees for M&A Activity SurgeData in CounselLink provides confirmation of a significant increase in M&A activity that began in 2013 and surged in 2014 and 2015. Outside counsel fees spent on M&A transactions in 2014 and 2015 were more than twice the fees reported in 2012. Of those fees, 99 percent were billed on an hourly basis (See Key Metric 3, page 18).
Larger law firms (those with at least 500 lawyers) are the firms of choice for the vast majority of M&A transactions. In 2014 and 2015, 72 percent of the fees billed on M&A matters originated from larger firms.
As M&A activity has increased, billing rates for lawyers with significant expertise have increased materially. The three-year CAGR for the median partner was 2 percent (2012 to 2015), but on the high end some partners increased rates by 9 percent on a three-year CAGR basis. Partners with the large increases were those partners already at the 90th percentile of billing rates.
In 2012 the median partner rate was $623. By 2015 the median rate was $638. Contrast that to the partner at the 90th percentile that billed at $903/hr in 2012 versus $1,032/hr in 2015. As demand for M&A expertise has grown, those partners with significant experience in this practice have been able to command higher rates.
Associate rates follow a similar pattern. While the three-year CAGR for the median associate rate paid was 2 percent, associates already billing at the 75th and 90th percentiles of billing rates increased rates by significantly higher percentages.
M&A work has been and continues to be partner intensive. Close to 25 percent of M&A matters in each year of the four years studied were handled entirely by partners. For the median matter, at least half of the hours billed were billed by partners in each of the four years.
High demand, high lawyer rates, and a high percentage of partner hours all contribute to M&A matters continuing to have the highest blended average rates of all matter categories. In 2015, the median rate paid on an M&A matter was $458. This represents a 3 percent compound annual growth rate relative to 2012, one of the highest CAGRs for the groupings of matters analyzed.

62015 CounselLink Enterprise Legal Management | Trends Report
1FIG
URE Figure 1: Enterprise Legal Management Trends Report
Macro Trend: M&A matter count more than doubles since 2012Based on rolling 12-month totals ending December 31 for years 2011 to 2015
This chart shows the relative growth of M&A transactions from 2012 to 2015.
2012 2013 2014 2015
The number of M&A transactions in 2014 and 2015 was more than twice that of 2012.

7 2015 CounselLink Enterprise Legal Management | Trends Report
2FIG
URE Figure 2: Enterprise Legal Management Trends Report
Macro Trend: M&A matter outside counsel fees more than double since 2012Based on rolling 12-month totals ending December 31 for years 2011 to 2015
This chart shows the relative growth of M&A fees paid from 2012 to 2015.
The total amount of M&A fees paid in 2014 and 2015 was more than twice that of 2012.
$ $ $$2012 2013 2014 2015

8 2015 CounselLink Enterprise Legal Management | Trends Report
3FIG
URE Figure 3: Enterprise Legal Management Trends Report
Macro Trend: M&A work continues to be partner intensiveBased on rolling 12-month totals ending December 31 for years 2011 to 2015
This chart illustrates M&A matter distribution by percent of partner time for the years 2012 through 2015.
90th Percentile
75th Percentile
Median
25th Percentile
10th Percentile
X
100%
80%
60%
40%
20%
02012 2013 2014 2015
X X XX
Perc
enta
ge o
f hou
rs b
y pa
rtne
r

92015 CounselLink Enterprise Legal Management | Trends Report
4FIG
URE Figure 4: Enterprise Legal Management Trends Report
Macro Trend: Median blended matter rates exhibit a three-year CAGR of 3 percentBased on rolling 12-month totals ending December 31 for years 2011 to 2015
This chart shows the blended effect on average rates for matters.
$800
$700
$600
$500
$400
$300
$200
$100
02012 2013 2014 2015
90th Percentile
75th Percentile
Median
25th Percentile
10th Percentile
X
X XX X
The three-year CAGR for the median matter rate is 3 percent. While other matter categories have had higher year-over-year median rate increases, this is one of the highest CAGRs for the groupings of matters we report on. Litigation has seen similar growth (4 percent) but that matter category consists of a broad range of litigation types.

10 2015 CounselLink Enterprise Legal Management | Trends Report10 2014 CounselLink Enterprise Legal Management | Trends Report
Market Insights: Most Legal Departments are not Hiring New Firms for Significant Legal WorkMany legal departments have created processes and metrics to evaluate law firms and inform decisions they make concerning which firms will continue to work with them, and in what capacity. Data suggests that legal departments are whittling down the number of firms with whom they work. For example, we observed in the 2013 Year-End edition of the Trends Report that 58 percent of companies hired fewer U.S. law firms than in a previous period. New data analyzed in the current report provides evidence that most legal departments are also forgoing hiring new firms to handle significant legal matters.
• 44 percent of legal departments engaged with at least one new US firm (one they hadn’t worked with in the prior four years) in 2015 1
• 23 percent engaged with at least two new firms
• 16 percent engaged with at least three new firms
• 11 percent engaged with at least four new firms
The majority of legal departments (56 percent) are not hiring new law firms. However, there are some types of work for which companies are more likely to bring in new outside counsel. For example, 57 percent of companies with significant litigation in 2015 (at least one matter with a minimum of $100k in outside counsel fees) brought in a new law firm. Similarly, 46 percent of companies with significant corporate work in 2015 brought in a new law firm. On the opposite side, less than a quarter of companies hired a new firm to handle employment work in 2015.
Putting the number of firms typically hired in context, the median number of law firms a company worked with in 2015 was 36. There’s a wide range around this median number that is largely affected by the size of the company, the industry, and types of legal matters handled. On the low end (the 25th percentile) 23 firms were engaged, and on the high end (the 75th percentile) 71 firms were used. In other words, 50 percent of CounselLink customers worked with between 23 and 71 law firms in 2015, but the other 50 percent were outliers on either side.
As further context, companies engage more law firms (between five and 27), to handle their litigation work than any other type of work and the fewest (between one and five) to handle M&A transactions (See Figure 2). Therefore, the fact that 31 percent of companies hired a new law firm for M&A work in 2015 represents a material decision related to their law firm panel.
From the law firm perspective, the low level of new outside counsel hiring represents a challenge to firms hoping to acquire business from new clients. This supports the importance of firms differentiating themselves and finding new ways to add value for clients.
1 To be counted, a firm had to work on a “significant” matter, defined here as resulting in at least $100k in legal fees.

11 2015 CounselLink Enterprise Legal Management | Trends Report
5FIG
URE Figure 5: Enterprise Legal Management Trends Report
Macro Trend: New law firm hiring mainly limited to two practice areasBased on rolling 12-month totals ending December 31 for years 2011 to 2015
This chart shows which practice areas hire new firms.
Litigation and General, Corporate,Tax are more willing to hire new firms, while other key practices are less likely to hire even a single new firm.
Hire at least 1 new firm
Hire at least 2 or more firms
Hire at least 3 or more firms
Hire at least 4 or more firms
60%
50%
40%
30%
20%
10%
0
Corporate,General, Tax
Litigation-General Regulatory and Compliance
Employment and Labor
Mergers and Acquisitions
Commercial and Contracts
IP
Commercial and Contracts
Corporate, General, Tax
Employment and Labor
Environmental
Finance, Loans and Investments
Insurance
IP-Patent
IP-Trademark
Litigation-General
Mergers and Acquisitions
Real Estate
Regulatory and Compliance
TM
Commercial and Contracts
Corporate, General, Tax
Employment and Labor
Environmental
Finance, Loans and Investments
Insurance
IP-Patent
IP-Trademark
Litigation-General
Mergers and Acquisitions
Real Estate
Regulatory and Compliance
TM
Commercial and Contracts
Corporate, General, Tax
Employment and Labor
Environmental
Finance, Loans and Investments
Insurance
IP-Patent
IP-Trademark
Litigation-General
Mergers and Acquisitions
Real Estate
Regulatory and Compliance
TM
Commercial and Contracts
Corporate, General, Tax
Employment and Labor
Environmental
Finance, Loans and Investments
Insurance
IP-Patent
IP-Trademark
Litigation-General
Mergers and Acquisitions
Real Estate
Regulatory and Compliance
TM
Commercial and Contracts
Corporate, General, Tax
Employment and Labor
Environmental
Finance, Loans and Investments
Insurance
IP-Patent
IP-Trademark
Litigation-General
Mergers and Acquisitions
Real Estate
Regulatory and Compliance
TM
Commercial and Contracts
Corporate, General, Tax
Employment and Labor
Environmental
Finance, Loans and Investments
Insurance
IP-Patent
IP-Trademark
Litigation-General
Mergers and Acquisitions
Real Estate
Regulatory and Compliance
TM
Commercial and Contracts
Corporate, General, Tax
Employment and Labor
Environmental
Finance, Loans and Investments
Insurance
IP-Patent
IP-Trademark
Litigation-General
Mergers and Acquisitions
Real Estate
Regulatory and Compliance
TM
Commercial and Contracts
Corporate, General, Tax
Employment and Labor
Environmental
Finance, Loans and Investments
Insurance
IP-Patent
IP-Trademark
Litigation-General
Mergers and Acquisitions
Real Estate
Regulatory and Compliance
TM
1
2+
3+ 4+
122015 CounselLink Enterprise Legal Management | Trends Report
6FIG
URE Figure 6: Enterprise Legal Management Trends Report
Macro Trend: Law departments use only a small set of law firms for M&A workBased on rolling 12-month totals ending December 31 for years 2011 to 2015
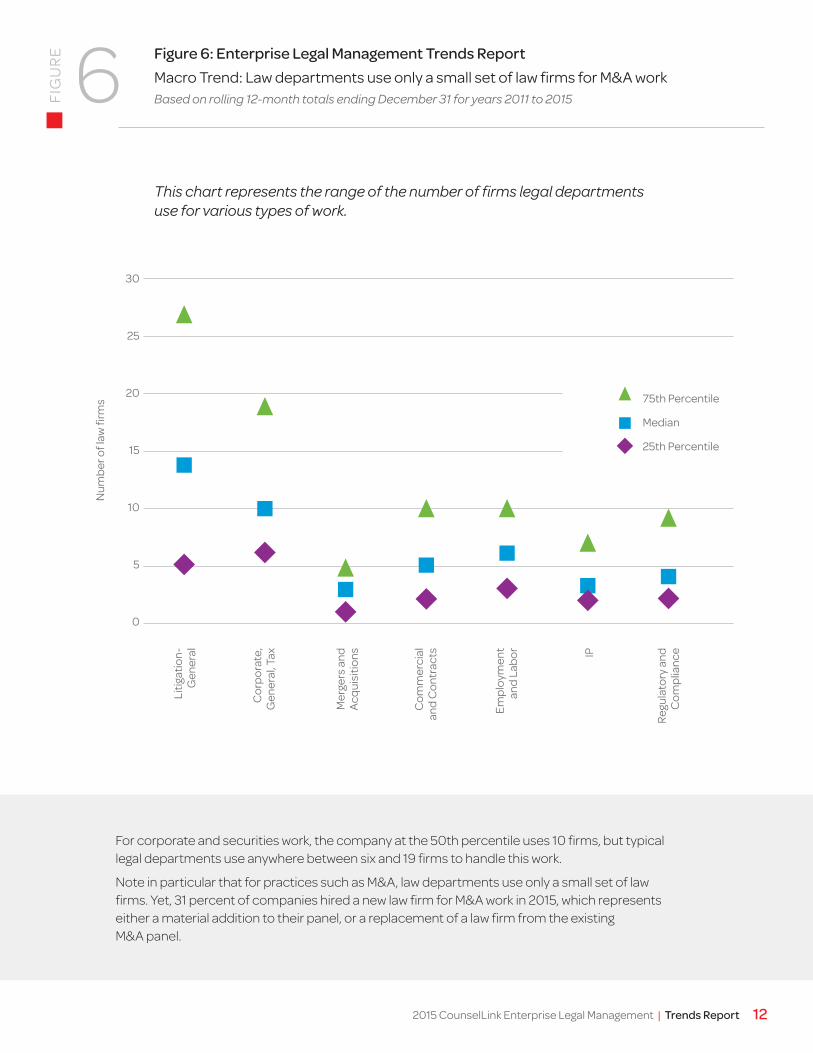
This chart represents the range of the number of firms legal departments use for various types of work.
For corporate and securities work, the company at the 50th percentile uses 10 firms, but typical legal departments use anywhere between six and 19 firms to handle this work.
Note in particular that for practices such as M&A, law departments use only a small set of law firms. Yet, 31 percent of companies hired a new law firm for M&A work in 2015, which represents either a material addition to their panel, or a replacement of a law firm from the existing M&A panel.
75th Percentile
Median
25th Percentile
30
25
20
15
10
5
0
Num
ber o
f law
firm
s
Mer
gers
and
Ac
quis
ition
s
Cor
pora
te,
Gen
eral
, Tax
Regu
lato
ry a
ndC
ompl
ianc
e
Empl
oym
ent
and
Labo
r
Com
mer
cial
and
Con
trac
ts IP
Litig
atio
n-
Gen
eral

13 2015 CounselLink Enterprise Legal Management | Trends Report
The Key Metrics
Enterprise Legal Management Trends Report
Each semi-annual update of the Enterprise Legal Management Trends Report covers a standard set of six key metrics for hourly legal rates and the corporate procurement of legal services from law firms.
13 2015 CounselLink Enterprise Legal Management | Trends Report

142015 CounselLink Enterprise Legal Management | Trends Report
See following page for guidance on interpreting this chart.
Volatility is a calculated indicator of blended rate variability. Higher numbers suggest a better opportunity to negotiate rates and/or the assigned timekeeper mix.
Key Metric #1: Blended Hourly Rate for Matters – by Practice AreaBlended hourly rates and rate volatility differ by type of workBased on trailing 12-months ending December 31, 2015 Practice areas ordered by median blended matter rates.
1KE
Y M
ETRI
C
Mer
gers
and
Ac
quis
ition
s
Cor
pora
te,
Gen
eral
, Tax
Envi
ronm
enta
l
Regu
lato
ry a
ndC
ompl
ianc
e
Empl
oym
ent
and
Labo
r
Com
mer
cial
and
Con
trac
ts
IP- P
aten
t
Real
Est
ate
IP- T
rade
mar
k
Litig
atio
n-
Gen
eral
Fina
nce,
Loa
ns
and
Inve
stm
ents
Insu
ranc
e
Volatility Rate
Partner - Median Associate - Median Paralegal - Median
Timekeeper rate metrics
10th - 90th Percentile Range Median25th - 75th Percentile Range
Blended matter hourly rate metrics
7 10 510 5 45 37 3 6 2
$800
$700
$600
$500
$400
$300
$200
$100
0

15 2015 CounselLink Enterprise Legal Management | Trends Report
Interpreting the Chart:
The chart captures median rates for three different groups of timekeepers (partners, associates and paralegals) and the range of the blended average hourly rate across multiple matter types. As a guide to interpreting the output, consider IP-Patent compared to Corporate, General, Tax. These two categories have somewhat similar average hourly partner rates – $420 and $441, respectively – but IP-Patent work requires significantly less partner time. The result is a noticeably lower blended median rate for IP-Patent work ($300) versus the same rate for Corporate, General, Tax ($340).
An additional metric provided in this section is the Volatility Index – a calculated marker indicating the variability encountered in blended matter rates. Using a 10-point scale, the Index reflects how broad the spread is between the 25th and 75th percentiles of hourly rates. High volatility scores indicate greater variance in prices paid based on the mix of timekeepers and individual hourly rates.
Comparing Regulatory and Compliance to Insurance as an example, the spread between the 25th and 75th percentiles of blended hourly rates for Regulatory and Compliance work is broader than that for Insurance. On a 10-point scale, Regulatory and Compliance has a volatility index of 10, while Insurance has an Index of two, indicating that the mix of timekeepers and rates paid on these matters varies more significantly than the mix for Insurance. A high volatility index could also be an indicator of a wide variety of matter types being represented in this category.
Although individual lawyer rates are the focus of considerable industry attention, it is equally, or arguably more important, to look at the bigger picture – the blended average rates that result when a mix of different timekeepers works on matters. The chart shows that the median blended hourly rate is highest for Mergers and Acquisitions, where the most expensive firms are more often involved with a great amount of partner engagement.
Six matter types have a relatively low Volatility Index, which means these rates are consistent and less subject to negotiations between corporations and their firms. The low-volatility matter types are:
• Insurance• Environmental• Real Estate
Legal departments can compare their own data against these rates and ranges for help in managing costs. If they are currently paying at the top end of the range for more volatile matter types, there may be an opportunity to negotiate lower rates or to request a different mix of timekeepers to reduce costs.
Rates across all practice areas are rising gradually, with no large increase in median rates observed in any one practice area. Of interest, however, although the median rates for IP-Patent and IP-Trademark have remained steady over the past six months, the overall range of rates for these practice areas has increased. Rates are no longer spread evenly over the distribution, but rather, skewed toward the lower end, where we see a 22 percent increase in blended rates at the 25th percentile for IP-Patent and a 14 percent increase for IP-Trademark. This dynamic is reflected in the volatility measure, which has changed from six for both matter types, as reported in the 2015 Mid-Year Trends Report, to four for IP-Patent and five for IP-Trademark in the current report.
• Finance, Loans and Investments• Litigation – General• IP-Patent (added since mid-year report)

162015 CounselLink Enterprise Legal Management | Trends Report
Key Metric #2: Law Firm Consolidation – Number of Legal Vendors Used by Corporations57% of companies in the data pool have 10 firms or fewer accounting for at least 80% of outside counsel feesBased on trailing 12-months ending December 31, 2015
2KE
Y M
ETRI
C
Interpreting the Chart:
This chart shows the degree of law firm consolidation among companies whose outside counsel legal billings are processed through CounselLink. The horizontal axis aligns participating companies into nine segments addressing different degrees of consolidation. For example, the bar on the far right indicates that 26 percent of participating companies have 90-100 percent of their legal billings with 10 or fewer vendors, representing the most consolidated legal departments. On the other hand, the far left bar shows the least consolidation, with only 1 percent of companies having less than 20 percent of their legal billings with 10 or fewer firms.
Industry type plays a significant role in consolidation. The segments noted below, reflecting high and low degrees of consolidation, were also identified as such in earlier Trends Reports:
• Manufacturing (non-pharmaceutical) companies, at 68 percent, transportation and warehousing companies, at 75 percent, and retail trade, at 78 percent, are highly consolidated.
• The insurance industry has the lowest level of consolidation.
Overall, law firm consolidation has increased slightly (from 55 to 57 percent) since the last Trends Report.
20-30%<20%
30%
35%
25%
20%
15%
10%
5%
0
30-40% 40-50% 50-60% 60-70% 70-80% 80-90% 90-100%
Degree of consolidation (% of billings from the company’s top 10 law firms)
% o
f com
pani
es
57%

17 2015 CounselLink Enterprise Legal Management | Trends Report
Key Metric #3: Alternative Fee Arrangement (AFA) Usage AFAs used in 9.4% of matters and 7.0% of billings in the past yearBased on trailing 12-months ending December 31, 2015
% of Matters Using AFA
3a
20%
15%
10%
5%
0
Practice Area
Mer
gers
and
Acqu
isiti
ons
Envi
ronm
enta
l
Cor
pora
te,
Gen
eral
, Tax
Regu
lato
ry a
nd
Com
plia
nce
Com
mer
cial
an
d C
ontr
acts
Empl
oym
ent
and
Labo
r
IP- T
rade
mar
k
Real
Est
ate
IP- P
aten
t
Fina
nce,
Loa
ns
and
Inve
stm
ents
Litig
atio
n-
Gen
eral
Insu
ranc
e
The use of AFAs to govern legal service payments varies significantly by legal matter type, but overall, remains fairly stable relative to previous reports. The industry has been comfortable with fixed fees for many typed of employment matters for years, and the acceptance continues to grow at a modest pace. Over the 12-month period ending December 31, 2015, 9.4 percent of matters submitted and processed via the CounselLink solution were invoiced, at least in part, under a fee arrangement other than traditional hourly billing. This represents a .8 percent increase in usage since the 2015 Mid-Year Trends Report.
Four categories of legal work came in above the average, with Employment and Labor, Insurance, IP-Patent and Regulatory and Compliance the types of matters in which AFAs are most often in place. Commodity-type work such as Insurance and Employment and Labor have tended to have the highest volume of matters billed under AFAs. Percent of matters under AFA billings for Employment and Labor grew from 14.1 percent to 17.3 percent.
Average 9.4%
KEY
MET
RIC

182015 CounselLink Enterprise Legal Management | Trends Report
Key Metric #3: Alternative Fee Arrangement (AFA) Usage AFAs used in 9.4% of matters and 7.0% of billings in the past yearBased on trailing 12-months ending December 31, 2015
3b
20%
15%
10%
5%
0
Practice Area
% of Billings Executed Under AFA
KEY
MET
RIC
$
$$ $ $ $
$ $ $$ $
Average 7.0%
Mer
gers
and
Acqu
isiti
ons
Envi
ronm
enta
l
Cor
pora
te,
Gen
eral
, Tax
Regu
lato
ry a
nd
Com
plia
nce
Com
mer
cial
an
d C
ontr
acts
Empl
oym
ent
and
Labo
r
IP- T
rade
mar
k
Real
Est
ate
IP- P
aten
t
Fina
nce,
Loa
ns
and
Inve
stm
ents
Litig
atio
n-
Gen
eral
Insu
ranc
e
The percentage of Corporate, General, Tax matters having billings under some sort of alternative fee arrangement continues to dominate the field, with the percentage of billings executed under an AFA for this matter type holding steady at 12.4 percent.

19 2015 CounselLink Enterprise Legal Management | Trends Report
$656
Key Metric #4: Partner Hourly Rate – OverallAverage rates across practice areas (excluding Insurance) and geographiesBased on trailing 12-months ending December 31, 2015
4Hourly rates by law firm size
51-1001-50
Median partner hourly rates by law firm size for 12-months ending December 31, 2015
101-200 201-500 501-750 750+
+
$20
0
$275
$288
$375
$50
5
The gap between the average partner rates at the “Largest 50” firms (those with 750+ lawyers) and those at the “Second Largest” firms (501-750 lawyers) has remained relatively stable since our last report. Firms with more than 750 lawyers have billable rates that are 30 percent higher than the next smaller tier of firms (501-750 lawyers).
KEY
MET
RIC
Attorneys in firm

202015 CounselLink Enterprise Legal Management | Trends Report
Interpreting the Chart:
In looking at unique partner hourly rates across 15 major metro areas, two indicators were plotted for each location to show both the year-over-year change and the compound annual growth rate (CAGR) over a three-year span.
Data for attorney rate growth by major U.S. city show that Chicago, Boston, and Washington, D.C. are at or above 4.0 percent in both compound annual growth rate (CAGR) and annual growth rate. At the opposite end of the spectrum, three cities – Dallas, Philadelphia, and Phoenix – experienced hourly rate growth below 2.5 percent in both metrics.
Key Metric #5: Partner Hourly Rate Growth – by Location (City)Three major cities show rate growth of 4.0% or more both over the last year and over the last three yearsBased on trailing 12-months ending December 31, 2015
5a
WASHINGTON, D.C.
BOSTON
CHICAGO
5.5%5.0%
YoY
CA
GR
4.3%4.1%
YoY
CA
GR
8.0%5.0%
YoY
CA
GR
Det
roit
MI
Seat
tle W
A
San
Fran
cisc
o C
A
Hou
ston
TX
New
Yor
k NY
Mia
mi F
L
Dal
las
TX
Los
Ange
les
CA
Atla
nta
GA
Phoe
nix
AZ
Phila
delp
hia
PA
Min
neap
olis
MN
8%
7%
6%
5%
4%
3%
2%
1%
0
YOY Change 3 Year CAGR
KEY
MET
RIC
Additional growth rates across the country
4.0%

21 2015 CounselLink Enterprise Legal Management | Trends Report
Key Metric #5: Partner Hourly Rate Growth – by Location (State)Growth in partner rates varies by state, averaging 2.0% year-over-year growthBased on trailing 12-months ending December 31, 20155b
The median year-over-year growth for partner hourly rates across all states is 2.5 percent.
5.9%
7.5%
6.4%
4.2%
5.4% 4.9%$495 median
$280 median
Washington
Hawaii
$486 median
$374 median
$535 median $231 median
> 4.0%2.1% to 4.0%0.0% to 2.0%< 0.0%
Growth Rate
insufficientdata
KEY
MET
RIC
Illinois Michigan
7.3%$625 median
Massachusetts
4.1%$215 median
New Hampshire
Maryland
Virginia
222015 CounselLink Enterprise Legal Management | Trends Report
Commercial and ContractsCommercial and Contracts
Corporate, General, Tax
Employment and Labor
Environmental
Finance, Loans and Investments
Insurance
IP-Patent
IP-Trademark
Litigation-General
Mergers and Acquisitions
Real Estate
Regulatory and Compliance
TM
Key Metric #6: Partner Hourly Rate – by Practice AreaBased on trailing 12-months ending December 31, 20156a
Mergers and Acquisitions
Corporate, General, Tax
IP - Trademark
IP - Patent
Employment and Labor
Real Estate
Litigation - General
Environmental
Insurance
$629
$417
$562$560$486$485$430
$392$375$350
$185
$325
KEY
MET
RIC
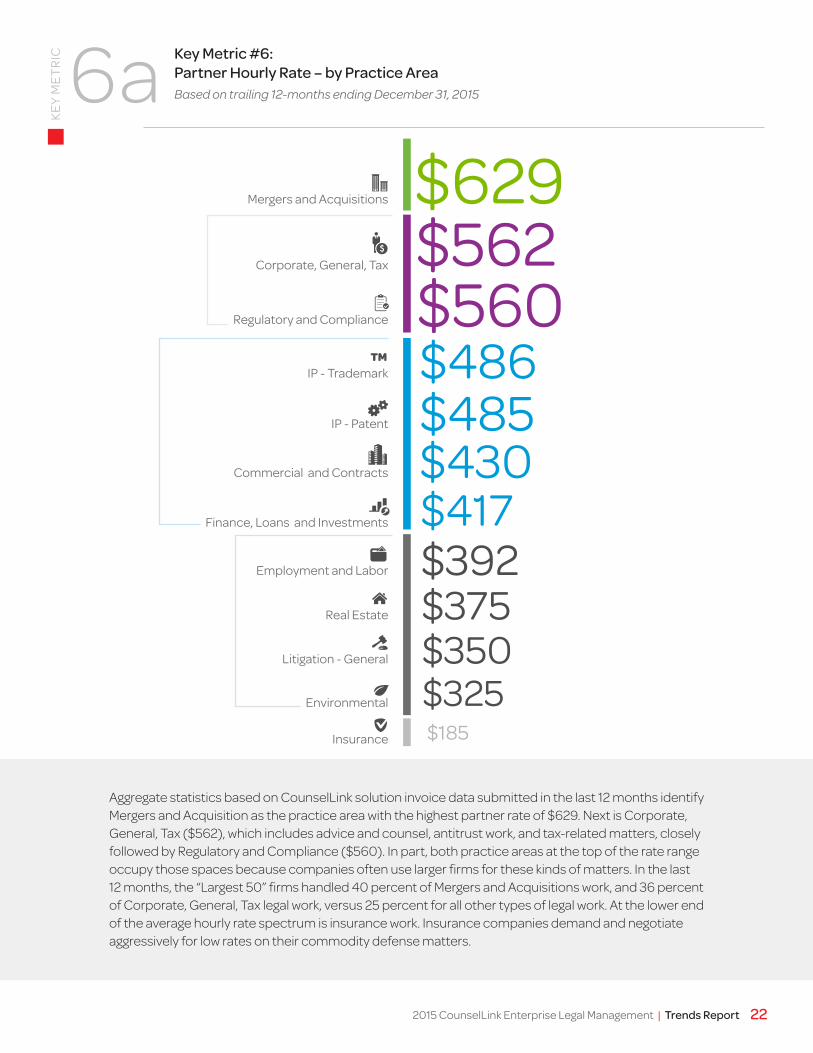
Aggregate statistics based on CounselLink solution invoice data submitted in the last 12 months identify Mergers and Acquisition as the practice area with the highest partner rate of $629. Next is Corporate, General, Tax ($562), which includes advice and counsel, antitrust work, and tax-related matters, closely followed by Regulatory and Compliance ($560). In part, both practice areas at the top of the rate range occupy those spaces because companies often use larger firms for these kinds of matters. In the last 12 months, the “Largest 50” firms handled 40 percent of Mergers and Acquisitions work, and 36 percent of Corporate, General, Tax legal work, versus 25 percent for all other types of legal work. At the lower end of the average hourly rate spectrum is insurance work. Insurance companies demand and negotiate aggressively for low rates on their commodity defense matters.
Regulatory and Compliance
Commercial and Contracts
Corporate, General, Tax
Employment and Labor
Environmental
Finance, Loans and Investments
Insurance
IP-Patent
IP-Trademark
Litigation-General
Mergers and Acquisitions
Real Estate
Regulatory and Compliance
TM
Commercial and Contracts
Corporate, General, Tax
Employment and Labor
Environmental
Finance, Loans and Investments
Insurance
IP-Patent
IP-Trademark
Litigation-General
Mergers and Acquisitions
Real Estate
Regulatory and Compliance
TM
Commercial and Contracts
Corporate, General, Tax
Employment and Labor
Environmental
Finance, Loans and Investments
Insurance
IP-Patent
IP-Trademark
Litigation-General
Mergers and Acquisitions
Real Estate
Regulatory and Compliance
TM
Commercial and Contracts
Corporate, General, Tax
Employment and Labor
Environmental
Finance, Loans and Investments
Insurance
IP-Patent
IP-Trademark
Litigation-General
Mergers and Acquisitions
Real Estate
Regulatory and Compliance
TM
Commercial and Contracts
Corporate, General, Tax
Employment and Labor
Environmental
Finance, Loans and Investments
Insurance
IP-Patent
IP-Trademark
Litigation-General
Mergers and Acquisitions
Real Estate
Regulatory and Compliance
TM Commercial and Contracts
Corporate, General, Tax
Employment and Labor
Environmental
Finance, Loans and Investments
Insurance
IP-Patent
IP-Trademark
Litigation-General
Mergers and Acquisitions
Real Estate
Regulatory and Compliance
TM
Finance, Loans and Investments
Commercial and Contracts
Corporate, General, Tax
Employment and Labor
Environmental
Finance, Loans and Investments
Insurance
IP-Patent
IP-Trademark
Litigation-General
Mergers and Acquisitions
Real Estate
Regulatory and Compliance
TM
Commercial and Contracts
Corporate, General, Tax
Employment and Labor
Environmental
Finance, Loans and Investments
Insurance
IP-Patent
IP-Trademark
Litigation-General
Mergers and Acquisitions
Real Estate
Regulatory and Compliance
TM
Commercial and Contracts
Corporate, General, Tax
Employment and Labor
Environmental
Finance, Loans and Investments
Insurance
IP-Patent
IP-Trademark
Litigation-General
Mergers and Acquisitions
Real Estate
Regulatory and Compliance
TM
Commercial and Contracts
Corporate, General, Tax
Employment and Labor
Environmental
Finance, Loans and Investments
Insurance
IP-Patent
IP-Trademark
Litigation-General
Mergers and Acquisitions
Real Estate
Regulatory and Compliance
TM

23 2015 CounselLink Enterprise Legal Management | Trends Report
Insurance
Key Metric #6: Partner Hourly Rate – by Practice AreaTwo practice areas showing 4% partner rate growth over both the last year and the last three yearsBased on trailing 12-months ending December 31, 2015
6b
3 Year CAGRYOY Change
Mergers and Acquisitions
Litigation - General
IP-Patent
Corporate, General, Tax
Employment and Labor
Real Estate
Finance, Loans and Investments
Environmental
IP–Trademark
Commercial and Contracts
Regulatory and Compliance
IP Patent
Corporate, General and Tax
Finance, Loans and Investments
Commercial and Contracts
Employment and Labor
3.5%
Turning to partner rate growth by practice area, the year-over-year increase in median partner rates is higher in most groups than in prior Trends Reports. Two of the 12 practice area categories have shown growth at or exceeding a rate of 4.0 percent during both the past year and over the previous three-year period: Regulatory and Compliance, and Corporate, General, Tax.
Partner rates for Insurance, Employment and Labor and Real Estate are growing notably more slowly than rates in other practice areas.
0 2% 4% 4% 8%
KEY
MET
RIC
Regulatory
Insurance
Litigation
Mergers and Acquisitions
Real Estate
Environmental
Matter categories with
short- and long-term
rate growth >4%
242015 CounselLink Enterprise Legal Management | Trends Report
About theEnterprise Legal ManagementTrends Report
Terminology:
Matter Categorization – CounselLink solution users define the types of work associated with various matters that were analyzed and categorized into legal practice areas. For this analysis, all types of litigation matters are classified as “litigation,” regardless of the nature of the dispute.
> Other, as an open category for all other matters and bills not already addressed
Company Size – Based on revenue cited in public sources, companies were grouped into these three size categories:
> $10 Billion Plus
> $1-10 Billion
> < $1 Billion
Company Industry – Companies were mapped into the NAICS hierarchy based on publicly available information:
> Finance
> Information
> Insurance
> Manufacturing
> Pharmaceutical
> Professional, Scientific and Technical Services
> Retail Trade
> Transportation and Warehousing
> Other

25 2015 CounselLink Enterprise Legal Management | Trends Report
LexisNexis individuals making notable contributions to this latest Enterprise Legal Management Trends Report in the analysis of CounselLink data and preparing the surrounding narrative include:
Principal AuthorKris Satkunas – Director of Strategic Consulting
As Director of Strategic Consulting at LexisNexis, Kris leads the CounselLink team in advising corporate legal department managers on improving operations with data-driven decisions. Kris is an expert in managing the business of law and in data mining, with specific expertise in matter pricing and staffing, practice area metrics and scorecards.
Prior to joining CounselLink, Kris served as Director of the LexisNexis Redwood Think Tank, which she also established. For five years, Kris worked closely with thought leaders in large law firms conducting unbiased data-based research studies focused on finding solutions to legal industry management issues. Earlier, she led the business of law consulting practice for large law firms. During this time she worked with key management at over a hundred law firms to evolve the financial models and analyses developed for large law firms.
Kris has authored numerous articles and spoken at many legal industry conferences and events. She came to LexisNexis in 2000 after having honed her finance skills as a Senior Vice President in Strategic Finance at SunTrust Bank. She holds a B.B.A. in Finance from The College of William and Mary.
Kris may be reached at [email protected].
Justin Silverman – Vice President, Product Management, CounselLink
Focused on the core CounselLink solution and its capabilities for Matter Management, Legal Spend Management and Legal Hold, Justin is responsible for all aspects of product and market strategy and the end-to-end experience for corporate legal department customers. He joined the CounselLink team in 2011, coming from a two-year assignment as Senior Director of Global Strategy and Business Development for LexisNexis. Prior to that, he managed a professional services business at Gerson Lehrman Group, and also acquired more than six years of management consulting experience, equally split between Oliver Wyman and the Boston Consulting Group. He earned a J.D. degree from Northwestern University Law School, and an MBA from the Kellogg School of Management.
Con
tributors
Expe
rt

262015 CounselLink Enterprise Legal Management | Trends Report
The CounselLink solution is an Enterprise Legal Management solution suite for matter management, legal spend management, legal hold, analytics and strategic consulting services. The solution has earned an industry reputation for enabling corporate counsel to use data effectively as a basis for improving legal department performance and outcomes. Two factors validate these customer opinions and perceptions:
• Specific legal spend and matter management features in the CounselLink solution give corporate clients advanced capabilities to evaluate legal department performance and metrics on an ongoing basis, entirely on their own.
• LexisNexis invests significant resources in professional consulting and service offerings that add a valuable layer of expertise in analytics, benchmarking and best practices. The overall goal with these optimization programs is to help clients translate data-driven analysis into actions that improve efficiency and bottom-line results.
If you have questions or comments about the Enterprise Legal Management Trends Report, or want to learn more about CounselLink software and services, visit www.lexisnexis.com/counsellink, or contact us via email: [email protected] or phone: 855.974.7774.
For media inquiries, please contact: [email protected].
LexisNexis and the Knowledge Burst logo are registered trademarks of Reed Elsevier Properties Inc., used under license. CounselLink is a registered trademark of LexisNexis, a division of RELX Inc. Other products or services may be trademarks or registered trademarks of their respective companies. Copyright © 2016 LexisNexis. All rights reserved.
Follow us online:Blog: www.businessoflawblog.com
Twitter: @lncounsellink
Facebook: www.facebook.com/lexisnexisbusinessoflaw
Link
Cou
nsel
Facebook “f ” Logo CMYK / .ai Facebook “f ” Logo CMYK / .ai


www.counsellink.com
CounselLink®
2015