2015 licensing and joint ventures
DESCRIPTION
Price listTRANSCRIPT

Life Sciences Dealmaking 2015 Laura Vitez and Vinay Singh 11 January 2016

Thomson Reuters life sciences content DISCOVERY
TRANSLATIONAL
BUSINESS DEVELOPMENT
PRE-CLINICAL
REGULATORY
COMMERCIALIZATION
Chemistry – 2.5 million+ compounds structure searchable
Genetic Sequences – Over 65 million nucleic and amino-acid sequences from patent claims, 1981-present
Biological Pathways – 1.4M+ interactions, 684 disease-specific pathway maps
Biological Effects – 1.5M Preclinical Pharmacology Records, 180K+ experimental models with 15K+ drugs tested
Biomarkers – 26,000+ Biomarkers with over 1.1M uses
Gene Variants – 372,000 variant-disease associations, 10,000 drug response records
Intellectual Property – More than 6M patents from 92 countries grouped in 2.3M+ families
Pipeline Drugs Intelligence – 53,000+ drugs in R&D status, indications, and licensing
Clinical Intelligence – 200,000+ Clinical Trial records. Key time, cost and quality performance metrics are derived from data collected directly from biopharmaceutical companies including metrics such as success rates, cycle times, enrollment rates and protocol deviations
Deals – 45,000+ Alliance summaries, 2,800+ Contract analyses, 1,700+ Deal snapshots
Corporate Intelligence – Coverage of 100,000 companies involved in Drug Development
Event Transcripts – 37,000+ transcripts of investor calls and meetings where pharmas/biotechs reveal information and plans, often before they are disclosed elsewhere, and field questions from analysts and reporters
Regulatory Intelligence – Enhanced regulatory data covering 70 countries & regions
Generic Drug Intelligence – 12,000 launched drugs, 360,000 trade names, 73 world markets, 56,000 manufacturing sites, 400 US patent challenges
News: 20+ years of biopharmaceutical news archives and market intelligence
Scientific Journals: 17,000+ peer-reviewed journals
Conferences: 300 events attended annually
Disease briefings: Comprehensive overviews of 27 therapeutic areas
Epidemiology: Incidence and prevalence for over 4,500 diseases and procedures
CLINICAL
2

Make a better deal, faster with Thomson Reuters Our asset valuation services:
• Leverage insight into leading practices to enable structuring the highest value deal possible
• Benchmark deal size, upfronts, milestones, royalty and equity payments
• Identify potential deal partners by therapeutic area, indication, mechanism, drug class, technology, and stage of development
• Understand individual potential partners
We can help you develop and implement strategic partnering plans, supplement resources for specific engagements, and align perspectives from a neutral position.
Vinay Singh: Prior to joining the Thomson Reuters team, Mr. Singh worked as an investment banker at Burrill & Company helping to close over $250M in public equity financings and M&As for life sciences companies
Laura Vitez: Ms. Vitez has over 25 years of experience in the life sciences industry. She has held lead or advisory roles at multiple small biotechs, a mid-sized pharma company, and two consulting firms, bringing in over $2 billion in deal dollars.

THOMSON REUTERS This report contains general information only and is based on the experiences and research of Thomson Reuters practitioners. Thomson Reuters is not, by means of this report, rendering business, financial, investment, or other professional advice or services. This report is not a substitute for such professional advice or services, nor should it be used as a basis for any decision or action that may affect your business. Before making any decision or taking any action that may affect your business, you should consult a qualified professional advisor. Thomson Reuters, its affiliates, and related entities shall not be responsible for any loss sustained by any person who relies on this report.

Contents • Mergers and acquisitions (M&A)
– Volumes – Valuations – Hostile attempts – Friendly options
• Licenses and joint ventures (JV) – Initial Public Offerings (IPOs) – Licensing trends – License/IPO case study
• Contact information
5

Mergers and Acquisitions

10 Years of M&A: Volume
468
0
50
100
150
200
250
300
350
400
450
500
2006 2007 2008 2009 2010 2011 2012 2013 2014 2015
Anno
unce
d M
&A
tran
sact
ions
Volume of announced life sciences industry-wide M&A events by year
Average 320 events / year
NOTE: $$ throughout presentation are USD. All dollars are nominal values (not adjusted for inflation). 7

3%
3% 3%
3% Diversified Cancer Infectious Disease Neurology Endocrine/Metabolic Autoimmune/Inflammatory Cardiovascular Dermatologic Ophthalmology Genitourinary/Sexual Function Hematologic Gastrointestinal Pulmonary/Respiratory Other/Miscellaneous
M&A 2015: Volume by therapeutic arena
NOTE: Excludes deals for non-therapeutic assets, and therapeutic asset deals for unknown therapeutic arenas.
2% each
Diversified 38%
Infect 9%
Cancer 15%
AI/Inflam 6%
Neuro 7%
Endo/Met 7%
1% each
8

M&A 2015: Therapeutic arenas cf. 2014
Other
Gastrointestinal
Pulmonary/Respiratory
Genitourinary
Hematologic
Cardiovascular
Dermatology
Ophthalmology
Autoimmune/Inflam
Endo/Metabolic
Neurology
Infectious disease
Cancer
0 5 10 15 20 Number of announced M&A events for companies with therapeutic assets
2015
2014
9
NOTE: Excludes deals for non-therapeutic assets, and therapeutic asset deals for unknown or diverse therapeutic arenas.

0% 10% 20% 30% 40% 50% 60% 70% 80% 90% 100%
5 year average 2009-13 (n = 425)
2014 (n = 71)
2015 (n = 89)
Percent distribution of lead product stages for therapeutic product company M&As
Discovery / Preclinical Phase I Phase II Phase III Registratoin Approved
Early Stage Late Stage Products Clinical Stage Products
Phase II n = 18
Disc/Preclinical n = 20
Approved n = 28
Phase II n = 16
Disc/Preclinical n = 16
Approved n = 21
54% Approved
23% Phase II
9% Disc/PC
2015 (n=89)
2014 (n=71)
M&A 2015: Breakdown by stage cf. history
5 year average 2009 -13 (n=425)
NOTE: Stage of deal is the most advanced development stage entered by the lead asset on the sellside of the transaction. For example, a deal for a company whose lead compound has completed Phase I but not yet begun Phase II is classified as a Phase I event. 10

10 Years of M&A: Aggregate announced dollars
$515
$0
$100
$200
$300
$400
$500
$600
2006 2007 2008 2009 2010 2011 2012 2013 2014 2015
Anno
unce
d M
&A
dolla
rs (U
S bi
llion
)
Volume of announced life sciences industry-wide M&A events by year
Average $182B / year
NOTE: All dollars are USD and are nominal values (i.e. are not adjusted for inflation). 11

10 years of M&A: Aggregate dollars by tier
$0
$50
$100
$150
$200
$250
$300
$350
$400
$450
$500
$550
2006 2007 2008 2009 2010 2011 2012 2013 2014 2015
Aggr
egat
e an
noun
ced
M&
A do
llars
($bi
llion
)
Annual aggregate M&A dollars by tier
> $100B $10-$100B $5-10B $1-5B < $1B
Total deal size:
$114
$175 $166
$105
$140 $135
$71
$113
$288
$515
12 NOTE: All dollars are USD and are nominal values (i.e. are not adjusted for inflation).

Bayer/Schering AG J&J/PFE consumer
MerMedImmuneerono
S Plough/Organon
AZ/MedImmune
Novartis/Alcon
Roche/Genentech
PFE/Wyeth
Merck/S Plough
Sanofi/Genzyme
J&J/Synthes
Takeda/Nycomed
Gilead/Pharmasset
Actavis/Forest
Novartis/GSK Onc
Bayer/Merck Merck KGaA/S Aldrich
Actavis/Allergan
Valeant/Salix
PFE/Hospira
Abbvie/Pharmacyclics
Teva/Allergan generics
Shire/Baxalta
$0.0
$10.0
$20.0
$30.0
$40.0
$50.0
$60.0
$70.0
2006 2007 2008 2009 2010 2011 2012 2013 2014 2015 20
Tota
l dea
l siz
e ($
B)
2006 2007 2008 2009 2010 2011 2012 2013 2014 2015
10 years of M&A: $10+ billion pharma deals Pfizer/Allergan,
$160 billion
13
Year
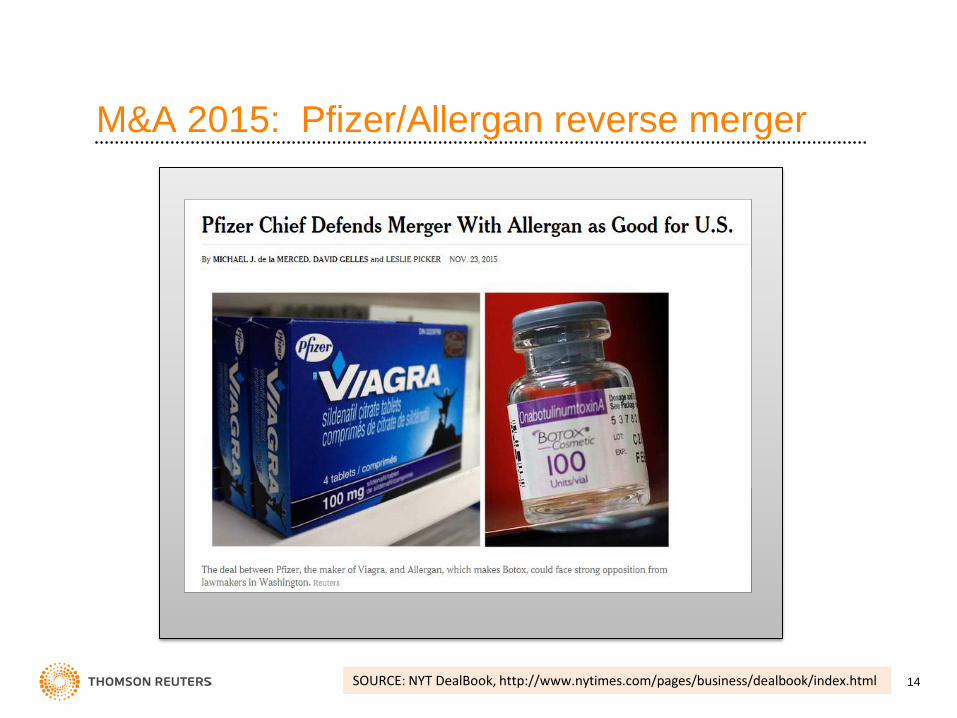
M&A 2015: Pfizer/Allergan reverse merger
SOURCE: NYT DealBook, http://www.nytimes.com/pages/business/dealbook/index.html 14

The Pfizer family tree
Warner-Lambert
2000 ($90B)
Merger 1950s
Parke-Davis 1970s
AHP merger 1999
Agouron 1999 ($2.1B)
Pharmacia 2002 ($60B)
Kabi merger early 90s
Procardia 1990 ($2.4B)
Upjohn 1995 ($7B)
Monsanto/ Searle, 1999
($27.3B)
Esperion 2003 ($1.3B)
Vicuron 2005 ($1.9B)
Wyeth 2009 ($68B)
AH Robins 1989 ($3.2B)
American Cyanamid
1994 ($9.6B)
Genetics Institute 1996 ($1.3B)
King 2010 ($3.6B)
Jones Phar 2000 ($2.4B)
Alpharma 2008 ($1.6B)
Hospira 2015 ($17B)
Pfizer
Pfizer acquisitions with < $1B or undisclosed total deal size: Active · Adria · Alacer · Alanex · Angiomedics · Angiosyn · Apollon · Bioren · BioRexis · Coley · Corvita · CovX · Embrex · Encysive · Erbamont · Excaliard · Ferrosa · FoldRx · Gene/Networks · Genetics Institute · Geoffrey Manner · Haptogen · Icagen · Idun · ImmunoPharmaceutics · InnoPharma · Lab Teuto · Leibinger · Medco · Meridian · Meridica · NextWave · PowderMed · Praxis · Redvax · Rinat · Sensus · Serene · Sugen · Synbiotics · Talaria · Thiakis · Vesta · Vetnex 15

Pfizer value history
Est.
$0
$50
$100
$150
$200
$250
$300
$350
$ U
S bi
llion
(not
adj
uste
d fo
r inf
latio
n)
Accumulated total spent on acquisitions* ($B)
Market capitalization at year end ($B)
Annual net sales ($B)
NOTES: All dollars are nominal values (i.e. are not adjusted for inflation) *Acquisition totals exclude milestone payments and stock-for-stock mergers **2015 data exclude pending acquisition of Allergan
16

M&A 2015: Top three tiers in 2015, $5B and up
$5,168
$5,200
$6,500
$6,800
$7,000
$7,200
$8,050
$8,400
$11,100
$17,000
$21,000
$32,000
$37,000
$40,500
$54,000
$160,000
$0 $20,000 $40,000 $60,000 $80,000 $100,000 $120,000 $140,000 $160,000 $180,000
BI/Merial
Shire/NPS
Shire/Dyax
Centene/HealthNet
AstraZeneca/Acerta
Celgene/Receptos
Endo/Par
Alexion/Synageva
Valeant/Salix
Pfizer/Hospira
AbbVie/Pharmacyclics
Shire/Baxalta
Aetna/Humana
Teva/Allergan generics
Anthem/CIGNA
Pfizer/Allergan
Health benefits
Rx: rare diseases / BLA filed
Rx: GI disorders / approved
Rx: injectables, biosimilars / approved
Rx: generics / approved
Total deal value ($M)
Health benefits
Rx: generics / approved
Rx: cancer / approved
Rx: rare diseases (hematology) / approved
Rx: diversified/ approved
Rx: cancer / Phase III
Rx: rare diseases (HAE) / approved
Rx: ulcerative colitis and multiple sclerosis / Phase III
Swap of Sanofi’s animal health biz Merial for BI’s consumer health biz + $5.2B cash
Health benefits
Rx: rare diseases (HPT) / approved
NOTE: Gray denotes pending transactions. Orange deals have closed.
......
$10B
and
up
$5 to
$10
B
16 deals over multiple market segments: • 4 rare disease (3 by Shire) • 3 generics/specialty pharma • 3 health benefits (insurance) • 2 Pfizer • 2 cancer • 1 ulcerative colitis/multiple sclerosis • 1 consumer/animal health swap
The 13 therapeutics are all late: • 10 approved • 1 BLA filed • 2 Phase III
17

M&A 2015: Not all deals are friendly and successful ...
18

M&A 2015: Unsolicited bids and alternative outcomes
Bidder Target Date Bid ($B) Instead ...
Horizon Depomed July 2015 $3.0 Horizon bought Hyperion ($1.1B) and Crealta ($510M)
Depomed bought 3 pain drugs from Janssen ($1.05B)
Teva Mylan April 2015 $40.1 Teva bought Allergan’s generics business
($40.5B); also Auspex, ($3.5B), Rimsa ($2.3B), Immuneering, and Gecko
Mylan bid on Perrigo ...
Mylan Perrigo April 2015 $28.9 Mylan bought Famy Care's female health biz ($800M)
Perrigo bought Patheon, Naturwohl, OTCs from GSK,
and a Crohn’s Rx from AZ
Endo Salix March 2015 $11.2 Endo bought Par ($8.05B) Valeant bought Salix ($11.1B)
AbbVie Shire June 2014 $46.0 AbbVie bought Pharmacyclics ($21B) Shire bought Dyax ($6.5B), NPS ($5.2B),
Foresight ($300M), with a pending acquisition of Baxalta ($32B)
Valeant Allergan April 2014 $45.5
Valeant bought Salix ($11.1B), Sprout ($1B), Amoun ($800M), Dendreon
($495M), Synergetics ($192),Unilens, Marathon, Commonwealth BioTech
(US/Can), Mycorrhizal
Actavis bought Allergan in 2014 ($66B) and this year bought Kythera ($2.1B), Naurex ($560M), Oculeve ($125M), Auden Mckenzie ($458M), AqueSys
($300M), with a pending reverse merger with Pfizer ($160B)
Pfizer AstraZeneca May 2014 $119.0 Pfizer has a reverse merger pending with Allergan ($160B), plus bought
Hospira ($17B) and Redvax
AZ bought ZS Pharma ($2.7B), Acerta ($700M), and the branded
respiratory biz from Allergan ($700M)
19

M&A 2015: Successfully triggered options Meritage Quanticel Annovation
Acquired by: Shire (post-ViroPharma acquisition) Celgene The Medicines Company
Time from option to exercise: 3 yrs 3 mo 3 yrs 5 mo 2 yrs 5 mo
Option upfront: $7.5M CON participation in Series A with
Versant + $45M over 3.5 years Medicines Co participated in $8.75M Series A with Atlas
Option term collaboration:
ViroPharma provided $12.5M in milestones for Phase II work
Celgene got “early access” to technology, team, molecules
Medicines Co had "significant influence, but not control"
Technology: Novel form of budesonide for
eosinophilic esophagitis, from UCSD
Single-cell genomic analysis and drug discovery platform,
from Stanford
Next-generation anesthetic, from Mass Gen
Stage when optioned: Phase II Discovery Preclinical
Acquisition trigger:
Receipt of data from a final Phase II study and agreement with FDA on
acceptable Phase III endpoint (Update: Phase III began Mar 2015)
3.5 years (extendable) (Update: multiple INDs
expected in 2016)
Completion of Phase II POC (Update: Phase III began
In Nov 2015)
Acquisition upfront: $70M $100M $28.4M
Acquisition contingencies: $175M $385M $26.3M milestones +
low single digit royalties
20
1
1
3
6
3
4
2
2
1
2
2
6
4
3
5
2
1
6
7
15
17
0 2 4 6 8 10 12 14 16 18 20
2006
2007
2008
2009
2010
2011
2012
2013
2014
2015
Number of option deals
Year
opt
ion
anno
unce
d
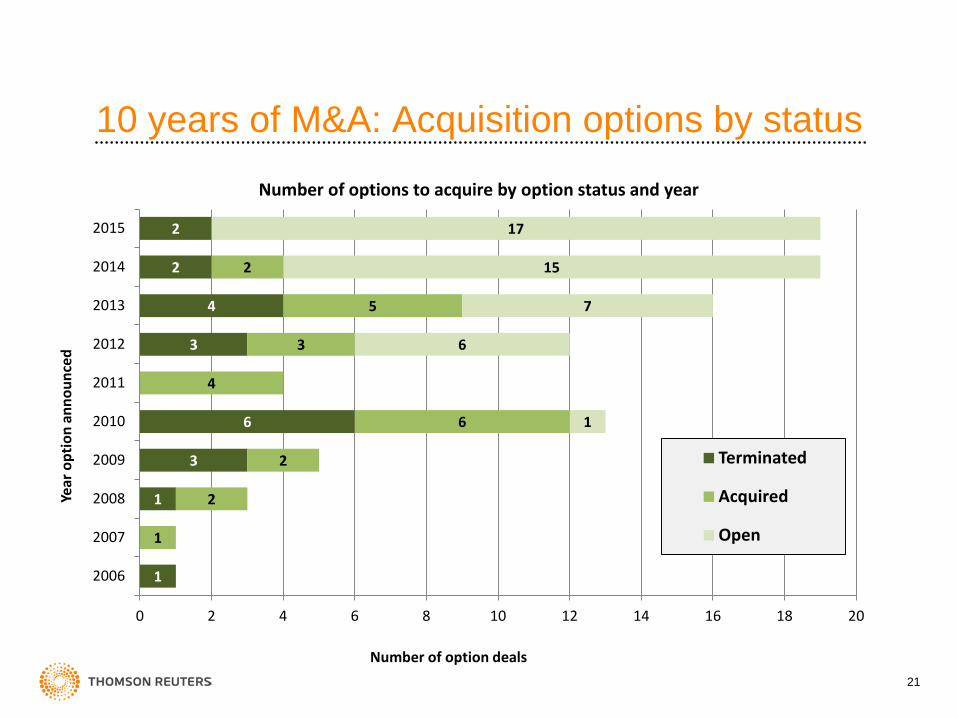
Number of options to acquire by option status and year
Terminated
Acquired
Open
10 years of M&A: Acquisition options by status
21

Licensing and Joint Ventures

Biotech markets take a turn
23

4
2 2 4
6
15 14
6
28
15
21
12 10
21
14
10 $0.3
$0.2 $0.1 $0.2
$2.5
$1.1 $1.1
$0.7
$1.8
$1.0
$2.0
$1.3
$0.8
$2.0
$1.4
$0.6
$0.0
$0.5
$1.0
$1.5
$2.0
$2.5
$3.0
0
5
10
15
20
25
30
Tota
l Am
ount
Rai
sed
(USD
B)
Tota
l The
rape
utic
IPO
s on
US
Exch
ange
s
Volume Amount Raised (USD B)
Initial Public Offering (IPO) market shows signs of teetering
NOTE: $2B of the $2.5B funding in Q1 2013 was from one IPO – Zoetis
2012
Number of Therapeutic IPOs and Aggregate Total Raised By Quarter
2013 2014 2015
57.4%
73.7%
56.7%
80.0%
23%
12%
7%
19%
77%
26% 26%
43%
0%
10%
20%
30%
40%
50%
60%
70%
80%
90%
2012 2013 2014 2015
Insi
der P
artic
ipat
ion
Median % of IPO's w/ 25% or more Insider Participation
Insider Participation in IPOs
24

But IPO market is not closed
(100%)
(50%)
0%
50%
100%
150%
Dec 2014 Feb 2015 Apr 2015 May 2015 Jul 2015 Sep 2015 Oct 2015 Dec 2015
Post
IPO
Per
form
ance
(Iss
ue P
rice
vs. P
rice
12/3
1/15
)
Post IPO performance wasn’t great in 2015
Overall 61% of 2015’s
Biotech IPOs finished at or below their issue price
And nearly 20% of 2015’s
IPO class lost 50% or more of its value
BUT…Despite the
downturn in the markets in mid-September, 12
Biotech IPOs still got out with favorable valuations and more than half have
performed very well, including Aclaris
Therapeutics which finished the year up 134%
25
Date of IPO

Licenses and joint ventures (JVs) by quarter
137 128
119
181
198 182
159 151
191
171 170
207
217
246
218
274
$5.7
$3.2
$6.2
$8.1
$4.7 $5.2 $3.8
$8.2
$6.4
$10.7
$8.0
$11.0
$14.8
$12.9 $13.1
$24.4
$0
$5
$10
$15
$20
$25
$30
0
50
100
150
200
250
300
1Q 2012
2Q 2012
3Q 2012
4Q 2012
1Q 2013
2Q 2013
3Q 2013
4Q 2013
1Q 2014
2Q 2014
3Q 2014
4Q 2014
1Q 2015
2Q 2015
3Q 2015
4Q 2015
Aggr
egat
e Di
sclo
sed
Deal
Val
ue ($
B)
# Li
cens
es a
nd JV
s
# Licenses/JVs Aggregate Disclosed Value ($B)
2013 2014 2015
Number of Disclosed Licenses/JVs and Aggregate Total Disclosed Deal Value By Quarter
NOTES: This analysis includes all announced licenses and JVs for products or technologies. Licenses for intellectual property and/or data only are excluded. All dollars are USD.
2012
26

Top ten 2015 licensing transactions by announced total size Licensee Licensor Total Size
(US $ M) Upfront (US $M) Subject Stage* Primary
Rx Area
1 Sanofi Hanmi $4,266 $445 Sanofi to develop Hanmi's Portfolio (specifically 3 assets) of long-acting diabetes treatment Reformulation Endo/Meta
2 AstraZeneca Ionis (fka Isis) $4,090 $65 Discovery and development of antisense therapies for
cardiovascular, metabolic and renal diseases Discovery Diversified
3 Vertex CRISPR $2,625 $75 Vertex and CRISPR to use CRISPR-Cas9 gene editing
technology to discover and develop new treatment for genetic diseases
Discovery Diversified
4 Gilead Galapagos $2,075 $300 Gilead Sciences to develop and commercialize Galapagos' filgotinib against rheumatoid arthritis Phase II AI/Inflam
5 Pfizer Heptares $1,890 undisclosed Heptares and Pfizer to develop novel drugs targeting GPCR against multiple therapeutic indications Discovery Diversified
6 BMS Five Prime $1,740 $350 BMS to develop and commercialize Five Prime's CSF1R
antibody program, including FPA-008 for immunology and oncology
Phase I Diversified
7 Sanofi Lexicon $1,730 $300 Sanofi to develop and commercialize Lexicon's sotagliflozin against diabetes, with an option to license Phase III Endo/Meta
8 Amgen Xencor $1,702 $45 Amgen to develop and commercialize Xencor's bispecific cancer immunotherapy and inflammation programs Preclinical Diversified
9 Sanofi Regeneron $1,665 $640 PD-1 inhibitor and other new immuno-oncology antibodies, with an option Phase I Cancer
10 Ultragenyx Arcturus $1,570 $10 Arcturus and Ultragenyx to discover and develop mRNA therapeutics using UNA Oligomer chemistry and LUNAR
nanoparticle delivery platform Discovery Diversified
*Stage: Recap classifies clinical development program deals by the highest stage entered by the lead asset at the time of deal signature. E.g., an asset that has completed Phase II but not yet begun Phase III is classified as a Phase II transaction.
27

Top 20 2015 licenses with upfronts > $50M Licensee Licensor Upfront
($M) Equity ($M) Stage Rx Area
Sanofi Regeneron $640 Phase I Cancer
Celgene MedImmune / AZ $450 Phase III Cancer
Sanofi Hanmi $445 Reformulation Endo/Meta
Bristol-Myers Squibb Five Prime $350 Phase I Diversified
Astellas Immunomic $300 Discovery AI/Inflam
Gilead Galapagos $300 $425 Phase II AI/Inflam
Sanofi Lexicon $300 Phase III Endo/Meta
MedImmune / AZ Innate $250 Phase II Cancer
Allergan Merck $250 Phase II Neurology
Novartis Aduro $200 $25 Preclinical Cancer
Celgene Juno $150 $850 Phase II Diversified
Celgene Nurix $150 Discovery Diversified
Merck KGaA Intrexon $115 Discovery Cancer
Celgene Lycera $105 Phase I Cancer
Janssen Hanmi $105 Phase I Endo/Meta
Bayer Ionis (fka ISIS) $100 Phase II Cardiovascular
DiaVax City of Hope $100 Phase I Viral Infect
Bayer Ionis (fka ISIS) $100 Phase II Hematologic
Merck NGM $94 $106 Preclinical Endo/Meta
Vertex Parion $80 Phase II Pulm/Resp 28

Trend in upfront license payments
$0
$10
$20
$30
$40
$50
$60
2010 (n = 106)
2011 (n = 104)
2012 (n = 94)
2013 (n = 83)
2014 (n = 121)
2015 (n=131)
Upf
ront
pay
men
t ($M
)
Year license announced
AVERAGE upfront payments
MEDIAN upfront payments
(n = 106) (n = 104) (n = 94) (n = 83) (n = 121) (n=136)
2010-2015 in aggregate
Number reporting upfront 508
Average upfront $33 M
Median upfront $10 M
NOTE: Analysis includes upfront cash payments only. Equity investments and near-term milestones are excluded.
Upfront payments in licensing transactions by year, 2010-2015
29

Trend in license deal upfront payments by stage
$0 $10 $20 $30 $40 $50 $60 $70 $80 $90
$100 $110 $120
2010
20
11
2012
20
13
2014
20
15
2010
20
11
2012
20
13
2014
20
15
2010
20
11
2012
20
13
2014
20
15
2010
20
11
2012
20
13
2014
20
15
Ave
rage
repo
rted
upf
ront
pay
men
t ($M
)
Year
Average reported upfront ($M) Median reported upfront ($M)
Disc/Preclin n = 242
Phase I n = 63
Phase II n = 134
Phase III/Reg n= 93
Average and median announced upfront payments by year and stage of lead asset, 2010-2015
30

Share of number of pharmaceutical licenses by therapeutic area, 2015
Cancer 35%
Neurology 11% Infection
10%
Diversified 10%
Endo/Meta 8%
AI/Inflam 7%
CV/Hema 3%
Other 16%
Percent change in number of pharmaceutical licenses by therapeutic area, 2010 to 2015
19%
38%
56%
63%
91%
250%
393%
0% 100% 200% 300% 400% 500%
CV/Hema
Neurology
Infection
AI/Inflam
Endo/Meta
Cancer
Diversified
NOTES: Charts includes licenses and JVs for which a therapeutic area is applicable and disclosed. “Other” includes dermatology, chromosomal abnormalities, gastrointestinal disease, genitourinary/sexual function, pulmonary/respiratory, ophthalmic, nutritional supplements, cosmetics, animal health.
2015 n = 777
Baseline: 2010 Comparator: 2015
Trend in number of licensing/JV transactions by therapeutic area
78 in 2010 vs. 273 in 2015
34 in 2010 vs. 65 in 2015
15 in 2010 vs. 74 in 2015
35 in 2010 vs. 57 in 2015
48 in 2010 to 75 in 2015
60 in 2010 vs. 83 in 2015
21 in 2010 vs. 25 in 2015
31

Most active dealmakers of 2015 by number of announced in-licenses
0
5
10
15
20
25
30
Num
ber o
f in-
licen
ses a
nnou
nced
in 2
015
Undisclosed or non-pharmaceutical asset
Approved
Clinical
Discovery/Lead/Preclinical
NOTE: Chart includes in-licensing activity of majority and wholly-owned subsidiaries.
748 companies announced in-
licenses/JVs in 2015
52 companies announced 3 or more
26
16 14
13
11
9 8
6 6 6 6
54% of the in-licenses announced by these top dealmakers were for discovery/preclinical stage assets.
Number of announced in-licenses by company
26
10 10
6
32

October 2013: Spark is spun out of CHOP with $50M investment
May 2014:
Spark raises $72.8M Series B led by Sofinnova Ventures, with leading institutional investors T. Rowe Price and Brookside
December 2014:
Spark announces pre-clinical licensing deal with Pfizer for SPK-FIX for hemophilia B, valued at up to $280M
January 30, 2015:
Spark files IPO (NASDAQ: ONCE) and shares nearly double amid excitement for gene therapy
December 2015: Investor group that participated in Spark’s mezzanine Series B leads a successful
$141M follow-on
Riding the wave: High-value strategic deal amid a series of large financing events
33

More sophisticated landscape enables Spark to ride through volatility
Spark Therapeutics
(100%)
(50%)
0%
50%
100%
150%
Dec 2014 Feb 2015 Apr 2015 May 2015 Jul 2015 Sep 2015 Oct 2015 Dec 2015
Post
IPO
Per
form
ance
(Iss
ue P
rice
vs. P
rice
12/3
1/15
) Drivers of Success
Founded on astounding science
Leveraging strong capital markets
Leveraging seller’s market
Validation from strategic partners
Post-IPO performance
fantastic
34
Date of IPO

Contact Information

2014 Dealmaker’s Report Available from sales, the report includes: Life Sciences Dealmaking 2015
presentation slides Twenty deal snapshots
2015’s top licensing deals 2015’s top M&A events
BioWorld Today reprints on top 2015 licensing and M&A transactions
Spreadsheet with complete set of all life science transactions announced in 2015. Details include buyer/seller, therapeutic arena, stage at selling, total deal size, upfront payment, territory, etc.
Contact your Thomson Reuters account representative for details.
The Thomson Reuters Recap of 2015 Dealmaking Landscape Report
36

Laura J. Vitez Principal Business Analyst Thomson Reuters Recap [email protected] Vinay Singh Senior Deals Analyst Thomson Reuters Recap [email protected] www.thomsonreuters.com
37
37