2015 guin gdr - ustverre.fr · setup naoh solution (s/v m-1) teflon® container furnace °c glass...
TRANSCRIPT

A'tool'for'probing'plas4city'with'a'nm'resolu4on'
25'
Bulk''
Shape?'Size?'Nature?'Permanently' deformed'
z o n e' s h e a r' fl ow' +'densifica4on'
Atomic'force'microscopy'
While'inden4ng'
Densifica4on''structural'modifica4ons''Impact'on'local'chemical'reac4vity?'
How'does'it'work?'
Reac=vité.:'θSiOSi.décroit. une'chute'dras4que'de'la'résistance'à'la'réac4on'd’hydrolyse'de'la'liaison'Si5O'[Michalske'1984,'Yip'2006]'Perte.de.connec=vitémoins'de'liaisons'à'hydrolyser'par'unité'de'volume'
Les'changements'structuraux'décrits'ci5dessus'sont'en'parfait'accord'avec'une'augmenta4on'de'la'vitesse'de'dissolu4on'du'verre'densifié.'
Star4ng'grant''QUIC'GLASS'(200752012)'

A typical experimental setup
0.1 N NaOH solution(S/V �
8 m-1)
Sealed Teflon® container
Thermo regulated furnace(80 +/- 1) °C
Indented glass sample
� Glasses : commercial float glass, silica glass. thermally annealed.
� Vickers, Berkovich and Knoop indenters.
� indentation load : 10 and 50 mN (edge crack free), 5 indents per load
�Each indentation is mapped out (3D characterization) over corrosion time by AFM (calibrated).
5 µm
S: surface of the sampleV: volume of the solution
GOMD 2010, Corning
Set'up'of'an'experiment'
1. Condi4ons' de' dissolu4on'congruente'(Doremus'1982)'
2. échan4llon' blanc' pour' la'mesure' de' V0' la' vitesse' de'dissolu4on' du' verre' relaxé'dans'la'même'solu4on'
3. Échan4llon' indenté'et' imagé'par'AFM.'

27'
Evolu4on'of'the'indenta4on'imprint'(depth,'morphology)'through'dissolu4on'steps.''
If'the'dissolu4on'rate'in'A'(densified'area'at'the'boRom'of'the'imprint)'is'faster'than'in'B'(free'surface)'then'the'imprint'depth'aÜer'dissolu4on'step'will'increase'
A'nano5chemical'probe'
Dissolu4on'4me'
Depth'of'th
e'im
print'
0'B'
A'Densified'area'
Pris4ne'glass'
VA=VB'
VA>VB'
VA<VB'
AFM'picture'aÜer'each'dissolu4on'step'
Plas4c'>'Pris4ne'glass'

Suivit d’empreintes d’indentations : exemple Vickers 10 mN, VAV'
Nécessite la mesure de V0 la vitesse de dissolution du verre relaxé
Surface initiale Te
mps
de
diss
olut
ion
Posi
tion
dans
le m
atér
iau
Le' suivit' de' l’al4tude' du' point' At/' à' la' surface' de'référence'donne'la'vitesse'de'dissolu4on'rela4ve'entre'le'fond'de'l’empreinte'et'la'surface'de'référence.''
V=V0'en'tout'point'de'la'surface'=>'dt=d0'='constante'V>V0'en'At'et'V0'ailleurs'=>'dt>d0'pour't>0'et'est'une'fonc4on'croissante'de't'
Surface de référence (8h)
At
28'
Surface'ini4ale'
Après'Recuit''Non'recuit'
Niu'YGF,'Han'K.,'Guin'JGP,'Langmuir,'28,'10733'(2012)*

Evolu4on'de'la'profondeur'de'l’empreinte'au'cours'de'l’aRaque'chimique'
Imprint'd
epth'd
t'at''A t'(n
m)'
Région'I'
Région'II'
Two'different'regions':''Région'I':'increase'of'imprint'depth'='enhanced'dissolu4on'rate'at'the'boRom'of'the'print.'Région'II:' 'plateau'='same'dissolu4on'rate'at'the'free'surface'and'in'At'the'boRom'of'the'imprint.'
Vd'
V0'At'
Transi4on'
29'
Niu'YGF,'Han'K.,'Guin'JGP,'Langmuir,'28,'10733'(2012)*
ΔVd = -51.4 (+/- 0.7) nm/h '
ddens = Vdensified x t*= (V0+ΔVd).t* Thickness'of'the'plas4c'zone'under'the'indenter'apex'
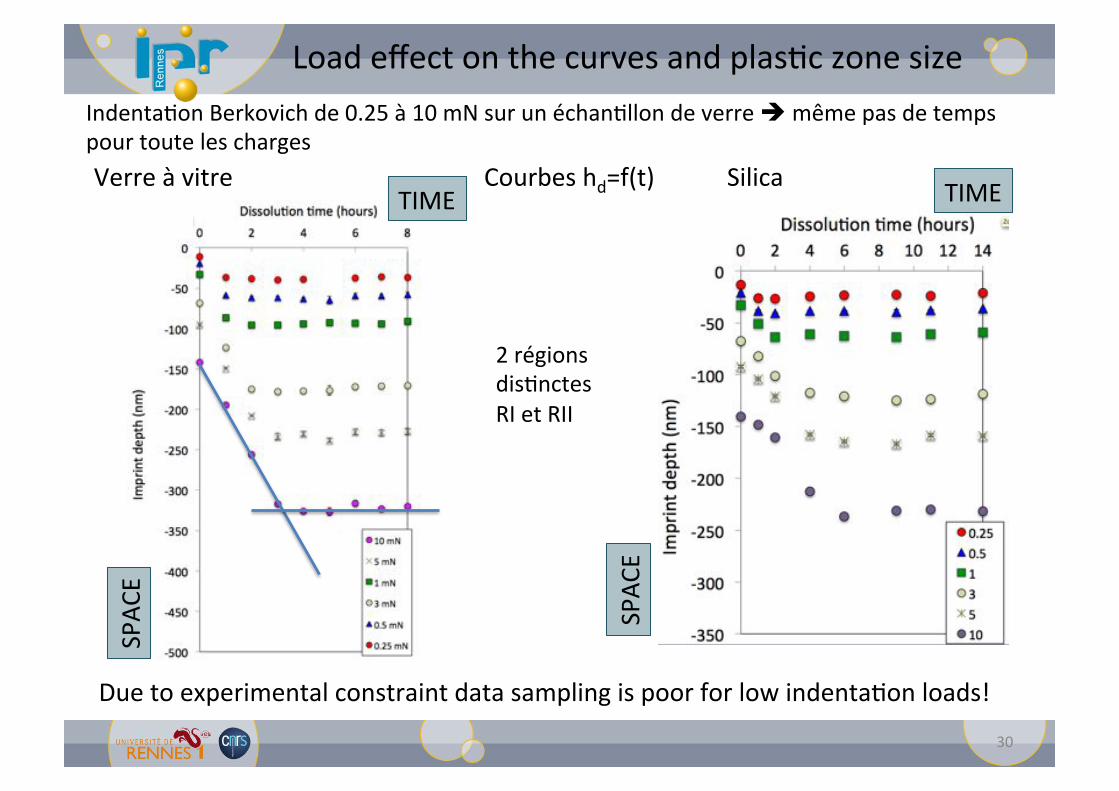
Load'effect'on'the'curves'and'plas4c'zone'size'
30'
Indenta4on'Berkovich'de'0.25'à'10'mN'sur'un'échan4llon'de'verre''même'pas'de'temps''pour'toute'les'charges'''
2'régions'dis4nctes'RI'et'RII'
Due'to'experimental'constraint'data'sampling'is'poor'for'low'indenta4on'loads!'
Silica'
Verre'à'vitre'
Verre'à'vitre' Courbes'hd=f(t)'
SPAC
E'
TIME'
SPAC
E'
TIME'
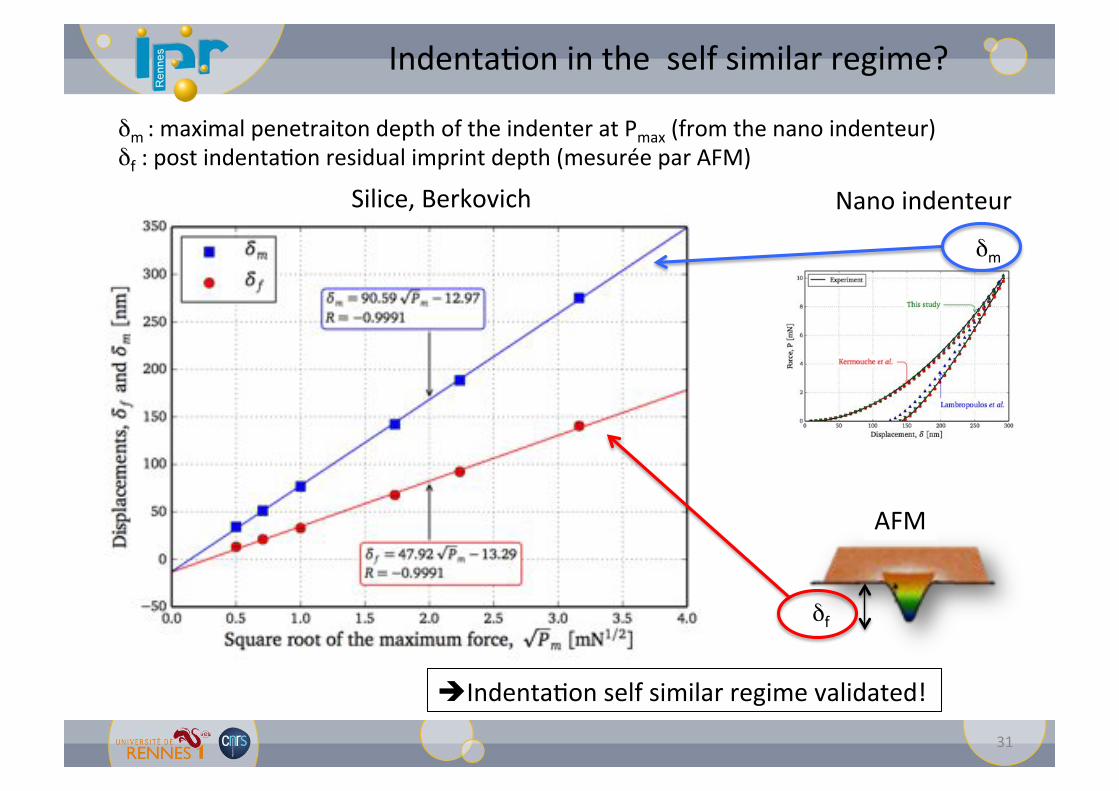
Indenta4on'in'the''self'similar'regime?'
31'
δm':'maximal'penetraiton'depth'of'the'indenter'at'Pmax'(from'the'nano'indenteur)&δf':'post'indenta4on'residual'imprint'depth'(mesurée'par'AFM)&
δm'
δf''
Silice,'Berkovich'
Indenta4on'self'similar'regime'validated!'
AFM'
Nano'indenteur'

Indenta4on'load'and'self'similar'regime'
Indenta=on.self.similar.regime?.:.what.ever.is.the.load.H.remains.constant!.
1) Indenter'geometry' is'self'similar:'Aproj'scales'with'h'(penetra4on'depth).'As'long'as'one'stays'far'from'the'finite'size'of'the'probe'4p.'
2) Material' :' if' far' from' any' REV' (representa4ve' elementary' volume)'considera4on'regarding'plas4city'and'as'long'as'only'plas4city'is'involved'(no'fracture'for'example).'
Berkovich'indentor:''
!"#$"%$&'()$'*+,-./((
Projected area
222
2
56.243.65tan33
3.65tan32
3.65tan323.65sin323.65cos
27.65cos
43
2
23
2/60tan
hhA
ha
aah
bh
aal
A
al
al
oproj
o
oo
o
o
proj
o
==
=
==
=
==
=
=
b
!"#$"%$&'()$'*+,-./((
Projected area
222
2
56.243.65tan33
3.65tan32
3.65tan323.65sin323.65cos
27.65cos
43
2
23
2/60tan
hhA
ha
aah
bh
aal
A
al
al
oproj
o
oo
o
o
proj
o
==
=
==
=
==
=
=
b H =PAproj
= cte = P24.56 !h2
P = cte !h2
h = cte !P1/2thus'
'Any'length'scale'associated'to'the'indenta4on'process'should'scale'''''with'P1/2'
In'the'self'similar'regime'
32'

Dimensionless'analysis':'similarity'principle'
H =PAproj
= cte = P24.56 !h2
Ph2
= cte = Pihi2
33'
Space.and.=me.dimensions:'In'the'geometrical'similar'regime'
tP= cte = ti
Pi
Thus'we'show'that'
Space:'' 'From'hardness'défini4on'
Time'
V0'
V0'd1'
d2'
t=0* t*2' t*1' V0 =h1t1* =
h2t2* = cte
The'curves,'Imprint'depth'versus'dissolu4on'4me,'may'be'rescaled'both'in'space'and'4me'scales'so'that'all'the'curves'should'collapse'into'a'single'one.'
t * :* Cme* t o* g o*through* the* red*space*at*a*speed*V0*
P1'
P2'

Dimensionless'analysis'of'our'experimental'results'
34'Conclusion':'it'works,'all'the'curves'collapse'into'a'single'one:'de'250'µN'à'10'mN.'
5'5%'+'5%'
5'5%'+'5%'
Charge'servant''de'référence':'10'mN'

35'
Dimensionless'analysis'of'our'experimental'results'
Tiny'finite'probe'size'effect'on'the'posi4on'of'the'plateau'

What'kind'of'data'may'we'extract'from'our'experiments'
36'
Extraire'des'paramètres''permeRant'un'dialogue'avec'les'modélisa4ons'numériques'
δ*f'':'post'indenta4on'imprint'depth'(AFM)'δ*m':'max'penetra4on'depth'at'Pmax'h*d'':'thickness'of'the'plas4c'zone'under'the'point'of'contact'p*d':'depth,'under'the'pris4ne'surface,'where'the'boundary'of'the'plas4c'zone'may'be'found''(δ*f'+h*d)'p*d/δ*m.:.example.of.an.non.dimensional.parameter.used.in.numerical.modeling..
**Signifie*que*ces*valeurs*sont*calculées*à*parCr*des*données*expérimentales*en*prenant*pour*charge*de*référence*10*mN.*Pour*toute*autre*charge*d’indentaCon*P*la*valeur*de*ces*paramètres*peut*être*obtenue*en*appliquant*le*rapport** P[mN ] 10
δ*f''
p*d'h*d''

Comparaison'between'modeling'and'experimenta4on'
37'
Lambropoulos'et'al.' Kermouche'et'al.' Keryvin'et'al.'
pD!m
pD!m
= 2.1
pD!m
= 0.9
pD!m
=1.8
Densifica4on'map'obtained'from'FEM'
Longueurs*adimensionnées*par*δm*
Lambropoulos. Kermouche. Keryvin.
Densifica4on'depth'
0.9' 2.1' 1.8'
Transi4on'zone'' 0.2' 1.6' 0.35'–'0.4'

38'
Comparaison'between'modeling'and'experimenta4on'
pD!m
=1.71.52.1
Épaisseur'de'la'zone'de'transi4on'de'0.35'(≈100'nm)'
Rescaled*to*10*mN*
Longueurs*adimensionnées*par*δm*
Lambropoulos. Kermouche. Keryvin. Experiment.
Densifica4on'depth'
0.9' 2.1' 1.8' 1.7'
Transi4on'zone'' 0.2' 1.6' 0.35'–'0.4' 0.35'(max)'
This'densifica4on'chemical'probe'allows'for'discrimina4ng'cons4tu4ve'laws'where'P5u'curves'don’t.'It'is'also'a'good'way'for'checking'the'limit'of'the'self'similar'regime,'especially'as'ultra'low'load'(finite'probe'size'effect,'REV).''
From'our'experimental'curves'

39'
Is'the'1'D'approach'enough'to'discriminate'between'cons4tu4ve'laws?'
Up'to'now'
?'

Retrieving'the'3D'informa4on'embedded'into'our'data'
Mathema4cal'formalism:'level'set'func4ons'or'PDE,''(Sethian'1982)'1: The dissolution vector applies normally to the surface for each considered point 2: Use of Huygens principle to deal with edges (inward or outward)
72 CHAPITRE 3. MODÉLISATION NUMÉRIQUE ET APPLICATION EXPÉRIMENTALE
a)
b)
Figure 3.4: a) Les empreintes simulées sur images modèles Im(N) et Im(N+1). Les empreintes sont axisymétriqueset seul une demi-surface est a�chée. Les unités des axes sont en nanomètre. b) Schéma zoom-in sur la calottehémisphérique.
�⇥AA1(i,j) : la matrice des vecteurs d’un point à la surface Im(N) à la zone de recherche de surface
Im(N + 1), �⇥n (i,j) : le vecteur normale à ce point à la surface Im(N) ; le petit carré représente la zone de recherche.
l’intensité de la vitesse de dissolution sont transformés en nanomètre par heure. Par le souci del’optimisation de temps de calcul nous avons commencé par un cas simple : calculer l’intensité deVd sur un profil de l’empreinte.
Le cas simple
Dans ce cas simple on réduit le degré de liberté d’équation 3.1 d’une matrice de vecteurs à uneligne de vecteurs. Le calcul est fait sur deux profils donnés et on cherche la valeur minimum deproduit vectoriel des deux vecteurs. L’équation 3.1 sera réduite ainsi si l’on prend le profil suivantl’axe x :
⌅��⇥AA1 ⇤ �⇥n ⌅ =
� X1 �X0
0Im(N + 1)� Im(N)
⇥
(i,j)
⇤� Nx
0Nz
⇥
(i,j)
(3.2)
Sur chaque surface modèle Im(N) et Im(N +1), on prend un profil passant au fond de la calottehémisphérique suivant la direction x (ou y) (Fig.3.4,(a)). Pour chaque point (i) du profil de Im(N), levecteur normale �⇥n (i) est unique et une ligne (ou colonne) de vecteurs
��⇥AA1(i�j) partant du profil de
Reconstruc4ng' the'matrix' of' dissolu4on'vector' from' two' AFM' images' of' the'same' imprint' taken' at' two' different'dissolu4on'4mes''
1)..Shape.evolu=on.of.surfaces.through.dissolu=on:.dissolu4on'vector'applies'normally'to'the'surface'at'each'point'of'the'surface.'
�t + V0 |∇�| = 0
solu4on'do'
do'Glass'

41'
1) Evolution of surfaces though dissolution
V0= 115 nm/h
Ini=al.imprint:.10.mN,.SLSG..(afer.annealing.=.no.densifica=on.effect).
Modeling (MATLAB ®)
Experiment
3'h'
40'h'
1'micron'
17'h'
3'h'
40'h'
17'h'
0'
580''nm'
It'is'possible'to'model'the'3D'shape'evolu4on'of'a'surface'through'congruent'dissolu4on'Yes'a'squared'pyramid'transforms'into'a'spherical'like'shape'through'dissolu4on.'

2D'analysis':'example'Silica'1'mN''
−200 0 200 400 600 800 1000 1200−100
−80
−60
−40
−20
0
20
40
60
80Berkovich indentation profile through dissolution 1 mN
length (nm)
altit
ude
(nm
)
Spectrosil, 0 - 1 hours @ 47.7 nm/h manually adjusted translation
simulated from Pexp,0 with V_max=66.94 nm/h
simulated from Pexp,0 with V_zero
Pris4ne'indenta4on'imprint'
AÜer'1'hours'dissolu4on'step'
nano
meter'
(1)'Plateau'(1)'
'(2)Transi4on'zones'V0'(2)' (2)'nm
/h'
42'
Champ'des'vitesses'de'dissolu4on'reconstruit'
Surface'ini4ale'0'
Surface'après'1h'de'dissolu4on'
0' 1000'nm'
520'nm'
60'
40'
1'
2'
3'

(165±2)'nm/h' V0 + !Vd
''115'nm/h'
V0
100 200 300 400 500
50
100
150
200
250
300
350
400
450
500
!"#$%&#'$()*+&,&($%
-+.-),/012%
0 h
100 200 300 400 500
50
100
150
200
250
300
350
400
450
500
1 h
100 200 300 400 500
50
100
150
200
250
300
350
400
450
500
3 h
100 200 300 400 500
50
100
150
200
250
300
350
400
450
500
2 h
1µm'5 h
100 200 300 400 500
50
100
150
200
250
300
350
400
450
500
4 h
1µm'
1µm'
1µm'
5115'5230'nm'
5230'5345'nm' 5345'5460'nm'
5460'5575'nm' 5575'5680'nm'
05115'nm'
Resolu4on'of'this'technique:'X5Y'≈qq'10'nm,'Z'nm'
051'h' 152'h'
253'h' 455'h'
556'h' 657'h'
Red':'165'nm/h'='fully'densified'Blanc':'115'nm/h'='not'densified'Blue:'transi4on'zone,'from'densified'to'less'densified;'from'less'densified'to'undensified;'edge'artefacts'
At'+'or'–''1'standard'devia4on'Meaning'of'the'Colors'
Reconstruc4on'of'the'densified'zone'under'a'10'mN'Vickers'indenta4on'on'Window'glass'
Retrieving'the'3D'informa4on:'
J. Phys.: Condens. Matter 23 (2011) 035402 T Deschamps et al
Figure 5. Raman spectra acquired on a 2 kg Vickers window glassindented surface, at different distances to the centre d , along theX = Y axis (ND: non-densified glass). These Raman spectra aresimilar to those obtained after applied hydrostatic pressure above theelastic threshold, showing permanent densification in the indentedarea.
increasing maximal pressure reached. This argues in favourof Q2 symmetric stretching modes attribution concerning the600 cm−1 band. Thus, knowing that the 560 cm−1 Ramanband is well attributed to a Q3 symmetric stretching mode, σ
Raman parameter variation (chosen for the calibration curve)is directly linked to the Q3 → Q2 population variation whenpmax increases in the irreversible pressure domain.
4.2. Window glass densification under Vickers indentation;iso-density curves
Different stress states and anisotropies have been encounteredfor experimentation in DAC (hydrostatic pressure) andindentation (non-hydrostatic pressure). However, it hasbeen mentioned above (cf section 3.2) that non-hydrostaticcompression does not affect the structural modifications whichinduce permanent densification. Thus, the Raman spectrumof a glass recovered after applied high mechanical stresses at
ambient temperature can be viewed as a signature of its density.This result allows us to translate pressure indent mappinginto density mapping using the pressure ↔ density relationobtained by Ji et al after high hydrostatic pressure experimentsconducted using an octahedral multi-anvil apparatus [22]. Thislatter relation is approximately linear in the pressure-induceddensity change domain (according to our results, from 6.9 to16.2 GPa), and the density saturation ratio is equal to 6.3%. Wenote that Ji et al compressed the glass samples for 1 h. In thepresent study, the samples have been compressed for 12 h. Thismay cause a slight difference in the permanent densificationratio.
Thus, the experimental Raman mapping can be convertedinto a map of permanent densification ratio. Figure 6 representssimultaneously the Raman experimental results, the pressuremapping and the densification mapping for 1 and 2 kg Vickersindented window glass.
4.3. Comparison between window glass and silica glassplasticity
On the basis of their mechanical properties, oxide glasses havebeen split into two classes: ‘normal’ glasses and ‘anomalous’glasses [11–15]. The criterion of this division is the elasticmoduli behaviour of glasses under external thermodynamicparameters (p, T ) variation. A glass is called ‘normal’ if theelastic moduli, like shear modulus G or longitudinal modulusM , show the same behaviour as crystals. In this case, the elasticmoduli increase with pressure and decrease with temperature.The great majority of materials exhibits this variation, andwindow glass belongs to this class [14].
On the other hand, strong glass formers like a-SiO2, a-GeO2, or slightly depolymerized silicate glasses (for example(Na2O)x –(SiO2)1−x with 0 < x < 0.1) are called ‘anomalous’glasses, because their elastic behaviour is the opposite of‘normal’ glasses [14, 19, 36–42]. For instance, hydrostaticcompression of silica glass up to 2.5 GPa reveals a monotonicdecrease of the G and M elastic moduli. These anomaliesare attributed to the open tetrahedral network of amorphoussilica and germania. Besides, let us note that several currentexperimental and theoretical studies are being carried out
Figure 6. A 1/4 sector of 1 and 2 kg Vickers indented window glass Raman mapping. Only a 1/8 sector has been experimentally mapped butwe present the X = Y axial symmetry for a better visualization. Experimental σ values are converted to pmax (using the calibration curve offigure 4(c)) and the densification ratio "ρ/ρ using [22]. (0, 0) defines the indent centre and the graduated axis symbolizes the diagonals of theindents (X and Y axes, see figure 1).
5
!"#$%##&'()*&#+,-..#
spherical with increasing glass normality. These contrasted shapes for the iso-densitycontours of normal and anomalous glasses is the main result of the paper. It is to beemphasized that it should be robust against uncertainties in the quantitativeconversion between spectroscopic features and density.
6. Finite element analysis of the indentation-induced densification process
In a previous paper [19], we have shown that a constitutive model based on themechanics of porous materials can be used to predict indentation-induced densifi-cation maps on silica. In this section, we test the predictions of the model on themaps shown in the previous sections. For a similar normal glass, the densificationunder high pressure has been measured recently [22].
Let us just recall the main features of this constitutive model. In compression, theyield criterion is
f ð!ijÞ ¼q
qc
! "2
þ p
pc
! "2
%1, ð2Þ
where pc is the (hydrostatic) plastic limit in pure hydrostatic loading and qc the(shear) plastic limit in pure deviatoric loading. This form of the yield criterion allowsus to consider an associative flow rule. The densification-induced hardening is
40
20
0
–20
–40
Posi
tion
(µm
)
–40 –20 0 20 40
Position (µm)
(a)
(b)
Figure 5. Densification maps obtained on sample G1 (a) (iso-density contours with 0.5%increments) and on amorphous silica (b) (iso-density contours with 2.5% increments, increasingfrom outside the contact area to inside). The iso-density contours for the ‘normal’ glass (a) areclose to circular while they are star-shaped for the silica which is an ‘anomalous’ glass.
1252 A. Perriot et al.
Dow
nloa
ded
by [U
nive
rsity
of R
enne
s 1] a
t 05:
47 1
0 A
pril
2013
/0/#
0#1233'*4#24#-,5#6!"778#
92.:;-<=.#24#-,5#6!"778#100 200 300 400 500
50
100
150
200
250
300
350
400
450
500
!"#$%&#'$()*+&,&($%
-+.-),/012%
0 h
100 200 300 400 500
50
100
150
200
250
300
350
400
450
500
1 h
7><#
?77@#?!A"#(<#"?77@#(<#
7A#
B3',,*C'(#.=2:43*.:*=D%#B5#ECFG#24#-,5#6!"7!8#
(Fig. 7a). As shown in Fig. 1b, there are several cracksin the contact region. It can thus be assumed that theelastic energy stored is released during the propagationof these cracks. Consequently, we have also computedthe densification by taking into account only the plasticstrain (Fig. 7b). In this case, the densification is twotimes lower. It points out that contrary to silica, themagnitude of the bulk plastic deformation and the bulk
elastic deformation are of the same order of size. Aquite good agreement with the densification computedfrom the plastic strain only can be observed.
Discussion
Results in Fig. 2 show that the 500–730 cm!1
band is modified during the Vickers indentation. In par-ticular, the relative intensity of the Raman bands sug-gests a decrease in Q3 species at the expense of Q2
species.14 These structural changes are reflected at themacroscopic scale by a permanent densification of thewindow glass. Observe that the maximum ratio of densi-fication of the window glass (6.3%) is much lower thanthat of silica (20%). Despite the width of the Ramanband, it is possible to establish a calibration curve allow-ing the direct determination of the densification ratiofrom the Raman shift of the centroı̈d of the band.
On Fig. 4b, it is then shown that the maximumdensification ratio at the center of the indent isapproximately equal within the experimental errors forthe 10 N (3.6%) and for the 20 N (3.8%) loads. Apart of this experimental error is due to the z resolutionof the X50 objective (9 lm).It means that the Ramananalysis is performed with an integration of the Ramansignal over 9 lm for both 10N and 20 N loads,
Fig. 5. Top view mapping of the densification ratio as functionof the normalized distance from the indent center for 20 Nindent outside (black square) or on a precrack line (red circles).
(a) (b)
(a’)
(b’)
Fig. 6. Optical microscope and Raman mapping of the iso-density curves for a 20 N Vickers load in side view (a,a´) and top view (b,b´).
www.ceramics.org/IJAGS Raman Mapping of Indented Window Glass 33
H"#><#
!"7A#
A8#:*<=-3-'.*(#&'4;#*4;23#42:;('IC2.#
E243'2J'(+#4;2#A9#'(K*3<-L*(M#
E-<-(#.=2:43*.:*=D#
N?1#OC'(#
P)+2#.'(+C,-3'4D#2Q2:4#*(#)2(.'R:-L*(#-,.*#*S.23J2)#&'4;#TPU5#
O&D))'*(#

J. Phys.: Condens. Matter 23 (2011) 035402 T Deschamps et al
Figure 5. Raman spectra acquired on a 2 kg Vickers window glassindented surface, at different distances to the centre d , along theX = Y axis (ND: non-densified glass). These Raman spectra aresimilar to those obtained after applied hydrostatic pressure above theelastic threshold, showing permanent densification in the indentedarea.
increasing maximal pressure reached. This argues in favourof Q2 symmetric stretching modes attribution concerning the600 cm−1 band. Thus, knowing that the 560 cm−1 Ramanband is well attributed to a Q3 symmetric stretching mode, σ
Raman parameter variation (chosen for the calibration curve)is directly linked to the Q3 → Q2 population variation whenpmax increases in the irreversible pressure domain.
4.2. Window glass densification under Vickers indentation;iso-density curves
Different stress states and anisotropies have been encounteredfor experimentation in DAC (hydrostatic pressure) andindentation (non-hydrostatic pressure). However, it hasbeen mentioned above (cf section 3.2) that non-hydrostaticcompression does not affect the structural modifications whichinduce permanent densification. Thus, the Raman spectrumof a glass recovered after applied high mechanical stresses at
ambient temperature can be viewed as a signature of its density.This result allows us to translate pressure indent mappinginto density mapping using the pressure ↔ density relationobtained by Ji et al after high hydrostatic pressure experimentsconducted using an octahedral multi-anvil apparatus [22]. Thislatter relation is approximately linear in the pressure-induceddensity change domain (according to our results, from 6.9 to16.2 GPa), and the density saturation ratio is equal to 6.3%. Wenote that Ji et al compressed the glass samples for 1 h. In thepresent study, the samples have been compressed for 12 h. Thismay cause a slight difference in the permanent densificationratio.
Thus, the experimental Raman mapping can be convertedinto a map of permanent densification ratio. Figure 6 representssimultaneously the Raman experimental results, the pressuremapping and the densification mapping for 1 and 2 kg Vickersindented window glass.
4.3. Comparison between window glass and silica glassplasticity
On the basis of their mechanical properties, oxide glasses havebeen split into two classes: ‘normal’ glasses and ‘anomalous’glasses [11–15]. The criterion of this division is the elasticmoduli behaviour of glasses under external thermodynamicparameters (p, T ) variation. A glass is called ‘normal’ if theelastic moduli, like shear modulus G or longitudinal modulusM , show the same behaviour as crystals. In this case, the elasticmoduli increase with pressure and decrease with temperature.The great majority of materials exhibits this variation, andwindow glass belongs to this class [14].
On the other hand, strong glass formers like a-SiO2, a-GeO2, or slightly depolymerized silicate glasses (for example(Na2O)x –(SiO2)1−x with 0 < x < 0.1) are called ‘anomalous’glasses, because their elastic behaviour is the opposite of‘normal’ glasses [14, 19, 36–42]. For instance, hydrostaticcompression of silica glass up to 2.5 GPa reveals a monotonicdecrease of the G and M elastic moduli. These anomaliesare attributed to the open tetrahedral network of amorphoussilica and germania. Besides, let us note that several currentexperimental and theoretical studies are being carried out
Figure 6. A 1/4 sector of 1 and 2 kg Vickers indented window glass Raman mapping. Only a 1/8 sector has been experimentally mapped butwe present the X = Y axial symmetry for a better visualization. Experimental σ values are converted to pmax (using the calibration curve offigure 4(c)) and the densification ratio "ρ/ρ using [22]. (0, 0) defines the indent centre and the graduated axis symbolizes the diagonals of theindents (X and Y axes, see figure 1).
5
20'N,''window'glass'
spherical with increasing glass normality. These contrasted shapes for the iso-densitycontours of normal and anomalous glasses is the main result of the paper. It is to beemphasized that it should be robust against uncertainties in the quantitativeconversion between spectroscopic features and density.
6. Finite element analysis of the indentation-induced densification process
In a previous paper [19], we have shown that a constitutive model based on themechanics of porous materials can be used to predict indentation-induced densifi-cation maps on silica. In this section, we test the predictions of the model on themaps shown in the previous sections. For a similar normal glass, the densificationunder high pressure has been measured recently [22].
Let us just recall the main features of this constitutive model. In compression, theyield criterion is
f ð!ijÞ ¼q
qc
! "2
þ p
pc
! "2
%1, ð2Þ
where pc is the (hydrostatic) plastic limit in pure hydrostatic loading and qc the(shear) plastic limit in pure deviatoric loading. This form of the yield criterion allowsus to consider an associative flow rule. The densification-induced hardening is
40
20
0
–20
–40
Posi
tion
(µm
)
–40 –20 0 20 40
Position (µm)
(a)
(b)
Figure 5. Densification maps obtained on sample G1 (a) (iso-density contours with 0.5%increments) and on amorphous silica (b) (iso-density contours with 2.5% increments, increasingfrom outside the contact area to inside). The iso-density contours for the ‘normal’ glass (a) areclose to circular while they are star-shaped for the silica which is an ‘anomalous’ glass.
1252 A. Perriot et al.
Dow
nloa
ded
by [U
nive
rsity
of R
enne
s 1] a
t 05:
47 1
0 A
pril
2013
VAV'
A'Perriot'et'al.'(2011)'
Deschamps'et'al.'(2011)'100 200 300 400 500
50
100
150
200
250
300
350
400
450
500
!"#$%&#'$()*+&,&($%
-+.-),/012%
0 h
100 200 300 400 500
50
100
150
200
250
300
350
400
450
500
1 h
1µm'
5115'5230'nm'05115'nm'
44'
Brillouin'spectroscopy,'B.'Rufflé'et'al.'(2012)'
(Fig. 7a). As shown in Fig. 1b, there are several cracksin the contact region. It can thus be assumed that theelastic energy stored is released during the propagationof these cracks. Consequently, we have also computedthe densification by taking into account only the plasticstrain (Fig. 7b). In this case, the densification is twotimes lower. It points out that contrary to silica, themagnitude of the bulk plastic deformation and the bulk
elastic deformation are of the same order of size. Aquite good agreement with the densification computedfrom the plastic strain only can be observed.
Discussion
Results in Fig. 2 show that the 500–730 cm!1
band is modified during the Vickers indentation. In par-ticular, the relative intensity of the Raman bands sug-gests a decrease in Q3 species at the expense of Q2
species.14 These structural changes are reflected at themacroscopic scale by a permanent densification of thewindow glass. Observe that the maximum ratio of densi-fication of the window glass (6.3%) is much lower thanthat of silica (20%). Despite the width of the Ramanband, it is possible to establish a calibration curve allow-ing the direct determination of the densification ratiofrom the Raman shift of the centroı̈d of the band.
On Fig. 4b, it is then shown that the maximumdensification ratio at the center of the indent isapproximately equal within the experimental errors forthe 10 N (3.6%) and for the 20 N (3.8%) loads. Apart of this experimental error is due to the z resolutionof the X50 objective (9 lm).It means that the Ramananalysis is performed with an integration of the Ramansignal over 9 lm for both 10N and 20 N loads,
Fig. 5. Top view mapping of the densification ratio as functionof the normalized distance from the indent center for 20 Nindent outside (black square) or on a precrack line (red circles).
(a) (b)
(a’)
(b’)
Fig. 6. Optical microscope and Raman mapping of the iso-density curves for a 20 N Vickers load in side view (a,a´) and top view (b,b´).
www.ceramics.org/IJAGS Raman Mapping of Indented Window Glass 33
40'µm'
'comparaison'with'other'techniques'
Retrieving'the'3D'informa4on:'
Raman'spectroscopy'
Edge'singularity'effect'on'densifica4on'also'observed'with'FEM.'
Gwyddion' 20'N'

Glass'nanoméchanics':'plas4city'under'sharp'contact'
[6,5]. Moreover, the radius of the cone crack obtained numerically(rnumcone = 41.14 μm) is in good agreement with the experimentalworks of Arora et al. [6] (rexpcone ≈ 40 μm).
5. Conclusion
This paper attempted to reproduce numerically the anomalous be-havior of silica glass and increase the comprehension of this behavior.Understanding permanent deformations in this type of glass repre-sents a considerable challenge. An assumption has been made thatthe densification takes place only under high compressive pressureand that no shearing stresses influence the final permanent deforma-tion levels. Based on this assumption, a densification model, adaptedfor discrete element methods, is developed in this work. The densifi-cation behavior is modeled by a “spring-slider” system incorporatedbetween beam-linked particles at the micro scale. This system acti-vates only under compression stress. The densification model in-volves three microscopic parameters which can be determined bycalibration tests. As shown previously, the calibration process of
these parameters is fairly easy. The macroscopic densification pres-sure Pd is a linear function of microscopic densification pressure σμ
d
only. Therefore, σμd can be determined independently from the other
microscopic parameters. Subsequently, the microscopic tangentialmodulus can be calibrated taking into account the macroscopic satu-ration pressure Ps. Finally, the maximum permanent deformation canbe set to adjust the macroscopic volume change ΔV
V0(or the density
change Δρρ0). It is shown that, after calibration, this model gives good
macroscopic densification results compared with those obtained ex-perimentally (Fig. 10). To validate this model at microscopic scales,simulations of the Vickers indentation process were performed withthree different indentation forces. First, low forces (0.1 N and 0.5 N)were used to validate microscopically the densification model in theabsence of fracture. A comparison of these results with experimentalones [8] shows that this model is also validated at microscopic scales(when microscopic loading is applied) and represents an advance-ment in the comprehension of permanent deformation in silica glass.
The influence of the densification behavior on the cracking responsewas studied by applying a high indentation force (30 N). As can be ob-served in Figure (Fig. 15), the silica glass forms primarily a cone crack.This is due to the densification behavior, which leads to the formationof a spherical densified region. This, in turn, behaves as a spherical in-denter that will induce in most brittle materials a cone crack at the be-ginning of fracture. When the indentation force further increases, othertypes of cracking appear and induce the complete destruction of thesample.
a)
b)
c)
Fig. 14. Cut-away view of the indented region; Findent = 0.5 N; top: experimental re-sults from Ji [8], middle: DEM numerical results; bottom: CNEM–DEM coupling numer-ical result.
a)
b)
c)
Fig. 15. Cracking pattern of silica glass indented with a Vickers tip; Findent = 30 N; onlythe discrete elements where the fracture criterion is reached are shown in (b) and (c).
23M. Jebahi et al. / Journal of Non-Crystalline Solids 378 (2013) 15–24
V..Keryvin.et.al.,.silice.2006,.2014. M..Jebahi.et.al..,.silice.,.2013.
Numerical.Modeling:.
0.0 0.5 1.0 1.5 2.0 2.5 3.0 3.5 4.0Radius, r/hmax
�3.0
�2.5
�2.0
�1.5
�1.0
�0.5
0.0
0.5
1.0
Dep
th,z/h
max
�max = 21.7 %
0.0
0.1
1.0
4.0
7.0
10.0
13.0
16.0
21.6
Den
sific
atio
nfie
ld,�=�⇥
p
⇥0[%]
2''
3,5'
g/cm
3 '
D..A..Kilymis.J]M..Delaye,.silice,2013.
Molecular'dynamic'Discrete'element'method'Finite'element'modeling'Plas4c'zo
ne'th
ickness'
√P,'P'indenta4on'load'
3D'mapping'of'the'plas4c'zone'
1µm'
Nano'crack'3D'network'Thickness' of' the' plas4c' zone'sizes'with'indenta4on'load'
Experimental.benchmark.:.chemical.probe.for.plas=city.
Plas4c'zone:'size,'shape,'local'gradients,'crack'nuclea4on'
densified.
transi4on'pris=ne.
Valida4on'of'numerical'hypotheses'
A.reliable.experimental.benchmark.at.a.per=nent.scale.to.study.plas=city.in.glass.
Illustration of the strategy developed in order to understand the coupling between densification and shear flow in glasses either at indentation sites or at scratches site.
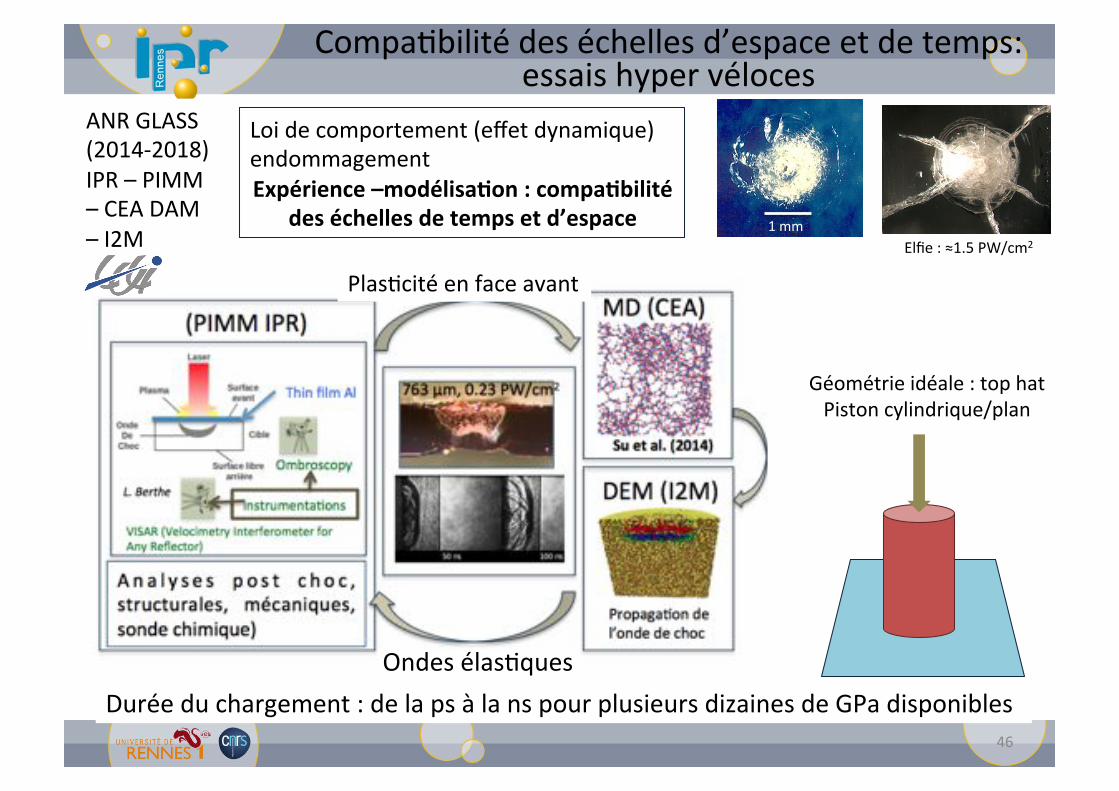
Compa4bilité'des'échelles'd’espace'et'de'temps:'essais'hyper'véloces'
46'
ANR'GLASS'(201452018)'IPR'–'PIMM'–'CEA'DAM'–'I2M'
Ondes'élas4ques'
Plas4cité'en'face'avant'
Durée'du'chargement':'de'la'ps'à'la'ns'pour'plusieurs'dizaines'de'GPa'disponibles'
Loi'de'comportement'(effet'dynamique)'endommagement'Expérience.–modélisa=on.:.compa=bilité.
des.échelles.de.temps.et.d’espace.
Géométrie'idéale':'top'hat'Piston'cylindrique/plan'
1'mm'Elfie':'≈1.5'PW/cm2'

47'
Remerciements:''Vincent'Keryvin'(LIMATB)'Ludovic'Charleux'(SYMME)'J5C'Sangleboeuf'(IPR5Rennes)'Didier'Loison'(IPR5Rennes)'MarieRe'Nivard'(IPR'Rennes)''Kun'Han'PhD'thesis'(2012)'Liva'Rabemananjara'(M2'2012)'Yi'Fan'Niu'(Thesis'2009','post'doc'2010)'
PhD'fundings'
Star4ng'grant''QUIC'GLASS'(200752012)'
GLASS'(201452018'
hRp://ipr.univ5rennes1.fr/'