2015 financial statements reveal boom in profitability of ... · turn on investment (roi) ... ne...
TRANSCRIPT
CWR 121/2017 54
The 3rd edition of the “Financial statement analysis of world ce-ramic tile producers” published by the Acimac Research De-partment / MECS in April this year provides a complete eco-nomic and financial picture of 325 ceramic tile producer com-panies operating in 42 countries worldwide for the three-year period 2013-2015. These include 88 companies in Italy, 75 in Spain, 38 in other EU countries, 31 in non-EU countries, 77 in Asia and 16 in other countries. The study compares each com-pany’s performance with the average national and world prof-itability values and with those of the most similar companies in terms of management and results (cluster and benchmarking analysis). The following are the main findings of the analysis of groups of companies operating in Italy, Spain and Asia.
❱ ITALY
All the trends in sales and profits of the Italian ceramic tile sector have been confirmed. The 2015 financial statements show that the industry has literally doubled its growth rate in the space of one year and is rapidly regaining the ground it lost during the 10-year crisis from which it is now emerg-
Luca Baraldi - Acimac Research Department ([email protected] - www.mec-studies.com)
chmarking). Di seguito si riporta-no in sintesi le maggiori eviden-ze emerse dall’analisi degli ag-gregati di imprese attive in Italia, Spagna e Asia.
❱ ITALIA
Tutte le tendenze relative al-le vendite e ai profitti del setto-re italiano delle piastrelle cerami-che sono state confermate: co-me emerge dai dati di bilancio consuntivi del 2015, il settore ha letteralmente raddoppiato, in un solo anno, il suo ritmo di cresci-ta e sta riguadagnando rapida-mente le posizioni perdute nella crisi decennale che ci stiamo la-sciando alle spalle. Per di più, la tendenza non sembra esaurirsi:
È stata pubblicata in aprile la 3a edizione di “Analisi di bi-lancio dei produttori mondia-li di piastrelle”, studio realiz-zato dal Centro Studi Acimac / MECS che presenta un’analisi economica e finanziaria com-pleta (triennio 2013-2015) di 325 aziende produttrici di pia-strelle ceramiche operanti in 42 Paesi, tra cui: 88 italiane, 75 spagnole, 38 attive in altre nazioni UE, 31 europee non-UE, 77 asiatiche, 16 di altri Pa-esi. Lo studio mette a confron-to le performance di ciascu-na azienda con i valori medi nazionali e mondiali di reddi-tività e con quelli delle azien-de più simili per gestione e ri-sultati (analisi cluster e di ben-
Bilanci 2015: crescita boom della profittabilità per le piastrelle italiane
2015 financial statements reveal boom in profitability of Italian tiles
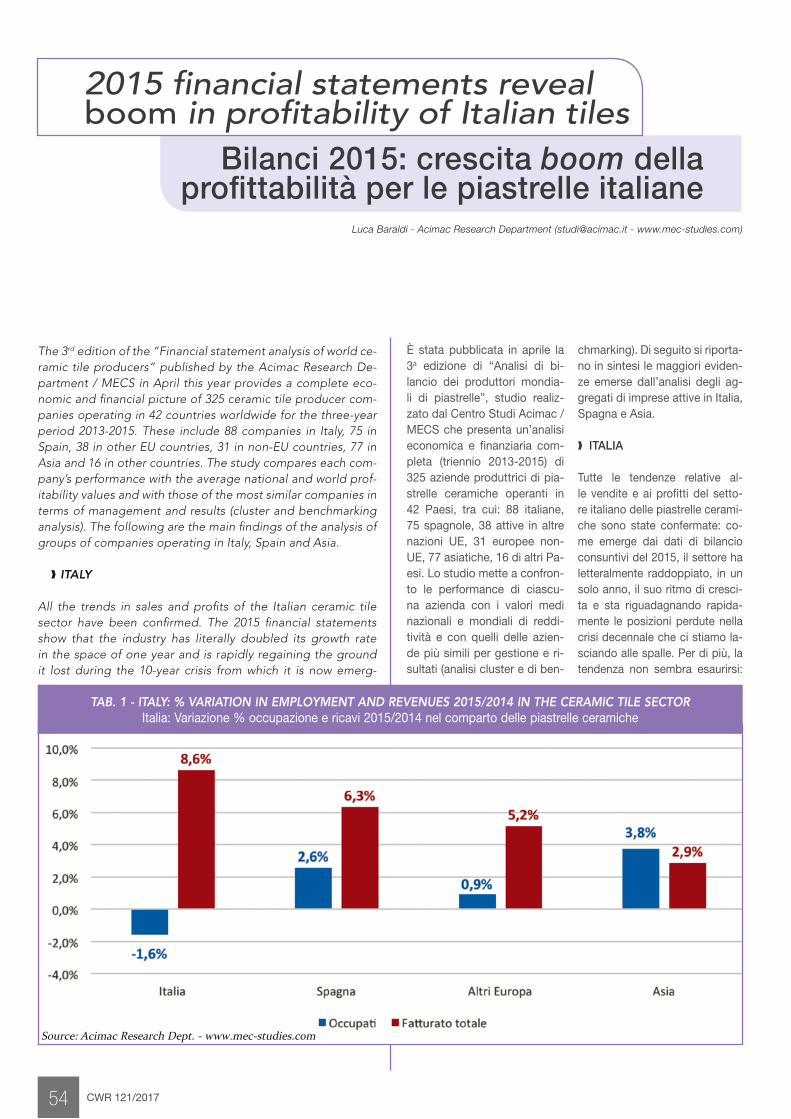
TAB. 1 - ITALY: % VARIATION IN EMPLOYMENT AND REVENUES 2015/2014 IN THE CERAMIC TILE SECTOR Italia: Variazione % occupazione e ricavi 2015/2014 nel comparto delle piastrelle ceramiche
Source: Acimac Research Dept. - www.mec-studies.com
CWR 121/2017 55
ing. Moreover, the trend does not appear to be slowing, with sales growing at a faster rate than other producer countries. Naturally this growth leadership position is particularly evi-dent when compared with the stagnant trend in sales of Asian countries (Italian sample +8.6% compared to +2.9% for the Asian sample), although Italy also enjoys a considerable ad-vantage over Spain (+6.3%) and even more significantly over other European countries (+5.2%). The Italian results reveal a real boom in sales which contin-ued in 2016. This acceleration does not appear likely to slack-en at least within the next two years, as it is determined by structural factors: the profound reorganisation of companies’ operations, the significant technological improvements in both products and processes, in turn driven by large-scale in-vestments in production equipment and R&D, and last but not least the significant average improvement in production and management efficiency at all corporate levels. In 2015, in-vestments in fixed and intangible assets saw overall growth (+4.4%), more than 1.5 percentage points higher than that of Spain and Asian countries (which however had previous-ly been experiencing almost 20% growth). The process of em-ployment restructuring continued in the sector amidst in-vestments that at least in part are introducing labour-saving technologies, leading to a further reduction in the industry’s overall employment levels (-1.6%).However, it is not just sales that are booming in Italy, all the profitability ratios are showing significant improvement. Re-turn on investment (ROI) has grown by more than one per-centage point (from 3.1% to 4.2%). Added value has also grown, both in relation to turnover and in the form of indus-trial gross productivity (added value per employee) and con-sequently the efficiency of production processes. In particular this includes leaner inventory management, as reflected by the further reduction of companies’ average stock inventory in 2015. The added value margin of ceramic tile producers,
le vendite crescono ad un rit-mo più sostenuto rispetto al-le altre realtà produttive mon-diali. Naturalmente questa vir-tuosa posizione di leadership della crescita è particolarmen-te evidente se confrontata con la tendenziale stagnazione del-le vendite asiatiche (campio-ne Italia +8,6%, campione Asia +2,9%), ma il vantaggio è mar-cato anche nei confronti della Spagna (+6,3%) e, ancora di più, delle altre realtà europee (+5,2%). Il risultato italiano, dunque, evidenzia certamente un vero e proprio boom delle vendite che, sappiamo, è pro-seguito anche nel 2016. Que-sta accelerazione non sembra destinata ad esaurirsi almeno nel prossimo biennio, giacché è determinata da fattori strut-turali: la profonda ristruttura-zione dell’organizzazione del lavoro nelle imprese, i marca-ti miglioramenti tecnologici sia nei prodotti che nei processi, a loro volta determinati da ingen-ti investimenti in attrezzatu-re produttive e in R&S; infine, il significativo progresso medio dell’efficienza produttiva e ge-stionale a tutti i livelli del mana-gement. Più in particolare, nel 2015 gli investimenti in immo-bilizzazioni materiali e imma-teriali hanno accelerato la loro crescita complessiva (+4,4%), superiore di oltre 1,5 punti per-centuali sia rispetto alla Spa-gna che rispetto alle impre-se asiatiche (che pure veniva-no da una crescita di quasi il
economics
20%). Per quanto attiene il pro-cesso di riordino della struttura occupazionale, si è registra-ta un’ulteriore riduzione dell’oc-cupazione complessiva del set-tore (-1,6%), a fronte di investi-menti che, almeno in parte, in-troducono tecnologie risparmia-trici di lavoro.Comunque, quello italiano non è soltanto un boom di vendite. Mi-gliorano, infatti, e di molto, tut-ti gli indici di redditività. La red-ditività del capitale investi-to, ROI, cresce di oltre un pun-to percentuale (dal 3,1 al 4,2%). Cresce ancora il valore ag-giunto, sia in rapporto al fattu-rato che nella forma di produt-tività lorda industriale (valore aggiunto per addetto), e quindi l’efficienza dei processi produt-tivi: tra questi spicca la gestio-ne più snella delle scorte, at-testata dall’ulteriore riduzione, nel 2015, della giacenza me-dia di magazzino nel comples-so delle imprese. Il valore ag-giunto/fatturato, che è il pri-mo indicatore (a monte) di mar-gine lordo nella catena del valo-re, risulta, nelle imprese italiane di produzione di piastrelle, ac-cresciuto di un ulteriore mezzo punto percentuale, fra il 2014 e il 2015, raggiungendo ora il livello del 32%, marcatamente al diso-pra del livello spagnolo, che da anni è attestato sul 30,8%, ed anche di quello asiatico (di po-co inferiore al 29%). Il livello ita-liano della produttività lorda in-dustriale rispecchia il modello industriale italiano che emerge
CWR 121/2017 56
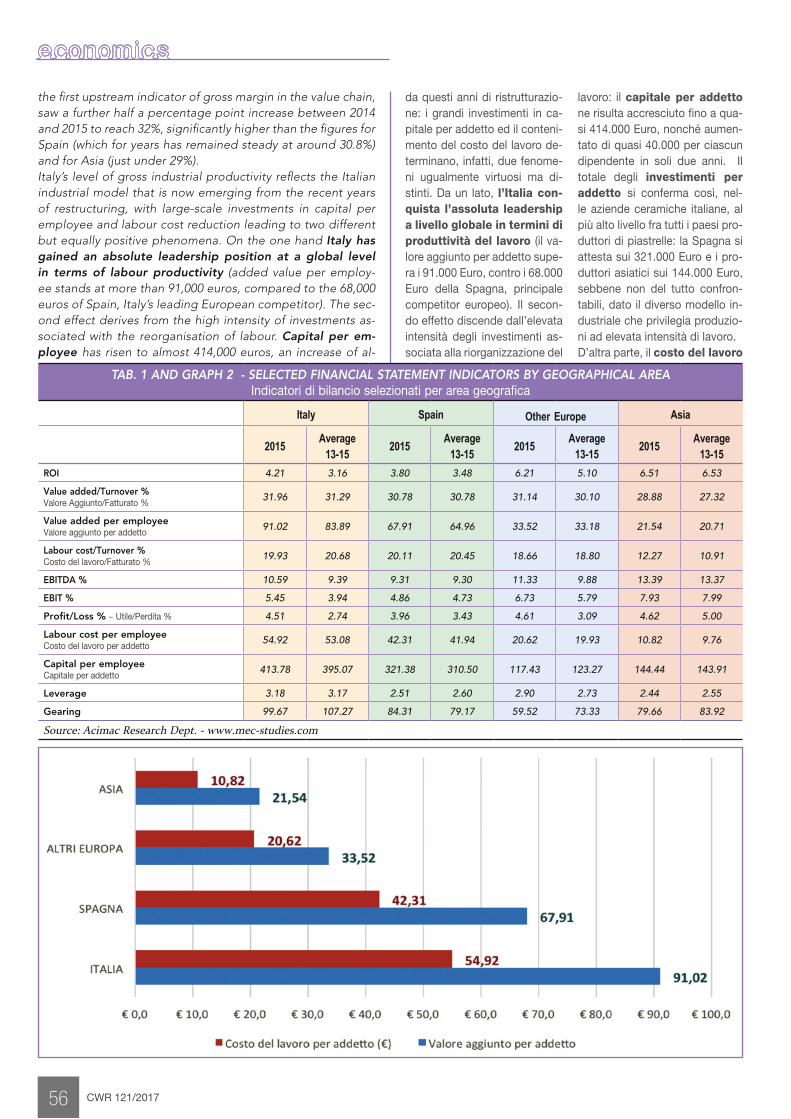
the first upstream indicator of gross margin in the value chain, saw a further half a percentage point increase between 2014 and 2015 to reach 32%, significantly higher than the figures for Spain (which for years has remained steady at around 30.8%) and for Asia (just under 29%). Italy’s level of gross industrial productivity reflects the Italian industrial model that is now emerging from the recent years of restructuring, with large-scale investments in capital per employee and labour cost reduction leading to two different but equally positive phenomena. On the one hand Italy has gained an absolute leadership position at a global level in terms of labour productivity (added value per employ-ee stands at more than 91,000 euros, compared to the 68,000 euros of Spain, Italy’s leading European competitor). The sec-ond effect derives from the high intensity of investments as-sociated with the reorganisation of labour. Capital per em-ployee has risen to almost 414,000 euros, an increase of al-
TAB. 1 AND GRAPH 2 - SELECTED FINANCIAL STATEMENT INDICATORS BY GEOGRAPHICAL AREAIndicatori di bilancio selezionati per area geografica
Italy Spain Other Europe Asia
2015Average
13-152015
Average 13-15
2015Average
13-152015
Average 13-15
ROI 4.21 3.16 3.80 3.48 6.21 5.10 6.51 6.53
Value added/Turnover %Valore Aggiunto/Fatturato %
31.96 31.29 30.78 30.78 31.14 30.10 28.88 27.32
Value added per employeeValore aggiunto per addetto
91.02 83.89 67.91 64.96 33.52 33.18 21.54 20.71
Labour cost/Turnover %Costo del lavoro/Fatturato %
19.93 20.68 20.11 20.45 18.66 18.80 12.27 10.91
EBITDA % 10.59 9.39 9.31 9.30 11.33 9.88 13.39 13.37
EBIT % 5.45 3.94 4.86 4.73 6.73 5.79 7.93 7.99
Profit/Loss % ~ Utile/Perdita % 4.51 2.74 3.96 3.43 4.61 3.09 4.62 5.00
Labour cost per employeeCosto del lavoro per addetto
54.92 53.08 42.31 41.94 20.62 19.93 10.82 9.76
Capital per employeeCapitale per addetto
413.78 395.07 321.38 310.50 117.43 123.27 144.44 143.91
Leverage 3.18 3.17 2.51 2.60 2.90 2.73 2.44 2.55
Gearing 99.67 107.27 84.31 79.17 59.52 73.33 79.66 83.92
Source: Acimac Research Dept. - www.mec-studies.com
economics
da questi anni di ristrutturazio-ne: i grandi investimenti in ca-pitale per addetto ed il conteni-mento del costo del lavoro de-terminano, infatti, due fenome-ni ugualmente virtuosi ma di-stinti. Da un lato, l’Italia con-quista l’assoluta leadership a livello globale in termini di produttività del lavoro (il va-lore aggiunto per addetto supe-ra i 91.000 Euro, contro i 68.000 Euro della Spagna, principale competitor europeo). Il secon-do effetto discende dall’elevata intensità degli investimenti as-sociata alla riorganizzazione del
lavoro: il capitale per addetto ne risulta accresciuto fino a qua-si 414.000 Euro, nonché aumen-tato di quasi 40.000 per ciascun dipendente in soli due anni. Il totale degli investimenti per addetto si conferma così, nel-le aziende ceramiche italiane, al più alto livello fra tutti i paesi pro-duttori di piastrelle: la Spagna si attesta sui 321.000 Euro e i pro-duttori asiatici sui 144.000 Euro, sebbene non del tutto confron-tabili, dato il diverso modello in-dustriale che privilegia produzio-ni ad elevata intensità di lavoro.D’altra parte, il costo del lavoro
CONSULenza
STRATEGICA
ORGANIZZATIva
TECNICA
TECNOLOGICA
LESS QUESTIONS. MORE IDEAS.Per la fabbrica del futuro, il nostro know how ed i più avanzati strumenti
di digitalizzazione per semplificare i processi e ottimizzare le performance.
Be smart, choose Ideas.
www.ideas4.it
ADV IDEAS 2017 OK 2.indd 1 20/01/17 11:46
most 40,000 euros per employee in the space of just two years. Italian companies maintain the highest level of total investments per employee of all ceramic tile producer coun-tries. Spain’s average level of investments per employee stands at 321,000 euros, while that of Asian producers is 144,000 euros, al-though the figures are not entirely comparable due to the dif-ferent industrial model which favours high labour-intensive production.At the same time, Italy’s unit labour costs (ULC) fell by al-most one percentage point in 2015 to drop below 20%. This is the real indicator of the competitiveness of Italian tile pro-ducers in terms of labour costs: although labour cost per em-ployee is significantly higher than that of other competitors (and growing), the greater capital intensity and higher labour productivity more than offset the effect of salary adjustments and the high Italian tax burden. It should be stressed however that this high level of Italian competitiveness is manifested in its key market, i.e. in the high-quality/high-price segments in which Italian producers do not face strong competition from Eastern European or Asian manufacturers, who still enjoy sig-nificant advantages in terms of labour costs. Italian ceramic tile manufacturers have seen a further improve-ment in cash flow and interest coverage margin, reflecting greater balance between the effects of economic manage-ment and those of financial management. The improvement in financial management of Italian companies is also reflect-ed in the stability of leverage and the sharp reduction in gearing (two indicators of the level of capitalisation of com-panies). Lastly, the other profitability ratios (return on equi-ty ROE and return on sales ROS), and likewise other profit margin ratios downstream of added value, continued to im-prove significantly in 2015, reaching very high levels in medi-um-large companies (turnovers of between 40 and 100 mil-lion euros) and above all in large companies (more than 100 million euros). Downstream profitability ratios (EBITDA mar-gin, EBIT margin and net profit margin) grew by more than one percentage point to comfortably exceed the gross oper-ating margins and profit margins of Spain and almost reach the profit margins of Asian companies.
❱ SPAIN
Spanish companies saw further growth in sales in 2015, al-though the process of increased production efficiency meas-ured through added value margin came to an end. Efficien-cy in the use of labour remained more or less stable, while gross and net profitability margins increased by approximate-ly half a percentage point (EBITDA 9.3%, EBIT 4.9%, net profits 4%). Return on equity (ROE) saw further growth to 6.5%, slightly higher than the Italian level, while return on in-vestments (ROI) and return on sales (ROS) resumed growth af-ter the previous year’s downturn. Asset turnover ratio (ATR) al-so remained stable at the same average level as observed in Italy (0.78). Spanish companies maintained their ability to achieve a good financial equilibrium (quick ratio = 1) and a slight improve-ment in short-term solvency (current ratio = 1.89). Cashflow saw further improvement and there was a marginal redistribu-tion of debt towards long-term debt. Lastly, the Spanish com-
58
per unità di prodotto (CLUP) nel 2015 scende, in Italia, di quasi un punto percentuale, al disotto del 20%. È questo il vero indicatore del-la competitività delle produzio-ni italiane di piastrelle in termi-ni di costo del lavoro: anche se il costo del lavoro per addetto è nettamente superiore e in cre-scita, rispetto a quello dei com-petitor, tuttavia la maggiore in-tensità di capitale e l’elevata produttività del lavoro compen-sano ampiamente l’effetto degli adeguamenti salariali e il signi-ficativo cuneo fiscale italiani. Va tuttavia sottolineato che ta-le maggiore competitività italia-na si manifesta nel suo mercato rilevante, cioè in quei segmen-ti high quality-high price dove non è forte la concorrenza con i produttori dell’Est europeo e dell’Asia, che ancora godono di marcati vantaggi in termini di costo del lavoro. Nelle imprese italiane produt-trici di piastrelle ceramiche mi-gliorano ulteriormente il ca-shflow e il grado di copertura reddituale (EBIT) degli interes-si passivi, attestando così un maggiore equilibrio fra gli effet-ti della gestione economica e quelli della gestione finanzia-ria. Che la gestione finanziaria delle imprese italiane sia in mi-glioramento è inoltre testimo-niato dalla stabilità del Leve-rage e dalla marcata riduzio-ne del Gearing (entrambi in-dicatori del grado di capitaliz-zazione delle imprese). Infine, gli altri indici di redditività (ROE e ROS: redditività del capitale proprio e delle vendite, rispet-tivamente), come pure anche gli indici di margine redditua-le più a valle del valore aggiun-to, continuano a migliorare si-gnificativamente nel 2015, rag-giungendo livelli assai eleva-ti nelle imprese medio-grandi (fra 40 e 100 milioni di fatturato) e soprattutto nelle grandi (oltre 100 milioni). Gli indici di gestio-ne della redditività a valle (EBI-TDA, EBIT e profitto netto, tutti in rapporto al fatturato), crescono di oltre un punto per-
centuale e superano nettamente i margini operativi lordi e gli uti-li riscontrati in Spagna, raggiun-gendo quasi il saggio di profitto delle imprese asiatiche.
❱ SPAGNA
Crescono ancora le vendite del-le imprese spagnole ma si inter-rompe, invece, nel 2015, il pro-cesso di crescita dell’efficien-za produttiva, misurata attraver-so il valore aggiunto in rappor-to al fatturato. Anche l’efficien-za nell’impiego di manodope-ra risulta all’incirca stabile, ma i margini di redditività lorda e net-ta comunque migliorano di circa mezzo punto percentuale (EBI-TDA: 9,3%, EBIT: 4,9%, uti-le netto: 4%). Si osserva poi un ulteriore progresso del ren-dimento del capitale proprio (ROE) che raggiunge il 6,5%, al disopra, seppur di poco, al livel-lo italiano, mentre il rendimen-to del capitale investito (ROI) e la redditività delle vendite (ROS) tornano a crescere dopo il peg-gioramento dell’anno preceden-te. Stabile risulta anche la rota-zione degli impieghi (ROT), al medesimo livello medio riscon-trato in Italia (0,78). Le imprese spagnole conferma-no la capacità di conservare un buon equilibrio finanziario (quick ratio =1) nonché una sol-vibilità di breve periodo in legge-ro miglioramento (current ratio = 1,89). Il cashflow migliora an-cora e si osserva una marginale redistribuzione dei debiti a favo-re di quelli a lungo termine. Pro-segue, infine, anche nelle impre-se spagnole, il già osservato in-cremento dei livelli di inve-stimento, il che produce un ul-teriore miglioramento del ca-pitale per addetto.
❱ ASIA
Si è detto del modello produttivo asiatico, ad alta intensità di lavo-ro, per la produzione di piastrelle di prezzo medio-basso destina-te a segmenti di mercato ad ele-vato grado di competizione. L’e-levato sfruttamento di economie
CWR 121/2017
MECSMachinery Economic Studies
www.mec-studies.com
di scala e, in molti casi (in Cina), anche di economie distrettuali, consentono una creazione di valore aggiunto relativamen-te alto in rapporto al fatturato, seppure non ai livelli italiano e spagnolo. L’impiego intensi-vo di manodopera e il con-seguente livello medio-bas-so degli investimenti in au-tomazione industriale rende questo modello meno perfor-mante in termini di produttività del lavoro. Tuttavia, questo ef-fetto è più che compensato dal basso costo della manodope-ra, cosicché i margini di reddi-tività lorda ottenuti dall’impresa asiatica media sono maggiori di quasi 2 punti percentuali rispet-to a quelli degli altri principali produttori mondiali.Le imprese asiatiche, per ef-fetto del costo del lavoro con-tenuto, confermano infatti nel 2015 elevatissime margina-lità a tutti gli stadi della cate-na del valore, pur partendo da
un livello di efficienza tecnolo-gico-produttiva inferiore rispet-to ad Italia e Spagna (ad ecce-zione del ciclo delle scorte, che è più efficiente e snello rispetto a quello medio italiano e spa-gnolo). Conseguono un EBIT-DA in rapporto alle vendite del 13,4%, di poco superiore al li-vello di profittabilità lorda del 2014. Tuttavia, nel 2015 risulta-no particolarmente compressi i margini di utile netto, in ca-lo di quasi 1,5 punti percentuali. La redditività del capitale inve-stito (indici di redditività ROE, ROI e ROS) sono quasi doppi rispetto ai due competitor eu-ropei. Ancora soddisfacente anche l’indice di rotazione degli impieghi (0,76), anche se que-sto non costituisce più carat-tere peculiare, dato che le im-prese asiatiche presentano lo stesso livello dell’indice riscon-trabile anche in Italia e Spagna. Inoltre, nella media delle impre-se asiatiche, l’indice di rotazio-
panies maintained the previously observed increase in levels of investment, resulting in a further improvement in capital per employee.
❱ ASIA
The Asian business model adopts a highly labour-intensive production process to produce medium-low price tiles for highly competitive market segments. The high degree of uti-lisation of economies of scale and in many cases (in China) district economies allows for the creation of relatively high levels of added value margin, although not at the levels of Italy and Spain. The intensive use of labour and the conse-quently medium-low level of investments in industrial au-tomation means that this model achieves lower levels of per-formance in terms of labour productivity. However, this effect is more than offset by the low cost of labour, so the gross prof-itability margins achieved by Asian companies are on aver-age almost 2 percentage points higher than those of the oth-er main world producers.Due to low labour costs, Asian companies achieved very high margins in 2015 in all stages of the value chain, despite start-ing out from a lower level of technological efficiency than It-aly or Spain (with the exception of the inventory cycle, which is more efficient and streamlined than the average in Italy and Spain). The result was an EBITDA margin of 13.4%, slightly higher than the level of gross profitability of 2014. Howev-er, net profit margins fell by almost 1.5 percentage points
economics
Premium grinding tools since 1919www.tyrolit.com
Your Partner for processing Technical Ceramic
In collaboration with ceramic manufacturers and stone fabricators TYROLIT has developed a wide assortment of diamond tools, which allow an unmatched quality of finish in any ceramic material and thickness. We provide tools for all applications; straight and 45° inclined cutting, drilling, profiling, drain board, calibrating and flush fitting. TYROLIT provides technically outstanding diamond tools for: Dekton, Florim, Iris, Kerlite, Laminam, Lapitec, Neotlith, Techlam, Slimtech, Stoneglass, Zero.3 and any ceramic over-sized tile and slab.
2062_17_SCG_IT_Ad_Tools_for_Ceramic_Slabs_210x148_RZ_PRINT.indd 1 09.03.17 09:49
ADVERTISING
CWR 121/2017 60
economics
in 2015. ROE, ROI and ROS were almost double those of the two European competitors. Although asset turnover ratio (ATR) remained satisfactory (0.76), it is no longer a distinctive characteristic of Asian companies as it is now on a par with the level observed in Italy and Spain. Moreover, the asset turn-over ratio has fallen on average amongst Asian companies, down from the 2014 figure of 0.85. From the standpoint of economic and financial indicators, it should be stressed that the ratio between equity and borrow-ing (leverage), cashflow, length of the active cycle and inter-est coverage margin (low at a sector-wide level) are all far su-perior to the corresponding values observed in Spain and Italy, although Italian companies have a higher level of inter-est coverage margin. Asian companies therefore continued to be highly profitable and efficient in 2015, although they tend-ed to operate in the low-cost market segment where neither Spanish nor Italian companies are direct competitors.
❱ Ceramic tiles: the two most successful business models
Analysing ceramic tile companies with very high levels of tech-nological and manufacturing efficiency and very high profita-bility (return on investments, or ROI, higher than 15%), the ACIMAC Research Department’s study identified two highly successful business models. The first, which we can consid-er a “western” model typical of the best Italian and Spanish companies, fully exploits innovative automation and mecha-nisation processes to save on the labour input while at the same time maintaining very high revenues by focusing on ex-tremely high-end products. In the “western” model, high per-formance is a result of significant technological investments in industrial automation and optimisation of supply relation-ships for raw materials and above all capital goods, in many cases through optimal use of district economies of proximity. The second successful business model is the “Middle-East-ern/Asian” model consisting of highly capitalised compa-nies in good financial health, which use production technolo-gies based on highly intensive use of low to medium-cost la-bour. These companies achieve high efficiency by exploiting economies of scale and production factor sourcing as well as lean management of the inventory cycle. Both of these busi-ness models give rise to highly successful and profitable com-panies (average ROI between 17% and 30%, average added value margin between 32% and 53%, average net profits be-tween 15% and 30%), allowing them to be taken as bench-marks of excellence at an industry level. The key to the suc-cess of the “western” model lies in significant investments in capital goods and other production assets, thereby enor-mously increasing labour productivity. However, these invest-ments require a substantial input of financial resources, includ-ing those of third parties, as the financial management struc-ture is more expensive and slightly more risky. This is particu-larly true for Italy, where the degree of capitalisation is low-er on average. By contrast, the Middle-Eastern/Asian model is more exposed to international competition than the west-ern model as the companies operate in market segments with highly elastic demand (medium to low-priced tiles), which are therefore less protected from competitive pressure. But despite their differences, both of these high-performance business models for the industry guarantee shareholders a very high return on invested capital. 5
so l’ottimizzazione dei rapporti di fornitura, non solo di materie prime ma anche e soprattutto di beni strumentali, ottenuti spesso sfruttando al meglio le economie di prossimità distrettuale. Il secondo modello di business vincente è quello “mediorienta-le-asiatico”, dove la redditività è ottenuta in imprese molto capi-talizzate e in ottima salute finan-ziaria, che impiegano tecnologie produttive ad alta intensità di la-voro (a basso-medio costo), rese efficienti grazie allo sfruttamento di economie di scala, di approv-vigionamento di fattori di produ-zione e attraverso una gestione snella del ciclo delle scorte.Entrambi questi modelli di busi-ness generano imprese estrema-mente virtuose e profittevoli (ROI medio fra 17% e 30%; Valore ag-giunto/fatturato medio fra 32% e 53%; Utile netto medio fra 15% e 30%), meritevoli quindi di co-stituire dei benchmark di eccel-lenza a livello di settore. La chiave del successo del mo-dello “occidentale” sta dunque in significativi processi di investi-mento in beni strumentali ed altri assets produttivi, con ciò accre-scendo enormemente la produt-tività del lavoro. Tali investimen-ti, tuttavia, richiedono un ingen-te impegno di mezzi di finanzia-mento, anche di terzi, cosicché la struttura della gestione finan-ziaria è più onerosa e leggermen-te più rischiosa. Questo è parti-colarmente vero per l’Italia, dove il grado di capitalizzazione è me-diamente inferiore. In contropartita il modello medio-rientale-asiatico è più esposto al-la concorrenza internazionale, ri-spetto a quello occidentale, poi-ché le imprese si posizionano su segmenti di mercato ad alta ela-sticità della domanda (le piastrel-le di prezzo medio-basso), quin-di, meno protetti dalla pressione concorrenziale. Anche nelle loro differenze, comunque, entram-bi i modelli di business di eccel-lenza per il settore riescono a ga-rantire agli shareholder un’eleva-tissima remunerazione del capi-tale investito.
5
ne degli impieghi risulta in di-minuzione, dal livello di 0,85 del 2014. Dal punto di vista de-gli indicatori economico-fi-nanziari, occorre sottoline-are come il rapporto fra mez-zi propri e mezzi di terzi (Leve-rage), cashflow, la durata del ciclo attivo ed il grado di co-pertura degli interessi passi-vi (settorialmente basso) siano tutti di gran lunga migliori ri-spetto a quelli riscontrabili in Spagna e in Italia, sebbe-ne le imprese italiane presenti-no un più elevato grado di co-pertura reddituale (EBIT) de-gli interessi passivi. Le impre-se asiatiche continuano quindi, anche nel 2015, a configurar-si come concorrenti molto pro-fittevoli ed efficienti, seppu-re tendenzialmente segmenta-ti su porzioni di mercato (il low cost, appunto) nei quali le im-prese spagnole (e a maggior ragione le italiane) non sono concorrenti diretti.
❱ Piastrelle ceramiche: i due modelli di business più virtuosi
Il settore di produzione di pia-strelle ceramiche presenta, a li-vello globale, due modelli di as-soluta eccellenza: esaminando le sole imprese con elevatissi-ma efficienza tecnologico-pro-duttiva ed altissima redditivi-tà (con redditività del capita-le investito, ROI, superiore al 15%), l’analisi del Centro Stu-di ACIMAC ha evidenziato due modelli di business “vincenti”. Il primo, che potremmo defini-re “occidentale”, caratteristi-co delle migliori imprese italia-ne e spagnole, sfrutta al me-glio i processi di innovazione nell’automazione e meccaniz-zazione che consentono di ri-sparmiare input lavoro, mante-nendo allo stesso tempo alti i ricavi attraverso la segmenta-zione in produzioni di altissima gamma. Nel modello “occiden-tale” l’eccellenza viene conse-guita attraverso significativi in-vestimenti tecnologici in auto-mazione industriale e attraver-
INTER SER: serving 22 of the 25 leaders in ceramic manufacturing across the worldBased in Italy (Sassuolo and Vercelli) - Interser.it