2015€¦ · digital highlights in q3 2015 insights & data digital customer experience/ mobile...
TRANSCRIPT

Q3 Revenues
2015
Paris • October 29th, 2015

Paul HERMELIN

€3,036M revenue+17.2% current growth
Bookings growth +20% YoY, incl. IGATE
54% of the workforce in Global
production centersIncluding 85,000 employees in India
IGATE integration on-track First joint wins, IGATE performance as expected
A solid execution of our strategy
21% SMAC revenue growth in Q3 YoY
20% of Group revenue

Group momentum sustained
Improvement inEurope
• Dynamic UK private sector with 8.0% organic growth YoY
• France (+2.0% organic) and Benelux (+0.6% organic) are back to growth
• Rest of Continental Europe growing at 10.4% organically YoY
Broad-based growth in North America
• Overall growth at 5.2% organically
• Traction in FS, CPRDT, MALS, PS and TME
• Strong project activities
Fast growing sectors
CPRDT
• +9.9% organic growth YoY
• Traction in France, North America, Nordics and Benelux
FS
• Second growth engine with +7.8% organic growth YoY
Buoyant Digital and Cloud market
• Launch of our “Cloud choice” offer with a focus on workload migration, SaaS and cloud-native Apps development
• Cybersecurity bookings growth above 75% YTD

Digital highlights in Q3 2015
Insights & DataDigital Customer Experience/Mobile solutions
Sectorial digital expertise
Cloud/Security
• Key deals
•Innovation Award
for Financial Services
at Dreamforce 2015
•Odigo solution: Leader in
Gartner's magic quadrant for
Contact Center as a Service
in Western Europe
• Key deals
• Partner award in the
Enterprise Intelligence
category
• Enablement Partner of the
year
• Key deals
• Sole distribution partnership
in France
• Partner agreement to deliver
Cyber security services to
Enterprise market
•16th Annual Cars Online Report published• Key deals
• Key deal
• Key deals
Connected cars
Digital Supply Chain
Energy Utilities
Car manufacturer
EuropeanBank

IGATE integration on-track
Coordinated go-to-market
pushing all disciplines
Stronger vertical as a new
model
Further globalize
our FS business
Improved profitability by
leveraging IGATE model
Increased Account centricity
Accelerate
transformation of
non FS business
Push industrialization, further
harmonize processes
Greater client responsibility
Support the innovation agenda
Put India at the
heart of the
Group
Strategic expansion
of footprint
Integrated account management
1st joint wins
Cross staffing of capabilities
IGATE executives appointed at key positions as of January 1st
...leading to first successesA Transformational integration...
Build on ITOPS
momentum
Building a new unit called
“Business services” leveraging
ITOPS and BPO offers
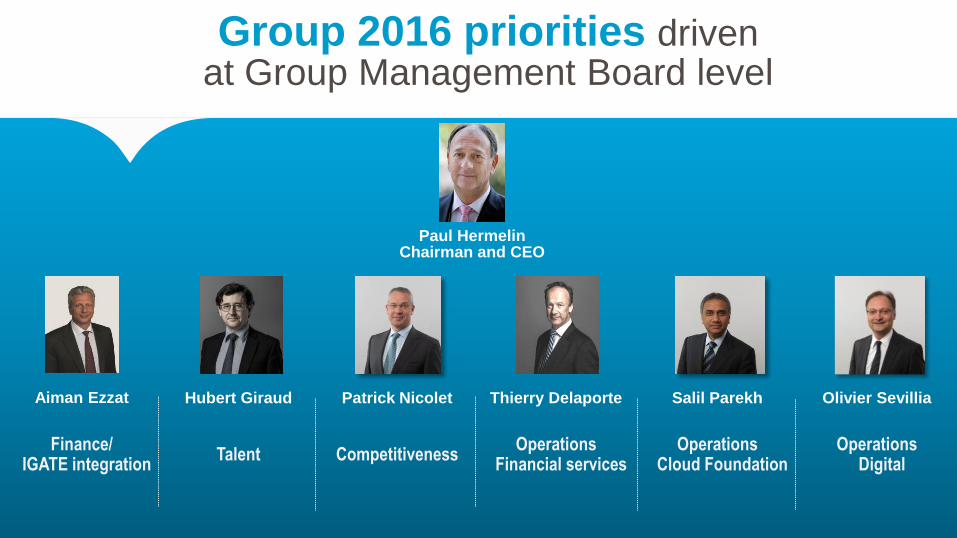
Group 2016 priorities drivenat Group Management Board level
Olivier SevilliaSalil ParekhPatrick Nicolet Thierry DelaporteAiman Ezzat
Paul HermelinChairman and CEO
Hubert Giraud
Finance/IGATE integration
Talent CompetitivenessOperations
Financial servicesOperations
Cloud FoundationOperations
Digital

2015 Full Year guidance confirmed
Current revenue growth of 12%
Operating margin of 10.3%
> €600M organic free cash flow

AimanEZZAT

10 Copyright © 2015. All rights reserved
Revenues Quarterly Evolution
Current growth
+17.2% YoY
+2.3% +3.0% +2.8% +5.5% +1.5% +1.3% +1.5%
Revenues
Currentgrowth
YoY
Organicgrowth
YoY
+0.2%
+2.7%
+5.7%
+10.4% +10.5%+9.3%
+17.2%
Q1'14 Q2'14 Q3'14 Q4'14 Q1'15 Q2'15 Q3'15
2,503M€
2,601M€
2,591M€
2,877M€
2,764M€
2,844M€
3,036M€

11 Copyright © 2015. All rights reserved
Q3 2015 Revenues by Main Geography
NorthAmerica
FranceUK &
Ireland
Rest of Europe
Benelux
APAC & LATAM
Current
Q3'14 Q3'15Q3'15 /
Q3'14
H1'15 /
H1'14
Q3'15 /
Q3'14
North America 572 937 +63.8% +11.8% +5.2%
UK & Ireland 540 551 +2.1% -15.4% -11.0%
France 560 574 +2.5% -0.0% +2.0%
Benelux 256 259 +1.1% +0.4% +0.6%
Rest of Europe 425 478 +12.5% +5.7% +10.4%
APAC & LATAM 238 237 -0.4% +15.5% +3.7%
TOTAL 2,591 3,036 +17.2% +1.4% +1.5%
Year-on-Year
in M€ Organic
31%
19%18%
16%
9%8%

12 Copyright © 2015. All rights reserved
60%22%
14%4%
Q3 2015 Revenues by Business
Consulting Services
Application Services
Local Professional
Services
Other Managed Services
H1'15 / H1'14 Q3'15 / Q3'14
Consulting Services +4.4% +6.7%
Local Professional Services +0.5% +1.4%
Application Services +5.1% +8.2%
Other Managed Services -6.7% -13.7%
TOTAL +1.4% +1.5%
Organic Year-on-Year

13 Copyright © 2015. All rights reserved
Q3 2015 Revenues by Sector
Telecom, Media
& Entertainment
Financial
Services
Others
Energy, Utilities
& Chemicals
Manufacturing,
Automotive
& Life Sciences
Consumer Product,
Retail,
Distribution and
Transportation
Public
Sector
26%
18%
17%
16%
13%
7%3%
H1'15 / H1'14 Q3'15 / Q3'14
Financial Services +10.8% +7.8%
Energy, Utilities & Chemicals +6.4% -1.8%
Manufacturing, Automotive & Life Sciences +1.6% +3.4%
Consumer Product, Retail, Distribution & Transportation +10.3% +9.9%
Public Sector -14.3% -10.0%
Telecom, Media & Entertainment -1.5% -1.4%
TOTAL +1.4% +1.5%
Organic Year-on-Year

14 Copyright © 2015. All rights reserved
Bookings Evolution
in M€(at av. Q3’2015 rates)
(1)
(1) Of which €1bn from Areva 10 year
contract
2,431
3,586
2,083
3,458
2,680 2,603 2,499
Q1'14 Q2'14 Q3'14 Q4'14 Q1'15 Q2'15 Q3'15

15 Copyright © 2015. All rights reserved
143,643
+29,936+4,466
178,045
Dec. 2014 Net variationoffshore
Net variationonshore
Sep. 2015
Headcount Evolution
Workforce in global
production centers:
>96,000
+49%
YoY
Attrition YTD Sep.14 Sep. 15Year-on-Year
variation
Consulting Services 21.0% 21.6% +0.6pts
Local Professional Services 14.8% 17.4% +2.6pts
Application Services 17.7% 19.1% +1.4pts
Other Managed Services 20.0% 23.0% +3.0pts
TOTAL 17.7% 19.7% +2.0pts
+24%
54%of total

Appendix
17 Copyright © 2015. All rights reserved
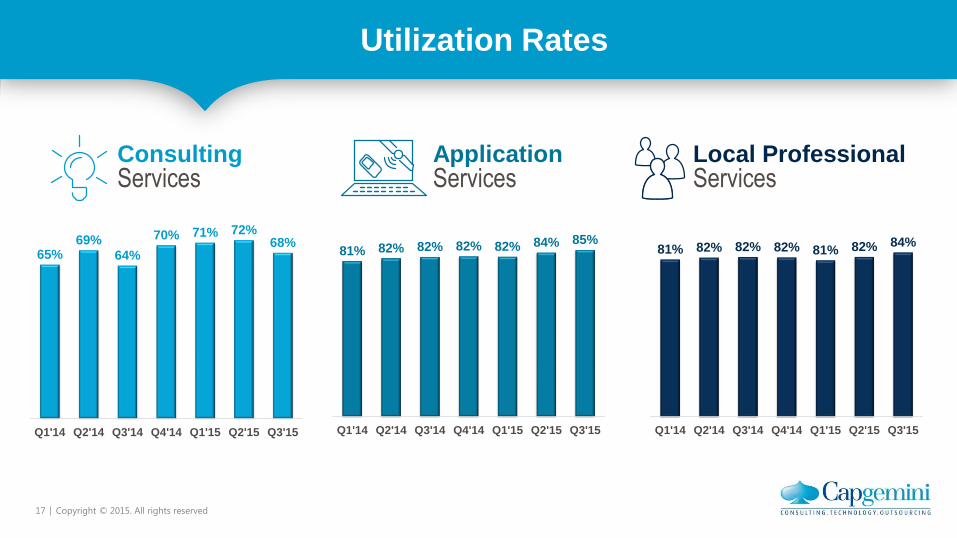
Utilization Rates
ConsultingServices
ApplicationServices
Local Professional Services
65%69%
64%
70% 71% 72%68%
Q1'14 Q2'14 Q3'14 Q4'14 Q1'15 Q2'15 Q3'15
81% 82% 82% 82% 82% 84% 85%
Q1'14 Q2'14 Q3'14 Q4'14 Q1'15 Q2'15 Q3'15
81% 82% 82% 82% 81% 82% 84%
Q1'14 Q2'14 Q3'14 Q4'14 Q1'15 Q2'15 Q3'15

18 Copyright © 2015. All rights reserved
Revenues Quarterly Evolution
Q1'14 Q2'14 Q3'14 Q4'14 Q1'15 Q2'15 Q3'15
In M€ 2,503 2,601 2,591 2,877 2,764 2,844 3,036
Sequential current growth -4.0% +3.9% -0.4% +11.1% -3.9% +2.9% +6.8%
Sequential organic growth -3.6% +1.9% -2.5% +10.0% -7.3% +1.9% -2.3%
Year-on-Year current growth +0.2% +2.7% +5.7% +10.4% +10.5% +9.3% +17.2%
Year-on-Year organic growth +2.3% +3.0% +2.8% +5.5% +1.5% +1.3% +1.5%

19 Copyright © 2015. All rights reserved
31%
19%18%
16%
9%
8%
Q3 2015 Revenues by Main Geography
NorthAmerica
FranceUK &
Ireland
Rest of Europe
Benelux
APAC & LATAM
Current Organic Current Organic
In M€ Q3'14 Q2'15 Q3'15Q3'15 /
Q2'15
Q3'15 /
Q2'15
Q3'15 /
Q3'14
Q3'15 /
Q3'14
North America 572 737 937 +27.2% -3.1% +63.8% +5.2%
UK & Ireland 540 523 551 +5.4% +0.4% +2.1% -11.0%
France 560 595 574 -3.5% -3.9% +2.5% +2.0%
Benelux 256 264 259 -2.2% -2.6% +1.1% +0.6%
Rest of Europe 425 493 478 -3.0% -4.8% +12.5% +10.4%
APAC & LATAM 238 232 237 +2.1% +4.1% -0.4% +3.7%
TOTAL 2,591 2,844 3,036 +6.8% -2.3% +17.2% +1.5%
Sequential Year-on-Year