©2015 apigee corp. all rights reserved. preserving signal in customer journeys joy thomas, apigee...
TRANSCRIPT
©2015 Apigee Corp. All Rights Reserved.
Preserving signal in customer journeysJoy Thomas, ApigeeJagdish Chand, Visa

©2015 Apigee Corp. All Rights Reserved. 2
Overview
• Customers journeys and event data• Customer Behavior Graph• Queries on Behavior Graphs• Predictive models on behavior graphs

© 2014 Apigee Confidential – All Rights Reserved
Customer View: A journey
3
Consumers interact with enterprises through multiple channels at multiple points of time
Each of these interactions is an event with a timestamp and the sequence of interactions is important

© 2014 Apigee Confidential – All Rights Reserved 4
A graphical structure can identify common interactions and influences
Common Interactions & InfluencesCustomer Journey

Customer behavior graphs vs. social graphs
5
Behavior Graph• Sequence of events:
– Actions experienced and taken
Social Graph• Links between people & activities
– At a point in time
Behavior graph
Social graph
©2015 Apigee Corp. All Rights Reserved.
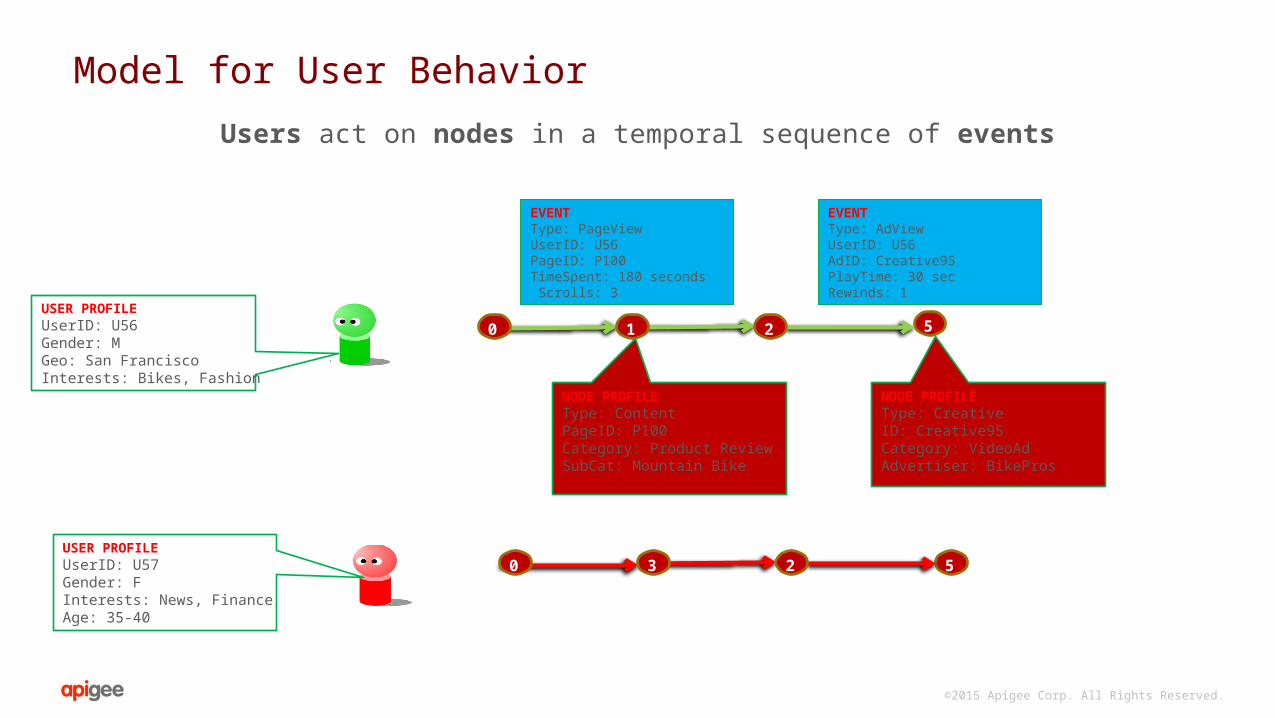
Model for User Behavior
Users act on nodes in a temporal sequence of events
1
3 52
2 50
0
USER PROFILEUserID: U56Gender: MGeo: San FranciscoInterests: Bikes, Fashion
USER PROFILEUserID: U57Gender: FInterests: News, FinanceAge: 35-40
NODE PROFILEType: ContentPageID: P100Category: Product ReviewSubCat: Mountain Bike
NODE PROFILEType: CreativeID: Creative95Category: VideoAdAdvertiser: BikePros
EVENTType: PageViewUserID: U56PageID: P100TimeSpent: 180 seconds Scrolls: 3
EVENTType: AdViewUserID: U56AdID: Creative95PlayTime: 30 secRewinds: 1

©2015 Apigee Corp. All Rights Reserved.
Aggregated Behavior Graph (ABG)
0
1
2
3
5
0
1
3 52
2 5Impressions: 1TimeSpent: 20Clicks: 1
0
0Impressions: 4TimeSpent: 10Clicks: 0
Impressions: 5TimeSpent: 30Clicks: 1
Combine
Characteristics
• Represents flow & behavior of all users
• Automated construction from event streams
• Information preserving• Aggregated representation• Permits drill-down
• Useful for reasoning about customer flows• Count unique users at node/edge• Aggregate metrics at nodes/edges• Measure drop-offs on a path (funnel)• Profile traffic at a node or edge• Analyze flows for user segments

©2015 Apigee Corp. All Rights Reserved. 8
Examples of queries on Behavior Graph
• Count the number of users who went from A -> B -> C -> D
• Find the distribution of (Age, Gender) for the people who took the path P-> Q ->R
• Of all the females in California who went from C to D, what are the most likely nodes that they are likely to visit next
• Of the people who bought a computer 3 months ago and received an email offer for a discounted printer 1 month ago, what fraction of them have bought printers in the last month
• All these queries would be painful to express in SQL on a large event table
©2015 Apigee Corp. All Rights Reserved. 9
Predictive Analytics on Behavior Graphs
Past behavior of consumers is the best predictor of future actions
• The behavior graph allows one to search for patterns of consumer behavior that are correlated with responses of interest
• Using the patterns we can build a Bayesian model to predict what users will do next
• Use the predictive model for recommendations, targeting and churn prediction

©2015 Apigee Corp. All Rights Reserved. 10
Comparison with other Machine Learning algorithms • Most machine learning algorithms assume that the training
data for a learning algorithm is in a form of a large table of examples, with responses in one column, and features in other columns, e.g. Logistic Regression, Random Forest, etc.
• These algorithms are designed for profile attributes such as age, gender, country, etc.
• To handle event data, the data scientist typically creates aggregate features out of the event data (e.g. total purchases over the last year, total purchases over the last month, etc.)
• The behavior graph allows the data scientist to automatically search over a large space of aggregates to use in the predictive model

©2015 Apigee Corp. All Rights Reserved. 11
Summary
• Event data should be treated differently from profile data
• A graphical data structure designed for event data can efficiently answer queries on event based patterns
• Event based patterns can be used to build predictive models for targeting, recommendations and churn prediction
• There is a need for a common query language to express queries for event data

Thank you