2015 annual report - edizione · the end of 2014 saw the completion of the activities set out in...
TRANSCRIPT

2015 ANNUAL REPORT


2015 ANNUAL REPORT

II
Portugal - Lisbon

III
TEXTILES & CLOTHING

IV
Messico - AntaraYarns

V
Mexico - Antara

VI
Indonesia - Bali

VII
FOOD & BEVERAGE

VIII
Finland - Helsinki

IX
Italy - Roma Fiumicino

X
Italy - A1 motorway - Variante di Valico

XI
INFRASTRUCTURES & SERVICES FOR MOBILITY

XII
Italy - Roma Fiumicino airport

XIII
Chile - Costanera Norte motorway

XIV
Moscow

XV
REAL ESTATE

XVI
Paris

XVII
Lisbon


CONTENTS
GROUP KEY DATA 2 Parent Company Officers 2 Group structure 3 Investment philosophy 3 Group chart 4 Financial highlights 5
DIRECTORS' REPORT 7 Main events in 2015 8 Analysis of the consolidated financial statements 12 Performance by business segment 15 Additional information 30 Significant events following the end of the financial year 30 Outlook for 2016 30
CONSOLIDATED FINANCIAL STATEMENTS AT DECEMBER 31, 2015 33 Consolidated statement of financial position 34 Consolidated income statement 36 Consolidated statement of comprehensive income 37 Consolidated statement of changes in equity 38 Consolidated cash flow statement 39 Notes to the consolidated financial statements 39 Notes on assets items 56 Notes on shareholders' equity items 74 Notes on liabilities items 77 Notes on income statement items 86 Additional information 96
ANNEXES 115 List of consolidated companies at December 31, 2015 115 Report of the independent auditors 123
2 GROUP KEY DATA
GROUP KEY DATA
PARENT COMPANY OFFICERS BOARD OF DIRECTORS Gilberto Benetton CHAIRMAN Carlo Benetton DEPUTY CHAIRMEN Gianni Mion Giuliana Benetton DIRECTORS Luciano Benetton Alessandro Benetton Franca Bertagnin Benetton Massimo Benetton Sabrina Benetton Fabio Cerchiai Giovanni Costa GENERAL MANAGER Carlo Bertazzo BOARD OF STATUTORY AUDITORS Angelo Casò CHAIRMAN Giovanni Pietro Cunial AUDITORS Aldo Laghi Alberto Giussani ALTERNATE AUDITORS Maria Martellini INDEPENDENT AUDITORS Deloitte & Touche S.p.A.

GROUP KEY DATA 3
GROUP STRUCTURE At December 31, 2015 the company Edizione S.r.l., fully owned by the Benetton family, held equity investments in the following industries: Textile & clothing, Food & beverage, Infrastructures & services for mobility, Real estate & agriculture.
INVESTMENT PHILOSOPHY Edizione is an active investor that combines an entrepreneurial approach with solid financial discipline, putting finance at its companies’ service in order to improve their competitive position and returns. Edizione aims to develop its investments over the long term and to help its holdings expand by strengthening their presence in their respective sectors. This goal can also be pursued through acquisitions, which leverage global relationships built over the years. Edizione maintains an ongoing dialogue with the managers of its holdings, while fully respecting their autonomy.

4 GROUP KEY DATA
GROUP CHART The Group structure at December 31, 2015 was as follows:
Edizione S.r.l.
100% Benetton Group S.r.l.
100% Maccarese 95%
Cia De Tierras (1)
100% Edizione Property
100% Schema34 50.10%
Autogrill
0.94% Assicurazioni Generali
2.00% Il Sole 24 Ore
2.16% Mediobanca
2.24% Caltagirone Editore
0.21% Hermès
0.13% Lbrands
32.71% Eurostazioni 40%
Grandi Stazioni
95.92% Aeroporti di Roma
100% Autostrade per l’Italia
100% Sintonia 30.25%
Atlantia
Textiles & Clothing
Food & beverage
Infrastructure and services for mobility
Real estate and agricolture
Other
(1) The remaining 5% stake is held directly by Edizione S.r.l. Listed companies
100% Olimpias Group S.r.l.

GROUP KEY DATA 5
FINANCIAL HIGHLIGHTS The Group’s results in 2015 and 2014, stated according to the International Financial Reporting Standards (IAS/IFRS) and audited by Deloitte & Touche S.p.A. for 2015 and by KPMG S.p.A. for 2014, are summarised below.
(Millions of Euro) 2015 2014
Revenues 11,445 10,900
Ebitda (*) 3,766 3,624
Operating result 2,490 2,004
Net income, Group 1,598 136
Net working capital (806) (923)
Net assets held for sale - 605
Intangible assets, property, plant and equipment 24,689 24,828
Non-current financial assets 1,183 924
Other non-current assets/(liabilities), net (1,791) (1,716)
Total non-current assets 24,081 24,036
Net capital employed 23,275 23,718
Shareholders’ equity, Group 6,406 5,040
Non-controlling interests 6,731 7,045
Total shareholders’ equity 13,137 12,085
Net financial position 10,138 11,633
Cash flow (**) 3,631 2,327
Net income, Group/Shareholders' equity (ROE) 25.0% 2.7%
Operating result/Capital employed (ROI) 10.7% 8.4% (*) Ebitda: calculated as Operating result plus depreciation, amortisation, impairment and provisions. (**) Cash Flow: calculated as Net income before minority interests plus depreciation, amortisation, impairment and provisions.
To fully appreciate the Group’s results and financial situation, the variety of its business segments must be considered, as described in detail in the following pages.

6 GROUP KEY DATA

DIRECTORS' REPORT 7
DIRECTORS' REPORT

8 DIRECTORS' REPORT
Dear Shareholders, The Group's share of net income in 2015 comes to Euro 1,598 million, compared to Euro 136 million in the previous year. The capital gain was realized, in the year under review, from the sale of the equity investment in World Duty Free S.p.A. (Euro 1,060 million). The Group's international scope and diversified business segments allowed it to gain ground in both revenues (+5.0%) and Ebitda (3.9%). At December 31, 2015, consolidated shareholders' equity stood at Euro 13,137 million (Euro 12,084 million the previous year) and net financial indebtedness at Euro 10,138 million, an improvement of Euro 1,495 million since the previous year (Euro 11,633 million).
MAIN EVENTS IN 2015
TEXTILES & CLOTHING
Benetton Group The financial statements for the year ended December 31, 2015 show the final results of the first year of commercial operations only (marketing and sales), separated from the industrial and real estate business at the end of 2014. From 2015, Benetton Group started to operate on the basis of the new scope of the group, defined in 2014 as a result of a thorough refocusing and streamlining process in terms of brands, markets and distribution network, which leveraged the distinctive "United Colors of Benetton" and "Sisley" brands, the company's two main assets, and their unique value in the global textile and clothing industry. In 2015, the company laid the foundations for its future growth, by: ! revising brand positioning with a progressive differentiation of the characteristics of United Colors of
Benetton and Sisley; ! updating the business model to make it more suitable to changing market and competition conditions; ! implementing actions to reorganise the company's structural components: people, organisation, processes
and systems.
The main elements to be highlighted in this respect are: human resources and organisation, product, sales channels, store model, supply chain and systems.
Olimpias Group The end of 2014 saw the completion of the activities set out in the Benetton group's reorganisation plan, as a result of which the clothing production business under the Benetton and Sisley brands was transferred to Olimpias Group S.r.l., which until that time had only managed the textile production business (yarns, fabrics and accessories). In its new configuration, the Olimpias Group operates in the clothing and textile production sector. In the clothing industry, the group is an important player in the Mediterranean region in the production of all types of apparel (about 53 million pieces in 2015). In 2015, it reported revenues of Euro 332 million (with Benetton alone), operating through its production platforms located in Europe (Croatia, Serbia, Romania, Hungary and Italy) and in Tunisia. In the textile industry, the group operates with production units in Italy in the Yarns, Fabrics, and Accessories segments, each of which independently designs and develops its own products, defines collections, and selects

DIRECTORS' REPORT 9
and plans purchases and production. In 2015, the textile segment achieved sales revenues of Euro 61 million, of which Euro 16 million to Benetton. In 2015, Olimpias Group S.r.l. started a process to reorganise and integrate operations with the foreign subsidiaries in order to optimise available resources and implement planning and management of the entire supply chain. Activities have been started and partially completed to decentralise and assign roles and responsibilities with regard to product development, timing and methods, procurement and production planning at our foreign platforms. The industrial rationalisation process in the knitwear segment was also completed in mid-2015, with the closure of the factory in Labin, Croatia, the sale of the plant to third parties and the transfer of the equipment to the sites located in Nis, Serbia and Osijek, Croatia. In 2015, the "Olimpias Kidswear" clothing business unit, a brand intended for third party customers, was sold to an Italian industry player. As part of the approved reorganisation plan, in 2016 the Olimpias group will continue to implement all the actions that will enable it to move closer to the goal of a complete organisational and operational separation of the clothing segment, expected to be completed by the second half of 2017. As a result of this demerger, already starting from the current year the Olimpias group will be able to offer its production capacity in the clothing industry also to third party customers other than the Benetton group.
FOOD & BEVERAGE
Autogrill 2015 was characterised by sustained growth in passenger traffic in airports and a recovery in motorway traffic in all the main geographical regions in which the Autogrill group operates. Global passenger traffic at airports increased by 6.1%, recording the highest growth rate since 2010. Growth was significant in North America (up 5.6%) and Europe (up 5%), and was particularly sustained in Middle East airports (up 11.3%). As to the motorway segment, traffic in Italy increased by a total of about 3.6%, thanks to the early signs of a recovery of the national economy and reduced fuel prices. In the United States, the traffic increased by approximately 3.3% compared to 2014.
INFRASTRUCTURE & SERVICES FOR MOBILITY
Atlantia In 2015, the Atlantia group continued its plan for the modernisation and expansion of the motorway and airport infrastructure, with investments of approximately Euro 1.5 billion. In Italy, 2015 was the year of the opening of the A1 Motorway Variante di Valico deviation: the project is a symbol of Autostrade per l'Italia's investment plan. With about 59 km of motorway development (32 km of which on the new Variante deviation), 41 new tunnels and 41 new viaducts, Variante di Valico is one of the most important infrastructures built in Europe in the past 20 years, comparable for excavation volumes and construction complexity to the Channel Tunnel and the Gotthard Tunnel. An example of Italy's technological primacy, the project has resolved one of the main bottlenecks of the national infrastructure system, with significant benefits in terms of increased safety and lower travel times for traffic flows.

10 DIRECTORS' REPORT
On the group's Italian motorway network, traffic volumes grew by 3.0%, while in 2015 the network of foreign motorway concessionaires recorded an overall growth of traffic of +1.9%, despite lower mobility growth rates in Brazil due to a slowdown in the local economy. 2015 also saw a sharp acceleration in investments by Aeroporti di Roma (the group's other major asset), amounting to Euro 335 million (almost doubled compared to 2014). The main projects executed in Fiumicino included the completion of improvements on Runway 3, while work is underway to complete the piers, the new boarding areas E/F and the forepart of Terminal 3. In 2015, the Fiumicino and Ciampino airports operated by Aeroporti di Roma broke a new traffic record with more than 46 million passengers, up by 6.1% on the previous year. This result is particularly significant as it was achieved despite the limited operational capacity of the Fiumicino airport in the period from May 7 to July 18, 2015, as a result of a fire in Terminal 3. The airport's connectivity has also been improved: with the opening of new intercontinental routes, particularly to the Far East, the Rome Fiumicino hub is today, along with Paris, China's gateway to Europe.
REAL ESTATE
Edizione Property Edizione Property S.p.A. (formerly Schematrentanove S.p.A.), was the parent company of the Benetton group until the end of 2014, when the Benetton group approved a new strategic plan that resulted in the separation of the commercial, industrial and real estate business into three distinct legal entities. Following this demerger, from January 1, 2015 Edizione Property has become the parent company of the real estate business, consisting of a portfolio of 85 properties in 16 countries worldwide. In order to further rationalise and simplify the group's legal and corporate structure, on December 1, 2015 the companies Immobiliare Italia S.r.l., Realty Capri S.r.l. and Edizione Property S.p.A. were merged by incorporation into Schematrentanove S.p.A. On the same date, the parent company changed its name from Schematrentanove S.p.A. to Edizione Property S.p.A.
HOLDING COMPANIES
The Parent Company ! On February 20, 2015 Edizione sold its 2.2% interest and convertible OCEANE bonds of Club Méditerranée,
participating in the tender offer launched on January 22, 2015 by Gaillon Invest II. The proceeds came to Euro 20.2 million, for a capital gain of Euro 12.3 million with respect to the carrying amount.
! In October 2015, Edizione participated in a tender offer on Pirelli & C. S.p.A. at Euro 15 per share, earning a total of Euro 112.3 million and realising a capital gain of Euro 31.3 million.
! On November 27, 2015, Edizione subscribed 100% of the shares of the Luxembourg-based Quaestio Opportunity Fund, amounting to Euro 500 million, with the aim to achieve a more efficient management of part of the liquidity.
! In November and December 2015, Edizione acquired minority stakes in high-cap listed foreign companies. At December 31, 2015, a total of Euro 106 million were invested, of which Euro 72 million in French-based Hermes (0.21% of the capital) and Euro 34 million in US-based Lbrands-Victoria's Secret (0.13%).
Sintonia S.p.A. ! June 16, 2015 was the effective date of the partial non-proportional demerger of Sintonia, as a result of
which a portion of the company's assets and liabilities has been assigned to three beneficiaries wholly

DIRECTORS' REPORT 11
owned (one for each) by the company's shareholders other than Edizione S.r.l., which has remained the sole shareholder of Sintonia after the demerger. The remaining portion of the investment in Atlantia held by the company is 30.25%.
Schematrentaquattro S.p.A. ! On August 7, 2015, Schematrentaquattro closed the sale of the entire holding in World Duty Free S.p.A.,
representing 50.1% of the share capital, to Dufry Financial Services B.V., a wholly owned subsidiary of Dufry AG. With a sales price of Euro 10.25 per share, the company received a total of Euro 1,307 million, realising a capital gain of Euro 415.9 million. The consolidated gain was just above Euro 1 billion.
! On October 20, 2015, following payment of the price for the tender offer on Pirelli & C. S.p.A. shares, the bond convertible into Pirelli shares issued by Schematrentaquattro in November 2013 (originally amounting to Euro 200 million) was fully repaid in advance. The capital gain realised on the originally held 3.03% investment in Pirelli amounted to Euro 41.9 million.

12 DIRECTORS' REPORT
ANALYSIS OF THE CONSOLIDATED FINANCIAL STATEMENTS The Group's key financial data for the years 2015 and 2014 are as follows:
(Millions of Euro) 2015 % 2014 %
Revenues 11,445 100 10,900 100
Materials and subcontracted work (2,906) (25.4) (2,933) (26.9)
Payroll costs (2,608) (22.8) (2,380) (21.8)
Other costs and general expenses, net (2,165) (18.9) (1,964) (18.0)
Ebitda 3,766 32.9 3,624 33.2
Depreciation, amortization, impairments and provisions (1,276) (11.1) (1,620) (14.9)
Operating result (Ebit) 2,490 21.8 2,004 18.4
Net financial income/(charges) (817) (7.1) (782) (7.2)
Income/(losses) from equity investments 184 1.6 6 0.1 Income/(charges) from currency hedges and exchange differences (25) (0.2) (24) (0.2)
Income before taxes and non-controlling interests 1,832 16.0 1,204 11.0
Income taxes (531) (4.6) (603) (5.5)
Profit/(loss) from continuing operations 1,301 11.4 601 5.5 Profit/(loss) from assets held for sale and discontinued operations 1,054 9.2 106 1.0
Non-controlling interests (757) (6.6) (571) (5.2)
Net income, Group 1,598 14.0 136 1.2 Group revenues increased by Euro 545 million (+5.0%), due to contributions from the Food & beverage and the Infrastructure and services for mobility segments. Revenues are broken down below by business segment (net of intercompany sales): (Millions of Euro) 2015 % 2014 %
Food & beverage 4,838 42.3 4,461 40.9
Infrastructures and services for mobility 4,968 43.4 4,763 43.7
Textile & clothing 1,594 13.9 1,633 15.0
Other 45 0.4 43 0.4
Total 11,445 100 10,900 100 The following table shows revenues by geographical area: (Millions of Euro) 2015 % 2014 %
Italy 6,515 56.9 6,459 59.3
Rest of Europe 1,712 15.0 1,661 15.2
Americas 2,807 24.5 2,416 22.2
Rest of the world 411 3.6 364 3.3
Total 11,445 100 10,900 100 Ebitda and Ebit grew by Euro 142 million and Euro 486 million, respectively. In particular, Ebit was positively influenced by changes in provisions for the Infrastructure and services for mobility business. Net financial charges came to Euro 817 million in 2015, up from Euro 782 million in 2014.

DIRECTORS' REPORT 13
In 2015, Income/(losses) from equity investments showed a positive balance of Euro 184 million and mainly benefited from a capital gain from the sale of investments in Pirelli & C. S.p.A. The item is shown net of equity investment write-downs. Income taxes for 2015 came to Euro 531 million, down by Euro 72 million compared to the previous year. As a result of the above, Profit from continuing operations was Euro 1,301 million, increased by Euro 700 million over 2014. Profit/(loss) from discontinued operations stood at Euro 1,054 million, including a capital gain realised from the sale of the equity investment in World Duty Free S.p.A. (Euro 1,060 million). The Group's share of net income amounts to Euro 1,598 million, compared to Euro 136 million in 2014.

14 DIRECTORS' REPORT
Financial situation The Group’s main financial figures at December 31, 2015 and 2014, duly restated, are as follows: (Millions of Euro) 12.31.2015 % 12.31.2014 %
Net working capital:
– inventories 605 2.6 611 2.6
– receivables, accrued income and prepaid expenses 2,310 9.9 2,262 9.5
– payables, accrued expenses and prepaid income (3,721) (16.0) (3,796) (16.0)
Net working capital (806) (3.5) (923) (3.9)
Net assets held for sale - - 605 2.6
Non-current assets:
– intangible assets 6,468 27.8 6,786 28.6
– concession rights, net 16,180 69.5 16,029 67.6
– property, plant and equipment 2,041 8.8 2,013 8.5
– non-current financial assets 1,183 5.1 924 3.9
– other non-current assets/(liabilities), net (1,791) (7.7) (1,716) (7.2)
Non-current assets 24,081 103.5 24,036 101.3
Net capital employed 23,275 100 23,718 100
– Shareholders’ equity, Group 6,406 27.5 5,040 21.2
– Non-controlling interests 6,731 28.9 7,045 29.7
Total shareholders’ equity 13,137 56.4 12,085 51.0
Net financial indebtedness 10,138 43.6 11,633 49.0
Sources of funding 23,275 100 23,718 100 Net financial indebtedness improved by Euro 1,495 million on the previous year (Euro 11,633 million). A breakdown of net financial indebtedness is presented below:
(Millions of Euro) 12.31.2015 12.31.2014
Edizione S.r.l. (21) 36
Schematrentaquattro S.p.A. 921 (157)
Sintonia S.p.A. 8 (142)
Benetton group (1) 85 (137)
Olimpias group 48 -
Edizione Property group (124) -
Autogrill group (644) (693)
Atlantia group (10,387) (10,528)
Other companies (25) (12)
Net financial position (10,138) (11,633) (1) At December 31, 2014 (before the January 1, 2015 demerger), the Benetton group included, in addition to the core component
(trademarks, products, marketing, sales and retail) also real estate assets (now in the Edizione Property group) and the manufacturing business (now in the Olimpias group).

DIRECTORS' REPORT 15
PERFORMANCE BY BUSINESS SEGMENT The performance of the main Group companies is discussed below by business segment. The 2015 and 2014 results of the groups related to the segments in which the Group operates are stated in accordance with the International Financial Reporting Standards (IAS/IFRS) in effect as of the reporting date. The implementation of the Benetton group's 2015-2017 focus plan also resulted in the split-off from January 1, 2015 of the commercial, industrial and real estate business into three distinct, stand-alone groups. The consolidated financial statements of Benetton Group S.r.l., Olimpias Group S.r.l. and Edizione Property S.p.A. for 2015 therefore present the final results of the first year of operation of the commercial, industrial and real estate business. For these three investments, the numerous corporate transactions carried out in accordance with the strategic three-year plan, mainly implemented during the second half of 2014, do not allow the comparability of 2015 results against those of the previous year. In order to identify the trends and performance of the respective businesses, the income statement for the year has been compared to 2014 pro forma data, calculated by approximating the effects of the split-off from the beginning of the previous year. The financial position is compared with the balances at January 1, 2015, when the demerger became effective. The results of the Parent Company, Sintonia S.p.A. and Schematrentaquattro S.p.A., commented below, have been derived from the financial statements prepared in accordance with national accounting standards.

16 DIRECTORS' REPORT
TEXTILES & CLOTHING
Benetton Group S.r.l. (controlling interest at 12.31.2015: 100%) The Benetton group's financial results of fiscal year 2015 and the pro forma results of 2014 are summarised below: (Millions of Euro) 2015 % 2014 pro-forma %
Revenues 1,529 100 1,547 100
Cost of sales (869) (56.8) (890) (57.5)
Gross operating profit 660 43.2 657 42.5
Sales and general expenses (451) (29.5) (503) (32.5)
Rents (132) (8.6) (133) (8.6)
Provisions for risks and charges (37) (2.4) (78) (5.0)
Depreciation and amortization (50) (3.3) (55) (3.6)
Impairments (9) (0.6) (25) (1.6)
Operating result (19) (1.2) (137) (8.9)
Income/(losses) from affiliates 4 0.3 n.a. n.a.
Net financial income/(charges) (7) (0.5) n.a. n.a.
Net foreign currency hedging gains/(losses) and exchange differences (5) (0.3) n.a. n.a.
Income before taxes and non-controlling interests (27) (1.8) n.a. n.a.
Income taxes (18) (1.2) n.a. n.a.
Non-controlling interests 1 0.1 n.a. n.a.
Net income, group (46) (3.0) n.a. n.a.
EBITDA from ordinary operations 54 40
Cash flow from operating activities 88 n.a.
Operating investments, gross 41 n.a.
12.31.2015 01.01.2015
Capital employed 631 727
Shareholders’ equity 716 760
Net financial position/(Cash) (85) (33)
Revenues The Benetton group's net revenues stood at Euro 1,529 million, down by Euro 18 million compared to the previous year's pro forma figures. At constant exchange rates, the change amounted to a negative Euro 38 million. Revenues by geographical area were as follows: (Millions of Euro) 2015 % 2014 pro-forma % Change
Italy 551 36.0 577 37.3 (26)
Rest of Europe 585 38.3 595 38.5 (10)
Asia 334 21.8 311 20.1 23
Americas 55 3.6 55 3.6 -
Rest of the world 4 0.3 9 0.6 (5)
Total 1,529 100.0 1,547 100.0 (18)

DIRECTORS' REPORT 17
Revenues by channel are shown below: (Millions of Euro) 2015 % 2014 pro-forma % Change
Indirect chanel 911 59.6 993 64.2 (82)
Direct chanel 618 40.4 554 35.8 64
Total 1,529 100.0 1,547 100.0 (18) In detail, please note that: ! in the indirect channel (shops operated by wholesale customers) revenue performance was mainly due to a
decrease in the number of shops operated by customers, some of whom transferred to the direct channel, as a result of the sales network streamlining process already started in past years;
! in the direct channel (directly operated stores) the trend shows an improvement compared to 2014 with a positive change of 11.6%, despite some closures during the period. The growth in sales revenues in this channel on a comparable basis was 6% compared to 2014.
Operating margins In 2015 the gross operating profit came to Euro 660 million or 43.2% of revenues, compared with 42.5% the previous year. Ebitda from ordinary operations was Euro 54 million, up 34.5% compared to Euro 40 million in 2014. The operating result was a negative Euro 19 million (negative Euro 137 million in 2014). These results were affected by non-recurring charges (Euro 21 million in 2015 and Euro 120 million in 2014) related to the group's refocusing and reorganisation plan. The group's share of the net result was a Euro 46 million loss.
Operating cash flow and investments The cash flow generated by operating activities (Euro 88 million) benefited from an improvement in Ebitda and from a positive cash flow generated by changes in working capital. Gross operating investments totalled Euro 41 million and were mainly aimed at supporting the development of the direct sales network and the renovation and expansion of existing stores, especially in Italy, Russia, France and Mexico, as well as the implementation of the group's IT systems.
Net Financial Position The Benetton group's net financial position is positive by Euro 85 million, from Euro 33 million at January 1, 2015.

18 DIRECTORS' REPORT
Olimpias Group S.r.l. (controlling interest at 12.31.2015: 100%) The financial results of fiscal year 2015 and the pro forma results of 2014 are summarised below: (Millions of Euro) 2015 % 2014 pro-forma %
Revenues 392.3 100 415.7 100
Cost of sales (359.9) (91.7) (378.1) (91.0)
Gross operating profit 32.4 8.3 37.6 9.0
Sales and general expenses (22.1) (5.6) (21.8) (5.2)
Provisions for risks and charges (3.0) (0.8) (1.9) (0.5)
Operating result 7.3 1.9 13.9 3.3
Net financial income/(charges) 0.2 0.1 n.a. n.a.
Net foreign currency hedging gains/(losses) and exchange differen-ces (0.1) - n.a. n.a.
Income before taxes 7.4 1.9 n.a. n.a.
Income taxes (2.6) (0.7) n.a. n.a.
Profit from discontinued operations (0.6) (0.2) n.a. n.a.
Non-controlling interests 0.6 0.2 n.a. n.a.
Net income, group 3.6 0.9 n.a. n.a.
EBITDA 22.3 28.0
Cash flow from operating activities 3.0 n.a.
Investments for the year, gross 3.4 n.a.
12.31.2015 01.01.2015
Capital employed 194.9 197.1
Shareholders’ equity 243.1 253.1
Net financial position/(Cash) (48.2) (55.9)
Revenues Revenues amounted to Euro 392.3 million, down by Euro 23.4 million or approximately 6% from 2014 (Euro 415.7 million). The decrease was mainly due to the Clothing segment. Revenues by category are detailed below: (Millions of Euro) 2015 % 2014 pro-forma % Change
Clothing 331.6 84.5 347.0 83.5 (15)
Yarns 16.6 4.2 20.0 4.8 (3)
Fabrics 39.6 10.1 43.6 10.5 (4)
Accessories 4.5 1.1 5.1 1.2 (1)
Total 392.3 100.0 415.7 100.0 (23) Sales in the Clothing segment are intended primarily for the customer Benetton group, while those intended for third parties amount to Euro 2.8 million, whereas other sales categories are entirely intended for third parties (Euro 60.7 million in 2015, compared with Euro 68.7 million in 2014). Overall, in 2015 sales revenues from third-party customers came to Euro 63.5 million.
DIRECTORS' REPORT 19
Operating margins The gross operating profit amounted to Euro 32.4 million compared to Euro 37.6 million in the previous year, with a decrease of Euro 5.2 million. 2015 Ebitda was Euro 22 million, down by Euro 6 million compared to 2014 pro forma figures 2015. Ebit came to Euro 7.3 million (Euro 13.9 million in 2014 pro forma figures). The group's share of net income amounts to Euro 3.6 million.
Net Financial Position The net financial position of Olimpias at December 31, 2015 was a positive Euro 48.2 million.

20 DIRECTORS' REPORT
FOOD & BEVERAGE
Autogrill S.p.A. (controlling interest at 12.31.2015: 50.10%) Key figures for the Autogrill group in 2015 and 2014 are shown below. (Millions of Euro) 2015 % 2014 %
Revenues 4,369.2 100 3,930.2 100
Fuel sales 469.6 10.7 531.2 13.5
Other operating income 103.0 2.4 108.9 2.8
Total revenues and income 4,941.8 113.1 4,570.3 116.3
Cost of raw materials and goods (1,832.7) (41.9) (1,813.6) (46.1)
Rents, concessions and royalties (755.0) (17.3) (668.5) (17.0)
Payroll costs (1,436.4) (32.9) (1,296.6) (33.0)
Other operating costs (541.5) (12.4) (475.4) (12.1)
Ebitda 376.2 8.6 316.2 8.0
Depreciation and amortization (211.6) (4.8) (187.5) (4.8) Impairment losses on property, plant and equipment and intangible assets (12.7) (0.3) (10.1) (0.3)
Ebit 151.9 3.5 118.6 3.0
Net financial expenses and impairment losses on financial assets (38.9) (0.9) (41.4) (1.1)
Income before taxes 113.0 2.6 77.2 2.0
Income taxes (34.5) (0.8) (40.2) (1.0)
Profit/(loss) from continuing operations 78.5 1.8 37.0 0.9
Non-controlling interests 14.4 0.3 11.9 0.3
Net income, group 64.1 1.5 25.1 0.6
Cash flow from operating activities 297.2 209.1
Investments, net 211.6 196.4
12.31.2015 12.31.2014
Capital employed 1,244.4 1,184.0
Shareholders’ equity 600.0 490.7
Net financial position 644.4 693.3
Net financial position/Ebitda 1.71 2.19
Revenues The Autogrill group earned consolidated revenues of Euro 4,369.2 million, up by 11.2% compared to the previous year (+2.0% on a like-for-like basis). Sales are broken down below by channel: (Millions of Euro) 2015 % 2014 % Change
Airports 2,347.3 53.7 1,952.9 49.7 394.4
Motorways 1,678.0 38.4 1,622.4 41.3 55.6
Railway stations 174.2 4 175.7 4.5 (1.5)
Other 169.7 3.9 179.2 4.6 (9.5)
Total 4,369.2 100.0 3,930.2 100.0 439.0
DIRECTORS' REPORT 21
In the airport channel sales increased by 20.2% (+5.3% at constant exchange rates), mainly supported by increased revenues in US airports, new openings and business expansion in Northern Europe and Asia. In the motorway channel revenues recorded a 3.4% growth (-0.4% at constant exchange rates) compared to the previous year, due to the performance recorded on US motorways, which made up for lower sales in Italy following selective renovations during the 2013/2014 bidding season. Net of the different scope of Italian business activities, revenues from the motorway segment were up by 5.3% (+1.4% at constant exchange rates). Sales are broken down below by geographical area: (Millions of Euro) 2015 % 2014 % Change
Italy 1,057.4 24.2 1,091.7 27.8 (34.3)
Rest of Europe 732.4 16.8 712.3 18.1 20.1
North America 2,232.4 51.1 1,847.9 47.0 384.5
International 347.0 7.9 278.2 7.1 68.8
Total 4,369.2 100.0 3,930.2 100.0 439.0 In Italy, revenues stood at Euro 1,057.4 million, a decrease of 3.1% from Euro 1,091.7 million in the previous year, mainly as a result of the limited scope of business operated due to the company's no longer managing several motorway service areas. In the rest of Europe, revenues came to Euro 732.4 million, up by 2.8% (+0.3% at constant exchange rates), compared with Euro 712.3 million in 2014, through the Airports channel thanks to a positive performance in the Athens and Brussels airports and the opening of new points of sale in Düsseldorf, Germany. In North America, revenues totalled Euro 2,232.4 million, up by 20.8% (+2.7% on a like-for-like basis) compared to Euro 1,847.9 in 2014.
Operating margins At Euro 376.2 million, Ebitda increased by 19% (+6% at constant exchange rates) and amounted to 8.6% of revenues, compared to 8% in the previous year). Improved margins were recorded in all areas where the group operates, and were achieved in particular thanks to the lower incidence of the cost of sales resulting from a more favourable sales mix, as well as reductions in the purchase prices of some food categories. Ebit came to Euro 151.9 million, up from Euro 118.6 million in 2014. The group's share of net income was a positive Euro 64.1 million in 2015, compared with Euro 25.1 million in the previous year.
Investments In 2015 net investment were mainly targeted at the airport channel and amounted to Euro 211.6 million. compared to Euro 196.4 million in 2014.
Net financial position Net financial position decreased from Euro 693.3 million at December 31, 2014 to Euro 644.4 million at December 31, 2015. The contribution given through cash generation financed in full the investments made during the year and the negative effect arising from the conversion into Euro of US Dollar denominated financial debt.

22 DIRECTORS' REPORT
Performance of Autogrill shares in 2015 The performance of Autogrill shares in 2015 was as follows, for a gain of 38%:

DIRECTORS' REPORT 23
INFRASTRUCTURE AND SERVICES FOR MOBILITY
Atlantia S.p.A. (controlling interest at 12.31.2015: 30.25%) The 2015 consolidated figures for the Atlantia group are not directly comparable with the previous year's due to non-homogeneous effects, including: ! the overall impact of non-recurring financial transactions related to the partial repurchase of Atlantia bonds; ! exchange differences on foreign currency balances; ! the impact of fluctuations in the discounting rates applied to funds recorded under liabilities; ! higher taxes related to the restating of deferred taxes of the Italian companies following the reduction of the
IRES rate effective from January 1, 2017.
Consolidated economic and financial highlights in 2015 and 2014 are as follows: (Millions of Euro) 2015 % 2014 %
Toll revenues 3,836 72.3 3,678 72.4
Aviation revenues 565 10.7 520 10.2
Other revenues 903 17.0 885 17.4
Total revenues 5,304 100.0 5,083 100.0
Ebitda 3,215 60.6 3,169 62.3
Ebit 2,212 41.7 1,933 38.0
Net financial charges (774) (14.6) (671) (13.2)
Income taxes (470) (8.9) (553) (10.9)
Profit/(loss) from continuing operations 968 18.3 709 13.9
Profit from discontinued operations 7 0.1 64 1.3
Non-controlling interests (122) (2.3) (33) (0.6)
Net income, group 853 16.1 740 14.6
12.31.2015 12.31.2014
Operating cash flow (FFO) 2,105 2,079
Investments 1,488 1,100
Capital employed 18,870 18,791
Shareholders’ equity 8,483 8,263
Net financial indebtedness 10,387 10,528
Net financial indebtedness/Ebitda 3.23 3.32
Revenues 2015 revenues amounted to Euro 5,304 million, up by Euro 221 million (+4%) compared to 2014. On a like-for-like basis, total revenues increased by Euro 293 million (+6%). Toll revenues amounted to Euro 3,836 million with a total increase of Euro 158 million (4%) compared to 2014. On a comparable basis, toll revenues increased by Euro 192 million (+5%), mainly due to the following factors: ! tariff increases in 2015 for the group's Italian operators (+ Euro 39 million); ! a 3% increase in traffic on the Italian network (+ Euro 90 million); ! higher toll revenues earned by foreign operators (+ Euro 41 million) due to positive traffic dynamics in Chile
and Poland and to tariff increases, partially offset by decreased traffic in Brazil.
Aviation revenues from amounted to Euro 565 million euros and increased by 45 million (+9%) compared to 2014 due to tariff adjustments and to an upward trend in traffic, despite the negative impact on revenues from the fire in Terminal 3 of the Fiumicino Airport.

24 DIRECTORS' REPORT
Other revenues totalled Euro 903 million, up by Euro 18 million compared to 2014 (Euro 885 million). Key indicators for the Atlantia group for the year 2015 are broken down below by sector:
(Millions of Euro) Italian
motorways Aeroporti di Roma
Overseas motorways
Atlantia S.p.A. and others Total
Revenues from third parties 3,764 803 546 191 5,304
Ebitda 2,314 450 407 44 3,215
Operating cash flow (FFO) 1,471 320 330 (16) 2,105
Investments 967 318 172 31 1,488
Operating margins Ebitda of Euro 3,215 million, up by Euro 46 million (+1%) compared to 2014. On a comparable basis, Ebitda increased by Euro 147 million (+5%). Ebit came to Euro 2,212 million, an increase of Euro 279 million (+14%) compared to 2014, principally attributable to lower provisions for infrastructure repair due to an increase in the discount rate from that used in 2014. On a like-for-like basis, the operating result increased by Euro 143 million (+7%). The group's share of net income (Euro 853 million) increased by Euro 113 million (+15%) compared to 2014 (Euro 740 million).
Investments In 2015 the Atlantia group invested Euro 1,488 million, or Euro 388 million more than in 2014 (Euro 1,100 million).
Net financial position At December 31, 2015 the group's net financial position stood at Euro 10,387 million, down by Euro 141 million (Euro 10,528 million at December 31, 2014).

DIRECTORS' REPORT 25
Performance of Atlantia shares in 2015 The performance of Atlantia shares in 2015 is shown below, for a gain of 24%:
26 DIRECTORS' REPORT
REAL ESTATE
Edizione Property S.p.A. (controlling interest at 12.31.2015: 100%) The financial results of fiscal year 2015 and the pro forma results of 2014 are summarised below:
(Millions of Euro) 2015 % 2014 pro-forma %
Rents 31.6 100 35.7 100
Amortization and depreciation (10.0) (31.6) (11.8) (33.1)
Property management cost, net (3.9) (12.3) (3.7) (10.4)
Real estate gross margin 17.7 56.0 20.2 56.6
Impairment of fixed assets (35.5) (112.3) - 0.0
Capital gains on disposal of fixed assets 125.0 395.6 78.1 218.8
Other income 4.1 13.0 3.1 8.7
Other costs (10.4) (32.8) (6.8) (19.0)
Operating result 100.9 319.4 94.6 265.0
Net financial income/(charges) (6.5) (20.6) n.a. n.a.
Net foreign currency hedging gains/(losses) and exchange differences (38.7) (122.5) n.a. n.a.
Income before taxes 55.7 176.3 n.a. n.a.
Income taxes (0.9) (2.8) n.a. n.a.
Net income, group 54.8 173.5 n.a. n.a.
12.31.2015 01.01.2015
Capital employed 467.4 439.5
Shareholders’ equity 343.6 222.4
Net financial position 123.8 217.1
Rental income In 2015, the group earned rental income of Euro 31.6 million from the management of real properties mainly intended for commercial use. The decrease compared to 2014 pro forma figures is attributable to the sale of the U.S. subsidiary owner of two properties in New York and Washington, as well as to the sale of a property in Paris at the end of last year.
Operating margins The Operating result stood at Euro 100.9 million (Euro 94.6 million in 2014 pro forma figures) and reflected, on the one hand, the capital gain from the sale of the U.S. subsidiary (Euro 125 million) and, on the other hand, write-downs on some properties as a result of impairment testing (Euro 35.5 million). In 2014 the operating profit included Euro 79 million gains from the sale of a property in Paris. The group's share of net income amounts to Euro 54.8 million.
Net financial position The Edizione Property group's net financial position at the end of 2015 amounted to Euro 123.8 million, a decrease of Euro 93.3 million compared to the situation at January 1, 2015 (Euro 217.1 million), mainly as a result of the amount received for the sale of the U.S. equity investment. The company also replaced the bank debt with an interest-bearing loan of Euro 140 million disbursed by the Parent Company Edizione S.r.l.

DIRECTORS' REPORT 27
HOLDING COMPANIES
The Parent Company Below are the economic and financial highlights of 2015 and 2014: (Millions of Euro) 2015 2014
Dividends and other income from equity investments 546.9 131.5
Other revenues and income 9.7 9.9
Capital gains from disposal of equity investments, net of capital losses 44.9 0.0
Operating costs (17.8) (15.9)
Depreciation and amortization (6.6) (4.7)
Net financial income/(charges) 3.0 (9.3)
Impairment of non-current financial assets, net of reversal (57.3) 455.9
Other non-recurring income/(charges), net (0.6) 0.0
Income taxes 7.4 (0.3)
Net income 529.6 567.1
12.31.2015 12.31.2014
Non-current financial assets 2,849.3 2,885.2
Property, plant and equipment and other assets, net 689.7 174.8
Capital employed 3,539.0 3,060.0
Shareholders’ equity 3,517.7 3,088.1
Net financial position /(Cash) 21.3 (28.1)
Sources of funding 3,539.0 3,060.0 Dividends and other income from equity investments amounted to Euro 546.9 million, an increase of Euro 415.4 compared to the previous year's Euro 131.5 million. This is explained almost entirely by increased dividends distributed by the subsidiaries Schematrentaquattro S.p.A. and Sintonia S.p.A. Other revenues and income amount to Euro 9.7 million, including Euro 8.8 million from property rentals. The remaining amount refers mostly to services rendered to Group companies. The net gains from the disposal of equity investments relate to disposals of investments in Pirelli & C. S.p.A. (Euro 31.3 million), Club Méditerranée (Euro 12.3 million) and Benetton Usa Corp. (Euro 1.3 million). Operating costs showed a slight increase, from Euro 15.9 million in 2014 to Euro 17.8 million. Net financial income amounted to Euro 3.0 million (Euro 9.3 million net financial charges in the previous year) and received Euro 4.3 million distributions from mutual funds. Impairment of non-current financial assets, net of reversal is related almost entirely to a Euro 57.1 million write-down of Assicurazioni Generali S.p.A. Positive income taxes of Euro 7.4 million are the estimated remuneration of the tax loss of Edizione S.r.l. used in the tax consolidation to offset the taxable income amounts contributed by other companies participating in the consolidation scheme. At the end of 2015, equity investments came to Euro 2,849 million, with a decrease of Euro 36 million compared with the previous year, due to the sale of Pirelli & C. and Club Méditerranée shares and the impairment of Assicurazioni Generali, partially offset by the purchase of other equity investments (Hermès and LBrands).

28 DIRECTORS' REPORT
At the end of 2015, Edizione's net financial position amounted to Euro 21.3 million, compared with net cash of Euro 28.1 million at the end of 2014.
Sintonia S.p.A. (controlling interest at 12.31.2015: 100%) At December 31, 2015 the company held 30.25% of Atlantia S.p.A., which in turn owns 100% of Autostrade per l'Italia S.p.A. (parent company operating in toll motorway concessions) and 95.92% of Aeroporti di Roma S.p.A., the company that operates the largest Italian airport in terms of number of passengers. The results of Sintonia S.p.A. in 2015 and 2014 are summarised below: (Millions of Euro) 2015 2014
Dividends and other income from equity investments 267.4 280.7
Gains/(losses) from disposal of financial instruments - 4.3
Operating costs (1.6) (1.6)
Depreciation, amortization and impairments (0.2) (0.8)
Net financial charges (0.5) (27.9)
Impairment of financial assets - (0.1)
Non-recurring income/(charges) 0.1 (1.2)
Net income 265.2 253.4
12.31.2015 12.31.2014
Shareholders’ equity 2,584 3,727
Net financial postition/(Cash) (8.0) 141.9
The amount of Dividends is reduced compared with the previous year, due to the smaller number of Atlantia shares owned by the Company as a result of the June 2015 demerger. Dividends from Atlantia refer, as to Euro 167.4 million, to the balance of the dividend for the year 2014 (received in May on a pre-demerger holding of 45.56%), and as to Euro 99.9 million to the advance payment of dividends for the year 2015 (received in November on a post-demerger holding 30.25%). Net financial charges came to Euro 0.5 million (Euro 27.9 million the previous year). Financial charges for the previous year also included differentials earned on Interest Rate Swap contracts maturing in October 2014. The reduction compared to the previous year is due also to full repayment in May 2015 of the bank loan in place. Cash at the end of the year stood at Euro 8 million, down from Euro 142 million of net debt at the end of 2014.

DIRECTORS' REPORT 29
Schematrentaquattro S.p.A. (controlling interest at 12.31.2015: 100%) At December 31, 2015 the company holds 50.10% of Autogrill S.p.A. In 2015 and 2014 Schematrentaquattro S.p.A. achieved the following results: (Thousands of Euro) 2015 2014
Dividends and other income from equity investments 3.2 4.6
Capital gains and income from disposal of equity investments 457.8 -
Operating costs (1.5) (0.8)
Financial income (charges), net 1.7 (0.5)
Impairment reversals of equity investments - 426.7
Income tax for the year (4.2) 0.2
Income for the year 457.0 430.2
(Thousands of Euro) 12.31.2015 12.31.2014
Shareholders' equity 1,863 1,836
Net financial position/(Cash) (921) 158
Dividends and other income from equity investments included dividends received from Pirelli & C. S.p.A. Capital gains and income from disposal of equity investments includes a gain from the disposal of World Duty Free shares (Euro 415.9 million), and the capital gain arising from the transfer by tender offer of Pirelli & C. shares (Euro 41.9 million), net of their respective costs associated with the sale. In the previous year, impairment of equity investments in Autogrill S.p.A. and World Duty Free S.p.A., whose carrying amount had been restored within the limits of the write-down made in 2008. Income tax for the year refers to a capital gain on the disposal of investments in World Duty Free S.p.A. and Pirelli & C. S.p.A. At December 31, 2015 the company's net cash amounted to Euro 921 million, against a Net financial indebtedness of Euro 158 million at December 31, 2014. Net cash includes a Euro 208.2 million balance of the current account in existence with the Parent Company Edizione S.r.l., remunerated at market rates.

30 DIRECTORS' REPORT
ADDITIONAL INFORMATION At the reporting date, the Parent Company did not hold own quotas and its subsidiaries did not own shares or quotas of the Parent or their respective controlling companies, either directly or through trust companies or intermediaries, nor had the Parent Company or its subsidiaries ever purchased or sold any such shares or quotas.
SIGNIFICANT EVENTS FOLLOWING THE END OF THE FINANCIAL YEAR
Benetton Group Following the intention expressed by the Korean partners to exercise the option to sell their equity investment, equal to 50% of the share capital of Benetton Korea Inc., the purchase of the aforesaid interest by Benetton Group S.r.l. was finalised on April 1, 2016. As a result of this transaction, Benetton Group S.r.l. will own 100% of Benetton Korea Inc. The total price for the acquisition was 20.0 billion Korean won.
Edizione Property On January 1, 2016 the Luxembourg subsidiary Benetton Real Estate International S.A. was merged by incorporation into Edizione Property S.p.A. The cross-border merger, which also had positive effects in terms of efficiency and simplification, was aimed at transferring to the acquiring company Edizione Property S.p.A. the business activities currently carried out autonomously by the subsidiary Benetton Real Estate International S.A.
OUTLOOK FOR 2016
TEXTILES & CLOTHING
Benetton Group In the direct channel, in 2016 store revenues are expected to continue to grow on a comparable basis. The goal is to improve the performance, quality and consistency of the store network. As regards the indirect channel, at constant exchange rates, revenues at expected to decline due to the impact on the entire year of the streamlining of the independent sales network implemented in recent years. The direct channel margins, at constant exchange rates, are expected to further improve, while those from the indirect channel should remain stable in absolute terms, despite the "inertial" fall in revenue, and improve in terms of incidence on sales. Efforts will be continued to optimise investments through constant control of working capital, while a sharp increase in investments is expected with the aim to upgrade both the direct and the indirect sales network through plans to support business partners. As a result, the net creditor position is expected to remain essentially unchanged by the end of the year.
Olimpias Group In 2016 the Olimpias Group will continue to implement actions aimed at completing the organisational and operational separation of the clothing segment, expected by the second half of 2017. 2016 will see growing commitment to developing products and markets, albeit in a context of predictable decline in sales revenues compared with the year just ended and of decreasing operating profitability.

DIRECTORS' REPORT 31
FOOD & BEVERAGE
Autogrill In 2016, the Autogrill group will aim to increase sales revenues and profitability in North America, relying on good traffic dynamics, specific commercial initiatives and efficient resource management programs. In the International area, the management will focus on the implementation of the many contracts won in 2014 and 2015, in addition to pursuing further growth opportunities in the countries where the group operates. In Italy, Autogrill aims to achieve a growth in sales and margins, leveraging the signs of recovery in traffic and consumption seen in 2015. In other European countries, the group's strategy is also aimed at seizing a possible recovery in consumption, maintaining a selective approach in the evaluation of investment opportunities.
INFRASTRUCTURE AND SERVICES FOR MOBILITY
Atlantia Despite a still unstable global macroeconomic situation, overall consolidated operating results are expected to improve in the various areas of activity of the Atlantia group for the year 2016. For the Italian motorway business, the trend of traffic on the group's motorway network in Italy has confirmed signs of recovery in the last few months. Please also note the contribution during the 12-month period under review of Società Autostrada Tirrenica (consolidated in the group's accounts since September 30, 2015) and the possible reduction in service area margins also in relation to tenders to award the new sub-concessions. On the whole, foreign motorway business has shown a growth in traffic volumes, with the exception of Brazil because of poor performance of the local economy. The contributions of the group’s overseas motorway operators are subject to exchange rate fluctuations. Aeroporti di Roma is expected to increase aviation revenues as a result of the positive trend in passenger traffic reported in the first few weeks of the year, which according to airlines will also occur in the new direct connections opened with the Fiumicino airport. Higher airport fees will also contribute to this increase. The growth of the non-aviation business may also help to improve results, impacted in 2015 by the closure of part of the commercial areas damaged in the fire that broke out in Fiumicino on May 7. The Atlantia group's 2016 results will also benefit from a reduction in the cost of debt as a result of capital structure optimisation actions implemented in 2015.
HOLDING COMPANIES
Edizione S.r.l. On the basis of resolutions taken by Edizione's subsidiaries and associates, dividends are expected to increase in 2016, while operating costs are likely to remain stable.
Sintonia S.p.A. Sintonia's dividend flow is expected to decrease due to the company's non-proportional partial demerger, which resulted in the allocation of part of Atlantia shares to the beneficiary companies.

32

CONSOLIDATED FINANCIAL STATEMENTS AT DECEMBER 31, 2015 33
CONSOLIDATED FINANCIAL STATEMENTS
AT DECEMBER 31, 2015

34 CONSOLIDATED FINANCIAL STATEMENTS AT DECEMBER 31, 2015
CONSOLIDATED STATEMENT OF FINANCIAL POSITION
ASSETS (Thousands of Euro) 12.31.2015 12.31.2014 Note
Non-current assets
Property, plant and equipment 1
Land and buildings 722,027 786,651
Investment property 112,832 114,462
Plant, machinery and equipment 379,283 381,180
Furniture, furnishings and electronic equipment 83,493 81,897
Assets to be relinquished 74,886 83,057
Leasehold improvements 411,922 358,309
Other tangible assets 52,145 47,052
Assets under construction and advances 204,846 160,470
Total property, plant and equipment 2,041,434 2,013,078
Intangible assets 2
Goodwill and other intangible assets of indefinite useful life 5,909,370 6,188,058
Intangible assets deriving from concession rights 19,990,230 20,311,687
Intangible assets of finite useful life 558,700 597,379
Total intangible assets 26,458,300 27,097,124
Other non-current assets
Equity investments in subsidiaries 677 390 3
Equity investments in associates and joint ventures 92,050 138,043 4
Equity investments in other companies 534,701 722,742 5
Investment securities 508,610 25,355 6
Other non-current financial assets 1,776,696 1,760,472 7
Other non-current receivables 98,098 101,949 8
Deferred tax assets 1,806,014 2,036,626 9
Total other non-current assets 4,816,846 4,785,577
Total non-current assets 33,316,580 33,895,779
Current assets
Inventories 604,601 610,878 10
Trade receivables 1,710,948 1,679,084 11
Tax receivables 103,323 77,899 12
Other current receivables, accrued income and prepaid expenses 495,930 495,625 13
Other current financial assets 900,966 1,036,532 14
Other investments 15,779 18,275 15
Cash and cash equivalents 4,027,830 2,273,326 16
Total current assets 7,859,377 6,191,619
Assets held for sale 44,985 2,570,330 17
TOTAL ASSETS 41,220,942 42,657,728

CONSOLIDATED FINANCIAL STATEMENTS AT DECEMBER 31, 2015 35
SHAREHOLDERS’ EQUITY AND LIABILITIES (Thousands of Euro) 12.31.2015 12.31.2014 Note Shareholders’ equity Shareholders’ equity attributable to the Parent Company Share capital 1,500,000 1,500,000 18 Fair value and hedging reserve 48,847 221,564 19 Other reserves and retained earnings 3,463,903 3,381,416 20 Translation reserve (205,365) (199,190) 21 Net income for the year 1,598,216 136,059 Total 6,405,601 5,039,849 Equity attributable to non-controlling interests 6,731,350 7,044,578 22 Total shareholders’ equity 13,136,951 12,084,427 Liabilities Non-current liabilities Bonds 10,762,271 10,938,735 23 Medium and long-term loans 3,531,144 3,470,668 24 Other non-current liabilities 137,808 125,722 25 Lease financing 11,531 15,109 26 Other non-current financial liabilities 487,403 527,527 27 Provisions for employee benefits 318,834 339,172 28 Deferred tax liabilities 1,760,121 2,015,119 29 Other non-current provisions and liabilities 1,418,885 1,330,232 30 Provisions for construction services required by contract 3,369,243 3,783,956 31 Total non-current liabilities 21,797,240 22,546,240 Current liabilities Trade payables 2,282,988 2,122,743 32 Other payables, accrued expenses and deferred income 935,447 972,610 33 Current income tax liabilities 42,971 72,883 34 Other current provisions and liabilities 460,039 627,424 30 Current portion of provisions for construction services required by contract 441,499 499,119 31 Current portion of bonds 1,085,993 162,887 23 Current portion of medium and long-term loans 258,005 637,947 24 Current portion of lease financing 3,578 3,517 26 Other current financial liabilities 357,507 387,044 35 Bank loans and overdraft 412,545 586,611 36 Total current liabilities 6,280,572 6,072,785 Liabilities held for sale 6,179 1,954,276 17 Total liabilities 28,083,991 30,573,301 TOTAL SHAREHOLDERS’ EQUITY AND LIABILITIES 41,220,942 42,657,728

36 CONSOLIDATED FINANCIAL STATEMENTS AT DECEMBER 31, 2015
CONSOLIDATED INCOME STATEMENT (Thousands of Euro) 2015 2014 Note
Revenues 11,444,946 10,900,064 37
Revenues from construction services 720,502 534,756 38
Other revenues and operating income 481,248 454,088 39
Change in inventories of finished products and work in progress 112,874 82,837
Purchases and changes of raw materials and consumables (2,897,036) (2,887,826) 40
Payroll costs (2,607,718) (2,379,701) 41
Costs of services (2,458,768) (2,078,463) 42
Leases and rentals (1,339,403) (1,238,533) 43
Other operating expenses (193,075) (170,773) 44
Use of provisions for construction services required by contract 502,495 406,613 45
Depreciation of property, plant and equipment (308,847) (290,639) 46
Amortization of intangible assets (897,055) (858,479) 47
Impairment of property, plan and equipment and intangible assets (63,384) (40,329) 48
Impairment of doubtful accounts (48,947) (106,165) 49
Provisions for risks 42,191 (324,393) 50
Operating result 2,490,023 2,003,057
Share of income/(loss) of associated companies (16,652) (5,260) 51
Financial income 651,250 382,274 52
Impairment of financial assets (94,277) (49,319) 53
Financial charges (1,172,683) (1,102,974) 54
Foreign currency hedging gains/(losses) and exchange differences (25,418) (23,779) 55
Income before taxes 1,832,243 1,203,999
Income taxes (531,160) (602,506) 56
Profit/(loss) from discontinued operations 1,053,627 106,031 57
Net income for the year (Group and non-controlling interests) 2,354,710 707,524
Income/(Loss) attributable to:
- Parent Company 1,598,216 136,059
- Non-controlling interests 756,494 571,465

CONSOLIDATED FINANCIAL STATEMENTS AT DECEMBER 31, 2015 37
CONSOLIDATED STATEMENT OF COMPREHENSIVE INCOME (Thousands of Euro) 2015 2014
Net income for the year (Group and non-controlling interests) 2,354,710 707,524
Fair value gains/(losses) on cash flow hedges 81,871 (25,669)
Fair value gains/(losses) of available for sale financial instruments (180,825) 9,192 Gains/(losses) from translation of assets and liabilities of consolidated companies in functional currencies other than euro (258,373) 42,592
Other gains/(losses) 6,124 (53,594)
Tax effect (35,607) 20,255
Other comprehensive income for the year (386,810) (7,224)
- of which discontinued operations 11,661 44,347
Comprehensive income/(loss) for the year attributable to: 1,967,900 700,300
- Parent Company 1,421,550 175,491
- Non-controlling interests 546,350 524,809

38 CONSOLIDATED FINANCIAL STATEMENTS AT DECEMBER 31, 2015
CONSOLIDATED STATEMENT OF CHANGES IN EQUITY
(Tho
usan
ds o
f Eur
o)Sh
are
cap
ital
Fair
value
and
he
dging
rese
rve
Othe
r res
erve
s an
d re
taine
d ea
rning
sTr
ansla
tion
rese
rve
Net in
com
e/(lo
ss) f
or
the y
ear
Equit
y att
ributa
ble to
the
Pare
nt Co
mpa
nyEq
uity
attrib
utable
to n
on-
contr
olling
inter
ests
Total
Bala
nce
at 1
2.31
.201
31,
500,
000
194,
522
3,30
3,99
8(2
31,5
58)
138,
684
4,90
5,64
66,
887,
329
11,7
92,9
75Ca
rry
forw
ard
of 2
013
inco
me
138,
684
(138
,684
)-
-
Divi
dend
s di
strib
uted
(42,
800)
(42,
800)
(380
,654
)(4
23,4
54)
Capi
tal in
crea
ses/
(rei
mbu
rsem
ents
)-
5,87
5 5,
875
Tran
sact
ions
with
non
-con
trollin
g in
tere
sts
329
329
2,76
7 3,
096
Chan
ge in
sco
pe o
f con
solid
atio
n33
33
1,14
1 1,
174
Oth
er m
ovem
ents
1,15
11,
151
3,31
1 4,
462
Com
preh
ensi
ve in
com
e fo
r the
yea
r27
,042
(19,
979)
32,3
6813
6,05
917
5,49
1 52
4,80
9 70
0,30
0
Bala
nce
at 1
2.31
.201
41,
500,
000
221,
564
3,38
1,41
6(1
99,1
90)
136,
059
5,03
9,84
97,
044,
578
12,0
84,4
27Ca
rry
forw
ard
of 2
014
inco
me
136,
059
(136
,059
)-
Divi
dend
s di
strib
uted
(100
,000
)(1
00,0
00)
(480
,945
)(5
80,9
45)
Capi
tal in
crea
ses/
(rei
mbu
rsem
ents
)-
18,3
79
18,3
79
Tran
sact
ions
with
non
-con
trollin
g in
tere
sts
44,2
9644
,296
(4
04,2
48)
(359
,952
)
Chan
ge in
sco
pe o
f con
solid
atio
n2,
571
2,57
1 -
2,57
1
Oth
er m
ovem
ents
(2,6
65)
(2,6
65)
7,23
6 4,
571
Com
preh
ensi
ve in
com
e fo
r the
yea
r(1
72,7
17)
2,22
6(6
,175
)1,
598,
216
1,42
1,55
0 54
6,35
0 1,
967,
900
Bala
nce
at 1
2.31
.201
51,
500,
000
48,8
473,
463,
903
(205
,365
)1,
598,
216
6,40
5,60
16,
731,
350
13,1
36,9
51
Note
s18
1920
2122

CONSOLIDATED FINANCIAL STATEMENTS AT DECEMBER 31, 2015 39
CONSOLIDATED CASH FLOW STATEMENT (Thousands of Euro) 2015 2014 Operating activities Net income for the year (Group and non-controlling interests) 2,354,710 707,524 Income taxes 531,160 602,506 Income before taxes 2,885,870 1,310,030 Adjustments: - depreciation and amortization 1,205,902 1,149,118 - (capital gains)/capital losses/impairment of intangible assets and property, plant and equipment (77,804) (44,048) - net provisions charged to statement of income (3,452) 421,641 - share of (income)/losses of associates 16,652 5,260 - dividends from associated companies 1,680 1,011 - (capital gains)/capital losses/impairment of other equity investments (1,269,399) 44,538 - net financial (income)/charges 794,556 739,658 Cash flow from operating activities before changes in working capital 3,554,005 3,627,208 Cash flow provided/(used) by changes in working capital 26,413 (85,435) Cash flow provided/(used) by changes in non-current assets and liabilities (1,227) (59,610) Payment of taxes (538,433) (499,638) Payment of employee termination indemnities (9,271) (23,672) Net interest received/(paid) (784,650) (809,871) Cash flow provided/(used) by operating activities 2,246,837 2,148,982 Investing activities Operating investments (1,521,066) (1,201,637) Operating divestments 167,057 133,562 Purchase of equity investments (106,081) (32,645) Purchase of consolidated companies (85,612) (2,036) Cash contributed by newly consolidated companies 12,588 - Disposal of equity investments 1,661,693 94,808 Operations in non-current financial assets (483,255) 168 Cash flow provided/(used) by investing activities (354,676) (1,007,780) Financing activities Change in shareholders' equity 231,245 (944) New medium and long-term loans 3,436,457 650,434 Repayment of medium and long-term loans (3,134,729) (4,644,327) Net changes in other sources of finance (99,614) 386,956 Dividend payments and distribution of capital reserves (580,945) (423,454) Cash flow provided/(used) by financing activities (147,586) (4,031,335) Increase/(decrease) in cash and cash equivalents 1,744,575 (2,890,133) Cash and cash equivalents at the beginning of the period 2,226,324 5,121,491 Translation differences and other movements (34,428) 5,823
Cash and cash equivalents at the beginning of the period of activities recognized as discontinued opera-tions - (10,857) Cash and cash equivalents at the end of the period 3,936,471 2,226,324 Cash and cash equivalents 4,027,830 2,273,326

40 CONSOLIDATED FINANCIAL STATEMENTS AT DECEMBER 31, 2015
NOTES TO THE CONSOLIDATED FINANCIAL STATEMENTS
GROUP ACTIVITIES Set up in 1981, Edizione S.r.l. at December 31, 2015 held controlling and non-controlling interests in companies in the following business segments: ! Textiles & clothing; ! Real estate; ! Food & beverage; ! Infrastructures & services for mobility.
These are headed up respectively by Benetton Group S.r.l. and Olimpias Group S.r.l., Edizione Property S.p.A., Autogrill S.p.A., and by the company Sintonia S.p.A., which holds interests in Atlantia S.p.A. Atlantia controls the operating companies Autostrade per l’Italia S.p.A. and Aeroporti di Roma S.p.A. The Group also manages real estate and agricultural operations, other than those directly held by the companies listed above. January 1, 2015 was the effective date of the partial demerger of Schematrentanove S.p.A. (formerly Benetton Group S.p.A.) in favour of two beneficiary companies directly controlled by the parent company. In particular, through this transaction:
" the 100% interest in Benetton Group S.r.l., focused on the core business (brands, products, marketing, sales and retail), was assigned to Schematrentasette S.r.l.;
" the 100% interest in Olimpias Group S.r.l., in charge of manufacturing activities with industrial platforms in the Mediterranean region (weaving, knitting, spinning, dyeing and sewing), was assigned to Schematrentotto S.r.l.
As a result of the demerger, Schematrentanove S.p.A. now has equity investments in the real estate sector only. On December 1, 2015, following further corporate reorganisation transactions, Schematrentanove S.p.A. absorbed some real estate companies and changed its name to Edizione Property S.p.A.
FORM AND CONTENT OF THE CONSOLIDATED FINANCIAL STATEMENTS The scope of consolidation includes subsidiaries for which the Group, pursuant to IFRS 10, is exposed to or has rights to variable returns and is able to affect those returns through power over these investees. The scope of consolidation also includes joint arrangements, pursuant to IFRS 11 (joint ventures and joint operations), and associate companies over which the Group has a significant influence in accordance with IAS 28. A list of the companies included in the scope of consolidation is annexed to these notes. More in detail, Edizione Group’s consolidated financial statements include the financial statements at December 31, 2015 of Edizione S.r.l. and all the Italian and foreign companies over which the Parent Company has direct or indirect control or a dominating influence. The financial statements used for the consolidation are those approved or pending approval by the shareholders of the various companies or, in the case of companies which close their fiscal year on a date other than December 31, 2015, the interim statements prepared as of the Group reporting date. HMSHost Corporation (formerly Autogrill Group Inc.) and its subsidiaries close their fiscal year on the Friday closest to December 31 and divide it into 13 four-week periods, which in turn are grouped into three 12-week quarters and a final 16-week quarter. Consequently, the accounts used for the financial statements refer to the period from January 3, 2015 - January 1, 2016, while the previous year’s accounts covered the period from January 4, 2014 - January 2, 2015. This practice does not cause significant effects on the representation of the financial position at December 31, 2015 and of the operating result.

CONSOLIDATED FINANCIAL STATEMENTS AT DECEMBER 31, 2015 41
The financial statements of subsidiaries have been duly reclassified for consistency with the policies adopted by the Parent Company. Some have also been adjusted for consistency with the accounting principles and the policies adopted by the Group. The results of subsidiaries acquired or sold during the year are included in the consolidated income statement as from the effective date of acquisition and until the effective date of disposal, with slight timing adjustments where these dates do not coincide with monthly reporting dates. The scope of consolidation at December 31, 2015 is different from that at December 31, 2014 due to: ! loss of the controlling interest in World Duty Free S.p.A. and its subsidiaries, on August 7, 2015. The World
Duty Free group's contribution to consolidated results (seven months in 2015 and 12 months in 2014) was represented in a single line of the income statement for the respective years, i.e. "Profit/(loss) from discontinued operations ", and in a single line in the statement of financial position for 2014: "Assets and liabilities held for sale";
! loss of the controlling interest in the US real estate company, which took place in August 2015; ! consolidation of Società Autostrada Tirrenica p.A. in September 2015 (see Note 62 Business Combinations).
In accordance with IFRS 5, in addition to the comments already made with reference to the World Duty Free group, the assets and liabilities of Atlantia group companies involved in the Ecomouv' projects were also reclassified in a single line of the 2015 and 2014 income statement, i.e. “Profit/(loss) from discontinued operations” and in a single line in the 2014 and 2015 statement of financial position: "Assets and liabilities held for sale", because of the intervening termination of the contract with the French government. In 2015, the line "Proft/(loss) from discontinued operations" also represented the effects of the sale of a clothing brand to third parties. These financial statements have been prepared on a going concern basis, matching costs and revenues to the accounting periods to which they pertain and applying the historical cost principle to all items except those that in accordance with IFRS are measured at fair value, as specified in the individual accounting policies. The reporting currency is the Euro and all amounts have been rounded to thousands of Euro, unless otherwise specified. The consolidated financial statements are comprised of the statement of financial position, income statement, statement of comprehensive income, statement of changes in shareholders' equity, cash flow statement and these notes. The statement of financial position follows the format whereby assets and liabilities are split into current and non-current, while in the income statement, costs are grouped by nature. The cash flow statement has been prepared using the indirect method. Some items in the statement of financial position published in fiscal year 2014 have been reclassified in order to provide a more accurate representation.

42 CONSOLIDATED FINANCIAL STATEMENTS AT DECEMBER 31, 2015
CONSOLIDATION CRITERIA The consolidation criteria adopted for the preparation of the consolidated financial statements are as follows: a. the financial statements of subsidiaries are consolidated on a line-by-line basis, with elimination of the
carrying value of the shareholdings held by the Parent Company and other consolidated companies against the relative shareholders’ equity;
b. when a company is consolidated for the first time, any positive difference emerging from the elimination of its carrying value on the basis indicated in a. above is allocated, where applicable, to the assets and liabilities of the subsidiary. Any excess of the cost of acquisition over the net assets is recorded as Goodwill and other intangible assets of indefinite useful life. Negative differences are recognised in the income statement as income, following the fair value review of acquired assets and liabilities. Purchases of non-controlling interests in subsidiaries are recognised as transactions on net equity and, consequently, the difference between the acquisition cost and the relevant net equity portions is directly recognised under net equity;
c. intercompany receivables and payables, costs and revenues, and all significant transactions between consolidated companies, including the intragroup payment of dividends, are eliminated. Unrealised intercompany profits and gains and losses arising from transactions between Group companies are also eliminated;
d. non-controlling interests in shareholders’ equity and in the income or loss of consolidated companies are shown separately under shareholders’ equity and in the consolidated income statement. Non-controlling interests are determined on the basis of the percentage of ownership of the fair value of assets and liabilities recognised as of the original acquisition date and of changes in net equity after that date;
e. the financial statements of foreign subsidiaries with a functional currency other than the Euro are translated using period-end exchange rates for assets and liabilities, and average exchange rates for the period for income statement items. Differences arising from the translation into Euro of foreign currency financial statements are reported in comprehensive income for the year and accumulated in an equity reserve.
Below are the exchange rates used to translate the financial statements of the main subsidiaries with a functional currency other than the Euro:
Currency Exchange rate on
12.31.2015
Average exchange
rate in 2015
Euro/Usd 1.089 1.110
Euro/Pln 4.264 4.484
Euro/Clp 772.713 726.406
Euro/Ars 14.210 10.433
Euro/Brl 4.312 3.700
Euro/Inr 72.022 71.196
Euro/Czk 27.023 27.279
Euro/Gbp 0.734 0.726
Euro/Jpy 131.070 134.314
Euro/Hkd 8.438 8.601
Euro/Rub 80.674 68.072
Euro/Krw 1,280.780 1,256.540
Euro/Cad 1.512 1.419
Euro/Chf 1.084 1.068

CONSOLIDATED FINANCIAL STATEMENTS AT DECEMBER 31, 2015 43
ACCOUNTING STANDARDS AND POLICIES
International Accounting Standards For preparation of the consolidated financial statements, in accordance with EU Regulation 1606 of July 19, 2002, since January 1, 2005 the Group has used the International Accounting Standards and the International Financial Reporting Standards (IAS/IFRS) published by the International Accounting Standards Board (IASB) and approved by the European Union and the interpretations issued thereby (IFRIC and SIC). IFRS means International Financial Reporting Standards including International Accounting Standards (IAS), supplemented by the interpretations issued by the International Financial Reporting Interpretations Committee (IFRIC), previously called the Standing Interpretations Committee (SIC). The 2015 consolidated financial statements were prepared in accordance with such standards and interpretations.
Application of IFRS Below are the accounting standards, amendments and interpretations issued by the IASB and endorsed by the European Union for mandatory adoption in financial statements for years beginning on January 1, 2015:
IFRS 3 – Business combinations The amendment clarifies that all contingent consideration arrangements classified as liabilities or assets arising from a business combination must be subsequently measured at fair value through profit or loss, whether or not the contingent consideration is a financial instrument or a non-financial asset or liability. In addition, it clarifies that the standard in question does not apply to all the transactions to establish a joint venture.
IFRS 13 – Fair value measurement It was explicitly clarified and confirmed that short-term trade receivables and payables can be accounted for without recognising the effects of discounting, if such effects are not material.
IFRIC 21 – Levies The interpretation is applicable to all levies other than outflows that are within the scope of other standards (e.g., IAS 12 Income Taxes). The interpretation clarifies that an entity recognises a liability for a levy when the activity that triggers payment, as identified by the relevant legislation, occurs. It also clarifies that a levy liability is accrued progressively only if the activity that triggers payment occurs over a period of time. For a levy that is triggered upon reaching a minimum threshold, the interpretation clarifies that no liability is recognised before the specified minimum threshold is reached.
IAS 19 – Defined benefit plans (Employee contributions) Regulation No 2015/29 issued by the European Commission on December 17, 2014 approved an amendment by which it is permitted to recognise contributions related to defined benefit plans, payable by the employee or by third parties, as a reduction in the service cost in the period in which the service is rendered, provided that such contributions satisfy the following conditions: (i) are indicated in the formal terms of the plan, (ii) are connected to the service performed by the employee, and (iii) are independent of the number of years of the employee's service.
Annual Improvements to IFRSs 2010-2012 Cycle and Annual Improvements to IFRSs 2011-2013 Cycle These improvements amendments, mostly of a technical and editorial nature, to international accounting standards. Regulations No. 2015/28 and No. 1361/2014 were issued and approved by the European Commission on December 17 and December 18, 2014 respectively.

44 CONSOLIDATED FINANCIAL STATEMENTS AT DECEMBER 31, 2015
Below are the accounting standards, amendments and interpretations issued by the IASB and endorsed by the European Union for mandatory adoption in financial statements for years beginning on January 1, 2016:
Details
Adopted by the EU, in force at the balance sheet
date Mandatory adoption date
Amendments to IAS 1 - initiative on disclosures Yes Fiscal year beginning on January 1, 2016
Amendments to IAS 16 and to IAS 38 - Clarification on amortizing methods Yes Fiscal year beginning on January 1, 2016
Amendments to IFRS 11 - Accounting for the acquisition of an interest in a joint venture Yes Fiscal year beginning on January 1, 2016
Annual cicle amendments to IFRS 2012-2014 Yes Fiscal year beginning on January 1, 2016
Below are the accounting standards, amendments and interpretations issued by the IASB and not yet endorsed by the European Union, which may in the future be applied in the Group’s consolidated financial statements:
Details
Adopted by the EU, in force at the balance sheet
date Mandatory adoption date
IFRS 9 - Financial instruments No Fiscal year beginning on January 1, 2018
IFRS 15 - Revenues from trade contracts No Fiscal year beginning on January 1, 2018
IFRS 16 - Leases No Fiscal year beginning on January 1, 2019
With regard to the standards and newly issued interpretations, as well as the revision or amendments to existing standards, the Group is evaluating the impact of future application.
Accounting policies The financial statements have been prepared on a historical cost basis, with the exception of the valuation of certain financial instruments. The more important accounting policies adopted by the Group for valuing the contents of its financial statements are detailed below.
Business combinations The Group accounts for all business combinations by applying the purchase method. The cost of each combination is determined as the aggregate of the fair values, at the date of exchange, of assets given, liabilities incurred or assumed, and equity instruments issued by the acquirer in exchange for control of the acquiree. The costs relating to the acquisition are recognised in the income statement in the period in which the costs are incurred and the services received; the sole exception is for the cost of issuing debt securities or equities. The acquiree’s identifiable assets, liabilities and contingent liabilities that can be recognised under IFRS 3 (2008) - Business Combinations are posted at their fair value on the date of acquisition. Goodwill is determined as the amount by which the aggregate of the consideration transferred in a business combination, the amount of any non-controlling interests in the acquiree and the acquisition-date fair value of any previously-held equity interest in the acquiree exceeds the net of the acquisition-date amounts of the identifiable assets acquired and the liabilities assumed. If the acquisition-date amounts of the identifiable assets acquired and liabilities assumed exceed the aggregate of the consideration transferred, the amount of any non-controlling interests in the acquiree and the acquisition-date fair value of any previously-held equity interest in the acquiree, this excess is immediately recognised in the income statement as a gain on a bargain purchase. In case of a business combination achieved in stages, the interest previously held in the acquiree is remeasured at its acquisition-date fair value and any resulting gain or loss is recognised in the income statement.

CONSOLIDATED FINANCIAL STATEMENTS AT DECEMBER 31, 2015 45
The acquirer can measure non-controlling interests at the acquisition date either at fair value or in proportion to their share in the acquiree’s recognised identifiable net assets. The choice of measurement method is made for each business combination. On acquiring control, further acquisitions/disposals of non-controlling interests that do not result in a loss of control are accounted for as equity transactions. This means that any differences between the change in equity attributable to non-controlling interests and the cash and cash equivalents exchanged are recognised directly as movements in equity attributable to owners of the parent. The sale of shares to non-controlling interests, resulting in the Group’s loss of control over an entity, produces gains or losses that are recognised in the income statement. The purchase of shares from non-controlling interests, resulting in the acquisition of control, produces goodwill which is calculated as described above. On first-time adoption of IFRS, the Group decided not to apply IFRS 3 retroactively to the acquisitions made prior to the date of transition to IFRS (January 1, 2004). Consequently, goodwill arising on acquisitions made prior to that date has been maintained at the value determined under Italian GAAP, subject to measurement and recognition of any impairment losses.
Property, plant and equipment These are recorded at purchase or production cost, including the price paid to buy the asset (net of discounts and rebates) and any costs directly attributable to the purchase and commissioning of the asset, including financial charges incurred during the asset’s construction. The cost of a commercial property purchased is the purchase price or equivalent of the price in cash, including all other directly attributable expenses such as legal costs, registration taxes and other transaction costs. The cost of internally produced assets is the cost at the date of completion of work. For the transition to International Accounting Standards, property revaluations carried out in accordance with specific monetary revaluation laws have been maintained only if they meet the requirements of IFRS 1. The cost of assets to be relinquished (whether free of charge or in exchange for payment of the residual carrying value of the asset by a new concession holder) includes the cost allowed by IAS 37 which is reasonably estimated and expected to be borne on expiry of the relevant contract to bring the asset to the contractually agreed state of conservation, assuming that maintenance will continue to be carried out properly and in a timely manner. Investment property, consisting of real estate held for rental and/or appreciation rather than for use in the production or supply of goods and services, is recorded at cost on the same basis as other property, plant and equipment and is depreciated over its useful life. Costs incurred to enhance and maintain an asset that produce a material and tangible increase in its productivity or safety or extend its useful life are capitalised and increase the carrying amount of the asset. Routine maintenance costs are taken directly to the income statement. The value of property, plant and equipment is depreciated on a straight-line basis over its useful life. The components of an asset with their own material value and with a useful life different from that of the asset to which they belong are considered separately for the purposes of depreciation. Depreciation is calculated on the useful life of each individual component, which is modified if any maintenance work or replacements during the year have substantially increased its useful life. In the event of replacement, new components are capitalised to the extent that they satisfy the criteria for recognition as an asset, and the carrying value of the replaced component is e eliminated from the statement of financial position. The residual value and useful life of an asset is reviewed at least at every financial year-end; if, regardless of depreciation already recorded, an impairment loss occurs according to the rules of IAS 36, the asset is correspondingly written down in value. If in future years the reasons for the write-down no longer apply, its value is restored.

46 CONSOLIDATED FINANCIAL STATEMENTS AT DECEMBER 31, 2015
The depreciation rates applied in 2015 are within the ranges shown below by category of asset:
2015
Commercial and industrial buildings and investment property 2% – 33.3%
Plant and machinery 5% – 33.3%
Industrial and commercial equipment 4.4% – 40%
Furniture, furnishing, electronic equipment and store furniture 10% – 25%
Vehicles 20% – 25%
Other 3% – 50% Land is not depreciated. Leasehold improvement costs are depreciated over the shorter of the period during which the improvement may be used and the residual duration of the lease contract. Assets to be relinquished are depreciated on a straight-line basis over the shorter of the asset’s useful life and the length of the depreciation plan, which is based on the life of the concession. Assets acquired under finance leases are recognised at fair value as of the contract effective date less ancillary charges and any expenses for replacing another party in the lease, or, if lower, at the present value of the minimum payments due under the contract. The amount due to the lessor is stated under Lease financing in the balance sheet. Lease payments are divided into principal and interest, assuming a constant interest rate on the residual liability. Financial charges are recognised in the income statement. Leased goods are depreciated on the same basis as similar assets. In the case of sale and leaseback transactions resulting in a finance lease, any gain resulting from the sale is deferred and released to income over the term of the lease. Leases for which the lessor substantially maintains all of the risks and rewards incidental to ownership are classified as operating leases. The costs of operating leases are expensed to income on a straight-line basis over the length of the leasing agreement. Benefits received or to be received, and those given or to be given, as incentives for taking out operating leases are also recognised on a straight-line basis over the term of the lease. Property, plant and equipment is derecognised on sale or if the facts and circumstances giving rise to the future expected benefits cease to exist. Any gains or losses (determined as the difference between the disposal proceeds, less costs to sell, and/or the carrying amount of the asset) are recognised in the income statement for the year in which the asset is sold.
Intangible assets Intangible assets are measured initially at cost, normally defined as their purchase price, inclusive of any ancillary charges and less any trade discounts and rebates; also included is any directly attributable expenditure on preparing the asset for its intended use, until the asset is capable of operating. The cost of an internally generated intangible asset includes only those expenses which can be directly attributed or allocated to it as from the date on which it satisfies the criteria for recognition as an asset. Research costs are charged to the income statement in the period in which they are incurred. Goodwill is recognised initially in intangible assets, as the excess of the purchase cost over the fair value of the net assets of the company acquired. As required by IAS 38, at the time of recognition, any intangible assets that have been generated internally by the acquired entity are eliminated from goodwill. Items which meet the definition of “assets acquired as part of a business combination transaction” are only recognised separately if their fair value can be measured reliably. At the acquisition date, goodwill is allocated to each cash generating unit or group of units expected to benefit from the synergies achieved with the business combination. The cost of concession rights may include one or more of the following:

CONSOLIDATED FINANCIAL STATEMENTS AT DECEMBER 31, 2015 47
a. the fair value of construction services and/or improvements made by the grantor (measured as explained in the note on the accounting policy on construction contracts and services work in progress) less any grants, the amount that shall be paid by the replacement operator on termination of the concession (the so-called "takeover rights") and/or the minimum guaranteed by the grantor. Such cost will be recovered through the tolls paid by users of the infrastructure. Specifically, the following are identified:
1. rights obtained as consideration for specific obligations to provide construction services for the expansion and modernisation of the infrastructure and for which the operator does not receive additional economic benefits. These rights are initially recognised at the present fair value of the construction services to be provided in future (excluding any financial charges to be incurred by the operator during the construction period), less any grants, with a contra entry of an equal amount in “provisions for construction services required by contract”; in addition to the impact of amortisation, the initial value of the rights changes over time as a result of periodic reassessment of the present fair value of the part of the construction services still to be rendered at the end of the reporting period;
2. rights accrued in return for construction services rendered for which the operator receives additional economic benefits, represented by specific tariff increases and/or extensions of the infrastructure expected to result in significant increases in the number of users;
3. rights accruing from construction work carried out and paid for by service area operators, handed over free of charge to the company;
b. rights obtained from third parties, if costs have been incurred to acquire concessions from the grantor from third parties (the latter relating to the acquisition of companies that hold a concession).
After initial recognition, intangible assets are carried at cost, less accumulated amortisation and any accumulated impairment losses calculated in accordance with IAS 36. Intangible assets are amortised unless they have indefinite useful lives. Goodwill is not amortised, but is submitted to an impairment test annually to identify any reductions in value, or more often whenever there is evidence of impairment (see Impairment losses of non-financial assets, below). Amortisation is charged systematically over the intangible asset’s useful life, which reflects the period it is expected to benefit. Concession rights are amortised throughout the effective period of the relevant concession, with a policy that reflects the estimated pattern of consumption of the economic benefits incorporated in the right; for this purpose, the amortisation rates are calculated taking into account, where relevant, any changes in traffic expected over the concession's effective period. The residual value at the end of the useful life is assumed to be zero, unless there is a commitment by third parties to buy the asset at the end of its useful life or there is an active market for the asset. Management reviews the estimated useful lives of intangible assets at every financial year end. Normally, brands are amortised over 5 to 25 years, while patents, contractual rights and concession rights are amortised over the life of the right. Deferred charges are amortised over the residual duration of the lease contract, with the exception of fonds de commerce, which are amortised over 20 years. Software and software licenses are amortised over a period from three to six years. Development costs are amortised over three to six years.
Impairment losses of non-financial assets The carrying amounts of the Group’s property, plant and equipment and intangible assets are submitted for impairment testing whenever there are obvious internal or external signs indicating that the asset or group of assets (defined as cash generating units, or CGUs) may be impaired. In the case of goodwill, other intangible assets of indefinite useful life and intangible assets not in use, the impairment test must be carried out at least annually, and in any case whenever there are signs of possible impairment. The impairment test is carried out by comparing the carrying amount of the asset or CGU with its recoverable value, defined as the higher of fair value (net of any costs to sell) and value in use. Value in use is determined by calculating the present value of future net cash flows expected to be generated by the asset or CGU. In determining value in use, the estimated future cash flows are discounted to their present value using a rate that

48 CONSOLIDATED FINANCIAL STATEMENTS AT DECEMBER 31, 2015
reflects current market assessments of the time value of money and the risks specific to the asset. If the carrying amount is higher than the recoverable amount, the asset or CGU is written down by the difference and the impairment loss is charged to the income statement. The conditions and methods applied by the Group for reversing impairment losses, excluding in any case those relating to goodwill that may not be reversed, are as set out in IAS 36. Under no circumstances may the carrying value of an asset be restored to a value higher than the net book value it would have had if the impairment loss had not occurred. Restoration of value is taken immediately to the income statement.
Equity investments Investments in subsidiaries that are not consolidated on a line-by-line basis, because they are not yet operative or are in liquidation as of the balance sheet date, are measured at fair value, unless this cannot be determined, in which case they are carried at cost. The difference between the cost and the net equity of investments at the time they were acquired is allocated on the basis described in paragraph b. of the consolidation criteria. Fair value changes are recorded in the statement of comprehensive income and in an equity reserve, unless they express a permanent loss, in which case they are charged to the income statement. According to IFRS 11, joint ventures are carried on an equity or proportional basis. In the latter case, the Group’s share of the joint venture’s assets, liabilities, costs and revenues is incorporated line by line with the equivalent items in the consolidated financial statements. Equity investments in other companies, classified as available-for-sale financial assets as defined by IAS 39, are carried at fair value. Fair value changes are recorded in an equity reserve, unless they express a permanent loss, in which case they are charged to the income statement. If the fair value cannot be reliably measured, equity investments are valued at cost, net of impairment losses. Impairment losses cannot be reversed. Held for sale investments or those acquired as a temporary investment are recognised at the lower of their carrying amount and fair value, less any costs to sell. Provisions are made to cover the risk that the losses of an investee company could exceed the carrying amount of the investment, to the extent that the shareholder is required to comply with actual or constructive obligations to cover such losses.
Financial assets All financial assets are measured initially at cost, which corresponds to the consideration paid including transaction costs (e.g. consulting fees, duty stamps, and fees imposed by the regulatory authorities). The classification of financial assets determines their subsequent valuation, as follows: ! financial assets held for trading: these are recorded at fair value, and associated gains and losses are
recognised in the income statement; ! held to maturity investments, loans receivable and other financial receivables: these are recorded at
amortised cost; gains and losses associated with this type of asset are recognised in the income statement when the investment is removed from the balance sheet on maturity or if it becomes impaired;
! available for sale financial assets: these are recorded at fair value, and gains and losses deriving from subsequent measurement are recognised in shareholders’ equity. If the fair value of these assets cannot be determined reliably, they are measured at cost, as adjusted for any impairment.
If it is no longer appropriate to classify an investment as “held to maturity” following a change of intent or ability to hold it until maturity, it must be reclassified as “available for sale” and re-measured at fair value. The difference between its carrying amount and fair value remains in shareholders’ equity until the financial asset is sold or otherwise transferred, in which case it is booked to the income statement.

CONSOLIDATED FINANCIAL STATEMENTS AT DECEMBER 31, 2015 49
All financial assets are recognised on the date of negotiation, i.e. the date on which the Group undertakes to buy or sell the asset. A financial asset is removed from the balance sheet only if all risks and rewards associated with the asset are effectively transferred together with it or, should the transfer of risks and rewards not occur, if the Group no longer has control over the asset.
Inventories Inventories are valued at the lower of purchase or manufacturing cost, generally determined on a weighted average cost or FIFO basis, and their market or net realisable value. Manufacturing cost includes raw materials and all attributable direct and indirect production-related expenses. The calculation of estimated realisable value includes any manufacturing costs still to be incurred and direct selling expenses. Obsolete and slow-moving inventories are written down to their useful or net realisable value.
Construction contracts and services work in progress Construction contracts are accounted for on the basis of the contract revenue and costs that can be reliably estimated with reference to the stage of completion of the contract, in accordance with the percentage of completion method, as determined by a survey of the works carried out. Contract revenue is allocated to the individual reporting periods in proportion to the stage of contract completion. Any positive or negative difference between contract revenue and any advance payments received is recognised in assets or liabilities, taking account of any impairment of the value of the completed work, in order to reflect the risks linked to the inability to recover the value of work performed on behalf of customers. In addition to contract payments, contract revenue includes variations in contract work, price reviews and claims to the extent that they can be measured reliably. Expected losses are fully recognised immediately regardless of the stage of contract completion. Construction services provided to the grantor relating to Group company concession arrangements are specifically recognised in the income statement in accordance with the stage of completion method. Specifically, construction and/or upgrade service revenue represents the consideration for the services provided and is measured at fair value, calculated on the basis of the total costs incurred. These primarily consist of the costs of materials and external services, the cost of employment benefits payable to employees used to provide the services, attributable financial charges (the latter only in the case of construction and/or upgrade services for which the operator receives additional economic benefits), and any profit on services rendered within the Group (as this represents the market value of these services).
Trade receivables Receivables are initially recognised at fair value and are subsequently stated at amortised cost, using the effective interest rate method, net of provisions for doubtful accounts. The amount of the provisions is based on the present value of expected future cash flows which take account of expected collection times, estimated realisable value, any guarantees provided, and the expected costs of recovering the amounts due. Impairment losses are reversed in future periods if the circumstances that resulted in the loss no longer exist. In this case, the reversal is accounted for in the income statement and may not in any event exceed the amortised cost of the receivable had no previous impairment losses been recognised. Any medium and long-term receivables that include an implicit component of interest are discounted using an appropriate market rate. Receivables factored without recourse, for which all risks and rewards are substantially transferred to the assignee, are derecognised from the financial statements at their nominal value. Commissions paid to factoring companies for their services are included in service costs.
Accruals and deferrals These are recorded to match costs and revenues within the accounting periods to which they relate.

50 CONSOLIDATED FINANCIAL STATEMENTS AT DECEMBER 31, 2015
Cash and cash equivalents These include cash, current accounts at banks and post offices, demand deposits, and other short-term financial investments that are highly liquid, easily convertible to cash, and subject to insignificant risk of change in value. They are stated at face value.
Provisions for contingent liabilities The Group makes provisions only when a present obligation exists for a future outflow of economic resources as a result of a past event, and when it is probable that this outflow will be required to settle the obligation and a reliable estimate can be made of the same. The amount provided is the best estimate of the expenditure required to settle the present obligation completely, discounted to present value using a suitable pre-tax rate. When cash flows are discounted, the increase in the provision over time is recorded as a financial charge. Any provisions for restructuring costs are recognised when the Group has drawn up a detailed restructuring plan and has announced it to the parties concerned. In the case of onerous contracts where the unavoidable costs of meeting the contractual obligations exceed the economic benefits expected to be received under the contract, the present obligation is recognised and measured as a provision. In accordance with the contract obligations reflected in the financial plans annexed to concession arrangements, the Atlantia group’s Provisions for repair and maintenance obligations show the amount provided at the balance sheet date to cover future maintenance obligations that ensure the necessary functionality and safety of motorway infrastructure. These provisions are calculated on the basis of the usage and wear and tear of motorway infrastructures, taking account, if material, of the time value of money. The Provision for construction services required by contract relates to contractual obligations, specifically in connection with the upgrading of motorway infrastructure, for which the Group obtains no additional economic benefits. Such costs are treated as consideration for concession arrangements and are initially recognised at the present value of the fair value of construction services to be rendered in the future (ignoring any financial costs) less any grants received. They are accounted for as a contra item of concession rights without additional benefits. The present value of the residual liability to be rendered in the future, for the construction services still to be rendered to date, is therefore periodically reassessed, and changes to the measurement of the liabilities (such as, for example, changes to the estimated cash outflows necessary to extinguish the obligation, a change in the discount rate and/or a change in the construction period) are recognised as a matching increase or reduction in the corresponding intangible asset.
Trade payables Payables are initially recorded at cost, which corresponds to fair value, net of directly attributable transaction costs. They are subsequently recognised at amortised cost, using the original effective interest rate method. The implicit interest component included in medium/long-term payables is recorded separately using an appropriate market rate.
Financial liabilities Financial liabilities are divided into three categories: ! liabilities acquired with the intention of making a profit from short-term price fluctuations or that are part of a
portfolio held for short-term profit. These are recorded at fair value, with the related gains and losses recognised in the income statement;
! other liabilities (bank overdrafts, loans, bonds), which are initially recorded at fair value, on the basis of the amounts received net of transaction costs, and are subsequently stated at amortised cost using the effective interest rate method;
! convertible bonds, which are financial instruments comprised of a liability component and an equity component. The fair value of the liability component is estimated as of the issue date using the going market interest rate for similar, non-convertible bonds. The difference between the net amount raised by the issue

CONSOLIDATED FINANCIAL STATEMENTS AT DECEMBER 31, 2015 51
and the fair value assigned to the liability component, which represents the implicit option to convert the bonds into shares of Group companies, is posted to shareholders’ equity under other reserves.
Foreign currency transactions and net investments in foreign operations Transactions in foreign currencies are recorded using the exchange rates in effect on the transaction dates. Exchange gains or losses realised during the period are recognised in the income statement. At the balance sheet date, the Group companies have adjusted receivables and payables in foreign currency using exchange rates ruling at period-end, recognising all resulting gains and losses in the income statement. Exchange differences arising on a monetary item forming part of a net investment in a foreign operation are initially recognised in a separate component of equity and reversed to income at the time of recognising the gains or losses on the investment’s disposal.
Derivative financial instruments and hedging transactions The Group uses derivative financial instruments only with the intent of managing and hedging its exposure to the risk of fluctuations in exchange rates of currencies other than the Euro and in interest rates. As established by IFRS, derivative financial instruments qualify as hedging instruments only when at the inception of the hedge there is formal designation and documentation of the hedging relationship and of the risk management objective and strategy for undertaking the hedge. In addition, the Group checks at the inception of the hedge and throughout its duration that the hedging instrument used in the relationship is highly effective in offsetting changes in the fair value of cash flows attributable to the hedged risk. After initial recognition, derivative financial instruments are reported at their fair value. The method of accounting for gains and losses relating to such instruments depends on the type and sustainability of the hedge. The objective of hedging transactions is to offset the impact on income statement of exposures relating to hedged items. Fair value hedges for specific assets and liabilities are recorded in assets and liabilities; the hedging instrument and the underlying item are measured at fair value, and the respective changes in value (which generally offset each other) are recognised to the income statement. Cash flow hedges are recorded in assets and liabilities; the hedging instrument is measured at fair value and the effective portion of changes in value is recognised directly in the statement of comprehensive income and accumulated in an equity reserve, which is released to income in the financial periods in which the cash flows of the underlying item occur. The ineffective portion of the changes in value is recognised in the income statement. If a hedged transaction is no longer thought probable, the unrealised gains or losses, recognised through comprehensive income and accumulated in an equity reserve, are immediately recognised in the income statement. The shareholders’ equity of foreign subsidiaries may be subject to hedging, in order to protect investments in foreign companies from fluctuations in exchange rates (foreign exchange translation risk). Exchange differences resulting from these capital hedging transactions are debited or credited directly to the statement of comprehensive income and accumulated in equity as an adjustment to the translation differences reserve, and are reversed to income at the time of disposal or settlement. Derivative instruments for managing financial risks, which do not meet the formal requirements to qualify for IFRS hedge accounting, are recorded under financial assets/liabilities with changes in value reported through the income statement.
Share-based payments The cost of services provided by directors and/or employees remunerated through share-based incentive plans is based on the fair value of the rights at the grant date. The method to determine fair value takes into account all the characteristics at the grant date of the instrument (duration, price, exercise conditions, etc.) and of the stock subject to the option. This value is booked to the income statement on a straight-line basis over the vesting period and is offset by an entry to a shareholders’ equity reserve; the amount booked is based on an estimate of the stock options which will effectively vest for staff so entitled, taking into account the conditions of use that are not based on the market value of the shares.

52 CONSOLIDATED FINANCIAL STATEMENTS AT DECEMBER 31, 2015
The cost of any services provided by employees and/or directors and remunerated through share-based payments, but settled in cash, is measured at the fair value of the liability recorded in the Provisions for employee benefits. Fair value is remeasured at the end of each reporting period until such time as the liability is settled, with any changes recognised in the income statement.
Government grants Government capital grants are recognised at fair value when their amount can be reliably determined and it is reasonably certain that the conditions required for their receipt will be satisfied. Operating grants are recognised to the income statement in the same year as the costs to which they relate. Grants for investments in motorway infrastructure are recognised as construction services revenue in accordance with the accounting policy on Construction contracts and services work in progress. Capital grants related to assets received to fund development projects or activities are accounted for in liabilities, and are subsequently recognised in operating income in the income statement, in line with depreciation of the assets to which they refer. Any grants received to fund investments in property, plant and equipment are accounted for as a reduction in the carrying value of the asset to which they refer and result in a reduction in depreciation.
Employee benefits All employee benefits are recognised and disclosed on an accruals basis. According to local conditions and practice in the countries in which the Group operates, there are defined-benefit and defined-contribution plans. Post-employment benefit plans are formalised and non-formalised agreements whereby the entity provides post-employment benefits to one or more employees. Defined-contribution plans are post-employment benefit plans whereby the entity pays predetermined contributions to a separate entity (a fund) and have or will have no legal or construed obligation to pay additional contributions if the fund does not have sufficient assets to pay obligations towards employee. The amount accrued at year end is projected forward to estimate the amount payable on termination of employment and is then discounted using the projected unit credit method, to account for the time that will elapse before actual payment occurs. Due to changes in the system of Italian employee termination indemnities (Trattamento di fine rapporto or TFR) brought about by Law no. 296 of December 27, 2006 and by the decrees and regulations issued in early 2007 (the “Social security reform”), the Group has adopted the following accounting rules: ! TFR accrued at December 31, 2006 is treated as a defined-benefit plan in accordance with IAS 19. The
benefits promised to employees in the form of TFR, which are paid upon termination of service, are recognised in the period when the right matures;
! TFR accrued from January 1, 2007 is treated as a defined-contribution plan, so contributions accrued during the period are fully recognised as costs and shown as a liability under employee termination indemnities and other employee benefit provisions.
Gains or losses from changes in actuarial assumptions are recognised in the statement of comprehensive income.
Assets and liabilities held for sale and discontinued operations Where the carrying amount of assets or of assets and associated liabilities (disposal groups) is material and is to be recovered primarily through sale rather than through continued use, these items are presented separately in the balance sheet. They are classified, as appropriate, under Assets held for sale or Liabilities held for sale and the amounts cannot be offset. Immediately prior to being classified as held for sale, they are recognised under the specific IFRS applicable to each asset and liability, and subsequently accounted for at the lower of the carrying amount and estimated fair value less costs to sell. Any impairment losses are recognised immediately in the income statement.

CONSOLIDATED FINANCIAL STATEMENTS AT DECEMBER 31, 2015 53
Regarding their classification in the income statement, discontinued operations or operations held for sale are those that have either been sold or are classified as held for sale and that satisfy one of the following requirements: ! they represent a major line of business or geographical area of operation; ! they are part of a single coordinated plan to dispose of a major line of business or geographical area of
operation; ! they are subsidiaries acquired exclusively for the purpose of resale.
Gains and losses resulting from these operations, net of the tax effects, are recognised in a specific item in the consolidated income statement, together with comparative amounts.
Revenues Revenues are recognised to the extent that their fair value can be reliably measured and it is likely that the economic benefits will flow to the company. Depending on the type of transaction, revenue is recognised on the basis of the following specific criteria: ! toll revenues are recognised in the period in which they are earned on the basis of motorway usage. Due
partially to the fact that the Group’s network interconnects with other networks, and that it is consequently necessary to allocate revenues among the various concessionaires, a portion of toll revenues relating to the last part of the year are determined on the basis of reasonable estimates;
! revenues from the sale of goods, net of any returns and discounts, are recognised when the company transfers the main risks and rewards associated with ownership of the goods to the buyer and when collection of the relevant receivables is reasonably certain;
! revenues from rendering of services are recorded with reference to the stage of completion of the transaction as of the balance sheet date. Revenues are recorded in the financial period in which the service is provided, based on the percentage of completion method. If revenues from the services cannot be estimated reliably, they are only recognised to the extent that the relative costs are recoverable. This method appropriately discloses the services provided and the economic results achieved during the period;
! revenues in the form of rental income or royalties is recognised on an accruals basis, considering the terms and conditions of contract.
Revenues from sales by directly operated stores are recognised when the customer pays for the merchandise. The Group’s policy regarding returns by customers is quite restrictive, allowing these only in very specific circumstances (e.g. defective goods or late shipment). At the end of each year the Group considers past trends to estimate the overall amount of returns expected in the following year relating to sales in the year just ended. This amount is then deducted from revenues reported in that year.
Financial income and charges Interest income and charges are recorded on a time-proportion basis, using the effective interest method.
Dividends Dividends from third parties are recorded when the shareholders’ right to receive payment is established, following a resolution by the shareholders of the investee company.
Expense recognition Expenses are recorded on an accruals basis. Recoveries of costs borne on behalf of others are recognised as a deduction from the related cost.
Income and costs relating to leasing contracts Income and costs from operating lease contracts are recognised on a straight-line basis over the duration of the contract.

54 CONSOLIDATED FINANCIAL STATEMENTS AT DECEMBER 31, 2015
Income taxes Income taxes are calculated by each consolidated company on the basis of a reasonable estimate of taxable income, in accordance with applicable local regulations and taking account of any tax credits due. In fiscal year 2007, the Parent Company and certain Italian subsidiaries adopted the National Consolidated Taxation System. Per Articles 117 to 129 of the Tax Code, this system involves the calculation of a single overall income for the purposes of corporate income tax (IRES), by adding the incomes and/or losses of the Parent Company and participating subsidiaries. The Parent Company then pays the tax due or carries forward/receives a refund for any credit. The Parent Company also carries forward any consolidated loss. The relationships arising from participation in the Group tax election are governed by specific rules, approved and signed by all participating companies, which provide for full recognition of the amount calculated on the fiscal losses or profits transferred at current corporate tax rates (IRES). Payables for IRAP (regional business tax), due directly to the national tax authorities, are shown under current tax liabilities net of advances paid. Deferred taxes are recorded on temporary differences between balance sheet values and the corresponding values recognised for tax purposes, on consolidation adjustments, and in relation to the fiscal deferral or deductibility of revenues and costs. Deferred tax assets are recorded for all temporary differences to the extent it is probable that taxable income will be available against which the deductible temporary difference can be recovered. The same principle is applied to the recognition of deferred tax assets on the carry forward of unused tax losses. The carrying value of deferred tax assets is reviewed at every balance sheet date and, if necessary, reduced to the extent that it is no longer probable that sufficient taxable income will be available to recover all or part of the asset. Deferred tax liabilities, save for specific exceptions, are always recognised. Deferred tax assets and liabilities are not recognised if the temporary differences arise from initial recognition of goodwill (different from business combination transactions) or of other assets or liabilities in transactions that have no influence either on accounting profit or on taxable income. Deferred tax assets and liabilities are calculated using tax rates which are expected to apply in the period when the asset is realised or the liability settled, using the tax rates and tax regulations which are in force at the balance sheet date. It is possible to offset deferred tax assets and liabilities only if there is a legal right to offset the current tax balances, if the deferred balances refer to taxes levied by the same tax authority, and if the Group intends to settle current tax balances on a net basis. Tax assets and liabilities for current taxes are only offset if there is a legally enforceable right to set off the recognised amounts and if it is intended to settle or pay on a net basis or to realise the asset and settle the liability simultaneously.
Cash flow statement In compliance with IAS 7, the cash flow statement, prepared using the indirect method, reports the Group’s ability to generate “cash and cash equivalents”. Other cash equivalents comprise short-term highly liquid financial investments that are readily convertible to a known amount of cash and are subject to an insignificant risk of changes in value. Therefore, an investment normally qualifies as a cash equivalent only when it has a short maturity, that is when the original maturity is shorter than three months. Bank overdrafts qualify as borrowings, unless they are payable on demand and form an integral part of an enterprise’s cash and cash equivalents management, in which case they are classified as a component of cash and cash equivalents. Cash and cash equivalents included in the cash flow statement comprise the balance sheet amounts for this item at the reporting date. Cash flows in foreign currencies are translated at the average exchange rate for the period. Income and expenses relating to interest, dividends received and income taxes are included in cash flow from operating activities. In the Group’s layout, the following are reported separately:
CONSOLIDATED FINANCIAL STATEMENTS AT DECEMBER 31, 2015 55
! operating cash flow: cash flow from operating activities originates mostly from revenue-generating activities and is presented by the Group using the indirect method; this method adjusts net income statement for the effects of items which did not result in cash outflows or generate liquidity (i.e. non-cash transactions);
! investing cash flow: investing activities are reported separately, in part because they are indicative of investments/ divestments aimed at the future generation of revenues and positive cash flows;
! financing cash flow: financing activities consist of the cash flows which determine a change in the size and composition of shareholders’ equity and loans granted.
Use of estimates The preparation of the financial statements and notes in accordance with IFRS requires management to make estimates and assumptions that affect the carrying values of assets and liabilities and the disclosure of contingent assets and liabilities as of the reporting date. Final results may be different from the estimates. The Group has used estimates for valuing, in particular, assets subject to impairment testing and provisions for doubtful accounts, inventory obsolescence, depreciation and amortisation, employee benefits, deferred taxes, restructuring, and for measuring the fair value of financial assets and liabilities. Estimates and assumptions are reviewed periodically and any changes are reflected immediately in the income statement.

56 CONSOLIDATED FINANCIAL STATEMENTS AT DECEMBER 31, 2015
NOTES TO ASSETS ITEMS (All figures in thousands of Euro) Individual items in the consolidated statement of financial position at December 31, 2015 are commented on below. The statements of financial position of the World Duty Free group at December 31, 2014 and of the Atlantia group companies connected to the Ecomouv’ Project were reclassified under Assets/liabilities held for sale, Note 17. The changes in scope occurred in 2015 essentially concerned the consolidation of Autostrada Tirrenica S.p.A. by the Atlantia group and the disposal of a US real estate company.
NON-CURRENT ASSETS
1 Property, plant and equipment
The gross value, accumulated depreciation and impairment, and net book value of the Group’s property, plant and equipment are detailed below:
12.31.2015 12.31.2014
(Thousands of Euro) Gross Accumulated deprecia-
tion and impairment Net Gross
Accumulated depre-ciation and impair-
ment Net
Land and buildings 1,174,335 (452,308) 722,027 1,195,372 (408,721) 786,651
Investment property 145,997 (33,165) 112,832 145,056 (30,594) 114,462
Plant, machinery and equipment 1,759,110 (1,379,827) 379,283 1,710,634 (1,329,454) 381,180
Furniture, furnishings and electronic equipment 470,066 (386,573) 83,493 471,351 (389,454) 81,897
Assets to be relinquished 398,207 (323,321) 74,886 392,147 (309,090) 83,057
Leasehold improvements 1,229,296 (817,374) 411,922 1,166,353 (808,044) 358,309
Other tangible assets 152,955 (100,810) 52,145 153,529 (106,477) 47,052
Assets under construc-tion and advances 204,846 - 204,846 160,470 - 160,470
Total 5,534,812 (3,493,378) 2,041,434 5,394,912 (3,381,834) 2,013,078

CONSOLIDATED FINANCIAL STATEMENTS AT DECEMBER 31, 2015 57
The following table reports movements in 2015 and in 2014 in property, plant and equipment, stated net of accumulated depreciation. 2014 movements included the assets held for sale of the Atlantia group and the World Duty Free group, as their reclassification to Assets and liabilities held for sale (Note 17) concerns only the balances at December 31, 2014 of those groups' property, plant and equipment.
(Thousands of Euro) Land and buil-
dings Investment
property
Property, plant, machi-
nery and equipment
Furniture, furnishings
and eletronic equipment
Asset to be relinqui-
shed Leasehold
improvements Other tangible
assets
Assets under construction
and advances Total Balance at 01.01.2014 948,717 59,245 501,276 92,864 92,641 339,173 51,439 158,213 2,243,568
Additions 6,716 12 86,608 37,174 8,399 24,515 14,856 204,063 382,343
Disposals (49,102) - (2,895) (998) (40) (1,093) (1,762) (6,813) (62,703)
Depreciation (25,614) (2,018) (159,483) (31,578) (22,223) (79,683) (12,730) - (333,329)
Impairments (1,909) (556) (4,787) (10,499) (4,304) (6,816) (2,824) (9) (31,704) Impairment rever-sals - - - 17 - - - - 17 Changes in scope of consolidation (76) - (17,437) (154) - 570 (83) (2,367) (19,547)
Reclassification to discountinued ope-rations (4,183) (5,636) (120,162) (6,000) - (12,619) (2,360) (30,644) (181,604) Translation diffe-rences (25,486) (28) 14,166 336 - 30,595 (1,730) 9,166 27,019
Other movements (62,412) 63,443 83,894 735 8,584 63,667 2,246 (171,139) (10,982) Balance at 12.31.2014 786,651 114,462 381,180 81,897 83,057 358,309 47,052 160,470 2,013,078
Additions 16,149 10 42,192 32,840 7,435 25,924 17,905 243,472 385,927
Disposals (3,836) (8) (13,133) (2,735) (20) (847) (576) (415) (21,570)
Depreciation (23,797) (1,785) (130,108) (28,681) (23,171) (89,138) (12,206) (3) (308,889)
Impairments (35,326) (500) (4,174) (2,885) (3,133) (7,607) (1,254) (1,609) (56,488) Impairment rever-sals 131 - 28 - - - - - 159 Changes in scope of consolidation (10,816) - (1,552) 39 - (5,583) - (590) (18,502) Translation diffe-rences (6,984) - 11,715 (270) - 26,565 (6,353) 8,487 33,160
Other movements (145) 653 93,135 3,288 10,718 104,299 7,577 (204,966) 14,559 Balance at 12.31.2015 722,027 112,832 379,283 83,493 74,886 411,922 52,145 204,846 2,041,434
Investments in property, plant and equipment in 2015 amounted to Euro 385,927: Euro 210,875 by the Autogrill group, Euro 95,525 by the Atlantia group, Euro 32,088 by the Benetton group, and Euro 12,146 by the Edizione Property group. Autogrill group's investments were mainly concentrated in the North American airport channel. Benetton group's investments focused on sales network (directly operated stores) in Italy, Russia, France and Mexico. The Edizione Property group acquired property units adjacent to the property it owns in Paris. Impairment losses totalling Euro 56,488 were recognised in the year and are explained for Euro 35,627 by the losses recognised by the Edizione Property group with respect to some commercial properties written down to their recoverable amount. The remaining part of the impairment can be attributed to the Autogrill group (Euro 12,556), Benetton group (Euro 4,866), a real estate subsidiary (Euro 2,177) and the Atlantia group (Euro 1,262). Translation differences, positive for Euro 33,160, mostly concern the Autogrill group (positive by Euro 49,781) and the real estate subsidiaries in Argentina (negative by Euro 8,858). Changes in scope of consolidation refer to the net balance between consolidation of the Società Autostrada Tirrenica business and sale of a US real estate company's business.

58 CONSOLIDATED FINANCIAL STATEMENTS AT DECEMBER 31, 2015
Assets to be relinquished are property, plant and equipment that will revert to the grantor upon expiry of the concession or sub-concession, either free of charge or against payment of their residual carrying value by the new concession holder. They are all held by the Autogrill group.
Leasehold improvements refer to the renovation of non-proprietary stores and the expenses incurred to build or improve properties and businesses run under leasing or concession agreements. The items in the following table include the contractual value of property, plant and equipment held under finance leases: (Thousands of Euro) 12.31.2015 12.31.2014
Land and buildings 7,365 8,399
Plant, machinery and equipment 688 2,685
Assets to be relinquished 5,108 5,108
Leasehold improvements - 519
Other assets 4,268 3,539
Accumulated depreciation (8,650) (10,165)
Total 8,779 10,085 The long-term portion of the residual amount of lease repayments at December 31, 2015 is recognised as Lease financing under non-current liabilities (Euro 11.531); the short-term portion is reported as Current portion of lease financing (Euro 3,578). See Note 26 for details. The fair value of investment property is greater than the stated balance sheet value. Additionally, some properties of the Edizione Property group have been identified as Relevant Properties to guarantee a credit line underwritten by Edizione Property S.p.A. (formerly Schematrentanove S.p.A.). In case of disposal of these properties, if compliance with the covenant so require, a partial repayment of the credit line will have to be made, unless the Relevant Properties have been replaced with other properties and subject to the prior consent of the majority of the lender banks. At December 31, 2015, this credit line is entirely unused.

CONSOLIDATED FINANCIAL STATEMENTS AT DECEMBER 31, 2015 59
2 Intangible assets
Movements in intangible asset items in 2015 and the previous year were as shown in the table below. As specified for property, plant and equipment, 2014 movements included the assets held for sale of the Atlantia group and the World Duty Free group, as their reclassification to Assets/liabilities held for sale, Note 17, concerns only the balances at December 31, 2014 of these groups' intangible assets.
(Thousands of Euro)
Goodwill and other intangible assets of indefinite useful life
Intangible assets deri-ving from concession
rights Patent rights
Concessions, licenses, trade-
marks and similar rights Deferred charges
Other intangible assets Total
Balance at 01.01.2014 6,758,259 20,217,858 4,693 614,636 82,852 480,627 28,158,925
Additions - 2,595 512 32,846 1,111 44,719 81,783 Additions due to execution of construction services - 424,369 - - - - 424,369 Changes due to update of con-cession plans - 457,757 - - - - 457,757
Disposals - (5,294) - (205) (1,281) (213) (6,993)
Depreciation - (760,131) (1,780) (86,224) (8,848) (67,624) (924,607)
Impairments - - (369) (155) (9,691) (65) (10,280) Changes in scope of consolida-tion - 12,018 - - 83 - 12,101
Impaiment reversals - - (25) (7) - (152) (184) Reclassification of assests held for sale (667,493) - (6) (520,791) - (6,871) (1,195,161)
Translation differences 97,341 (26,075) 226 28,595 161 1,370 101,618
Other movements (49) (11,410) 13 1,544 (95) 7,793 (2,204)
Balance at 12.31.2014 6,188,058 20,311,687 3,264 70,239 64,292 459,584 27,097,124
Additions - 3,690 694 15,511 667 41,331 61,893 Additions due to execution of construction services - 570,751 - - - - 570,751 Changes due to update of concession plans - 9,018 - - - - 9,018
Disposals (335,947) - (2) (67) (3,825) (564) (340,405)
Depreciation (38) (798,584) (1,884) (22,878) (6,369) (67,338) (897,091)
Impairments (2,802) - (1) (166) (3,922) (5) (6,896) Changes in scope of consolidation (2,810) 346,022 - 84 - 62 343,358
Translation differences 62,909 (418,053) (15) 248 262 (4,662) (359,311)
Other movements - (34,301) (5) 1,431 17 12,717 (20,141)
The balance of Goodwill and other intangible assets of indefinite useful life at December 31, 2015 consists essentially of goodwill pertaining to the Atlantia group (Euro 5,045,636) and the Autogrill group (Euro 818,421). The decrease in this item refers entirely to the amount of goodwill allocated to the higher value of the investment in Atlantia, which was attributed to former shareholders of the subsidiary Sintonia, following the company's demerger in 2015. Goodwill and other intangible assets of indefinite useful life are subject to impairment testing once a year. Impairment losses recognised during the year under review amounted to Euro 2,802. Translation differences pertain to the Autogrill group for Euro 62.735.

60 CONSOLIDATED FINANCIAL STATEMENTS AT DECEMBER 31, 2015
Concession rights pertain solely to the Atlantia group and are broken down as follows: (Thousands of Euro) 12.31.2015 12.31.2014
Acquired concession rights 6,087,169 6,543,078 Concession rights deriving from construction services for which no additional economic benefits are received 8,438,603 8,824,429 Concession rights deriving from construction services for which additional economic benefits are received 5,415,985 4,868,704
Concession rights deriving from construction services carried on by service area operators 48,473 75,476
Total 19,990,230 20,311,687 Acquired concession rights are recognised against the cash outlays incurred to obtain concessions from the grantor or from third parties; in particular, they refer to the fair value of the concession rights recognised following the acquisitions of Aeroporti di Roma and the motorway operators in Chile and Brazil. Rights relating to construction services for which no additional economic benefits are received have accrued against construction service commitments by operators in the Atlantia group. Rights deriving from construction services for which additional economic benefits are received (specific tariff increases and/or significant increases in the number of expected users due to infrastructure expansion) also pertain to the Atlantia group. Rights deriving from construction services provided by suboperators are recognised against investments carried out by service area operators that are handed over free of charge to the Atlantia group. The principal changes in this item are an increase of Euro 570,751 in the amount of investments carried out in 2015 relating to construction and/or upgrade services for which additional economic benefits are received; amortisation of Euro 798,584; and the negative balance of exchange losses amounting to Euro 418,053, mainly attributable to depreciation of the Brazilian real. Changes in the scope of consolidation refer for Euro 346,022 to registration of Società Autostrada Tirrenica's concession rights, including capital gains as a result of the acquisition of a controlling interest finalised in 2015. In 2014 the reversal of impairment losses on concession rights pertains to the Atlantia group's motorway operator in Poland. Concessions, licenses, trademarks and similar rights at December 31, 2015 refer to the Autogrill group for Euro 38.504; the remainder consists primarily of licenses and trademarks owned by the Atlantia group (Euro 19,776) and the trademarks owned by the Benetton group (Euro 5,971). Deferred charges consist of key money for the acquisition of retail operations by the Benetton group, which is amortised over the term of the related lease contracts. Impairment losses with respect to key money came to Euro 3,922. Other intangible assets include Euro 331,759 for the commercial contractual relationships quantified during the fair value measurement of the assets and liabilities acquired with the Aeroporti di Roma group in 2013. Other intangible assets also include the cost of purchasing and developing software, of which Euro 20.481 pertains to the Benetton group, Euro 8.874 to the Autogrill group and Euro 9,548 to the Atlantia group. In addition, this item includes assets under construction and advances (Euro 36,813).

CONSOLIDATED FINANCIAL STATEMENTS AT DECEMBER 31, 2015 61
Impairment testing According to the rules of IAS 36, the Group has: ! checked for any indication that its property, plant and equipment or intangible assets of finite useful life might
be impaired; ! compared the recoverable amount of its intangible assets of indefinite useful life and of its intangible assets
not yet available for use with their corresponding carrying amounts; such a comparison was carried out irrespective of the occurrence of events indicating that the carrying amount of such assets might be impaired.
The main write-downs recognised in 2015 by the Benetton group are as follows: ! stores in which the group has invested, whether operated directly or by partners, were divided into two
categories: - "discontinuing stores" due for closure or sale to third-party customers, which have been the subject of
direct write-downs; - "continuing stores" that will remain in operation for at least the next two years, for which the future cash
flows have been determined.
Each is treated as a separate CGU, for which the net present value of future cash flows (value in use) is calculated. If value in use is found to be lower than the carrying amount of the CGU, the latter's assets have been impaired. In 2015 the classes of property for which impairment losses were recognised included furniture and furnishings, deferred charges ("key money") and leasehold improvements mainly in Spain, Italy and India;
! if there are indications of a possible write-down, the "fonds de commerce", included in the "deferred charges" category, are the subject of an assessment to determine whether their recoverable value is higher than their net book value. In 2015, some "fonds de commerce" in France and Belgium were written down;
! the goodwill arising from the acquisition of a Swiss company through a business combination was the subject of specific evaluation, and highlighted cash flows of the acquired business activities that were sufficient to cover the value of the same.
The Edizione Property group identified assets and CGUs (consisting of the individual buildings) to be impairment tested, as well as the test procedures. For non-current assets, the impairment test is carried out by comparing the carrying amount of the asset or CGU against its recoverable value, defined as the higher of fair value (net of any costs to sell) and value in use. Value in use is determined by calculating the present value of future net cash flows expected to be generated by the asset or CGU. For some properties of the Edizione Property group, which showed indicators of impairment, write-downs were carried out in accordance with the three-year plan approved by the company's Board of Directors, which dictated the guidelines for exiting certain countries considered no longer strategic for the group and for which there will be no future cash flows sufficient to repay the net carrying amount of the property entered in the balance sheet. Additionally, the macroeconomic indicators of some countries (e.g. inflation rates and devaluation of the local currency), and particularly Russia, Ukraine and Kazakhstan, had negative effects on asset value. The Olimpias group carried out the impairment test with the Discount Cash Flow (DCF) method to determine the value in use of the Cash Generating Units (CGUs), with the related estimate of the discount rate (Weighted Average Cost of Capital, WACC) and the perpetual growth rate (g), in continuity with the method used in the previous year except for the following: ! the analysis was carried out separately for the Textile GCU and the Clothing GCU, while in the previous year
the sum of the values in use of each CGU had been compared against the total invested capital of Olimpias Group;

62 CONSOLIDATED FINANCIAL STATEMENTS AT DECEMBER 31, 2015
! compared to the previous year, and in accordance with the redesign of internal control as a result of the successful segmentation process, the Olimpias Knitting business, being entirely devoted to the Clothing area, was included in the scope in this area (in 2014 it was included in the Textile area).
The value of the Textile & Clothing CGU was found reasonable in relation to the relevant invested capital. Impairment losses likewise concerned some assets of the Autogrill group. Except for goodwill, impairment testing is performed on the individual contract or store considering future cash flows (without incorporating any assumed efficiency gains), discounted at the average cost of capital, which reflects the cost of money and the specific business risk attributable to each country. When testing goodwill for impairment, the CGUs are identified on the basis of business segment, following a geographical/operational logic, consistently with the minimum level at which goodwill is monitored for internal management purposes. The recoverability of the goodwill allocated to each CGU is verified by estimating its value in use, defined as the present value of estimated cash flows based on the 2016 budget and forecasts for 2017-2020, discounted at a rate differentiated by geographical area and reflecting the risks specific to the individual CGU on the measurement date. On the basis of the assumptions made, for 2015 the goodwill allocated to each CGU was found to be fully recoverable. In the Atlantia group, each concession holding company is treated as a separate CGU. The subsidiaries that do not hold motorway concessions are also identified as individual CGUs. The recoverability of goodwill and concession rights was assessed using the long-term plans drawn up by each company, which report traffic, investment, cost and revenue projections for the full term of the concession contract, on the basis of the financial plans annexed to the concession agreements signed with the grantor. Almost all goodwill is allocated to a single concession holder (Autostrade per l’Italia S.p.A.); impairment testing confirms that it is fully recoverable. The discount rate (WACC) used to determine the present value of projected cash flows depends on the cost of money and the specific country risk of the business. The nominal growth rate (g rate) of projected cash flows not stated expressly in financial plans ranges from 1% to 4.5%. The specific forecast period does not exceed five years, with the exception of the CGUs of the Atlantia group, for which projections are based on business and financial plans developed for the full term of the concession period.

CONSOLIDATED FINANCIAL STATEMENTS AT DECEMBER 31, 2015 63
The results of impairment testing in 2015 are summarised in the following table which reports, by business segment and type of asset, the impairment losses recognised for the year:
(Thousands of Euro) Textiles &
clothing Food &
beverage Real estate
Infrastructures and services for
mobility Other business Total
Property, plant and equipment
Buildings - 546 33,103 - 2,177 35,826
Plant, machinery and equipment 182 3,503 481 8 - 4,174 Furniture, furnishings and electronic equipment 2,587 27 271 - - 2,885
Leasehold improvements 2,097 5,347 163 - - 7,607
Other - 3,133 1,609 1,254 - 5,996
Total property, plant and equipment 4,866 12,556 35,627 1,262 2,177 56,488
Intangible assets Intangible assets of indefinite useful life 861 - - - 1,941 2,802
Intangible assets of finite useful life 3,929 165 - - - 4,094
Total intangible assets 4,790 165 - - 1,941 6,896
Total 9,656 12,721 35,627 1,262 4,118 63,384
3 Equity investments in subsidiaries
This item is made up of non-significant subsidiaries that are not included in the consolidation.
4 Equity investments in associates and joint-ventures
The main investments in associated companies and joint ventures are as follows: 12.31.2015 12.31.2014
(Thousands of Euro) % held Carrying value % held Carrying value
Eurostazioni S.p.A. 32.71% 49,220 32.71% 49,220
Società Autostrada Tirrenica p.A. - - 24.98% 28,268
Rodovias do Tietê S.A. 50.00% 17,698 50.00% 30,443
Pune-Solapur Expressway Private Ltd. 50.00% 6,786 50.00% 11,192
Società Infrastrutture Toscane S.p.A. (in liquidation) 46.60% 6,808 46.60% 5,622
Other investments - 11,538 - 13,298
Total 92,050 138,043 Società Autostrada Tirrenica p.A. was wholly consolidated by the Atlantia group in 2015. The change in the value of the investment in Rodovias do Tietê concerns capital contributions for Euro 7 million and the negative effect of its measurement using the equity method for Euro 20 million. The change in value of the other equity investments is due to their measurement using the equity method.

64 CONSOLIDATED FINANCIAL STATEMENTS AT DECEMBER 31, 2015
5 Equity investments in other companies
Because these investments are “available for sale” in accordance with IAS 39, they are recognised at fair value, and gains and losses from the valuation (except impairment losses, which are recognised in the income statement) are charged to a shareholders' equity reserve. If the fair value of these assets cannot be determined reliably, they are measured at cost, and adjusted for any impairment. For equity investments in listed companies, fair value is taken as the average stock market price in December 2015. Equity investments in other companies are as follows: 12.31.2015 12.31.2014 (Thousands of Euro) % held Carrying value % held Carrying value
Assicurazioni Generali S.p.A. 0.94% 192,030 0.94% 249,105
Pirelli & C. S.p.A. - - 4.61% 243,840
Mediobanca S.p.A. 2.16% 163,702 2.16% 129,035
Hermès International SCA 0.21% 69,864 - -
Tangenziali Esterne di Milano S.p.A. 13.67% 34,544 13.67% 34,544
LBrands Inc. 0.13% 34,196 - -
Compagnia Aerea Italiana S.p.A. 7.02% - 5.96% 27,223
Club Méditerranée S.A. - - 2.22% 17,417
Lusoponte 17.21% 15,339 - -
Gruppo Banca Leonardo S.p.A. 1.83% 6,606 1.93% 7,212
Tangenziale Esterna S.p.A. 1.25% 5,811 1.25% 4,527
Il Sole 24 Ore S.p.A. 2.00% 1,708 2.00% 1,638
Other investments - 10,900 - 8,201
Total 534,700 722,742 The table below shows movements during the year in Equity investments in other companies:
(Thousands of Euro) Fair value at 12.31.2014
Additions/ Disposals
Impaiment losses
Fair value adjustments
Fair value at 12.31.2015
Assicurazioni Generali S.p.A. 249,105 - (57,075) - 192,030
Pirelli & C. S.p.A. 243,840 (243,840) - - -
Mediobanca S.p.A. 129,035 - - 34,667 163,702
Hermès International SCA - 72,216 - (2,352) 69,864
Tangenziali Esterne di Milano S.p.A. 34,544 - - - 34,544
LBrands Inc. - 33,854 - 342 34,196
Alitalia-Compagnia Aerea Italiana S.p.A. 27,223 9,026 (36,249) - -
Club Méditerranée S.A. 17,417 (17,417) - - -
Lusoponte - 15,339 - - 15,339
Gruppo Banca Leonardo S.p.A. 7,212 (606) - - 6,606
Tangenziale Esterna S.p.A. 4,527 1,284 - - 5,811
Il Sole 24 Ore S.p.A. 1,638 - - 70 1,708
Other investments 8,201 2,699 - - 10,900
Total 722,742 (127,445) (93,324) 32,727 534,700 In October 2015, all the shares held by the Group in Pirelli & C. S.p.A., part of which to service the convertible bond issued by the subsidiary company Schematrentaquattro S.p.A., were transferred to the tender offer launched by Marco Polo Industrial Holding S.p.A. (wholly-owned subsidiary of China National Tire & Rubber Co.) at a price of Euro 15.00 per share. The consolidated capital gain realised by the Group amounted to Euro 260.8 million.

CONSOLIDATED FINANCIAL STATEMENTS AT DECEMBER 31, 2015 65
In 2015, the Parent Company acquired shares of Hermès International SCA and of LBrands Inc. The value of the investment in Compagnia Aerea Italiana S.p.A. (formerly Alitalia - Compagnia Aerea Italiana) at December 31, 2015 was completely written off. In February 2015, the Parent Company participated in the tender bid on Club Méditerranée shares launched by Gaillon Invest II at a price of Euro 24.60 per share; it then transferred the shares, equal to 2.2% of the share capital and the bonds convertible into shares held by the parent, realising a capital gain of Euro 12.3 million. The minority interest in Lusoponte was reclassified under Equity investments in other companies, after it no longer met IFRS 5 requirements for it to be classified as an asset held for sale.
6 Investment securities
The balance refers to the fair value of the shares held in investment funds owned by the Parent Company for Euro 506,892 and by the subsidiary Schemaquattordici S.p.A., for Euro 1,608. In November 2015, the Parent Company subscribed 100% of the shares of the Luxembourg-based Quaestio Opportunity Fund, with a nominal value of Euro 500 million.
7 Other non-current financial assets
The balance at the end of 2015 includes the following: (Thousands of Euro) 12.31.2015 12.31.2014
Non-current portion of financial assets deriving from concession rights 766,499 704,347
Convertible term deposits 324,894 291,189
Financial assets deriving from government grants related to construction services 255,662 215,023
Financial receivables from Group companies 385,183 448,106
Financial receivables from grantors - 56,042
Other financial receivables and assets 44,458 45,765
Total 1,776,696 1,760,472 The Non-current portion of financial assets deriving from concession rights refers to the Atlantia group and includes: ! the present value of the minimum tolls guaranteed by the grantor of the concessions held by certain of the
group's Chilean motorways operators in accordance with the concession agreements (Euro 578,236); ! the financial assets attributable to the investments of the Chilean motorway operator Costanera Norte (Euro
188,263).
Convertible term deposits consist of the loans disbursed by banks for the construction of new infrastructure; they will be released and made available to the Atlantia group based on percentage of completion of these works. Financial assets deriving from government grants related to construction services consist of amounts receivable from concession grantors, or other public entities, for grants accrued on the Atlantia group's construction of motorway infrastructure during the year and increase essentially for grants accrued during the year by Autostrade per l’Italia. Financial receivables from associates refer to the amount due to the subsidiary Atlantia Bertin Concessões from Infra Bertin Empreendimentos (the company in charge of constructing and managing the ring road southeast of São Paulo) to finance its investment plan. The change compared to the previous year is due for Euro 121,722 to negative foreign exchange differences realised during the year, and for Euro 58,799 to the capitalisation of interest income.

66 CONSOLIDATED FINANCIAL STATEMENTS AT DECEMBER 31, 2015
At December 31, 2014 Financial receivables from concession grantors refer wholly to the non-current receivable due to Vespucio Sur, a member of the Atlantia group, by the concession grantor to compensate for lost toll revenue as a result of the concession's delayed start with respect to the date established in the contract. Other non-current financial assets are broken down below by maturity (Thousands of Euro) 12.31.2015 12.31.2014
From 1 to 5 years 1,371,028 779,865
Beyond 5 years 405,668 980,607
Total 1,776,696 1,760,472
8 Other non-current receivables
This item, with a balance of Euro 98,098, pertains mostly to: ! the Benetton group for trade receivables (Euro 16,865), security deposits (Euro 28,114), VAT receivables
(Euro 1,521); ! the Autogrill group for concession fees paid in advance (Euro 11,158) and security deposits (Euro 8,016); ! the Atlantia group for receivables from concession grantors (Euro 6,771) and security deposits (Euro
10,499).
9 Deferred tax assets
The nature and composition of net deferred tax assets are broken down below: (Thousands of Euro) 12.31.2015 12.31.2014
Tax effect on deductible intercompany goodwill 509,726 666,281
Tax effect on the adoption of IFRIC 12 445,524 519,690
Tax effect on provisions and costs relating to future periods for fiscal purposes 702,275 693,147
Tax effect on different basis for amortization, depreciation and impairment 228,293 192,559
Benefit on carried forward tax losses 144,482 156,889
Tax effect on intercompany profits elimination 2,521 4,520
Other deferred tax assets 431,106 435,139
Total deferred tax assets 2,463,927 2,668,225
Total offsettable deferred tax liabilities (657,913) (631,599)
Total deferred tax assets, net 1,806,014 2,036,626 For the sake of clarity, the following paragraphs describe separately the nature of tax assets generated by the Atlantia, Benetton and Autogrill groups.
Atlantia group The balance of Euro 1,574,566 at December 31, 2015 is comprised mainly of residual deferred tax assets (Euro 509,726) arising from the transfer of motorway assets to Autostrade per l’Italia and that company's recognition of deductible goodwill, as well as deferred tax assets of Euro 445,524 originating from Autostrade per l’Italia's adoption of IFRIC 12, to be released throughout the life of the concession.
Benetton group The balance of this item (Euro 158,916) is comprised mainly of deferred tax assets recognised on the different basis for the amortisation and depreciation of non-current assets, measured according to the estimated future recoverability of the tax benefits, and of taxes recognised on costs, provisions and revenues deductible in future

CONSOLIDATED FINANCIAL STATEMENTS AT DECEMBER 31, 2015 67
accounting periods. In particular it consists of taxed provisions (provision for doubtful accounts, inventory write-down provision and provisions for risks and charges), as well as tax benefits related to the release of the values involved in the 2003 corporate reorganisation. Additional tax benefits for euro 70 million were not valued at the balance sheet date.
Autogrill group The deferred tax assets of the Autogrill group amount to Euro 45,511. At December 31, 2015, tax losses for which deferred tax assets have not been recognised amount to Euro 193,395. The corresponding unrecognised tax benefit comes to Euro 54,059.

68 CONSOLIDATED FINANCIAL STATEMENTS AT DECEMBER 31, 2015
CURRENT ASSETS
10 Inventories
Inventories are broken down below: (Thousands of Euro) 12.31.2015 12.31.2014
Raw materials, other materials and consumables 243,333 240,520
Work in progress and semi-manufactured products 40,359 37,817
Finished goods 304,419 312,425
Construction contracts in progress 16,473 20,090
Advances 17 26
Total 604,601 610,878 Inventories are stated net of the write-down provision of Euro 58,787 (Euro 53,645 at December 31, 2014), of which Euro 37,403 pertains to the Benetton group.
11 Trade receivables
At December 31, 2015, trade receivables, net of the provision for doubtful accounts, were as follows: (Thousands of Euro) 12.31.2015 12.31.2014
Trade receivables 2,115,710 2,080,828
Provision for doubtful accounts (404,762) (401,744)
Total 1,710,948 1,679,084 Trade receivables, net of the relevant write-down provision, include Euro 336,781 pertaining to the Benetton group and Euro 1,297,864 pertaining to the Atlantia group. The total amount of receivables is increasing due to two opposite factors: compared to the previous year, the Benetton group recorded a reduction in the amount of trade receivables, both because of lower revenues and of improved receipts from customers; while the Atlantia group experienced an increase that involved customers in the motorway and airport segments and in the other segments in which the group operates. Movements in the provision for doubtful accounts are summarised below:
(Thousands of Euro) 01.01.2015 Additions Uses Releases to sta-
tement of income Reclassification
IFRS 5
Other movements and translation
differences 12.31.2015 Provision for doub-tful accounts 401,774 39,141 (48,367) (1,289) (3,244) 16,747 404,762
At the end of the year, there were no receivables factored without recourse.
12 Tax receivables
This item includes: ! tax refunds due in the amount of Euro 43,772 (Euro 16,084 at December 31, 2014); ! tax refunds due in the amount of Euro 59,551 (Euro 61,815 at December 31, 2014): in particular for the
deduction of a portion of IRAP (regional tax) from IRES (corporate tax).

CONSOLIDATED FINANCIAL STATEMENTS AT DECEMBER 31, 2015 69
13 Other current receivables, accrued income and prepaid expenses
The item is detailed as follows:: (Thousands of Euro) 12.31.2015 12.31.2014
Other receivables
Advances paid to suppliers 79,682 112,443
VAT credits 82,271 70,357
Receivables due from motorway end-users and insurance companies for damages 24,469 33,325
Advances to employees and agents 5,245 6,044
Receivables due from social security institutions 6,808 5,799
Receivables from public entities 23,196 26,075
Other receivables from tax authorities 18,206 6,694
Other receivables 189,240 160,702
Total 429,117 421,439
Accrued income and prepaid expenses
Concession and leasing fees paid in advance 16,497 23,040
Rents and leases 10,878 13,063
Other accrued income and prepaid expenses 39,438 38,083
Total accrued icome and prepaid expenses 66,813 74,186
Total other receivables, accrued income and prepaid expenses 495,930 495,625 Advances paid to suppliers concern the Autogrill group for Euro 29,503, comprised of promotional contributions and bonuses awaiting settlement as well as amounts paid in advance for services; the Atlantia group for Euro 44,485, consisting of advances paid to awarders of contracts in the motorway and airport channels; and the Benetton group for Euro 6,552. The reduction compared to the previous year is attributable for approximately Euro 20 million to the Atlantia group, because of fewer services provided by suppliers during the year. The change (increase) in VAT receivables is attributable for approx. Euro 12 million to the Atlantia group, for approx. Euro 4 million to the Olimpias group and for approx. Euro 2 million to the parent company. VAT receivables of the Autogrill group decreased by about Euro 7 million due to the sale without recourse of a VAT receivable. Receivables due from motorway end-users and insurance companies for damages refer to the reimbursement of damages caused to motorways. The balance of Other receivables from tax authorities (Euro 15 million), is attributable to the Edizione Property group. The item includes a receivable from the US tax authorities for a withholding tax incurred with reference to the sale of US real estate company. This receivable was collected in March 2016. Other receivables were contributed mainly by: ! the Autogrill group (Euro 40,728) for amounts due from sub-concession holders, advances to concession
grantors for investments made on their behalf or on behalf of sub-concessionaires, and receivables from credit card companies;
! the Benetton group for Euro 6,207, including other tax receivables, insurance receivables, and short-term security deposits. In the previous year this item included a Euro 11 million receivable for the compensation that a French subsidiary subsequently received during the third quarter of 2015 for the sale of a property in Paris;

70 CONSOLIDATED FINANCIAL STATEMENTS AT DECEMBER 31, 2015
! the Olimpias group, Euro 10,205, which includes a Euro 4.5 million receivable from the Serbian State as a contribution to planned investments by a subsidiary in the production hub in Serbia, collection of which is expected in June 2016; and a Euro 2 million receivable owed to the same Serbian company by external laboratories, for grants paid by the latter to the laboratories in advance, as opposed to the accrual principle according to which they should have been paid. The portion of the grant that does not follow the accrual principle, which will be transferred to the said external laboratories, was deferred and recognised in current liabilities, Note 33, and the item Other payables, accrued expenses and deferred income amounted to Euro 9.5 million;
! for the remaining Euro 131,014, mainly pertaining to the Atlantia group, which, compared with 2014, increased by Euro 27 million due to a receivable from the insurance company recognised by the subsidiary Aeroporti di Roma, as amount included in the minimum refundable limit applicable to the Fire coverage, in relation to costs incurred in 2015 for the implementation of safety measures and the restoration of the areas impacted by the fire in Terminal 3 of the Fiumicino airport.
This item is shown net of provisions for doubtful accounts (Euro 34,224), of which Euro 29,748 pertains to the Atlantia group. The provision relates chiefly to amounts pertained to Stalexport Autostrady by its associates, which are currently insolvent, and whose loans from the local authorities have therefore been repaid by the Polish company in its capacity as guarantor. Other accrued income and prepaid expenses refers to maintenance fees, insurance policies, advertising and sponsorship costs.
14 Other current financial assets
This item is summarised as follows: (Thousands of Euro) 12.31.2015 12.31.2014
Current financial assets deriving from concession rights 435,511 428,933
Convertible term deposits 221,834 250,018
Financial assets deriving from government grants related to construction services 74,627 79,847
Financial receivables from Group companies 18 116,667
Financial receivables from third parties 51,721 56,189
Derivatives: fair value hedges 24,074 16,250
Derivatives: cash flow hedges 21,473 30,888
Accrued income on derivative transactions 63,146 48,455
Other financial accrued income and prepaid expenses 8,562 9,285
Total 900,966 1,036,532 Current financial assets deriving from concession rights, Convertible term deposits, and Financial assets deriving from government grants related to construction services consist of the current portion of the Atlantia group assets discussed in Note 8, Other non-current financial assets. Current financial assets deriving from concession rights consist mostly of the value of the takeover rights of Autostrade Meridionali S.p.A. (Euro 403,293), due by the motorway operators that will take over the concession when it expires to compensate for investments carried out during the final years of the concession that have not yet depreciated. This heading also includes the current portion of the present value of the minimum guaranteed revenues that various Chilean motorway concession holders in the Atlantia group will receive from the grantor in accordance with the concession agreements (Euro 32,218).

CONSOLIDATED FINANCIAL STATEMENTS AT DECEMBER 31, 2015 71
Financial assets deriving from government grants related to construction services are grants accrued from concession grantors or other public entities on investments and maintenance work associated with businesses under concession. At December 31, 2014 the full amount of Financial receivables from Group companies referred to the associated company Società Autostrada Tirrenica, expiring in June 2016; the company was wholly consolidated in 2015. The amount of current Financial receivables from third parties is related, for Euro 27,429, to amounts paid to minority shareholders of certain North American subsidiaries of the Autogrill group. The item Derivatives: fair value hedges includes the differentials on interest rate hedges of the Benetton group. The item Derivatives: cash flow hedges consists almost exclusively of the fair value accounting of the Benetton group’s hedges against exchange risk. Accrued income on derivative transactions pertains mostly to the Atlantia group (Euro 59,684).
15 Other investments
This item covers the fair value of investments classified as "available for sale" according to the rules of IAS 39, whose carrying value has been adjusted to the average stock market price in December 2015.
16 Cash and cash equivalents
This item can be broken down as follows: (Thousands of Euro) 12.31.2015 12.31.2014
Time deposits 714,464 578,151
Bank accounts 3,216,373 1,586,178
Cash in hand 80,737 90,225
Checks 16,256 18,772
Total 4,027,830 2,273,326 Time deposits refer mainly to the Atlantia group (Euro 706 million). Bank accounts are liquid funds held at major banks. Average interest rates reflect market returns for the various currencies concerned. The balance mostly consists of amounts pertaining to Atlantia group companies (Euro 2,220 million) and Schematrentaquattro S.p.A. (Euro 712 million). Cash in hand includes cash floats at stores and amounts in the process of being credited and may vary according to the frequency of deposit. Checks reflect receipts from customers in the last few days of the year. The change in this item compared to the previous year is mainly attributable to an increase in net cash flows from operations and from new bond issues by Atlantia group companies, net of repurchases of previous issues (Euro 1,052 million), as well as the remaining cash and cash equivalents relating to amounts collected for the sale of the equity investment in World Duty Free (approx. Euro 750 million).

72 CONSOLIDATED FINANCIAL STATEMENTS AT DECEMBER 31, 2015
17 Assets and liabilities held for sale
At December 31, 2015 and 2014 this item was made up as follows:
(Thousands of Euro)
Atlantia group (Ecomouv' and
other) 12.31.2015
Assets held for sale
Property, plant and equipment - -
Equity investments 4,271 4,271
Financial assets 39,034 39,034
Deferred tax assets - -
Trading assets 7 7
Other assets 1,673 1,673
Total assets held for sale 44,985 44,985
(Thousands of Euro)
Atlantia group (Ecomouv' and
other) 12.31.2015
Liabilities held for sale
Financial liabilities 411 411
Trading liabilities 1,260 1,260
Other liabilities 4,508 4,508
Total liabilities held for sale 6,179 6,179
(Thousands of Euro) Atlantia group
(Ecomouv') World Duty Free
group Other assets 12.31.2014
Assets held for sale
Property, plant and equipment 1,570 1,375,194 5,544 1,382,308
Equity investments 16,510 - - 16,510
Financial assets 297,532 103,752 - 401,284
Deferred tax assets 2,829 11,025 - 13,854
Trading assets 157,616 233,377 - 390,993
Other assets 63,297 302,084 - 365,381
Total assets held for sale 539,354 2,025,432 5,544 2,570,330
(Thousands of Euro) Atlantia group
(Ecomouv') World Duty Free
group Other assets 12.31.2014
Liabilities held for sale
Financial liabilities 287,046 1,037,901 - 1,324,947
Trading liabilities 71,833 289,429 - 361,262
Other liabilities 64,362 203,705 - 268,067
Total liabilities held for sale 423,241 1,531,035 - 1,954,276 At December 31, 2015 the balance consisted mainly of the residual net assets of the French companies involved in the Eco-Taxe project (Euro 34,535) and the residual 2% interest in Strada dei Parchi (Euro 4,271), subject to a put and call option with the Toto group, in accordance with the sale agreements signed in 2011.

CONSOLIDATED FINANCIAL STATEMENTS AT DECEMBER 31, 2015 73
The equity investment held by the Atlantia group in Lusoponte (Euro 15,339) at December 31, 2015 was reclassified under Equity investments in other companies (Note 5) after it no longer met the requirements of IFRS 5. The reduction in this item compared to the balance at December 31, 2014 reflects the World Duty Free group's exit from the consolidation scope. In particular, with reference to the Atlantia group, the decrease in financial assets and liabilities and in commercial assets is related to the payment by the French State of an indemnity for termination of the partnership contract in connection with the Eco-Taxe project, while the decrease in commercial liabilities refers to payment of the suppliers of the group's French companies and of indemnities for termination of contracts related to the Ec-oTaxe project.

74 CONSOLIDATED FINANCIAL STATEMENTS AT DECEMBER 31, 2015
NOTES TO SHAREHOLDERS' EQUITY ITEMS (All figures in thousands of Euro) The statements of financial position of the World Duty Free group at December 31, 2014 and of the Atlantia group companies connected to the Ecomouv’ Project were reclassified under Assets and liabilities held for sale, Note 17. Changes in scope essentially concerned the consolidation of Società Autostrada Tirrenica by the Atlantia group and the disposal of a US real estate company.
SHAREHOLDERS' EQUITY
Shareholders' equity attributable to the Parent Company On June 25, 2015, the annual general meeting of Edizione S.r.l. approved a dividend totalling Euro 100 million, paid during the course of the year.
18 Share capital
At December 31, 2015 the share capital of Edizione S.r.l. amounted to Euro 1,500 million, fully subscribed and paid in and divided into quotas.
19 Fair value and hedging reserve
This item reflects the changes arising from the fair value recognition of "available for sale" financial assets shown under current and non-current assets, as well as the changes in the effective hedging component of cash flow hedges.
20 Other reserves and retained earnings
Amounting to Euro 3,463,903 at the close of the year (Euro 3,381,416 at December 31, 2014), this item includes: ! Euro 43,802 for the Parent Company's legal reserve; ! Euro 1,444,291 for the Parent Company's other reserves; ! Euro 1,981,810 representing the shareholders' equity of consolidated companies in excess of their carrying
value, together with other consolidation entries.
21 Translation reserve
This reserve shows the effects of consolidating companies with financial statements in currencies other than the Euro using the line-by-line method.

CONSOLIDATED FINANCIAL STATEMENTS AT DECEMBER 31, 2015 75
The following table shows the components of comprehensive income and the related tax effect:
(Thousands of Euro) Gross Financial gains/
(losses) Net
Fair value gains/(losses) on cash flow hedges 9,036 (13,842) (4,806)
Reclassification to the income statement of gains/(losses) from fair value measure-ment of cash flow hedges 72,835 (20,977) 51,858
Fair value gains/(losses) of available for sale financial instruments (180,825) (253) (181,078)
Gains/(losses) from translation of assets and liabilities of consolidated companies in functional currencies other than euro (225,311) 667 (224,644)
Reclassification to the income statement of gains/(losses) from translation of assets and liabilities of consolidated companies in functional currencies other than euro (33,062) - (33,062)
Other gains/(losses) 6,124 (1,202) 4,922
Other comprehensive income for the year (351,203) (35,607) (386,810) Below is the reconciliation between the shareholders’ equity and net income of Edizione S.r.l. at December 31, 2015 and the corresponding consolidated amounts, net of non-controlling interests:
(Thousands of Euro) Shareholders'
equity Net income As shown in the separate financial statements of Edizione S.r.l. prepared according to Italian GAAP 3,517,674 529,581
IFRS adjustments to separate financial statements of Edizione S.r.l. 35,172 99,767
As shown in the separate financial statements of Edizione S.r.l. prepared according to IFRS 3,552,846 629,348 Group share of net income and shareholders’ equity of consolidated subsidiaries, net of their carrying value 2,255,827 1,013,738
Elimination of dividends paid to the Parent Company by consolidated subsidiaries - (810,369) Allocation to non-current assets of the difference between the purchase price and the equity of new sub-sidiaries at the date of acquisition and related depreciation and amortization 667,497 (8,257)
Elimination of capital gains from the intercompany transactions (26,988) 94,408
Adjustment to reflect the equity value of associated companies (1,102) -
Net effect of other consolidation adjustments (42,479) 679,348
As shown in the Group’s consolidated financial statements 6,405,601 1,598,216

76 CONSOLIDATED FINANCIAL STATEMENTS AT DECEMBER 31, 2015
22 Non-controlling interests
At December 31, 2015 and 2014, non-controlling interests in the net equity of consolidated companies were as follows: (Thousands of Euro) 12.31.2015 12.31.2014
Atlantia group 6,419,641 5,246,915
Sintonia S.p.A. - 1,297,997
Autogrill group 318,834 260,091
World Duty Free group - 246,617
Benetton group 19,100 17,673
Olimpias group 2,356 1,858
Schemaquattrordici S.p.A. 906 1,243
Other companies and consolidation adjustments (29,487) (27,816)
Total 6,731,350 7,044,578 The change in non-controlling interests in net equity is due to the exit of the World Duty Free group from the scope of consolidation. The reduction in non-controlling interests in Sintonia, resulting from the company's demerger, is offset by the increase in non-controlling interests in the Atlantia group.

CONSOLIDATED FINANCIAL STATEMENTS AT DECEMBER 31, 2015 77
NOTES ON LIABILITIES ITEMS (All figures in thousands of Euro)
NON-CURRENT LIABILITIES
23 Bonds
Bonds amount to Euro 10,762,271 for the non-current portion (Euro 10,938,735 at December 31, 2014) and Euro 1,085,993 for the current portion (Euro 162,887 at December 31, 2014). Bonds are broken down below by group and by current and non-current share:
12.31.2015 12.31.2014
Current portion
Non-current portion
Current portion
Non-current portion
Atlantia group 1,085,993 10,300,558 162,887 10,330,706
Autogrill group - 461,713 - 415,800
Schematrentaquattro S.p.A. - - - 192,229
Total 1,085,993 10,762,271 162,887 10,938,735 The increase in the balance in 2015, with respect to the Atlantia group (Euro 892 million), is principally attributable to the new bond issues by the subsidiary Autostrade per l'Italia, totalling Euro 2,618 million, net of partial repurchase by Atlantia of its own bonds coming to maturity in 2016, 2017, 2019 and 2020 (Euro 1,351 million) and of 99.87% of the Romulus Finance securities named "Gbp 215,000,000 5.441% Class A4 Notes due 2023" (Euro 287 million). The change in the non-current portion of the Autogrill group essentially reflects the effect of the appreciation of the US dollar against the euro (Euro 47.9 million), partially offset by a change in the fair value of hedging derivatives.
24 Medium and long-term loans
This item consists of loans from credit institutions and payables to other lenders. The following table shows the current and non-current portions for each group:
12.31.2015 12.31.2014
Current portion
Non-current portion
Current portion
Non-current portion
Atlantia group 253,158 3,250,740 406,808 3,134,406
Autogrill group - 276,612 - 330,842
World Duty Free group - - - -
Schematrentanove group 62 162 221,070 2,681
Edizione S.r.l. - - - -
Sintonia S.p.A. - - - -
Other companies 4,785 3,630 10,069 2,739
Total 258,005 3,531,144 637,947 3,470,668 Medium and long-term loans from credit institutions amount to Euro 3,395,821 for the non-current portion (Euro 3,412,152 at December 31, 2014) and Euro 195,739 for the current portion (Euro 574,619 at December 31, 2014).

78 CONSOLIDATED FINANCIAL STATEMENTS AT DECEMBER 31, 2015
The balance of the current portion decreased from the previous year, mainly as a result of the early repayment of the loan to Edizione Property group (Euro 220 million). The non-current portion of medium and long-term loans from credit institutions is broken down below by maturity: Year 12.31.2015
2017 224,445
2018 189,999
2019 198,369
2020 218,595
2021 and beyond 2,564,413
Total 3,395,821 Loans from other lenders amount to Euro 135,323 for the non-current portion (Euro 58,516 at December 31, 2014) and Euro 62,266 for the current portion (Euro 63,328 the previous year). The change compared to the previous year is due to an increase in the Atlantia group's payables to the grantor by Euro 54,287.
25 Other non-current liabilities
This item can be broken down as follows: (Thousands of Euro) 12.31.2015 12.31.2014
Long-term deferred income 65,724 63,674
Payables to social security institutions 12,717 11,175
Payables to personnel 27,619 12,055
Payables to concession grantors 13,681 24,640
Other payables 18,067 14,178
Total 137,808 125,722 Long-term deferred income concerns investments to be carried out for contractual obligations (Euro 26,933) and other non-commercial deferred income (Euro 38,791) of the Atlantia group. Payables to social security institutions essentially refer to the Autogrill group and consist of the liability for defined contribution plans. Payables to personnel principally concern the Autogrill and Atlantia groups, reflecting the non-current portion of amounts due under long-term incentive plans. Other payables include security deposits (Euro 5,511) mostly pertaining to the Benetton group.

CONSOLIDATED FINANCIAL STATEMENTS AT DECEMBER 31, 2015 79
26 Lease financing
The Group has acquired properties, machinery, and other assets using lease financing. Payables to leasing companies are guaranteed to the lessor by virtue of rights on the leased assets. Lease financing is broken down below by maturity: (Thousands of Euro) 12.31.2015 12.31.2014
Within 1 year 3,578 3,517
From 1 to 5 years 5,426 6,497
Beyond 5 years 6,105 8,612
Total 15,109 18,626 The portion due beyond one year amounts to Euro 11,531, while payments due within one year come to Euro 3,578 and are shown under current liabilities. Minimum lease payments due to the leasing company are reconciled to their present value (principal portion) as follows: (Thousands of Euro) 12.31.2015 12.31.2014
Minimum payments due 19,340 22,386
Outstanding financial expenses (4,231) (3,760)
Present value of lease financing 15,109 18,626
27 Other non-current financial liabilities
The balance at December 31, 2015 refers to the Atlantia group and represents the negative market value of derivatives outstanding at the close of the year, classified as cash flow hedges or fair value hedges depending on the hedged risk: a. Euro 308,625 refers to the fair value of the Cross Currency Interest Rate Swaps to hedge the foreign
currency and interest rate risks on medium/long-term bonds, subscribed by Atlantia for a nominal GBP 500 million and a nominal JPY 20 billion, as well as to derivatives entered into by Aeroporti di Roma on a bond of the nominal amount of GBP 215 million, 99.87% of which was repurchased by Atlantia. The latter derivative contracts no longer meet the qualifying requirements as cash flow hedge instruments in the financial statements at December 31, 2015. The total balance decreased by approx. Euro 92 million, as a result of the combined effect of the Euro's exchange rate trend against the pound and the yen (Euro 71 million) and the upward interest rate curve (Euro 21 million);
b. Euro 139,961 refers to the fair value of Interest Rate Swaps entered into by certain Atlantia group companies to hedge interest rate risk on existing and highly probable future non-current financial liabilities. The increase of about Euro 36 million from the previous year is affected by the negative fair value of the new Interest Rate Swap Forward Starting contracts (Euro 53,567) concluded by the subsidiary Autostrade per l'Italia for a notional amount of Euro 2,200 million at a weighted average fixed rate of approx. 1.16%;
c. Euro 12,461 consists of the fair value of IPCA x CDI swaps, classified as fair value hedges, entered into by Triangulo do Sol and Rodovias das Colinas, which are designed to convert various bonds issued in 2013 at a real IPCA rate to a floating nominal CDI rate.
28 Provisions for employee benefits
This item covers the provisions for post-employment benefits for all Group employees, such as employee termination indemnities (TFR) payable by the Italian companies (Euro 271,476).

80 CONSOLIDATED FINANCIAL STATEMENTS AT DECEMBER 31, 2015
Since December 31, 2007, the actuarial valuations for TFR reflect the changes introduced by Law 296 of December 27, 2006 and by the decrees and regulations issued in early 2007 (the "social security reform"). As a result of those changes: ! TFR accruing from January 1, 2007, whether the employee opts for a complementary pension fund or the
traditional INPS system, is treated as a defined-contribution plan and accounted for accordingly; ! TFR accrued up to December 31, 2006 is treated as a defined-benefit plan and recognised according to the
rules of IAS 19.
Movements during the year in the present value of post-employment benefit obligations were as follows: (Thousands of Euro)
Present value of obligation at 01.01.2015 339,172
Service cost 6,385
Financial expenses/(income) 3,058
Actuarial losses/(gains) 136
Contributions paid by the Group and by employees (3,209)
Indemnities paid (9,271)
Translation differences 3,770
Other movements (21,207)
Present value of obligation at 12.31.2015 318,834 Of the total, Euro 173,637 refers to employee termination indemnities (TFR) for the Italian companies in the Atlantia group. The Autogrill group accounts for Euro 100,195, with Euro 59,773 pertaining to termination indemnities of Italian companies. The amount for the Benetton group is Euro 31,011, including Euro 24,597 in TFR for Italian personnel. Certain companies in the Autogrill group also recognise the fair value of financial assets held to service defined benefit plans, consisting of equity instruments, bonds, real estate, other securities and debt instruments issued by third parties. These plan assets, shown net of the amount of the obligation, at December 31, 2015 amounted to Euro 82,313. The table below summarises the main financial and actuarial assumptions used to calculate post-employment benefits:
12.31.2015
Discounting rate 0,2% - 2,4%
Inflation rate 1,5% - 2%
Expected rate of salary increases 0,8% - 2,5%
The wide range for some of the above assumptions is explained by differences in the countries where the Group operates.
29 Deferred tax liabilities
This item refers chiefly to the Atlantia group (Euro 1,701,181) and the Autogrill group (Euro 41,456) and covers deferred tax liabilities that cannot be offset by deferred tax assets. They consist mainly of temporary differences arising from acquisitions by Group companies.

CONSOLIDATED FINANCIAL STATEMENTS AT DECEMBER 31, 2015 81
30 Other non-current provisions and liabilities
The table below summarises movements during the year:
For a better understanding of the changes in these provisions, details of their overall composition, including the current portion, are provided below. At December 31, 2015, Provisions for risk totalled Euro 192,233. The Atlantia group contributed Euro 140,579 to this item (current portion: Euro 82,656), representing the estimated charges to be incurred in connection with pending litigation, including those with contractors regarding contract reserves. Euro 42,526 pertains to the Autogrill group (current portion: Euro 16,612) and is detailed as follows: ! a self-insurance provision (Euro 32,031) to cover the excess on third-party liability provided for in insurance
plans; ! provisions for legal disputes (Euro 6,080) involving the Autogrill group, which take account of the opinions of
its legal advisors.
The Benetton group's contribution of Euro 7,226 (current portion: Euro 4,913) relates to provisions made for legal disputes. The Provision for sales agent indemnities reflects the estimated liability for the termination of contracts held by Benetton group sales representatives in the cases envisaged by law. The Provision for other expenses, totalling Euro 77,653, pertains to the Autogrill group for Euro 13,630 (current portion: Euro 2,644), the Benetton group for Euro 39,058 (current portion: Euro 29,458) and the Atlantia group for Euro 18,556 (current portion: Euro 4,295). The balance at December 31, 2015 for the Autogrill group includes: ! a provision for the refurbishment of third party assets (Euro 7,309), representing estimated liabilities for
ensuring that leased assets are returned in the contractually agreed condition; ! provisions for onerous contracts (Euro 3,546), relating to loss-making contracts for commercial units whose
earnings are not sufficient to cover the amount of the lease; ! a tax risk provision (Euro 2,774), referring mostly to disputes over the US subsidiaries’ direct and indirect
taxation.
The amount relating to the Benetton group mainly includes provisions for the reorganisation plan and estimated costs for the closure of some directly operated stores. Provisions for the repair and replacement of motorway infrastructure assets (Euro 1,332,007) refer entirely to the Atlantia group and cover the estimated cost of repairing or replacing assets held under concession in accordance with the concession arrangements between the group's motorway operators and the grantors of those concessions.
(Thousands of Euro) Prov isions for riskProv ision for sales
agent indemnitiesProv ision for other
ex penses
Prov isions for repair and replacement of
motorw ay infrastructure assets
Prov isions for refurbishment of
airport infrastructureTotal non-current
portion Prov isions for riskProv ision for other
ex penses
Prov isions for the repair and
replacement of motorw ay
infrastructure assets
Prov isions for the refurbishment of
airport infrastructureTotal current
portion
Balance at 01.01.2015 87,290 15,709 41,112 1,029,314 156,807 1,330,232 93,408 44,618 329,881 159,517 627,424
Provisions 25,587 1,618 7,462 336,155 84,151 454,973 19,870 6,753 - - 26,623
Uses (8,828) (2,586) (1,436) - - (12,850) 5,689 (10,003) - - (4,314)Released to statement of income (880) (13) (1,127) - - (2,020) 4,637 (8,308) (372,790) (150,997) (527,458)
Reclassif ication to discontinued operations (IFRS5) - - - 3,228 - 3,228 - - 4,373 - 4,373 Other movements and translation differences (15,232) (132) (5,831) (253,791) (79,692) (354,678) (19,308) 4,413 255,637 92,649 333,391 Balance at 12.31.2015 87,937 14,596 40,180 1,114,906 161,266 1,418,885 104,296 37,473 217,101 101,169 460,039
Non-current portion Current portion

82 CONSOLIDATED FINANCIAL STATEMENTS AT DECEMBER 31, 2015
The Provisions for the refurbishment of airport infrastructure (Euro 262,435) concerns companies in the Aeroporti di Roma group and covers the present value of estimated future expenses for extraordinary maintenance, repairs and replacements in accordance with the terms and conditions of the Aeroporti di Roma concession arrangement.
31 Provisions for construction services required by contract
These provisions represent the present value of the motorway infrastructure construction/upgrading services still to be provided, which some operators in the Atlantia group, in particular Autostrade per l’Italia, have committed to providing and for which they will not receive additional economic benefits in terms of specific tariff increases and/or a substantial rise in expected traffic. An allocation is made yearly to reflect the change in present value of the investment commitments and the financial and planning effects of revised timing estimates; the provisions are reduced in proportion to the work without additional benefits actually completed during the year, net of grants receivable. The table below presents balances at the beginning and end of 2015 and movements during the year, broken down by current/non-current portion. The increase in these provisions is essentially the combined effect of: a. the provision for the time value of money (Euro 32,393), recognised in 2015 as a contra-entry to financial
discounting expenses in the consolidated income statement; b. utilisations for investments in works without additional economic benefits carried out during the year (Euro
542,452, net of Euro 39,957 in contributions).
(Thousands of Euro)Balance at
01.01.2015 Non-current Current
Changes due to rev ised present
v alue obligationsFinancial
prov isionsReduction for
completed w orks
Grants accrued on completed
w orksTranslation differences
Balance at 12.31.2015 Current Non-current
Provisions for construction services required by contract 4,283,075 3,783,956 499,119 9,018 32,393 (542,452) 39,957 (11,249) 3,810,742 3,369,243 441,499

CONSOLIDATED FINANCIAL STATEMENTS AT DECEMBER 31, 2015 83
CURRENT LIABILITIES
32 Trade payables
These represent the Group’s liabilities for the purchase of goods and services, including the Atlantia group's tolls in the process of settlement (Euro 94,110) and payables to operators of interconnecting motorways (Euro 619,621).
33 Other payables, accrued expenses and deferred income
This item is summarised as follows: (Thousands of Euro) 12.31.2015 12.31.2014
Other payables
Payables to personnel 218,162 202,888
Other payables to tax authorities 117,595 127,447
Payables for the purchase of fixed assets 93,207 96,816
Payables to social security institutions 98,840 98,426
Payables to grantors 101,849 99,826
Guarantee deposits and deposits of users who pay by direct debit 55,589 56,121
Payable to expropriated companies 16,514 43,608
VAT payables 31,622 40,490
Payable to public entities 14,629 17,268
Other payables 122,994 111,951
Total other payables 871,001 894,841
Accrued expenses and deferred income
Leases and rentals 11,168 18,484
Other 53,278 59,285
Total accrued expenses and deferred income 64,446 77,769
Total other payables, accrued expenses and deferred income 935,447 972,610 Payables to personnel concern amounts accrued and not paid at December 31, 2015 and also include the current portion of liabilities for long-term personnel incentive plans. The change in Other payables to tax authorities is attributable for the most part to the lower IRESA amount due by the subsidiary Aeroporti di Roma to the Lazio Region. This tax is payable by air carriers, which are required to pay it to airport operation companies, which in turn are responsible for periodic IRESA payments to the Region. Payables for the purchase of fixed assets refer to the retail network, manufacturing division and information technology of the Benetton group (Euro 13,066) and to amounts payable in connection with investments by the Autogrill group (Euro 78,517). Payables to social security institutions consist of contributions due from Group companies and employees. Payables to grantors, Payables to expropriated companies, Guarantee deposits and deposits of current account holders, and Payables to public entities are due by companies in the Atlantia group.

84 CONSOLIDATED FINANCIAL STATEMENTS AT DECEMBER 31, 2015
Other payables include amounts due to Directors and Statutory Auditors, amounts due to insurance companies, and other non-trade payables. Accrued expenses and deferred income refer mainly to insurance premiums, lease instalments and utilities pertaining to the subsequent year and include Euro 9,509 in deferred income relating to the grant received from the Serbian government for the construction by the Olimpias group of the new manufacturing complex in Niš, Serbia.
34 Current income tax liabilities
Current income tax liabilities represent the amount payable by the Group for current year income tax, stated net of taxes paid in advance, tax credits and withholding taxes.
35 Other current financial liabilities
Details are as follows: (Thousands of Euro) 12.31.2015 12.31.2014
Financial accrued expenses and deferred income 319,220 359,471
Derivatives: cash flow hedges 9,116 6,071
Derivatives: fair value hedges 2,737 6,829
Financial payables to Group companies 515 112
Financial payables due to other companies 25,919 14,561
Total 357,507 387,044 Financial accrued expenses and deferred income are made up mostly of accrued expenses and deferred income on bonds and loans (Euro 277,767) and of accrued expenses on derivative transactions (Euro 41,453). Derivatives: cash flow hedges refer to the fair value recognition of derivatives involved in interest rate and exchange rate hedging transactions. Derivatives: fair value hedges represent the differentials on forward exchange contracts arising from the fair value measurement of hedges outstanding at December 31, 2015 in relation to exchange rate risk. The balance at December 31, 2015 refers almost entirely to the Benetton group (Euro 2,397). Financial payables due to other companies at December 31, 2015 include, for Euro 18,044, amounts due to minority shareholders of a Korean company of the Benetton group for the put option on their shares. At December 31, 2014, Financial payables due to other companies included the payable for dividends of the subsidiary Sintonia to a shareholder, settled in early 2015.

CONSOLIDATED FINANCIAL STATEMENTS AT DECEMBER 31, 2015 85
36 Bank loans and overdrafts
In detail: (Thousands of Euro) 12.31.2015 12.31.2014
Short-term bank loans from credit institutions 310,268 539,609
Current account overdrafts 102,277 47,002
Total 412,545 586,611 The Atlantia group contributed Euro 281,404. The Benetton group accounted for Euro 31,130, essentially for drawdowns on uncommitted credit facilities. The amount pertaining to the Autogrill group, Euro 87,989, consists of current account overdrafts (Euro 52,989) and other unsecured bank debt (Euro 35,000). The change in this item compared to the previous year reflects primarily the repayment of the loan to the subsidiary Sintonia (Euro 160 million).

86 CONSOLIDATED FINANCIAL STATEMENTS AT DECEMBER 31, 2015
NOTES TO INCOME STATEMENT ITEMS (All figures in thousands of Euro) In accordance with IFRS 5 the contribution of the Atlantia group companies connected to the Ecomouv’ Project and of the World Duty Free group was recognised in a single line of the income statement, Profit/(loss) from discontinued operations, Note 57, in both 2015 and the comparison period.
37 Revenues
Revenues are broken down by type as follows: (Thousands of Euro) 2015 2014
Net sales 6,462,871 6,123,555
Tolls 3,835,954 3,677,628
Aviation revenues 565,312 519,979
Royalties 243,821 256,513
Other revenues 336,988 322,389
Total 11,444,946 10,900,064 Most of the change in Net sales concerned the Autogrill group, with a Euro 377 million increase (Euro 354 million as a result of currency exchange effects). Tolls stood at Euro 3,836 million, up by a total of Euro 158 million compared with 2014: this was essentially the result of the application of tariff increases from January 1, 2015 for the Group's Italian operators (Euro 39 million), of the 3% increase in the traffic on the Italian network (Euro 90 million) and of higher toll revenues of the Group's foreign operators (Euro 41 million). Aviation revenues include contributions from the Aeroporti di Roma group companies and increased compared to the previous year as a result of tariff adjustments and a rise in traffic, despite the negative impact of the fire in Terminal 3 of the Fiumicino airport. Most Royalties pertain to the Atlantia group and include fees paid by the sub-concession holders that operate motorway and airport service areas. Other revenues consist of the Telepass and Viacard income of the Atlantia group (Euro 134,180), sundry airport management revenues, and income from various services such as subcontracting and the development of advertising campaigns. Revenues by business segment are shown below: (Thousands of Euro) 2015 2014
Food & beverage 4,838,233 4,461,423
Infrastructures and services for mobility 4,968,102 4,762,407
Textiles & clothing 1,593,739 1,632,900
Other sectors 44,872 43,334
Total 11,444,946 10,900,064
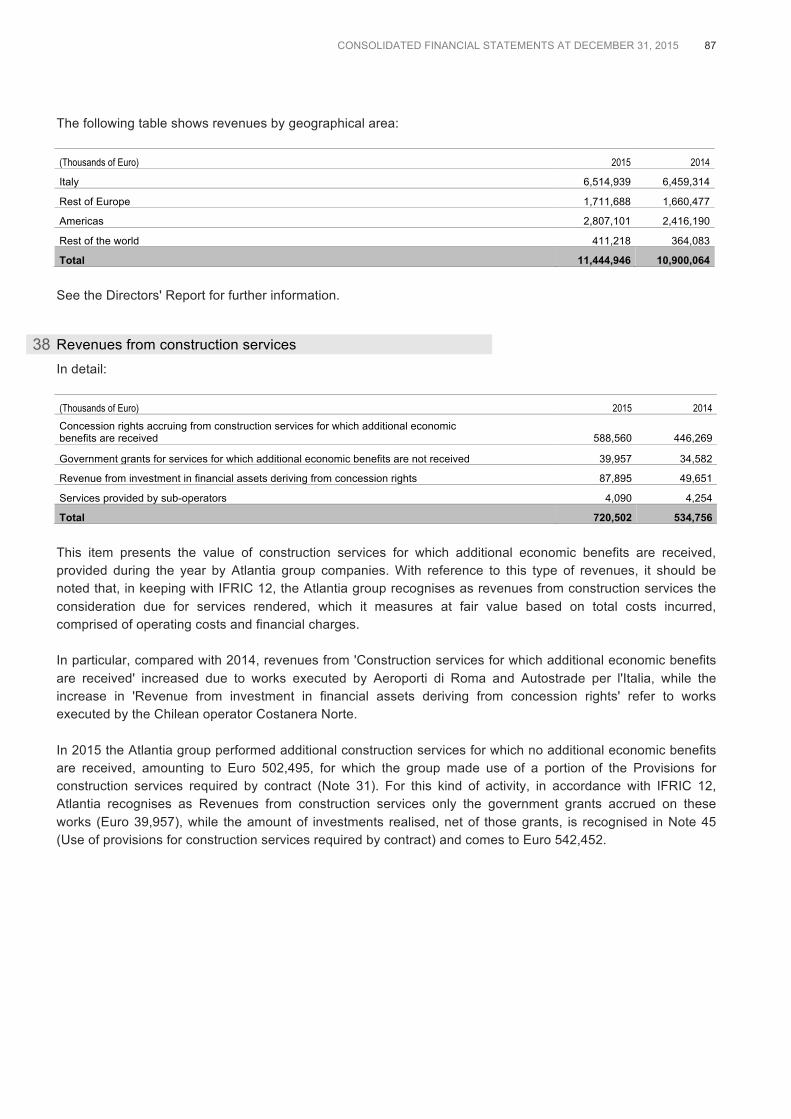
CONSOLIDATED FINANCIAL STATEMENTS AT DECEMBER 31, 2015 87
The following table shows revenues by geographical area: (Thousands of Euro) 2015 2014
Italy 6,514,939 6,459,314
Rest of Europe 1,711,688 1,660,477
Americas 2,807,101 2,416,190
Rest of the world 411,218 364,083
Total 11,444,946 10,900,064 See the Directors' Report for further information.
38 Revenues from construction services
In detail: (Thousands of Euro) 2015 2014 Concession rights accruing from construction services for which additional economic benefits are received 588,560 446,269
Government grants for services for which additional economic benefits are not received 39,957 34,582
Revenue from investment in financial assets deriving from concession rights 87,895 49,651
Services provided by sub-operators 4,090 4,254
Total 720,502 534,756 This item presents the value of construction services for which additional economic benefits are received, provided during the year by Atlantia group companies. With reference to this type of revenues, it should be noted that, in keeping with IFRIC 12, the Atlantia group recognises as revenues from construction services the consideration due for services rendered, which it measures at fair value based on total costs incurred, comprised of operating costs and financial charges. In particular, compared with 2014, revenues from 'Construction services for which additional economic benefits are received' increased due to works executed by Aeroporti di Roma and Autostrade per l'Italia, while the increase in 'Revenue from investment in financial assets deriving from concession rights' refer to works executed by the Chilean operator Costanera Norte. In 2015 the Atlantia group performed additional construction services for which no additional economic benefits are received, amounting to Euro 502,495, for which the group made use of a portion of the Provisions for construction services required by contract (Note 31). For this kind of activity, in accordance with IFRIC 12, Atlantia recognises as Revenues from construction services only the government grants accrued on these works (Euro 39,957), while the amount of investments realised, net of those grants, is recognised in Note 45 (Use of provisions for construction services required by contract) and comes to Euro 542,452.

88 CONSOLIDATED FINANCIAL STATEMENTS AT DECEMBER 31, 2015
39 Other revenues and operating income
This item is detailed in the following table: (Thousands of Euro) 2015 2014
Capital gains from disposal of fixed assets 145,070 87,764
Rents 63,297 74,776
Promotional contributions by suppliers 45,651 47,609
Reimbursement of costs by third parties 69,645 52,438
Commisions on premium product sales 21,590 23,417
Release of provisions 16,593 19,022
Affiliation fees 2,607 2,661
Impairment reversals 159 12,118
Other operating income 116,636 134,283
Total 481,248 454,088 Capital gains from disposal of non-current assets pertained, for Euro 134 million, to the sale of two high-end properties of a US subsidiary. In the comparison period, capital gains from disposal of non-current assets were realised, for Euro 79 million, from the sale of a property in Paris. Rents refer mainly to income from commercial premises used for the sale of Benetton group label products, leasing instalments for companies in the Autogrill group, and the leasing of properties classified as investment property. Reimbursement of costs by third parties includes Euro 61,057 for the Atlantia group and refers to refunds and indemnities received. The item also includes the prudent appreciation of an insurance compensation relating to coverage of extra costs and recovery and restoration costs incurred following the fire in Terminal 3 of the Fiumicino airport (Euro 12,579). In the previous period, impairment reversals concern the concession rights of the Atlantia group. The heading Other operating income covers the sublease of parts of commercial units, contingent income, operating grants and miscellaneous income.
40 Purchases and changes of raw materials and consumables
The item remained essentially unchanged from 2014.
41 Payroll costs
Details are as follows: (Thousands of Euro) 2015 2014
Wages and salaries 1,946,651 1,777,300
Social security charges 457,906 431,020
Directors’ emoluments 18,267 16,468
Provision for employee termination indemnities and similar 6,385 10,105
Other payroll costs 178,509 144,808
Total 2,607,718 2,379,701

CONSOLIDATED FINANCIAL STATEMENTS AT DECEMBER 31, 2015 89
Other payroll costs concern the Autogrill group for Euro 130,775, in connection with long-term incentives, health insurance and other benefits, and the Atlantia group for Euro 43,367, and include bonuses, leaving incentives and the cost of seconded personnel. The change in this item reflects a difference in the exchange rate, particularly for the US dollar, in the Autogrill group's accounts (Euro 120 million). The following table shows the average number of employees by business segment in terms of equivalent full-time employees: FTE 2015 2014
Food & beverage 40,560 40,128
Infrastructures and services for mobility 14,600 13,661
Textiles & clothing 9,164 9,429
Other sectors 673 529
Total 64,997 63,747
42 Costs of services
Details are as follows: (Thousands of Euro) 2015 2014
Construction and similar 886,389 638,689
Maintenance costs 324,937 284,873
Utilities 159,754 159,568
Subcontracted work 122,175 127,554
Consultants’ fees (Tax & Legal) 117,123 106,649
Transport and distribution 106,659 101,711
Cleaning and disinfestation 73,849 72,633
Advertising and promotion 71,131 72,003
Sales commissions 58,801 68,715
Banking services 55,632 45,688
Professional and technical services 71,474 37,561
Insurance 42,918 35,132
Travel expenses and accommodation 37,666 33,460
Telephone and postal charges 31,473 31,495
Surveillance 26,040 23,961
Statutory auditors’ emoluments 2,214 2,313
Capitalized cost of services 270,533 236,458
Total 2,458,768 2,078,463 The items Construction and similar and Professional and technical services pertain to the Atlantia group and include construction and professional services relating to infrastructure under concession. The item increased over the previous year due to higher investments in business under concession and significant maintenance works carried out on the motorway network. The increase in Maintenance costs is related to heavier works on motorways. Costs for Subcontracted work pertain to the Olimpias group and basically reflect the trend in sales volumes.

90 CONSOLIDATED FINANCIAL STATEMENTS AT DECEMBER 31, 2015
Other services include miscellaneous items such as public relations, graphics and design consulting, personnel recruitment and training, temporary work, money transportation and health inspections.
43 Leases and rentals
This item consists primarily of concession fees paid by the Autogrill group to third parties and by the Atlantia group to the grantors. The change of this item (Euro 1,339,403 compared to Euro 1,238,533 in 2014) reflects for euro 86 million the appreciation of the US dollar against the Euro.
44 Other operating expenses
In detail: (Thousands of Euro) 2015 2014
Indirect taxes and duties 65,431 60,327
Donations 36,548 32,938
Dammages, compensation and penalties 29,778 18,426
Capital losses from disposal of fixed assets 4,041 3,387
Differences in cash deposits 1,727 1,689
Other expenses 55,550 54,006
Total 193,075 170,773 Indirect taxes and duties refer to the Autogrill group for Euro 25,662, the Atlantia group for Euro 23.161, the Edizione Property group for Euro 5,031 and the Benetton group for Euro 6,930. Donations concern the Atlantia group for Euro 34,371, for the upgrading of infrastructures operated by other entities located near the motorways. Damages, compensation and penalties increased due to contribution from the Atlantia group. Other expenses include indemnities paid to third parties, contingent losses and other miscellaneous operating costs.
45 Use of provisions for construction services required by contract
The use of provisions for construction services required by contract in relation to works for which no additional economic benefits are received equals the value of the relative construction services provided during year. It is recognised as an indirect adjustment of the costs, classified by nature, incurred in 2015 for the construction services provided by operators of the Atlantia group. The amount is shown net of Euro 39,957 in grants accrued on construction services for which no additional economic benefits are received, as mentioned in Note 42 (Revenues from construction services).

CONSOLIDATED FINANCIAL STATEMENTS AT DECEMBER 31, 2015 91
46 Depreciation of property, plant and equipment
As follows: (Thousands of Euro) 2015 2014
Depreciation of buildings 23,792 25,033
Depreciation of investment property 1,785 1,642
Depreciation of plant, machinery and equipment 130,099 122,766
Depreciation of furniture, furnishings and electronic equipment 28,659 30,371
Depreciation of assets to be relinquished 23,171 22,223
Depreciation of leasehold improvements 89,138 76,151
Depreciation of other tangible assets 12,203 12,453
Total 308,847 290,639
47 Amortisation of intangible assets
As follows: (Thousands of Euro) 2015 2014
Amortization of intangible assets deriving from concession rights 798,584 760,131
Amortization of industrial patents and intellectual property rights 1,884 1,780
Amortization of concessions, licenses, trademarks and similar rights 22,878 21,692
Amortization of deferred rights 6,369 8,848
Amortization of other intangible assets 67,340 66,028
Total 897,055 858,479
48 Impairment of property, plant and equipment and intangible assets
Amounting to Euro 63,384, this item is made up of Euro 6,896 in impairment of intangible assets and Euro 56,488 in impairment of property, plant and equipment. Details can be found in the impairment testing section of Note 2.
49 Impairment of doubtful accounts
This item, totalling Euro 48,947, pertains to trade receivables for Euro 39,141 and to other receivables for Euro 9,806. In the previous year, write-downs of trade receivables amounted to Euro 93,591 (most of which, Euro 79,503, carried out by the Benetton group) and write-downs of other receivables amounted to Euro 12,574. Movements in the provision for doubtful accounts are shown in Note 11, Trade receivables.
50 Provisions for risks
These include provisions for general risks (Euro 45,457), provisions for sales agent indemnities (Euro 1,618), and other provisions (Euro 14,215) made in 2015. The item also includes the net provision for the repair of assets operated under concession, pertaining to the motorway operators of the Atlantia group (Euro 36,635), and the net provision for the renovation of airport infrastructure of the Aeroporti di Roma group (Euro 66,846). The net change on the previous year results from discounting the provision for the repair of assets operated under concession and the provision for the renovation of airport infrastructure of the Atlantia group, because the higher discount rate used at December 31, 2015 with respect to the previous year reduced the value of those

92 CONSOLIDATED FINANCIAL STATEMENTS AT DECEMBER 31, 2015
provisions and therefore required the recognition in the income statement of drawdowns higher than the available provisions.
51 Share of income/(loss) of associated companies
This item primarily reflects the negative impact of the valuation on an equity basis of some associates and joint ventures of the Atlantia group (Euro 18,506) and of the Autogrill group (Euro 1,003). It also includes the dividends received from the associated company Eurostazioni S.p.A. (Euro 1,680). For further information, see Note 4, Equity investments in associates and joint ventures.
52 Financial income
This item comprises: (Thousands of Euro) 2015 2014
Interest income from other non-financial receivables 34,327 23,031
Interest income from banks 35,063 53,926
Financial income from discounting 63,578 56,359
Financial income on derivatives 107,242 79,992
Financial income accounted for as an increase in financial assets 61,722 48,582
Dividends from other companies 22,914 16,619
Capital gains from disposal of equity investments 273,123 18,958
Income from measurement of financial instruments at amortized cost 11,717 9,871
Interest income from Group companies 27 7,528
Interest income from non-current securities 4,399 6,937
Financial income relating to agreements with the Bertin group - 50,067
Other financial income 37,138 10,404
Total 651,250 382,274 Interest income from banks and the relevant change from the previous year are mainly attributable to the Atlantia group.
Financial income from discounting refers to the Atlantia group's discounting of concession rights and financial assets deriving from government grants.
Financial income on derivatives concerns the interest rate hedging transactions of the Atlantia group for Euro 103,690 and the exchange rate hedging transactions of the Benetton group for Euro 3,513. Financial income accounted for as an increase in financial assets refers to the Atlantia group and relates chiefly to the sum lent to Infra Bertin Empreendimentos (the company in charge of constructing and managing the ring road southeast of São Paulo) to finance the investment plan, as discussed in Note 8. Dividends from other companies were collected in 2015 from Pirelli & C. S.p.A. (Euro 5.9 million), Assicurazioni Generali S.p.A. (Euro 8.8 million) and Mediobanca S.p.A. (Euro 4.7 million). Capital gains from disposal of equity investments pertain, for Euro 260.8 million, to the disposal of the investment in Pirelli & C. S.p.A. following participation in the tender offer that also led to the early repayment of the convertible bond, originally of Euro 200 million, issued by Schematrentaquattro S.p.A., and for Euro 12.3 million to capital gains from the transfer to the tender offer of shares held in Club Méditerranée.

CONSOLIDATED FINANCIAL STATEMENTS AT DECEMBER 31, 2015 93
In the previous year, capital gains from disposal of equity investments referred entirely to the disposal of the investment in Brunello Cucinelli by Edizione Property S.p.A. (formerly Schematrentanove S.p.A.) Financial income from non-current securities consists mainly of investment fund distributions received by the subsidiary Schemaquattordici S.p.A. and the Parent Company. In the previous year, Interest income from Group companies has accrued on the loan granted to the associate Società Autostrada Tirrenica, which was consolidated in 2015. In the previous year, financial income linked to agreements with the Bertin group concerned a price adjustment paid by the Atlantia group to the Bertin group for the acquisition of the Brazilian motorway operators Triangulo do Sol, Rodovias da Colinas and Rodovias do Tietê, as a function of their actual toll revenues for the three-year period 2012-2014. The total earn-out came to Euro 54,473, including Euro 4,406 recognised as a foreign exchange difference. Other financial income includes interest income on non-financial receivables, mostly in the form of legally prescribed interest on past-due trade receivables.
53 Impairment of financial assets
The amount of Euro 94,227 refers to impairment losses on equity investments classified under IAS 39 as "available for sale," as mentioned in Note 5 (Equity investments in other companies). The write-downs carried out in 2015 relate to equity investments held in Alitalia-Compagnia Aerea Italiana S.p.A., for Euro 36.2 million and in Assicurazioni Generali S.p.A., for Euro 57.1 million. For 2014, impairment losses concern the interest in Alitalia-Compagnia Aerea Italiana S.p.A. (Euro 29.9 million) and the Alitalia convertible bond loan (Euro 14.2 million), both held by the Atlantia group, as well as writedowns charged by the subsidiary Schemaquattordici S.p.A.
54 Financial charges
As follows: (Thousands of Euro) 2015 2014
Interest on bonds 507,679 597,542
Interest on bank loans 153,130 170,593
Financial charges from derivatives 139,492 156,663
Financial charges from discounting 57,370 119,781
Financial charges accounted as an increase of financial liabilities 25,350 21,548
Write-downs for overdue interest on current payables 22,751 13,543
Non-recurring financial charges 233,509 -
Interest on loans from third parties 1,698 149
Bank expenses and commissions 13,394 12,837
Other financial charges 18,310 10,318
Total 1,172,683 1,102,974 Interest on bonds pertains to the bond issues of the Atlantia group and the Autogrill group. Interest on bank loans also includes the effect of measuring loans at amortised cost (Euro 6,065).

94 CONSOLIDATED FINANCIAL STATEMENTS AT DECEMBER 31, 2015
Financial charges from derivatives essentially relate to interest rate hedges (Euro 133,014 of which Euro 131.813 pertains to the Atlantia group). Non-recurring financial charges relates to the Atlantia group and reflects the impact of extraordinary transactions aimed at optimising the debt structure, carried out in 2015. Financial charges from discounting reflect the impact of discounting the provisions for construction services required by contract, the provisions for the repair of assets operated under concession, and the renewal provision for airport infrastructure of the Atlantia group. The change with respect to 2014 results essentially from the trend in the interest rate curve.
55 Foreign currency hedging gains/(losses) and exchange differences
This item states the balance of foreign exchange gains and losses over the year and the result of currency hedges, attributable mainly to the Edizione Property and Atlantia groups.
56 Income taxes
The balance includes current and deferred taxes, as detailed below: (Thousands of Euro) 2015 2014
Current taxes 501,646 546,992
Deferred taxes 29,514 55,514
Total 531,160 602,506 The Group's tax charge for the year breaks down as follows: (Thousands of Euro) 2015 2014
Atlantia group 470,962 552,594
Autogrill group 39,208 37,862
Other Group companies and consolidation adjustments 20,990 12,050
Total 531,160 602,506 Current taxes are allocated below by Group: (Thousands of Euro) 2015 2014
Atlantia group 450,052 460,893
Autogrill group 47,626 42,303
Other Group companies and consolidation adjustments 3,968 43,796
Total 501,646 546,992

CONSOLIDATED FINANCIAL STATEMENTS AT DECEMBER 31, 2015 95
Deferred taxes can be broken down as follows: (Thousands of Euro) 2015 2014
Atlantia group 20,910 91,701
Autogrill group (8,418) (3,424)
Other Group companies and consolidation adjustments 17,022 (32,763)
Total 29,514 55,514 The reduction of tax amounts compared to the previous year is mainly attributable to the Atlantia group, due to the combined effect of: ! deferred taxes assets of Euro 49 million entered in 2015 as a result of the corporate reorganisation
completed in Brazil; ! recognition in 2015 of benefits arising from the application of the 2015 Stability Law for Euro 20 million; ! recognition in 2015 of net deferred tax expense of Euro 42 million following the IRES rate reduction from
27.5% to 24%; ! recognition in 2014 of net deferred tax liabilities following the Chilean tax reform with an impact of Euro 107
million.
57 Profit/(loss) from discontinued operations
The following table breaks down the Profit from discontinued operations in 2015 and 2014:
(Thousands of Euro) Atlantia group
(Ecomouv') World Duty Free
group Other 2015
Operating revenues - 1,603,393 9,090 1,612,483
Operating expenses (5,251) (1,611,198) (11,315) (1,627,764)
Financial income 10,730 6,360 - 17,090
Financial charges (11,541) (16,913) - (28,454)
Fiscal gains/(charges) 13,045 (20,132) 285 (6,802)
Contribution to profit of discontinued operations 6,983 (38,490) (1,940) (33,447) Capital gain/(loss) on disposal of discontinued operations, net of tax effect - 1,059,660 1,319 1,060,979
Other income/(charges) relating to discontinued operations - 26,095 - 26,095
Profit/(loss) of discontinued operations 6,983 1,047,265 (621) 1,053,627
(Thousands of Euro)
Atlantia group (TowerCo ed
Ecomouv') World Duty Free
group 2014
Operating revenues 214,636 2,439,607 2,654,243
Operating expenses (178,159) (2,309,666) (2,487,825)
Financial income 12,891 22,142 35,033
Financial charges (50,953) (55,095) (106,048)
Fiscal charges (6,953) (55,492) (62,445)
Contribution to profit of discontinued operations (8,538) 41,496 32,958 Capital gain/(loss) on disposal of discontinued operations, net of tax effect 69,718 - 69,718
Other income/(charges) relating to discontinued operations 3,355 - 3,355
Profit/(loss) of discontinued operations 64,535 41,496 106,031 In the previous year it also included a small amount for dividends received from the Portuguese company Lusoponte (Atlantia group).
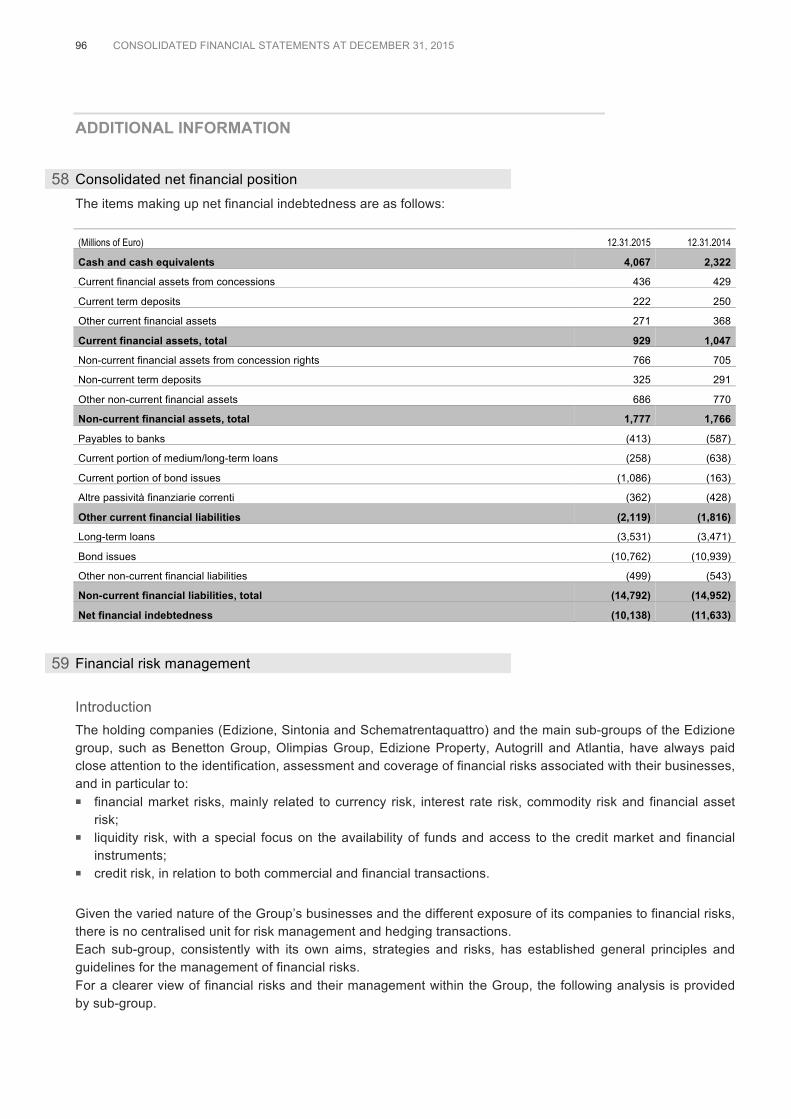
96 CONSOLIDATED FINANCIAL STATEMENTS AT DECEMBER 31, 2015
ADDITIONAL INFORMATION
58 Consolidated net financial position
The items making up net financial indebtedness are as follows: (Millions of Euro) 12.31.2015 12.31.2014
Cash and cash equivalents 4,067 2,322
Current financial assets from concessions 436 429
Current term deposits 222 250
Other current financial assets 271 368
Current financial assets, total 929 1,047
Non-current financial assets from concession rights 766 705
Non-current term deposits 325 291
Other non-current financial assets 686 770
Non-current financial assets, total 1,777 1,766
Payables to banks (413) (587)
Current portion of medium/long-term loans (258) (638)
Current portion of bond issues (1,086) (163)
Altre passività finanziarie correnti (362) (428)
Other current financial liabilities (2,119) (1,816)
Long-term loans (3,531) (3,471)
Bond issues (10,762) (10,939)
Other non-current financial liabilities (499) (543)
Non-current financial liabilities, total (14,792) (14,952)
Net financial indebtedness (10,138) (11,633)
59 Financial risk management
Introduction The holding companies (Edizione, Sintonia and Schematrentaquattro) and the main sub-groups of the Edizione group, such as Benetton Group, Olimpias Group, Edizione Property, Autogrill and Atlantia, have always paid close attention to the identification, assessment and coverage of financial risks associated with their businesses, and in particular to: ! financial market risks, mainly related to currency risk, interest rate risk, commodity risk and financial asset
risk; ! liquidity risk, with a special focus on the availability of funds and access to the credit market and financial
instruments; ! credit risk, in relation to both commercial and financial transactions.
Given the varied nature of the Group’s businesses and the different exposure of its companies to financial risks, there is no centralised unit for risk management and hedging transactions. Each sub-group, consistently with its own aims, strategies and risks, has established general principles and guidelines for the management of financial risks. For a clearer view of financial risks and their management within the Group, the following analysis is provided by sub-group.

CONSOLIDATED FINANCIAL STATEMENTS AT DECEMBER 31, 2015 97
Regarding the fair value hierarchy for the classification of assets and liabilities measured at fair value or for which fair value is disclosed herein, the prevailing level is 2 for derivatives and 1 for listed securities. There are no assets or liabilities at level 3 of the fair value hierarchy.
MARKET RISK
Currency risk, interest rate risk, commodity risk and financial asset risk The Group is exposed to various financial market risks, such as currency fluctuations, as it operates in an international context where transactions are conducted in different currencies and at different interest rates. It is also exposed to market risks in terms of the price of commodities used in running its business and the trading price of certain financial assets. The Group’s exposure to currency risk stems from the geographical distribution of its industrial activities with respect to the geographical distribution of the markets where it sells its products, and from the borrowing of funds in foreign currency. Exposure to interest rate risk derives from the need to finance operating activities, both industrial and financial, and to invest liquid funds. A change in market interest rates may have an adverse or a positive impact on the Group’s performance, by influencing the cost of borrowing and the return on investments. The Group’s exposure to commodity risk concerns the possibility of price fluctuations for some of the raw materials employed.
Edizione S.r.l.
Price risk Edizione is exposed to the risk of changes in the market price of its financial assets, particularly with respect to its medium and long-term investments in listed companies that are classified as equity investments “available for sale” on the basis of IAS 39.
Sensitivity analysis of price risk Concerning the risk of share price movements in investments “available for sale”, we have assumed a 500 bps shock in the price of the shares. Based on the analyses, the outcome is that a change of ±5% in the stock market price at December 31, 2015 would have affected shareholders’ equity by ± Euro 24,419 (± Euro 23,278 in 2014).
Benetton group
Interest rate risk Under its financial policy, the Benetton group can use derivative financial instruments to hedge or reduce its exposure to interest rate risk. There are no interest rate hedges in place at December 31, 2015. Almost all of the interest-bearing debt consists of floating-rate loans and/or deposits and so their fair value is close to the value recognised in the statement of financial position. At December 31, 2015 the potential pre-tax impact on the income statement of a hypothetical 10% increase in interest rates, applied to the Benetton group's average interest-bearing debtor or creditor positions, would increase financial charges by approximately Euro 500. A similar change but of opposite sign would occur if rates were to fall by 10%.

98 CONSOLIDATED FINANCIAL STATEMENTS AT DECEMBER 31, 2015
Currency risk It is the Benetton group's policy to manage currency risk through derivative financial instruments such as currency forwards, currency swaps, currency spot transactions and currency options to reduce or hedge the exposure to such risk. According to the type of risk, the maximum duration of hedging transactions may vary from a minimum of two years to a maximum of five years. The financial policy does not allow the undertaking of any transactions for the purposes of realising gains from exchange rate fluctuations, or any transactions in currencies to which there is not an underlying exposure or transactions in currencies designed to increase the underlying exposure. Financial instruments are designated as part of a hedging relationship at the inception of the hedge. Fluctuations in the market value of hedging instruments are therefore related to changes in the market value of the underlying asset covered for the entire effective period of the contract. At December 31, 2015 the fair value of hedging instruments on currency risk is negative for Euro 40,476 (positive for Euro 39,667 at December 31, 2014). At December 31, 2015 the potential (pre-tax) impact on the income statement of a hypothetical 10% increase in exchange rates against the Euro, assuming that all other variables remain equal is by approximately Euro 7 million. The potential (pre-tax) impact on the income statement of a hypothetical 10% decrease in exchange rates would be a positive Euro 1 million. The analysis includes, in addition to financial instruments and currency translation risk, also the shareholders' equity of the subsidiaries. The potential (pre-tax) impact on Shareholders’ equity would be negative for Euro 26 million and positive for Euro 41 million, respectively.
Price risk The Benetton group is exposed to fluctuations in commodity prices, particularly wool and cotton, which can adversely affect its margins. The risk exposure is represented by the quantity of commodities purchased (direct) or present in purchased products (yarns, fabrics, finished products). The Benetton group’s financial policy allows it to use derivative financial instruments to hedge or reduce its exposure to commodity risk. There are no interest rate hedges in place at December 31, 2015.
Olimpias group
Interest rate risk Olimpias group is not subject to interest rate risk because, on the one hand, it has no payables to banks, and on the other, its receivables are from the parent company and therefore from Edizione group companies.
Currency risk It is the Olimpias group's policy to manage currency risk through derivative financial instruments such as currency forwards, currency swaps, currency spot transactions and currency options to reduce or hedge the exposure to such risk. According to the type of risk, the maximum duration of hedging transactions is two years. The financial policy does not allow the undertaking of any transactions for the purposes of realizing gains from exchange rate fluctuations, or any transactions in currencies to which there is not an underlying exposure or transactions in currencies designed to increase the underlying exposure. Financial instruments are designated as part of a hedging relationship at the inception of the hedge. Fluctuations in the market value of hedging instruments are therefore related to changes in the market value of the underlying asset covered for the entire effective period of the contract.

CONSOLIDATED FINANCIAL STATEMENTS AT DECEMBER 31, 2015 99
Edizione Property group
Interest rate risk The Edizione Property group uses financial resources in the form of debt and uses the available liquidity in monetary and financial market instruments. Changes in market interest rates influence the cost and performance of the different forms of financing, affecting the level of financial income and charges. There are no interest rate hedges in place at December 31, 2015. Almost all of the interest-bearing debt consists of floating-rate loans and/or deposits and so their fair value is close to the value recognised in the statement of financial position.
Currency risk In 2015, the Edizione Property group managed the exchange risk through the use of derivative hedging instruments such as currency forwards, currency swaps, and currency spot. There are no derivative contracts at December 31, 2015.
Autogrill group
Interest rate risk The aim of interest rate risk management is to control financial charges and its volatility. This entails, through a mix of fixed- and floating-rate liabilities, the predetermination of a portion of financial expense out to a time horizon in keeping with the structure of debt, which in turn must be in line with capital structure charges future cash flows. Where it is not possible to obtain the desired risk profile in the capital markets or through banks, it is achieved by using derivatives of amounts and maturities in line with those of the liabilities to which they refer. The derivatives used are mainly Interest Rate Swaps (IRS). Hedging instruments are allocated to companies with significant exposure to interest rate risk where there are borrowings paying a floating rate (thus exposing the group to higher finance costs if interest rates rise) or a fixed rate (which means that lower interest rates would result in increased/reduced value of the debt). When applying the policy described above, interest rate risk management instruments were accounted for as cash flow hedges in Autogrill group companies' financial statements where they were subject to this risk, and thus recognised as financial assets or liabilities with a balancing entry in specific comprehensive income. These instruments are recognised as financial assets or liabilities, under a specific heading of comprehensive income and in the "Derivative hedging instruments valuation reserve" equity item. The FY 2015 saw the repayment, upon their natural expiry, of interest rate risk hedges, accounted for as "cash flow hedges", totalling a notional Euro 120 million. At December 31, 2015, the ratio of fixed-rate debt to net debt (i.e., net of financial assets, which are generally floating-rate) was 54.8%. The fixed-rate portion of US dollar denominated debt was 78.3%, while all euro denominated debt is variable rate. Gross debt denominated in US Dollars amounted to Usd 530.6 million at the end of the year, including Usd 502.6 million in bond issues. Part of the interest rate risk is hedged by fixed-to-floating interest rate swaps for Usd 100 million, classified as fair value hedges, the fair value of which was positive from some Euro 1,714 at December 31, 2015 (Euro 365 at December 31, 2014). A hypothetical unfavourable change of 1% in the interest rates applicable to financial assets and liabilities and to interest rate hedges outstanding at December 31, 2015 would increase net financial charges by Euro 3,228.
Currency risk The Autogrill group operates in some countries with functional currencies other than the Euro. In these countries, the procurement policy dictates that raw material purchases and other operating expense be conducted in the same currencies, thereby minimising currency risk. Such a risk remains with respect to

100 CONSOLIDATED FINANCIAL STATEMENTS AT DECEMBER 31, 2015
intragroup loans, when granted to subsidiaries that use non-Euro currencies. Under these circumstances, the objective of currency risk management is to neutralise some of this risk in respect of payables and receivables in foreign currency arising from lending transactions in currencies other than the Euro. Hedging instruments are allocated to companies with significant exposure to currency risk in terms of translation risk (i.e., the risk attending conversion into Euros in the parent company's or its subsidiaries' accounts of equity investments denominated in foreign currency) or financial assets or liabilities in a currency other than the reporting currency. These transactions are recognised at fair value under financial assets or liabilities. Fluctuations in the fair value of hedges of foreign currency financial assets or liabilities are taken to profit or loss, as is the corresponding change in the amount of the hedged assets and liabilities. The fair value of these instruments was a negative Euro 144 at December 31, 2015 (versus a positive Euro 416 at December 31, 2014). For instruments hedging translation risk that are therefore designated as hedges of net investments, the effective component of fair value is recognised in comprehensive income and classified under the “Conversion reserve” shareholders' equity item. The fair value of these instruments reached a positive Euro 320 at December 31, 2015 (versus a negative Euro 685 at December 31, 2014). With respect to the Usd, Cad, and Chf, a 10% appreciation or depreciation of the Euro would have had, at December 31, 2015, a negative impact of Euro 37,505 and a positive impact of Euro 45,839, respectively, on equity and a negative impact of Euro 7,510 and a positive impact of Euro 9.178, respectively, on profit.
Atlantia group
Interest rate risk Interest rate risk is linked to uncertainty regarding the performance of interest rates, and takes two forms: a. cash flow risk: related to financial assets or liabilities with financial flows that are indexed to a market interest
rate. In order to reduce floating rate debt, the group has entered into interest rate swaps (IRS), classified as cash flow hedges. The hedging instruments and the underlying financial liabilities have matching terms to maturity and notional amounts. Following tests of effectiveness, changes in fair value are essentially recognised in the other comprehensive income components. The results show a minimal proportion of negative ineffectiveness (Euro 966) posted to the income statement and mainly related to the effects of IFRS 13 on the new forward starting IRS derivatives of a notional amount of Euro 2,200 million, with 6, 7 and 8 years at a weighted average fixed rate of about 1.16% subscribed against highly probable future financial liabilities to be taken until 2017 by Autostrade per l'Italia to cover financial requirements. Interest income or expense deriving from the hedged instruments is recognised simultaneously in profit or loss;
b. fair value risk: the risk of losses deriving from an unexpected change in the value of fixed rate financial assets and liabilities following an unfavourable shift in the market yield curve. At December 31, 2015 the group reports transactions classifiable as fair value hedges in accordance with IAS 39, regarding the IPCA x CDI Swaps entered into by the Brazilian companies, Triangulo do Sol and Colinas, with the aim of converting the real IPCA rate bonds issued in 2013 to a floating CDI rate. Changes in the fair value of these instruments are recognised in profit or loss and are offset by matching changes in the fair value of the underlying liabilities.
With reference to the type of interest rate, as a result of cash flow hedges, 92% of interest bearing debt is fixed rate. A hypothetical unfavourable change of 0.10% in interest rates would have had a negative impact on the income statement at December 31, 2015 of Euro 989 and on the comprehensive income statement of Euro 26,439, before the tax effects.

CONSOLIDATED FINANCIAL STATEMENTS AT DECEMBER 31, 2015 101
Currency risk The group's prime objective of currency risk is to minimise transaction exposure through the assumption of liabilities in currencies other than the presentation currency. Cross currency swaps (CCIRS) with notional amounts and maturities matching those of the underlying financial liabilities have been entered into specifically to eliminate the currency risk to which the sterling and yen-denominated bonds issued by Atlantia are exposed. These swaps also qualify as cash flow hedges and tests have shown that they are fully effective. It should be noted that following the acquisition by Atlantia of 99.87% of a bond for a nominal amount of GBP 215 million issued by Romulus Finance (a vehicle controlled by Aeroporti di Roma), the Cross Currency swap derivatives entered into by Atlantia and Aeroporti di Roma, covering the interest and exchange rate risk arising from the underlying currency assets, are classified as non-hedge accounting in the consolidated financial statements. The fair value recorded in the other comprehensive income components of the respective companies (totalling Euro 61 million at December 31, 2015) was charged to the income statement of the consolidated financial statements. 16% of the group’s debt is denominated in currencies other than the Euro. Taking account of foreign exchange hedges and the proportion of debt denominated in the local currency of the country in which the relevant group company operates (around 10%), the group is effectively not exposed to currency risk on translation. At December 31, 2015 the fair value of currency hedges reached a negative Euro 467,485, Euro 12,461 of which relating to fair value hedges (Euro 527,041 at December 31, 2014). A hypothetical unfavourable change of 10% in exchange rates would have had a negative impact on the income statement of Euro 22,716 and on the comprehensive income statement of Euro 233,769 as a result of the change in the net profit of the group’s foreign subsidiaries and the change in the translation reserve.
LIQUIDITY RISK Liquidity risk can arise through the inability to access, at economically viable conditions, the financial resources needed to guarantee the Group’s ability to operate and to honour its liabilities. The two main factors that determine the Group’s liquidity situation are the resources generated or used by operating and investment activities; and the terms of expiration and renewal of debt or financial investments in conjunction with market conditions.
Edizione S.r.l. Edizione finances the outflows of ordinary operations mainly through the dividends received from subsidiaries and through its cash holdings. Liquidity risk may arise only when the amounts related to investment decisions are not covered by cash availability and suitable and readily available funding sources. Given its cash flows and its non-revocable lines of credit, Edizione believes that it has access to funding sources whose amounts and maturities are in line with its investment plans. The table below shows financial liabilities outstanding at December 31, 2015 by maturity: (Thousands of Euro)
Non-derivative financial liabilities Total contractual
amount Within 1 year 1-5 years Beyond 5 years
Revolving MB, ISP, UCI (Euro 100 million) - - - -
Bank accounts and intercompany accounts (218,105) (218,105) - -
Total (218,105) (218,105) - -

102 CONSOLIDATED FINANCIAL STATEMENTS AT DECEMBER 31, 2015
The table below shows financial liabilities outstanding at December 31, 2014 by maturity: (Thousands of Euro)
Non-derivative financial liabilities Total contractual
amount Within 1 year 1-5 years Beyond 5 years
Revolving MB, ISP, UCI (Euro 375 million) - - - -
Bank accounts and intercompany accounts (4,625) (4,625) - -
Total (4,625) (4,625) - - Sintonia S.p.A. According to Sintonia S.p.A.'s management, the company is not exposed to significant liquidity risks because, due to its high capitalisation and its ability to generate steady cash flows, it has access to funds whose amounts and maturities are in line with its investment plans. At December 31, 2015 Sintonia had demand bank deposits of Euro 11.4 million, of which Euro 3.4 million relating to deposits in current accounts pertaining to the company's former shareholders.
Schematrentaquattro S.p.A. According to Schematrentaquattro's management, the company is not exposed to significant liquidity risks because, due to its high capitalisation, it has access to funds whose amounts and maturities are in line with its requirements. At December 31, 2015 Schematrentaquattro had demand deposits totalling Euro 712 million, including financial receivables from the parent company of Euro 208 million.

CONSOLIDATED FINANCIAL STATEMENTS AT DECEMBER 31, 2015 103
Benetton group Liquidity requirements are monitored by the Benetton group's in order to guarantee effective access to financial resources and/or adequate investment of liquidity. Credit facility management was coordinated by the parent company, which performed this function according to efficiency standards on the basis of group company needs. At December 31, 2015, the group had unused uncommitted credit lines of Euro 407 million. Management feels that currently available funds and credit facilities, apart from those which will be generated by operating and financing activities, will allow the group to satisfy its requirements as far as investment, working capital management, and debt repayment at natural maturity are concerned. The Benetton group's financial liabilities at December 31, 2015 are analysed by due date in the following tables; note that these amounts include cash flows arising from future financial charges.
(Thousands of Euro) 12.31.2015
Contractual maturity within1
year
Contractual maturity 1-2
years
Contractual maturity 2-3
years
Contractual maturity 3-4
years
Contractual maturity 4-5
years
Contractual maturity beyond
5 years
Non-current liabilities Medium/long-term loans 872 - 580 292 - - - Other medium/long-term payables 5,967 295 2,761 76 40 656 2,139 Lease financing 82 - 47 35 - - - Current liabilities Trade payables 359,579 359,563 16 - - - -
Other payables, accrued expenses and deferred in-come 50,320 47,037 687 623 405 367 1,201 Current portion of lease financing 47 47 - - - - - Current portion of me-dium/long-term loans 626 626 - - - - - Financial payables and bank loans 62,321 62,320 1 - - - -
Olimpias group Regarding liquidity risk, the requirement, if any, arising from investing activities are covered by the credit facilities made available to the company by two national banks.
Edizione Property group At December 31, 2015 Edizione Property S.p.A. had unused committed credit lines of Euro 100 million and uncommitted credit lines of Euro 10 million. Liquidity requirements are monitored by the parent company’s head office functions in order to guarantee effective access to financial resources and/or adequate investment of liquidity. Management feels that currently available funds and credit facilities, apart from those which will be generated by operating and financing activities, will allow the group to satisfy its requirements as far as investment, working capital management, and debt repayment at natural maturity are concerned.

104 CONSOLIDATED FINANCIAL STATEMENTS AT DECEMBER 31, 2015
Autogrill group Liquidity risk arises when it proves difficult to meet the obligations relating to financial liabilities. The group manages liquidity by ensuring that to the extent possible, it always has sufficient funds to meet its obligations on time, without incurring excessive charges or risking damage to its reputation. The elements that make up the Autogrill group's liquidity are the resources generated or used in operating and investing activities, the characteristics of its debt, the liquidity of its financial investments, and financial market conditions. Exposure and maturity data at December 31, 2015 were as follows: 12.31.2015 (Thousands of Euro) Contractual cash flows
Non-derivative financial liabilities Carrying amount Total 1-3 months 3-6 months
6 months-1 year 1-2 years 2-5 years Over 5 years
Current accounts overdrafts 52,989 52,989 52,989 - - - - - Unsecured bank loans 315,000 315,000 35,000 - - - 280,000 - Lease payments due to others 5,675 5,675 230 135 275 477 851 3,707 Other financial liabilities 321 321 - - - - - 321 Bonds 463,738 463,738 - - - 141,139 - 322,599 Trade payables 398,802 398,802 392,193 6,480 91 27 11 - Due to suppliers for invest-ments 78,517 78,517 78,511 - - - - 6 Total 1,315,042 1,315,042 558,923 6,615 366 141,643 280,862 326,633
12.31.2015 (Thousands of Euro) Contractual cash flows
Derivative financial liabilities Carrying amount Total 1-3 months 3-6 months
6 months-1 year 1-2 years 2-5 years Over 5 years
Forward foreign exchange derivatives 340 340 340 - - - - - Total 340 340 340 - - - - -

CONSOLIDATED FINANCIAL STATEMENTS AT DECEMBER 31, 2015 105
Exposure and maturity data at December 31, 2014 were as follows: 12.31.2014 (Thousands of Euro) Contractual cash flows
Non-derivative financial liabilities Carrying amount Total 1-3 months 3-6 months
6 months-1 year 1-2 years 2-5 years Over 5 years
Current accounts overdrafts 40,426 40,426 40,426 - - - - - Unsecured bank loans 429,464 429,464 96,183 - - 333,281 - - Lease payments due to others 6,296 6,296 207 161 328 861 810 3,929 Other financial liabilities 289 289 - - - - - 289 Bonds 418,006 418,007 - - - - 129,358 288,649 Trade payables 377,114 377,115 369,479 7,390 223 13 10 - Due to suppliers for invest-ments 82,481 82,481 80,475 2,000 - - 6 - Total 1,354,077 1,354,077 586,770 9,551 551 334,155 130,184 292,867
12.31.2014 (Thousands of Euro) Contractual cash flows
Derivative financial liabilities Carrying amount Total 1-3 months 3-6 months
6 months-1 year 1-2 years 2-5 years Over 5 years
Forward foreign exchange derivatives 1,043 1,043 1,043 - - - - - Interest Rate Swap 4,321 4,321 - 3,888 - - - 433 Total 5,364 5,364 1,043 3,888 - - - 433 With regard to exposure to trade payables, there is no significant concentration of suppliers, of which the largest 10 account for 24.79% of the total and the leading supplier (Autostrade per l'Italia S.p.A., an Edizione group company) for 7.40%. The bond regulations call for compliance with certain financial ratios, calculated solely with respect to the companies headed up by HMSHost Corporation. They are not guaranteed by Autogrill S.p.A. There are also limits on the distribution of dividends by HMSHost Corporation to the parent, Autogrill S.p.A., if the leverage ratio of the HMSHost subgroup exceeds a certain amount. The loan contracts and bonds outstanding at December 31, 2015 require the satisfaction of certain financial ratios, specifically, the leverage ratio (net debt/Ebitda) and interest coverage ratio (Ebitda/net financial charges). These are measured with different criteria and for different groupings of companies depending on the loan and the beneficiary. In particular, Autogrill S.p.A. has outstanding loans for which the above ratios are calculated on figures pertaining to the Autogrill group as a whole. The weighted average term of bank loans and bonds at December 31, 2015, including unutilised credit lines, is approximately four years and six months (three years and four months at the end of 2014).
Atlantia group Liquidity risk relates to the risk that cash resources may be insufficient to fund the payment of liabilities as they fall due. The group believes that its ability to generate cash, the ample diversification of its sources of funding and the availability of committed and uncommitted lines of credit provides access to sufficient sources of finance to meet its projected financial needs.

106 CONSOLIDATED FINANCIAL STATEMENTS AT DECEMBER 31, 2015
At December 31, 2015, project debt allocated to specific overseas companies amounts to Euro1,828 million. At the same date the group has cash reserves of Euro 5,688 million, consisting of: a. Euro 2,997 million cash and cash equivalents and/or investments with a time horizon not exceeding the short
term; b. Euro 547 million in term deposits allocated primarily to part finance the execution of specific construction
services and to service the debt of certain Chilean companies; c. Euro 2,144 million in undrawn committed lines of credit. In particular, the group has credit lines with a
weighted duration, calculated from the expiry of the period of use (approximately 8 years and 5 months) and a weighted average remaining period of use (approximately 2 years and 3 months).
The following schedule shows the distribution of loan maturities outstanding at December 31, 2015. (Thousands of Euro) Financial liabilities
12.31.2015 Carrying amount Total contractual
flows Within 12 mon-
ths Between 1 and
2 years Between 3 and
5 years After 5 years
Non-derivative financial liabilities (1)
Total bond issues (A) 11,386,551 (14,716,589) (1,542,245) (1,097,359) (3,687,641) (8,389,344)
Medium/long-term loans (2)
Bank borrowings 3,308,211 (4,230,486) (249,397) (299,687) (877,141) (2,804,261)
Other borrowings 202,149 (52,280) - - (52,280) -
Total medium/long-term borrowings (B) 3,510,360 (4,282,766) (249,397) (299,687) (929,421) (2,804,261) Total non-derivative financial liabilities (C = A + B) 14,896,911 (18,999,355) (1,791,642) (1,397,046) (4,617,062) (11,193,605)
Derivatives (2) (3)
Interest Rate Swap (4) 146,997 (379,025) (22,379) (35,340) (133,789) (187,517)
IPCA x CDI Swap (4) 12,461 52,020 (7,833) (3,779) 15,760 47,872
Cross Currency Swap 308,625 (244,355) (12,241) (11,971) (36,163) (183,980)
Total derivatives 468,083 (571,360) (42,453) (51,090) (154,192) (323,625) (1) Future cash flows relating to floating rate loans have been projected on the basis of the latest established rate and applied and held
constant to final maturity. (2) At December 31, 2015, expected contractual flows are linked to highly probable present and future hedged financial liabilities covering
requirements from the present to 2017. (3) Expected future cash flows from differentials on derivatives have been projected on the basis of the exchange rate fixed at the
measurement date. (4) Future cash flows relating to differentials on interest rate swaps (IRS) and IPCA x CDI Swaps have been projected on the basis of the
latest interest rate fixed and held constant to the maturity of the contract.

CONSOLIDATED FINANCIAL STATEMENTS AT DECEMBER 31, 2015 107
The following schedule shows the distribution of loan maturities outstanding at December 31, 2014. (Thousands of Euro) Financial liabilities
12.31.2014 Carrying amount Total contractual
flows Within 12 mon-
ths Between 1 and
2 years Between 3 and
5 years After 5 years
Non-derivative financial liabilities (1)
Total bond issues (A) 10,493,593 (13,815,143) (675,641) (2,082,053) (4,401,347) (6,656,101)
Medium/long-term loans (2)
Bank borrowings 3,495,168 (4,418,940) (460,848) (229,456) (880,435) (2,848,201)
Other borrowings 161,710 (83,460) (31,293) - (46,909) (5,258)
Total medium/long-term borrowings (B) 3,656,878 (4,502,400) (492,141) (229,456) (927,344) (2,853,459) Total non-derivative financial liabilities (C = A + B) 14,150,471 (18,317,543) (1,167,782) (2,311,509) (5,328,691) (9,509,560)
Derivatives (3) (4)
Interest Rate Swap (5) 115,119 (308,420) (45,813) (37,486) (112,251) (112,870)
IPCA x CDI Swap (5) 9,800 61,384 (6,753) (4,400) 10,994 61,543
Cross Currency Swap 401,088 (364,367) (15,776) (16,025) (47,411) (285,155)
Total derivatives 526,007 (611,403) (68,342) (57,911) (148,668) (336,482) (1) Future cash flows relating to floating rate loans have been projected on the basis of the latest established rate and applied and held
constant to final maturity. (2) This item includes the liabilities of the French companies classified from discontinued operations. (3) Expected contractual flows are linked to the outstanding hedged financial liabilities at December 31, 2014. (4) Expected future cash flows from differentials on derivatives have been projected on the basis of the exchange rate fixed at the
measurement date. (5) Future cash flows relating to differentials on interest rate swaps (IRS) and IPCA x CDI Swaps have been projected on the basis of the
latest interest rate fixed and held constant to the maturity of the contract.
CREDIT RISK Credit risk is the risk of incurring losses due to the failure to collect receivables due for both normal commercial transactions and financial investments. It includes the direct risk of the counterparty's insolvency or decrease in creditworthiness, as well as credit concentration risk. The carrying value of the financial assets is the group’s maximum exposure to credit risk, in addition to the face value of guarantees given for the borrowings or commitments of third parties.
Benetton group The Benetton group has different concentrations of credit risk depending on the nature of the activities which have generated the receivables. Commercial credit risk is essentially related to the indirect channel (wholesale). Sales to direct channel customers are settled in cash or using credit cards and other debit cards. Individually significant positions can be subject to individual write-down if they are objectively considered to be partially or totally unrecoverable. The amount of the write-down takes into account a forecast of recoverable cash flows and their relevant collection date, as well as the fair value of warranties. Collective provisions are made for receivables which are not subject to individual write-down, taking into account bad debt history and statistical data. Financial credit risk lies in the counterpart’s or the issuer’s inability to settle its financial obligations. The company uses financial instruments to invest liquidity and hedge financial risks, with the following rating and concentration limits per individual issuer:

108 CONSOLIDATED FINANCIAL STATEMENTS AT DECEMBER 31, 2015
! Liquidity investments: for maturities of more than 90 days, a long-term issuer and/or counterparty rating of at least "BBB-" from S&P (or equivalent); for shorter maturities, a short-term issuer and/or counterparty rating of at least "A-3" from S&P (or equivalent). To limit the concentration risk, the maximum exposure per individual issuer depends on the rating (and can range from 10 to 50 million) and in any case must not exceed 30% of the value of investments. These limits do not apply in the case of cash on hand and bank deposits with maturities of less than two weeks;
! Financial risk hedging: for maturities of more than 12 months, a long-term issuer or counterparty rating of at least "BBB-" from S&P (or equivalent); for shorter maturities, a short-term issuer or counterparty rating of at least "A-3" from S&P (or equivalent). To limit the concentration risk, the maximum exposure per individual counterparty depends on the rating (and can range from 25% to 40%).
Cash and cash equivalents are stated at their fair value; furthermore, at December 31, 2015 the group does not have any positions with sovereign debtors carrying significant repayment risks.
Olimpias group Trade receivables from customers that are not part of the Benetton group are usually insured with a major insurance company, for about 85% of their amount. The percentage of the insurance coverage is reduced in the case of customers residing in high risk countries. Positions can be subject to individual write-down if they are objectively considered to be partially or totally unrecoverable. The amount of the write-down takes into account a forecast of recoverable cash flows and their relevant collection date, as well as the fair value of warranties. Collective provisions are made for receivables which are not subject to individual write-down, taking into account bad debt history and statistical data on the basis of the last five years.
Autogrill group Exposure to credit risk depends on the specific characteristics of each customer. The Autogrill group's business model, centred on the relationship with the end consumer, means that trade receivables and thus the relative degree of risk is of limited significance in relation to total financial assets, since most sales are paid for in cash. In most cases, the Autogrill group's trade receivables stem from catering service agreements and commercial affiliations. Other receivables consist mainly of amounts due from Inland Revenue and other government agencies, fees paid in advance, and advances for services or commercial investments made on behalf of concession grantors, for which the degree of credit risk is low. Financial assets are recognised net of impairment losses calculated on the basis of the counterparty's risk of default. Impairment is determined according to local procedures, which may require impairment of individual positions, if material, where there is evidence of an objective condition of uncollectability of part or all of the amount due, or collective impairment calculated on the basis of historical and statistical data. There is no significant concentration of credit risk: the top 10 customers account for 18.77% of total trade receivables, and the largest customer (Tamoil Italia S.p.A.) for 3.01%.
Atlantia group The group manages credit risk essentially through recourse to counterparties with high credit ratings, with no significant credit risk concentrations as required by financial policy. Credit risk deriving from outstanding derivative financial instruments can also be considered marginal in that the counterparties involved are major financial institutions. There are no margin agreements providing for the exchange of cash collateral if a certain fair value threshold is exceeded. Provisions for impairment losses on individually material items, on the other hand, are established when there is objective evidence that the group will not be able to collect all or any of the amount due. The amount of the provisions takes account of estimated future cash flows and the date of collection, any future recovery costs and

CONSOLIDATED FINANCIAL STATEMENTS AT DECEMBER 31, 2015 109
expenses, and the value of any security and guarantee deposits received from customers. General provisions, based on the available historical and statistical data, are established for items for which specific provisions have not been made.
60 Related party transactions
The following table shows income and costs for the year and balance sheet figures at December 31, 2015 as a result of related party transactions. Related party transactions are conducted at arm's length and with the utmost transparency.
(Thousands of Euro) Receivables Payables Operating
costs Revenues Other opera-
ting income Interest in-
come Interest charges
Non-consolidated subsidiaries 1,436 161 1,993 235 37 6 1
Associated companies 17,400 100 700 1,700 2,102 9,000 -
Total 18,836 261 2,693 1,935 2,139 9,006 1

110 CONSOLIDATED FINANCIAL STATEMENTS AT DECEMBER 31, 2015
61 Non-controlling interests in subsidiaries
The consolidated companies with material non-controlling interests for the purposes of IFRS 12 disclosures are as follows: ! Atlantia S.p.A. and its subsidiaries; ! Autogrill S.p.A. and its subsidiaries;
The figures in the following table thus refer to those companies and their subsidiaries and have been taken, unless otherwise specified, from their consolidated financial statements.
Atlantia group Autogrill group
(Millions of Euro) 2015 2014 2015 2014
Revenues 5,304 5,083 4,942 4,570
Income (loss) for the year 975 773 78 37
Income (loss) for the year, minority interests 122 33 14 12
Non-current assets 28,543 29,114 1,876 1,780
Current assets 5,578 5,063 525 522
Non-current liabilities 20,714 21,271 953 949
Current liabilities 4,924 4,643 848 862
Net assets 8,483 8,263 600 491
Net assets, minority interests 1,683 1,744 40 32
Cash flow from operating activities 2,211 1,823 297 209
Cash flow from investing activities (1,341) (716) (193) (159)
Cash flow from financing activities 173 (3,551) (139) (44)
Translation impact on cash and cash equivalent (36) 3 1 7
Increase / (Decrease) of cash and cash equivalents 1,007 (2,441) (34) 13
Dividends paid to minority interests (29) (9) (21) (21)
62 Business combinations
Main business combinations occurring in 2015 are detailed below. Acquisition of a controlling interest in Società Autostrada Tirrenica On February 25, 2015 the group's subsidiary Atlantia Autostrade per l’Italia, which already owned 24.98% of Società Autostrada Tirrenica, signed agreements to acquire a further 74.95% stake in the company, thus raising its total interest to 99.93%. The transaction was completed in September 2015, after obtaining the Grantor's authorisation, with Autostrade per l'Italia paying a total price of Euro 84.3 million. Società Autostrade Tirrenica was a subsidiary of Autostrade per l'Italia until 2011, and is the operator of the A12 Livorno–Civitavecchia motorway. The relevant Unified Agreement signed in 2009 with the Grantor provides for the extension of the concession from October 31, 2028 to December 31, 2046, as well as the execution of the works to complete the entire motorway to Civitavecchia. After some remarks by the European Commission with regard, inter alia, to the extension of the concession until 2046, on October 14, 2014 the Grantor sent to Società Autostrade Tirrenica an addition to the Agreement which provides for the expiration of the concession in 2043, the completion of the works on the Civitavecchia–Tarquinia section (currently in progress) and the possible completion of the motorway (by sections or otherwise) to be executed by third parties on the basis of tendering procedures. The completion of the motorway is subject to the fulfilment of technical, economic and financial conditions, to be ascertained jointly by the Grantor and the Operator, upon the conclusion of an addition to the Agreement with an attached well-balanced economic and financial plan. Subsequently, on May 13, 2015, a memorandum of understanding was signed between the Grantor, the Tuscany Region, the Lazio Region,

CONSOLIDATED FINANCIAL STATEMENTS AT DECEMBER 31, 2015 111
Autostrade per l'Italia and Società Autostrade Tirrenica with an attached addition to the Agreement confirming (i) duration of the concession until 2043, (ii) the requirement of a balanced financial plan for the Civitavecchia – Tarquinia section, and (iii) the obligation to outsource all works, and also providing for the commitment by Società Autostrade Tirrenica to develop projects to optimise the final designs for the Tarquinia – Ansedonia section, as well as the final designs and environmental impact study (SIA) for the Ansedonia – Grosseto Sud section and the final design for the improvements of the current road conditions of State Road 1 Variante Aurelia in the Grosseto Sud–S. Pietro in Palazzi section, maintaining the current geometric characteristics. The execution of these works remains subject to the successful outcome of the technical, engineering, economic, financial and administrative analyses to be conducted jointly by the Grantor and Società Autostrade Tirrenica for the execution of the completion works described above, and to the conclusion of an additional agreement including a balanced economic and financial plan. At the request of the Grantor dated June 5, 2015, following further talks with Italian representatives at the European Union, on June 24, 2015 Società Autostrade Tirrenica drew up and transmitted additional versions of a financial plan concerning (i) the sections in operation and the section under construction of the Civitavecchia–Tarquinia motorway, and (ii) the entire Civitavecchia-San Pietro in Palazzi section, both expiring on December 31, 2040. For the purpose of preparing these consolidated financial statements, the transaction was accounted for in accordance with IFRS 3, using the acquisition method which resulted in the recognition of the fair value of the assets acquired and the liabilities assumed by Società Autostrade Tirrenica. The table below shows the carrying amounts of the net assets acquired, as well as the values of the relevant fair values identified. (Millions of Euro)
Carrying amount
Fair value adjustments Fair value
Net assets acquired:
Property, plant and equipment 0.3 - 0.3
Intangible assets 287.2 58.8 346.0
Non-current financial liabilities 4.4 - 4.4
Other non-current assets 0.1 - 0.1
Cash and cash equivalents 12.6 - 12.6
Trading and other current assets 22.3 - 22.3
Non-current financial liabilities (47.9) 17.8 (30.1)
Deferred tax assets 9.2 (23.9) (14.7)
Current financial liabilities (176.9) - (176.9)
Provisions (8.5) - (8.5)
Trading and other current liabilities (42.9) - (42.9)
Total net assets acquired 59.9 52.7 112.6
Carrying amount of 24.98% interest already held in acquired company 28.2
Minority interest 0.1
Cost of aquisition 84.3
Cash and cash equivalents acquired (12.6)
Net effective cash outflow for the acquisition 71.7

112 CONSOLIDATED FINANCIAL STATEMENTS AT DECEMBER 31, 2015
Completion of the measurement process has resulted in a net fair value adjustment to the net assets acquired of Euro 52.7 million, reflecting recognition of the following: a. an increase in the value of the concession held by Società Autostrade Tirrenica, estimated at Euro 58.8
million; b. adjustment to fair value of the non-interest bearing financial liability of Società Autostrade Tirrenica relating
to the amount due to the former Fondo Centrale di Garanzia, with the recognition of smaller value thereof estimated at Euro 17.8 million;
c. the relevant net deferred taxes of Euro 23.9 million.
From the date of initial consolidation until December 31, 2015, Società Autostrade Tirrenica reported total revenues of Euro 21.3 million and a net loss of Euro 0.1 million. If the company had been fully consolidated from January 1, 2015, the Atlantia group's 2015 consolidated revenues and consolidated net profit would have amounted to Euro 6,116.2 million (of which Euro 805.3 million relating to revenues from construction services) and Euro 980.5 million, respectively. Additionally, at the end of 2015 Società Autostrade Tirrenica completed the acquisition of treasury shares equal to 0.06% of its share capital. Therefore, at December 31, 2015 the group holds 99.99% of Società Autostrade Tirrenica.
63 Significant events following the end of the financial year
Benetton Group S.r.l. Following the intention expressed by the Korean partners to exercise the option to sell their equity investment, equal to 50% of the share capital of Benetton Korea Inc., the purchase of the aforesaid interest by Benetton Group S.r.l. was finalised on April 1, 2016. As a result of this transaction, Benetton Group S.r.l. will own 100% of Benetton Korea Inc. The total price for the acquisition was 20.0 billion Korean won.
Edizione Property S.p.A. On January 1, 2016 the Luxembourg subsidiary Benetton Real Estate International S.A. was merged by incorporation into Edizione Property S.p.A. The cross-border merger, which also had positive effects in terms of efficiency and simplification, was aimed at transferring to the acquiring company Edizione Property S.p.A. the business activities currently carried out autonomously by the subsidiary Benetton Real Estate International S.A.
64 Atypical and/or unusual transactions
As required by the Consob Communication DEM/6064293 dated July 28, 2006, the Group companies have not undertaken any atypical and/or unusual transactions, meaning those whose significance/materiality, nature of the counterparties, purpose, method of determining the transfer price, or timing might give rise to doubts as to the fairness or completeness of the information contained in the financial statements, conflicts of interest, the safekeeping of assets and the interests of non-controlling shareholders.

CONSOLIDATED FINANCIAL STATEMENTS AT DECEMBER 31, 2015 113
65 Guarantees given, commitments and other contingent liabilities
(Thousands of Euro) 12.31.2015 12.31.2014
Unsecured guarantees given
Sureties and guarantees 565,414 746,256
Commitments
Purchase commitments 16,670 19,529
Sale commitments 4,889 4,432
Other commitments 14,126 14,070
Total 601,099 784,287 Guarantees are made up as follows: ! guarantees given by the parent company to the Italian tax authorities for Euro 86,945, to guarantee VAT
credits offset as part of the VAT settlement procedure for some Italian Group companies; ! guarantees given by the Autogrill group in the amount of Euro 253,828 in the form of performance bonds and
other personal guarantees issued in favour of grantors and business counterparties; ! guarantees given to third parties by the Atlantia group, including the following of particular importance: a. the guarantee issued in favour of Strada dei Parchi's creditor banks and on this company's behalf, to cover
the interest rate risk on cash flow hedging derivatives. The value of the guarantee is determined based on the fair value of these derivatives, for a maximum amount guaranteed of Euro 40,000, corresponding to the amount at December 31, 2015. This guarantee, renewed in February 2016 for an additional 12 months, is enforceable only if Strada dei Parchi's concession is terminated; Atlantia holds a counter guarantee from Toto Holding (Strada dei Parchi's majority shareholder), which has committed to take over from Atlantia by October 31, 2016;
b. bank guarantees on behalf of Tangenziale di Napoli (Euro 29,756) in favour of the Ministry of Infrastructure and Transport, as provided for in the commitments assumed in the agreement;
c. the counter guarantees issued by Atlantia on behalf of its subsidiary Electronic Transaction Consultants, in favour of insurance companies that have issued performance bonds totalling Euro 107,779, to guarantee free flow tolling projects in course;
d. bank guarantees given by Telepass (Euro 25,789) in favour of certain French companies in relation to the business of the company in France.
Purchase commitments chiefly relate to payments to be made to investment funds held by the Parent Company (Euro 14,357) and preliminary agreements for the purchase of commercial properties by the Autogrill group (Euro 2,272). Sale commitments consist of the value of sale-or-return products held at the premises of Autogrill group companies (Euro 4,799). Also at December 31, 2015 the shares of certain of the Atlantia group’s overseas motorway operators have been pledged to providers of project financing to those companies, as have shares in Pune-Solapur Expressways, Lusoponte and Bologna & Fiera Parking.

114 CONSOLIDATED FINANCIAL STATEMENTS AT DECEMBER 31, 2015
At the end of the year, the future payments due by the Group for rents and operational leases which cannot be terminated were as follows: (Thousands of Euro) 12.31.2015 12.31.2014
Within 1 year 494,671 494,402
From 1 to 5 years 1,499,362 1,471,930
Beyond 5 years 1,155,416 1,051,602
Total 3,149,449 3,017,934
66 Other commitments and rights
No Other commitments and rights of the group are reported other than those already mentioned in other notes of these financial statements.
67 Contingent liabilities
Benetton group The Group has not recognised any provisions against an estimated amount of around Euro 68.3 million in liabilities associated with unsettled litigation, insofar as it considers that the risk of a related financial outlay is only "possible", in compliance with IAS 37. Contingent liabilities for the parent company include the tax disputes (IRES/IRAP) for tax years 2004 to 2008 concerning the claimed disallowance of certain costs for commissions paid to agents resident in low-tax jurisdictions.
Atlantia group Since June 20, 2012, the Polish Antitrust Authority has been conducting an Explanatory Proceeding to investigate Stalexport Autostrada Maloposka. The proceeding aims to investigate the company’s “abuse of its dominant position" with regard to the tolls charged to road users when carrying out construction and extraordinary maintenance work, given that Stalexport Autostrada Maloposka is held to operate as a "monopoly". Should the Authority rule that there has been an "abuse of its dominant position", the proceeding could result in a fine.
68 Fees paid to the external auditors
The following table presents the fees paid to the Parent Company’s external auditors (Deloitte & Touche S.p.A.) for all services provided to Edizione Group companies in 2015. (Thousands of Euro) 2015
Type of service:
Audit 3,013
Certification 131
Other services 920
Total 4,064

CONSOLIDATED FINANCIAL STATEMENTS AT DECEMBER 31, 2015 115
ANNEXES
LIST OF CONSOLIDATED COMPANIES AT DECEMBER 31, 2015
Company name Registered office Currency Share capital Percentage
held
Companies consolidated on a line-by-line basis
Parent Company and holding companies
Edizione S.r.l. Italy Euro 1,500,000,000
Schemaquattordici S.p.A. Italy Euro 1,067,494 58.99%
Sintonia S.p.A. Italy Euro 930,000 100.00%
Schematrentaquattro S.p.A. Italy Euro 100,000,000 100.00%
Schematrentasette S.r.l. Italy Euro 225,708,850 100.00%
Schematrentotto S.r.l. Italy Euro 8,411,895 100.00%
Food & Beverage
Autogrill S.p.A. Italy Euro 68,688,000 50.10%
Ac Restaurants & Hotels Beheer NV Belgium Euro 3,250,000 100.00%
Anton Airfood Inc USA Usd 1,000 100.00%
Anton Airfood JFK Inc USA Usd - 100.00%
Anton Airfood of Cincinnati Inc USA Usd - 100.00%
Anton Airfood of Minnesota Inc USA Usd - 100.00%
Anton Airfood of Newark Inc USA Usd - 100.00%
Anton Airfood of Seattle Inc USA Usd - 100.00%
Anton Airfood of Texas Inc USA Usd - 100.00%
Anton Airfood of Tulsa Inc USA Usd - 100.00%
Autogrill Aéroports S.A.S. France Euro 2,207,344 100.00%
Autogrill Austria Ag Austria Euro 7,500,000 100.00%
Autogrill Belux NV Belgium Euro 10,000,000 100.00%
Autogrill Catering UK Ltd United Kingdom Gbp 217,063 100.00%
Autogrill Commercial Catering France Sàrl (in liquidation) France Euro 361,088 100.00%
Société de Gestion Pétrolière Autogrill S.a.r.l. (SGPA) France Euro 8,000 100.00%
Autogrill Coté France S.A.S. France Euro 31,579,526 100.00%
Autogrill Czech Sro Czech Republic Czk 154,463,000 100.00%
Autogrill Deutschland GmbH Germany Euro 205,000 100.00%
Autogrill D.o.o. Slovenia Euro 1,342,670 100.00%
Autogrill FFH Autoroutes S.àr.l. France Euro 375,000 100.00%
Autogrill FFH Centres Villes S.àr.l. France Euro 375,000 100.00%
Autogrill Gares Métropoles S.àr.l. France Euro 4,500,000 100.00%
Autogrill Hellas Epe Greece Euro 3,696,330 100.00%
Autogrill Iberia Slu Spain Euro 7,000,000 100.00%
Autogrill Nederland BV The Netherlands Euro 41,371,500 100.00%
Autogrill Nederland Hotel Amsterdam BV The Netherlands Euro 150,000 100.00%
Autogrill Nederland Hotels BV The Netherlands Euro 1,500,000 100.00%
Autogrill Polska Sp Zoo Poland Pln 14,050,000 100.00%
Autogrill Russia Llc Russia Rub 10,000 100.00%

116 CONSOLIDATED FINANCIAL STATEMENTS AT DECEMBER 31, 2015
Company name Registered office Share capital Percentage
held
Autogrill Restauration Carrousel S.A.S. France Euro 2,337,000 100.00%
Sociètè Berrichonne de Restauration S.a.s. (Soberest) France Euro 288,000 50.00%
Autogrill Restauration Services S.A.S. France Euro 15,394,500 100.00%
Société Porte de Champagne S.A. (SPC) France Euro 153,600 53.33%
Société de Restauration de Bourgogne S.a.s. (Sorebo) France Euro 144,000 50.00%
Société de Restauration de Troyes-Champagne S.A. (SRTC) France Euro 1,440,000 70.00%
Autogrill Schweiz Ag Switzerland Chf 23,183,000 100.00%
Carestel Nord S.àr.l. (in liquidation) France Euro 76,225 99.80%
Fresno AAI Inc USA Usd - 100.00%
HK Travel Centres GP Inc Canada Cad - 51.00%
HK Travel Centres Lp Canada Cad - 51.00%
HMSHost Family Restaurants Inc USA Usd 2,000 100.00%
HMSHost Finland Oy Finland Euro 2,500 100.00%
HMSHost Huazhuo (Bejing) Catering Management Co. Ltd Cina Cny 12,239,987 60.00%
HMSHost Hospitality Services Bharath Pte Ltd India Inr 500,000 100.00%
HMSHost and Lite Bite Pte Ltd India Inr - 51.00%
HMSHost Motorways Inc Canada Cad - 100.00%
HMSHost New Zealand Ltd New Zealand Nzd 1,520,048 100.00%
HMSHost (Shanghai) Catering Management Co Ltd China Cny 1,300,000 100.00%
HMSHost (Shanghai) Enterprise Management Consulting Co Ltd China Cny - 100.00%
HMSHost Yiyeecek ve Icecek Hizmetleri As Turkey Trl 10,271,734 100.00%
HMSHost Antalya Yiyeecek ve Icecek Hizmetleri As Turkey Trl 2,140,000 51.00%
HMS - Airport Terminal Services Inc USA Usd 1,000 100.00%
HMSHost Corporation USA Usd - 100.00%
HMSHost International Inc USA Usd - 100.00%
HMSHost Ireland Ltd Ireland Euro 13,600,000 100.00%
HMSHost Services India Private Ltd India Inr 668,441,680 100.00%
HMSHost Singapore Pte Ltd Singapore Sgd 8,470,896 100.00%
HMSHost Sweden Ab Sweden Sek 2,500,000 100.00%
HMSHost Tollroads Inc USA Usd - 100.00%
HMSHost Usa Inc USA Usd - 100.00%
HMSHost Usa Llc USA Usd - 100.00%
Holding de Participations Autogrill S.A.S. France Euro 84,581,920 100.00%
Horeca Exploitatie Maatschappij Schiphol BV The Netherlands Euro 45,400 100.00%
Host (Malaysia) Sdn Bhd Malaysia Myr 2 100.00%
Host International (Poland) Spzoo (in liquidation) Poland Usd - 100.00%
Host International Inc USA Usd - 97.00%
Host International of Canada Ltd Canada Cad 75,351,237 100.00%
Host International of Maryland Inc USA Usd 1,000 100.00%
Host International of Kansas Inc USA Usd 1,000 100.00%
HMSHost International BV The Netherlands Euro 18,090 100.00%
Host Services Inc USA Usd - 100.00%
Host Services of New York Inc USA Usd 1,000 100.00%
Host Services Pty Ltd Australia Aud 6,252,872 100.00%
Islip AAI Inc USA Usd - 100.00%
Marriott Airport Concessions Pty Ltd Australia Aud 2,000 100.00%

CONSOLIDATED FINANCIAL STATEMENTS AT DECEMBER 31, 2015 117
Company name Registered office Share capital Percentage
held
Michigan Host Inc USA Usd 1,000 100.00%
NAG BV Russia Euro 100 60.00%
Nuova Sidap S.r.l. Italy Euro 100,000 100.00%
Palm Springs AAI Inc USA Usd - 100.00%
Restair Uk Ltd (in liquidazione) United Kingdom Gbp - 100.00%
Restoroute de Bavois S.A. Switzerland Chf 2,000,000 73.00%
Restoroute de la Gruyère S.A. Switzerland Chf 1,500,000 54.33%
Shenzen Host Catering Company Ltd (in liquidation) China Usd - 100.00%
SMSI Travel Centres Inc Canada Cad 10,800,100 100.00%
Volcarest S.A. France Euro 1,050,144 50.00%
PT Autogrill Taurus Gemilang Indonesia Indonesia Usd 1,000,000 70.00%
HMSHost Nederland BV The Netherlands Euro 100 100.00%
Host Bush Lubbock Airport Joint Venture USA Usd - 90.00%
Host-Chelsea Joint Venture #1 USA Usd - 65.00%
Host-Tinsley Joint Venture USA Usd - 84.00%
Host/ Howell - Mickens Joint Venture USA Usd - 65.00%
Airside C F&B Joint Venture USA Usd - 70.00%
Bay Area Restaurant Group USA Usd - 49.00%
HMSHost Coffee Partners Joint Venture USA Usd - 50.01%
Host & Garrett Joint Venture USA Usd - 75.00%
Host CTI Denver Airport Joint Venture USA Usd - 90.00%
Host D&D STL FB Llc USA Usd - 75.00%
Host PJJD Jacksonville Joint Venture USA Usd - 51.00%
Host Shellis Atlanta Joint Venture USA Usd - 70.00%
Host/Java Star Services Joint Venture USA Usd - 50.01%
Host/Coffee Star Joint Venture USA Usd - 50.01%
Host/Diversified Joint Venture USA Usd 90.00%
Host/Forum Joint Venture USA Usd - 70.00%
Host/JQ RDU Joint Venture USA Usd - 75.00%
Host/JV Ventures McCarran Joint Venture USA Usd - 60.00%
Host/LJA Joint Venture USA Usd - 85.00%
Host/Tarra Enterprises Joint Venture USA Usd - 75.00%
Host-Chelsea Joint Venture #3 USA Usd - 63.80%
Host-Chelsea Joint Venture #4 USA Usd - 63.00%
Islip Airport Joint Venture USA Usd - 50.00%
Seattle Restaurant Associates USA Usd - 70.00%
Southwest Florida Airport Joint Venture USA Usd - 78.00%
Tinsley/Host - Tampa Joint Venture Company USA Usd - 49.00%
HMS/Blue Ginger Joint Venture USA Usd - 55.00%
HMSHost Family Restaurants Llc USA Usd 2,000 100.00%
HMSHost Motorways Lp Canada Cad - 100.00%
Host/DFW AF Llc USA Usd - 50.01%
Host-D/FW Airport Jv USA Usd - 65.00%
Host Adevco Joint Venture USA Usd - 70.00%
Host MCA TEI FLL FB, Llc USA Usd - 76.00%
Host CTI DEN F&B STA, Llc USA Usd - 80.00%

118 CONSOLIDATED FINANCIAL STATEMENTS AT DECEMBER 31, 2015
Company name Registered office Share capital Percentage
held
HOST MCA SRQ FB, Llc USA Usd - 90.00%
HHL Cole's LAX F&B Llc USA Usd - 80.00%
Host-CTI DEN F&B II Llc USA Usd - 80.00%
Host FDY ORF F&B Llc USA Usd - 90.00%
Host Fox PHX F&B Llc USA Usd - 75.00%
Host GRL LIH F&B Llc USA Usd - 85.00%
Host H8 Terminal E F&B Llc USA Usd - 60.00%
Host Havana LAX F&B Llc USA Usd - 90.00%
Host Havana LAX TBIT FB, Llc USA Usd - 70.00%
Host Howell Terminal A F&B Llc USA Usd - 65.00%
Host JQE RDU Prime Llc USA Usd - 85.00%
Host Lee JAX FB Llc USA Usd - 80.00%
Host LGO PHX F&B Llc USA Usd - 80.00%
Host TCC BHM F&B Llc USA Usd - 70.00%
Host WAB SAN FB Llc USA Usd - 95.00%
Host-CMS SAN F&B Llc USA Usd - 65.00%
Host CMS LAX TBIT F&B Llc USA Usd - 70.00%
Host-Love Field Partners I Llc USA Usd - 51.00%
LTL ATL JV Llc USA Usd - 70.00%
Host ATL Chefs JV 3 Llc USA Usd - 95.00%
Host ATL Chefs JV 5 Llc USA Usd - 85.00%
Host Honolulu Joint Venture Company USA Usd - 90.00%
Host of Kahului Joint Venture Company USA Usd - 90.00%
Host Houston 8 IAH Terminal B Llc USA Usd - 60.00%
Host-TFC-RSL Llc USA Usd - 65.00%
Host-True Flavors SAT Terminal A FB USA Usd - 65.00%
Host MGV DCA FB Llc USA Usd - 70.00%
Host MGV DCA KT Llc USA Usd - 51.00%
Host MGV IAD FB Llc USA Usd - 65.00%
Host ECI ORD FB Llc USA Usd - 51.00%
Host Aranza Howell DFB B&E FB Llc USA Usd - 55.00%
Miami Airport FB Partners Jv USA Usd - 70.00%
Host MCA ATL FB Llc USA Usd - 64.00%
Host BGV IAH FB, Llc USA Usd - 55.00%
Host H8 IAH FB I, Llc USA Usd - 60.00%
Host MBA LAX SB, Llc USA Usd - 70.00%
Host JQE CVF FB, Llc USA Usd - 90.00%
Host MBA CMS LAX, Llc USA Usd 5,593,000 60.00%
Host TBL TPA FB, Llc USA Usd - 71.00%
Autogrill VFS F&B Co. Ltd Vietnam Usd 5,000,000 70.00%
Textiles & clothing
Benetton Group S.r.l. Italy Euro 200,000,000 100.00%
Retail Italia Netwok S.r.l. Italy Euro 1,000,000 100.00%
Benetton Servizi S.r.l. Italy Euro 5,100,000 100.00%
Fabrica S.p.A. Italy Euro 4,128,000 100.00%
Ponzano Children S.r.l. Italy Euro 110,000 100.00%
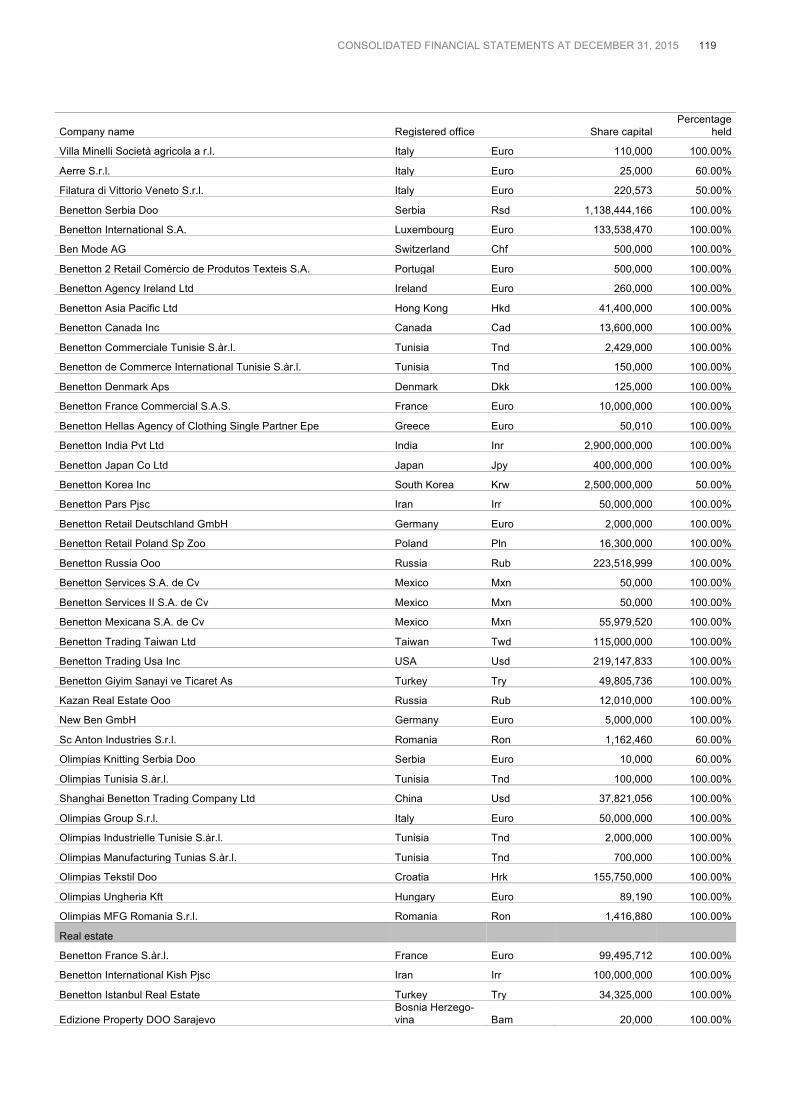
CONSOLIDATED FINANCIAL STATEMENTS AT DECEMBER 31, 2015 119
Company name Registered office Share capital Percentage
held
Villa Minelli Società agricola a r.l. Italy Euro 110,000 100.00%
Aerre S.r.l. Italy Euro 25,000 60.00%
Filatura di Vittorio Veneto S.r.l. Italy Euro 220,573 50.00%
Benetton Serbia Doo Serbia Rsd 1,138,444,166 100.00%
Benetton International S.A. Luxembourg Euro 133,538,470 100.00%
Ben Mode AG Switzerland Chf 500,000 100.00%
Benetton 2 Retail Comércio de Produtos Texteis S.A. Portugal Euro 500,000 100.00%
Benetton Agency Ireland Ltd Ireland Euro 260,000 100.00%
Benetton Asia Pacific Ltd Hong Kong Hkd 41,400,000 100.00%
Benetton Canada Inc Canada Cad 13,600,000 100.00%
Benetton Commerciale Tunisie S.àr.l. Tunisia Tnd 2,429,000 100.00%
Benetton de Commerce International Tunisie S.àr.l. Tunisia Tnd 150,000 100.00%
Benetton Denmark Aps Denmark Dkk 125,000 100.00%
Benetton France Commercial S.A.S. France Euro 10,000,000 100.00%
Benetton Hellas Agency of Clothing Single Partner Epe Greece Euro 50,010 100.00%
Benetton India Pvt Ltd India Inr 2,900,000,000 100.00%
Benetton Japan Co Ltd Japan Jpy 400,000,000 100.00%
Benetton Korea Inc South Korea Krw 2,500,000,000 50.00%
Benetton Pars Pjsc Iran Irr 50,000,000 100.00%
Benetton Retail Deutschland GmbH Germany Euro 2,000,000 100.00%
Benetton Retail Poland Sp Zoo Poland Pln 16,300,000 100.00%
Benetton Russia Ooo Russia Rub 223,518,999 100.00%
Benetton Services S.A. de Cv Mexico Mxn 50,000 100.00%
Benetton Services II S.A. de Cv Mexico Mxn 50,000 100.00%
Benetton Mexicana S.A. de Cv Mexico Mxn 55,979,520 100.00%
Benetton Trading Taiwan Ltd Taiwan Twd 115,000,000 100.00%
Benetton Trading Usa Inc USA Usd 219,147,833 100.00%
Benetton Giyim Sanayi ve Ticaret As Turkey Try 49,805,736 100.00%
Kazan Real Estate Ooo Russia Rub 12,010,000 100.00%
New Ben GmbH Germany Euro 5,000,000 100.00%
Sc Anton Industries S.r.l. Romania Ron 1,162,460 60.00%
Olimpias Knitting Serbia Doo Serbia Euro 10,000 60.00%
Olimpias Tunisia S.àr.l. Tunisia Tnd 100,000 100.00%
Shanghai Benetton Trading Company Ltd China Usd 37,821,056 100.00%
Olimpias Group S.r.l. Italy Euro 50,000,000 100.00%
Olimpias Industrielle Tunisie S.àr.l. Tunisia Tnd 2,000,000 100.00%
Olimpias Manufacturing Tunias S.àr.l. Tunisia Tnd 700,000 100.00%
Olimpias Tekstil Doo Croatia Hrk 155,750,000 100.00%
Olimpias Ungheria Kft Hungary Euro 89,190 100.00%
Olimpias MFG Romania S.r.l. Romania Ron 1,416,880 100.00%
Real estate
Benetton France S.àr.l. France Euro 99,495,712 100.00%
Benetton International Kish Pjsc Iran Irr 100,000,000 100.00%
Benetton Istanbul Real Estate Turkey Try 34,325,000 100.00%
Edizione Property DOO Sarajevo Bosnia Herzego-vina Bam 20,000 100.00%

120 CONSOLIDATED FINANCIAL STATEMENTS AT DECEMBER 31, 2015
Company name Registered office Share capital Percentage
held
Edizione Property Belgique S.A. Belgium Euro 14,500,000 100.00%
Benetton Real Estate International S.A. Luxembourg Euro 116,600,000 100.00%
Benetton Real Estate Kazakhstan Llp Kazakhstan Kzt 62,920,000 100.00%
Edizione Property France S.A. France Euro 15,002,250 100.00%
Edizione Property Portugal Imobiliaria S.A. Portugal Euro 100,000 100.00%
Edizione Property Mongolia Llp Mongolia Mnt 115,000,000 100.00%
Hotel Union Llc Kosovo Euro 3,200,000 100.00%
Kaliningrad Real Estate Ooo Russia Rub 10,000 100.00%
Property Russia Ooo Russia Rub 10,000 100.00%
Real Estate Russia Ooo Russia Rub 120,010,000 100.00%
Real Estate Ukraine Llc Ukraine Usd 7,921 100.00%
Real Estate Management Doo Russia Rub 250,000,000 100.00%
Edizione Property Spain S.L. Spain Euro 15,270,450 100.00%
Edizione Property S.p.A. Italy Euro 237,482,716 100.00%
Edizione Property Latvia Sla Latvia Lvl 630,000 100.00%
Edizione Property Austria GmbH Austria Euro 2,500,000 100.00%
Edizione Alberghi S.r.l. Italy Euro 5,000,000 100.00%
Cia de Tierras Sud Argentino S.A. Argentina Ars 253,000,000 100.00%
Infrastructures and services for mobility
Atlantia S.p.A. Italy Euro 825,783,990 30.25%
AD Moving S.p.A. Italy Euro 1,000,000 100.00%
Autostrade Concessoes e Partecipaçoes Brasil Ltda Brazil Brl 729,590,863 100.00%
Autostrade dell'Atlantico S.r.l. Italy Euro 1,000,000 100.00%
Autostrade Holding do Sur S.A. Chile Clp 51,496,805,692 100.00%
Autostrade Indian Infrastructure Development Pvt Ltd India Inr 500,000 100.00%
Autostrade Meridionali S.p.A. Italy Euro 9,056,250 58.98%
Autostrade per l'Italia S.p.A. Italy Euro 622,027,000 100.00%
Autostrade Portugal - Concessoes de Infraestructuras S.A. Portugal Euro 30,000,000 100.00%
Autostrade Tech S.p.A. Italy Euro 1,120,000 100.00%
Concessionaria da Rodovia MG050 S.A. Brazil Brl 113,525,350 50.00%
Dannii Holding GmbH Austria Euro 10,000 100.00%
Electronic Transactions Consultants Co USA Usd 20,000,000 64,46%
Ecomouv' S.A.S. France Euro 30,000,000 70.00%
EsseDiEsse Società di Servizi S.p.A. Italy Euro 500,000 100.00%
Giove Clear S.r.l. Italy Euro 10,000 100.00%
Grupo Costanera S.p.A. Chile Clp 465,298,430,418 50.01%
Infoblu S.p.A. Italy Euro 5,160,000 75.00%
Mizard S.r.l. Italy Euro 10,000 100.00%
Pavimental Polska Sp Zoo Poland Pln 3,000,000 98.58%
Pavimental S.p.A. Italy Euro 10,116,452 98.58%
Raccordo Autostradale Valle d'Aosta S.p.A. Italy Euro 343,805,000 24.46%
Rodovias das Colinas S.A. Brazil Brl 226,145,401 50.00%
Sociedad Concesionaria AMB S.A. Chile Clp 5,875,178,700 50.01%
Sociedad Concesionaria Autopista Nororiente S.A. Chile Clp 22,738,904,654 50.01%
Sociedad Concesionaria Autopista Nueva Vespucio Sur S.A. Chile Clp 166,967,672,229 50.01%

CONSOLIDATED FINANCIAL STATEMENTS AT DECEMBER 31, 2015 121
Company name Registered office Share capital Percentage
held
Sociedad Concesionaria Vespucio Sur S.A. Chile Clp 52,967,792,704 50.01%
Sociedad Concesionaria de los Lagos S.A. Chile Clp 53,602,284,061 100.00%
Sociedad Concesionaria Costanera Norte S.A. Chile Clp 58,859,765,519 50.01%
Sociedad Concesionaria Litoral Central S.A. Chile Clp 18,368,224,675 50.01%
Sociedad Gestion Vial S.A. Chile Clp 397,237,788 50.01%
Sociedad Operacion y Logistica de Infraestructuras S.A. Chile Clp 11,736,819 50.01%
Società Autostrada Tirrenica p.A. Italy Euro 24,460,800 99.99%
Società Italiana p.A. per il Traforo del Monte Bianco Italy Euro 198,749,200 99.18%
Spea Engineering S.p.A. Italy Euro 6,966,000 99.18%
Spea do Brasil Projectos e Infraestrutura Ldta Brazil Brl 1,000,000 100.00%
Stalexport Autoroute S.àr.l. Luxembourg Euro 56,149,500 61.20%
Stalexport Autostrada Malopolska S.A. Poland Pln 66,753,000 61.20%
Stalexport Autostrady S.A. Poland Pln 185,446,517 61.20%
Tangenziale di Napoli S.p.A. Italy Euro 108,077,490 100.00%
Tech Solutions Integrators S.A.S. (in liquidation) France Euro 2,000,000 100.00%
Telepass S.p.A. Italy Euro 26,000,000 100.00%
Triangulo do sol Auto-Estradas S.A. Brazil Brl 71,000,000 50.00%
VIA4 S.A. Poland Pln 500,000 33.66%
Aeroporti di Roma S.p.A. Italy Euro 62,224,743 95.92%
ADR Tel S.p.A. Italy Euro 600,000 95.92%
ADR Sviluppo S.r.l. Italy Euro 100,000 95.92%
ADR Assistance S.r.l. Italy Euro 4,000,000 95.92%
ADR Mobility S.r.l. Italy Euro 1,500,000 95.92%
ADR Security S.r.l. Italy Euro 400,000 95.92%
Airport Cleaning S.r.l. Italy Euro 1,500,000 95.92%
AB Concessòes S.A. Brazil Brl 738,652,989 50.00%
Fiumicino Energia S.r.l. Italy Euro 741,795 87.14%
Leonardo Energia - Società Consortile a r.l. Italy Euro 10,000 88.02%
Romulus Finance S.r.l. Italy Euro 10,000 N.A.
Other companies
Edizione Realty Czech Sro Czech Republic Czk 100,000,000 100.00%
Maccarese società agricola p.A. Italy Euro 34,485,805 100.00%
San Giorgio S.r.l. Italy Euro 100,000 100.00%
Verde Sport S.p.A. Italy Euro 8,000,000 100.00%
Asolo Golf Club S.r.l. Italy Euro 100,000 100.00%
Associates and joint control
Caresquick NV Belgium Euro 3,300,000 50.00%
Autogrill Middle East LLC Abu Dhabi Aed 100,000 50.00%
Dewina Host Sdn Bhd Malaysia Myr 350,000 49.00%
HKSC Opco Lp (Opco) Canada Cad - 49.00%
HKSC Developments Lp (Projecto) Canada Cad - 49.00%
Arab Host Services LLC Qatar Qar 200,000 49.00%
Autostrade for Russia GmbH Austria Euro 60,000 25.50%
Concesionaria Rodovias do Tieté S.A. Brazil Brl 303,578,476 50.00%
Pune Solapur Expressways Pvt Ltd India Inr 100,000,000 50.00%
Bologna & Fiera Parking S.p.A. Italy Euro 2,715,200 36.81%

122 CONSOLIDATED FINANCIAL STATEMENTS AT DECEMBER 31, 2015
Company name Registered office Share capital Percentage
held
Biuro Centrum Sp Zoo Poland Pln 80,000 40.63%
GEIE del Traforo del Monte Bianco Italy Euro 2,000,000 50.00%
Pedemontana Veneta S.p.A. (in liquidation) Italy Euro 6,000,000 29.77%
Società Infrastrutture Toscane S.p.A. (in liquidation) Italy Euro 15,000,000 46.60%
Subsidiaries and associates carried on at cost or fair value
Schematrentatre S.p.A. Italy Euro 120,000 100.00%
Schematrentasei S.r.l. Italy Euro 15,000 100.00%
Schemaquaranta S.r.l. Italy Euro 10,000 100.00%
Benetton Rugby Treviso S.r.l. Italy Euro 52,000 100.00%
Pallacanestro Treviso Società Sportiva Dilettantistica a r.l. Italy Euro 50,000 100.00%
Eurostazioni S.p.A. Italy Euro 160,000,000 32.71%
Pavimental Est Ao (in liquidation) Russia Rub 4,200,000 100.00%
Petrostal S.A. (in liquidation) Poland Pln 2,050,500 100.00%
Domino S.r.l. Italy Euro 10,000 100.00%
Gemina Fiduciary Services S.A. Luxembourg Euro 150,000 99.99%
Benetton Beograd Doo Serbia Euro 500 100.00%
Bensec S.c.ar.l. Italy Euro 110,000 78.00%

CONSOLIDATED FINANCIAL STATEMENTS AT DECEMBER 31, 2015 123
REPORT OF THE INDEPENDENT AUDITORS

124 CONSOLIDATED FINANCIAL STATEMENTS AT DECEMBER 31, 2015

125
126
CONTACTS Edizione S.r.l. Calmaggiore, 23 31100 Treviso - Italy Tel. +39 0422 5995 Fax +39 0422 412176 [email protected] www.edizione.it Tax code, VAT and Treviso Companies’ Register number 00778570267 REA CCIAA Treviso 148942 Share capital Euro 1,500,000,000.00 fully paid-in


www.edizione.it
BILA
NC
IO C
ON
SO
LIDA
TO
2015
BILANCIO CONSOLIDATO 2015