2015 analysis of impediments to fair housing choice …
TRANSCRIPT

2015 ANALYSIS OF IMPEDIMENTS TO FAIR HOUSING CHOICE FOR
THE TOWNSHIP OF ABINGTON, PA
The Township of Abington, Pennsylvania Department of Community Development 1176 Old York Road, Abington, PA 19001

Township of Abington, Pennsylvania
Analysis of Impediments to Fair Housing Choice Page 1 of 125
Table of Contents
Executive Summary ........................................................................................................ 2
I. Introduction ........................................................................................................... 11
II. Background Data .................................................................................................. 13
A. Population and Race ..................................................................................... 14
B. Households ................................................................................................... 26
C. Income and Poverty ...................................................................................... 29
D. Employment .................................................................................................. 34
E. Housing Profile .............................................................................................. 36
F. Housing Costs ............................................................................................... 39
G. Household Types .......................................................................................... 42
H. Cost Burden .................................................................................................. 46
I. Housing Problems ......................................................................................... 48
J. Disproportionately Greater Need Severe Housing Problems ........................ 50
K. Disabled Households .................................................................................... 52
III. Review/Update to Original Plan ............................................................................ 55
A. Summary of Impediments – 2012 ................................................................. 55
IV. Impediments to Fair Housing 2015 ....................................................................... 64
A. Fair Housing Complaints ............................................................................... 64
B. Public Sector ................................................................................................. 75
C. Private Sector ................................................................................................ 97
D. Community Participation ............................................................................. 110
V. Actions and Recommendations ........................................................................... 115
VI. Certification ......................................................................................................... 120
VII. Appendix ............................................................................................................. 121

Township of Abington,
Pennsylvania
Analysis of Impediments to Fair Housing Choice Page 2 of 125
Executive Summary The Township of Abington, Pennsylvania is an entitlement community under the U.S. Department of Housing and Urban Development’s (HUD) Community Development Block Grant Program (CDBG). In accordance with the Housing and Community Development Act of 1974, as amended, each entitlement community must “affirmatively further fair housing.” In order to “affirmatively further fair housing,” each entitlement community must conduct a Fair Housing Analysis which identifies any impediments to fair housing choice. The HUD Fair Housing and Equal Opportunity (FHEO) Office is now advising Federal entitlement communities to update their Analysis of Impediments (AI) to Fair Housing Choice to coincide with their Five Year Consolidated Plan, and then every five (5) years thereafter. In addition, each year the Township, as part of its Annual Action Plan, must sign certifications that the Township will affirmatively further fair housing. This means that the Township will conduct an Analysis of Impediments (AI) to Fair Housing Choice, take appropriate actions to overcome the effects of any impediments identified through the AI, and maintain records reflecting what analysis and corrective actions were taken. Under Federal Register Vol. 78, No. 139 dated Friday, July 19, 2013 Proposed Rules, HUD has proposed an improved structure and process to replace the AI. HUD proposes to provide program participants with guidance, data, and an assessment template from which the community would complete an Assessment of Fair Housing (the AFH). This assessment would then link to Consolidated Plans and Annual Action Plans in IDIS and offer communities a robust tool to affirmatively further fair housing. The proposed AFH would focus program participants’ analysis on four primary goals: improving integrated living patterns and overcoming historic patterns of segregation; reducing racial and ethnic concentrations of poverty; reducing disparities by race, color, religion, sex, familial status, national origin, or disability in access to community assets such as education, transit access, and employment, as well as exposure to environmental health hazards and other stress factors that harm a person’s quality of life; and respond to disproportionate housing needs by a protected class. HUD has not finalized the new AFH requirements as of the submission of this AI. As such, this AI will follow the old AI document requirements but will also incorporate proposed AFH goals as data allows. The Township of Abington prepared an Analysis of Impediments to Fair Housing Choice in 2012. The Township has now prepared this 2015 Analysis of Impediments to Fair Housing Choice. The analysis focuses on the status and interaction of six (6) fundamental conditions within the community:
The sale or rental of dwellings (public or private);
The provision of housing brokerage services;
The provision of financial assistance for dwellings;

Township of Abington,
Pennsylvania
Analysis of Impediments to Fair Housing Choice Page 3 of 125
Public policies and actions affecting the approval of sites and other building requirements used in the approval process for the construction of publicly assisted housing;
The administrative policies concerning community development and housing activities, which affect opportunities of minority households to select housing inside or outside areas of minority concentration; and
Where there is a determination of unlawful segregation or other housing discrimination by a court or a finding of noncompliance by HUD regarding assisted housing in a recipient’s jurisdiction, an analysis of the actions which could be taken by the recipient to remedy the discriminatory condition, including actions involving the expenditure of funds made available under 24 CFR Part 570.
The Fair Housing Act was originally passed in 1968 to protect buyers and renters from discrimination from sellers and landlords by making it unlawful to refuse the sale or rental of a property to persons included under the category of a protected class. The Fair Housing Act prohibits discrimination against persons based on their race, color, religion, sex, national origin, disability, or familial status in the sale, rental, and financing of housing.
The Township has Ordinance 2074, known as the Abington Township Human Relations Ordinance, to address actions of discrimination. The Ordinance defines discriminatory acts as follows: DISCRIMINATION: Any discriminatory act(s) taken by any person, employer, entity, employment agency, or labor organization, with respect to or involving a transaction related to employment, public accommodations or publicly offered commercial property or housing, on the basis of a person's actual or perceived race, color, age, familial status, religious creed, ancestry, sex, national origin, handicap or disability, use of guide or support animals because of blindness, deafness or physical handicap of the user or because the user is a handler or trainer of support or guide animals, or because of an individual's sexual orientation, gender identity or gender expression. The methodology employed to undertake this Analysis of Impediments included:
Research
- A review of the Township’s 2012 Analysis of Impediments to Fair Housing Choice, the Township’s Zoning Ordinance, and the Comprehensive Plan dated 2007, as well as a review of the FY 2010-
Race Color Religion Sex National Origin Disability Familial
Status

Township of Abington,
Pennsylvania
Analysis of Impediments to Fair Housing Choice Page 4 of 125
2014 Five Year Consolidated Plan, FY 2014 Annual Action Plan, and the Consolidated Annual Performance Evaluation Reports for FY 2013.
- A review of the Montgomery County Housing Authority’s Five Year and Annual PHA Plans.
- The most recent demographic data for the Township was analyzed from the U.S. Census, which included general, demographic, housing, economic, social, and disability characteristics.
- A review of the U.S. Department of Housing and Urban Development Comprehensive Housing Affordability Strategy (HUD-CHAS) data.
- A review of financial lending institutions through the Home Mortgage Disclosure Act (HMDA) database.
- A review of the area real estate and mortgage practices.
- A review of home mortgage foreclosure data.
Interviews & Meetings
- Meetings and/or interviews were conducted with the various Township Departments; the Township Manager; the Montgomery County Housing Authority; community, social service, and advocacy agencies for the disabled; housing providers; etc.
- Surveys were sent to each housing, social service, and community development agency that was invited to the roundtable discussions. Follow up phone calls were made when an organization neither returned a survey nor attended a meeting.
Analysis of Data
- Low- and moderate-income areas were identified and mapped.
- Concentrations of minority populations were identified and mapped.
- Concentrations of owner-occupied and renter-occupied housing units were identified and mapped.
- Fair housing awareness in the community was evaluated.
- Distribution by location of public and assisted housing units were analyzed and mapped.
- The location of CDBG expenditures throughout the Township were analyzed.
- The location of HOME expenditures throughout the Township were analyzed.
- The Township’s Five Year Goals and Objectives were reviewed.

Township of Abington,
Pennsylvania
Analysis of Impediments to Fair Housing Choice Page 5 of 125
Potential Impediments
- Public sector policies that may be viewed as impediments were analyzed.
- Private sector policies that may be viewed as impediments were analyzed.
- The status of previously identified impediments were analyzed.
Citizen Participation
- Electronic copies of a community development and fair housing survey were made available on the Township’s website and at www.survyemonkey.com/s/Abington2015 and www.survyemonkey.com/s/Abingtonespanol, public meetings were held, and copies were placed on public display to encourage citizen input.
- A “Draft Plan” was placed on display at the Office of Community Development, 1176 Old York Road, Abington, PA 19001 from June 8, 2015 until July 8, 2015.
- The Township developed the AI based on the input received at the public hearings, draft plan review comments, and the citizen's survey.
- The Township held a Public Hearing on the “draft” 2015 Analysis of Impediments on July 1, 2015.
The Township of Abington’s 2015 Analysis of Impediments to Fair Housing Choice has identified the following impediments, along with the goals and strategies to address those impediments.
Impediment 1: FAIR HOUSING EDUCATION AND OUTREACH – There
is a continuing need to educate persons about their rights and responsibilities under the Fair Housing Act and raise awareness, especially for low-income households, that all residents of Abington Township have a right to fair housing choice. Goal: Improve the public’s knowledge and awareness of the Fair Housing Act, and related laws, regulations, and requirements to affirmatively further fair housing in the community.
The strategies to achieve this goal include:
- 1-A: Continue to promote the Township Police Department’s “No
Place for Hate” Program in the schools and provide educational

Township of Abington,
Pennsylvania
Analysis of Impediments to Fair Housing Choice Page 6 of 125
opportunities for all persons to learn about their rights under the Fair Housing Act and the Americans With Disabilities Act.
- 1-B: Continue to make available and distribute literature and informational material concerning fair housing issues. These documents should be translated for the applicable LEP population in Abington.
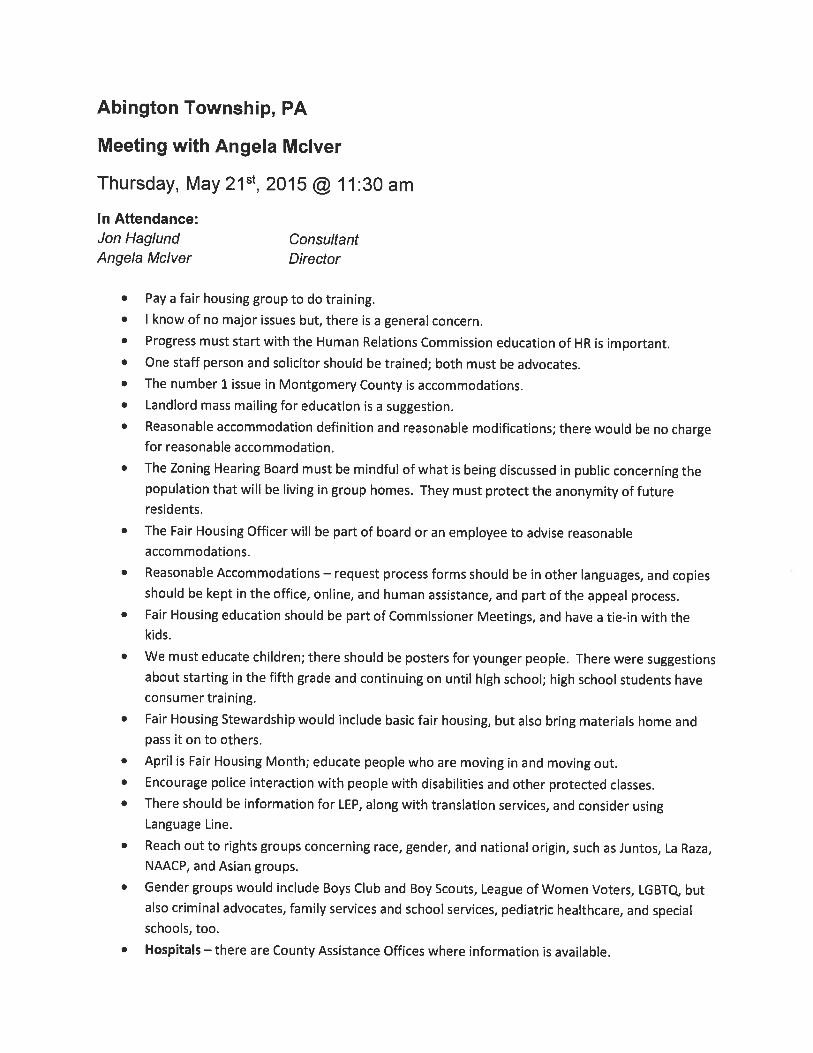
- 1-C: Support the continuing efforts of the local fair housing organizations to provide training and technical assistance to the staff of Abington Township, the local Human Relations Commission members, Township Solicitor, affordable housing providers, and other organizations that are concerned with housing and civil rights in Abington.
Impediment 2: PUBLIC POLICIES AND REGULATIONS – The Township, in conjunction with the Montgomery County Planning Department, has been working on revising its Zoning Ordinance in accordance with the latest model codes. The Township needs to continue to move forward and complete this major revision to its Zoning Ordinance to bring it into compliance with the Federal Fair Housing Act, Section 504, the Americans with Disabilities Act, etc.
Goal: Complete the work on the revisions to the Township’s Zoning Ordinance to promote and affirmatively further fair housing by revising its purposes, definitions, and land use regulations.
The strategies to achieve this goal include:
- 2-A: Review and revise the definition of "Family" in the Zoning Ordinance to permit up to six (6) disabled persons to live together as a single family unit in any residential zoning district. The Township has been administratively abiding by this, but should now include this in the wording of the Zoning Ordinance.
- 2-B: Revise the General Purpose and Intent Section of the Zoning Ordinance to reaffirm the Township’s commitment to affirmatively further fair housing.
- 2-C: Revise the Zoning Ordinance to develop a chart with the revised permitted uses, including all types of housing: i.e. group residences, community living arrangements, elderly housing, etc.
- 2-D: Review and revise all of the other definitions in the Zoning Ordinance Township’s and include new definitions for Handicapped (Disabled), Fair Housing Act, Group Home, Community Living Arrangement, Elderly Housing (Senior Citizen

Township of Abington,
Pennsylvania
Analysis of Impediments to Fair Housing Choice Page 7 of 125
Housing), Visitability, Accessibility, Americans With Disabilities Act, etc.
Impediment 3: NEED FOR AFFORDABLE RENTAL HOUSING UNITS –
The cost of rent for apartments in the Township has increased over the past ten years to the point that 52.6% of all renter households in Abington are paying more than 30% of their income on the cost of their housing, which means that these households are considered cost overburdened.
Goal: Promote and encourage the construction and development of additional affordable rental housing units in the Township, especially for households whose income is less than 80% of the median income.
The strategies to achieve this goal include:
- 3-A: Support and encourage both private developers and non-profit housing providers to develop and implement plans for the construction of new affordable mixed income rental housing that would be located throughout the Township that provide access to employment opportunities, transportation, amenities, and services throughout the Township; especially for the Elderly.
- 3-B: Assist in supporting and promoting financial assistance to households that are cost overburdened, particularly those households below 80% of the area median family income.
- 3-C: Continue to support and encourage the rehabilitation of existing housing units and the construction of upper floor housing units in mixed use buildings, as outlined in the “Old York Road Corridor Improvement Study,” to increase the supply of decent, safe and sound rental housing that is affordable to low- and moderate-income households.
Impediment 4: NEED FOR AFFORDABLE HOUSING FOR SALE – The
monthly housing cost for homeowners with a mortgage has increased to over $1,958 per month and it is estimated that 36.4% of all homeowners with a mortgage are paying more than 30% of their income on housing costs, which makes them cost overburdened, and limits the choice of housing for lower income households.
Goal: Promote and encourage the development of for-sale single family houses that are affordable to low- to moderate-income households.

Township of Abington,
Pennsylvania
Analysis of Impediments to Fair Housing Choice Page 8 of 125
The strategies to achieve this goal include:
- 4-A: Continue to support the construction and development of new for sale housing that provides affordable housing options to low- and moderate-income households outside of economically impacted areas.
- 4-B: Continue to support down-payment assistance and financing to assist low- and moderate-income homebuyers to purchase housing outside of economically impacted areas.
- 4-C: Continue to support the rehabilitation of the existing housing stock to increase the supply of decent, safe, and sound housing that is affordable to low- and moderate-income households.
- 4-D: Continue to support homebuyer education and training programs to improve homebuyer awareness and increase the opportunities of fair housing choice for lower income households to move outside impacted areas.
- 4-E: Apply to the Federal Home Loan Bank, Pennsylvania Housing Finance Agency, and State CDBG and HOME programs for funds for down payment assistance to lower income households so they can become homeowners.
Impediment 5: NEED FOR ACCESSIBLE HOUSING – There is a need for
more accessible housing that is decent, safe, and sound, as well as affordable to persons with disabilities.
Goal: Increase the number of accessible housing units that are decent, safe, and sound, as well as affordable to lower income households throughout the Township.
The strategies to achieve this goal include:
- 5-A: Increase the number of accessible housing units through rehabilitation of the existing housing stock.
- 5-B: Increase the number of accessible housing units through the development and construction of new rental and single family homes for sale.
- 5-C: Continue to enforce the ADA requirements for landlords to make “reasonable” modifications and accommodations to their rental properties, which will increase the number of accessible housing units for the disabled.

Township of Abington,
Pennsylvania
Analysis of Impediments to Fair Housing Choice Page 9 of 125
- 5-D: Provide financial assistance to homeowners to make their properties accessible in order to allow the elderly to remain in their residences.
Impediment 6: COUNTYWIDE APPROACH TO AFFIRMATIVELY
FURTHERING FAIR HOUSING – There are four (4) Federal Entitlement jurisdictions in Montgomery County: Abington, Lower Merion, Norristown, and Montgomery County. Housing, racial, and socio-economic data from the U.S. Census of 2010, as well as the location of subsidized housing illustrates that there is a disproportionate concentration of low- and moderate-income persons, minorities, and Hispanics living in impacted areas throughout Montgomery County, which demonstrates a lack of housing choice. Goal: Provide housing and economic opportunities for low- and moderate-income persons and the protected classes to live and work throughout all of Montgomery County, including outside impacted areas. The strategies to meet this goal include:
- 6-A: Establish an Affirmatively Furthering Fair Housing (AFFH) Task Force for Montgomery County with representatives from the Township of Abington, Lower Merion Township, the Municipality of Norristown, Montgomery County, U.S. Department of Housing and Urban Development (HUD), the two Fair Housing Councils, and the Montgomery County Housing Authority (MCHA).
- 6-B: The AFFH Task Force should review the mobility policies and procedures of the Montgomery County Housing Authority to encourage and support low- and moderate-income Housing Choice Voucher holders to move outside racially and economically impacted areas in Montgomery County.
- 6-C: The four (4) federal Entitlement jurisdictions: Montgomery County, Norristown, Lower Merion and Abington should coordinate and cooperate in the preparation and implementation of their individual Analysis of Impediments (A.I.) and/or prepare and adopt a joint countywide fair housing strategic plan.
- 6-D: The three (3) federal Entitlement jurisdictions should work with Montgomery County to promote and encourage the development of affordable housing throughout Montgomery County in areas that are not economically or racially impacted.
Impediment 7: SUPPORT THE HUMAN RELATIONS COMMISSION – The
Township needs to continue to support the Human Relations Commission, to
Township of Abington,
Pennsylvania
Analysis of Impediments to Fair Housing Choice Page 10 of 125
become a local coordination, outreach, investigation, and adjudication organization; fair housing choice will be promoted and encouraged. Goal: The Human Relations Commission of Abington Township will be a motivating force in affirmatively furthering fair housing in the Township and will promote fair housing choice for all protected classes of people. The strategies to achieve this goal include:
- 7-A: The local governing body of the Township will keep the appointments of members to the Human Relations Commission current and will provide the Commission with technical and clerical support.
- 7-B: Establish procedures and protocols for how fair housing complaints are to be reported, monitored, and mediated, as well as training for Commission members and the Township Solicitor.
- 7-C: Advertise to the community, including the Township’s website, the existence of the Human Relations Commission, its mission, and how to report fair housing complaints.
- 7-D: Promote seminars and educational programs for the community in cooperation with local fair housing organizations to increase the knowledge base of all residents, owners, renters, and landlords, concerning their rights under the Fair Housing Act, as well as the Americans with Disabilities Act.

Township of Abington,
Pennsylvania
Analysis of Impediments to Fair Housing Choice Page 11 of 125
I. Introduction
The Township of Abington is an entitlement community under the U.S. Department of Housing and Urban Development’s (HUD’s) Community Development Block Grant Program (CDBG). In accordance with the Housing and Community Development Act of 1974, as amended, each entitlement community must “affirmatively further fair housing.” In order to demonstrate that the entitlement community is “affirmatively furthering fair housing” the community must conduct an Analysis of Impediments to Fair Housing Choice which identifies any impediments to fair housing choice and what steps it will take to affirmatively further fair housing. The HUD Fair Housing and Equal Opportunity (FHEO) Office is now advising Federal entitlement communities to update their Analysis of Impediments to Fair Housing Choice to coincide with the Five Year Consolidated Plan, and then every five (5) years thereafter. HUD defines “fair housing choice” as:
The Fair Housing Analysis consists of the following six (6) conditions:
The sale or rental of dwellings (public or private);
The provision of housing brokerage services;
The provision of financial assistance for dwellings;
Public policies and actions affecting the approval of sites and other building requirements used in the approval process for the construction of publicly assisted housing;
The administrative policies concerning community development and housing activities, which affect opportunities of minority households to select housing inside or outside areas of minority concentration; and
Where there is a determination of unlawful segregation or other housing discrimination by a court or a finding of noncompliance by HUD regarding assisted housing in a recipient’s jurisdiction, an analysis of the actions which could be taken by the recipient to remedy the discriminatory condition, including actions involving the expenditure of funds made available under 24 CFR Part 570.
HUD-FHEO suggests that communities conducting an AI consider the policies surrounding “visitability,” the Section 504 Rehabilitation Act, the Americans with
“The ability of persons, regardless of race, color, religion, sex, national origin, familial status, or handicap, of similar income levels to have available to them the same housing choices.”

Township of Abington,
Pennsylvania
Analysis of Impediments to Fair Housing Choice Page 12 of 125
Disabilities Act, and the Fair Housing Act. Housing that is “visitable” has the most basic level of accessibility that enables persons with disabilities to visit the home of a friend, family member, or neighbor. “Visitable” housing has at least one accessible means of ingress/egress, and all interior and bathroom doorways have as a minimum a 32-inch clear opening. Section 504 of the Rehabilitation Act (24 CFR Part 8), known as “Section 504” prohibits discrimination against persons with disabilities in any program receiving Federal funds. The Americans with Disabilities Act (42 U.S.C. 12131; 47 U.S.C. 155, 201, 218, and 225) (ADA) prohibits discrimination against persons with disabilities in all programs and activities sponsored by state and local governments. The Fair Housing Act requires property owners to make reasonable modifications to units and/or public areas in order to allow a disabled tenant to make full use of the unit. Additionally, property owners are required to make reasonable accommodations to rules or procedures to afford a disabled tenant full use of the unit. In regard to local zoning ordinances, the Fair Housing Act prohibits local government from making zoning or land use decisions, or implementing land use policies that exclude or discriminate against persons of a protected class. The Township of Abington previously prepared an Analysis of Impediments to Fair Housing Choice in 2012. This Analysis of Impediments to Fair Housing Choice will outline progress that has been made since the previous Analysis of Impediments, explore the continuation of these impediments where necessary, and identify any new impediments to fair housing choice. Furthermore, this Analysis of Impediments will bring the Township into sequence with the FY 2015-2019 Five Year Consolidated Plan. The document is designed to act as a planning tool, providing the Township with the necessary framework to strategically reduce any identified impediments to fair housing choice over the next five (5) years, and continue to make modifications based on events and activities in the community during this time period. In order to affirmatively further fair housing in the Township of Abington, the Township must look beyond its boundaries and coordinate fair housing with Montgomery County and the surrounding region. Fair housing choice is the goal of the AI and the opportunity should be made available to all low-income residents and the members of the protected classes to live anywhere in the surrounding region.

Township of Abington,
Pennsylvania
Analysis of Impediments to Fair Housing Choice Page 13 of 125
II. Background Data
In order to perform an analysis of fair housing in the Township of Abington, the demographic, housing, economic, and social characteristics of the Township were evaluated as a basis for determining and identifying if there are any existing impediments to fair housing choice. Abington Township is located in Montgomery County, a suburban county, situated on the northwest border of Philadelphia County in the Commonwealth of Pennsylvania. Abington is one of the oldest communities in Montgomery County with early settlers living in the area prior to 1700. The Township consists of 15.5 square miles and it is estimated that 98% of the area has been developed. The area that comprises the Township was originally purchased by William Penn from the Lenape, also known as the Delaware Indians, in the 1680’s. The Township was later incorporated in 1704. The Township is rich in history and has endeavored to preserve the areas past by protecting important historical landmarks and institutions such as Alverthorpe Manor and Briar Bush Nature Center. The Abington Township High School is listed on the National Register of Historic Places. The Abington School District is remembered for its historical contribution to the “prayer in school debate” with the Abington School District v. Schempp (1963) United States Supreme Court decision that declared school-sponsored Bible reading in public schools in the United States to be unconstitutional. The Township has been featured on the “100 Best Places to Live” by CNN Money Magazine, receiving the designation in 2008 and 2010, which was based on job growth, home affordability, safety, school quality, health care, arts and leisure, diversity, and several ease-of-living criteria (Source: money.cnn.com/magazines). The Township was also named one of the “100 Best Communities for Young People” by America’s Promise Alliance, a partnership founded by Colin and Alma Powell to improve the lives of young people and to put an end to the high school drop-out crisis run (Source: www.americaspromise.org); the Township is a six time recipient of this designation. Additionally, the Abington School District has received national recognition for its efforts to reduce crime, involve students in civic engagement and community service, and for its achievements in narrowing the education performance gap for minority, special education, and economically disadvantaged students. According to Abington Township's 2013 Comprehensive Annual Financial Report, the two top employers are the Abington Memorial Hospital and the Holy Redeemer Health System, employing 4,053 and 2,062 people respectively. With roughly 30,000 Abington residents over the age of 16 in the workforce according to the 2010 Census, the health care field accounts for about 27% of the Township’s economy.
Township of Abington,
Pennsylvania
Analysis of Impediments to Fair Housing Choice Page 14 of 125
Abington Township is governed by a Board of Commissioners, each of whom is elected from one of the township’s fifteen wards. With no elected mayor, the President of the Board of Commissioners serves as the head of government for the Township. The Township is administrated by a Township Manager who is hired by the Board of Commissioners. Montgomery County has a population of 799,874 people as of the 2010 U.S. Census and is the third most populous county in Pennsylvania after Philadelphia and Allegheny counties. In order to better understand the Township of Abington, data from the 2000 and 2010 U.S. Census was used, as well as the 2007-2011 American Community Survey, which offers recent estimates of general demographics for Abington. This Census data, along with other databases such as the CHAS Data, have been used to evaluate the Township of Abington’s demographic and socio-economic characteristics, and other conditions affecting fair housing choice. Appendix A of this report contains complete U.S. Census data and Appendix B includes full-page maps of the U.S. Census data that is summarized and illustrated in the following sections. A. Population and Race:
Population -
The total population for the Township of Abington at the time of the 2010 Census was 55,310, and the 2011 estimate was 55,429. In the 2000 Census, the population was 56,103, and at the time of the 1990 Census, the Township of Abington had a population of 56,322. This illustrates a slight population decline.
The U.S. Census Bureau has used the population at the time of the 2010 Census to make annual estimates as to the change in population. The Township’s population decreased by an estimated 893 people between 1990 and 2011, or 1.6%.

Township of Abington,
Pennsylvania
Analysis of Impediments to Fair Housing Choice Page 15 of 125
Population Decline in the Township of Abington, PA
Source: U.S. Census
Race and Hispanic or Latino Population -
The table below illustrates that “White alone” is the largest racial cohort in Abington, although it has decreased in size from 84.12% in 2000 to 77.80% in 2010. “Black or African American alone” remains the largest minority cohort, and has increased from 10.82% in 2000, to 12.11% in 2010. The Hispanic and Asian populations have also slightly increased in the past decade, from 1.57% and 3.27% in 2000, to 3.20% and 4.82%, respectively, in 2010.
Race and Hispanic or Latino Population in the Township of Abington, PA
Race and Hispanic or Latino
2000 U.S. Census 2010 U.S. Census
# % # %
Total 56,103 100.00% 55,429 100.00%
One race 55,465 98.86% 54,019 97.46%
White alone 47,194 84.12% 43,122 77.80%
Black or African American alone
6,072 10.82% 6,711 12.11%
American Indian and Alaska Native alone
51 0.09% 40 0.07%
Asian alone 1832 3.27% 2,673 4.82%
0
10,000
20,000
30,000
40,000
50,000
60,000
70,000
1970 1980 1990 2000 2010

Township of Abington,
Pennsylvania
Analysis of Impediments to Fair Housing Choice Page 16 of 125
Native Hawaiian and Other Pacific Islander alone
28 0.05% 7 0.01%
Some other race alone 288 0.51% 87 0.16%
Two or More Races 638 1.14% 899 1.62%
Hispanic or Latino 883 1.57% 1,771 3.20%
Source: 2000 U.S. Census & 2010 U.S. Census The table below outlines comparisons of minority populations in each Census Tract in the Township at the time of the 2000 and 2010 U.S. Census Reports. Concentrations of Minority Residents from 2000 and 2010
Census Tract
2000 Census 2010 Census
Total Population
Minority Population
% Minority Population
Total Population
Minority Population
% Minority Population
2015.01 3,462 291 8.41% 3,294 377 11.45%
2015.02 1,843 80 4.34% 1,846 141 7.64%
2016.03 4,663 2,143 45.96% 4,659 2,241 48.10%
2016.04 3,339 1,061 31.78% 3,384 1,035 30.59%
2016.05 3,086 467 15.13% 3,108 707 22.75%
2016.06 2,589 966 37.31% 2,356 953 40.45%
2016.07 3,600 422 11.72% 3,473 708 20.39%
2016.08 4,580 382 8.34% 4,696 605 12.88%
2017.03 3,127 142 4.54% 3,106 473 15.23%
2017.04 3,434 557 16.22% 3,065 507 16.54%
2017.05 4,538 329 7.25% 4,319 544 12.60%
2017.06 4,361 645 14.79% 4,424 727 16.43%
2018 3,127 189 6.04% 2,683 332 12.37%
2019.01 4,546 220 4.84% 4,581 232 5.06%
2019.02 5,808 1,015 17.48% 6,425 2,070 32.22%
Census Tract Totals
56,103 8,909 15.88% 55,419 11,652 21.03%
Source: 2000 and 2010 U.S. Census
Township of Abington,
Pennsylvania
Analysis of Impediments to Fair Housing Choice Page 17 of 125
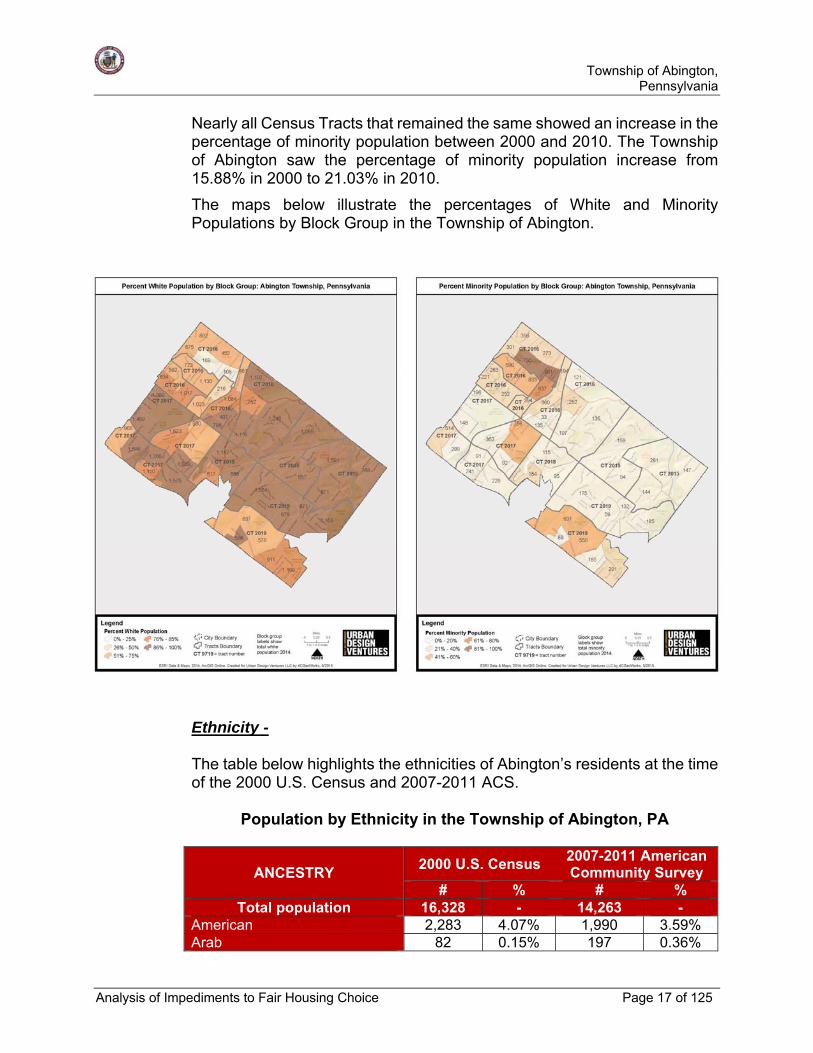
Nearly all Census Tracts that remained the same showed an increase in the percentage of minority population between 2000 and 2010. The Township of Abington saw the percentage of minority population increase from 15.88% in 2000 to 21.03% in 2010.
The maps below illustrate the percentages of White and Minority Populations by Block Group in the Township of Abington.
Ethnicity - The table below highlights the ethnicities of Abington’s residents at the time of the 2000 U.S. Census and 2007-2011 ACS.
Population by Ethnicity in the Township of Abington, PA
ANCESTRY 2000 U.S. Census
2007-2011 American Community Survey
# % # % Total population 16,328 - 14,263 -
American 2,283 4.07% 1,990 3.59% Arab 82 0.15% 197 0.36%

Township of Abington,
Pennsylvania
Analysis of Impediments to Fair Housing Choice Page 18 of 125
Czech 104 0.19% 147 0.27% Danish 96 0.17% 52 0.09% Dutch 514 0.92% 448 0.81% English 5,538 9.87% 4,867 8.78% French (except Basque) 762 1.36% 1,082 1.95% French Canadian 182 0.32% 129 0.23% German 12,077 21.53% 12,675 22.87% Greek 186 0.33% 260 0.47% Hungarian 674 1.20% 422 0.76% Irish 14,558 25.95% 14,410 26.00% Italian 7,233 12.89% 7,697 13.89% Lithuanian 477 0.85% 315 0.57% Norwegian 236 0.42% 186 0.34% Polish 2,809 5.01% 4,091 7.38% Portuguese 111 0.20% 264 0.48% Russian 2,409 4.29% 2,308 4.16% Scotch-Irish 988 1.76% 1,036 1.87% Scottish 1,141 2.03% 913 1.65% Slovak 211 0.38% 236 0.43% Sub-Saharan African 166 0.30% 310 0.56% Swedish 328 0.58% 583 1.05% Swiss 165 0.29% 176 0.32% Ukrainian 742 1.32% 912 1.65% Welsh 736 1.31% 481 0.87% West Indian (excluding Hispanic origin groups)
374 0.67% 752 1.36%
Other ancestries 11887 21.19% - - Source: 2000 U.S. Census and 2007-2011 American Community Survey
The largest ethnicities in Abington include German, Irish, and Italian. Between 2000 and 2011, Abington experienced a very slight increase in the percentage of residents identifying themselves as Arab, Czech, French, German, Greek, Irish, Italian, Polish, Portuguese, Scotch-Irish, Slovak, Sub-Saharan African, Swedish, Swiss, Ukrainian, and West Indian. Many of the other ethnicities experienced slight fluctuations between 2000 and 2011. The 2007-2011 American Community Survey did not include “Other Ancestries” as an option, so this may account for an increase in some of the other categories in the event that survey participants selected an ancestry that most closely described their actual ancestry. Title VI of the Civil Rights Act of 1964 is the federal law that protects individuals from discrimination on the basis of their race, color, or national origin in programs that receive federal financial assistance. In certain situations, failure to ensure that persons who have Limited English Proficiency (LEP) can effectively participate in, or benefit from, federally assisted programs, may violate Title VI's prohibition against national origin discrimination.

Township of Abington,
Pennsylvania
Analysis of Impediments to Fair Housing Choice Page 19 of 125
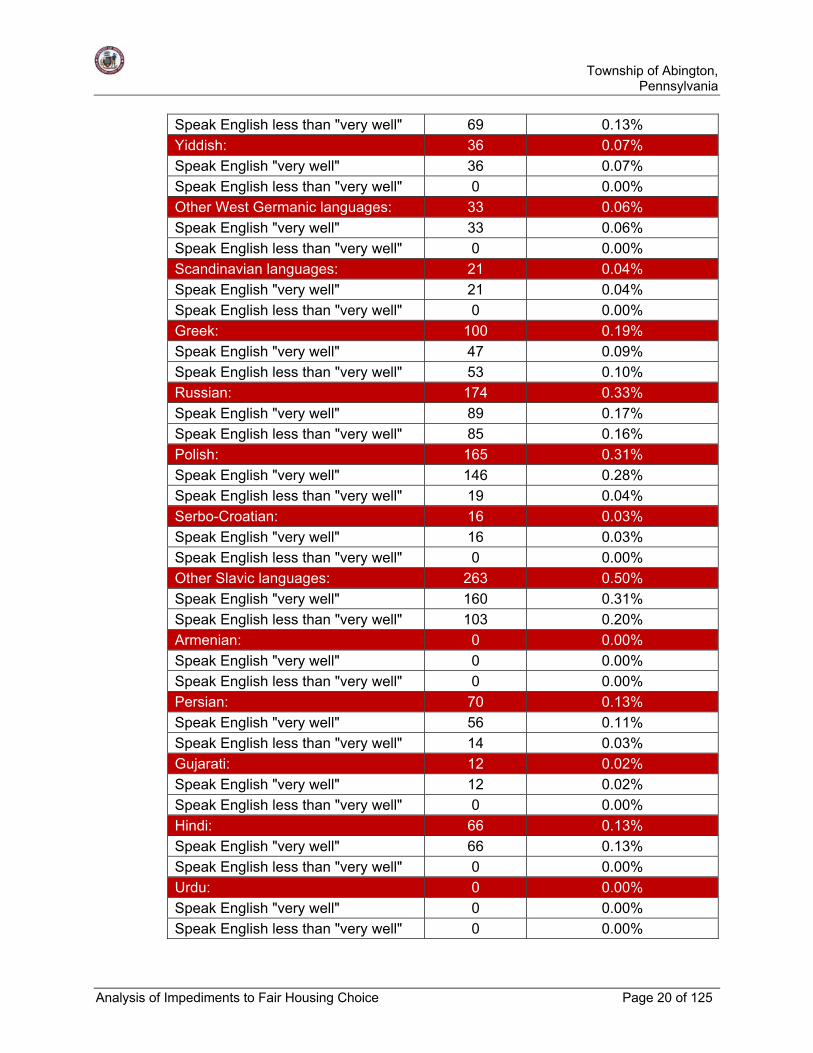
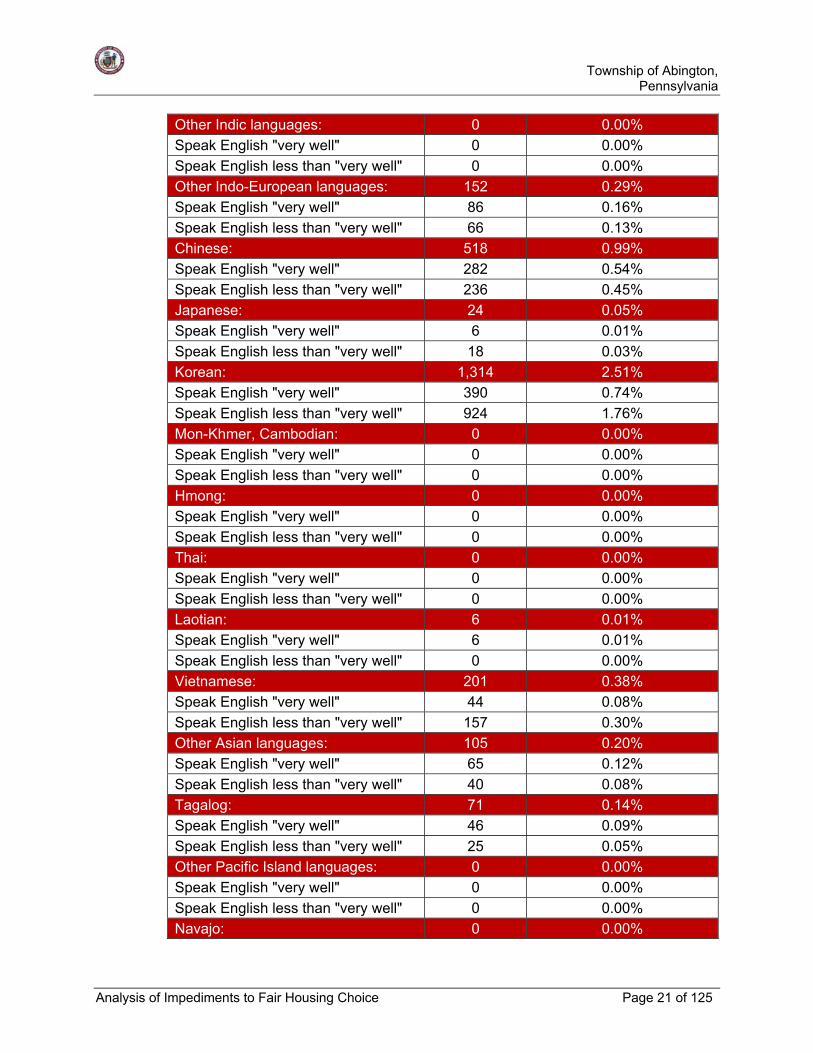
Limited English Proficiency means persons who, as a result of their national origin, do not speak English as their primary language and who have a limited ability to speak, read, write, or understand English. Based on Title VI and LEP Guidance, persons may be entitled to language assistance with respect to a particular service, benefit, or encounter. According to the 2007-2011 American Community Survey, 10.94% of Township residents speak a language other than English at home. Of those residents, 4.64% report that they speak English less than “very well;” The top three populations of the Township that speaks English less than “very well” are: 924 Korean speakers (1.76%), 322 Spanish speakers (0.61%), and 236 Chinese speakers (0.45%). The Township will utilize interpretation services, referrals to community liaisons proficient in the language of LEP persons, and HUD translated documents found at www.hud.gov/offices/fheo/lep.xml for any LEP persons that the CDBG program will come into contact with.
Language Spoken at Home in the Township of Abington, PA
Abington Township, Montgomery County, PA
Estimate Percent
Total: 52,443 100%
Speak only English 46,705 89.06%
Spanish or Spanish Creole: 1,136 2.17%
Speak English "very well" 814 1.55%
Speak English less than "very well" 322 0.61%
French (incl. Patois, Cajun): 119 0.23%
Speak English "very well" 109 0.21%
Speak English less than "very well" 10 0.02%
French Creole: 155 0.30%
Speak English "very well" 104 0.20%
Speak English less than "very well" 51 0.10%
Italian: 348 0.66%
Speak English "very well" 229 0.44%
Speak English less than "very well" 119 0.23%
Portuguese or Portuguese Creole: 130 0.25%
Speak English "very well" 68 0.13%
Speak English less than "very well" 62 0.12%
German: 227 0.43%
Speak English "very well" 158 0.30%
Township of Abington,
Pennsylvania
Analysis of Impediments to Fair Housing Choice Page 20 of 125
Speak English less than "very well" 69 0.13%
Yiddish: 36 0.07%
Speak English "very well" 36 0.07%
Speak English less than "very well" 0 0.00%
Other West Germanic languages: 33 0.06%
Speak English "very well" 33 0.06%
Speak English less than "very well" 0 0.00%
Scandinavian languages: 21 0.04%
Speak English "very well" 21 0.04%
Speak English less than "very well" 0 0.00%
Greek: 100 0.19%
Speak English "very well" 47 0.09%
Speak English less than "very well" 53 0.10%
Russian: 174 0.33%
Speak English "very well" 89 0.17%
Speak English less than "very well" 85 0.16%
Polish: 165 0.31%
Speak English "very well" 146 0.28%
Speak English less than "very well" 19 0.04%
Serbo-Croatian: 16 0.03%
Speak English "very well" 16 0.03%
Speak English less than "very well" 0 0.00%
Other Slavic languages: 263 0.50%
Speak English "very well" 160 0.31%
Speak English less than "very well" 103 0.20%
Armenian: 0 0.00%
Speak English "very well" 0 0.00%
Speak English less than "very well" 0 0.00%
Persian: 70 0.13%
Speak English "very well" 56 0.11%
Speak English less than "very well" 14 0.03%
Gujarati: 12 0.02%
Speak English "very well" 12 0.02%
Speak English less than "very well" 0 0.00%
Hindi: 66 0.13%
Speak English "very well" 66 0.13%
Speak English less than "very well" 0 0.00%
Urdu: 0 0.00%
Speak English "very well" 0 0.00%
Speak English less than "very well" 0 0.00%
Township of Abington,
Pennsylvania
Analysis of Impediments to Fair Housing Choice Page 21 of 125
Other Indic languages: 0 0.00%
Speak English "very well" 0 0.00%
Speak English less than "very well" 0 0.00%
Other Indo-European languages: 152 0.29%
Speak English "very well" 86 0.16%
Speak English less than "very well" 66 0.13%
Chinese: 518 0.99%
Speak English "very well" 282 0.54%
Speak English less than "very well" 236 0.45%
Japanese: 24 0.05%
Speak English "very well" 6 0.01%
Speak English less than "very well" 18 0.03%
Korean: 1,314 2.51%
Speak English "very well" 390 0.74%
Speak English less than "very well" 924 1.76%
Mon-Khmer, Cambodian: 0 0.00%
Speak English "very well" 0 0.00%
Speak English less than "very well" 0 0.00%
Hmong: 0 0.00%
Speak English "very well" 0 0.00%
Speak English less than "very well" 0 0.00%
Thai: 0 0.00%
Speak English "very well" 0 0.00%
Speak English less than "very well" 0 0.00%
Laotian: 6 0.01%
Speak English "very well" 6 0.01%
Speak English less than "very well" 0 0.00%
Vietnamese: 201 0.38%
Speak English "very well" 44 0.08%
Speak English less than "very well" 157 0.30%
Other Asian languages: 105 0.20%
Speak English "very well" 65 0.12%
Speak English less than "very well" 40 0.08%
Tagalog: 71 0.14%
Speak English "very well" 46 0.09%
Speak English less than "very well" 25 0.05%
Other Pacific Island languages: 0 0.00%
Speak English "very well" 0 0.00%
Speak English less than "very well" 0 0.00%
Navajo: 0 0.00%

Township of Abington,
Pennsylvania
Analysis of Impediments to Fair Housing Choice Page 22 of 125
Speak English "very well" 0 0.00%
Speak English less than "very well" 0 0.00% Other Native North American languages:
0 0.00%
Speak English "very well" 0 0.00%
Speak English less than "very well" 0 0.00%
Hungarian: 46 0.09%
Speak English "very well" 24 0.05%
Speak English less than "very well" 22 0.04%
Arabic: 30 0.06%
Speak English "very well" 30 0.06%
Speak English less than "very well" 0 0.00%
Hebrew: 63 0.12%
Speak English "very well" 41 0.08%
Speak English less than "very well" 22 0.04%
African languages: 126 0.24%
Speak English "very well" 126 0.24%
Speak English less than "very well" 0 0.00%
Other and unspecified languages: 11 0.02%
Speak English "very well" 0 0.00%
Speak English less than "very well" 11 0.02% Source: 2007-2011 American Community Survey
Age -
The chart below illustrates age distribution within the Township of Abington for 2010. Children under five years of age represent 5.63% of the population; 24.42% of the Township’s population was under 20 years of age; and 17.52% were 65 years of age or older.

Township of Abington,
Pennsylvania
Analysis of Impediments to Fair Housing Choice Page 23 of 125
Age of Population in the Township of Abington, PA
Source: 2010 U.S. Census Data
The median age in the Township of Abington at the time of the 2010 U.S. Census was 42.8 years. The median age in Montgomery County is slightly lower at 40.6 years, and the median age in the Commonwealth of Pennsylvania is similar at 40.1 years.
5.63%5.98%
6.28%6.53%
5.24%5.41%5.51%5.56%
6.76%7.90%
8.50%7.49%
5.69%4.37%
3.38%3.06%3.14%
2.19%1.38%
0.00% 1.00% 2.00% 3.00% 4.00% 5.00% 6.00% 7.00% 8.00% 9.00%
Under 5 years
10 to 14 years
20 to 24 years
30 to 34 years
40 to 44 years
50 to 54 years
60 to 64 years
70 to 74 years
80 to 84 years
90 years and over

Township of Abington,
Pennsylvania
Analysis of Impediments to Fair Housing Choice Page 24 of 125
The map below illustrates the percentage of the Population Age 65 and Over by Block Groups in the Township of Abington.
Religion -
The U.S. Census does not collect data on the religious affiliations of the population in the United States. In an effort to better understand the religious affiliations of the residents of Abington, the Township used the data made available by The Association of Religion Data Archives (ARDA). ARDA surveys the congregation members, their children, and other people

Township of Abington,
Pennsylvania
Analysis of Impediments to Fair Housing Choice Page 25 of 125
who regularly attend church services within counties across the country. Although this data appears to be the most comprehensive data that is available, it is unfortunately not entirely complete as it does not accurately include traditional African American denominations nor does it include non-Christian religions. The total number of regular attendees was adjusted in 2010 (the most recent year for which data is available) to represent the population including historic African American denominations. However, the total value cannot be disaggregated to determine the distribution across denominational groups. The table below shows the distribution of residents of Montgomery County across various Christian denominational groups, as a percentage of the population which reported affiliation with a church.
Religious Affiliation in Montgomery County
1980 1990 2000 2010
# % # % # % # % Evangelical Protestant
19,709 4.95% 32842 7.28% 29,566 6.16% 54,215 10.66%
Black Protestant
0 0.00% 62 0.01% 0 0.00% 3,190 0.63%
Mainline Protestant
153,849 38.60% 136205 30.20% 122,417 25.50% 103,475 20.35%
Catholic 209,341 52.53% 235352 52.18% 263,375 54.86% 301,220 59.23%
Orthodox 0 0.00% 0 0.00% 3,727 0.78% 2,945 0.58%
Other 15636 3.92% 46538 10.32% 61015 12.71% 43532 8.56%
Total Adherents:
398,535 61.92% 450,999 66.51% 480,100 64.01% 508,577 63.58%
Unclaimed (% of total population)
245,086 38.08% 227,112 33.49% 269,997 35.99% 291,297 36.42%
Total Population:
643,621 100.00% 678,111 100.00% 750,097 100.00% 799,874 100.00%
Source: The Association of Religious Data Archives; http://www.thearda.com/ Between 1980 and 2010, Montgomery County experienced a decrease in people identifying themselves as “Mainline Protestants,” while there was an overall increase in the portion of the religious population identifying itself as “Evangelical Protestants,” and identifying as Catholic. Between 1980 and 2010, Montgomery County saw an overall increase in the number of people identifying with religious traditions. The percentage of total adherents increased between 1980 and 1990, but then experienced a slight decline in 2000 and 2010.

Township of Abington,
Pennsylvania
Analysis of Impediments to Fair Housing Choice Page 26 of 125
B. Households:
According to the U.S. Census for 2010, there were 22,369 housing units in the Township of Abington. This is a very slight increase compared to the 2000 Census, when there were 22,367 households in the Township of Abington. Of the households in 2010, 78.2% were owners and 21.8% were renters, whereas in 2000, 79.3% were owner-occupied and 20.7% were renter-occupied. This shows that there was a slight decrease in homeownership in the past decade. However, the 2007-2011 American Community Survey shows an increase in homeownership to 78.5% The 2007-2011 ACS data shows that the average size of the owner-occupied households was 2.75 persons and the average renter household was 1.89 persons. The chart below illustrates household size breakdown for owner and renter households.
Occupancy by Tenure in the Township of Abington, PA
Source: 2010 U.S. Census
0
1,000
2,000
3,000
4,000
5,000
6,000
7,000
Owner occupied: Renter occupied:

Township of Abington,
Pennsylvania
Analysis of Impediments to Fair Housing Choice Page 27 of 125
The maps below illustrate the percentages of Owner and Renter-Occupied Housing Units by Block Group in the Township of Abington.
The table below compares homeowners and renters by race, according to the 2000 and 2010 Census. This table shows that “White” households represent the largest percentage of homeownership (70.0%) with “Black or African American” households comprising (7.4%) of total homeowners.
Household Tenure by Race in Abington
Cohort 2000 U.S. Census 2010 U.S. Census
Owner (79.3%)
Renter (37.2%)
Owner (78.2%)
Renter (21.8%)
Householder who is White alone
70.0% 16.2% 66.8% 15.7%
Householder who is Black or African American alone
7.4% 2.5% 8.1% 3.7%

Township of Abington,
Pennsylvania
Analysis of Impediments to Fair Housing Choice Page 28 of 125
Householder who is American Indian and Alaska Native alone
0.0% 0.0% 0.0% 0.0%
Householder who is Asian alone
1.4% 1.2% 2.2% 1.8%
Householder who is Native Hawaiian and Other Pacific Islander alone
0.0% 0.0% 0.0% 0.0%
Householder who is some other race alone
0.1% 0.3% 0.3% 0.2%
Householder who is two or more races
0.3% 0.4% 0.7% 0.3%
Householder who is Hispanic or Latino
0.8% 0.6% 1.4% 0.7%
Source: 2000 & 2010 U.S. Census
Families comprised 69.2% of households in the Township; 30.3% of households included families with their own children less than 18 years of age. More than ten percent (10.5%) of families were female-headed households, with no husband present. The chart below illustrates households by type in Abington.
Households by Type in the Township of Abington, PA
Source: 2007-2011 American Community Survey
Married-Couple Family, 55.6%Female
householder, no husband
present, 10.5%
Nonfamily households,
30.8%
Male householder, no wife present,
3.1%

Township of Abington,
Pennsylvania
Analysis of Impediments to Fair Housing Choice Page 29 of 125
C. Income and Poverty:
The 2000 Census reported that the per capita income for the Township of Abington was $30,331. The median household income for the Township was $59,921, compared to $60,829 for Montgomery County and $40,106 for the Commonwealth of Pennsylvania. The 2007-2011 American Community Survey reported that the per capita income for the Township in 2011 was $39,753. The median household income for Abington was $77,928, compared to $78,446 for Montgomery County, and $51,651 for the Commonwealth of Pennsylvania. The median income of the area increased by 30.1% over the time period. This increase in median income represents a change in nominal dollars and not a change in real dollars. To calculate the change in real dollars, the Consumer Price Index is used to calculate the inflation rate for a given period. Between 2000 and 2011, the cumulative inflation rate was 30.6%, meaning that the $59,921 median income in 2000 would be $77,957 if it were expressed in 2011 dollars. By taking into consideration the rate of inflation, the median income in Abington has increased at a rate similar to the rate of inflation. The table below illustrates household income trends.
Household Income in the Township of Abington, PA
2000 U.S. Census 2007-2011 American Community Survey
Items Number of
Households Percentage
Number of Households
Percentage
Total Households 21,707 100.0% 21,287 100.0% Less than $10,000 839 3.9% 830 3.9% $10,000 to $14,999 912 4.2% 1,681 3.1% $15,000 to $24,999 1,803 8.3% 1,681 7.9% $25,000 to $34,999 1,997 9.2% 1,456 6.8% $35,000 to $49,999 3,183 14.7% 2,004 9.4% $50,000 to $74,999 4,913 22.6% 3,752 17.6% $75,000 to $99,999 3,321 15.3% 3,181 14.9% $100,000 to $149,999 2,771 12.8% 4,119 19.3% $150,000 to $199,999 826 3.8% 1,177 8.3% $200,000 or more 1,142 5.3% 1,833 8.6% Median Household Income ($) 59,921 (X) 77,928 (X)
Source: 2000 U.S. Census and 2007-2011 American Community Survey
The following table identifies the Section 8 Income Limits in Montgomery County based on household size for 2015. The Median Family Household

Township of Abington,
Pennsylvania
Analysis of Impediments to Fair Housing Choice Page 30 of 125
Income for a family of four living in Montgomery County was $81,100 in 2015.
Section 8 Income Limits for 2015
Income Category
1 Person
2 Person
3 Person
4 Person
5 Person
6 Person
7 Person
8 Person
Extremely Low (30%) Income Limits
17,050 19,500 21,950 24,350 28,410 32,570 36,730 40,890
Very Low (50%) Income Limits
28,400 32,450 36,500 40,550 43,800 47,050 50,300 53,550
Low (80%) Income Limits
45,450 51,950 58,450 64,900 70,100 75,300 80,500 85,700
Source: Hud.gov The table below highlights the low- and moderate-income population in the Township of Abington. The Township of Abington has an overall low- and moderate-income percentage of 26.21%. The low- and moderate-income statistics are based on the 2006 – 2010 American Community Survey were obtained from the U.S. Department of Housing and Urban Development’s website, www.hud.gov. The Census Tracts and Block Groups (highlighted and bold) that qualify as low- and moderate-income are based on the Upper Quartile Exception Criteria established by HUD. The upper quartile cutoff for the Township’s low/mod population is 34.73%. This is based on 12 block groups out of 47 block groups with the greatest percentage of low/mod income persons.
Low- and Moderate-Income in the Township of Abington, PA
TRACT BLKGRP LOWMOD LOWMODUNIV LOWMODPCT
201501 1 180 960 18.75%
201501 2 195 850 22.94%
201501 3 630 1,265 49.80%
201502 1 125 685 18.25%
201502 2 155 1,130 13.72%
201603 1 170 1,135 14.98%
201603 2 225 600 37.50%
201603 3 545 935 58.29%
201603 4 150 745 20.13%
201603 5 105 1,240 8.47%

Township of Abington,
Pennsylvania
Analysis of Impediments to Fair Housing Choice Page 31 of 125
201604 1 565 1,400 40.36%
201604 2 370 1,985 18.64%
201605 1 265 1,115 23.77%
201605 2 345 1,145 30.13%
201605 3 210 690 30.43%
201606 1 630 880 71.59%
201606 2 445 1,475 30.17%
201607 1 165 855 19.30%
201607 2 140 1,275 10.98%
201607 3 50 325 15.38%
201607 4 200 960 20.83%
201608 1 240 1,345 17.84%
201608 2 180 1,040 17.31%
201608 3 215 1,435 14.98%
201608 4 350 875 40.00%
201703 1 320 1,690 18.93%
201703 2 315 1,420 22.18%
201704 1 380 1,650 23.03%
201704 2 535 1,415 37.81%
201705 1 400 1,525 26.23%
201705 2 310 1,520 20.39%
201705 3 500 1,275 39.22%
201706 1 455 1,310 34.73%
201706 2 20 980 2.04%
201706 3 550 2,135 25.76%
201800 1 95 680 13.97%
201800 2 190 620 30.65%
201800 3 635 1,310 48.47%
201901 1 150 565 26.55%
201901 2 335 1,095 30.59%
201901 3 255 1,865 13.67%
201901 4 350 980 35.71%
201902 1 265 1,270 20.87%
201902 2 390 1,280 30.47%
201902 3 115 915 12.57%
201902 4 65 900 7.22%
201902 5 795 1,720 46.22% Township of
Abington Total: 14,275 54,465 26.21%
Source: Hud.gov

Township of Abington,
Pennsylvania
Analysis of Impediments to Fair Housing Choice Page 32 of 125
Just over five percent (5.5%) of the population in the Township of Abington was living below the poverty level in 2011, according to the 2007-2011 American Community Survey. In comparison, 5.7% of the population in Montgomery County and 12.6% of the population in Pennsylvania were living below the poverty level. Additionally, 3.2% of all families in the Township of Abington were living under the poverty level, while just 3.7% of families were living in such conditions in Montgomery County and 8.8% of families from the Commonwealth of Pennsylvania.
The map below illustrates the percentages of Low-Income Population by Block Group in the Township of Abington.

Township of Abington,
Pennsylvania
Analysis of Impediments to Fair Housing Choice Page 33 of 125
The Township’s poverty statistics for families with children are significant, particularly for single mothers. The chart below illustrates the poverty statistics for families living in the Township of Abington. At the time of the 2007-2011 American Community Survey, the percentage of some families with children living below the poverty level was as follows:
Families with related children under the age of 18 was 4.1%.
Families with related children under the age of 5 was 2.2%.
Female-headed families with related children under the age of 18 was 11.8%
Female-headed families with related children under the age of 5 was 5.9%
Families in Poverty in the Township of Abington, PA
The Township of Abington does not have any Census Tracts or Block Groups that qualify as racially/ethnically-concentrated areas of poverty (RCAP/ECAPs). RCAP/ECAPs are defined by HUD as an area that has a non-white population of 50% or more and extreme poverty (Census Tracts with 40% or more of individuals living at or below the poverty line or is three times the average tract poverty rate for the area, whichever threshold is lower). There are not any Census Tracts that have a non-white population over 50%, nor are there any Census Tracts that have a poverty rate over 40% or three times the area average (approximately 5%).
0.00%
5.00%
10.00%
15.00%
20.00%
25.00%
All Families With relatedchildren under
18 years
With relatedchildren under
5 years
Families withfemale
householder,no husband
present
Femalehouseholder,with related
children under18 years
Femalehouseholder,with related
children under5 years
2000 Census 2007-2011 American Community Survey

Township of Abington,
Pennsylvania
Analysis of Impediments to Fair Housing Choice Page 34 of 125
Referring to the LMI concentration map, there are significant areas of overlap in the Township where economic and service centers are located that represent areas of opportunity. There are higher concentrations of low- and moderate-income populations by the schools, retail areas, and hospitals. Some specific actions the Township should consider include:
Encourage financial assistance to include private and public investment in impacted areas of the Township in future economic and transportation plans
Encourage public funding to improve infrastructure in the impacted areas of the Township
Encourage financial assistance to build affordable housing, through the use of FHLBank, PHFA, LIHTC, CDBG, and HOME programs outside of impacted areas
Encourage financial assistance to rehabilitate housing, through the use of FHLBank, PHFA, LIHTC, CDBG, and HOME programs outside of impacted areas
Provide educational materials to residents of the Township to improve the public’s understanding of Fair Housing Choice outside of impacted areas
Encourage the creation of a regional Resource Guide (paper and electronic versions) that provides residents information on affordable housing opportunities and social service options
D. Employment:
According to the 2007-2011 ACS, 68.1% of the Township’s residents 16 years of age and over were considered a part of the labor force in 2011. The charts below illustrate the classes of workers and the occupations. Most workers were employed in four occupations: management, business, science, and arts (46%), sales and office (27%), service (13%), and production, transportation, and material moving occupations (7%). The class of worker consisted primarily of private wage and salary workers (66%), to go along with private not-for-profit wage and salary workers (16%), government (12%) and self-employed workers (6%).

Township of Abington,
Pennsylvania
Analysis of Impediments to Fair Housing Choice Page 35 of 125
Abington Occupations
Source: 2007-2011 American Community Survey
Abington Class of Worker
Source: 2007-2011 American Community Survey
Management, business, science,
and arts
Service occupations
Sales and office occupations
Natural resources, construction, and
maintenance
Production, transportation, and
Private for-profit wage and salary workers
66%
Private not-for-profit wage and salary
workers
Government workers
12%
Self-employed in own not incorporated business
Township of Abington,
Pennsylvania
Analysis of Impediments to Fair Housing Choice Page 36 of 125
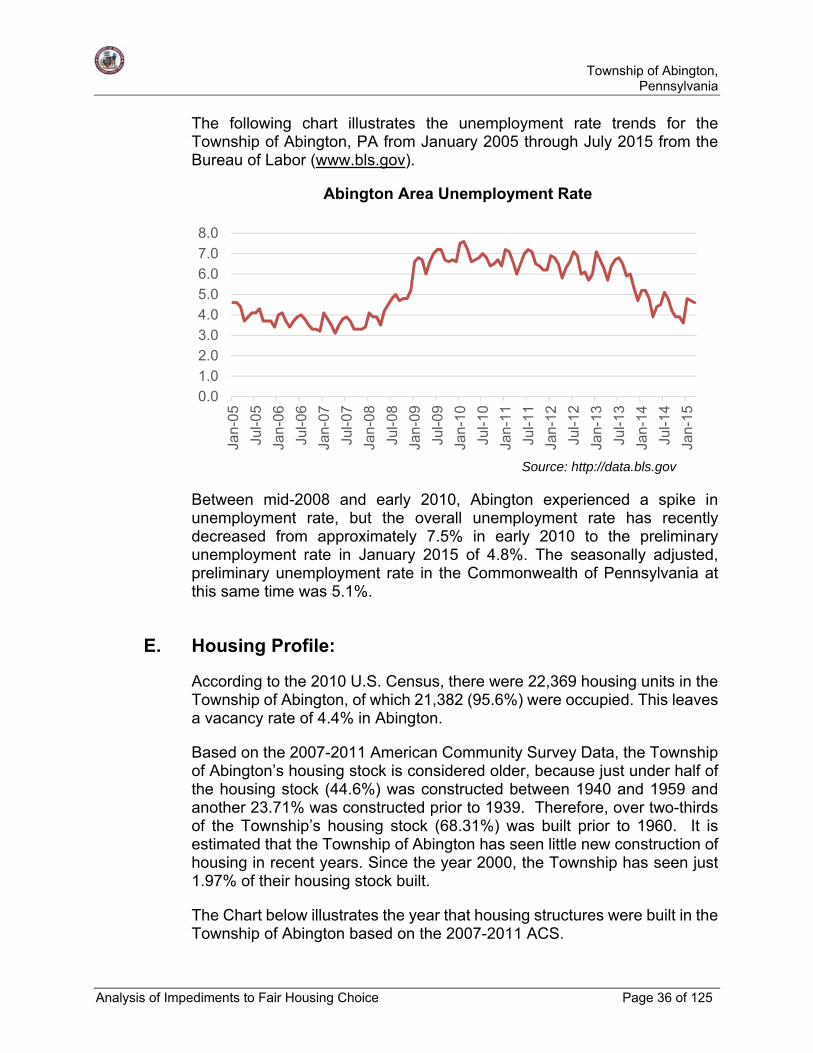
The following chart illustrates the unemployment rate trends for the Township of Abington, PA from January 2005 through July 2015 from the Bureau of Labor (www.bls.gov).
Abington Area Unemployment Rate
Source: http://data.bls.gov
Between mid-2008 and early 2010, Abington experienced a spike in unemployment rate, but the overall unemployment rate has recently decreased from approximately 7.5% in early 2010 to the preliminary unemployment rate in January 2015 of 4.8%. The seasonally adjusted, preliminary unemployment rate in the Commonwealth of Pennsylvania at this same time was 5.1%.
E. Housing Profile:
According to the 2010 U.S. Census, there were 22,369 housing units in the Township of Abington, of which 21,382 (95.6%) were occupied. This leaves a vacancy rate of 4.4% in Abington.
Based on the 2007-2011 American Community Survey Data, the Township of Abington’s housing stock is considered older, because just under half of the housing stock (44.6%) was constructed between 1940 and 1959 and another 23.71% was constructed prior to 1939. Therefore, over two-thirds of the Township’s housing stock (68.31%) was built prior to 1960. It is estimated that the Township of Abington has seen little new construction of housing in recent years. Since the year 2000, the Township has seen just 1.97% of their housing stock built.
The Chart below illustrates the year that housing structures were built in the Township of Abington based on the 2007-2011 ACS.
0.01.0
2.0
3.0
4.0
5.0
6.0
7.0
8.0Ja
n-05
Jul-0
5
Jan-
06
Jul-0
6
Jan-
07
Jul-0
7
Jan-
08
Jul-0
8
Jan-
09
Jul-0
9
Jan-
10
Jul-1
0
Jan-
11
Jul-1
1
Jan-
12
Jul-1
2
Jan-
13
Jul-1
3
Jan-
14
Jul-1
4
Jan-
15

Township of Abington,
Pennsylvania
Analysis of Impediments to Fair Housing Choice Page 37 of 125
Year Structure Built in the Township of Abington, PA
Source: 2007-2011 American Community Survey
The table below outlines the number of new units for which building permits were filed annually in the Township of Abington. Overall, most new construction has been for single family units. The County has experienced a sharp decrease in the total number of new units between 2007 and 2008, and a steady decrease overall until the present day. Data for the Township of Abington drastically shows less construction; according to local records, there were six (6) building permits issued for housing units in Abington in 2013, and nine (9) issued in 2014. This data backs up the chart below, which illustrates very little new housing construction has taken place within the Township of Abington.
Units Authorized by Building Permits Abington, PA
Year Single Family Multi Family 5+ Units Total 2004 23 3 0 26 2005 23 6 0 29 2006 19 6 0 25 2007 15 6 0 21 2008 13 0 0 13 2009 11 0 0 11 2010 15 0 0 15 2011 10 0 0 10 2012 8 0 0 8 2013 6 0 0 6 2014 9 0 0 9
Source: socds.huduser.org/permits/summary.odb
0.68%
1.29%
2.54%
5.20%
21.96%
44.60%
23.71%
0.00% 10.00% 20.00% 30.00% 40.00% 50.00%
2005 or later
2000 to 2004
1990 to 1999
1980 to 1989
1960 to 1979
1940 to 1959
1939 or earlier

Township of Abington,
Pennsylvania
Analysis of Impediments to Fair Housing Choice Page 38 of 125
In 2000, the Township’s housing stock primarily consisted of single-family detached (70.98%) and single-family attached (7.92%). In 2000, multi-family units in the Township of Abington consisted of two units (3.61%), three to four units (2.72%), five to nine units (2.16%), ten to nineteen units (3.5%) and twenty units or more (8.96%). Mobile homes made up 0.11% of the housing stock. The median value of owner-occupied homes in the Township of Abington in 2000 was $142,100 compared to $160,700 for Montgomery County and $97,000 for the Commonwealth of Pennsylvania.
In 2011, the Township’s housing stock consisted primarily of single-family detached (71.95%) and single-family attached (7.88%). In 2011, multi-family units in the Township of Abington consisted of two units (3.41%), three to four units 2.51%), five to nine units (2.33%), ten to nineteen units (2.94%) and twenty units or more (8.98%). There were no mobile homes recorded in 2011. The median value of owner-occupied homes in the Township of Abington in 2011 was $272,000, compared to $292,600 for Montgomery County and $164,700 for the Commonwealth of Pennsylvania. The chart below shows the trends in these housing statistics over the last decade.
Housing Stock in the Township of Abington, PA
Source: 2000 U.S. Census & 2007-2011 American Community Survey
70.98%
7.92%
3.65%
2.72%
2.16%
3.50%
8.96%
0.11%
0.00%
71.95%
7.88%
3.41%
2.51%
2.33%
2.94%
8.98%
0.00%
0.00%
0.00% 10.00% 20.00% 30.00% 40.00% 50.00% 60.00% 70.00% 80.00%
1-unit, detached
1-unit, attached
2 units
3 or 4 units
5 to 9 units
10 to 19 units
20 or more units
Mobile home
Boat, RV, van, etc.
2007-2011 American Community Survey 2000 Census

Township of Abington,
Pennsylvania
Analysis of Impediments to Fair Housing Choice Page 39 of 125
F. Housing Costs:
Owner Costs -
The median mortgage expense in the Township of Abington for 2000 was $499, compared to $762 in 2011. The table below illustrates mortgage status and selected monthly owner costs. Monthly owner costs increased by 29.8% while median income during the same time period increased by 30.1%. Given that the inflation rate for the time period between 2000 and 2011 was 30.6, real monthly owner costs have actually decreased. Furthermore, there appears to be a decreasing strain on home ownership given that real monthly ownership costs have decreased more than real income between 2000 and 2011. Close to two-thirds (65.63%) of all houses in Abington had mortgages in 2000, compared to 70.22% in 2011.
Mortgage Status and Selected Monthly Owner Costs
2000 U.S. Census 2007-2011 American Community Survey
Monthly Owner Cost Number of
Housing Units Percentage
Number of Housing Units
Percentage
Houses with a mortgage 10,487 65.63% 11,738 70.22% Less than $300 0 0.00% 12 0.10% $300 to $499 62 0.59% 47 0.40% $500 to $699 382 3.64% 117 1.00% $700 to $999 1,317 12.56% 481 4.10% $1,000 to $1,499 4,684 44.66% 2,066 17.60% $1,500 to $1,999 2,395 22.84% 3,474 29.60% $2,000 or more 1,647 15.71% 5,552 47.30% Median (dollars) $1,375 (X) $1,958 (X) Houses without a mortgage 5,493 34.37% 4,978 29.78% Median $499 (X) $762 (X)
Source: 2000 U.S. Census and 2007-2011 American Community Survey
Over a quarter (26.3%) of owner-occupied households with a mortgage had monthly housing costs that exceeded 30% of their monthly income in 2011, indicating a relatively high percentage of owners whose housing is not considered affordable. This is illustrated in the table below, which shows housing costs for owner-households. Between the 2000 census count and the 2007-2011 ACS, there was a slight trend of increased monthly housing costs.

Township of Abington,
Pennsylvania
Analysis of Impediments to Fair Housing Choice Page 40 of 125
Selected Monthly Owner Costs as a Percentage of Household Income
Owner Costs as a % of Income
2000 Census 2007-2011 American Community Survey
Number of Housing Units
Percentage of Units Number of
Housing Units Percentage of
Units
Housing units with a mortgage
10,487 65.63% 11,738 70.22%
Less than 20 percent
4165 39.72% 3901 33.23%
20 to 24.9 percent
1904 18.16% 1890 16.10%
25 to 29.9 percent
1352 12.89% 1659 14.13%
30 to 34.9 percent
832 7.93% 1415 12.05%
35 percent or more
2220 21.17% 2849 24.27%
Not computed 14 0.13% 24 0.20%
Housing units without a mortgage
5,493 34.37% 4,978 29.78%
Less than 20 percent
3,726 67.83% 3,170 63.68%
20 to 24.9 percent
405 7.37% 332 6.67%
25 to 29.9 percent
411 7.48% 320 6.43%
30 to 34.9 percent
292 5.32% 192 3.86%
35 percent or more
551 10.03% 912 18.32%
Not computed 108 1.97% 52 1.04%
Source: 2000 U.S. Census & 2007-2011 American Community Survey The median value of owner-occupied homes in the Township of Abington in 2011 was $272,000, compared to $297,900 for Montgomery County and $163,200 for the Commonwealth of Pennsylvania. Foreclosures -
According to RealtyTrac, the Township of Abington had a foreclosure rate of 1 in every 813 housing units as of April 2015. In April 2015, the

Township of Abington,
Pennsylvania
Analysis of Impediments to Fair Housing Choice Page 41 of 125
Commonwealth of Pennsylvania had a foreclosure rate of 1 in every 1,064 housing units. Montgomery County had a foreclosure rate of 1 in every 997 housing units. The following chart illustrates the foreclosure rate of the Township of Abington.
Foreclosures in the Township of Abington, PA
Source: www.realtytrac.com
The number of foreclosures for the Township of Abington was at its highest in October 2014, with 13 foreclosures.
Renter Costs -
The median monthly rent in 2000 was $749, compared to $1,040 in 2011, an increase of 38.8%. The table below illustrates rental rates within the Township at the time of the 2000 U.S. Census and 2007-2011 American Community Survey.
Gross Monthly Rent
Rental Rates 2000 U.S. Census
2007-2011 American Community Survey
Number of Housing Units
PercentageNumber of
Housing Units Percentage
Less than $200 92 2.05% 12 0.26% $200 to $299 137 3.05% 126 2.76% $300 to $499 220 4.90% 105 2.30% $500 to $749 1639 36.51% 604 13.21% $750 to $999 945 21.05% 1,126 24.63%
0
2
4
6
8
10
12
14

Township of Abington,
Pennsylvania
Analysis of Impediments to Fair Housing Choice Page 42 of 125
$1,000 to $1,499 826 18.40% 1,402 30.67% $1,500 or more 402 8.96% 864 18.90% No cash rent 128 2.85% 321 7.02% Median (dollars) $749 - $1,040 -
Source: 2000 U.S. Census & 2007-2011 American Community Survey
The table below illustrates the housing cost for renter-households. The monthly housing costs for 37.1% of all renter-occupied households exceeded 30% of monthly income in 2000, indicating an even higher percentage of renters whose housing is not considered affordable. In 2011, that amount increased to 48.3%.
Gross Rent as a Percentage of Household Income
Rental Cost as a % of Income
2000 U.S. Census 2007-2011 American Community Survey
Number of Housing Units
PercentageNumber of
Housing Units Percentage
Less than 15 percent 795 17.71% 333 7.29% 15 to 19 percent 709 15.79% 718 15.71% 20 to 24 percent 589 13.12% 472 10.33% 25 to 29 percent 536 11.94% 467 10.22% 30 to 34 percent 365 8.13% 341 7.46%
35 percent or more 1,298 28.92% 1,867 40.84% Not computed 197 4.39% 373 8.16%
Source: 2000 U.S. Census & 2007-2011 American Community Survey
The 2014 Fair Market Rents for the Township of Abington, PA MSA are shown in the following table.
Final FY 2014 FMRs by Unit Bedrooms
EfficiencyOne-
Bedroom Two-
BedroomThree-
Bedroom Four-
Bedroom
Final FY 2014 FMR $814 $959 $1,156 $1,440 $1,546
Source: www.hud.gov
G. Household Types:
Based on a comparison between the 2000 and 2011 populations, the Township of Abington experienced a 1.2% decrease in population and a

Township of Abington,
Pennsylvania
Analysis of Impediments to Fair Housing Choice Page 43 of 125
1.86% decrease in households. The median income of the area increased by 21% but an actual decreased in real dollars when inflation is taken into account.
Demographic Changes between 2000 & 2011
Demographics 2000 2011 %
Change
Population 56,103 55,429 -1.20%
Households 21,690 21,287 -1.86%
Median Income $59,921 $77,928 30.05%
Source: 2000 Census and 2007-2011 American Community Survey
Number of Households by Income
0-30% HAMFI
>30-50% HAMFI
>50-80% HAMFI
>80-100% HAMFI
>100% HAMFI
Total Households * 1,880 1,920 2,825 2,045 12,620
Small Family Households * 245 445 890 740 7,190
Large Family Households * 70 70 230 225 1,370
Household contains at least one person 62-74 years of age
495 345 690 285 2,390
Household contains at least one person age 75 or older
640 800 695 494 1,179
Households with one or more children 6 years old or younger *
110 168 430 389 864
Source: 2007-2011 CHAS * the highest income category for these family types is >80% HAMFI

Township of Abington,
Pennsylvania
Analysis of Impediments to Fair Housing Choice Page 44 of 125
Housing Problems by Income for Renters and Owners (Households with one of
the listed needs)
Renter Owner 0-
30% AMI
>30-50% AMI
>50-80% AMI
>80-100% AMI
Total 0-
30% AMI
>30-50% AMI
>50-80% AMI
>80-100% AMI
Total
Substandard Housing - Lacking complete plumbing or kitchen facilities
75 20 4 30 129 25 0 0 0 25
Severely Overcrowded - With >1.51 people per room (and complete kitchen and plumbing)
0 30 0 4 34 0 0 0 0 0
Overcrowded - With 1.01-1.5 people per room (and none of the above problems)
0 25 10 0 35 0 4 15 15 34
Housing cost burden greater than 50% of income (and none of the above problems)
565 475 65 15 1,120 665 425 565 105 1,760
Housing cost burden greater than 30% of income (and none of the above problems)
50 265 340 145 800 95 340 660 745 1,840
Zero/negative Income (and none of the above problems)
55 0 0 0 55 75 0 0 0 75
Source: 2007-2011 CHAS

Township of Abington,
Pennsylvania
Analysis of Impediments to Fair Housing Choice Page 45 of 125
Severe Housing Problems by Income for Renters and Owners (Households with one or more Severe Housing Problems)
Renter Owner 0-
30% AMI
>30-50% AMI
>50-80% AMI
>80-100% AMI
Total0-
30% AMI
>30-50% AMI
>50-80% AMI
>80-100% AMI
Total
Having 1 or more of four housing problems
640 545 80 49 1,314 690 430 580 120 1,820
Having none of four housing problems
300 370 715 454 1,839 130 575 1,450 1,415 3,570
Household has negative income, but none of the other housing problems
55 0 0 0 55 75 0 0 0 75
Source: 2007-2011 CHAS
Cost Burdened Greater Than 30%
Renter Owner
0-30% AMI
>30-50% AMI
>50-80% AMI
Total 0-
30% AMI
>30-50% AMI
>50-80% AMI
Total
Small Related 90 210 95 395 85 189 510 784 Large Related 4 35 0 39 30 35 160 225 Elderly 280 360 150 790 555 475 449 1,479 Other 270 210 165 645 109 75 114 298 Total need by income
644 815 410 1,869 779 774 1,233 2,786
Source: 2007-2011 CHAS
Cost Burdened Greater Than 50%
Renter Owner 0-
30% AMI
>30-50% AMI
>50-80% AMI
Total 0-
30% AMI
>30-50% AMI
>50-80% AMI
Total
Small Related 90 80 0 170 85 114 255 454 Large Related 4 0 0 4 30 20 85 135 Elderly 235 265 65 565 455 255 184 894 Other 260 150 0 410 109 45 55 209 Total need by income 589 495 65 1,149 679 434 579 1,692
Source: 2007-2011 CHAS

Township of Abington,
Pennsylvania
Analysis of Impediments to Fair Housing Choice Page 46 of 125
Overcrowding Conditions
Renter Owner 0-
30% AMI
>30-50% AMI
>50-80% AMI
>80-100% AMI
Total0-
30% AMI
>30-50% AMI
>50-80% AMI
>80-100% AMI
Total
Single family households
0 55 10 4 69 0 0 15 0 15
Multiple, unrelated family households
0 0 0 0 0 0 4 0 15 19
Other, non-family households
0 0 0 0 0 0 0 0 0 0
Total need by income 0 55 10 4 69 0 4 15 15 34 Source: 2007-2011 CHAS
According to the 2007-2011 American Community Survey (ACS), there were 21,287 households in 2011 in the Township of Abington. Of the Township’s households 5,535 (26.0%) of all households were single person households living alone. Single person households aged 65 and over in the Township comprised 2,789 households or 13.1% of all households and it can be presumed that as they age in place, additional accommodations and special needs will be necessary for this portion of the Township’s population. The Township will need to assist in obtaining funding and working with housing service and elderly support agencies to provide programs, activities and accommodations for its elderly population. The elderly and disabled populations are the most affected by the high cost of housing in the Township of Abington. The elderly and disabled are on fixed or limited incomes. The lack of affordable housing that is decent, safe, and sound forces them into below code standards housing. The other large group affected by the lack of affordable housing is the homeless and persons at-risk of becoming homeless, including persons who are victims of domestic violence. The high cost of decent, safe, and sanitary housing in the Township creates instability of housing for the lower income families in the area. Many families are living from paycheck to paycheck and are paying over 30% of their income for housing.
H. Cost Burden:
A major housing problem facing the Township of Abington is the lack of affordable housing. Lower income households are most affected by the cost of housing options. For the jurisdiction as a whole, 32% of all households were cost burdened by 30% or more and 13% of all households were cost

Township of Abington,
Pennsylvania
Analysis of Impediments to Fair Housing Choice Page 47 of 125
burdened by 50% or more. Additionally, 3,270 White households were cost burdened by 30% to 50%, and 2,105 White households were cost burdened by more than 50%; 445 Black/African American households were cost burdened by 30% to 50%, and 420 Black/African American households were cost burdened by more than 50%.
Housing Cost Burden
Housing Cost Burden
<=30% 30-50% >50% No / negative income (not computed)
Jurisdiction as a whole
13,965 3,950 2,740 55
White 11,485 3,270 2,105 45 Black / African American
1,465 445 420 0
Asian 510 35 145 10 American Indian, Alaska Native
0 0 0 0
Pacific Islander 0 0 0 0 Hispanic 325 135 30 0
Source: 2007-2011 CHAS The racial and ethnic demographics of the Township of Abington’s households according to the 2011 American Communities Survey was: 81.5% White; 13.6% African American; 0.8% Native American; 5.7% Asian; 0.0% Pacific Islander; and the Hispanic or Latino population of any race was reported as 3.4%. A disproportionately greater need was identified when a racial or ethnic group experienced a 10 percentage points or higher occurrence rate of housing cost burdens. A housing cost burden is defined as a household paying over 30% of household AMI on housing costs. Comparing all households that are housing cost burdened by 30% to 50%: 19% of White households were cost burdened; 18% of Black/African American households were cost burdened; 4% of Asian households were cost burdened; 0% of American Indian, Alaska Native households were cost burdened; 0% of Pacific Islander households were cost burdened; and 30% of Hispanic households were cost burdened. Comparing all households that are housing cost burdened by over 50%: 12% of White households were cost burdened; 17% of Black/African American households were cost burdened; 17% of Asian households were cost burdened; 0% of American Indian, Alaska Native households were cost burdened; 0% of Pacific Islander households were cost burdened; and 7% of Hispanic households were cost burdened.
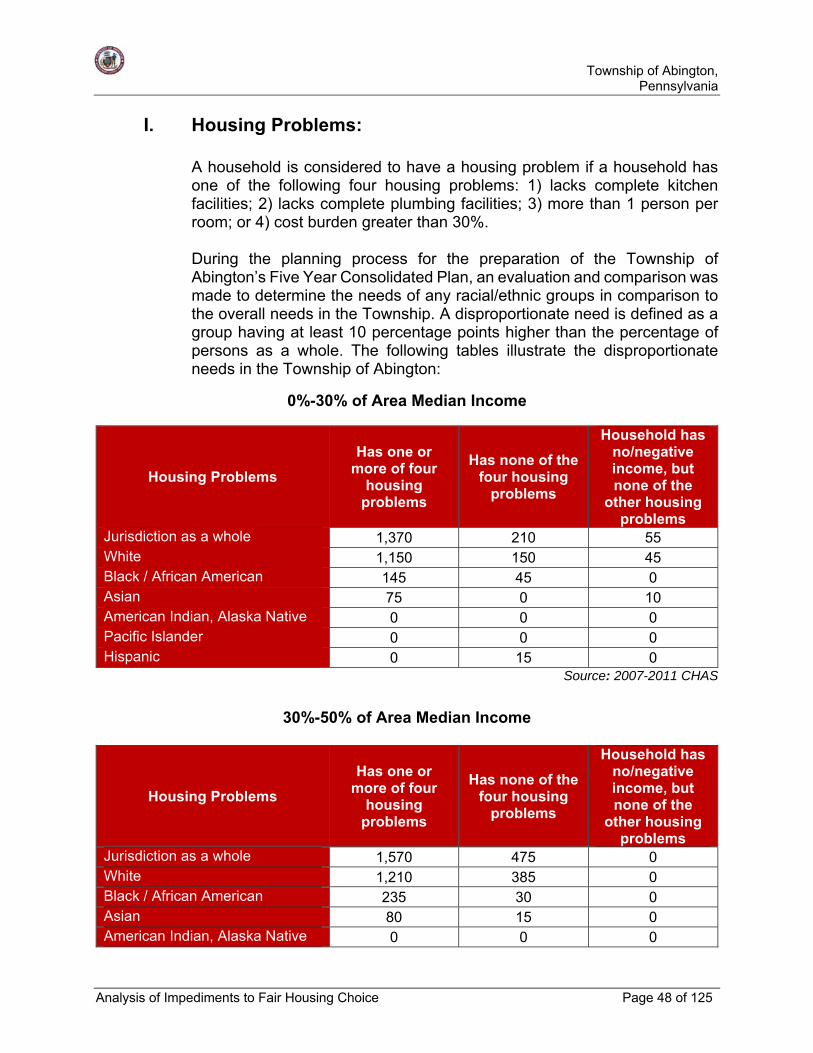
Township of Abington,
Pennsylvania
Analysis of Impediments to Fair Housing Choice Page 48 of 125
I. Housing Problems:
A household is considered to have a housing problem if a household has one of the following four housing problems: 1) lacks complete kitchen facilities; 2) lacks complete plumbing facilities; 3) more than 1 person per room; or 4) cost burden greater than 30%. During the planning process for the preparation of the Township of Abington’s Five Year Consolidated Plan, an evaluation and comparison was made to determine the needs of any racial/ethnic groups in comparison to the overall needs in the Township. A disproportionate need is defined as a group having at least 10 percentage points higher than the percentage of persons as a whole. The following tables illustrate the disproportionate needs in the Township of Abington:
0%-30% of Area Median Income
Housing Problems
Has one or more of four
housing problems
Has none of the four housing
problems
Household has no/negative income, but none of the
other housing problems
Jurisdiction as a whole 1,370 210 55 White 1,150 150 45 Black / African American 145 45 0 Asian 75 0 10 American Indian, Alaska Native 0 0 0 Pacific Islander 0 0 0 Hispanic 0 15 0
Source: 2007-2011 CHAS
30%-50% of Area Median Income
Housing Problems
Has one or more of four
housing problems
Has none of the four housing
problems
Household has no/negative income, but none of the
other housing problems
Jurisdiction as a whole 1,570 475 0 White 1,210 385 0 Black / African American 235 30 0 Asian 80 15 0 American Indian, Alaska Native 0 0 0
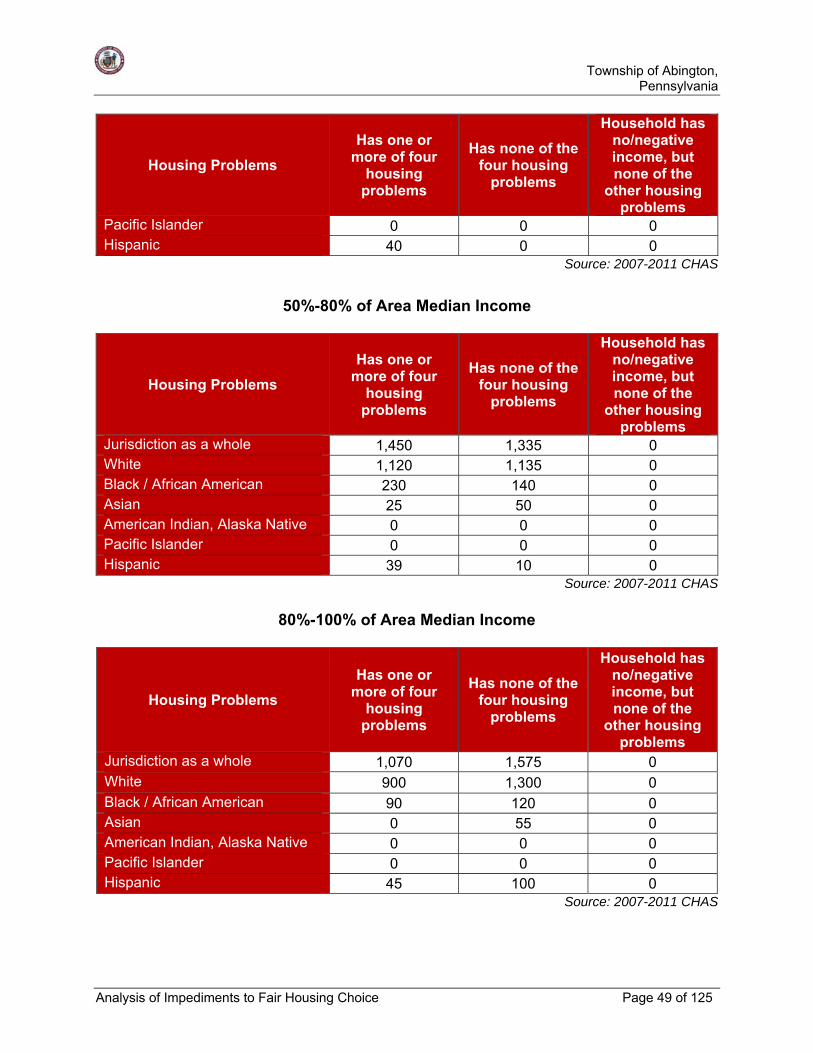
Township of Abington,
Pennsylvania
Analysis of Impediments to Fair Housing Choice Page 49 of 125
Housing Problems
Has one or more of four
housing problems
Has none of the four housing
problems
Household has no/negative income, but none of the
other housing problems
Pacific Islander 0 0 0 Hispanic 40 0 0
Source: 2007-2011 CHAS
50%-80% of Area Median Income
Housing Problems
Has one or more of four
housing problems
Has none of the four housing
problems
Household has no/negative income, but none of the
other housing problems
Jurisdiction as a whole 1,450 1,335 0 White 1,120 1,135 0 Black / African American 230 140 0 Asian 25 50 0 American Indian, Alaska Native 0 0 0 Pacific Islander 0 0 0 Hispanic 39 10 0
Source: 2007-2011 CHAS
80%-100% of Area Median Income
Housing Problems
Has one or more of four
housing problems
Has none of the four housing
problems
Household has no/negative income, but none of the
other housing problems
Jurisdiction as a whole 1,070 1,575 0 White 900 1,300 0 Black / African American 90 120 0 Asian 0 55 0 American Indian, Alaska Native 0 0 0 Pacific Islander 0 0 0 Hispanic 45 100 0
Source: 2007-2011 CHAS

Township of Abington,
Pennsylvania
Analysis of Impediments to Fair Housing Choice Page 50 of 125
The racial and ethnic demographics of the Township of Abington’s households according to the 2011 American Communities Survey was: 81.5% White; 13.6% African American; 0.8% Native American; 5.7% Asian; 0.0% Pacific Islander; and the Hispanic or Latino population of any race was reported as 3.4%. There were no disproportionately impacted groups in terms of housing problems. Comparing housing problems for households across all income groups based on race and ethnicity the prevalence of housing problems was: 25% for White households; 28% for Black/African American households; 21% for Asian households; 0% for American Indian, Alaska Native households; 0% for Pacific Islander households; and 27% for Hispanic households.
J. Disproportionately Greater Need Severe Housing Problems:
A household is considered to have a severe housing problem if a household has one of the following four housing problems: 1) lacks complete kitchen facilities; 2) lacks complete plumbing facilities; 3) more than 1.5 persons per room; or 4) cost burden greater than 50%. During the planning process for the preparation of the Township of Abington’s Five Year Consolidated Plan, an evaluation and comparison was made to determine the needs of any racial/ethnic groups in comparison to the overall needs in the Township. A disproportionate need is defined as a group having at least 10 percentage points higher than the percentage of persons as a whole. The following tables illustrate the disproportionate needs in the Township of Abington:
0%-30% of Area Median Income
Severe Housing Problems*
Has one or more of four
housing problems
Has none of the four housing
problems
Household has no/negative income, but none of the
other housing problems
Jurisdiction as a whole 1,190 390 55 White 965 335 45 Black / African American 145 45 0 Asian 75 0 10 American Indian, Alaska Native 0 0 0 Pacific Islander 0 0 0 Hispanic 0 15 0
Source: 2007-2011 CHAS

Township of Abington,
Pennsylvania
Analysis of Impediments to Fair Housing Choice Page 51 of 125
30%-50% of Area Median Income
Severe Housing Problems*
Has one or more of four
housing problems
Has none of the four housing
problems
Household has no/negative income, but none of the
other housing problems
Jurisdiction as a whole 870 1,175 0 White 600 995 0 Black / African American 145 120 0 Asian 80 15 0 American Indian, Alaska Native 0 0 0 Pacific Islander 0 0 0 Hispanic 40 0 0
Source: 2007-2011 CHAS
50%-80% of Area Median Income
Severe Housing Problems*
Has one or more of four
housing problems
Has none of the four housing
problems
Household has no/negative income, but none of the
other housing problems
Jurisdiction as a whole 505 2,280 0 White 380 1,875 0 Black / African American 90 275 0 Asian 0 75 0 American Indian, Alaska Native 0 0 0 Pacific Islander 0 0 0 Hispanic 4 45 0
Source: 2007-2011 CHAS
80%-100% of Area Median Income
Severe Housing Problems*
Has one or more of four
housing problems
Has none of the four housing
problems
Household has no/negative income, but none of the
other housing problems
Jurisdiction as a whole 160 2,485 0 White 135 2,065 0 Black / African American 25 185 0

Township of Abington,
Pennsylvania
Analysis of Impediments to Fair Housing Choice Page 52 of 125
Severe Housing Problems*
Has one or more of four
housing problems
Has none of the four housing
problems
Household has no/negative income, but none of the
other housing problems
Asian 0 55 0 American Indian, Alaska Native 0 0 0 Pacific Islander 0 0 0 Hispanic 0 145 0
Source: 2007-2011 CHAS
The racial and ethnic demographics of the Township of Abington’s households according to the 2011 American Communities Survey was: 81.5% White; 13.6% African American; 0.8% Native American; 5.7% Asian; 0.0% Pacific Islander; and the Hispanic or Latino population of any race was reported as 3.4%. There were no disproportionately impacted groups in terms of severe housing problems.
K. Disabled Households:
The following table includes the 2007-2011 ACS data for the number of disabled individuals in the Township of Abington. The total population over the age of 5 is 54,818 and the disabled portion of this population is 6,435, or (11.70%). This is an indicator of the need for housing for the disabled, which are oftentimes low- and moderate-income, and do not have housing resources that are accessible and/or affordable.
Disability Status for Abington, PA
Disability Status of the Civilian Non-Institutional Population
Total Population
Over 5 Years of Age
Population with a Disability
Percent with a
Disability
Total civilian noninstitutionalized population
54,818 6,435 11.70%
Population under 5 years 2,817 0 0.00% With a hearing difficulty (X) 0 0.00% With a vision difficulty (X) 0 0.00% Population 5 to 17 years 9,268 581 6.30% With a hearing difficulty (X) 76 0.80%

Township of Abington,
Pennsylvania
Analysis of Impediments to Fair Housing Choice Page 53 of 125
With a vision difficulty (X) 34 0.40% With a cognitive difficulty (X) 455 4.90% With an ambulatory difficulty (X) 31 0.30% With a self-care difficulty (X) 135 1.50% Population 18 to 64 years 33,632 2,824 8.40% With a hearing difficulty (X) 549 1.60% With a vision difficulty (X) 438 1.30% With a cognitive difficulty (X) 1,037 3.10% With an ambulatory difficulty (X) 1,415 4.20% With a self-care difficulty (X) 430 1.30% With an independent living difficulty (X) 923 2.70%
Population 65 years and over 9,101 3,030 33.30% With a hearing difficulty (X) 1,308 14.40% With a vision difficulty (X) 569 6.30% With a cognitive difficulty (X) 631 6.90% With an ambulatory difficulty (X) 1,880 20.70% With a self-care difficulty (X) 934 10.30% With an independent living difficulty (X) 1,554 17.10% SEX Male 26,255 2,966 11.30% Female 28,563 3,469 12.10% RACE AND HISPANIC OR LATINO ORIGIN
One Race N N N White alone 43,854 5,212 11.90% Black or African American alone 6,868 864 12.60%
American Indian and Alaska Native alone N N N Asian alone 2,755 228 8.30% Native Hawaiian and Other Pacific Islander alone
N N N
Some other race alone N N N Two or more races N N N White alone, not Hispanic or Latino 42,441 5,026 11.80% Hispanic or Latino (of any race) 2,113 244 11.50%
Source: 2007-2011 American Community Survey

Township of Abington,
Pennsylvania
Analysis of Impediments to Fair Housing Choice Page 54 of 125
The disabled population of the Township of Abington comprises 11.17% of the Township's residents; 3.53% of the population has a hearing difficulty; 1.9% of the population has a vision difficulty; 3.87% of the population has a cognitive difficulty; 6.07% of the population has an ambulatory difficulty; 2.73% of the population has a self-care difficulty; and 4.52% of the population has an independent living difficulty. Of the population age 65 and older, 33.3% have a disability, made up largely due to ambulatory difficulty (20.7%) and an independent living difficulty (17.1%). The overall data shows a fairly even percentage between males and females, with 11.3% and 12.1% of the respective populations having disabilities.

Township of Abington,
Pennsylvania
Analysis of Impediments to Fair Housing Choice Page 55 of 125
III. Review/Update to Original Plan
The Township of Abington identified specific goals and strategies for the Township to affirmatively further fair housing in 2012, as part of its Five Year Consolidated Plan and subsequent Annual Action Plans. During the FY 2013 CAPER period, Abington Township took the following actions to address the 2012 Analysis of Impediments to Fair Housing Choice Impediments:
A. Summary of Impediments – 2012
Impediment 1: FAIR HOUSING EDUCATION AND OUTREACH – There is a continuing need to educate persons about their rights under the Fair Housing Act and raise awareness, especially for low-income households, that all residents of Abington Township have a right to fair housing choice. Goal: Improve the public’s knowledge and awareness of the Fair Housing Act, and related laws, regulations, and requirements to affirmatively further fair housing in the community.
The strategies to achieve this goal include:
- 1-A: Continue to promote the Township Police Department’s “No
Place for Hate” Program in the schools and provide educational opportunities for all persons to learn about their rights under the Fair Housing Act and the Americans With Disabilities Act.
- 1-B: Continue to make available and distribute literature and informational material, to pass out, concerning fair housing issues and place in prominent locations to be available for distribution.
- 1-C: Include a link on the Township’s website for information on Fair Housing and who to contact in cases of suspected housing discrimination.
- 1-D: Support the continuing efforts of the local fair housing organizations to provide training and technical assistance to the staff of Abington Township, the local Human Relations Commission members, affordable housing providers, and other organizations that are concerned with housing and civil rights in Abington.
Action – The Township provided funding for the following activities under FY 2013 to address the above impediment: CDBG-13-02 Roslyn Boys and Girls Club After-School Program ($11,500 in CDBG funds) - The Abington Township Police Department’s

Township of Abington,
Pennsylvania
Analysis of Impediments to Fair Housing Choice Page 56 of 125
“No Place for Hate” Program provides educational opportunities for all persons to learn about their rights under the Fair Housing Act and the Americans With Disabilities Act. CDBG-13-03 Roslyn Boys and Girls Club Summer Program ($16,500 in CDBG funds) - The Abington Township Police Department’s “No Place for Hate” Program provides educational opportunities for all persons to learn about their rights under the Fair Housing Act and the Americans With Disabilities Act. On April 24, 2014, Abington Township Community Development Department Staff attended a training session entitled, “Affirmatively Furthering Fair Housing: Using the Fair Housing Act to Leverage Resources for your Community” put on by the Fair Housing Rights Center in Southeastern Pennsylvania. During this CAPER period, the Abington Township sponsored a full page advertisement at the annual NAACP Banquet. Attached notice is at the end of this section. Impediment 2: PUBLIC POLICIES AND REGULATIONS – The Township in conjunction with the Montgomery County Planning Department has been working on revising its Zoning Ordinance in accordance with the latest model codes. The Township needs to continue to move forward and complete this major revision to its Zoning Ordinance to bring it into compliance with the Federal Fair Housing Act, Section 504, the Americans with Disabilities Act, etc.
Goal: Complete the work on the revisions to the Township’s Zoning Ordinance to promote and affirmatively further fair housing by revising its purposes, definitions, and land use regulations.
The strategies to achieve this goal include:
- 2-A: Review and revise the definition of "Family" in the Zoning Ordinance to permit six (6) or less disabled persons to live together as a single family unit in any residential zoning district. The Township has been administratively abiding by this, but should now include this in the wording of the Zoning Ordinance.
- 2-B: Revise the General Purpose and Intent Section of the Zoning Ordinance to reaffirm the Township’s commitment to affirmatively further fair housing.
- 2-C: Revise the Zoning Ordinance to develop a chart with the revised permitted uses, including all types of housing: i.e. group residences, community living arrangements, elderly housing, etc.
Township of Abington,
Pennsylvania
Analysis of Impediments to Fair Housing Choice Page 57 of 125
- 2-D: Review and revise all of the other definitions in the Zoning Ordinance Township’s and include new definitions for Handicapped (Disabled), Fair Housing Act, Group Home, Community Living Arrangement, Elderly Housing (Senior Citizen Housing), Visitability, Accessibility, Americans With Disabilities Act, etc.
During the 2013 CAPER period, Abington Township prepared changes to the Zoning Ordinance and these changes have been approved. One of the changes is the definition of Family. The proposed new definition is: Family. One or more persons related by blood, marriage or adoption, or a group of not more than five persons who need not be related, and who are living together in a single dwelling and maintaining a common household with single cooking facilities. As a special exception, the Zoning Hearing Board may interpret the term “family” to include the following: A. Any number of individuals living together, when all individuals are related by blood, marriage or legal adoption, as two nonprofit housekeeping units and doing separate cooking on the premises, provided that one of the housekeeping units and doing separate cooking on the premises, provided that one of the housekeeping units shall contain not more than two members, at least one of who shall be 60 years of age or older, and provided further that the owner of the property executes an agreement with the township which shall be recorded with the County Recorder of Deeds, which agreement provides for the immediate removal of separate cooking faculties at such time as they are no longer being utilized by the person for who they were originally installed. All provisions of other Township ordinances, codes and regulations, specifically as they pertain to multifamily dwellings, must be met. Impediment 3: NEED FOR AFFORDABLE RENTAL HOUSING UNITS – The cost of rent for apartments in the Township has increased over the past ten years to the point that 51.2% of all renter households in Abington are paying more than 30% of their income on the cost of their housing, which means that these households are considered cost overburdened.
Goal: Promote and encourage the construction and development of additional affordable rental housing units in the Township, especially for households whose income is less than 80% of the median income.
The strategies to achieve this goal include:
- 3-A: Continue to support the construction and development of rental housing and the rehabilitation of upper floor residential units in the business district that provides affordable housing options to

Township of Abington,
Pennsylvania
Analysis of Impediments to Fair Housing Choice Page 58 of 125
low- and moderate-income households, especially outside of economically impacted areas.
- 3-B: Assist in supporting and promoting financial assistance to households that are cost overburdened, particularly those households below 80% of the area median family income.
- 3-C: Continue to encourage the Montgomery County Housing Authority, private non-profit housing development agencies, and private developers to construct new mixed income housing for rent in the Township, especially for the Elderly.
- 3-D: Continue to support and encourage the rehabilitation of existing housing units, and upper floor housing in mixed use buildings as outlined in the “Old York Road Corridor Improvement Study,” and to increase the supply of decent, safe and sound rental housing that is affordable to low- and moderate-income households.
Action – The Township provided funding for the following activities under FY 2013 to address the above impediment: CDBG-13-05 Renter-Occupied Housing Rehabilitation ($75,000 in CDBG funds) - CDBG funds are available to both for-profit and non-profit owners to bring their rental units up to local code standards. The units must be rented to low- and moderate-income families. During this CAPER period, Willow Grove Community Development Corporation completed the rehabilitation of five (5) affordable rental housing units. These units are rented at or below the fair market rental rates. Impediment 4: NEED FOR AFFORDABLE HOUSING FOR SALE – The monthly housing cost for homeowners with a mortgage has increased to over $2,000 per month and it is estimated that 35.3% of all homeowners with a mortgage are paying more than 30% of their income on housing costs, which makes them cost overburdened, and limits the choice of housing for lower income households.
Goal: Promote and encourage the development of for-sale single family houses that are affordable to low- to moderate-income households.
The strategies to achieve this goal include:
- 4-A: Continue to support the construction and development of for sale housing that provides affordable housing options to low- and moderate-income households outside of economically impacted areas.

Township of Abington,
Pennsylvania
Analysis of Impediments to Fair Housing Choice Page 59 of 125
- 4-B: Continue to support down-payment assistance and financing to assist low- and moderate-income homebuyers to purchase housing outside of economically impacted areas.
- 4-C: Continue to support the rehabilitation of the existing housing stock to increase the supply of decent, safe, and sound housing that is affordable to low- and moderate-income households.
- 4-D: Continue to support homebuyer education and training programs to improve homebuyer awareness and increase the opportunities of fair housing choice for lower income households to move outside impacted areas.
Action – The Township provided funding for the following activities under FY 2013 to address the above impediment: CDBG-13-06 Owner-Occupied Housing Rehabilitation ($140,000 in CDBG funds) - CDBG funds are available to low- and moderate-income homeowners to bring their homes up to local code standards. During this CAPER period, the Township assisted five (5) owner occupied households with funding for housing rehabilitation work. The Township forwards any low/mod household that is interested in purchasing a home in the Township to Montgomery County’s First Time Homebuyer Program. Impediment 5: NEED FOR ACCESSIBLE HOUSING – There is a need for more accessible housing that is decent, safe, and sound, as well as affordable to persons with disabilities.
Goal: Increase the number of accessible housing units that are decent, safe, and sound, as well as affordable to lower income households throughout the Township.
The strategies to achieve this goal include:
- 5-A: Increase the number of accessible housing units through rehabilitation of the existing housing stock.
- 5-B: Increase the number of accessible housing units through the development and construction of new rental and single family homes for sale.
- 5-C: Continue to enforce the ADA requirements for landlords to make “reasonable” modifications and accommodations to their rental properties, which will increase the number of accessible housing units for the disabled.

Township of Abington,
Pennsylvania
Analysis of Impediments to Fair Housing Choice Page 60 of 125
- 5-D: Provide financial assistance to homeowners to make their properties accessible in order to allow the elderly to remain in their residences.
Action – The Township provided funding for the following activities under FY 2013 to address the above impediment: CDBG-13-05 Renter-Occupied Housing Rehabilitation ($75,000 in CDBG funds) - CDBG funds are available to both for-profit and non-profit owners to bring their rental units up to local code standards. The units must be rented to low- and moderate-income families. CDBG-13-06 Owner-Occupied Housing Rehabilitation ($140,000 in CDBG funds) - CDBG funds are available to low- and moderate-income homeowners to bring their homes up to local code standards. Any resident that needs accessibility modifications will receive the modification immediately, but must agree to a full rehab at a later date. Inglis & Medical Mission Sisters completed construction of Mission Green during this CAPER period. This project is a sixty-one (61) units of fully-accessible, affordable housing for age 55+ seniors and persons with disabilities development. This development has been designed to meet or exceed PHFA’s Green Building standards. Willow Grove Community Development Corporation completed the rehabilitation of five (5) affordable rental housing units. These units are rented at or below the fair market rental rates. During this CAPER period, the Township assisted three (3) owner occupied housing rehabilitations. The Township forwards any low/mod household that is interested in purchasing a home in the Township to the Montgomery County’s First Time Homebuyer Program. Impediment 6: PRIVATE LENDING AND INSURANCE PRACTICES – The HMDA data suggests that there is a disparity between the approval rates of home mortgage loans that are originated from white and those originated from minority applicants. Furthermore, based on testing done in the County, there appears to be discrimination in obtaining insurance quotes.
Goal: Approval rates for all originated home mortgage loans and insurance coverage should be fair, unbiased, and impartial, regardless of race, familial status and location.
The strategies to achieve this goal include:

Township of Abington,
Pennsylvania
Analysis of Impediments to Fair Housing Choice Page 61 of 125
- 6-A: An in depth review of the mortgage lending practices by local
banks should be undertaken by an independent agency or accounting firm, that does not have any interest in the local financial institutions.
- 6-B: Testing should be performed by an independent fair housing agency to determine if any patterns of discrimination are present in local home mortgage lending practices for home buyers in lower income areas.
- 6-C: Testing should be performed by an independent fair housing agency to determine if there are any patterns of discrimination in providing quotes and levels of insurance coverage for housing located in lower income areas.
- 6-D: Additional funding should be applied for in order for the Township to provide a higher rate of public financial assistance to potential home buyers in lower-income neighborhoods in order to improve the loan to value ratio so private lenders will increase the number of home loan mortgages made in these areas.
Action – The Township did not provide any CDBG funding for this impediment during this CAPER period. Impediment 7: COUNTYWIDE APPROACH TO AFFIRMATIVELY FURTHERING FAIR HOUSING – There are four (4) Federal Entitlement jurisdictions in Montgomery County: Abington, Lower Merion, Norristown, and Montgomery County. Housing, racial, and socio-economic data from the U.S. Census of 2010, as well as the location of subsidized housing illustrates that there is a disproportionate concentration of low- and moderate-income persons, minorities, and Hispanics living in impacted areas throughout Montgomery County, which demonstrates a lack of housing choice. Goal: Provide housing and economic opportunities for low- and moderate-income persons and the protected classes to live and work throughout all of Montgomery County, but outside impacted areas. The strategies to meet this goal include: - 7-A: Establish an Affirmatively Furthering Fair Housing (AFFH)
Task Force for Montgomery County with representatives from the Township of Abington, Lower Merion Township, the Municipality of Norristown, Montgomery County, U.S. Department of Housing and Urban Development (HUD), the two Fair Housing Councils, and the Montgomery County Housing Authority (MCHA).

Township of Abington,
Pennsylvania
Analysis of Impediments to Fair Housing Choice Page 62 of 125
- 7-B: The AFFH Task Force should review the mobility policies and procedures of the Montgomery County Housing Authority to encourage and support low- and moderate-income Housing Choice Voucher holders to move outside racially and economically impacted areas in Montgomery County.
- 7-C: The four (4) federal Entitlement jurisdictions: Montgomery County, Norristown, Lower Merion and Abington should coordinate and cooperate in the preparation and implementation of their individual Analysis of Impediments (A.I.) and/or prepare and adopt a joint countywide fair housing strategic plan.
- 7-D: The four (4) federal Entitlement jurisdictions should work with Montgomery County to promote and encourage the development of affordable housing throughout Montgomery County in areas that are not economically or racially impacted.
Action – The Township did not provide any CDBG funding for this impediment during this CAPER period. Impediment 8: SUPPORT THE HUMAN RELATIONS COMMISSION – The Township needs to support the recently established Human Relations Commission. By having a local coordination, outreach, investigation, and adjudication organization fair housing choice will be promoted and encouraged. Goal: The Human Relations Commission of Abington Township will be a motivating force in affirmatively furthering fair housing in the Township and will promote fair housing choice for all protected classes of people. The strategies to achieve this goal include:
- 8-A: The local governing body of the Township will keep the
appointments of members to the Human Relations Commission current and will provide the Commission with technical and clerical support.
- 8-B: Establish procedures and protocols for how fair housing complaints are to be reported, monitored, and mediated.
- 8-C: Advertise to the community, including the Township’s website, the formation of the Human Relations Commission, its mission, and how to report fair housing complaints.
- 8-D: Create seminars and educational programs for the community in cooperation with local fair housing organizations to increase the knowledge base of all residents, owners, renters, and landlords,

Township of Abington,
Pennsylvania
Analysis of Impediments to Fair Housing Choice Page 63 of 125
concerning their rights under the Fair Housing Act, as well as the Americans with Disabilities Act.
Action – The Township did not provide CDBG funding for the following activities under FY 2013 to address the above impediment. In April of 2012, the Abington Board of Commissioners adopted the Abington Township Human Relations Ordinance. In this Ordinance the Township of Abington stated the intent to foster equality and equal opportunity for all of its citizens regardless of actual or perceived race, color, religion creed, ancestry, sex, national origin, handicap or disability, use of support animals because of blindness, deafness or physical handicap of the user or because the user is a handler or trainer of support or guide animals, or because of an individual’s sexual orientation, gender identity of gender expression in all matters affecting employment, housing, and commercial property and public accommodation, and to safeguard the right of all persons to remain free of discrimination or discriminatory practices in any of the foregoing aspects of their lives. As a result of the above ordinance the Township established the Abington Township Human Relations Commission consisting of five (5) members and will serve as the contact point for any and all complaints of discrimination. Arrangements have been made for the newly formed Commission to receive training from the Pennsylvania Human Relations Commission and also from the Fair Housing Council of Suburban Philadelphia. Abington Township has a five (5) members Human Relations Commission (HRC). The Human Relations Commission meets monthly. The Mission Statement of the HRC is: In order to protect the rights of all community members, the Abington Township Human Relations Commission (ATHRC) will promote the provisions of Abington Ordinance 2029, which prohibits discrimination in housing, employment, and public accommodations. Abington Township and the ATHRC recognize the inherent dignity and worth of all people; therefore, the ATHRC strives to ensure, through education, mediation, and community outreach, that all members of the community enjoy equality and equal protection under the law.

Township of Abington,
Pennsylvania
Analysis of Impediments to Fair Housing Choice Page 64 of 125
IV. Impediments to Fair Housing 2015
In order to determine if impediments to fair housing choice exist, interviews and meetings were conducted, as well as a review of previous fair housing complaints filed in the Township.
A. Fair Housing Complaints:
1. Township of Abington Human Relations Commission
The Abington Township Board of Commissioners adopted the “Abington Township Human Relations Ordinance” on April 12, 2012 by Ordinance Number 2029. In the ordinance, the the Township of Abington declared it’s intent: “To foster equality and equal opportunity for all citizens, regardless of actual or perceived race, color, religious creed, ancestry, sex, national origin, handicap or disability, use of guide or support animals because of blindness, deafness or physical handicap of the user or because the user is a handler or trainer of support or guide animals, or because of an individual's sexual orientation, gender identity of gender expression in all matters affecting employment, housing and commercial property and public accommodation, and to safeguard the right of all persons to remain free of discrimination or discriminatory practices in any of the foregoing aspects of their lives.”
The Abington Township Human Relations Commission consists of five (5) members. The Commission members are appointed by the Board of Commissioners to terms of three years. The terms of the members of the Commission are staggered, such that the terms of one third (1/3) of the members of the Commission shall expire each year. All members of the Commission must be residents or business owners in the Township of Abington and will serve without compensation.
The Human Relations Commission annually designates one member to serve as Chairperson of the Commission. The Chairperson is responsible for coordinating the activities, meetings, and operations of the Commission. The Chairperson also reports, from time to time, to the President of the Board of Commissioners regarding the activities of the Commission. All members of the Commission are
Township of Abington Human Relations Commission
1176 Old York RoadAbington, PA 19001
(267) [email protected]

Township of Abington,
Pennsylvania
Analysis of Impediments to Fair Housing Choice Page 65 of 125
required to attend training and educational seminars in conjunction with the state Human Relations Commission.
When complaints are received, the Chairperson of the Commission will designates one member of the Commission to be responsible to receive the complaint and conduct an intake meeting with the complainants. The member charged with this duty does not participate in any mediations involving parties to the complaint for which they handled the intake.
Complaints may be filed in person at the office of the Township Manager, or by mailing complaints to the Township offices, to the attention of the Township Manager or the Human Relations Commission. All complaints must be received by the Township within one hundred eighty (180) days of the occurrence of the act giving rise to the complaint or the complaint shall be dismissed as untimely.
The Commission provides a process by which persons seeking to file a complaint may consult with a volunteer or other staff person affiliated with the Commission who is trained to assist the prospective complainant in discerning the facts relevant to the prospective complaint. The process also includes referral of additional information to the prospective complainant, the content of the Pennsylvania Human Relations Act, and the availability of the Pennsylvania Human Relations Commission as an additional venue within which the prospective complainant may seek redress when possible.
The Township formed the Human Relations Commission at of the end of 2012 and has not received any complaints or implemented any programs or activities to promote fair housing.
To contact the Human Relations Commission, the following contact information is applicable:
The Township of Abington Human Relations Commission 1176 Old York Road, Abington, PA 19001
OR
Michael LeFevre, Township Manager 1176 Old York Road, Abington, PA 19001 Phone: 267-536-1001 Email: [email protected] In addition to the Human Relations Commission, there are two Fair Housing Rights organizations that operate in the Abington Township

Township of Abington,
Pennsylvania
Analysis of Impediments to Fair Housing Choice Page 66 of 125
area. The two groups are the Fair Housing Rights Center in Southeastern Pennsylvania, located in Philadelphia, PA, and the Fair Housing Equality Center of Pennsylvania, located in Fort Washington, PA. The Fair Housing Rights Center in Southeastern Pennsylvania was incorporated in 1992 with a mission to ensure equal access to housing opportunities for all people. The Center educates the public on fair housing laws, provides assistance to individuals who have experienced housing discrimination, monitors the community for compliance with applicable housing laws, and offers information and counseling on housing related issues. The Fair Housing Rights Center did not have any major fair housing findings regarding the Township.
Fair Housing Rights Center in Southeastern Pennsylvania 444 N. 3rd Street, Suite 110, Philadelphia, PA 19123 Toll Free: 886-576-1968 Phone: 215-625-0700 http://www.fairhousingrights.org The Housing Equality Center of Pennsylvania (formerly known as the Fair Housing Council of Suburban Philadelphia) is the oldest fair housing agency in the United States. Founded in 1956, the Housing Equality Center’s mission is to educate and advocate for equal access to quality, affordable housing for everyone in Southeast Pennsylvania. As a part of the Housing Equality Center’s contract with Montgomery County, the Fair Housing Council has conducted testing, reviewed zoning codes, and reviewed housing advertisements. There were no major findings from these activities in the Township of Abington over the past few years. Additionally, no complaints for housing discrimination were filed with the Housing Equality Center.
Housing Equality Center of Pennsylvania 455 Maryland Drive, Suite 190, Fort Washington, PA 19034 Toll Free: (866) 540-FAIR (3247) Phone: (267) 419-8918 http://www.equalhousing.org

Township of Abington,
Pennsylvania
Analysis of Impediments to Fair Housing Choice Page 67 of 125
2. Pennsylvania Human Relations Commission
The Pennsylvania Human Relations Commission (PHRC) is tasked to enforce state laws that prohibit discrimination: which are the Pennsylvania Human Relations Act, and the Pennsylvania Fair Educational Opportunities Act. The Pennsylvania Fair Educational Opportunities Act, created in 1961 by the General Assembly of the Commonwealth of Pennsylvania and amended in 1992, prohibits discriminatory practices in educational institutions based on race, religion, color, ancestry, national origin, or sex. The Pennsylvania Human Relations Act was created in 1955 and amended in 1997; the Act prohibits certain discriminatory practices because of race, color, religious creed, ancestry, age, or national origin by employers, employment agencies, labor organizations, etc. This Act additionally created the Pennsylvania Human Relations Commission (PHRC) in the Governor’s Office and defined its powers; PHRC’s mission is to “not only seek to end and prevent discrimination through enforcement of the laws, but through educating Pennsylvanians on their legal rights and responsibilities” (PHRC 2011-2013 Annual Plan. PHRC investigates employment and housing discrimination complaints on behalf of the U.S. Equal Employment Opportunity Commission (EEOC) and the U.S. Department of Housing and Urban Development (HUD), respectively. The State Governor appoints eleven commissioners (confirmed by the Senate) to act as public liaisons, establish policies, and resolve cases not settled voluntarily. The commission is independent and nonpartisan, with the chairperson appointed by the governor and a vice-chairperson, secretary, and assistant secretary elected by the commissioners every year. The commission holds monthly meetings, which are open to the public, to address issues of discrimination or civil tension. The PHRC organizes the PA Interagency Task Force on Community Activities and Relations, a group of state agencies unified in preventing and stopping civil tension and violence stemming from conflicts between ethnic or cultural groups. In addition, the PHRC offers hotlines to report bias and hate crimes, as well as an online way of filing a complaint regarding discrimination; the current law
PA Human Relations Commission
Executive Offices333 Market St., 8th Floor
Harrisburg, PA 17101-2210(717) 787-4410 (Voice)
(717) 787-7279 (TTY users only)

Township of Abington,
Pennsylvania
Analysis of Impediments to Fair Housing Choice Page 68 of 125
protects citizens in matters of employment, education, public accommodations, housing, and commercial property.
The PHRC publishes an annual summary of docketed cases filed during the State’s fiscal year (July 1st – June 30th). The table below illustrates the trends for new complaints that were docketed and conciliated for Montgomery County from 2010 to 2014. In FY 2014, housing related complaints accounted for 16.99% of total complaints; since 2010, housing related complaints have accounted for 6.77% of total complaints. Housing related complaints have been steadily increasing in comparison to other types of complaints from 2010 to 2014 in Montgomery County, with the exception of the comparative decrease in housing related complaints between 2012 and 2013.
PHRC New Complaints Docketed in Montgomery County
Category 2010 2011 2012 2013 2014 Total
Employment 362 190 191 185 118 1,046
Housing 20 19 26 16 26 107
Public Accommodations 191 15 14 13 7 240
TOTALS 573 224 231 214 151 1,393
Source: Pennsylvania Human Rights Commission Annual Reports, 2010-2014
PHRC New Complaints Docketed in the Commonwealth of Pennsylvania
Category 2010 2011 2011 2013 2014 Total
Employment 4,403 2,675 2,431 1,899 1,554 12,962
Housing 293 253 243 210 184 1,183
Public Accommodations 430 160 157 103 78 928
TOTALS 5,377 3,187 2,804 2,207 1,816 15,391
Source: Pennsylvania Human Rights Commission Annual Reports, 2010-2014
PHRC Complaints Closed
Category 2010 2011 2012 2013 2014
Percentage of Complaints Closed 39.8% 56.0% 50.0% 48.6% 53%
Source: Pennsylvania Human Rights Commission Annual Reports, 2010-2014
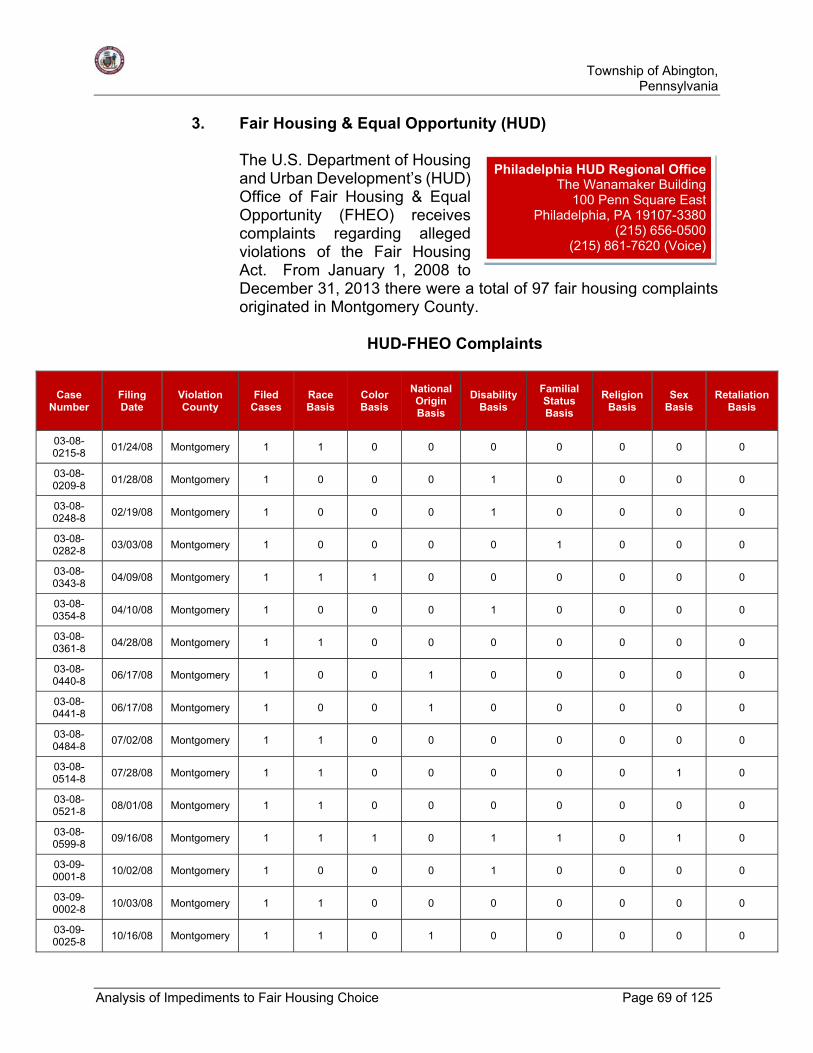
Township of Abington,
Pennsylvania
Analysis of Impediments to Fair Housing Choice Page 69 of 125
3. Fair Housing & Equal Opportunity (HUD) The U.S. Department of Housing and Urban Development’s (HUD) Office of Fair Housing & Equal Opportunity (FHEO) receives complaints regarding alleged violations of the Fair Housing Act. From January 1, 2008 to December 31, 2013 there were a total of 97 fair housing complaints originated in Montgomery County.
HUD-FHEO Complaints
Case Number
Filing Date
Violation County
Filed Cases
Race Basis
Color Basis
National Origin Basis
Disability Basis
Familial Status Basis
Religion Basis
Sex Basis
Retaliation Basis
03-08-0215-8
01/24/08 Montgomery 1 1 0 0 0 0 0 0 0
03-08-0209-8
01/28/08 Montgomery 1 0 0 0 1 0 0 0 0
03-08-0248-8
02/19/08 Montgomery 1 0 0 0 1 0 0 0 0
03-08-0282-8
03/03/08 Montgomery 1 0 0 0 0 1 0 0 0
03-08-0343-8
04/09/08 Montgomery 1 1 1 0 0 0 0 0 0
03-08-0354-8
04/10/08 Montgomery 1 0 0 0 1 0 0 0 0
03-08-0361-8
04/28/08 Montgomery 1 1 0 0 0 0 0 0 0
03-08-0440-8
06/17/08 Montgomery 1 0 0 1 0 0 0 0 0
03-08-0441-8
06/17/08 Montgomery 1 0 0 1 0 0 0 0 0
03-08-0484-8
07/02/08 Montgomery 1 1 0 0 0 0 0 0 0
03-08-0514-8
07/28/08 Montgomery 1 1 0 0 0 0 0 1 0
03-08-0521-8
08/01/08 Montgomery 1 1 0 0 0 0 0 0 0
03-08-0599-8
09/16/08 Montgomery 1 1 1 0 1 1 0 1 0
03-09-0001-8
10/02/08 Montgomery 1 0 0 0 1 0 0 0 0
03-09-0002-8
10/03/08 Montgomery 1 1 0 0 0 0 0 0 0
03-09-0025-8
10/16/08 Montgomery 1 1 0 1 0 0 0 0 0
Philadelphia HUD Regional OfficeThe Wanamaker Building
100 Penn Square EastPhiladelphia, PA 19107-3380
(215) 656-0500(215) 861-7620 (Voice)

Township of Abington,
Pennsylvania
Analysis of Impediments to Fair Housing Choice Page 70 of 125
03-09-0050-8
10/30/08 Montgomery 1 1 0 0 0 0 0 1 0
03-09-0085-8
12/01/08 Montgomery 1 0 0 0 0 1 0 0 0
03-09-0141-8
12/30/08 Montgomery 1 1 0 0 1 0 0 0 0
03-09-0196-8
01/30/09 Montgomery 1 1 0 0 0 0 0 0 0
03-09-0265-8
03/10/09 Montgomery 1 1 0 0 0 0 0 0 0
03-09-0328-8
04/28/09 Montgomery 1 0 0 0 1 0 0 0 0
03-09-0388-8
06/05/09 Montgomery 1 1 0 0 0 0 0 0 0
03-09-0449-8
07/08/09 Montgomery 1 0 0 0 1 0 0 0 0
03-09-0473-8
07/21/09 Montgomery 1 0 0 0 0 1 0 0 0
03-09-0476-8
07/22/09 Montgomery 1 0 0 0 1 0 0 0 0
03-09-0511-8
08/10/09 Montgomery 1 0 0 1 0 0 0 0 0
03-09-0519-8
08/12/09 Montgomery 1 0 0 0 1 0 0 0 0
03-09-0564-8
09/11/09 Montgomery 1 0 0 0 0 0 0 1 1
03-09-0585-8
09/24/09 Montgomery 1 0 0 0 1 0 0 0 0
03-10-0006-8
10/06/09 Montgomery 1 1 0 0 0 0 0 0 0
03-10-0115-8
01/07/10 Montgomery 1 1 0 0 0 0 0 0 0
03-10-0142-8
01/21/10 Montgomery 1 0 0 0 0 1 0 0 0
03-10-0166-8
02/12/10 Montgomery 1 1 0 0 0 0 0 0 0
03-10-0332-8
05/24/10 Montgomery 1 0 0 0 0 1 0 0 0
03-10-0416-8
07/06/10 Montgomery 1 0 0 0 1 0 0 0 0
03-10-0556-8
08/23/10 Montgomery 1 0 0 0 1 0 0 0 0
03-11-0071-8
11/29/10 Montgomery 1 1 0 0 0 0 0 0 0
00-11-0017-8
12/06/10 Montgomery 1 1 0 1 0 0 0 0 0
03-11-0117-8
01/06/11 Montgomery 1 1 0 0 0 0 0 0 0
03-11-0120-8
01/07/11 Montgomery 1 0 0 0 1 0 0 0 0
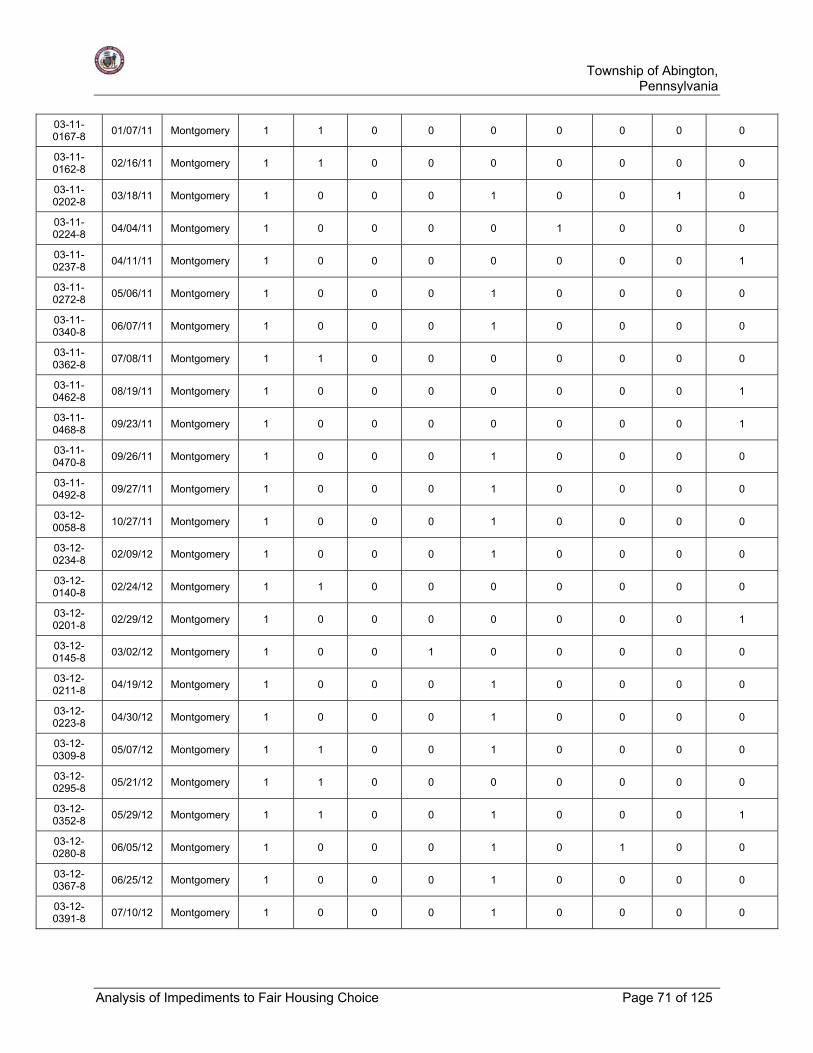
Township of Abington,
Pennsylvania
Analysis of Impediments to Fair Housing Choice Page 71 of 125
03-11-0167-8
01/07/11 Montgomery 1 1 0 0 0 0 0 0 0
03-11-0162-8
02/16/11 Montgomery 1 1 0 0 0 0 0 0 0
03-11-0202-8
03/18/11 Montgomery 1 0 0 0 1 0 0 1 0
03-11-0224-8
04/04/11 Montgomery 1 0 0 0 0 1 0 0 0
03-11-0237-8
04/11/11 Montgomery 1 0 0 0 0 0 0 0 1
03-11-0272-8
05/06/11 Montgomery 1 0 0 0 1 0 0 0 0
03-11-0340-8
06/07/11 Montgomery 1 0 0 0 1 0 0 0 0
03-11-0362-8
07/08/11 Montgomery 1 1 0 0 0 0 0 0 0
03-11-0462-8
08/19/11 Montgomery 1 0 0 0 0 0 0 0 1
03-11-0468-8
09/23/11 Montgomery 1 0 0 0 0 0 0 0 1
03-11-0470-8
09/26/11 Montgomery 1 0 0 0 1 0 0 0 0
03-11-0492-8
09/27/11 Montgomery 1 0 0 0 1 0 0 0 0
03-12-0058-8
10/27/11 Montgomery 1 0 0 0 1 0 0 0 0
03-12-0234-8
02/09/12 Montgomery 1 0 0 0 1 0 0 0 0
03-12-0140-8
02/24/12 Montgomery 1 1 0 0 0 0 0 0 0
03-12-0201-8
02/29/12 Montgomery 1 0 0 0 0 0 0 0 1
03-12-0145-8
03/02/12 Montgomery 1 0 0 1 0 0 0 0 0
03-12-0211-8
04/19/12 Montgomery 1 0 0 0 1 0 0 0 0
03-12-0223-8
04/30/12 Montgomery 1 0 0 0 1 0 0 0 0
03-12-0309-8
05/07/12 Montgomery 1 1 0 0 1 0 0 0 0
03-12-0295-8
05/21/12 Montgomery 1 1 0 0 0 0 0 0 0
03-12-0352-8
05/29/12 Montgomery 1 1 0 0 1 0 0 0 1
03-12-0280-8
06/05/12 Montgomery 1 0 0 0 1 0 1 0 0
03-12-0367-8
06/25/12 Montgomery 1 0 0 0 1 0 0 0 0
03-12-0391-8
07/10/12 Montgomery 1 0 0 0 1 0 0 0 0

Township of Abington,
Pennsylvania
Analysis of Impediments to Fair Housing Choice Page 72 of 125
03-12-0336-8
07/11/12 Montgomery 1 0 0 0 1 0 0 0 0
03-12-0392-8
07/19/12 Montgomery 1 0 0 0 1 0 0 0 0
03-12-0426-8
07/31/12 Montgomery 1 0 0 0 1 0 0 0 0
03-12-0414-8
08/06/12 Montgomery 1 0 0 0 1 0 0 0 0
03-12-0438-8
08/28/12 Montgomery 1 1 0 0 0 1 0 0 0
03-12-0401-8
08/31/12 Montgomery 1 1 0 0 0 0 0 0 0
03-12-0437-8
09/20/12 Montgomery 1 0 0 0 0 1 0 0 0
03-13-0005-8
10/05/12 Montgomery 1 1 1 1 0 0 0 0 0
03-13-0030-8
11/01/12 Montgomery 1 1 0 0 1 0 0 0 0
03-13-0066-8
11/02/12 Montgomery 1 1 0 0 0 0 0 0 0
03-13-0054-8
11/23/12 Montgomery 1 0 0 0 1 0 0 0 0
03-13-0057-8
11/28/12 Montgomery 1 0 0 0 1 0 0 0 0
03-13-0074-8
12/04/12 Montgomery 1 0 0 0 1 0 0 0 0
03-13-0083-8
12/06/12 Montgomery 1 0 0 0 0 1 0 0 0
03-13-0106-8
12/19/12 Montgomery 1 1 0 0 0 0 0 0 0
03-13-0177-8
03/07/13 Montgomery 1 0 0 0 1 0 0 0 0
03-13-0264-8
05/29/13 Montgomery 1 0 0 0 0 1 0 0 0
03-13-0277-8
06/05/13 Montgomery 1 0 0 0 0 0 0 1 0
03-13-0303-8
06/27/13 Montgomery 1 0 0 0 0 1 0 0 0
03-13-0430-8
07/09/13 Montgomery 1 1 0 0 1 0 0 0 0
03-13-0310-8
07/11/13 Montgomery 1 0 0 0 1 0 0 0 0
03-13-0342-8
07/12/13 Montgomery 1 1 0 0 1 0 0 0 0
03-13-0314-8
07/15/13 Montgomery 1 0 0 0 0 0 0 1 0
03-13-0428-8
07/15/13 Montgomery 1 0 0 0 0 0 0 0 1
03-13-0340-8
07/16/13 Montgomery 1 0 0 0 0 0 0 0 1
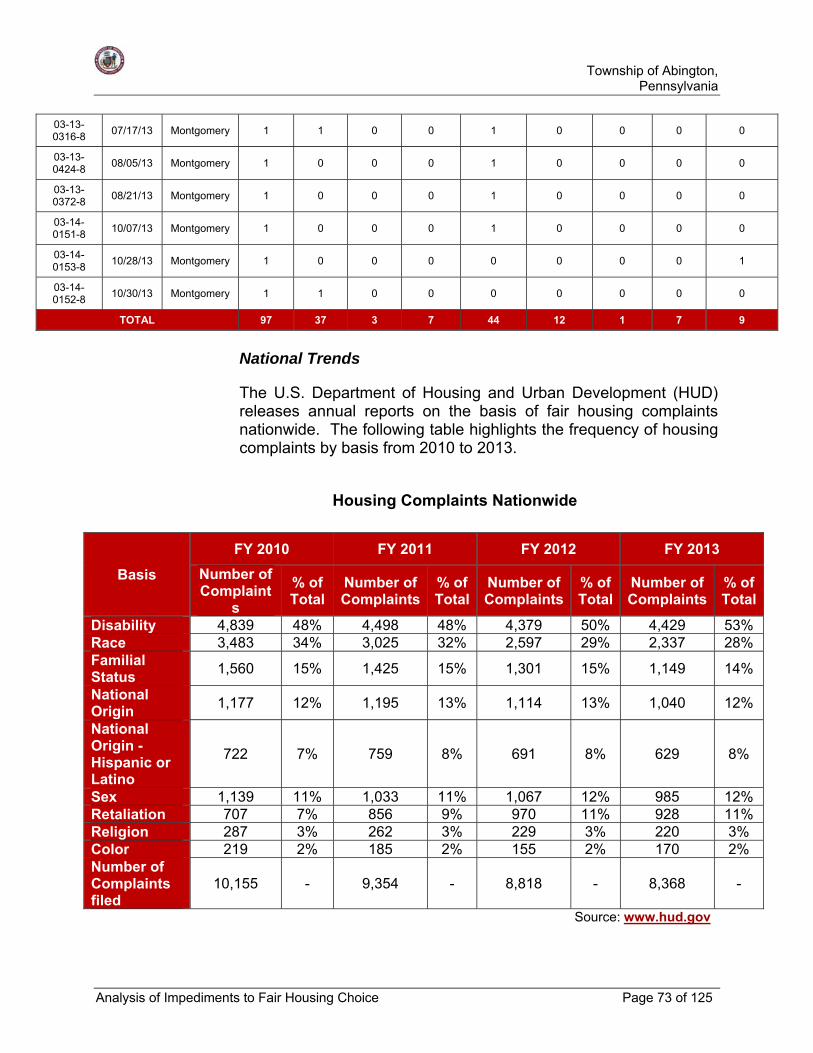
Township of Abington,
Pennsylvania
Analysis of Impediments to Fair Housing Choice Page 73 of 125
03-13-0316-8
07/17/13 Montgomery 1 1 0 0 1 0 0 0 0
03-13-0424-8
08/05/13 Montgomery 1 0 0 0 1 0 0 0 0
03-13-0372-8
08/21/13 Montgomery 1 0 0 0 1 0 0 0 0
03-14-0151-8
10/07/13 Montgomery 1 0 0 0 1 0 0 0 0
03-14-0153-8
10/28/13 Montgomery 1 0 0 0 0 0 0 0 1
03-14-0152-8
10/30/13 Montgomery 1 1 0 0 0 0 0 0 0
TOTAL 97 37 3 7 44 12 1 7 9
National Trends
The U.S. Department of Housing and Urban Development (HUD) releases annual reports on the basis of fair housing complaints nationwide. The following table highlights the frequency of housing complaints by basis from 2010 to 2013.
Housing Complaints Nationwide
Basis
FY 2010 FY 2011 FY 2012 FY 2013
Number of Complaint
s
% of Total
Number of Complaints
% of Total
Number of Complaints
% of Total
Number of Complaints
% of Total
Disability 4,839 48% 4,498 48% 4,379 50% 4,429 53% Race 3,483 34% 3,025 32% 2,597 29% 2,337 28% Familial Status
1,560 15% 1,425 15% 1,301 15% 1,149 14%
National Origin
1,177 12% 1,195 13% 1,114 13% 1,040 12%
National Origin - Hispanic or Latino
722 7% 759 8% 691 8% 629 8%
Sex 1,139 11% 1,033 11% 1,067 12% 985 12% Retaliation 707 7% 856 9% 970 11% 928 11% Religion 287 3% 262 3% 229 3% 220 3% Color 219 2% 185 2% 155 2% 170 2% Number of Complaints filed
10,155 - 9,354 - 8,818 - 8,368 -
Source: www.hud.gov

Township of Abington,
Pennsylvania
Analysis of Impediments to Fair Housing Choice Page 74 of 125
Much like housing complaints in Montgomery County in the past few years, complaints based on disability and race are the most common causes for complaints across the nation, with complains based on sex beginning to have a larger proportional share as well. Note that the total percentages for each year do not equal 100% and that the number of complaints each year does not equal the total number of complaints per basis. The reason for this is that most housing complaints reported are based on multiple factors and as such all sources of complaints are recorded.
4. Legal Aid of Southeastern PA
Legal Aid of Southeastern PA (LASP) serves Bucks, Chester, Delaware, and Montgomery Counties. The LASP stated mission is: “To provide quality legal representation to low-income and vulnerable people in Bucks, Chester, Delaware and Montgomery County, to empower them to solve problems without legal representation through legal education and increased access to the courts, and to change community practices and systems that cause or aggravate poverty.” LASP provides free legal services and advising to those who are eligible based on finances, residency, and the type of issue requiring assistance. Those seeking help are encouraged to call the toll-free hotline for more information regarding what actions they should take. LASP has access to interpreters for over 150 languages and several Spanish-speaking staff members. Links to legal information on some topics, such as disability, immigrant issues, and health law, are available on the website. Along with these topics, general legal information on housing is available online. Brochures with more detailed information relating to rights and procedures are available by contacting LASP. Examples of legal information that LASP provides regarding housing issues include: landlord/tenant law, evictions, security deposits, public housing, utility law, LIHEAP, and preventing foreclosure. It is unclear from this list whether housing discrimination cases are advised or handled through this organization.
5. Housing and Human Services Agencies
Agencies offering housing and human services within the Township were contacted and interviewed in order to obtain their input and gain
Legal Aid of Southeastern PA625 Swede Street
Norristown, PA 19401(610) 275-4500

Township of Abington,
Pennsylvania
Analysis of Impediments to Fair Housing Choice Page 75 of 125
insight into potential impediments to fair housing in the Township of Abington. A summary pf agency input can be found in Appendix D.
B. Public Sector:
Part of the Analysis of Impediments is to examine the public policies of the jurisdiction and the impact on fair housing choice. The local government controls land use and development through the comprehensive plan, zoning regulations, subdivision regulations, and other laws and ordinances passed by the local governing body. These regulations and ordinances govern the types of housing that may be constructed, the density of housing, and the various residential uses in a community. Local officials determine the community’s commitment to housing goals and objectives. The local policies therefore determine if fair housing is to be promoted or passively tolerated. This section of the Analysis of Impediments evaluates the Township’s policies to determine if there is a commitment to affirmatively further fair housing.
1. CDBG Program -
The objective of the Five Year Consolidated Plan is to serve as a consolidated planning document, an application, and a strategic plan for the Township of Abington. The following six (6) priorities and subsequent goals/strategies have been identified for the Township of Abington, PA for the period of FY 2015 through FY 2019 for the Community Development Block Grant (CDBG) Program:
Housing Priority – (High Priority)
Priority Need: There is a need to improve the quality of the housing stock in the community by increasing the amount of decent, safe, sound, and accessible housing for homeowners, renters, and homebuyers that is affordable to low- and moderate-income persons and families.
Goals:
HS-1 Housing Rehabilitation - Continue to provide financial assistance to low- and moderate-income homeowners to rehabilitate their existing owner-occupied housing.
HS-2 Rental Rehabilitation - Provide financial assistance to affordable housing providers to rehabilitate housing units that are rented to low- and moderate-income tenants.

Township of Abington,
Pennsylvania
Analysis of Impediments to Fair Housing Choice Page 76 of 125
HS-3 Housing Construction - Increase the supply of decent, safe, sound, and accessible housing that is affordable to owners and renters in the community through rehabilitation of vacant buildings and new construction.
HS-4 Fair Housing - Promote fair housing choice through education and outreach in the community.
HS-5 Home Ownership - Assist low- and moderate-income households to become homeowners by providing down payment assistance, closing cost assistance, and requiring housing counseling training.
HS-6 Public Housing - Support the local public housing authority in its efforts to improve and maintain the existing public housing communities, and promote homeownership programs through the use of Section 8 Vouchers for home purchase.
Homeless Priority – (Low Priority)
Priority Need: There is a need for housing and support services for homeless persons, and persons who are at-risk of becoming homeless.
Goals:
HO-1 Continuum of Care - Support the local Continuum of Care’s (CoC) efforts to provide emergency shelter, transitional housing, and permanent supportive housing to persons and families who are homeless or who are at risk of becoming homeless.
HO-2 Operation/Support - Assist providers in the operation of housing and support services for the homeless and persons at-risk of becoming homeless.
HO-3 Prevention and Housing - Continue to support the prevention of homelessness and programs for rapid rehousing.
HO-4 Housing - Support the rehabilitation of and making accessibility improvements to emergency shelters, transitional housing and permanent housing for the homeless.
HO-5 Permanent Housing - Support the development of permanent supportive housing for homeless individuals and families.

Township of Abington,
Pennsylvania
Analysis of Impediments to Fair Housing Choice Page 77 of 125
Other Special Needs Priority – (High Priority)
Priority Need: There is a continuing need for affordable housing, services, and facilities for persons with special needs and the disabled.
Goals:
SN-1 Housing - Increase the supply of affordable, decent, safe, sound, and accessible housing for the elderly, persons with disabilities, and persons with other special needs through rehabilitation of existing buildings and new construction.
SN-2 Social Services - Support social service programs and facilities for the elderly, persons with disabilities, and persons with other special needs.
SN-3 Accessibility - Improve the accessibility of owner occupied housing through rehabilitation and improve renter occupied housing by making reasonable accommodations for the physically disabled.
Community Development Priority – (High Priority)
Priority Need: There is a need to improve the public and community facilities, infrastructure, public services, and the quality of life for all residents in the community.
Goals:
CD-1 Community Facilities - Improve the parks, recreational centers, trails, libraries, and all public and community facilities in the municipality.
CD-2 Infrastructure - Improve the public infrastructure through rehabilitation, reconstruction, and new construction.
CD-3 Public Services - Improve and increase public safety, municipal services, and public service programs throughout the community.
CD-4 Accessibility - Improve the physical and visual accessibility of community facilities, infrastructure, and public buildings.
CD-5 Public Safety - Improve the public safety facilities, equipment, and ability to respond to emergency situations.

Township of Abington,
Pennsylvania
Analysis of Impediments to Fair Housing Choice Page 78 of 125
CD-6 Code Enforcement - Enforce the local codes and ordinances to bring buildings into compliance with the standards through systematic code enforcement.
CD-7 Clearance - Remove and eliminate slum and blighting conditions through demolition of vacant, abandoned and dilapidated structures.
CD-8 Revitalization - Promote neighborhood revitalization in strategic areas through acquisition, demolition, rehabilitation, code enforcement, infrastructure improvements, housing construction, public and community facilities improvements, etc.
CD-9 Historic Preservation - Promote historic preservation and adaptive reuse of existing buildings in the community through financial incentives.
CD-10 Community Policing - Improve neighborhoods by having the Police Department work cooperatively with residents and community based organizations to identify and resolve issues affecting the neighborhood.
Economic Development Priority – (Low Priority)
Priority Need: There is a need to increase employment, self-sufficiency, education, job training, technical assistance, and economic empowerment of low and moderate income residents in the community.
Goals:
ED-1 Employment - Support and encourage new job creation, job retention, employment, and job training services.
ED-2 Financial Assistance - Support business and commercial growth through expansion and new development through technical assistance programs and low interest loans.
ED-3 Redevelopment Program - Plan and promote the development and redevelopment of the downtown business district.
ED-4 Financial Incentives - Support and encourage new economic development through local, state and Federal tax incentives and programs such as Tax Incremental Financing (TIP), tax abatements (LERTA), Enterprise Zones/Entitlement Communities, Section 108 Loan Guarantees, Economic Development Initiative (EDI) funds, etc.

Township of Abington,
Pennsylvania
Analysis of Impediments to Fair Housing Choice Page 79 of 125
Administration, Planning, and Management Priority – (High Priority)
Priority Need: There is a continuing need for planning, administration, management, and oversight of Federal, state, and local funded programs.
Goals:
AM-1 Overall Coordination - Provide program management and oversight for the successful administration of Federal, state, and local funded programs, including planning services for special studies, environmental clearance, fair housing, and compliance with all Federal, state, and local laws and regulations.
The Township of Abington receives CDBG funds from HUD as an entitlement Township under the program. The Township will receive $706,700 in CDBG funds in FY 2015. The Township allocates its funds to public facility improvements, public services, senior services, youth services, and emergency housing assistance. All of the CDBG funds directed towards public services, or 80% of the Township’s CDBG funds, directly benefit low- and moderate-income persons.
In order to address the identifiable needs of the Township of Abington, the proposed FY 2015 One-Year Action Plan proposes the following activities:
AM-1 Overall Coordination
Administration $ 140,000
Abington Human Relations Commission (Training, Seminars, Outreach & Educational Programs)
$ 2,000
Total $ 142,000
HS-1 Housing Rehabilitation
Owner-Occupied Rehabilitation $ 116,700
Total $ 116,700
HS-2 Rental Rehabilitation and HS-3 Housing Construction
Crest Manor $ 153,000

Township of Abington,
Pennsylvania
Analysis of Impediments to Fair Housing Choice Page 80 of 125
Total $ 153,000
CD-2 Infrastructure
Street Improvements $ 295,000
Total $ 295,000
Total FY 2015 CDBG Funds for Project Activities
$ 706,700
2. Other Funds -
HOME Program The Township does not receive a HOME allocation from the U.S. Department of HUD. The Township has received HOME allocations from the Pennsylvania Department of Community and Economic Development Department in previous years. Through the last DCED HOME allocation, the Township rehabilitated three (3) owner-occupied units and currently the Township has about $100,000 remaining in DCED HOME funds allocated to three (3) additional owner-occupied housing rehabilitation activities that are expected to commence construction the end of 2015. Currently, there are no HOME applications pending. Low Income Housing Tax Credit The Low Income Housing Tax Credit (LIHTC) Program was created under the Tax Reform Act of 1986 and is intended to attract private investment to develop affordable rental housing for low- and moderate-income households. This program provides a dollar-for-dollar tax credit to reduce the developer’s Federal income tax.
Montgomery County is supportive of the use of Low Income Housing Tax Credit (LIHTC) projects to provide housing that is affordable to low income households. There are twenty-one (21) LIHTC projects with 821 LIHTC units in Montgomery County. However, there currently are no known, proposed, or planned projects in the Township of Abington, which is probably due to the fact that Abington is almost a totally developed environment and has less than 2% of its land area as vacant or unimproved.
The chart below illustrates which LIHTC projects in Montgomery County:

Township of Abington,
Pennsylvania
Analysis of Impediments to Fair Housing Choice Page 81 of 125
LIHTC in Montgomery County
HUD ID Number:
Project Name: Project
Address: Project Township:
Project State:
Project ZIP
Code:
Total Number of Units:
Total Low-
Income Units:
PAA1987210 618-620 CHERRY
ST. 618 CHERRY
ST NORRISTOWN PA 19401 4 4
PAA1989105 1802 E. RIDGE
PIKE 1802 E RIDGE
PIKE ROYERSFORD PA 19468 4 4
PAA1989215 246 MAPLE
AVENUE 246 W MAPLE
ST AMBLER PA 19002 1 1
PAA1989455 829 SWEDE ST. 829 SWEDE
ST NORRISTOWN PA 19401 3 3
PAA1989765 ROLLING HILLS 2120
BUCHERT RD SANATOGA PA 19464 232 231
PAA1990080 311 N. FRANKLIN
ST. 311 N
FRANKLIN ST POTTSTOWN PA 19464 2 2
PAA1990150 611 GREEN
STREET 611 GREEN ST NORRISTOWN PA 19401 1 1
PAA1991405 FORD
APARTMENTS 159 MAIN ST ROYERSFORD PA 19468 9 9
PAA1993010 1402 DRAYTON
LANE 1402
DRAYTON LN WYNNEWOOD PA 19096 3 3
PAA1993240 POWELL 224
DUPLEX REHAB 224 E
HECTOR ST CONSHOHOCKEN PA 19428 2 2
PAA1993275 RAHN'S
HORIZON III 12 SCHOOL HOUSE RD
COLLEGEVILLE PA 19426 3 3
PAA1993330 STEPS - KING
STREET 519 KING ST POTTSTOWN PA 19464 10 10
PAA1997005 13 ST. ASAPH'S
ROAD 13 SAINT
ASAPHS RD BALA CYNWYD PA 19004 6 6
PAA2000075 LIMERICK
GREEN 827 N LEWIS
RD LIMERICK PA 19468 80 80
PAA2001010 AMBLER MANOR
APARTMENTS 32 N MAIN ST AMBLER PA 19002 60 60
PAA2001145 PARKVIEW AT OAK CREST
560 OAK DR HARLEYSVILLE PA 19438 100 99
PAA2003090 JEFFERSON
APARTMENTS 250 HALE ST POTTSTOWN PA 19464 46 46
PAA2003185 VILLAS AT RED
HILL 550 SINGER
WAY RED HILL PA 18076 68 67
PAA2006005 ARDMORE
CROSSING APTS
213 W COUNTY LINE
RD ARDMORE PA 19003 53 53
PAA2006120 PARK VIEW AT CHELTENHAM
990 ASHBOURNE
RD ELKINS PARK PA 19027 75 74
PAA2008155 SCHWENCKFELD
MEWS
1292 ALLENTOWN
RD LANSDALE PA 19446 63 63
Source: http://lihtc.huduser.org/
Township of Abington,
Pennsylvania
Analysis of Impediments to Fair Housing Choice Page 82 of 125
3. Planning, Zoning, and Building Codes -
Township of Abington: The Montgomery County Regional Planning Commission prepared a Zoning Ordinance for the Township of Abington in 2006, which was adopted by the Township on September 28, 2006. A “draft” Zoning Ordinance was prepared in 2014 to revise the existing zoning ordinance. For the purpose of this Analysis of Impediments, the proposed “draft” zoning ordinance has been reviewed for conformance with the Fair Housing Act, as amended, and current HUD policies and regulations. The Township of Abington should review the proposed “draft” zoning ordinance and make the following revisions prior to its adoption: Article I: Section 102. General Purpose and Intent: add “M.”
– Abide by the provisions of the Fair Housing Act of 1968, as amended, by promoting fair housing choice for all residents in the Township, assure the rights of all individuals who are identified as members of a protected class by the Federal
Government, and therefore affirmatively further fair housing. The “draft” zoning ordinance does not appear to contain any discriminatory language, however, several definitions need to be added to the document and other definitions should be revised. These definitions should be reviewed by the planning staff and solicitor for conformance with the Fair Housing Act, as amended.
Article II: Section 201. SPECIFIC DEFINITIONS. Add the
following:
- Accessibility: the ease of access to and around the exterior and interior of a building or facility without obstruction to a person who may be physically disabled. - Visitability: the basic level of accessibility that enables persons with disabilities to visit the home or housing unit of a friend, family member, or neighbor. - Disabled/Handicapped: Disabled means “handicapped” as defined according to the Fair Housing Act Amendments of 1988. 42 U.S.C.S. Subsection 3602 (h), and any amendments thereto. Federal laws define a person with a disability as “Any person who has a physical or mental impairment that substantially limits one or more major life activities; has a
Township of Abington,
Pennsylvania
Analysis of Impediments to Fair Housing Choice Page 83 of 125
record of such impairment; or is regarded as having such an impairment.” In general, a physical or mental impairment includes hearing, mobility and visual impairments, chronic alcoholism, chronic mental illness, AIDS, AIDS Related Complex, and mental retardation that substantially limits one or more major life activities. Major life activities include walking, talking, hearing, seeing, breathing, learning, performing manual tasks, and caring for oneself.’
- Group Care Facility: A facility which provides services to six (6) or more individuals who are mentally or physically handicapped, homeless, disabled, or undergoing rehabilitation, and are provided a program to meet their needs. When required, or available, Group Care Facilities must be licensed by appropriate Federal, State, or County health/welfare agencies. Group Care Facility is not a “family” as defined by this Ordinance, but is a conditional use in Residential Districts. Neither is a Group Care Facility a nursing home or senior citizen housing, which are regulated separately.”
The definition of “family” should be revised and clarified.
- Family: One or more persons related by blood, marriage, or adoption, or a group of not more than five (5) unrelated disabled persons living together as a single housekeeping unit in a dwelling unit and sharing common facilities as considered reasonably appropriate for a family related by blood, marriage or adoption. If appropriate, one (1) staff person may or may not reside on the premises and will not be counted in the total number of occupants of the dwelling unit.
If the definition of “family” is revised and includes a group of 5 or less disabled persons, then that group of unrelated individuals will be allowed by right to live in any residential zoning district in the Township. However, a “Group Care Facility” will have to abide by the higher density residential provision of the zoning ordinance. Article XXI: Section 2103. Categories of Permitted Uses – Use E-7: Group Home/Personal Care Home: The Use Regulations are too vague and general and should be more specific. In the case of a Group Care facility for the disabled, the facility may contain six (6) or more residents and should be considered a multi-family use

Township of Abington,
Pennsylvania
Analysis of Impediments to Fair Housing Choice Page 84 of 125
and permitted in multi-family zoning districts. It is permitted in the R1, R2, R3 and R4 Districts but not in the RC District. In its 2009 Analysis of Impediments to Fair Housing Choice, the Township of Abington identified one impediment to Fair Housing that directly related to the Township’s planning, zoning, and building codes; this impediment was first identified in the Township of Abington’s 1996 Analysis of Impediments to Fair Housing Choice: Act, in the following areas:
Land Use Ordinances – Many of the Township’s regulations are outdated and could serve as impediments to fair housing for the protected classes.
The 2009 A.I. review of the Zoning Ordinance did not identify what language it considered to be restrictive, in accordance with the Fair Housing Act.
The Zoning Ordinance was reviewed and revised as necessary, to bring it into compliance with the Federal Fair Housing Act, as revised. The Township has adopted the Pennsylvania State Building Code which contains the 2009 International Building Code Amendments. U.S. Department of Housing and Urban Development (HUD): HUD encourages its grantees to incorporate “visitability” principles into their designs. Housing that is “visitable” has the most basic level of accessibility that enables persons with disabilities to visit the home of a friend, family member, or neighbor. “Visitable” homes have at least one accessible means of egress/ingress for each unit, and all interior and bathroom doorways have 32-inch clear openings. At a minimum, HUD grantees are required to abide by all Federal laws governing accessibility for disabled persons.
Federal Requirements: Federal laws governing accessibility requirements include Section 504 of the Rehabilitation Act, the Americans with Disabilities Act, and the Fair Housing Act.
Section 504 of the Rehabilitation Act (24 CFR Part 8), known as “Section 504” prohibits discrimination against persons with disabilities in any program receiving Federal funds. Specifically, Section 504 concerns the design and construction of housing to

Township of Abington,
Pennsylvania
Analysis of Impediments to Fair Housing Choice Page 85 of 125
ensure that a portion of all housing developed with Federal funds is accessible to those with mobility, visual, and hearing impairments.
The Americans with Disabilities Act (42 U.S.C. 12131; 47 U.S.C. 155, 201, 218, and 225) (ADA) prohibits discrimination against persons with disabilities in all programs and activities sponsored by state and local governments. Specifically, ADA gives HUD jurisdiction over housing discrimination against persons with disabilities.
The Fair Housing Act was amended in 1988 to include persons with disabilities as a protected class, as well as to include design and construction requirements for housing developed with private or public funds. Specifically, this law requires property owners to make reasonable modifications to units and/or public areas in order to allow the disabled tenant to make full use of the unit. Additionally, property owners are required to make reasonable accommodations to rules or procedures to afford a disabled tenant full use of the unit. As it relates to local zoning ordinances, the Fair Housing Act prohibits local government from making zoning or land use decisions, or implementing land use policies that exclude or discriminate against persons of a protected class.
4. Environmental Justice –
Federal Executive Order 12898, "Federal Actions to Address Environmental Justice in Minority Populations and Low-Income Populations" dated February 11, 1994 focuses attention on the environmental and human health conditions of minority and low-income populations with the goal of achieving environmental protection for all communities. The Order directs federal entitlement communities to develop environmental justice strategies to help those communities address disproportionately high and adverse human health or environmental effects of their programs on minority and low-income populations. The order is also intended to promote nondiscrimination in federal programs that affect human health and the environment and aims to provide minority and low-income communities’ access to public information and public participation in matters relating to human health and the environment. For HUD, environmental justice means equal access to safe and healthy housing for all; mitigating risks to communities in disaster-prone areas; improving access to affordable, quality housing free of hazards to residents’ health; and working to achieve inclusive, sustainable communities free from discrimination. (Source: 2012-2015 HUD Environmental Justice Strategy dated March 30, 2012)
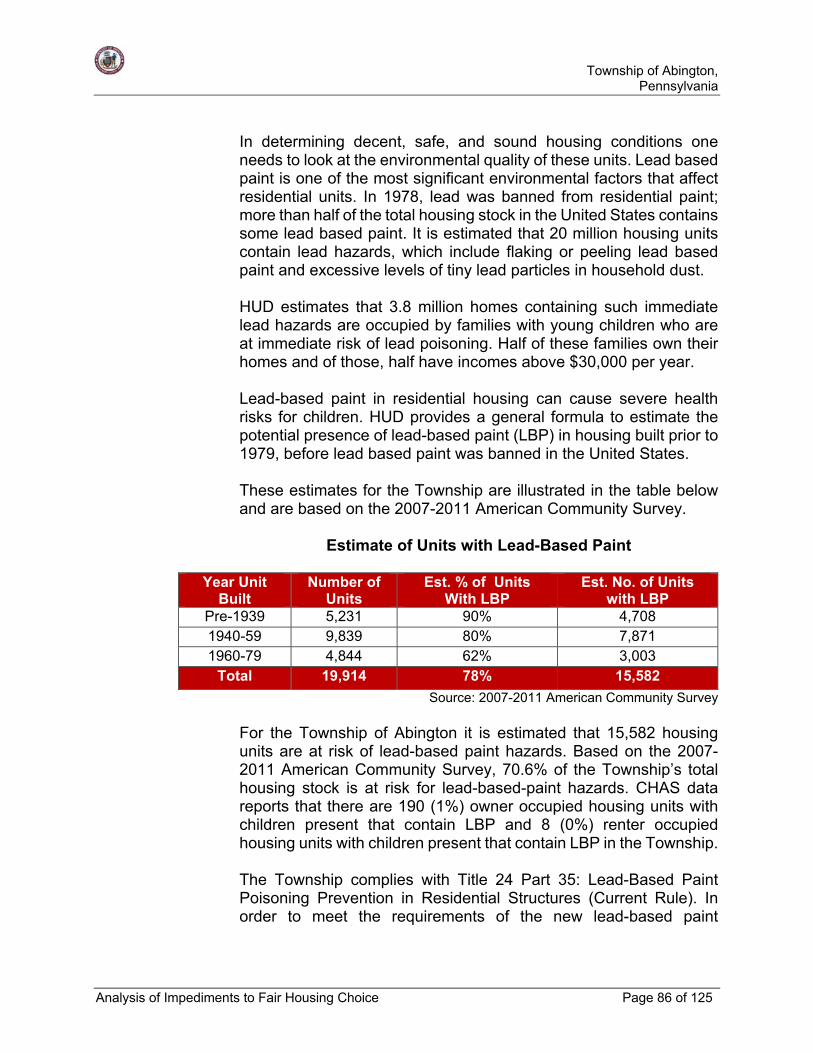
Township of Abington,
Pennsylvania
Analysis of Impediments to Fair Housing Choice Page 86 of 125
In determining decent, safe, and sound housing conditions one needs to look at the environmental quality of these units. Lead based paint is one of the most significant environmental factors that affect residential units. In 1978, lead was banned from residential paint; more than half of the total housing stock in the United States contains some lead based paint. It is estimated that 20 million housing units contain lead hazards, which include flaking or peeling lead based paint and excessive levels of tiny lead particles in household dust. HUD estimates that 3.8 million homes containing such immediate lead hazards are occupied by families with young children who are at immediate risk of lead poisoning. Half of these families own their homes and of those, half have incomes above $30,000 per year. Lead-based paint in residential housing can cause severe health risks for children. HUD provides a general formula to estimate the potential presence of lead-based paint (LBP) in housing built prior to 1979, before lead based paint was banned in the United States. These estimates for the Township are illustrated in the table below and are based on the 2007-2011 American Community Survey.
Estimate of Units with Lead-Based Paint
Year Unit Built
Number of Units
Est. % of Units With LBP
Est. No. of Units with LBP
Pre-1939 5,231 90% 4,708 1940-59 9,839 80% 7,871 1960-79 4,844 62% 3,003
Total 19,914 78% 15,582
Source: 2007-2011 American Community Survey For the Township of Abington it is estimated that 15,582 housing units are at risk of lead-based paint hazards. Based on the 2007-2011 American Community Survey, 70.6% of the Township’s total housing stock is at risk for lead-based-paint hazards. CHAS data reports that there are 190 (1%) owner occupied housing units with children present that contain LBP and 8 (0%) renter occupied housing units with children present that contain LBP in the Township. The Township complies with Title 24 Part 35: Lead-Based Paint Poisoning Prevention in Residential Structures (Current Rule). In order to meet the requirements of the new lead-based paint

Township of Abington,
Pennsylvania
Analysis of Impediments to Fair Housing Choice Page 87 of 125
regulations the Township of Abington will take the following actions regarding housing rehabilitation: Applicants for rehabilitation funding receive the required lead-
based paint information and understand their responsibilities. Staff properly determines whether proposed projects are
exempt from some or all lead-based paint requirements. The level of Federal rehabilitation assistance is properly
calculated and the applicable lead-based paint requirements determined.
Properly qualified personnel perform risk management, paint testing, lead hazard reduction, and clearance services when required.
Required lead hazard reduction work and protective measures are incorporated into project rehabilitation specifications.
Risk assessment, paint testing, lead hazard reduction, and clearance work are performed in accordance with the applicable
Standards established in 24 CFR Part 35, Subpart R. Required notices regarding lead-based paint evaluation,
presumption, and hazard reduction are provided to occupants and documented.
Program documents establish the rental property owner's responsibility to perform and document ongoing lead-based paint maintenance activities, when applicable.
Program staff monitors owner compliance with ongoing lead-based paint maintenance activities.
5. Taxes -
Real estate property taxes also impact housing affordability. This may not be an impediment to fair housing choice but it does impact the affordability of housing.
The Township’s tax assessments are set by the County; therefore the Township does not have any control over the assessed value. The last time a county-wide reassessment was done was 1996. The assessment is the basis used by the County and Township to levy taxes by multiplying the millage rate of the taxing authority times the assessment. The following equations apply:
Market Value X Assessment Ratio = Assessment

Township of Abington,
Pennsylvania
Analysis of Impediments to Fair Housing Choice Page 88 of 125
Assessment X Millage Rate = Taxes
Currently, all assessments are set at 100% of the 1996 base year value. The following tables represent the 2015 Real Estate and Township taxes for Abington residents:
Real Estate Taxes 2015 Mils
Abington Township 3.9711
Abington School District (07/01/11 to 06/30/12)
29.89
Montgomery County 3.152
Total 37.0131
Breakdown of Township Taxes Mils
General 2.1177
Fire Tax (to support Abington Volunteer Companies)
0.641
Library Tax 0.43
Debt Service 0.52
Ambulance Service 0.01
Parks & Recreation Tax 0.2524
Total 3.9711
According to “City-Data.com,” the median real estate property taxes paid in Montgomery County for housing units with mortgages in 2009 was $3,936 (1.3%). Meanwhile, the median real estate property taxes paid for housing units with no mortgage in 2009 was $3,417 (1.2%).
6. Public Housing -
The Montgomery County Housing Authority (MCHA) is the public housing agency that serves the Township of Abington. The

Township of Abington,
Pennsylvania
Analysis of Impediments to Fair Housing Choice Page 89 of 125
Montgomery County Housing Authority owns and operates seven public housing communities. There are a total of 616 housing units in the public housing communities through Montgomery County. Roughly one quarter of the public housing units are reserved for the elderly. There is one public housing community in Abington, Crest Manor. Since, 1963 the Montgomery County Housing Authority (MCHA) has owned and managed Crest Manor, located in Abington, as rental housing for very low income households. Today, over fifty (50) years after its construction, Crest Manor is in need of critical functional and aesthetic improvements in order to preserve the development's sustained habitability as a vibrant, affordable asset to the Crestmont neighborhood, Abington Township and Montgomery County. Through competitive procurement, the MCHA partnered with Pennrose Properties, LLC (Pennrose) to redevelop and revitalize Crest Manor. The partnership, Crest Manor Housing LP, submitted an application for Low Income Housing Tax Credits ("LIHTC") to the Pennsylvania Housing Finance Agency ("PHF A"). The partnership plans on investing over $17 million, through the combination federal, state and local funds, to completely revitalize Crest Manor. As part of its financing plan, the MCHA together with Pennrose requested $200,000 in Community Development Block Grant (CDBG) funds from the Township to support the redevelopment of Crest Manor. Crest Manor's proposed plans call for comprehensive rehabilitation of thirty-four (34) existing twin homes and the new construction of twelve (12) one-bedroom units for a total of forty-six (46) units, an increase of six (6) total units from the current condition. Bedroom sizes will vary from one to five (5)-bedroom units. A newly constructed, high-quality community building with management, maintenance, amenity space, and a computer lab is included in the plans. The property, while increasing the number of affordable units it offers, also alleviates stress on the existing flood plain at Hamilton and Washington Avenues by demolishing two structures and building in its place tot-lot and playground. Additionally, the Housing Authority administers 2,814 Housing Choice Vouchers for low- to moderate-income households for rental units in the Municipality and surrounding region. The Housing Authority also administers Veteran Affairs Supportive Housing (VASH) and Family Unification Program (FUP) Vouchers. According to the Montgomery County Housing Authority’s Five Year Plan for the period of 2015 - 2019, the goals of the Housing Authority are as follows:

Township of Abington,
Pennsylvania
Analysis of Impediments to Fair Housing Choice Page 90 of 125
Continue to demonstrate a successful conversion to asset
management and project based management Improve the quality of assisted housing by striving to maintain a
high performer rating and achieving high scores in each component
Concentrate on efforts to improve specific management functions (if PHAS scores show a need for improvement, MCHA will concentrate on areas of need)
Strive to reduce public housing vacancies and improve vacant unit turnaround time
Increase customer satisfaction and improve marketability of current public housing units
Continue to consult with Resident Advisory Board with management and maintenance planning and policy development
Renovate and modernize public housing units and systems to be energy efficient and appealing to the community
Diligently preserve renovated public housing units and systems Acquire or build units or developments Demolish or dispose of obsolete public housing Consider submitting applications to HUD for competitive grants to
support the revitalization of public housing properties Explore leveraging private or other public funds to create
additional housing opportunities, including mixed-finance public housing and assisted housing with Section 8 project-based voucher subsidy
Consider conversion of at-risk public and assisted housing to long-term Section 8 rental assistance contracts under the HUD Rental Assistance Demonstration Program
Consider providing public housing homeownership opportunities Provide an improved living environment by implementing
measures to deconcentrate poverty by bringing higher income public housing households into lower income developments and vice versa
Implement public housing security improvements Promote self-sufficiency and asset development of assisted
households by increasing the number and percentage of employed persons in public housing families
Continue to actively promote Section 3 requirements through contracting preferences and advertisement
Ensure equal opportunity and affirmatively further fair housing by ensuring a suitable living environment is available for families living in public housing, regardless of race, color, religion national origin, sex, familial status and disability

Township of Abington,
Pennsylvania
Analysis of Impediments to Fair Housing Choice Page 91 of 125
Ensure accessible housing is available to persons with all varieties of disabilities
Continue to maintain cooperative agreements with other agencies and support the Montgomery County Consolidated Plan to ensure housing and supportive services are available for low income residents
7. Comprehensive Plan -
The Township of Abington updated its Comprehensive Plan in 2007. The previous Comprehensive Plan had been completed in 1992. The stated purpose of the Comprehensive Plan is to define goals and objectives for the future of the Township and chart the path through which those goals can be realized. The primary focus of the Township’s goals focus on the following areas: Housing; Natural Resources/Green Spaces; Parks and Recreation; Community Identity and Pride; Wastewater Treatment; Transportation; Township Finance; Economic Development; and Land Use and Zoning. Specific to Housing the following goal and objectives have been identified: Housing Goal – As a community, Abington Township should work to maintain the existing housing diversity and encourage the creation of housing choices to meet the needs of current and future residents. Objective A: Conserve the character and encourage the maintenance of existing housing within Abington Township and where practical rehabilitate and renovate deteriorated housing.
Objective B: With new incentives encourage replacement of untenable, existing units with new housing to provide a diversity of alternative housing types which will serve the needs of all age groups and economic levels.
Objective C: Establish communities of interest or create an agency which encourages private and public resources to be directed to achieving housing goals and objectives.
Objective D: Encourage housing which maximizes the use of existing transit infrastructure, to achieve a greater utilization of available economic resources.
Objective E: Develop/redevelop communities which allow for living, walking, and working within Abington Township.
Township of Abington,
Pennsylvania
Analysis of Impediments to Fair Housing Choice Page 92 of 125
8. Transportation -
Public transit is important to the economic development and housing development in the Township and County. Many people rely on bus service for access to work, school, and other services, and often use mass transit routes to decide where they will live. The residents of the Township of Abington and Montgomery County are served by the Southeastern Pennsylvania Transportation Authority (SEPTA) bus and rail lines. There is also a Montgomery County Transportation Authority, which oversees transportation improvement issues, except for mass transit. The Township of Abington has selected two existing Septa Regional Railroad Stations, within its jurisdiction, to improve vehicular mobility and pedestrian accessibility. Improvements at these two regional railroad stations will act as a catalyst for future real estate development projects in the area. The Township was approved for $3,000,000 in PennDOT Multi-modal Transportation Fund grant and $200,000 in Montgomery County Local Share Account grant funds. SEPTA’s Customized Community Transportation (CCT) provides on-demand, paratransit services to individuals with disabilities and senior citizens. Additionally, there is a Shared-Ride Program which picks up senior citizens aged 65 and over at their door, following an advanced reservation. The Shared-Ride Program is funded by The Commonwealth of Pennsylvania Lottery Fund, but also costs riders $4.00 for one way. SEPTA also operates regional rail lines, trolley lines, light rail, a high speed line, and the bus system. There are 16 regional rail lines, including service between Center City and Philadelphia International Airport, Center City and Trenton, NJ, and even Center City and Newark and Wilmington, DE. Abington itself is serviced by West Trenton Line, and Warminster Line; the Warminster Line’s Rosyln stop is accessible for people with disabilities. Fares, if paid in cash, costs $2.25, but tickets, tokens, and passes also exist and offer savings to regular commuters. The following table, found on www.septa.org, gives a comparison of fares.

Township of Abington,
Pennsylvania
Analysis of Impediments to Fair Housing Choice Page 93 of 125
If you ride SEPTA Best Fare Value Total Cost
Average Savings Over
Cash Fare
5 Days and use 2 or more Transit Routes
Weekly or Monthly TransPass
$24 (W) $91 (M)
$8.50 and Unlimited rides
5 Days and use 1 Transit Route each way
Tokens $18.00 $4.50
More than 3 rides on any Transit Route in one day
One Day Convenience Pass (8 ride limit)
$8.00 $10.00
More than 3 rides on any Transit Route or Regional Rail
Line in one day
Independence Day Pass
$12.00 $6.50
Norristown High Speed Line Zone 1 TrailPass $27.25 $.25 and
Unlimited rides
SEPTA has recently adopted the use of electronic fare cards called the SEPTA Key. Currently there are 71 fare kiosks throughout Philadelphia and surrounding areas that dispense the SEPTA Keys. There are currently 115 turnstiles that accept that Key, with 14 ADA gates, and over 200 validators on buses, trolleys, and light rail. The SEPTA Key will adhere to the fares listed above, providing no additional discount.
According to the 2007-2011 American Community Survey estimates, workers age 16 years and over in the Township of Abington and Montgomery County largely took cars, trucks, or vans for commuting. Of commuters in Abington, 86.8% drove, with 78.1% driving alone; in Montgomery County, 87.2% of commuters drove, 79.4% driving alone. Public transportation accounted for just 7.4% of commuters in Abington Township, and 4.9% of commuters in Montgomery County. However, Abington Township was recently awarded a Transportation & Community Development Initiative (TCDI) Grant for $60,000.00 from the Delaware Valley Regional Planning Commission. The grant, along with a cash match from the township, will help fund a Township Master Bicycle Plan. The plan will identify areas in which bicycle lanes of varying classes will link residential areas, businesses, transportation, schools, existing trails, and other municipalities. The addition of bicycle lanes can help low- to moderate-income residents with alternatives to owning a car or constantly using public transportation for shorter trips.

Township of Abington,
Pennsylvania
Analysis of Impediments to Fair Housing Choice Page 94 of 125
9. Education -
Education is often an important factor influencing where people choose to live. The Abington School District is located in the southeastern corner of Montgomery County, Pennsylvania. The district covers Abington Township and the Borough of Rockledge. The school district serves the Township’s population of 55,310 and has a student population of 7,639 in grades K-12. The school district employs 647 full time K-12 professional teaching faculty, with 100% considered Highly Qualified. The school district contains seven elementary schools (Copper Beech, Highland, McKinley, Overlook, Roslyn, Rydal East, and Willow Hill), one middle school (Abington Junior High School), and one senior high school (Abington). The Abington School District’s mission is to “Build upon the historical and culturally diverse roots of our community and its proud traditions, and recognize the uniqueness in each student, the Abington School District promotes excellence as our standard and achievement as the result”. The school district has a minority population of 34.44% and a high school enrollment of 1,745. The high school Class of 2014 saw 87% attend college, with 4% joining the military, and 9% joining the work force directly. 20.02% of students within the district are considered economically disadvantaged; the schools participate in the National School Lunch and Breakfast Program, which serves free or low-cost nutrionally balanced meals throughout the school week. The district’s website provides contact information for resources that can help provide free meals to children throughout the summer months. According to the 2007-2011 American Community Survey, 93.5% of the Township’s population age 25 years and over have at least a high school education or higher, and 42.3% have a bachelor’s degree or higher. The Abington Senior High School for 2013-2014 shows that the district has met most of its indicators of academic achievement; however, the Science and Biology – Percent Proficient or Advanced on PSSA/Keystone is at 69.53%, the lowest of any indicator score for the year. The following school dissimilarity index focusing on the public school system is based on Census data and was calculated as part of Brown University’s American Communities Project (http://www.s4.brown.edu/us2010/). The dissimilarity index measures whether one particular group is distributed across census tracts in the metropolitan area in the same way as another group. A

Township of Abington,
Pennsylvania
Analysis of Impediments to Fair Housing Choice Page 95 of 125
high value indicates that the two groups tend to live in different tracts. Dissimilarity ranges from 0 to 100. A value of 60 (or above) is considered very high. It means that 60% (or more) of the members of one group would need to move to a different tract in order for the two groups to be equally distributed. Values of 40 or 50 are usually considered a moderate level of segregation, and values of 30 or below are considered to be fairly low.
Source: American Communities Project, U.S. Census
The isolation index (below) is the percentage of same-group population the elementary schools where the average member of a racial/ethnic group attends. It has a lower bound of zero (for a very small group that is quite dispersed) to 100 (meaning that group members are entirely isolated from other groups). It should be kept in mind that this Index is affected by the size of the group -- it is almost inevitably smaller for smaller groups, and it is likely to rise over time if the group becomes larger.
Source: American Communities Project, U.S. Census

Township of Abington,
Pennsylvania
Analysis of Impediments to Fair Housing Choice Page 96 of 125
Indices of exposure to other groups, illustrated below, also range from 0 to 100, where a larger value means that the average group member attends elementary school with a higher percentage of children from the other group. These indices depend partly on the overall size of the other group in the region.
Source: American Communities Project, U.S. Census
The Abington School District recently approved a Comprehensive Plan for the 2015-2018 cycle, which identifies the following shared values:
1. “Public education, providing opportunities for all children, is
the cornerstone of American society and essential to the future of our country.
2. Diversity is a strength and an asset.
3. Everyone can learn and learning is accomplished in different ways and at different rates.
4. Every individual has equal human value.
5. A secure and safe environment and peaceful conflict resolution are essential to learning and to society.
6. The commitment to excellence is essential and worth the effort.
7. A quality school district requires the allocation of appropriate resources.

Township of Abington,
Pennsylvania
Analysis of Impediments to Fair Housing Choice Page 97 of 125
8. Successful individuals and institutions actively engage in the process of reflection and improvement.
9. Shared decision making and active participation strengthen organizations and communities.
10. The involvement of each school family and every member of the community essential to the educational process.
11. Every individual needs to be prepared to function in a global society.
-Abington School District Comprehensive Plan (pg. 2)
10. Section 3 -
HUD’s definition of Section 3 is: Section 3 is a provision of the Housing and Urban Development Act of 1968. The purpose of Section 3 to ensure that employment and other economic opportunities generated by certain HUD financial assistance shall, to the greatest extent feasible, and consistent with existing Federal, State and local laws and regulations, be directed to low- and very low income persons, particularly those who are recipients of government assistance for housing, and to business concerns which provide economic opportunities to low- and very low-income persons.
During this Analysis of Impediments study, no impediments or complaints were mentioned or filed based on Section 3 Requirements.
C. Private Sector:
The private sector has traditionally been the greatest impediment to fair housing choice in regard to discrimination in the sale, rental or advertising of dwellings, the provision of brokerage services, or in the availability of financing for real estate purchases. The Fair Housing Act prohibits such practices as the failure to give the same terms, privileges, or information, charging different fees, steering prospective buyers or renters toward a certain area or neighborhood, or using advertising that discourages prospective buyers or renters because of race, color, religion, sex, handicap, familial status or national origin.

Township of Abington,
Pennsylvania
Analysis of Impediments to Fair Housing Choice Page 98 of 125
1. Real Estate Practices -
The Montgomery County Association of Realtors, a member of the National Association of REALTORS, Inc., is the local organization of real estate brokers operating in Montgomery County. The Montgomery County Association of REALTORS has an open membership policy and does not discriminate. Members are bound by the Code of Ethics of the National Association of REALTORS (NAR). This Code of Ethics is available on the Montgomery County Association of REALTORS website (http://www.mcarealtors.org) and it obligates its members to maintain professional standards including efforts to affirmatively furthering fair housing.
In order for realtors to maintain their license in Pennsylvania they must annually complete continuing education courses which includes fair housing education. The Montgomery County Association of REALTORS offers continuing education courses on a variety of topics including fair housing, ethics and professional standards to ensure that its members are up to date on policies, practices, and procedures. Pennsylvania requires that realtors complete 14 hours of continuing education every two years. There is generally a 3.5 hour class offered which includes fair housing that is available several times a year. In addition, new members must complete an orientation course which includes a 2.5 hour Code of Ethics class which also incorporates Fair Housing. In the event of a complaint of discrimination, the Montgomery County Association of REALTORS has the policies in place to handle such complaints. There have not been any fair housing complaints against local area realtors reported during the review period.
Each year, the Pennsylvania Association of Realtors recognizes the significance of the anniversary of the 1968 Fair Housing Act and reconfirms their commitment to uphold fair housing laws as well as the commitment to offer equal professional service to all Pennsylvania citizens in their search for real property by participating in the Pennsylvania Human Rights Commission’s Annual Fair Housing Conference.

Township of Abington,
Pennsylvania
Analysis of Impediments to Fair Housing Choice Page 99 of 125
2. Newspaper Advertising -
Under Federal Law, no advertising with respect to the sale or rental of a dwelling unit may indicate any preference, limitation, or discrimination because of race, color, religion, sex, handicap, familial status, or national origin. Under the Fair Housing Act Amendments, descriptions are listed in regard to the use of words, photographs, symbols or other approaches that are considered discriminatory.
Real estate advertisements were reviewed for several real estate publications, including The Intelligencer, The Times Chronicle, Apartments for Rent, and Craigslist. There were no signs of discriminatory advertising in the sources reviewed.
3. Private Financing -
The Financial Institutions Reform, Recovery, and Enforcement Act of 1989 (F.I.R.R.E.A.) requires any commercial institution that makes five (5) or more home mortgage loans, to report all home loan activity to the Federal Reserve Bank under the Home Mortgage Disclosure Act (HMDA). The data does not suggest wide spread discriminatory lending practices but there are some patterns of minority groups having higher denial rates.
The table below compares lending in Abington Township to Montgomery County and the Philadelphia, PA MSA; this MSA includes all the Census Tracts in Montgomery County, as well as the Township of Abington. Conventional mortgages in Abington Township made up 5.9% of the conventional mortgages in Montgomery County and 1.6% of such mortgages in the Philadelphia MSA for 2013.
Home Purchase Loans Originated
FHA, FSA/RHS & VA
Conventional Refinancing Home
Improvement Loans
# Amount $000’s
# Amount $000’s
# Amount $000’s
# Amount $000’s
Abington Township
139 30,778 382 87,900 1,195 234,114 92 6,646

Township of Abington,
Pennsylvania
Analysis of Impediments to Fair Housing Choice Page 100 of 125
Montgomery County
1,771 385,750 6,478 1,727,513 17,465 3,873,736 1,508 144,260
Philadelphia MSA
8,833 1,683,314 25,212 6,630,590 67,689 13,960,137 6,899 562,177
% of County Lending in Abington
7.8% 8.0% 5.9% 5.1% 6.8% 6.0% 6.1% 4.6%
% of MSA Lending in Montgomery County
20.0% 22.9% 25.7% 26.1% 25.8% 27.7% 21.9% 25.7%
% of MSA Lending in Abington
1.6% 1.8% 1.5% 1.3% 1.8% 1.7% 1.3% 1.2%
Source: http://www.ffiec.gov/hmda The table below shows the conventional loan applications in Abington Township. Of the conventional loan applications in the township, 7.04% were denied, while 7.87% were withdrawn and 4.14% were approved but not accepted.
Disposition of Conventional Loans
Abington Township
(Count)
% of Abington Township
Applications
% of Montgomery
County Applications
% of Total MSA
Applications
Loans Originated 382 79.09% 5.90% 1.52%
Approved, Not Accepted 20 4.14% 0.31% 0.08%
Applications Denied 34 7.04% 0.52% 0.13%
Applications Withdrawn 38 7.87% 0.59% 0.15% File Closed for Incompleteness
9 1.86% 0.14% 0.04%
Source: http://www.ffiec.gov/hmda

Township of Abington,
Pennsylvania
Analysis of Impediments to Fair Housing Choice Page 101 of 125
The following table outlines the disposition of conventional loans in the Philadelphia, PA MSA by income level. Loan applications from households making less than 50% of MSA median income have the lowest origination rates and highest denial rates.
Disposition of Conventional Loans by Income Level
Income Level
Applications Received
Loans Originated
Applications Approved,
Not Accepted
Applications Denied
Applications Withdrawn
Applications Withdrawn or
Closed for Incompleteness
Co
un
t
% o
f T
ota
l
Co
un
t
% o
f In
com
e L
evel
A
pp
licat
ion
s
Co
un
t
% o
f In
com
e L
evel
O
rig
inat
ion
s
Co
un
t
% o
f In
com
e L
evel
O
rig
inat
ion
s
Co
un
t
% o
f In
com
e L
evel
O
rig
inat
ion
s
Co
un
t
% o
f In
com
e L
evel
O
rig
inat
ion
s
Less than 50% of MSA Median
2,351 7.06% 1,436 61.08% 97 4.13% 569 24.20% 182 7.74% 67 2.85%
50-79% of MSA Median
5,590 16.78% 4,018 71.88% 260 4.65% 668 11.95% 503 9.00% 141 2.52%
80-99% of MSA Median
3,699 11.11% 2,773 74.97% 156 4.22% 385 10.41% 300 8.11% 85 2.30%
100-119% of MSA Median
3,322 9.97% 2,496 75.14% 140 4.21% 290 8.73% 309 9.30% 87 2.62%
120% or More of MSA Median
18,342 55.07% 13,755 74.99% 965 5.26% 1,389 7.57% 1,852 10.10% 381 2.08%
Total 33,304 100.00% 24,478 73.50% 1,618 4.86% 3,301 9.91% 3,146 9.45% 761 2.29%
Source: http://www.ffiec.gov/hmda

Township of Abington,
Pennsylvania
Analysis of Impediments to Fair Housing Choice Page 102 of 125
The following table shows the dispositions of conventional loans disaggregated by minority status and income level for the Philadelphia, PA MSA. The number of applications for conventional loans submitted by White, non-Hispanic applicants significantly outnumbers minority applicants in each income level analyzed. The percentage of loans originated by White households is greater than the percentage of loans originated by minority households; however, as the White, non-Hispanic applicants far outnumber the minority applicants in each category, the results may be misleading.
Conventional Loan Disposition Rates by Minority Status, Less than 50% of MSA Median Income
Min
ori
ty S
tatu
s
Ap
plic
atio
ns
Rec
eive
d
% o
f T
ota
l Ap
plic
atio
ns
Lo
ans
Ori
gin
ated
% o
f A
pp
licat
ion
s R
ecei
ved
by
Min
ori
ty S
tatu
s
Ap
plic
atio
ns
Den
ied
% o
f L
oan
s O
rig
inat
ed b
y M
ino
rity
S
tatu
s
Ap
plic
atio
ns
Ap
pro
ved
bu
t N
ot
Acc
epte
d
% o
f L
oan
s O
rig
inat
ed b
y M
ino
rity
S
tatu
s
Ap
plic
atio
ns
Wit
hd
raw
n
% o
f L
oan
s O
rig
inat
ed b
y M
ino
rity
S
tatu
s
Ap
plic
atio
ns
Clo
sed
fo
r In
com
ple
ten
ess
% o
f L
oan
s O
rig
inat
ed b
y M
ino
rity
S
tatu
s
White, Non-Hispanic
1273 60.27% 841 66.06% 61 4.79% 249 19.56% 91 7.15% 31 2.44%
Minority, Including Hispanic
839 39.73% 481 57.33% 28 3.34% 239 28.49% 65 7.75% 26 3.10%
Total 2,112 100.00% 1,322 62.59% 89 4.21% 488 23.11% 156 7.39% 57 2.70%
Source: http://www.ffiec.gov/hmda
The number of White, non-Hispanic low-income applicants significantly outnumbers the number of minority applicants. Minority applicants have a lower applicant origination rate and a lower denial rate.

Township of Abington,
Pennsylvania
Analysis of Impediments to Fair Housing Choice Page 103 of 125
Conventional Loan Disposition Rates by Minority Status,
50-79% of MSA Median Income
Min
ori
ty S
tatu
s
Ap
plic
atio
ns
Rec
eive
d
% o
f T
ota
l Ap
plic
atio
ns
Lo
ans
Ori
gin
ated
% o
f A
pp
licat
ion
s R
ecei
ved
by
Min
ori
ty S
tatu
s
Ap
plic
atio
ns
Den
ied
% o
f L
oan
s O
rig
inat
ed b
y M
ino
rity
Sta
tus
Ap
plic
atio
ns
Ap
pro
ved
bu
t N
ot
Acc
epte
d
% o
f L
oan
s O
rig
inat
ed b
y M
ino
rity
Sta
tus
Ap
plic
atio
ns
Wit
hd
raw
n
% o
f L
oan
s O
rig
inat
ed b
y M
ino
rity
Sta
tus
Ap
plic
atio
ns
Clo
sed
fo
r In
com
ple
ten
ess
% o
f L
oan
s O
rig
inat
ed b
y M
ino
rity
Sta
tus
White, Non-Hispanic
3999 79.35% 3014 75.37% 178 4.45% 394 9.85% 323 8.08% 90 2.25%
Minority, Including Hispanic
1041 20.65% 666 63.98% 51 4.90% 175 16.81% 119 11.43% 30 2.88%
Total 5,040 100.00% 3,680 73.02% 229 4.54% 569 11.29% 442 8.77% 120 2.38%
Source: http://www.ffiec.gov/hmda
The number of White, non-Hispanic middle-income applicants significantly outnumbers the number of minority applicants. White, non-Hispanic households have a higher origination, while Minority applicants have a slightly higher denial rate.

Township of Abington,
Pennsylvania
Analysis of Impediments to Fair Housing Choice Page 104 of 125
Conventional Loan Disposition Rates by Minority Status, 80-99% of MSA Median Income
Min
ori
ty S
tatu
s
Ap
plic
atio
ns
Rec
eive
d
% o
f T
ota
l Ap
plic
atio
ns
Lo
ans
Ori
gin
ated
% o
f A
pp
licat
ion
s R
ecei
ved
by
Min
ori
ty S
tatu
s
Ap
plic
atio
ns
Den
ied
% o
f L
oan
s O
rig
inat
ed b
y M
ino
rity
Sta
tus
Ap
plic
atio
ns
Ap
pro
ved
bu
t N
ot
Ac
cep
ted
% o
f L
oan
s O
rig
inat
ed b
y M
ino
rity
Sta
tus
Ap
plic
atio
ns
Wit
hd
raw
n
% o
f L
oan
s O
rig
inat
ed b
y M
ino
rity
Sta
tus
Ap
plic
atio
ns
Clo
sed
fo
r In
com
ple
ten
ess
% o
f L
oan
s O
rig
inat
ed b
y M
ino
rity
Sta
tus
White, Non-Hispanic
2733 82.97% 2124 77.72% 101 3.70% 245 8.96% 211 7.72% 52 1.90%
Minority, Including Hispanic
561 17.03% 381 67.91% 25 4.46% 94 16.76% 46 8.20% 15 2.67%
Total 3,294 100.00% 2,505 76.05% 126 3.83% 339 10.29% 257 7.80% 67 2.03%
Source: http://www.ffiec.gov/hmda
The number of White, non-Hispanic upper middle-income applicants significantly outnumbers the number of minority applicants. In this income category, minority applicants have a lower origination rate and a higher denial rate.
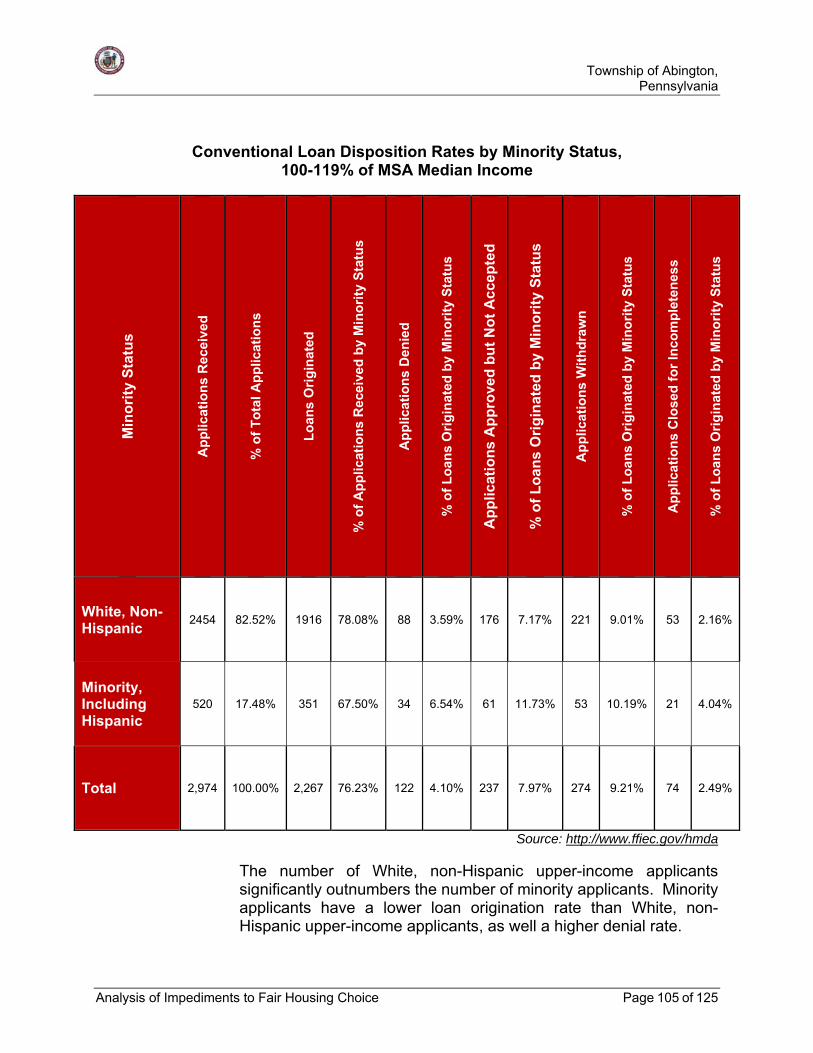
Township of Abington,
Pennsylvania
Analysis of Impediments to Fair Housing Choice Page 105 of 125
Conventional Loan Disposition Rates by Minority Status, 100-119% of MSA Median Income
Min
ori
ty S
tatu
s
Ap
plic
atio
ns
Rec
eive
d
% o
f T
ota
l Ap
plic
atio
ns
Lo
ans
Ori
gin
ated
% o
f A
pp
licat
ion
s R
ecei
ved
by
Min
ori
ty S
tatu
s
Ap
plic
atio
ns
Den
ied
% o
f L
oan
s O
rig
inat
ed b
y M
ino
rity
Sta
tus
Ap
plic
atio
ns
Ap
pro
ved
bu
t N
ot
Ac
cep
ted
% o
f L
oan
s O
rig
inat
ed b
y M
ino
rity
Sta
tus
Ap
plic
atio
ns
Wit
hd
raw
n
% o
f L
oan
s O
rig
inat
ed b
y M
ino
rity
Sta
tus
Ap
plic
atio
ns
Clo
sed
fo
r In
com
ple
ten
ess
% o
f L
oan
s O
rig
inat
ed b
y M
ino
rity
Sta
tus
White, Non-Hispanic
2454 82.52% 1916 78.08% 88 3.59% 176 7.17% 221 9.01% 53 2.16%
Minority, Including Hispanic
520 17.48% 351 67.50% 34 6.54% 61 11.73% 53 10.19% 21 4.04%
Total 2,974 100.00% 2,267 76.23% 122 4.10% 237 7.97% 274 9.21% 74 2.49%
Source: http://www.ffiec.gov/hmda
The number of White, non-Hispanic upper-income applicants significantly outnumbers the number of minority applicants. Minority applicants have a lower loan origination rate than White, non-Hispanic upper-income applicants, as well a higher denial rate.

Township of Abington,
Pennsylvania
Analysis of Impediments to Fair Housing Choice Page 106 of 125
Conventional Loan Disposition Rates by Minority Status, 120% or More of MSA Median Income
Min
ori
ty S
tatu
s
Ap
plic
atio
ns
Rec
eive
d
% o
f T
ota
l Ap
plic
atio
ns
Lo
ans
Ori
gin
ated
% o
f A
pp
licat
ion
s R
ecei
ved
by
Min
ori
ty S
tatu
s
Ap
plic
atio
ns
Den
ied
% o
f L
oan
s O
rig
inat
ed b
y M
ino
rity
Sta
tus
Ap
plic
atio
ns
Ap
pro
ved
bu
t N
ot
Ac
cep
ted
% o
f L
oan
s O
rig
inat
ed b
y M
ino
rity
Sta
tus
Ap
plic
atio
ns
Wit
hd
raw
n
% o
f L
oan
s O
rig
inat
ed b
y M
ino
rity
Sta
tus
Ap
plic
atio
ns
Clo
sed
fo
r In
com
ple
ten
ess
% o
f L
oan
s O
rig
inat
ed b
y M
ino
rity
Sta
tus
White, Non-Hispanic
13034 82.16% 10166 78.00% 558 4.28% 868 6.66% 1209 9.28% 233 1.79%
Minority, Including Hispanic
2831 17.84% 1976 69.80% 143 5.05% 278 9.82% 352 12.43% 82 2.90%
Total 15,865 100.00% 12,142 76.53% 701 4.42% 1146 7.22% 1561 9.84% 315 1.99%
Source: http://www.ffiec.gov/hmda
The number of White, non-Hispanic high-income applicants significantly outnumbers the number of minority applicants. Compared to white applicants, minority applicants have a higher denial rate, though a smaller origination rate.

Township of Abington,
Pennsylvania
Analysis of Impediments to Fair Housing Choice Page 107 of 125
The following table offers a closer look at the denial rates of conventional loans by denial reason and income level. For applicants earning up to 119% of median income, the most common reason for denial is debt-to-income ratio. Collateral is the most common reason for denial for applicants earning 120% of median income or more. Overall, the most common reasons for denial were debt-to-income ratio, followed by collateral and credit history.
Conventional Loan Denial Rates by Denial Reason and Income Level
Less than 50% Low
50-79% 80-99% 100-119% 120% or
More
Income Not
Available
Total Denials
Co
un
t
% o
f In
com
e L
evel
Co
un
t
% o
f In
com
e L
evel
Co
un
t
% o
f In
com
e L
evel
Co
un
t
% o
f In
com
e L
evel
Co
un
t
% o
f In
com
e L
evel
Co
un
t
% o
f In
com
e L
evel
Co
un
t
% o
f to
tal
Debt to Income Ratio
211 35.64% 170 28.57% 80 22.99% 58 23.29% 196 15.67% 17 24.64% 732 23.58%
Employment History
24 4.05% 24 4.03% 7 2.01% 3 1.20% 26 2.08% 2 2.90% 86 2.77%
Credit History 132 22.30% 118 19.83% 58 16.67% 29 11.65% 151 12.07% 9 13.04% 497 16.01%
Collateral 74 12.50% 86 14.45% 76 21.84% 56 22.49% 315 25.18% 8 11.59% 615 19.81%
Insufficient Cash
37 6.25% 40 6.72% 20 5.75% 11 4.42% 66 5.28% 3 4.35% 177 5.70%
Unverifiable Information
24 4.05% 37 6.22% 19 5.46% 11 4.42% 92 7.35% 7 10.14% 190 6.12%
Credit Application Incomplete
32 5.41% 59 9.92% 48 13.79% 49 19.68% 242 19.34% 10 14.49% 440 14.18%
Mortgage Insurance Denied
5 0.84% 5 0.84% 3 0.86% 5 2.01% 13 1.04% 0.00% 31 1.00%
Other 53 8.95% 56 9.41% 37 10.63% 27 10.84% 150 11.99% 13 18.84% 336 10.82%
Total Denials/ % of Total
592 19.07% 595 19.17% 348 11.21% 249 8.02% 1,251 40.30% 69 2.22% 3,10
4 100.00%
Source: http://www.ffiec.gov/hmda

Township of Abington, Pennsylvania
Analysis of Impediments to Fair Housing Choice Page 108 of 125
In summary, the HMDA Data indicates that low income households have a higher rate of denial than higher income households; More than one-third (38.24%) of denied loans originated from applicants earning less than 80% of the area’s median income. Overall, the origination rate of conventional loans in the Philadelphia MSA is 73.5%; the number of white applicants far exceeds the number of minority applicants and the origination and denial rates by race do vary by income. The most common reasons for denial are debt-to-income ratio, followed by collateral and credit history. In every income category, White, non-minority applicants for a conventional home purchase loan significantly outnumber minority applicants. The percentage of total applications by Whites accounts for at least 79% or more of the total in all income groups except for those making less than 50% AMI, where White applicants accounted for 60% of all applicants. Loan origination rates are slightly higher for White applicants (76.9%) than for minority applicants (66.1%) as a whole, and minority denial rates (4.9%) are higher than White denial rates (4.2%). However, the disparity in the categories of results of the applications is not as great between Whites and minorities as it is when comparing the percentage of applications. An additional analysis of loans granted by race in Montgomery County, Pennsylvania, and across the country, is beneficial to further illustrate the financial trends in the Township of Abington. The following tables’ present data gathered from www.dataplace.org. The table below presents loans for the purchase of single-family homes by race. Montgomery County has a lower rate of loans made to minorities as compared to the national rate.
Home Purchase Loans by Race
Loans by Race Montgomery
County Pennsylvania
United States
Percentage of owner-occupied home purchase loans to Whites (2007)
83.2% 84.1% 72.7%
Percentage of owner-occupied home purchase loans to Blacks (2007)
5.3% 5.9% 7.9%
Percentage of owner-occupied home purchase loans to Asian/Pacific Islanders (2007)
6.8% 3.6% 5.2%

Township of Abington, Pennsylvania
Analysis of Impediments to Fair Housing Choice Page 109 of 125
Percentage of owner-occupied home purchase loans to Native Americans (2007)
0.1% 0.1% 0.3%
Percentage of owner-occupied home purchase loans to Hispanics (2007)
1.9% 4.5% 10.8%
Percentage of owner-occupied home purchase loans to mixed race pairs (2007)
2.5% 1.7% 2.9%
Percentage of owner-occupied home purchase loans to minorities (2007)
16.8% 15.9% 27.3%
Percentage of owner-occupied home purchase loans made to multiracial applicants (2007)
0.2% 0.1% 0.2%
Source: www.dataplace.org
The table below highlights home loans made in Montgomery County, Pennsylvania, and the United States. The median income in the Montgomery County is higher than the median income in Pennsylvania and the United States. Montgomery County has a low rate of lending to very low- and low-income borrowers.
Home Purchase Loans by Income
Income (2007) Montgomery
County Pennsylvania
United States
Median borrower income for owner-occupied purchase 1 to 4 family
$90,000 $66,000 $74,000
Median borrower income for owner-occupied purchases of manufactured homes
$50,000 $43,000 $42,000
Percentage of owner-occupied home purchase loans to very low-income borrowers
2.6% 8.4% 5.7%
Percentage of owner-occupied home purchase loans to low-income borrowers
15.9% 23.1% 19.2%
Percentage of owner-occupied home purchase loans to middle-income borrowers
27.1% 26.7% 25.8%
Percentage of owner-occupied home purchase loans to high-income borrowers
54.4% 41.8% 49.3%
Source: www.dataplace.org

Township of Abington, Pennsylvania
Analysis of Impediments to Fair Housing Choice Page 110 of 125
The table below considers the percentage of conventional and refinancing mortgages made by subprime lenders. The prevalence of these loans in Montgomery County in 2005 (the most recent data available) is lower than rates in the Commonwealth of Pennsylvania and United States.
Loans from Subprime Lenders by Purpose and Loan Type
Type Montgomery
County Pennsylvania
United States
Percentage of conventional home purchase mortgage loans by subprime lenders (2005)
6.6% 9.8% 17.7%
Percentage of conventional refinancing mortgage loans by subprime lenders (2005)
14.6% 18.1% 20.4%
Source: www.dataplace.org
4. Insurance
The Housing Equality Center of Pennsylvania conducted a review of insurance practices in Montgomery County. It found discrepancies in the rates and amounts of insurance coverage available to minority households. Further investigation and assessment is needed to determine if there is a barrier for a discrimination lawsuit.
D. Community Participation:
The Township of Abington, in compliance with the Township’s Citizen Participation Plan, advertised and held three (3) public hearings on the needs of the Township of Abington that provided residents with the opportunity to discuss the Township’s CDBG Program and to offer their suggestions on future CDBG program priorities. The public hearings were advertised in The Times Chronicle and Glenside News on April 12, 2015, May 10, 2015, and June 7, 2015. The Township maintains a stakeholder contact list for the CDBG program. All stakeholders received emails and phone calls notifying the listees of all public hearings, meetings, and surveys. A “Draft AI” was placed on display at the Office of Community Development, 1176 Old York Road, Abington, PA 19001 from June 8, 2015 until July 8,

Township of Abington, Pennsylvania
Analysis of Impediments to Fair Housing Choice Page 111 of 125
2015 for review and comment. The draft plan review period was advertised in The Times Chronicle and Glenside News on June 7, 2015. Additionally, the Township developed and disseminated an online citizen’s survey at the following address: www.surveymonkey.com/s/Abington2015 and www.surveymonkey.com/s/abingtonespanol. There were a total of 36 surveys completed.
Notable Characteristics
Some of the notable characteristics of respondents included (as a percentage of those that answered each question):
The majority of respondents are male at 61.76%.
The vast majority (87.88%) of respondents are White.
The majority, at 31.43%, are over the age of 60.
100% of respondents are homeowners.
Notable Needs
Some of the notable needs identified by respondents included problems with the following (as a percentage of those that answered each question):
Streets – 36.36%
Property Maintenance – 9.09%
Curbs/Sidewalks – 31.82%
Public Safety – 40.91%
Litter – 18.18%
Parking – 31.82%
Storm Sewers – 22.73%
Traffic – 36.36%
Handicap Access – 9.09%
Sanitary Sewers – 9.09%
The following is a list of needs/issues associated with different areas of community and economic development. Values were calculated as a percentage of those that answered each question.
Recreation:
13.33% would like to see aesthetic improvements to parks, including landscaping, additional trees, park benches, and trash cans.

Township of Abington, Pennsylvania
Analysis of Impediments to Fair Housing Choice Page 112 of 125
Other recreation needs included:
- Adult sports leagues.
- Senior citizen fitness programs.
- Better lighting, parking, and access to parks.
- New playground equipment.
- Sports field for special needs children.
Medical:
One respondent mentioned a need for subsidized programs that offered transportation services, food delivery, and pharmacy delivery to those in need.
Another mentioned a need for senior fitness programs.
Other medical needs included:
- Mental health treatment and programs.
- Special needs assessments.
Social Services:
3.7% of respondents indicated that they used social services.
One respondent mentioned a need for programs that support energy efficiency of homes with grants for insulation, etc.
Another respondent mentioned a need for social service programs that provide transportation for seniors.
A need for more mental health and special needs programs was cited.
A need for street cleaning programs was also stated.
Employment:
There is a need for additional job opportunities.
There is a need for employment opportunities for seniors.
Housing:
One respondent mentioned a need to remove blighted properties and improve the appearance of dilapidated homes.
One respondent said that there is a need for quality, affordable, income-based housing.

Township of Abington, Pennsylvania
Analysis of Impediments to Fair Housing Choice Page 113 of 125
Another stated that senior citizen tax rebates should be age-based and not income-based, which would encourage long-term residents to stay in the Township.
Reasons Fair Housing Complaints Are Not Reported:
45.45% said that people either lack knowledge on the issue and their fair housing rights, or don’t know where to go to make a complaint.
9.09% said that fear of retaliation through eviction, increased rents, or harm prevents some victims of housing discrimination from making a report.
9.09% think that reporting a violation will be a waste of time and energy because they won’t be taken seriously and/or nothing will be done about it.
The following situations result in further discriminations and/or barriers to fair housing in the Township:
Reasons for Discrimination
Strongly
Agree Agree Neutral/Unsure Disagree
Strongly Disagree
Concentration of subsidized housing in certain neighborhoods
12.50% 18.75% 43.75% 6.25% 18.75%
Lack of affordable housing in certain areas
12.50% 25.00% 25.00% 25.00% 12.50%
Lack of accessible housing for persons with disabilities
12.50% 12.50% 62.50% 6.25% 6.25%
Lack of accessibility in neighborhoods (i.e. curb cuts)
13.33% 6.67% 53.33% 20.00% 6.67%
Lack of fair housing education 12.50% 31.25% 37.50% 6.25% 12.50%
Lack of fair housing organizations in the City
12.50% 6.25% 68.75% 0.00% 12.50%
State or Local laws and policies that limit housing choice
12.50% 0.00% 68.75% 6.25% 12.50%
Lack of knowledge among residents regarding fair housing
12.50% 31.25% 43.75% 6.25% 6.25%
Lack of knowledge among landlords and property managers regarding fair housing
12.50% 18.75% 50.00% 6.25% 12.50%
Lack of knowledge among real estate agents regarding fair housing
12.50% 12.50% 43.75% 18.75% 12.50%

Township of Abington, Pennsylvania
Analysis of Impediments to Fair Housing Choice Page 114 of 125
Lack of knowledge among bankers/lenders regarding fair housing
13.33% 6.67% 53.33% 13.33% 13.33%
Other barriers 8.33% 8.33% 83.33% 0.00% 0.00%
Citizen Comments: Any comments received by the City at the public hearing in regard to the “draft” Analysis of Impediments to Fair Housing Choice are included in the Appendix Section of this report.
The Township developed the Analysis of Impediments to Fair Housing Choice based on the input received from residents and stakeholders through interviews, public hearings, meetings, surveys, and draft plan review comments.

Township of Abington, Pennsylvania
Analysis of Impediments to Fair Housing Choice Page 115 of 125
V. Actions and Recommendations
The following impediments to fair housing choice and recommendations are presented to assist the Township of Abington to affirmatively further fair housing in the community. The previously identified impediments to fair housing choice were discussed in Section III and progress was reported for each impediment. New and carried over impediments to Fair Housing Choice are presented on the pages that follow. The Township of Abington’s 2015 Analysis of Impediments to Fair Housing Choice has identified the following impediments, along with the goals and strategies to address those impediments.
Impediment 1: FAIR HOUSING EDUCATION AND OUTREACH – There
is a continuing need to educate persons about their rights and responsibilities under the Fair Housing Act and raise awareness, especially for low-income households, that all residents of Abington Township have a right to fair housing choice. Goal: Improve the public’s knowledge and awareness of the Fair Housing Act, and related laws, regulations, and requirements to affirmatively further fair housing in the community.
The strategies to achieve this goal include:
- 1-A: Continue to promote the Township Police Department’s “No
Place for Hate” Program in the schools and provide educational opportunities for all persons to learn about their rights under the Fair Housing Act and the Americans With Disabilities Act.
- 1-B: Continue to make available and distribute literature and informational material concerning fair housing issues. These documents should be translated for the applicable LEP population in Abington.
- 1-C: Support the continuing efforts of the local fair housing organizations to provide training and technical assistance to the staff of Abington Township, the local Human Relations Commission members, Township Solicitor, affordable housing providers, and other organizations that are concerned with housing and civil rights in Abington.
Impediment 2: PUBLIC POLICIES AND REGULATIONS – The Township, in conjunction with the Montgomery County Planning Department, has been working on revising its Zoning Ordinance in accordance with the latest model codes. The Township needs to continue to move forward and complete this major revision to its Zoning Ordinance to bring it into

Township of Abington, Pennsylvania
Analysis of Impediments to Fair Housing Choice Page 116 of 125
compliance with the Federal Fair Housing Act, Section 504, the Americans with Disabilities Act, etc.
Goal: Complete the work on the revisions to the Township’s Zoning Ordinance to promote and affirmatively further fair housing by revising its purposes, definitions, and land use regulations.
The strategies to achieve this goal include:
- 2-A: Review and revise the definition of "Family" in the Zoning Ordinance to permit up to six (6) disabled persons to live together as a single family unit in any residential zoning district. The Township has been administratively abiding by this, but should now include this in the wording of the Zoning Ordinance.
- 2-B: Revise the General Purpose and Intent Section of the Zoning Ordinance to reaffirm the Township’s commitment to affirmatively further fair housing.
- 2-C: Revise the Zoning Ordinance to develop a chart with the revised permitted uses, including all types of housing: i.e. group residences, community living arrangements, elderly housing, etc.
- 2-D: Review and revise all of the other definitions in the Zoning Ordinance Township’s and include new definitions for Handicapped (Disabled), Fair Housing Act, Group Home, Community Living Arrangement, Elderly Housing (Senior Citizen Housing), Visitability, Accessibility, Americans With Disabilities Act, etc.
Impediment 3: NEED FOR AFFORDABLE RENTAL HOUSING UNITS –
The cost of rent for apartments in the Township has increased over the past ten years to the point that 52.6% of all renter households in Abington are paying more than 30% of their income on the cost of their housing, which means that these households are considered cost overburdened.
Goal: Promote and encourage the construction and development of additional affordable rental housing units in the Township, especially for households whose income is less than 80% of the median income.
The strategies to achieve this goal include:
- 3-A: Support and encourage both private developers and non-profit housing providers to develop and implement plans for the construction of new affordable mixed income rental housing that would be located throughout the Township that provide access to

Township of Abington, Pennsylvania
Analysis of Impediments to Fair Housing Choice Page 117 of 125
employment opportunities, transportation, amenities, and services throughout the Township; especially for the Elderly.
- 3-B: Assist in supporting and promoting financial assistance to households that are cost overburdened, particularly those households below 80% of the area median family income.
- 3-C: Continue to support and encourage the rehabilitation of existing housing units and the construction of upper floor housing units in mixed use buildings, as outlined in the “Old York Road Corridor Improvement Study,” to increase the supply of decent, safe and sound rental housing that is affordable to low- and moderate-income households.
Impediment 4: NEED FOR AFFORDABLE HOUSING FOR SALE – The
monthly housing cost for homeowners with a mortgage has increased to over $1,958 per month and it is estimated that 36.4% of all homeowners with a mortgage are paying more than 30% of their income on housing costs, which makes them cost overburdened, and limits the choice of housing for lower income households.
Goal: Promote and encourage the development of for-sale single family houses that are affordable to low- to moderate-income households.
The strategies to achieve this goal include:
- 4-A: Continue to support the construction and development of new for sale housing that provides affordable housing options to low- and moderate-income households outside of economically impacted areas.
- 4-B: Continue to support down-payment assistance and financing to assist low- and moderate-income homebuyers to purchase housing outside of economically impacted areas.
- 4-C: Continue to support the rehabilitation of the existing housing stock to increase the supply of decent, safe, and sound housing that is affordable to low- and moderate-income households.
- 4-D: Continue to support homebuyer education and training programs to improve homebuyer awareness and increase the opportunities of fair housing choice for lower income households to move outside impacted areas.
- 4-E: Apply to the Federal Home Loan Bank, Pennsylvania Housing Finance Agency, and State CDBG and HOME programs for funds for down payment assistance to lower income households so they can become homeowners.

Township of Abington, Pennsylvania
Analysis of Impediments to Fair Housing Choice Page 118 of 125
Impediment 5: NEED FOR ACCESSIBLE HOUSING – There is a need for more accessible housing that is decent, safe, and sound, as well as affordable to persons with disabilities.
Goal: Increase the number of accessible housing units that are decent, safe, and sound, as well as affordable to lower income households throughout the Township.
The strategies to achieve this goal include:
- 5-A: Increase the number of accessible housing units through rehabilitation of the existing housing stock.
- 5-B: Increase the number of accessible housing units through the development and construction of new rental and single family homes for sale.
- 5-C: Continue to enforce the ADA requirements for landlords to make “reasonable” modifications and accommodations to their rental properties, which will increase the number of accessible housing units for the disabled.
- 5-D: Provide financial assistance to homeowners to make their properties accessible in order to allow the elderly to remain in their residences.
Impediment 6: COUNTYWIDE APPROACH TO AFFIRMATIVELY
FURTHERING FAIR HOUSING – There are four (4) Federal Entitlement jurisdictions in Montgomery County: Abington, Lower Merion, Norristown, and Montgomery County. Housing, racial, and socio-economic data from the U.S. Census of 2010, as well as the location of subsidized housing illustrates that there is a disproportionate concentration of low- and moderate-income persons, minorities, and Hispanics living in impacted areas throughout Montgomery County, which demonstrates a lack of housing choice. Goal: Provide housing and economic opportunities for low- and moderate-income persons and the protected classes to live and work throughout all of Montgomery County, including outside impacted areas. The strategies to meet this goal include:
- 6-A: Establish an Affirmatively Furthering Fair Housing (AFFH) Task Force for Montgomery County with representatives from the Township of Abington, Lower Merion Township, the Municipality of Norristown, Montgomery County, U.S. Department of Housing

Township of Abington, Pennsylvania
Analysis of Impediments to Fair Housing Choice Page 119 of 125
and Urban Development (HUD), the two Fair Housing Councils, and the Montgomery County Housing Authority (MCHA).
- 6-B: The AFFH Task Force should review the mobility policies and procedures of the Montgomery County Housing Authority to encourage and support low- and moderate-income Housing Choice Voucher holders to move outside racially and economically impacted areas in Montgomery County.
- 6-C: The four (4) federal Entitlement jurisdictions: Montgomery County, Norristown, Lower Merion and Abington should coordinate and cooperate in the preparation and implementation of their individual Analysis of Impediments (A.I.) and/or prepare and adopt a joint countywide fair housing strategic plan.
- 6-D: The three (3) federal Entitlement jurisdictions should work with Montgomery County to promote and encourage the development of affordable housing throughout Montgomery County in areas that are not economically or racially impacted.
Impediment 7: SUPPORT THE HUMAN RELATIONS COMMISSION – The
Township needs to continue to support the Human Relations Commission, to become a local coordination, outreach, investigation, and adjudication organization; fair housing choice will be promoted and encouraged. Goal: The Human Relations Commission of Abington Township will be a motivating force in affirmatively furthering fair housing in the Township and will promote fair housing choice for all protected classes of people. The strategies to achieve this goal include:
- 7-A: The local governing body of the Township will keep the appointments of members to the Human Relations Commission current and will provide the Commission with technical and clerical support.
- 7-B: Establish procedures and protocols for how fair housing complaints are to be reported, monitored, and mediated, as well as training for Commission members and the Township Solicitor.
- 7-C: Advertise to the community, including the Township’s website, the existence of the Human Relations Commission, its mission, and how to report fair housing complaints.
- 7-D: Promote seminars and educational programs for the community in cooperation with local fair housing organizations to increase the knowledge base of all residents, owners, renters, and landlords, concerning their rights under the Fair Housing Act, as well as the Americans with Disabilities Act.

Township of Abington, Pennsylvania
Analysis of Impediments to Fair Housing Choice Page 121 of 125
VII. Appendix
The following items are in the appendix:
Appendix A – Demographic Data
The 2000 and 2010 Census Data for the Township of Abington, Montgomery County, and Pennsylvania and the 2007-2011 American Community Survey Data for the Township of Abington, Montgomery County, and Pennsylvania.
Appendix B – Home Mortgage Disclosure Act Data
HMDA Reports from 2013.
Appendix C – Maps
Maps of the Township of Abington.
Appendix D – Citizen Participation
Public hearing notices, public hearing sign-in sheets, public hearing minutes, summaries of the public hearings and interviews, and other documents outlining the citizen participation.

Township of Abington, Pennsylvania
Analysis of Impediments to Fair Housing Choice Page 122 of 125
Appendix A – Demographic Data
The 2000 & 2010 Census Data for the Township of Abington, Montgomery County, and Pennsylvania and the 2007-2011 American Community Survey Data for the Township of Abington, Montgomery County, and Pennsylvania.
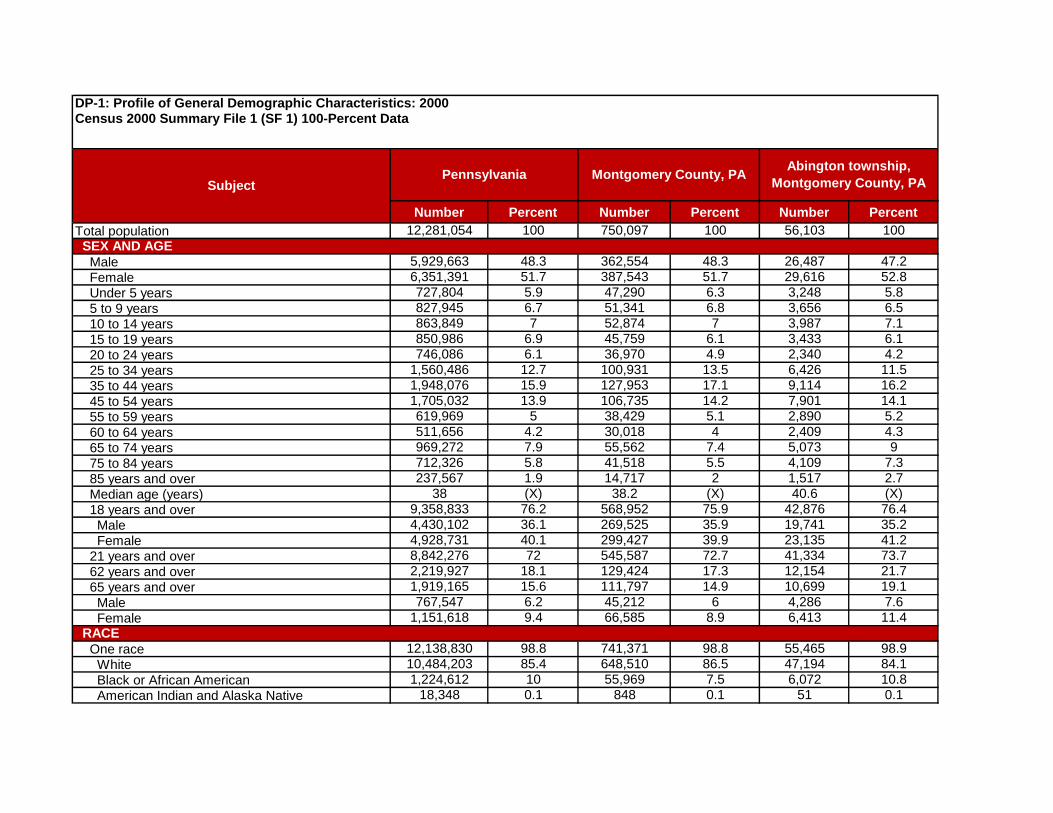
Number Percent Number Percent Number Percent
Total population 12,281,054 100 750,097 100 56,103 100
Male 5,929,663 48.3 362,554 48.3 26,487 47.2 Female 6,351,391 51.7 387,543 51.7 29,616 52.8 Under 5 years 727,804 5.9 47,290 6.3 3,248 5.8 5 to 9 years 827,945 6.7 51,341 6.8 3,656 6.5 10 to 14 years 863,849 7 52,874 7 3,987 7.1 15 to 19 years 850,986 6.9 45,759 6.1 3,433 6.1 20 to 24 years 746,086 6.1 36,970 4.9 2,340 4.2 25 to 34 years 1,560,486 12.7 100,931 13.5 6,426 11.5 35 to 44 years 1,948,076 15.9 127,953 17.1 9,114 16.2 45 to 54 years 1,705,032 13.9 106,735 14.2 7,901 14.1 55 to 59 years 619,969 5 38,429 5.1 2,890 5.2 60 to 64 years 511,656 4.2 30,018 4 2,409 4.3 65 to 74 years 969,272 7.9 55,562 7.4 5,073 9 75 to 84 years 712,326 5.8 41,518 5.5 4,109 7.3 85 years and over 237,567 1.9 14,717 2 1,517 2.7 Median age (years) 38 (X) 38.2 (X) 40.6 (X) 18 years and over 9,358,833 76.2 568,952 75.9 42,876 76.4 Male 4,430,102 36.1 269,525 35.9 19,741 35.2 Female 4,928,731 40.1 299,427 39.9 23,135 41.2 21 years and over 8,842,276 72 545,587 72.7 41,334 73.7 62 years and over 2,219,927 18.1 129,424 17.3 12,154 21.7 65 years and over 1,919,165 15.6 111,797 14.9 10,699 19.1 Male 767,547 6.2 45,212 6 4,286 7.6 Female 1,151,618 9.4 66,585 8.9 6,413 11.4
One race 12,138,830 98.8 741,371 98.8 55,465 98.9 White 10,484,203 85.4 648,510 86.5 47,194 84.1 Black or African American 1,224,612 10 55,969 7.5 6,072 10.8 American Indian and Alaska Native 18,348 0.1 848 0.1 51 0.1
SEX AND AGE
RACE
Abington township,
Montgomery County, PA
DP-1: Profile of General Demographic Characteristics: 2000Census 2000 Summary File 1 (SF 1) 100-Percent Data
Pennsylvania Montgomery County, PASubject

Asian 219,813 1.8 30,191 4 1,832 3.3 Asian Indian 57,241 0.5 8,056 1.1 194 0.3 Chinese 50,650 0.4 5,987 0.8 307 0.5 Filipino 14,506 0.1 1,674 0.2 126 0.2 Japanese 6,984 0.1 655 0.1 43 0.1 Korean 31,612 0.3 9,015 1.2 943 1.7 Vietnamese 30,037 0.2 2,687 0.4 115 0.2 Other Asian [1] 28,783 0.2 2,117 0.3 104 0.2 Native Hawaiian and Other Pacific Islander 3,417 0 255 0 28 0 Native Hawaiian 897 0 55 0 7 0 Guamanian or Chamorro 646 0 30 0 0 0 Samoan 734 0 85 0 17 0 Other Pacific Islander [2] 1,140 0 85 0 4 0 Some other race 188,437 1.5 5,598 0.7 288 0.5 Two or more races 142,224 1.2 8,726 1.2 638 1.1 Race alone or in combination with one or more other races [3] White 10,596,409 86.3 655,447 87.4 47,700 85 Black or African American 1,289,123 10.5 60,052 8 6,431 11.5 American Indian and Alaska Native 52,650 0.4 2,798 0.4 201 0.4 Asian 248,601 2 32,767 4.4 2,026 3.6 Native Hawaiian and Other Pacific Islander 8,790 0.1 527 0.1 39 0.1 Some other race 238,700 1.9 7,975 1.1 420 0.7
Total population 12,281,054 100 750,097 100 56,103 100 Hispanic or Latino (of any race) 394,088 3.2 15,300 2 883 1.6 Mexican 55,178 0.4 3,940 0.5 114 0.2 Puerto Rican 228,557 1.9 5,595 0.7 367 0.7 Cuban 10,363 0.1 812 0.1 58 0.1 Other Hispanic or Latino 99,990 0.8 4,953 0.7 344 0.6 Not Hispanic or Latino 11,886,966 96.8 734,797 98 55,220 98.4 White alone 10,322,455 84.1 640,019 85.3 46,689 83.2
Total population 12,281,054 100 750,097 100 56,103 100 In households 11,847,753 96.5 726,840 96.9 55,119 98.2 Householder 4,777,003 38.9 286,098 38.1 21,690 38.7 Spouse 2,467,673 20.1 163,746 21.8 12,458 22.2 Child 3,555,036 28.9 221,660 29.6 16,866 30.1 Own child under 18 years 2,653,125 21.6 169,730 22.6 12,267 21.9 Other relatives 525,185 4.3 27,372 3.6 2,397 4.3
HISPANIC OR LATINO AND RACE
RELATIONSHIP

Under 18 years 201,853 1.6 8,559 1.1 816 1.5 Nonrelatives 522,856 4.3 27,964 3.7 1,708 3 Unmarried partner 237,622 1.9 11,967 1.6 710 1.3 In group quarters 433,301 3.5 23,257 3.1 984 1.8 Institutionalized population 213,790 1.7 13,988 1.9 608 1.1 Noninstitutionalized population 219,511 1.8 9,269 1.2 376 0.7
Total households 4,777,003 100 286,098 100 21,690 100 Family households (families) 3,208,388 67.2 197,640 69.1 15,136 69.8 With own children under 18 years 1,430,808 30 91,569 32 6,503 30 Married-couple family 2,467,673 51.7 163,746 57.2 12,458 57.4 With own children under 18 years 1,043,071 21.8 75,129 26.3 5,466 25.2 Female householder, no husband present 554,693 11.6 25,290 8.8 2,080 9.6 With own children under 18 years 298,021 6.2 12,647 4.4 819 3.8 Nonfamily households 1,568,615 32.8 88,458 30.9 6,554 30.2 Householder living alone 1,320,941 27.7 73,213 25.6 5,619 25.9 Householder 65 years and over 555,374 11.6 28,213 9.9 2,789 12.9 Households with individuals under 18 years 1,559,281 32.6 97,199 34 7,018 32.4 Households with individuals 65 years and over 1,328,237 27.8 74,784 26.1 7,270 33.5 Average household size 2.48 (X) 2.54 (X) 2.54 (X) Average family size 3.04 (X) 3.09 (X) 3.1 (X)
Total housing units 5,249,750 100 297,434 100 22,367 100 Occupied housing units 4,777,003 91 286,098 96.2 21,690 97 Vacant housing units 472,747 9 11,336 3.8 677 3 For seasonal, recreational, or occasional use 148,230 2.8 1,038 0.3 77 0.3 Homeowner vacancy rate (percent) 1.6 (X) 1 (X) 0.8 (X) Rental vacancy rate (percent) 7.2 (X) 5.6 (X) 5.7 (X)
Occupied housing units 4,777,003 100 286,098 100 21,690 100 Owner-occupied housing units 3,406,337 71.3 210,233 73.5 17,205 79.3 Renter-occupied housing units 1,370,666 28.7 75,865 26.5 4,485 20.7 Average household size of owner-occupied unit 2.62 (X) 2.74 (X) 2.72 (X) Average household size of renter-occupied unit 2.12 (X) 1.99 (X) 1.85 (X)
HOUSING TENURE
HOUSEHOLDS BY TYPE
HOUSING OCCUPANCY

Number Percent Number Percent Number Percent
Population 3 years and over enrolled in school 3,135,934 100 194,722 100 14,124 100 Nursery school, preschool 203,934 6.5 16,426 8.4 1,269 9 Kindergarten 159,146 5.1 10,338 5.3 613 4.3 Elementary school (grades 1-8) 1,379,671 44 84,374 43.3 6,223 44.1 High school (grades 9-12) 690,020 22 40,044 20.6 3,155 22.3 College or graduate school 703,163 22.4 43,540 22.4 2,864 20.3
Population 25 years and over 8,266,284 100 515,871 100 39,213 100 Less than 9th grade 452,069 5.5 15,649 3 1,007 2.6 9th to 12th grade, no diploma 1,044,036 12.6 43,658 8.5 2,902 7.4 High school graduate (includes equivalency) 3,150,013 38.1 140,839 27.3 10,907 27.8 Some college, no degree 1,284,731 15.5 85,342 16.5 7,237 18.5 Associate degree 487,804 5.9 30,596 5.9 2,289 5.8 Bachelor's degree 1,153,383 14 118,910 23.1 8,681 22.1 Graduate or professional degree 694,248 8.4 80,877 15.7 6,190 15.8 Percent high school graduate or higher 81.9 (X) 88.5 (X) 90 (X) Percent bachelor's degree or higher 22.4 (X) 38.7 (X) 37.9 (X)
Population 15 years and over 9,861,713 100 598,897 100 45,255 100 Never married 2,685,328 27.2 144,789 24.2 11,089 24.5 Now married, except separated 5,352,297 54.3 362,440 60.5 26,421 58.4 Separated 215,846 2.2 9,895 1.7 711 1.6 Widowed 808,903 8.2 39,076 6.5 3,647 8.1 Female 656,381 6.7 31,579 5.3 3,039 6.7 Divorced 799,339 8.1 42,697 7.1 3,387 7.5 Female 456,801 4.6 25,999 4.3 2,175 4.8
Grandparent living in household with one or more own grandchildren under 18 years
204,909 100 10,226 100 824 100
Grandparent responsible for grandchildren 80,423 39.2 3,151 30.8 263 31.9
SCHOOL ENROLLMENT
EDUCATIONAL ATTAINMENT
MARITAL STATUS
GRANDPARENTS AS CAREGIVERS
Abington township,
Montgomery County, PA
DP-2: Profile of Selected Social Characteristics: 2000Census 2000 Summary File 3 (SF 3) - Sample Data
Pennsylvania Montgomery County, PA

Civilian population 18 years and over 9,354,471 100 568,589 100 42,908 100 Civilian veterans 1,280,788 13.7 70,232 12.4 5,686 13.3
Population 5 to 20 years 2,689,895 100 155,617 100 11,536 100 With a disability 202,259 7.5 8,901 5.7 692 6 Population 21 to 64 years 6,837,268 100 428,056 100 30,535 100 With a disability 1,196,717 17.5 52,286 12.2 4,468 14.6 Percent employed 54.8 (X) 66.1 (X) 66.7 (X) No disability 5,640,551 82.5 375,770 87.8 26,067 85.4 Percent employed 78.3 (X) 82.9 (X) 83 (X) Population 65 years and over 1,809,320 100 104,489 100 10,000 100 With a disability 712,795 39.4 33,494 32.1 3,267 32.7
Population 5 years and over 11,555,538 100 702,662 100 52,792 100 Same house in 1995 7,333,591 63.5 429,699 61.2 36,300 68.8 Different house in the U.S. in 1995 4,056,716 35.1 258,706 36.8 15,913 30.1 Same county 2,513,167 21.7 131,395 18.7 7,829 14.8 Different county 1,543,549 13.4 127,311 18.1 8,084 15.3 Same state 874,796 7.6 83,650 11.9 5,945 11.3 Different state 668,753 5.8 43,661 6.2 2,139 4.1 Elsewhere in 1995 165,231 1.4 14,257 2 579 1.1
Total population 12,281,054 100 750,097 100 56,103 100 Native 11,772,763 95.9 697,945 93 52,139 92.9 Born in United States 11,620,495 94.6 692,247 92.3 51,742 92.2 State of residence 9,544,251 77.7 550,542 73.4 42,885 76.4 Different state 2,076,244 16.9 141,705 18.9 8,857 15.8 Born outside United States 152,268 1.2 5,698 0.8 397 0.7 Foreign born 508,291 4.1 52,152 7 3,964 7.1 Entered 1990 to March 2000 209,123 1.7 18,623 2.5 990 1.8 Naturalized citizen 257,339 2.1 27,822 3.7 2,430 4.3 Not a citizen 250,952 2 24,330 3.2 1,534 2.7
Total (excluding born at sea) 508,282 100 52,152 100 3,964 100 Europe 182,667 35.9 17,117 32.8 1,692 42.7 Asia 182,967 36 24,199 46.4 1,466 37 Africa 25,413 5 1,743 3.3 79 2 Oceania 2,178 0.4 381 0.7 33 0.8 Latin America 99,514 19.6 7,099 13.6 555 14
RESIDENCE IN 1995
NATIVITY AND PLACE OF BIRTH
REGION OF BIRTH OF FOREIGN BORN
VETERAN STATUS
DISABILITY STATUS OF THE CIVILIAN NONINSTITUTIONALIZED POPULATION

Northern America 15,543 3.1 1,613 3.1 139 3.5LANGUAGE SPOKEN AT HOME Population 5 years and over 11,555,538 100 702,662 100 52,792 100 English only 10,583,054 91.6 635,062 90.4 47,898 90.7 Language other than English 972,484 8.4 67,600 9.6 4,894 9.3 Speak English less than 'very well 368,257 3.2 23,886 3.4 1,747 3.3 Spanish 356,754 3.1 14,182 2 969 1.8 Speak English less than "very well" 140,502 1.2 5,227 0.7 305 0.6 Other Indo-European languages 428,122 3.7 30,107 4.3 2,443 4.6 Speak English less than "very well" 138,542 1.2 7,992 1.1 699 1.3 Asian and Pacific Island languages 143,955 1.2 19,373 2.8 1,270 2.4 Speak English less than "very well" 76,183 0.7 9,832 1.4 709 1.3
Total population 12,281,054 100 750,097 100 56,103 100 Total ancestries reported 13,575,589 110.5 884,840 118 67,069 119.5 Arab 49,413 0.4 2,647 0.4 82 0.1 Czech[1] 70,704 0.6 3,117 0.4 104 0.2 Danish 16,762 0.1 1,429 0.2 96 0.2 Dutch 255,373 2.1 12,745 1.7 514 0.9 English 966,253 7.9 71,415 9.5 5,538 9.9 French (except Basque)[1] 211,264 1.7 13,814 1.8 762 1.4 French Canadian[1] 31,769 0.3 2,353 0.3 182 0.3 German 3,115,560 25.4 169,883 22.6 12,077 21.5 Greek 56,911 0.5 3,330 0.4 186 0.3 Hungarian 132,184 1.1 8,111 1.1 674 1.2 Irish[1] 1,983,262 16.1 159,205 21.2 14,558 25.9 Italian 1,418,465 11.6 112,072 14.9 7,233 12.9 Lithuanian 78,330 0.6 4,507 0.6 477 0.9 Norwegian 38,869 0.3 3,766 0.5 236 0.4 Polish 824,146 6.7 48,419 6.5 2,809 5 Portuguese 13,566 0.1 1,324 0.2 111 0.2 Russian 178,855 1.5 27,173 3.6 2,409 4.3 Scotch-Irish 218,173 1.8 11,299 1.5 988 1.8 Scottish 185,163 1.5 12,796 1.7 1,141 2 Slovak 243,009 2 5,716 0.8 211 0.4 Subsaharan African 58,807 0.5 3,304 0.4 166 0.3 Swedish 105,525 0.9 6,308 0.8 328 0.6 Swiss 60,107 0.5 3,656 0.5 165 0.3 Ukrainian 122,291 1 8,447 1.1 742 1.3 United States or American 633,236 5.2 29,954 4 2,283 4.1
ANCESTRY (single or multiple)
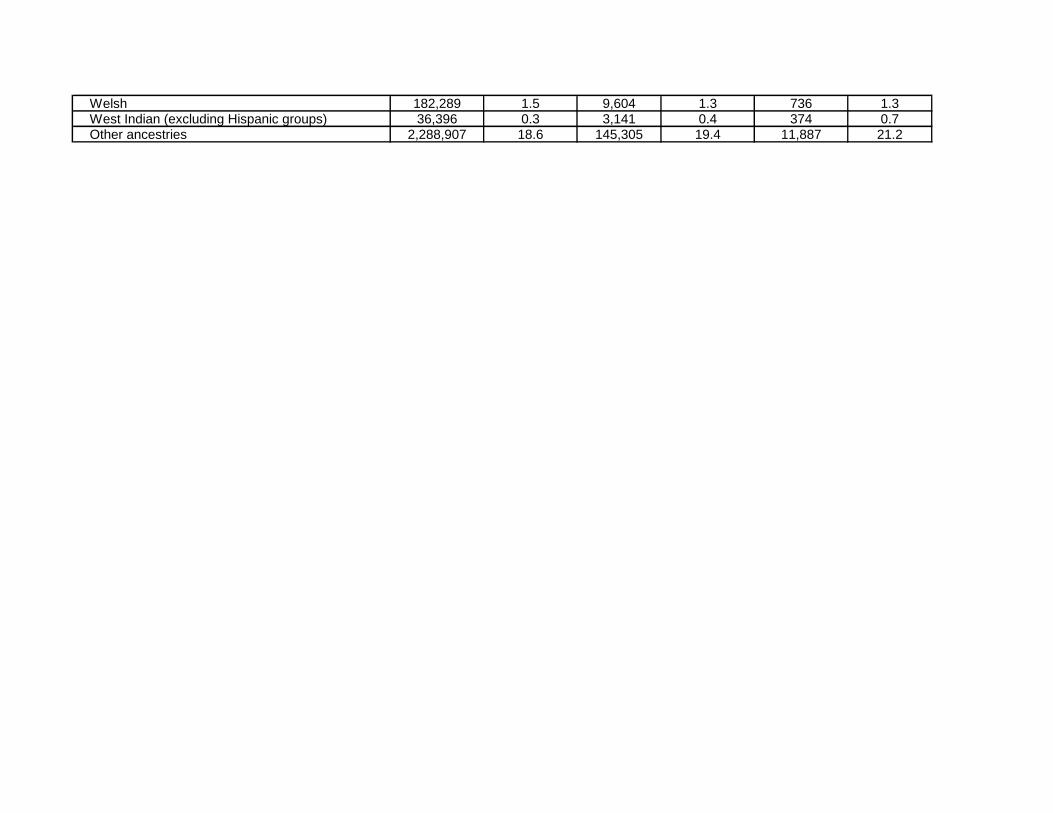
Welsh 182,289 1.5 9,604 1.3 736 1.3 West Indian (excluding Hispanic groups) 36,396 0.3 3,141 0.4 374 0.7 Other ancestries 2,288,907 18.6 145,305 19.4 11,887 21.2

Number Percent Number Percent Number Percent
Population 16 years and over 9,693,040 100 589,000 100 44,530 100 In labor force 6,000,512 61.9 403,574 68.5 29,232 65.6 Civilian labor force 5,992,886 61.8 402,653 68.4 29,185 65.5 Employed 5,653,500 58.3 384,688 65.3 28,157 63.2 Unemployed 339,386 3.5 17,965 3.1 1,028 2.3 Percent of civilian labor force 5.7 (X) 4.5 (X) 3.5 (X) Armed Forces 7,626 0.1 921 0.2 47 0.1 Not in labor force 3,692,528 38.1 185,426 31.5 15,298 34.4 Females 16 years and over 5,094,133 100 309,201 100 23,932 100 In labor force 2,818,832 55.3 190,402 61.6 13,960 58.3 Civilian labor force 2,817,741 55.3 190,324 61.6 13,939 58.2 Employed 2,660,720 52.2 180,896 58.5 13,463 56.3 Own children under 6 years 845,915 100 55,580 100 3,714 100 All parents in family in labor force 508,870 60.2 34,647 62.3 2,325 62.6
Workers 16 years and over 5556311 100 379832 100 27839 100 Car, truck, or van -- drove alone 4247836 76.5 305924 80.5 21552 77.4 Car, truck, or van -- carpooled 577364 10.4 31393 8.3 2397 8.6 Public transportation (including taxicab) 289699 5.2 16555 4.4 1848 6.6 Walked 229725 4.1 9963 2.6 939 3.4 Other means 47041 0.8 2460 0.6 161 0.6 Worked at home 164646 3 13537 3.6 942 3.4 Mean travel time to work (minutes) 25.2 (X) 26.5 (X) 26.3 (X)Employed civilian population 16 years and over 5653500 100 384688 100 28157 100
Management, professional, and related occupations 1,841,175 32.6 171,063 44.5 12,385 44 Service occupations 838,137 14.8 40,413 10.5 2,805 10 Sales and office occupations 1,525,131 27 108,422 28.2 8,354 29.7 Farming, fishing, and forestry occupations 26,722 0.5 405 0.1 32 0.1 Construction, extraction, and maintenance occupations 500,898 8.9 26,380 6.9 2,094 7.4 Production, transportation, and material moving occupations 921,437 16.3 38,005 9.9 2,487 8.8
DP-3: Profile of Selected Economic Characteristics: 2000Census 2000 Summary File 3 (SF 3) - Sample Data
EMPLOYMENT STATUS
COMMUTING TO WORK
OCCUPATION
INDUSTRY
Abington township,
Montgomery County, PAPennsylvania Montgomery County, PA

Agriculture, forestry, fishing and hunting, and mining 73,459 1.3 1,039 0.3 68 0.2 Construction 339,363 6 21,691 5.6 1,811 6.4 Manufacturing 906,398 16 57,831 15 2,835 10.1 Wholesale trade 201,084 3.6 15,069 3.9 1,077 3.8 Retail trade 684,179 12.1 43,445 11.3 3,536 12.6 Transportation and warehousing, and utilities 304,335 5.4 12,384 3.2 923 3.3 Information 148,841 2.6 13,412 3.5 903 3.2 Finance, insurance, real estate, and rental and leasing 372,148 6.6 38,494 10 2,844 10.1 Professional, scientific, management, administrative, and waste management services
478,937 8.5 49,471 12.9 3,148 11.2
Educational, health and social services 1,237,090 21.9 83,269 21.6 7,445 26.4 Arts, entertainment, recreation, accommodation and food services
397,871 7 20,902 5.4 1,296 4.6
Other services (except public administration) 274,028 4.8 17,220 4.5 1,409 5 Public administration 235,767 4.2 10,461 2.7 862 3.1
Private wage and salary workers 4,657,372 82.4 328,416 85.4 23,628 83.9 Government workers 639,088 11.3 31,043 8.1 2,601 9.2 Self-employed workers in own not incorporated business 339,631 6 24,311 6.3 1,815 6.4 Unpaid family workers 17,409 0.3 918 0.2 113 0.4
Households 4,779,186 100 286,255 100 21,707 100 Less than $10,000 465,860 9.7 12,344 4.3 839 3.9 $10,000 to $14,999 333,381 7 10,412 3.6 912 4.2 $15,000 to $24,999 657,266 13.8 23,193 8.1 1,803 8.3 $25,000 to $34,999 633,953 13.3 27,251 9.5 1,997 9.2 $35,000 to $49,999 809,165 16.9 41,432 14.5 3,183 14.7 $50,000 to $74,999 929,863 19.5 61,745 21.6 4,913 22.6 $75,000 to $99,999 457,480 9.6 42,693 14.9 3,321 15.3 $100,000 to $149,999 317,171 6.6 38,727 13.5 2,771 12.8 $150,000 to $199,999 84,173 1.8 13,091 4.6 826 3.8 $200,000 or more 90,874 1.9 15,367 5.4 1,142 5.3 Median household income (dollars) 40,106 (X) 60,829 (X) 59,921 (X) With earnings 3,667,238 76.7 237,842 83.1 17,228 79.4 Mean earnings (dollars) 54,209 (X) 78,055 (X) 74,216 (X) With Social Security income 1,451,386 30.4 76,683 26.8 7,404 34.1 Mean Social Security income (dollars) 11,717 (X) 13,311 (X) 13,634 (X) With Supplemental Security Income 203,851 4.3 6,355 2.2 530 2.4 Mean Supplemental Security Income (dollars) 6,523 (X) 7,184 (X) 6,926 (X) With public assistance income 149,203 3.1 3,572 1.2 224 1 Mean public assistance income (dollars) 2,848 (X) 3,306 (X) 2,982 (X) With retirement income 940,184 19.7 48,767 17 4,789 22.1
CLASS OF WORKER
INCOME IN 1999

Mean retirement income (dollars) 14,663 (X) 17,807 (X) 17,205 (X) Families 3,225,707 100 198,871 100 15,217 100 Less than $10,000 167,090 5.2 3,734 1.9 234 1.5 $10,000 to $14,999 124,473 3.9 2,947 1.5 160 1.1 $15,000 to $24,999 352,867 10.9 10,580 5.3 698 4.6 $25,000 to $34,999 410,489 12.7 14,499 7.3 1,131 7.4 $35,000 to $49,999 586,011 18.2 25,384 12.8 2,033 13.4 $50,000 to $74,999 756,698 23.5 46,646 23.5 3,979 26.1 $75,000 to $99,999 396,388 12.3 36,010 18.1 2,833 18.6 $100,000 to $149,999 278,306 8.6 33,373 16.8 2,417 15.9 $150,000 to $199,999 74,520 2.3 11,717 5.9 725 4.8 $200,000 or more 78,865 2.4 13,981 7 1,007 6.6 Median family income (dollars) 49,184 (X) 72,183 (X) 70,959 (X) Per capita income (dollars) 20,880 (X) 30,898 (X) 30,331 (X) Median earnings (dollars): Male full-time, year-round workers 37,051 (X) 48,698 (X) 47,408 (X) Female full-time, year-round workers 26,687 (X) 35,089 (X) 36,572 (X)
Families 250,296 (X) 5,470 (X) 305 (X) Percent below poverty level (X) 7.8 (X) 2.8 (X) 2 With related children under 18 years 188,366 (X) 4,044 (X) 160 (X) Percent below poverty level (X) 12.1 (X) 4.1 (X) 2.3 With related children under 5 years 88,081 (X) 1,876 (X) 64 (X) Percent below poverty level (X) 15.3 (X) 4.9 (X) 2.4 Families with female householder, no husband present 134,560 (X) 2,735 (X) 156 (X) Percent below poverty level (X) 24.9 (X) 11.4 (X) 7.3 With related children under 18 years 118,782 (X) 2,423 (X) 107 (X) Percent below poverty level (X) 34.9 (X) 17.4 (X) 11.2 With related children under 5 years 55,163 (X) 1,121 (X) 40 (X) Percent below poverty level (X) 47.4 (X) 28.2 (X) 19.2 Individuals 1,304,117 (X) 32,215 (X) 1,992 (X) Percent below poverty level (X) 11 (X) 4.4 (X) 3.6 18 years and over 882,372 (X) 23,597 (X) 1,642 (X) Percent below poverty level (X) 9.8 (X) 4.3 (X) 3.9 65 years and over 164,095 (X) 5,353 (X) 422 (X) Percent below poverty level (X) 9.1 (X) 5.1 (X) 4.2 Related children under 18 years 408,079 (X) 8,186 (X) 342 (X) Percent below poverty level (X) 14.3 (X) 4.6 (X) 2.6 Related children 5 to 17 years 291,913 (X) 5,863 (X) 248 (X) Percent below poverty level (X) 13.6 (X) 4.5 (X) 2.5 Unrelated individuals 15 years and over 473,182 (X) 14,649 (X) 1,055 (X) Percent below poverty level (X) 22.8 (X) 12.7 (X) 12.7
POVERTY STATUS IN 1999 (below poverty level)

Number Percent Number Percent Number Percent
Total housing units 5,249,750 100 297,434 100 22,367 100
1-unit, detached 2,935,248 55.9 166,543 56 15,876 71 1-unit, attached 940,396 17.9 55,745 18.7 1,772 7.9 2 units 273,798 5.2 10,642 3.6 816 3.6 3 or 4 units 241,745 4.6 12,465 4.2 609 2.7 5 to 9 units 179,909 3.4 9,641 3.2 483 2.2 10 to 19 units 131,691 2.5 11,613 3.9 782 3.5 20 or more units 283,714 5.4 28,067 9.4 2,004 9 Mobile home 258,551 4.9 2,627 0.9 25 0.1 Boat, RV, van, etc. 4,698 0.1 91 0 0 0
1999 to March 2000 66,916 1.3 5,075 1.7 88 0.4 1995 to 1998 212,916 4.1 15,422 5.2 302 1.4 1990 to 1994 266,445 5.1 18,148 6.1 244 1.1 1980 to 1989 531,986 10.1 35,774 12 1,044 4.7 1970 to 1979 709,768 13.5 42,310 14.2 2,377 10.6 1960 to 1969 595,897 11.4 43,091 14.5 3,268 14.6 1940 to 1959 1,275,149 24.3 77,513 26.1 10,145 45.4 1939 or earlier 1,590,673 30.3 60,101 20.2 4,899 21.9
1 room 62,654 1.2 3,196 1.1 201 0.9 2 rooms 143,152 2.7 8,225 2.8 661 3 3 rooms 403,457 7.7 22,237 7.5 1,604 7.2 4 rooms 668,040 12.7 31,634 10.6 1,770 7.9 5 rooms 924,603 17.6 36,860 12.4 2,442 10.9 6 rooms 1,220,416 23.2 54,468 18.3 4,782 21.4 7 rooms 767,695 14.6 48,290 16.2 4,720 21.1 8 rooms 561,360 10.7 44,235 14.9 3,092 13.8 9 or more rooms 498,373 9.5 48,289 16.2 3,095 13.8 Median (rooms) 5.8 (X) 6.4 (X) 6.4 (X)
Pennsylvania Montgomery County, PA
DP-4: Profile of Selected Housing Characteristics: 2000Census 2000 Summary File 3 (SF 3) - Sample Data
Abington township,
Montgomery County, PA
UNITS IN STRUCTURE
ROOMS
YEAR STRUCTURE BUILT

Occupied Housing Units 4,777,003 100 286,098 100 21,690 100
1999 to March 2000 696,279 14.6 43,269 15.1 2,619 12.1 1995 to 1998 1,139,483 23.9 74,837 26.2 4,324 19.9 1990 to 1994 734,248 15.4 47,200 16.5 3,466 16 1980 to 1989 821,152 17.2 52,279 18.3 4,178 19.3 1970 to 1979 575,344 12 30,577 10.7 2,784 12.8 1969 or earlier 810,497 17 37,936 13.3 4,319 19.9
None 613,249 12.8 18,151 6.3 1,710 7.9 1 1,667,535 34.9 93,845 32.8 7,395 34.1 2 1,791,526 37.5 129,463 45.3 9,443 43.5 3 or more 704,693 14.8 44,639 15.6 3,142 14.5
Utility gas 2,452,941 51.3 138,395 48.4 14,523 67 Bottled, tank, or LP gas 145,254 3 4,215 1.5 158 0.7 Electricity 786,648 16.5 57,269 20 2,613 12 Fuel oil, kerosene, etc. 1,217,155 25.5 83,353 29.1 4,272 19.7 Coal or coke 67,986 1.4 544 0.2 7 0 Wood 76,060 1.6 998 0.3 36 0.2 Solar energy 663 0 14 0 0 0 Other fuel 20,500 0.4 938 0.3 44 0.2 No fuel used 9,796 0.2 372 0.1 37 0.2
Lacking complete plumbing facilities 24,450 0.5 798 0.3 48 0.2 Lacking complete kitchen facilities 25,831 0.5 984 0.3 151 0.7 No telephone service 65,680 1.4 1,567 0.5 65 0.3
Occupied housing units 4,777,003 100 286,098 100 21,690 100 1.00 or less 4,685,858 98.1 281,805 98.5 21,407 98.7 1.01 to 1.50 60,627 1.3 2,679 0.9 208 1 1.51 or more 30,518 0.6 1,614 0.6 75 0.3Specified owner-occupied units 2,889,484 100 190,477 100 15,980 100
Less than $50,000 435,193 15.1 1,551 0.8 78 0.5 $50,000 to $99,999 1,079,698 37.4 22,324 11.7 1,319 8.3 $100,000 to $149,999 703,093 24.3 59,078 31 7,917 49.5 $150,000 to $199,999 344,172 11.9 48,815 25.6 3,723 23.3 $200,000 to $299,999 214,812 7.4 35,112 18.4 1,650 10.3 $300,000 to $499,999 84,425 2.9 16,316 8.6 868 5.4
VALUE
OCCUPANTS PER ROOM
SELECTED CHARACTERISTICS
HOUSE HEATING FUEL
VEHICLES AVAILABLE
YEAR HOUSEHOLDER MOVED INTO UNIT

$500,000 to $999,999 23,654 0.8 5,832 3.1 365 2.3 $1,000,000 or more 4,437 0.2 1,449 0.8 60 0.4 Median (dollars) 97,000 (X) 160,700 (X) 142,100 (X)
With a mortgage 1,798,402 62.2 137,426 72.1 10,487 65.6 Less than $300 9,157 0.3 28 0 0 0 $300 to $499 108,720 3.8 1,248 0.7 62 0.4 $500 to $699 270,083 9.3 4,902 2.6 382 2.4 $700 to $999 498,003 17.2 18,232 9.6 1,317 8.2 $1,000 to $1,499 546,365 18.9 52,359 27.5 4,684 29.3 $1,500 to $1,999 220,493 7.6 33,296 17.5 2,395 15 $2,000 or more 145,581 5 27,361 14.4 1,647 10.3 Median (dollars) 1,010 (X) 1,423 (X) 1,375 (X) Not mortgaged 1,091,082 37.8 53,051 27.9 5,493 34.4 Median (dollars) 318 (X) 465 (X) 499 (X)
Less than 15 percent 1,091,368 37.8 61,753 32.4 4,897 30.6 15 to 19 percent 509,245 17.6 34,464 18.1 2,994 18.7 20 to 24 percent 399,694 13.8 30,087 15.8 2,309 14.4 25 to 29 percent 264,015 9.1 19,937 10.5 1,763 11 30 to 34 percent 164,558 5.7 12,386 6.5 1,124 7 35 percent or more 436,159 15.1 31,099 16.3 2,771 17.3 Not computed 24,445 0.8 751 0.4 122 0.8Specified renter-occupied units 1,348,824 100 75,476 100 4,489 100
Less than $200 85,346 6.3 1,734 2.3 92 2 $200 to $299 89,493 6.6 1,489 2 137 3.1 $300 to $499 389,144 28.9 6,610 8.8 320 7.1 $500 to $749 454,749 33.7 25,803 34.2 1,639 36.5 $750 to $999 167,064 12.4 21,439 28.4 945 21.1 $1,000 to $1,499 65,230 4.8 12,887 17.1 826 18.4 $1,500 or more 19,811 1.5 2,887 3.8 402 9 No cash rent 77,987 5.8 2,627 3.5 128 2.9 Median (dollars) 531 (X) 757 (X) 749 (X)
Less than 15 percent 259,386 19.2 15,076 20 795 17.7 15 to 19 percent 193,612 14.4 12,874 17.1 709 15.8 20 to 24 percent 165,624 12.3 10,476 13.9 589 13.1 25 to 29 percent 139,877 10.4 8,383 11.1 536 11.9
GROSS RENT AS A PERCENTAGE OF HOUSEHOLD INCOME IN 1999
GROSS RENT
SELECTED MONTHLY OWNER COSTS AS A PERCENTAGE OF HOUSEHOLD INCOME IN 1999
MORTGAGE STATUS AND SELECTED MONTHLY OWNER COSTS
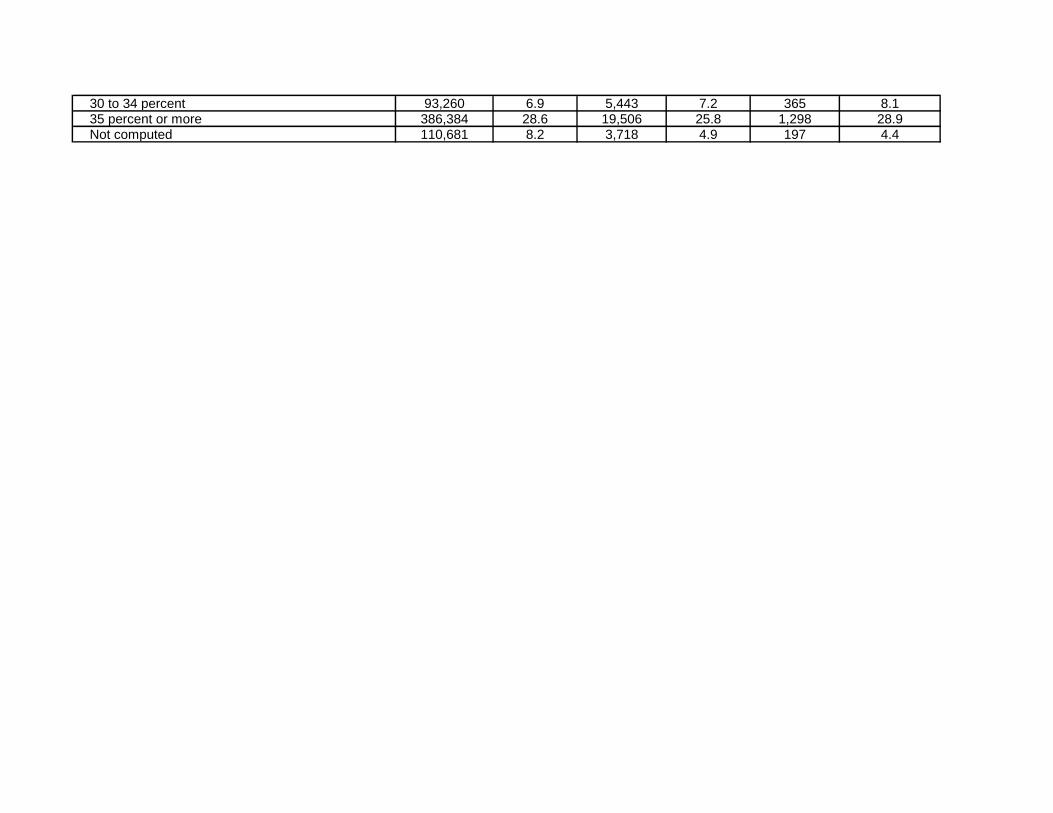
30 to 34 percent 93,260 6.9 5,443 7.2 365 8.1 35 percent or more 386,384 28.6 19,506 25.8 1,298 28.9 Not computed 110,681 8.2 3,718 4.9 197 4.4

Number Percent Number Percent Number Percent
Total population 12,702,379 100.0 799,874 100.0 55,310 100.0 Under 5 years 729,538 5.7 47,305 5.9 3,113 5.6 5 to 9 years 753,635 5.9 50,313 6.3 3,305 6.0 10 to 14 years 791,151 6.2 52,570 6.6 3,476 6.3 15 to 19 years 905,066 7.1 51,581 6.4 3,612 6.5 20 to 24 years 874,146 6.9 43,590 5.4 2,900 5.2 25 to 29 years 781,527 6.2 48,681 6.1 2,994 5.4 30 to 34 years 729,592 5.7 47,960 6.0 3,046 5.5 35 to 39 years 764,287 6.0 51,136 6.4 3,077 5.6 40 to 44 years 851,382 6.7 57,748 7.2 3,739 6.8 45 to 49 years 955,763 7.5 64,482 8.1 4,372 7.9 50 to 54 years 984,641 7.8 63,829 8.0 4,701 8.5 55 to 59 years 879,048 6.9 54,755 6.8 4,143 7.5 60 to 64 years 743,296 5.9 45,197 5.7 3,145 5.7 65 to 69 years 553,002 4.4 33,312 4.2 2,419 4.4 70 to 74 years 426,536 3.4 25,180 3.1 1,870 3.4 75 to 79 years 362,332 2.9 22,029 2.8 1,693 3.1 80 to 84 years 311,761 2.5 19,591 2.4 1,735 3.1 85 years and over 305,676 2.4 20,615 2.6 1,970 3.6
Median age (years) 40.1 ( X ) 40.6 ( X ) 42.8 ( X )
16 years and over 10,260,299 80.8 638,702 79.9 44,641 80.7 18 years and over 9,910,224 78.0 616,375 77.1 43,012 77.8 21 years and over 9,331,047 73.5 589,989 73.8 41,276 74.6 62 years and over 2,390,028 18.8 146,928 18.4 11,449 20.7 65 years and over 1,959,307 15.4 120,727 15.1 9,687 17.5
Male population 6,190,363 48.7 387,964 48.5 26,274 47.5 Under 5 years 373,216 2.9 24,303 3.0 1,596 2.9 5 to 9 years 384,359 3.0 25,524 3.2 1,659 3.0 10 to 14 years 405,227 3.2 26,862 3.4 1,823 3.3 15 to 19 years 462,465 3.6 26,392 3.3 1,854 3.4 20 to 24 years 441,886 3.5 21,774 2.7 1,444 2.6 25 to 29 years 392,569 3.1 24,609 3.1 1,473 2.7 30 to 34 years 364,681 2.9 23,872 3.0 1,482 2.7 35 to 39 years 380,172 3.0 25,342 3.2 1,443 2.6 40 to 44 years 421,689 3.3 28,258 3.5 1,797 3.2 45 to 49 years 470,543 3.7 31,205 3.9 2,082 3.8 50 to 54 years 484,289 3.8 31,198 3.9 2,224 4.0 55 to 59 years 430,202 3.4 26,429 3.3 2,021 3.7 60 to 64 years 358,008 2.8 21,784 2.7 1,529 2.8
DP-1-Geography-Abington township, Montgomery County, Pennsylvania: Profile of General Population
and Housing Characteristics: 2010
2010 Demographic Profile Data
Subject
SEX AND AGE
Pennsylvania Montgomery County,
Pennsylvania
Abington Township,
Pennsylvania

65 to 69 years 258,653 2.0 15,499 1.9 1,097 2.0 70 to 74 years 192,187 1.5 11,244 1.4 799 1.4 75 to 79 years 153,890 1.2 9,349 1.2 709 1.3 80 to 84 years 120,931 1.0 7,743 1.0 668 1.2 85 years and over 95,396 0.8 6,577 0.8 574 1.0
Median age (years) 38.7 ( X ) 39.2 ( X ) 41.0 ( X )
16 years and over 4,941,116 38.9 305,681 38.2 20,804 37.6 18 years and over 4,760,912 37.5 294,198 36.8 19,976 36.1 21 years and over 4,468,432 35.2 280,917 35.1 19,056 34.5 62 years and over 1,027,972 8.1 62,949 7.9 4,682 8.5 65 years and over 821,057 6.5 50,412 6.3 3,847 7.0
Female population 6,512,016 51.3 411,910 51.5 29,036 52.5 Under 5 years 356,322 2.8 23,002 2.9 1,517 2.7 5 to 9 years 369,276 2.9 24,789 3.1 1,646 3.0 10 to 14 years 385,924 3.0 25,708 3.2 1,653 3.0 15 to 19 years 442,601 3.5 25,189 3.1 1,758 3.2 20 to 24 years 432,260 3.4 21,816 2.7 1,456 2.6 25 to 29 years 388,958 3.1 24,072 3.0 1,521 2.7 30 to 34 years 364,911 2.9 24,088 3.0 1,564 2.8 35 to 39 years 384,115 3.0 25,794 3.2 1,634 3.0 40 to 44 years 429,693 3.4 29,490 3.7 1,942 3.5 45 to 49 years 485,220 3.8 33,277 4.2 2,290 4.1 50 to 54 years 500,352 3.9 32,631 4.1 2,477 4.5 55 to 59 years 448,846 3.5 28,326 3.5 2,122 3.8 60 to 64 years 385,288 3.0 23,413 2.9 1,616 2.9 65 to 69 years 294,349 2.3 17,813 2.2 1,322 2.4 70 to 74 years 234,349 1.8 13,936 1.7 1,071 1.9 75 to 79 years 208,442 1.6 12,680 1.6 984 1.8 80 to 84 years 190,830 1.5 11,848 1.5 1,067 1.9 85 years and over 210,280 1.7 14,038 1.8 1,396 2.5
Median age (years) 41.5 ( X ) 42.0 ( X ) 44.6 ( X )
16 years and over 5,319,183 41.9 333,021 41.6 23,837 43.1 18 years and over 5,149,312 40.5 322,177 40.3 23,036 41.6 21 years and over 4,862,615 38.3 309,072 38.6 22,220 40.2 62 years and over 1,362,056 10.7 83,979 10.5 6,767 12.2 65 years and over 1,138,250 9.0 70,315 8.8 5,840 10.6
Total population 12,702,379 100.0 799,874 100.0 55,310 100.0 One Race 12,464,544 98.1 784,354 98.1 54,160 97.9 White 10,406,288 81.9 649,021 81.1 44,083 79.7 Black or African American 1,377,689 10.8 69,351 8.7 6,850 12.4 American Indian and 26,843 0.2 1,174 0.1 57 0.1 Asian 349,088 2.7 51,565 6.4 2,686 4.9 Asian Indian 103,026 0.8 16,767 2.1 401 0.7 Chinese 84,812 0.7 9,642 1.2 367 0.7 Filipino 21,948 0.2 2,366 0.3 130 0.2
RACE

Japanese 6,492 0.1 706 0.1 45 0.1 Korean 40,505 0.3 13,417 1.7 1,337 2.4 Vietnamese 39,008 0.3 3,719 0.5 155 0.3 Other Asian [1] 53,297 0.4 4,948 0.6 251 0.5 Native Hawaiian and 3,653 0.0 296 0.0 8 0.0 Native Hawaiian 940 0.0 49 0.0 1 0.0 Guamanian or Chamorro 968 0.0 85 0.0 0 0.0 Samoan 453 0.0 62 0.0 2 0.0 Other Pacific Islander [2] 1,292 0.0 100 0.0 5 0.0 Some Other Race 300,983 2.4 12,947 1.6 476 0.9 Two or More Races 237,835 1.9 15,520 1.9 1,150 2.1 White; American Indian and Alaska Native [3]
27,502 0.2 1,325 0.2 94 0.2
White; Asian [3] 36,127 0.3 3,655 0.5 240 0.4 White; Black or African 87,287 0.7 5,397 0.7 400 0.7 White; Some Other Race 27,627 0.2 1,305 0.2 105 0.2
Race alone or in combination with one or more White 10,604,187 83.5 661,998 82.8 45,025 81.4 Black or African American 1,507,965 11.9 77,347 9.7 7,513 13.6 American Indian and 81,092 0.6 4,225 0.5 296 0.5 Asian 402,587 3.2 56,841 7.1 3,030 5.5 Native Hawaiian and Other 12,424 0.1 775 0.1 53 0.1 Some Other Race 352,183 2.8 15,601 2.0 664 1.2
Total population 12,702,379 100.0 799,874 100.0 55,310 100.0 Hispanic or Latino (of any 719,660 5.7 34,233 4.3 1,771 3.2 Mexican 129,568 1.0 13,386 1.7 261 0.5 Puerto Rican 366,082 2.9 9,356 1.2 683 1.2 Cuban 17,930 0.1 1,338 0.2 111 0.2 Other Hispanic or Latino 206,080 1.6 10,153 1.3 716 1.3 Not Hispanic or Latino 11,982,719 94.3 765,641 95.7 53,539 96.8
Total population 12,702,379 100.0 799,874 100.0 55,310 100.0 Hispanic or Latino 719,660 5.7 34,233 4.3 1,771 3.2 White alone 311,636 2.5 17,237 2.2 961 1.7 Black or African American 50,598 0.4 1,769 0.2 139 0.3 American Indian and 9,934 0.1 383 0.0 17 0.0 Asian alone 2,800 0.0 211 0.0 13 0.0 Native Hawaiian and Other Pacific Islander alone
938 0.0 75 0.0 1 0.0
Some Other Race alone 284,514 2.2 11,741 1.5 389 0.7 Two or More Races 59,240 0.5 2,817 0.4 251 0.5 Not Hispanic or Latino 11,982,719 94.3 765,641 95.7 53,539 96.8 White alone 10,094,652 79.5 631,784 79.0 43,122 78.0 Black or African American 1,327,091 10.4 67,582 8.4 6,711 12.1 American Indian and 16,909 0.1 791 0.1 40 0.1 Asian alone 346,288 2.7 51,354 6.4 2,673 4.8
HISPANIC OR LATINO
HISPANIC OR LATINO AND RACE
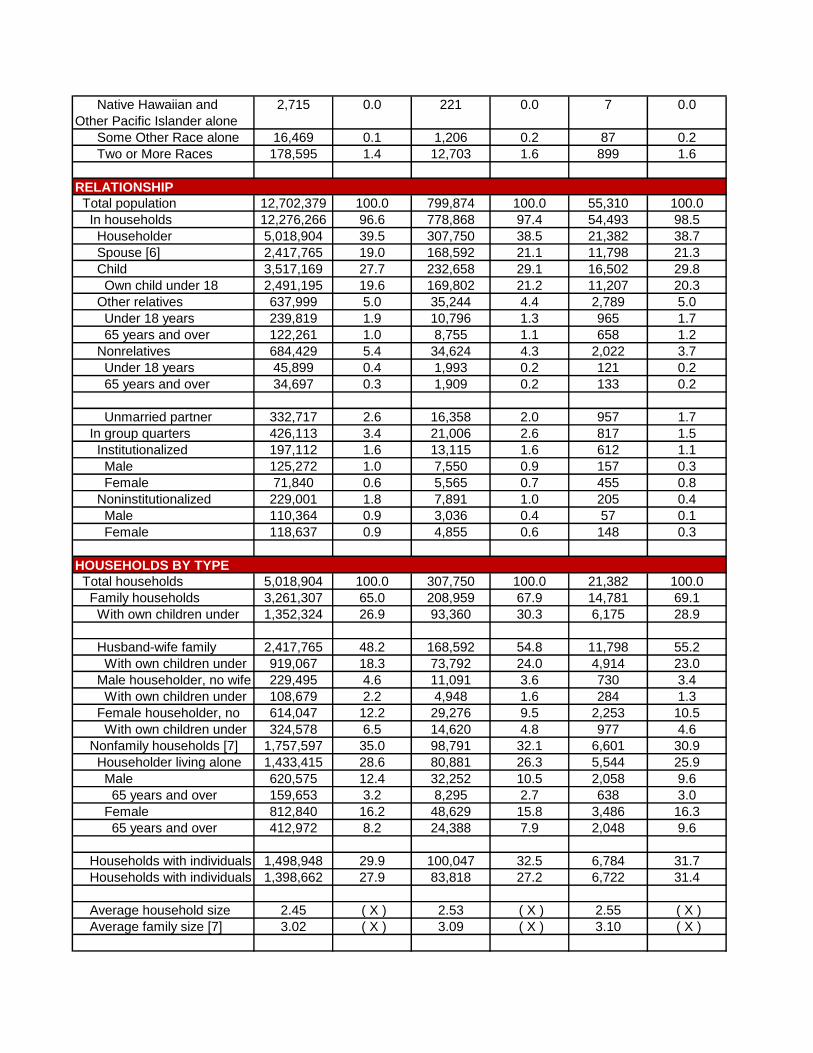
Native Hawaiian and Other Pacific Islander alone
2,715 0.0 221 0.0 7 0.0
Some Other Race alone 16,469 0.1 1,206 0.2 87 0.2 Two or More Races 178,595 1.4 12,703 1.6 899 1.6
Total population 12,702,379 100.0 799,874 100.0 55,310 100.0 In households 12,276,266 96.6 778,868 97.4 54,493 98.5 Householder 5,018,904 39.5 307,750 38.5 21,382 38.7 Spouse [6] 2,417,765 19.0 168,592 21.1 11,798 21.3 Child 3,517,169 27.7 232,658 29.1 16,502 29.8 Own child under 18 2,491,195 19.6 169,802 21.2 11,207 20.3 Other relatives 637,999 5.0 35,244 4.4 2,789 5.0 Under 18 years 239,819 1.9 10,796 1.3 965 1.7 65 years and over 122,261 1.0 8,755 1.1 658 1.2 Nonrelatives 684,429 5.4 34,624 4.3 2,022 3.7 Under 18 years 45,899 0.4 1,993 0.2 121 0.2 65 years and over 34,697 0.3 1,909 0.2 133 0.2
Unmarried partner 332,717 2.6 16,358 2.0 957 1.7 In group quarters 426,113 3.4 21,006 2.6 817 1.5 Institutionalized 197,112 1.6 13,115 1.6 612 1.1 Male 125,272 1.0 7,550 0.9 157 0.3 Female 71,840 0.6 5,565 0.7 455 0.8 Noninstitutionalized 229,001 1.8 7,891 1.0 205 0.4 Male 110,364 0.9 3,036 0.4 57 0.1 Female 118,637 0.9 4,855 0.6 148 0.3
Total households 5,018,904 100.0 307,750 100.0 21,382 100.0 Family households 3,261,307 65.0 208,959 67.9 14,781 69.1 With own children under 1,352,324 26.9 93,360 30.3 6,175 28.9
Husband-wife family 2,417,765 48.2 168,592 54.8 11,798 55.2 With own children under 919,067 18.3 73,792 24.0 4,914 23.0 Male householder, no wife 229,495 4.6 11,091 3.6 730 3.4 With own children under 108,679 2.2 4,948 1.6 284 1.3 Female householder, no 614,047 12.2 29,276 9.5 2,253 10.5 With own children under 324,578 6.5 14,620 4.8 977 4.6 Nonfamily households [7] 1,757,597 35.0 98,791 32.1 6,601 30.9 Householder living alone 1,433,415 28.6 80,881 26.3 5,544 25.9 Male 620,575 12.4 32,252 10.5 2,058 9.6 65 years and over 159,653 3.2 8,295 2.7 638 3.0 Female 812,840 16.2 48,629 15.8 3,486 16.3 65 years and over 412,972 8.2 24,388 7.9 2,048 9.6
Households with individuals 1,498,948 29.9 100,047 32.5 6,784 31.7 Households with individuals 1,398,662 27.9 83,818 27.2 6,722 31.4
Average household size 2.45 ( X ) 2.53 ( X ) 2.55 ( X ) Average family size [7] 3.02 ( X ) 3.09 ( X ) 3.10 ( X )
RELATIONSHIP
HOUSEHOLDS BY TYPE

Total housing units 5,567,315 100.0 325,735 100.0 22,369 100.0 Occupied housing units 5,018,904 90.1 307,750 94.5 21,382 95.6 Vacant housing units 548,411 9.9 17,985 5.5 987 4.4 For rent 135,262 2.4 8,532 2.6 425 1.9 Rented, not occupied 9,386 0.2 484 0.1 49 0.2 For sale only 64,818 1.2 3,012 0.9 159 0.7 Sold, not occupied 20,131 0.4 728 0.2 48 0.2 For seasonal, recreational, or occasional
161,582 2.9 1,498 0.5 98 0.4
All other vacants 157,232 2.8 3,731 1.1 208 0.9
Homeowner vacancy rate 1.8 ( X ) 1.3 ( X ) 0.9 ( X ) Rental vacancy rate 8.1 ( X ) 9.3 ( X ) 8.3 ( X )
Occupied housing units 5,018,904 100.0 307,750 100.0 21,382 100.0 Owner-occupied housing 3,491,722 69.6 225,001 73.1 16,718 78.2 Population in owner- 8,974,740 ( X ) 606,576 ( X ) 45,400 ( X ) Average household size of owner-occupied units
2.57 ( X ) 2.70 ( X ) 2.72 ( X )
Renter-occupied housing 1,527,182 30.4 82,749 26.9 4,664 21.8 Population in renter- 3,301,526 ( X ) 172,292 ( X ) 9,093 ( X ) Average household size of renter-occupied units
2.16 ( X ) 2.08 ( X ) 1.95 ( X )
HOUSING OCCUPANCY
HOUSING TENURE

Both
sexesMale Female
Both
sexesMale Female
Both
sexesMale Female
Total population 12,702,37 6,190,363 6,512,016 100.0 100.0 100.0 95.1 799,874 387,964 411,910 Under 5 years 729,538 373,216 356,322 5.7 6.0 5.5 104.7 47,305 24,303 23,002 5 to 9 years 753,635 384,359 369,276 5.9 6.2 5.7 104.1 50,313 25,524 24,789 10 to 14 years 791,151 405,227 385,924 6.2 6.5 5.9 105.0 52,570 26,862 25,708 15 to 19 years 905,066 462,465 442,601 7.1 7.5 6.8 104.5 51,581 26,392 25,189 20 to 24 years 874,146 441,886 432,260 6.9 7.1 6.6 102.2 43,590 21,774 21,816 25 to 29 years 781,527 392,569 388,958 6.2 6.3 6.0 100.9 48,681 24,609 24,072 30 to 34 years 729,592 364,681 364,911 5.7 5.9 5.6 99.9 47,960 23,872 24,088 35 to 39 years 764,287 380,172 384,115 6.0 6.1 5.9 99.0 51,136 25,342 25,794 40 to 44 years 851,382 421,689 429,693 6.7 6.8 6.6 98.1 57,748 28,258 29,490 45 to 49 years 955,763 470,543 485,220 7.5 7.6 7.5 97.0 64,482 31,205 33,277 50 to 54 years 984,641 484,289 500,352 7.8 7.8 7.7 96.8 63,829 31,198 32,631 55 to 59 years 879,048 430,202 448,846 6.9 6.9 6.9 95.8 54,755 26,429 28,326 60 to 64 years 743,296 358,008 385,288 5.9 5.8 5.9 92.9 45,197 21,784 23,413 65 to 69 years 553,002 258,653 294,349 4.4 4.2 4.5 87.9 33,312 15,499 17,813 70 to 74 years 426,536 192,187 234,349 3.4 3.1 3.6 82.0 25,180 11,244 13,936 75 to 79 years 362,332 153,890 208,442 2.9 2.5 3.2 73.8 22,029 9,349 12,680 80 to 84 years 311,761 120,931 190,830 2.5 2.0 2.9 63.4 19,591 7,743 11,848 85 to 89 years 202,117 68,252 133,865 1.6 1.1 2.1 51.0 13,365 4,635 8,730 90 years and over 103,559 27,144 76,415 0.8 0.4 1.2 35.5 7,250 1,942 5,308
Under 18 years 2,792,155 1,429,451 1,362,704 22.0 23.1 20.9 104.9 183,499 93,766 89,733 18 to 64 years 7,950,917 3,939,855 4,011,062 62.6 63.6 61.6 98.2 495,648 243,786 251,862 18 to 24 years 1,261,381 637,702 623,679 9.9 10.3 9.6 102.2 61,860 31,089 30,771 25 to 44 years 3,126,788 1,559,111 1,567,677 24.6 25.2 24.1 99.5 205,525 102,081 103,444 25 to 34 years 1,511,119 757,250 753,869 11.9 12.2 11.6 100.4 96,641 48,481 48,160 35 to 44 years 1,615,669 801,861 813,808 12.7 13.0 12.5 98.5 108,884 53,600 55,284 45 to 64 years 3,562,748 1,743,042 1,819,706 28.0 28.2 27.9 95.8 228,263 110,616 117,647 45 to 54 years 1,940,404 954,832 985,572 15.3 15.4 15.1 96.9 128,311 62,403 65,908
Pennsylvania Montgomery County, Pennsylvania
QT-P1-Geography-Abington township, Montgomery County, Pennsylvania: Age Groups and Sex: 20102010 Census Summary File 1
Age Males per
100
females
Number Percent Number

55 to 64 years 1,622,344 788,210 834,134 12.8 12.7 12.8 94.5 99,952 48,213 51,739 65 years and over 1,959,307 821,057 1,138,250 15.4 13.3 17.5 72.1 120,727 50,412 70,315 65 to 74 years 979,538 450,840 528,698 7.7 7.3 8.1 85.3 58,492 26,743 31,749 75 to 84 years 674,093 274,821 399,272 5.3 4.4 6.1 68.8 41,620 17,092 24,528 85 years and over 305,676 95,396 210,280 2.4 1.5 3.2 45.4 20,615 6,577 14,038
16 years and over 10,260,29 4,941,116 5,319,183 80.8 79.8 81.7 92.9 638,702 305,681 333,021 18 years and over 9,910,224 4,760,912 5,149,312 78.0 76.9 79.1 92.5 616,375 294,198 322,177 21 years and over 9,331,047 4,468,432 4,862,615 73.5 72.2 74.7 91.9 589,989 280,917 309,072 60 years and over 2,702,603 1,179,065 1,523,538 21.3 19.0 23.4 77.4 165,924 72,196 93,728 62 years and over 2,390,028 1,027,972 1,362,056 18.8 16.6 20.9 75.5 146,928 62,949 83,979 67 years and over 1,727,684 711,744 1,015,940 13.6 11.5 15.6 70.1 106,505 43,845 62,660 75 years and over 979,769 370,217 609,552 7.7 6.0 9.4 60.7 62,235 23,669 38,566
Median age (years) 40.1 38.7 41.5 ( X ) ( X ) ( X ) ( X ) 40.6 39.2 42.0

Both
sexesMale Female Both sexes Male Female Both sexes Male Female
100.0 100.0 100.0 94.2 55,310 26,274 29,036 100.0 100.0 100.0 90.55.9 6.3 5.6 105.7 3,113 1,596 1,517 5.6 6.1 5.2 105.26.3 6.6 6.0 103.0 3,305 1,659 1,646 6.0 6.3 5.7 100.86.6 6.9 6.2 104.5 3,476 1,823 1,653 6.3 6.9 5.7 110.36.4 6.8 6.1 104.8 3,612 1,854 1,758 6.5 7.1 6.1 105.55.4 5.6 5.3 99.8 2,900 1,444 1,456 5.2 5.5 5.0 99.26.1 6.3 5.8 102.2 2,994 1,473 1,521 5.4 5.6 5.2 96.86.0 6.2 5.8 99.1 3,046 1,482 1,564 5.5 5.6 5.4 94.86.4 6.5 6.3 98.2 3,077 1,443 1,634 5.6 5.5 5.6 88.37.2 7.3 7.2 95.8 3,739 1,797 1,942 6.8 6.8 6.7 92.58.1 8.0 8.1 93.8 4,372 2,082 2,290 7.9 7.9 7.9 90.98.0 8.0 7.9 95.6 4,701 2,224 2,477 8.5 8.5 8.5 89.86.8 6.8 6.9 93.3 4,143 2,021 2,122 7.5 7.7 7.3 95.25.7 5.6 5.7 93.0 3,145 1,529 1,616 5.7 5.8 5.6 94.64.2 4.0 4.3 87.0 2,419 1,097 1,322 4.4 4.2 4.6 83.03.1 2.9 3.4 80.7 1,870 799 1,071 3.4 3.0 3.7 74.62.8 2.4 3.1 73.7 1,693 709 984 3.1 2.7 3.4 72.12.4 2.0 2.9 65.4 1,735 668 1,067 3.1 2.5 3.7 62.61.7 1.2 2.1 53.1 1,209 377 832 2.2 1.4 2.9 45.30.9 0.5 1.3 36.6 761 197 564 1.4 0.7 1.9 34.9
22.9 24.2 21.8 104.5 12,298 6,298 6,000 22.2 24.0 20.7 105.062.0 62.8 61.1 96.8 33,325 16,129 17,196 60.3 61.4 59.2 93.87.7 8.0 7.5 101.0 4,108 2,078 2,030 7.4 7.9 7.0 102.425.7 26.3 25.1 98.7 12,856 6,195 6,661 23.2 23.6 22.9 93.012.1 12.5 11.7 100.7 6,040 2,955 3,085 10.9 11.2 10.6 95.813.6 13.8 13.4 97.0 6,816 3,240 3,576 12.3 12.3 12.3 90.628.5 28.5 28.6 94.0 16,361 7,856 8,505 29.6 29.9 29.3 92.416.0 16.1 16.0 94.7 9,073 4,306 4,767 16.4 16.4 16.4 90.3
Montgomery County, Pennsylvania Abington Township, Pennsylvania
QT-P1-Geography-Abington township, Montgomery County, Pennsylvania: Age Groups and Sex: 20102010 Census Summary File 1
Males per
100
females
Males per
100
females
Number PercentPercent

12.5 12.4 12.6 93.2 7,288 3,550 3,738 13.2 13.5 12.9 95.015.1 13.0 17.1 71.7 9,687 3,847 5,840 17.5 14.6 20.1 65.97.3 6.9 7.7 84.2 4,289 1,896 2,393 7.8 7.2 8.2 79.25.2 4.4 6.0 69.7 3,428 1,377 2,051 6.2 5.2 7.1 67.12.6 1.7 3.4 46.9 1,970 574 1,396 3.6 2.2 4.8 41.1
79.9 78.8 80.8 91.8 44,641 20,804 23,837 80.7 79.2 82.1 87.377.1 75.8 78.2 91.3 43,012 19,976 23,036 77.8 76.0 79.3 86.773.8 72.4 75.0 90.9 41,276 19,056 22,220 74.6 72.5 76.5 85.820.7 18.6 22.8 77.0 12,832 5,376 7,456 23.2 20.5 25.7 72.118.4 16.2 20.4 75.0 11,449 4,682 6,767 20.7 17.8 23.3 69.213.3 11.3 15.2 70.0 8,678 3,383 5,295 15.7 12.9 18.2 63.97.8 6.1 9.4 61.4 5,398 1,951 3,447 9.8 7.4 11.9 56.6
( X ) ( X ) ( X ) ( X ) 42.8 41.0 44.6 ( X ) ( X ) ( X ) ( X )

Number Percent Number Percent Number Percent
Total housing units 5,567,315 100.0 325,735 100.0 22,369 100.0 Occupied housing units 5,018,904 90.1 307,750 94.5 21,382 95.6 Vacant housing units 548,411 9.9 17,985 5.5 987 4.4
Occupied housing units 5,018,904 100.0 307,750 100.0 21,382 100.0 Owner occupied 3,491,722 69.6 225,001 73.1 16,718 78.2 Owned with a mortgage or loan 2,268,674 45.2 165,021 53.6 11,842 55.4 Owned free and clear 1,223,048 24.4 59,980 19.5 4,876 22.8 Renter occupied 1,527,182 30.4 82,749 26.9 4,664 21.8
Vacant housing units 548,411 100.0 17,985 100.0 987 100.0 For rent 135,262 24.7 8,532 47.4 425 43.1 Rented, not occupied 9,386 1.7 484 2.7 49 5.0 For sale only 64,818 11.8 3,012 16.7 159 16.1 Sold, not occupied 20,131 3.7 728 4.0 48 4.9 For seasonal, recreational, or occasional 161,582 29.5 1,498 8.3 98 9.9 For migratory workers 411 0.1 26 0.1 0 0.0 Other vacant 156,821 28.6 3,705 20.6 208 21.1
Occupied housing units 5,018,904 100.0 307,750 100.0 21,382 100.0 Owner-occupied housing units 3,491,722 69.6 225,001 73.1 16,718 78.2 Not Hispanic or Latino householder 3,408,824 67.9 221,551 72.0 16,423 76.8 White alone householder 3,097,608 61.7 197,934 64.3 14,097 65.9 Black or African American alone 224,161 4.5 12,000 3.9 1,711 8.0 American Indian and Alaska Native alone 3,523 0.1 150 0.0 8 0.0 Asian alone householder 61,832 1.2 9,931 3.2 472 2.2 Native Hawaiian and Other Pacific 468 0.0 40 0.0 1 0.0
QT-H1-Geography-Abington township, Montgomery County, Pennsylvania: General Housing Characteristics: 2010
Subject
2010 Census Summary File 1
OCCUPANCY STATUS
VACANCY STATUS
TENURE BY HISPANIC OR LATINO ORIGIN OF HOUSEHOLDER BY RACE OF HOUSEHOLDER
PennsylvaniaMontgomery County,
Pennsylvania
Abington Township,
Pennsylvania
TENURE

Some Other Race alone householder 1,656 0.0 122 0.0 12 0.1 Two or More Races householder 19,576 0.4 1,374 0.4 122 0.6 Hispanic or Latino householder 82,898 1.7 3,450 1.1 295 1.4 White alone householder 42,397 0.8 2,339 0.8 182 0.9 Black or African American alone 4,690 0.1 156 0.1 17 0.1 American Indian and Alaska Native alone 1,039 0.0 35 0.0 3 0.0 Asian alone householder 372 0.0 33 0.0 2 0.0 Native Hawaiian and Other Pacific 76 0.0 3 0.0 0 0.0 Some Other Race alone householder 29,105 0.6 670 0.2 58 0.3 Two or More Races householder 5,219 0.1 214 0.1 33 0.2 Renter-occupied housing units 1,527,182 30.4 82,749 26.9 4,664 21.8 Not Hispanic or Latino householder 1,414,534 28.2 77,682 25.2 4,515 21.1 White alone householder 1,079,135 21.5 58,105 18.9 3,283 15.4 Black or African American alone 262,013 5.2 12,031 3.9 770 3.6 American Indian and Alaska Native alone 3,292 0.1 142 0.0 7 0.0 Asian alone householder 46,486 0.9 6,046 2.0 392 1.8 Native Hawaiian and Other Pacific 420 0.0 34 0.0 2 0.0 Some Other Race alone householder 2,070 0.0 121 0.0 3 0.0 Two or More Races householder 21,118 0.4 1,203 0.4 58 0.3 Hispanic or Latino householder 112,648 2.2 5,067 1.6 149 0.7 White alone householder 45,197 0.9 2,256 0.7 82 0.4 Black or African American alone 8,102 0.2 295 0.1 15 0.1 American Indian and Alaska Native alone 1,719 0.0 58 0.0 3 0.0 Asian alone householder 370 0.0 13 0.0 0 0.0 Native Hawaiian and Other Pacific 163 0.0 13 0.0 1 0.0 Some Other Race alone householder 49,406 1.0 2,108 0.7 38 0.2 Two or More Races householder 7,691 0.2 324 0.1 10 0.0
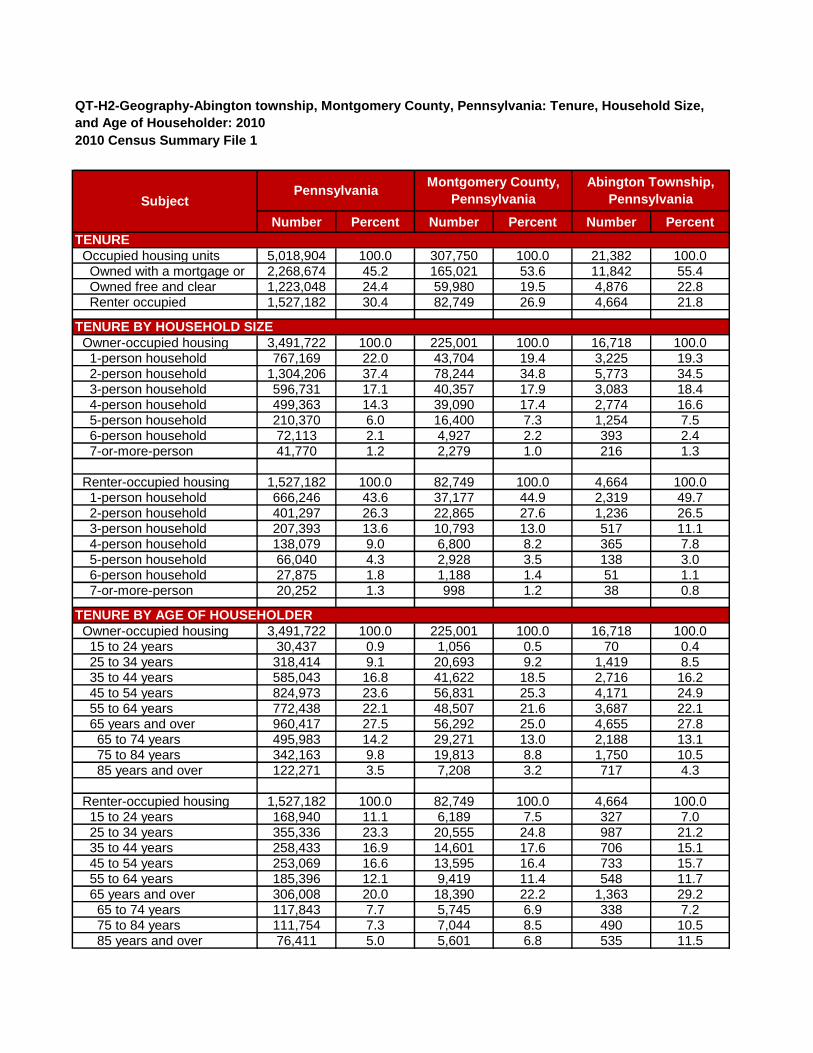
Number Percent Number Percent Number Percent
Occupied housing units 5,018,904 100.0 307,750 100.0 21,382 100.0 Owned with a mortgage or 2,268,674 45.2 165,021 53.6 11,842 55.4 Owned free and clear 1,223,048 24.4 59,980 19.5 4,876 22.8 Renter occupied 1,527,182 30.4 82,749 26.9 4,664 21.8
Owner-occupied housing 3,491,722 100.0 225,001 100.0 16,718 100.0 1-person household 767,169 22.0 43,704 19.4 3,225 19.3 2-person household 1,304,206 37.4 78,244 34.8 5,773 34.5 3-person household 596,731 17.1 40,357 17.9 3,083 18.4 4-person household 499,363 14.3 39,090 17.4 2,774 16.6 5-person household 210,370 6.0 16,400 7.3 1,254 7.5 6-person household 72,113 2.1 4,927 2.2 393 2.4 7-or-more-person 41,770 1.2 2,279 1.0 216 1.3
Renter-occupied housing 1,527,182 100.0 82,749 100.0 4,664 100.0 1-person household 666,246 43.6 37,177 44.9 2,319 49.7 2-person household 401,297 26.3 22,865 27.6 1,236 26.5 3-person household 207,393 13.6 10,793 13.0 517 11.1 4-person household 138,079 9.0 6,800 8.2 365 7.8 5-person household 66,040 4.3 2,928 3.5 138 3.0 6-person household 27,875 1.8 1,188 1.4 51 1.1 7-or-more-person 20,252 1.3 998 1.2 38 0.8
Owner-occupied housing 3,491,722 100.0 225,001 100.0 16,718 100.0 15 to 24 years 30,437 0.9 1,056 0.5 70 0.4 25 to 34 years 318,414 9.1 20,693 9.2 1,419 8.5 35 to 44 years 585,043 16.8 41,622 18.5 2,716 16.2 45 to 54 years 824,973 23.6 56,831 25.3 4,171 24.9 55 to 64 years 772,438 22.1 48,507 21.6 3,687 22.1 65 years and over 960,417 27.5 56,292 25.0 4,655 27.8 65 to 74 years 495,983 14.2 29,271 13.0 2,188 13.1 75 to 84 years 342,163 9.8 19,813 8.8 1,750 10.5 85 years and over 122,271 3.5 7,208 3.2 717 4.3
Renter-occupied housing 1,527,182 100.0 82,749 100.0 4,664 100.0 15 to 24 years 168,940 11.1 6,189 7.5 327 7.0 25 to 34 years 355,336 23.3 20,555 24.8 987 21.2 35 to 44 years 258,433 16.9 14,601 17.6 706 15.1 45 to 54 years 253,069 16.6 13,595 16.4 733 15.7 55 to 64 years 185,396 12.1 9,419 11.4 548 11.7 65 years and over 306,008 20.0 18,390 22.2 1,363 29.2 65 to 74 years 117,843 7.7 5,745 6.9 338 7.2 75 to 84 years 111,754 7.3 7,044 8.5 490 10.5 85 years and over 76,411 5.0 5,601 6.8 535 11.5
TENURE BY AGE OF HOUSEHOLDER
PennsylvaniaMontgomery County,
Pennsylvania
Abington Township,
Pennsylvania
QT-H2-Geography-Abington township, Montgomery County, Pennsylvania: Tenure, Household Size,
and Age of Householder: 2010
2010 Census Summary File 1
Subject
TENURE
TENURE BY HOUSEHOLD SIZE

EstimateMargin of
ErrorPercent
Percent Margin of
ErrorEstimate
Margin of
ErrorPercent
Percent Margin of
ErrorEstimate
Margin of
ErrorPercent
Percent Margin of
Error
Total households 4,952,566 +/-9,681 4,952,566 (X) 307,598 +/-1,198 307,598 (X) 21,287 +/-420 21,287 (X) Family households (families) 3,234,899 +/-10,218 65.30% +/-0.1 209,017 +/-1,533 68.00% +/-0.4 14,738 +/-321 69.20% +/-1.6 With own children under 18 years 1,363,109 +/-8,825 27.50% +/-0.1 94,803 +/-1,235 30.80% +/-0.4 6,010 +/-248 28.20% +/-1.2 Married-couple family 2,438,675 +/-13,662 49.20% +/-0.2 169,554 +/-1,658 55.10% +/-0.5 11,845 +/-311 55.60% +/-1.5 With own children under 18 years 937,877 +/-9,802 18.90% +/-0.2 74,657 +/-1,230 24.30% +/-0.4 4,833 +/-259 22.70% +/-1.4 Male householder, no wife present, family 209,217 +/-3,105 4.20% +/-0.1 10,730 +/-730 3.50% +/-0.2 653 +/-167 3.10% +/-0.8 With own children under 18 years 100,041 +/-2,021 2.00% +/-0.1 5,087 +/-489 1.70% +/-0.2 303 +/-114 1.40% +/-0.5 Female householder, no husband present, family 587,007 +/-5,119 11.90% +/-0.1 28,733 +/-1,023 9.30% +/-0.3 2,240 +/-261 10.50% +/-1.2 With own children under 18 years 325,191 +/-3,680 6.60% +/-0.1 15,059 +/-865 4.90% +/-0.3 874 +/-186 4.10% +/-0.8 Nonfamily households 1,717,667 +/-6,095 34.70% +/-0.1 98,581 +/-1,455 32.00% +/-0.4 6,549 +/-417 30.80% +/-1.6 Householder living alone 1,442,877 +/-6,095 29.10% +/-0.1 82,726 +/-1,421 26.90% +/-0.5 5,527 +/-379 26.00% +/-1.4 65 years and over 570,747 +/-6,242 11.50% +/-0.1 32,617 +/-899 10.60% +/-0.3 2,781 +/-261 13.10% +/-1.1
Households with one or more people under 18 years 1,493,320 +/-8,771 30.20% +/-0.1 100,844 +/-1,253 32.80% +/-0.4 6,557 +/-269 30.80% +/-1.3 Households with one or more people 65 years and over 1,364,955 +/-4,367 27.60% +/-0.1 82,187 +/-855 26.70% +/-0.3 6,810 +/-261 32.00% +/-1.0
Average household size 2.47 +/-0.01 (X) (X) 2.52 +/-0.01 (X) (X) 2.56 +/-0.05 (X) (X) Average family size 3.06 +/-0.01 (X) (X) 3.09 +/-0.02 (X) (X) 3.13 +/-0.05 (X) (X)
Population in households 12,229,824 ***** 12,229,824 (X) 774,470 +/-1,181 774,470 (X) 54,563 +/-319 54,563 (X) Householder 4,952,566 +/-9,681 40.50% +/-0.1 307,598 +/-1,198 39.70% +/-0.1 21,287 +/-420 39.00% +/-0.7 Spouse 2,437,162 +/-12,565 19.90% +/-0.1 169,434 +/-1,676 21.90% +/-0.2 11,845 +/-301 21.70% +/-0.5 Child 3,599,290 +/-7,628 29.40% +/-0.1 234,613 +/-1,728 30.30% +/-0.2 16,683 +/-440 30.60% +/-0.8 Other relatives 635,062 +/-10,376 5.20% +/-0.1 33,189 +/-1,603 4.30% +/-0.2 2,853 +/-446 5.20% +/-0.8 Nonrelatives 605,744 +/-9,181 5.00% +/-0.1 29,636 +/-1,519 3.80% +/-0.2 1,895 +/-351 3.50% +/-0.6 Unmarried partner 283,759 +/-3,684 2.30% +/-0.1 14,222 +/-871 1.80% +/-0.1 904 +/-221 1.70% +/-0.4
Males 15 years and over 5,002,050 +/-968 5,002,050 (X) 309,168 +/-67 309,168 (X) 21,266 +/-442 21,266 (X) Never married 1,743,913 +/-9,756 34.90% +/-0.2 96,312 +/-1,360 31.20% +/-0.4 6,338 +/-473 29.80% +/-1.9 Now married, except separated 2,594,380 +/-12,198 51.90% +/-0.2 179,918 +/-1,626 58.20% +/-0.5 12,540 +/-304 59.00% +/-1.6 Separated 96,885 +/-2,434 1.90% +/-0.1 4,314 +/-377 1.40% +/-0.1 344 +/-124 1.60% +/-0.6 Widowed 154,772 +/-2,392 3.10% +/-0.1 8,384 +/-435 2.70% +/-0.1 741 +/-176 3.50% +/-0.8 Divorced 412,100 +/-4,156 8.20% +/-0.1 20,240 +/-869 6.50% +/-0.3 1,303 +/-219 6.10% +/-1.0
Females 15 years and over 5,379,390 +/-736 5,379,390 (X) 336,246 +/-51 336,246 (X) 24,366 +/-416 24,366 (X) Never married 1,567,868 +/-7,363 29.10% +/-0.1 88,089 +/-1,180 26.20% +/-0.4 6,311 +/-438 25.90% +/-1.5 Now married, except separated 2,542,643 +/-11,097 47.30% +/-0.2 177,105 +/-1,648 52.70% +/-0.5 12,434 +/-305 51.00% +/-1.6 Separated 130,965 +/-2,709 2.40% +/-0.1 6,227 +/-532 1.90% +/-0.2 382 +/-140 1.60% +/-0.6 Widowed 604,247 +/-3,659 11.20% +/-0.1 34,717 +/-835 10.30% +/-0.2 3,218 +/-315 13.20% +/-1.3 Divorced 533,667 +/-5,601 9.90% +/-0.1 30,108 +/-1,065 9.00% +/-0.3 2,021 +/-232 8.30% +/-0.9
Number of women 15 to 50 years old who had a birth in the past 12 months
154,198 +/-2,582 154,198 (X) 9,447 +/-564 9,447 (X) 728 +/-165 728 (X)
Unmarried women (widowed, divorced, and never married) 56,948 +/-1,794 36.90% +/-1.0 1,869 +/-315 19.80% +/-3.1 100 +/-55 13.70% +/-7.2 Per 1,000 unmarried women 35 +/-1 (X) (X) 21 +/-4 (X) (X) 16 +/-9 (X) (X) Per 1,000 women 15 to 50 years old 51 +/-1 (X) (X) 49 +/-3 (X) (X) 57 +/-13 (X) (X) Per 1,000 women 15 to 19 years old 22 +/-2 (X) (X) 8 +/-4 (X) (X) 7 +/-12 (X) (X) Per 1,000 women 20 to 34 years old 96 +/-2 (X) (X) 94 +/-7 (X) (X) 89 +/-23 (X) (X) Per 1,000 women 35 to 50 years old 23 +/-1 (X) (X) 29 +/-3 (X) (X) 46 +/-18 (X) (X)
Number of grandparents living with own grandchildren under 18 years
220,659 +/-4,379 220,659 (X) 12,297 +/-780 12,297 (X) 959 +/-207 959 (X)
Responsible for grandchildren 84,229 +/-2,420 38.20% +/-0.8 3,248 +/-397 26.40% +/-2.6 236 +/-83 24.60% +/-8.8 Years responsible for grandchildren
Pennsylvania
DP02: SELECTED SOCIAL CHARACTERISTICS IN THE UNITED STATES2007-2011 American Community Survey 5-Year Estimates
Montgomery County, PA Abington township, Montgomery County, PA
HOUSEHOLDS BY TYPE
RELATIONSHIP
MARITAL STATUS
FERTILITY
GRANDPARENTS

Less than 1 year 18,560 +/-1,142 8.40% +/-0.5 821 +/-253 6.70% +/-2.0 61 +/-49 6.40% +/-5.2 1 or 2 years 21,118 +/-1,072 9.60% +/-0.4 789 +/-214 6.40% +/-1.7 37 +/-40 3.90% +/-4.2 3 or 4 years 13,761 +/-850 6.20% +/-0.4 644 +/-164 5.20% +/-1.3 42 +/-37 4.40% +/-3.8 5 or more years 30,790 +/-1,366 14.00% +/-0.6 994 +/-210 8.10% +/-1.6 96 +/-70 10.00% +/-7.3
Number of grandparents responsible for own grandchildren under 84,229 +/-2,420 84,229 (X) 3,248 +/-397 3,248 (X) 236 +/-83 236 (X) Who are female 54,332 +/-1,535 64.50% +/-0.8 2,086 +/-263 64.20% +/-3.6 182 +/-64 77.10% +/-10.4 Who are married 57,826 +/-1,918 68.70% +/-1.1 2,317 +/-341 71.30% +/-4.9 167 +/-79 70.80% +/-18.6
Population 3 years and over enrolled in school 3,179,333 +/-6,645 3,179,333 (X) 206,423 +/-1,679 206,423 (X) 13,747 +/-467 13,747 (X) Nursery school, preschool 196,964 +/-3,104 6.20% +/-0.1 15,582 +/-711 7.50% +/-0.3 953 +/-164 6.90% +/-1.2 Kindergarten 147,712 +/-2,356 4.60% +/-0.1 9,338 +/-603 4.50% +/-0.3 727 +/-128 5.30% +/-1.0 Elementary school (grades 1-8) 1,233,792 +/-3,284 38.80% +/-0.1 81,418 +/-860 39.40% +/-0.5 5,380 +/-368 39.10% +/-2.7 High school (grades 9-12) 685,921 +/-2,882 21.60% +/-0.1 44,080 +/-712 21.40% +/-0.3 2,933 +/-338 21.30% +/-2.1 College or graduate school 914,944 +/-5,784 28.80% +/-0.1 56,005 +/-1,514 27.10% +/-0.6 3,754 +/-410 27.30% +/-2.6
Population 25 years and over 8,611,136 +/-1,001 8,611,136 (X) 550,425 +/-95 550,425 (X) 39,355 +/-422 39,355 (X) Less than 9th grade 332,207 +/-4,279 3.90% +/-0.1 12,339 +/-775 2.20% +/-0.1 963 +/-223 2.40% +/-0.6 9th to 12th grade, no diploma 709,982 +/-5,346 8.20% +/-0.1 26,928 +/-902 4.90% +/-0.2 1,593 +/-277 4.00% +/-0.7 High school graduate (includes equivalency) 3,233,796 +/-11,253 37.60% +/-0.1 142,136 +/-2,157 25.80% +/-0.4 10,242 +/-569 26.00% +/-1.4 Some college, no degree 1,402,444 +/-7,670 16.30% +/-0.1 89,195 +/-2,013 16.20% +/-0.4 7,415 +/-492 18.80% +/-1.2 Associate's degree 636,147 +/-4,820 7.40% +/-0.1 35,270 +/-1,067 6.40% +/-0.2 2,513 +/-291 6.40% +/-0.7 Bachelor's degree 1,416,932 +/-8,658 16.50% +/-0.1 141,805 +/-1,984 25.80% +/-0.4 9,666 +/-527 24.60% +/-1.3 Graduate or professional degree 879,628 +/-7,498 10.20% +/-0.1 102,752 +/-2,132 18.70% +/-0.4 6,963 +/-564 17.70% +/-1.5
Percent high school graduate or higher (X) (X) 87.90% +/-0.1 (X) (X) 92.90% +/-0.2 (X) (X) 93.50% +/-0.9 Percent bachelor's degree or higher (X) (X) 26.70% +/-0.1 (X) (X) 44.40% +/-0.5 (X) (X) 42.30% +/-1.6
Civilian population 18 years and over 9,848,020 +/-812 9,848,020 (X) 611,341 +/-157 611,341 (X) 43,281 +/-318 43,281 (X) Civilian veterans 1,007,939 +/-4,857 10.20% +/-0.1 54,507 +/-982 8.90% +/-0.2 4,223 +/-336 9.80% +/-0.8
Total Civilian Noninstitutionalized Population (X) (X) (X) (X) (X) (X) (X) (X) (X) (X) (X) (X) With a disability (X) (X) (X) (X) (X) (X) (X) (X) (X) (X) (X) (X)
Under 18 years (X) (X) (X) (X) (X) (X) (X) (X) (X) (X) (X) (X) With a disability (X) (X) (X) (X) (X) (X) (X) (X) (X) (X) (X) (X)
18 to 64 years (X) (X) (X) (X) (X) (X) (X) (X) (X) (X) (X) (X) With a disability (X) (X) (X) (X) (X) (X) (X) (X) (X) (X) (X) (X)
65 years and over (X) (X) (X) (X) (X) (X) (X) (X) (X) (X) (X) (X) With a disability (X) (X) (X) (X) (X) (X) (X) (X) (X) (X) (X) (X)
Population 1 year and over 12,522,536 +/-2,005 12,522,536 (X) 785,970 +/-467 785,970 (X) 54,718 +/-159 54,718 (X) Same house 10,984,285 +/-15,381 87.70% +/-0.1 704,210 +/-2,797 89.60% +/-0.4 50,005 +/-573 91.40% +/-1.0 Different house in the U.S. 1,486,529 +/-15,239 11.90% +/-0.1 77,716 +/-2,720 9.90% +/-0.3 4,562 +/-551 8.30% +/-1.0 Same county 919,063 +/-10,762 7.30% +/-0.1 38,865 +/-2,033 4.90% +/-0.3 2,372 +/-451 4.30% +/-0.8 Different county 567,466 +/-8,377 4.50% +/-0.1 38,851 +/-1,871 4.90% +/-0.2 2,190 +/-426 4.00% +/-0.8 Same state 324,087 +/-5,383 2.60% +/-0.1 25,027 +/-1,617 3.20% +/-0.2 1,425 +/-357 2.60% +/-0.7 Different state 243,379 +/-5,861 1.90% +/-0.1 13,824 +/-1,183 1.80% +/-0.2 765 +/-249 1.40% +/-0.5 Abroad 51,722 +/-2,450 0.40% +/-0.1 4,044 +/-688 0.50% +/-0.1 151 +/-92 0.30% +/-0.2
Total population 12,660,739 ***** 12,660,739 (X) 794,921 ***** 794,921 (X) 55,429 +/-39 55,429 (X) Native 11,937,313 +/-7,841 94.30% +/-0.1 719,352 +/-1,355 90.50% +/-0.2 50,245 +/-617 90.60% +/-1.1 Born in United States 11,746,779 +/-7,392 92.80% +/-0.1 711,746 +/-1,480 89.50% +/-0.2 49,930 +/-628 90.10% +/-1.1 State of residence 9,400,284 +/-12,098 74.20% +/-0.1 568,693 +/-3,005 71.50% +/-0.4 41,795 +/-716 75.40% +/-1.3 Different state 2,346,495 +/-11,570 18.50% +/-0.1 143,053 +/-2,871 18.00% +/-0.4 8,135 +/-621 14.70% +/-1.1
Born in Puerto Rico, U.S. Island areas, or born abroad to American parent(s)
190,534 +/-3,829 1.50% +/-0.1 7,606 +/-678 1.00% +/-0.1 315 +/-95 0.60% +/-0.2
Foreign born 723,426 +/-7,841 5.70% +/-0.1 75,569 +/-1,355 9.50% +/-0.2 5,184 +/-617 9.40% +/-1.1
EDUCATIONAL ATTAINMENT
VETERAN STATUS
DISABILITY STATUS OF THE CIVILIAN NONINSTITUTIONALIZED POPULATION
RESIDENCE 1 YEAR AGO
PLACE OF BIRTH
SCHOOL ENROLLMENT

Foreign-born population 723,426 +/-7,841 723,426 (X) 75,569 +/-1,355 75,569 (X) 5,184 +/-617 5,184 (X) Naturalized U.S. citizen 362,007 +/-4,659 50.00% +/-0.5 40,261 +/-1,221 53.30% +/-1.5 3,282 +/-438 63.30% +/-5.4 Not a U.S. citizen 361,419 +/-5,724 50.00% +/-0.5 35,308 +/-1,374 46.70% +/-1.5 1,902 +/-393 36.70% +/-5.4
Population born outside the United States 913,960 +/-7,392 913,960 (X) 83,175 +/-1,480 83,175 (X) 5,499 +/-628 5,499 (X)
Native 190,534 +/-3,829 190,534 (X) 7,606 +/-678 7,606 (X) 315 +/-95 315 (X) Entered 2010 or later 47,047 +/-2,197 24.70% +/-1.0 1,482 +/-350 19.50% +/-3.9 19 +/-23 6.00% +/-7.9 Entered before 2010 143,487 +/-3,098 75.30% +/-1.0 6,124 +/-562 80.50% +/-3.9 296 +/-99 94.00% +/-7.9
Foreign born 723,426 +/-7,841 723,426 (X) 75,569 +/-1,355 75,569 (X) 5,184 +/-617 5,184 (X) Entered 2010 or later 264,272 +/-5,879 36.50% +/-0.6 25,157 +/-1,235 33.30% +/-1.4 1,412 +/-395 27.20% +/-6.3 Entered before 2010 459,154 +/-5,605 63.50% +/-0.6 50,412 +/-1,277 66.70% +/-1.4 3,772 +/-495 72.80% +/-6.3
Foreign-born population, excluding population born at sea 723,426 +/-7,841 723,426 (X) 75,569 +/-1,355 75,569 (X) 5,184 +/-617 5,184 (X) Europe 176,725 +/-3,754 24.40% +/-0.4 16,207 +/-850 21.40% +/-1.0 1,577 +/-290 30.40% +/-5.2 Asia 270,285 +/-3,221 37.40% +/-0.4 37,687 +/-853 49.90% +/-1.3 2,062 +/-439 39.80% +/-7.0 Africa 49,477 +/-2,485 6.80% +/-0.3 3,659 +/-672 4.80% +/-0.9 211 +/-108 4.10% +/-2.0 Oceania 3,180 +/-468 0.40% +/-0.1 258 +/-128 0.30% +/-0.2 15 +/-23 0.30% +/-0.5 Latin America 206,851 +/-5,112 28.60% +/-0.6 16,070 +/-997 21.30% +/-1.2 1,191 +/-357 23.00% +/-5.7 Northern America 16,908 +/-1,011 2.30% +/-0.1 1,688 +/-254 2.20% +/-0.3 128 +/-97 2.50% +/-1.9
Population 5 years and over 11,933,062 +/-399 11,933,062 (X) 747,975 +/-69 747,975 (X) 52,443 +/-304 52,443 (X) English only 10,734,015 +/-8,525 90.00% +/-0.1 657,282 +/-1,933 87.90% +/-0.3 46,705 +/-706 89.10% +/-1.2 Language other than English 1,199,047 +/-8,500 10.00% +/-0.1 90,693 +/-1,928 12.10% +/-0.3 5,738 +/-623 10.90% +/-1.2 Speak English less than "very well" 453,258 +/-6,077 3.80% +/-0.1 34,141 +/-1,282 4.60% +/-0.2 2,428 +/-445 4.60% +/-0.9 Spanish 501,460 +/-4,597 4.20% +/-0.1 23,093 +/-916 3.10% +/-0.1 1,136 +/-341 2.20% +/-0.6 Speak English less than "very well" 196,334 +/-3,596 1.60% +/-0.1 10,466 +/-807 1.40% +/-0.1 322 +/-204 0.60% +/-0.4 Other Indo-European languages 429,336 +/-5,906 3.60% +/-0.1 33,658 +/-1,505 4.50% +/-0.2 2,087 +/-352 4.00% +/-0.7 Speak English less than "very well" 133,336 +/-3,237 1.10% +/-0.1 8,918 +/-649 1.20% +/-0.1 651 +/-156 1.20% +/-0.3 Asian and Pacific Islander languages 208,019 +/-3,230 1.70% +/-0.1 28,982 +/-1,041 3.90% +/-0.1 2,239 +/-454 4.30% +/-0.9 Speak English less than "very well" 105,160 +/-2,424 0.90% +/-0.1 13,725 +/-828 1.80% +/-0.1 1,400 +/-370 2.70% +/-0.7 Other languages 60,232 +/-3,264 0.50% +/-0.1 4,960 +/-660 0.70% +/-0.1 276 +/-133 0.50% +/-0.3 Speak English less than "very well" 18,428 +/-1,675 0.20% +/-0.1 1,032 +/-276 0.10% +/-0.1 55 +/-58 0.10% +/-0.1
Total population 12,660,739 ***** 12,660,739 (X) 794,921 ***** 794,921 (X) 55,429 +/-39 55,429 (X) American 584,764 +/-6,702 4.60% +/-0.1 29,264 +/-1,858 3.70% +/-0.2 1,990 +/-312 3.60% +/-0.6 Arab 61,064 +/-2,797 0.50% +/-0.1 4,020 +/-755 0.50% +/-0.1 197 +/-98 0.40% +/-0.2 Czech 56,779 +/-2,105 0.40% +/-0.1 3,231 +/-485 0.40% +/-0.1 147 +/-88 0.30% +/-0.2 Danish 18,810 +/-1,160 0.10% +/-0.1 1,561 +/-316 0.20% +/-0.1 52 +/-39 0.10% +/-0.1 Dutch 257,351 +/-4,421 2.00% +/-0.1 12,376 +/-903 1.60% +/-0.1 448 +/-149 0.80% +/-0.3 English 1,032,951 +/-9,081 8.20% +/-0.1 75,412 +/-2,317 9.50% +/-0.3 4,867 +/-517 8.80% +/-0.9 French (except Basque) 229,064 +/-3,786 1.80% +/-0.1 13,924 +/-1,026 1.80% +/-0.1 1,082 +/-310 2.00% +/-0.6 French Canadian 29,998 +/-1,682 0.20% +/-0.1 2,087 +/-399 0.30% +/-0.1 129 +/-76 0.20% +/-0.1 German 3,489,253 +/-11,152 27.60% +/-0.1 188,986 +/-2,755 23.80% +/-0.3 12,675 +/-754 22.90% +/-1.4 Greek 66,002 +/-2,161 0.50% +/-0.1 4,056 +/-496 0.50% +/-0.1 260 +/-128 0.50% +/-0.2 Hungarian 141,643 +/-3,035 1.10% +/-0.1 8,059 +/-724 1.00% +/-0.1 422 +/-132 0.80% +/-0.2 Irish 2,248,917 +/-12,945 17.80% +/-0.1 180,697 +/-3,378 22.70% +/-0.4 14,410 +/-1,008 26.00% +/-1.8 Italian 1,570,324 +/-10,762 12.40% +/-0.1 123,076 +/-2,869 15.50% +/-0.4 7,697 +/-754 13.90% +/-1.4 Lithuanian 79,550 +/-1,918 0.60% +/-0.1 5,120 +/-509 0.60% +/-0.1 315 +/-101 0.60% +/-0.2 Norwegian 43,485 +/-1,976 0.30% +/-0.1 3,293 +/-469 0.40% +/-0.1 186 +/-84 0.30% +/-0.2 Polish 872,072 +/-7,202 6.90% +/-0.1 56,060 +/-1,848 7.10% +/-0.2 4,091 +/-622 7.40% +/-1.1 Portuguese 19,606 +/-1,427 0.20% +/-0.1 1,745 +/-368 0.20% +/-0.1 264 +/-157 0.50% +/-0.3 Russian 201,284 +/-4,292 1.60% +/-0.1 28,076 +/-1,338 3.50% +/-0.2 2,308 +/-303 4.20% +/-0.5 Scotch-Irish 243,048 +/-4,481 1.90% +/-0.1 13,579 +/-941 1.70% +/-0.1 1,036 +/-239 1.90% +/-0.4 Scottish 205,852 +/-3,893 1.60% +/-0.1 13,866 +/-925 1.70% +/-0.1 913 +/-231 1.60% +/-0.4 Slovak 237,772 +/-4,065 1.90% +/-0.1 5,944 +/-570 0.70% +/-0.1 236 +/-115 0.40% +/-0.2 Subsaharan African 84,297 +/-3,328 0.70% +/-0.1 3,918 +/-628 0.50% +/-0.1 310 +/-162 0.60% +/-0.3 Swedish 112,545 +/-2,945 0.90% +/-0.1 6,087 +/-607 0.80% +/-0.1 583 +/-200 1.10% +/-0.4 Swiss 70,721 +/-2,118 0.60% +/-0.1 3,458 +/-429 0.40% +/-0.1 176 +/-113 0.30% +/-0.2 Ukrainian 117,848 +/-3,042 0.90% +/-0.1 9,388 +/-755 1.20% +/-0.1 912 +/-268 1.60% +/-0.5 Welsh 183,561 +/-3,336 1.40% +/-0.1 9,531 +/-791 1.20% +/-0.1 481 +/-131 0.90% +/-0.2 West Indian (excluding Hispanic origin groups) 67,425 +/-3,640 0.50% +/-0.1 5,751 +/-837 0.70% +/-0.1 752 +/-328 1.40% +/-0.6
YEAR OF ENTRY
WORLD REGION OF BIRTH OF FOREIGN BORN
LANGUAGE SPOKEN AT HOME
ANCESTRY
U.S. CITIZENSHIP STATUS

EstimateMargin of
ErrorPercent
Percent Margin
of ErrorEstimate
Margin of
ErrorPercent
Percent Margin
of ErrorEstimate
Margin of
ErrorPercent
Percent Margin
of Error
Population 16 years and over 10,209,810 +/-2,157 10,209,810 (X) 634,719 +/-457 634,719 (X) 44,847 +/-306 44,847 (X) In labor force 6,456,527 +/-9,684 63.20% +/-0.1 439,826 +/-2,364 69.30% +/-0.4 30,529 +/-584 68.10% +/-1.3 Civilian labor force 6,447,161 +/-9,768 63.10% +/-0.1 439,184 +/-2,362 69.20% +/-0.4 30,517 +/-588 68.00% +/-1.3 Employed 5,938,507 +/-10,031 58.20% +/-0.1 412,931 +/-2,640 65.10% +/-0.4 28,398 +/-667 63.30% +/-1.5 Unemployed 508,654 +/-5,119 5.00% +/-0.1 26,253 +/-1,116 4.10% +/-0.2 2,119 +/-312 4.70% +/-0.7 Armed Forces 9,366 +/-570 0.10% +/-0.1 642 +/-155 0.10% +/-0.1 12 +/-17 0.00% +/-0.1 Not in labor force 3,753,283 +/-9,807 36.80% +/-0.1 194,893 +/-2,364 30.70% +/-0.4 14,318 +/-617 31.90% +/-1.3
Civilian labor force 6,447,161 +/-9,768 6,447,161 (X) 439,184 +/-2,362 439,184 (X) 30,517 +/-588 30,517 (X) Percent Unemployed (X) (X) 7.90% +/-0.1 (X) (X) 6.00% +/-0.3 (X) (X) 6.90% +/-1.0
Females 16 years and over 5,296,514 +/-1,492 5,296,514 (X) 330,959 +/-340 330,959 (X) 23,951 +/-419 23,951 (X) In labor force 3,084,167 +/-6,671 58.20% +/-0.1 211,690 +/-1,553 64.00% +/-0.5 15,006 +/-443 62.70% +/-1.8 Civilian labor force 3,082,970 +/-6,690 58.20% +/-0.1 211,604 +/-1,558 63.90% +/-0.5 15,006 +/-443 62.70% +/-1.8 Employed 2,859,230 +/-6,631 54.00% +/-0.1 199,817 +/-1,777 60.40% +/-0.5 14,147 +/-465 59.10% +/-1.9
Own children under 6 years 849,875 +/-2,356 849,875 (X) 55,750 +/-619 55,750 (X) 3,699 +/-303 3,699 (X) All parents in family in labor force 559,319 +/-4,692 65.80% +/-0.5 39,358 +/-938 70.60% +/-1.6 2,619 +/-275 70.80% +/-4.5
Own children 6 to 17 years 1,828,366 +/-3,170 1,828,366 (X) 122,611 +/-648 122,611 (X) 8,079 +/-430 8,079 (X) All parents in family in labor force 1,310,256 +/-5,517 71.70% +/-0.3 93,137 +/-1,379 76.00% +/-1.0 6,555 +/-473 81.10% +/-3.3
Workers 16 years and over 5,806,520 +/-10,496 5,806,520 (X) 404,629 +/-2,648 404,629 (X) 27,755 +/-654 27,755 (X) Car, truck, or van -- drove alone 4,443,973 +/-10,478 76.50% +/-0.1 321,410 +/-2,793 79.40% +/-0.5 21,683 +/-708 78.10% +/-1.8 Car, truck, or van -- carpooled 535,947 +/-4,757 9.20% +/-0.1 31,478 +/-1,143 7.80% +/-0.3 2,405 +/-363 8.70% +/-1.3 Public transportation (excluding taxicab) 311,753 +/-4,092 5.40% +/-0.1 19,738 +/-971 4.90% +/-0.2 2,062 +/-283 7.40% +/-1.0 Walked 228,966 +/-3,523 3.90% +/-0.1 11,712 +/-888 2.90% +/-0.2 657 +/-180 2.40% +/-0.6 Other means 73,908 +/-1,774 1.30% +/-0.1 3,493 +/-378 0.90% +/-0.1 128 +/-61 0.50% +/-0.2 Worked at home 211,973 +/-2,921 3.70% +/-0.1 16,798 +/-799 4.20% +/-0.2 820 +/-178 3.00% +/-0.6
Mean travel time to work (minutes) 25.7 +/-0.1 (X) (X) 27.6 +/-0.2 (X) (X) 28.1 +/-0.8 (X) (X)
Civilian employed population 16 years and over 5,938,507 +/-10,031 5,938,507 (X) 412,931 +/-2,640 412,931 (X) 28,398 +/-667 28,398 (X) Management, business, science, and arts occupations 2,110,258 +/-11,694 35.50% +/-0.2 197,898 +/-2,239 47.90% +/-0.5 13,120 +/-501 46.20% +/-1.7 Service occupations 1,004,069 +/-7,106 16.90% +/-0.1 50,761 +/-1,690 12.30% +/-0.4 3,621 +/-371 12.80% +/-1.3 Sales and office occupations 1,485,290 +/-7,708 25.00% +/-0.1 103,438 +/-1,993 25.00% +/-0.4 7,556 +/-524 26.60% +/-1.6 Natural resources, construction, and maintenance occupations 519,190 +/-4,138 8.70% +/-0.1 27,693 +/-1,137 6.70% +/-0.3 2,087 +/-250 7.30% +/-0.9 Production, transportation, and material moving occupations 819,700 +/-5,466 13.80% +/-0.1 33,141 +/-1,162 8.00% +/-0.3 2,014 +/-258 7.10% +/-0.9
Civilian employed population 16 years and over 5,938,507 +/-10,031 5,938,507 (X) 412,931 +/-2,640 412,931 (X) 28,398 +/-667 28,398 (X) Agriculture, forestry, fishing and hunting, and mining 75,170 +/-1,824 1.30% +/-0.1 1,048 +/-224 0.30% +/-0.1 46 +/-44 0.20% +/-0.2 Construction 360,192 +/-3,729 6.10% +/-0.1 24,707 +/-1,208 6.00% +/-0.3 1,758 +/-239 6.20% +/-0.8 Manufacturing 760,154 +/-5,476 12.80% +/-0.1 51,129 +/-1,324 12.40% +/-0.3 2,106 +/-276 7.40% +/-1.0 Wholesale trade 177,607 +/-2,489 3.00% +/-0.1 12,953 +/-672 3.10% +/-0.2 634 +/-162 2.20% +/-0.6 Retail trade 691,014 +/-5,148 11.60% +/-0.1 41,876 +/-1,229 10.10% +/-0.3 2,980 +/-357 10.50% +/-1.2 Transportation and warehousing, and utilities 311,336 +/-3,833 5.20% +/-0.1 13,113 +/-678 3.20% +/-0.2 1,311 +/-206 4.60% +/-0.7 Information 117,051 +/-2,022 2.00% +/-0.1 10,056 +/-635 2.40% +/-0.1 515 +/-120 1.80% +/-0.4 Finance and insurance, and real estate and rental and leasing 387,038 +/-3,789 6.50% +/-0.1 41,268 +/-1,168 10.00% +/-0.3 2,692 +/-299 9.50% +/-1.0
Professional, scientific, and management, and administrative and waste management services
568,058 +/-4,299 9.60% +/-0.1 58,318 +/-1,472 14.10% +/-0.3 3,370 +/-352 11.90% +/-1.2
Educational services, and health care and social assistance 1,496,986 +/-8,500 25.20% +/-0.1 102,991 +/-1,919 24.90% +/-0.4 8,649 +/-524 30.50% +/-1.8 Arts, entertainment, and recreation, and accommodation and food services
468,375 +/-4,918 7.90% +/-0.1 26,452 +/-1,083 6.40% +/-0.3 1,808 +/-285 6.40% +/-1.0
Other services, except public administration 278,609 +/-3,542 4.70% +/-0.1 18,187 +/-816 4.40% +/-0.2 1,439 +/-230 5.10% +/-0.8
EMPLOYMENT STATUS
COMMUTING TO WORK
OCCUPATION
INDUSTRY
Montgomery County, Pennsylvania Abington township, Montgomery County, PennsylvaniaPennsylvania
DP03: SELECTED ECONOMIC CHARACTERISTICS2007-2011 American Community Survey 5-Year Estimates
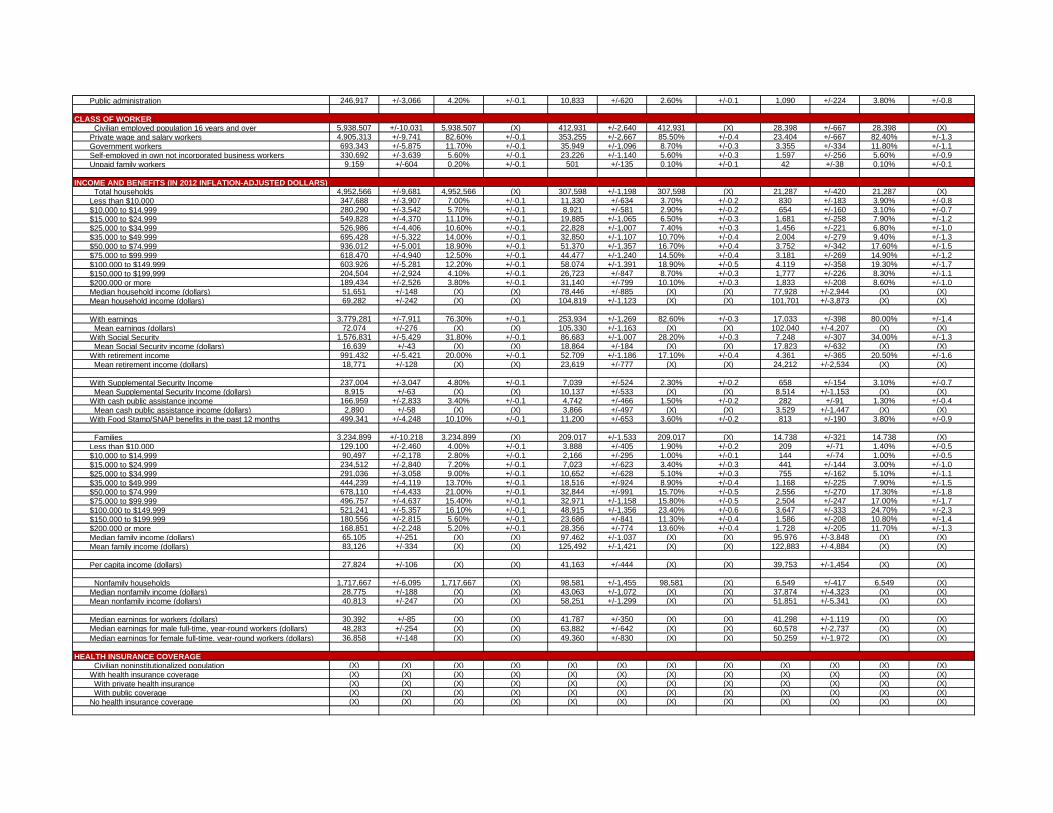
Public administration 246,917 +/-3,066 4.20% +/-0.1 10,833 +/-620 2.60% +/-0.1 1,090 +/-224 3.80% +/-0.8
Civilian employed population 16 years and over 5,938,507 +/-10,031 5,938,507 (X) 412,931 +/-2,640 412,931 (X) 28,398 +/-667 28,398 (X) Private wage and salary workers 4,905,313 +/-9,741 82.60% +/-0.1 353,255 +/-2,667 85.50% +/-0.4 23,404 +/-667 82.40% +/-1.3 Government workers 693,343 +/-5,875 11.70% +/-0.1 35,949 +/-1,096 8.70% +/-0.3 3,355 +/-334 11.80% +/-1.1 Self-employed in own not incorporated business workers 330,692 +/-3,639 5.60% +/-0.1 23,226 +/-1,140 5.60% +/-0.3 1,597 +/-256 5.60% +/-0.9 Unpaid family workers 9,159 +/-604 0.20% +/-0.1 501 +/-135 0.10% +/-0.1 42 +/-38 0.10% +/-0.1
Total households 4,952,566 +/-9,681 4,952,566 (X) 307,598 +/-1,198 307,598 (X) 21,287 +/-420 21,287 (X) Less than $10,000 347,688 +/-3,907 7.00% +/-0.1 11,330 +/-634 3.70% +/-0.2 830 +/-183 3.90% +/-0.8 $10,000 to $14,999 280,290 +/-3,542 5.70% +/-0.1 8,921 +/-581 2.90% +/-0.2 654 +/-160 3.10% +/-0.7 $15,000 to $24,999 549,828 +/-4,370 11.10% +/-0.1 19,885 +/-1,065 6.50% +/-0.3 1,681 +/-258 7.90% +/-1.2 $25,000 to $34,999 526,986 +/-4,406 10.60% +/-0.1 22,828 +/-1,007 7.40% +/-0.3 1,456 +/-221 6.80% +/-1.0 $35,000 to $49,999 695,428 +/-5,322 14.00% +/-0.1 32,850 +/-1,107 10.70% +/-0.4 2,004 +/-279 9.40% +/-1.3 $50,000 to $74,999 936,012 +/-5,001 18.90% +/-0.1 51,370 +/-1,357 16.70% +/-0.4 3,752 +/-342 17.60% +/-1.5 $75,000 to $99,999 618,470 +/-4,940 12.50% +/-0.1 44,477 +/-1,240 14.50% +/-0.4 3,181 +/-269 14.90% +/-1.2 $100,000 to $149,999 603,926 +/-5,281 12.20% +/-0.1 58,074 +/-1,391 18.90% +/-0.5 4,119 +/-358 19.30% +/-1.7 $150,000 to $199,999 204,504 +/-2,924 4.10% +/-0.1 26,723 +/-847 8.70% +/-0.3 1,777 +/-226 8.30% +/-1.1 $200,000 or more 189,434 +/-2,526 3.80% +/-0.1 31,140 +/-799 10.10% +/-0.3 1,833 +/-208 8.60% +/-1.0 Median household income (dollars) 51,651 +/-148 (X) (X) 78,446 +/-885 (X) (X) 77,928 +/-2,944 (X) (X) Mean household income (dollars) 69,282 +/-242 (X) (X) 104,819 +/-1,123 (X) (X) 101,701 +/-3,873 (X) (X)
With earnings 3,779,281 +/-7,911 76.30% +/-0.1 253,934 +/-1,269 82.60% +/-0.3 17,033 +/-398 80.00% +/-1.4 Mean earnings (dollars) 72,074 +/-276 (X) (X) 105,330 +/-1,163 (X) (X) 102,040 +/-4,207 (X) (X) With Social Security 1,576,831 +/-5,429 31.80% +/-0.1 86,683 +/-1,007 28.20% +/-0.3 7,248 +/-307 34.00% +/-1.3 Mean Social Security income (dollars) 16,639 +/-43 (X) (X) 18,864 +/-184 (X) (X) 17,823 +/-632 (X) (X) With retirement income 991,432 +/-5,421 20.00% +/-0.1 52,709 +/-1,186 17.10% +/-0.4 4,361 +/-365 20.50% +/-1.6 Mean retirement income (dollars) 18,771 +/-128 (X) (X) 23,619 +/-777 (X) (X) 24,212 +/-2,534 (X) (X)
With Supplemental Security Income 237,004 +/-3,047 4.80% +/-0.1 7,039 +/-524 2.30% +/-0.2 658 +/-154 3.10% +/-0.7 Mean Supplemental Security Income (dollars) 8,915 +/-63 (X) (X) 10,137 +/-533 (X) (X) 8,514 +/-1,153 (X) (X) With cash public assistance income 166,959 +/-2,833 3.40% +/-0.1 4,742 +/-466 1.50% +/-0.2 282 +/-91 1.30% +/-0.4 Mean cash public assistance income (dollars) 2,890 +/-58 (X) (X) 3,866 +/-497 (X) (X) 3,529 +/-1,447 (X) (X) With Food Stamp/SNAP benefits in the past 12 months 499,341 +/-4,248 10.10% +/-0.1 11,200 +/-653 3.60% +/-0.2 813 +/-190 3.80% +/-0.9
Families 3,234,899 +/-10,218 3,234,899 (X) 209,017 +/-1,533 209,017 (X) 14,738 +/-321 14,738 (X) Less than $10,000 129,100 +/-2,460 4.00% +/-0.1 3,888 +/-405 1.90% +/-0.2 209 +/-71 1.40% +/-0.5 $10,000 to $14,999 90,497 +/-2,178 2.80% +/-0.1 2,166 +/-295 1.00% +/-0.1 144 +/-74 1.00% +/-0.5 $15,000 to $24,999 234,512 +/-2,840 7.20% +/-0.1 7,023 +/-623 3.40% +/-0.3 441 +/-144 3.00% +/-1.0 $25,000 to $34,999 291,036 +/-3,058 9.00% +/-0.1 10,652 +/-628 5.10% +/-0.3 755 +/-162 5.10% +/-1.1 $35,000 to $49,999 444,239 +/-4,119 13.70% +/-0.1 18,516 +/-924 8.90% +/-0.4 1,168 +/-225 7.90% +/-1.5 $50,000 to $74,999 678,110 +/-4,433 21.00% +/-0.1 32,844 +/-991 15.70% +/-0.5 2,556 +/-270 17.30% +/-1.8 $75,000 to $99,999 496,757 +/-4,637 15.40% +/-0.1 32,971 +/-1,158 15.80% +/-0.5 2,504 +/-247 17.00% +/-1.7 $100,000 to $149,999 521,241 +/-5,357 16.10% +/-0.1 48,915 +/-1,356 23.40% +/-0.6 3,647 +/-333 24.70% +/-2.3 $150,000 to $199,999 180,556 +/-2,815 5.60% +/-0.1 23,686 +/-841 11.30% +/-0.4 1,586 +/-208 10.80% +/-1.4 $200,000 or more 168,851 +/-2,248 5.20% +/-0.1 28,356 +/-774 13.60% +/-0.4 1,728 +/-205 11.70% +/-1.3 Median family income (dollars) 65,105 +/-251 (X) (X) 97,462 +/-1,037 (X) (X) 95,976 +/-3,848 (X) (X) Mean family income (dollars) 83,126 +/-334 (X) (X) 125,492 +/-1,421 (X) (X) 122,883 +/-4,884 (X) (X)
Per capita income (dollars) 27,824 +/-106 (X) (X) 41,163 +/-444 (X) (X) 39,753 +/-1,454 (X) (X)
Nonfamily households 1,717,667 +/-6,095 1,717,667 (X) 98,581 +/-1,455 98,581 (X) 6,549 +/-417 6,549 (X) Median nonfamily income (dollars) 28,775 +/-188 (X) (X) 43,063 +/-1,072 (X) (X) 37,874 +/-4,323 (X) (X) Mean nonfamily income (dollars) 40,813 +/-247 (X) (X) 58,251 +/-1,299 (X) (X) 51,851 +/-5,341 (X) (X)
Median earnings for workers (dollars) 30,392 +/-85 (X) (X) 41,787 +/-350 (X) (X) 41,298 +/-1,119 (X) (X) Median earnings for male full-time, year-round workers (dollars) 48,283 +/-254 (X) (X) 63,882 +/-642 (X) (X) 60,578 +/-2,737 (X) (X) Median earnings for female full-time, year-round workers (dollars) 36,858 +/-148 (X) (X) 49,360 +/-830 (X) (X) 50,259 +/-1,972 (X) (X)
Civilian noninstitutionalized population (X) (X) (X) (X) (X) (X) (X) (X) (X) (X) (X) (X) With health insurance coverage (X) (X) (X) (X) (X) (X) (X) (X) (X) (X) (X) (X) With private health insurance (X) (X) (X) (X) (X) (X) (X) (X) (X) (X) (X) (X) With public coverage (X) (X) (X) (X) (X) (X) (X) (X) (X) (X) (X) (X) No health insurance coverage (X) (X) (X) (X) (X) (X) (X) (X) (X) (X) (X) (X)
HEALTH INSURANCE COVERAGE
CLASS OF WORKER
INCOME AND BENEFITS (IN 2012 INFLATION-ADJUSTED DOLLARS)

Civilian noninstitutionalized population under 18 years (X) (X) (X) (X) (X) (X) (X) (X) (X) (X) (X) (X) No health insurance coverage (X) (X) (X) (X) (X) (X) (X) (X) (X) (X) (X) (X)
Civilian noninstitutionalized population 18 to 64 years (X) (X) (X) (X) (X) (X) (X) (X) (X) (X) (X) (X) In labor force: (X) (X) (X) (X) (X) (X) (X) (X) (X) (X) (X) (X) Employed: (X) (X) (X) (X) (X) (X) (X) (X) (X) (X) (X) (X) With health insurance coverage (X) (X) (X) (X) (X) (X) (X) (X) (X) (X) (X) (X) With private health insurance (X) (X) (X) (X) (X) (X) (X) (X) (X) (X) (X) (X) With public coverage (X) (X) (X) (X) (X) (X) (X) (X) (X) (X) (X) (X) No health insurance coverage (X) (X) (X) (X) (X) (X) (X) (X) (X) (X) (X) (X) Unemployed: (X) (X) (X) (X) (X) (X) (X) (X) (X) (X) (X) (X) With health insurance coverage (X) (X) (X) (X) (X) (X) (X) (X) (X) (X) (X) (X) With private health insurance (X) (X) (X) (X) (X) (X) (X) (X) (X) (X) (X) (X) With public coverage (X) (X) (X) (X) (X) (X) (X) (X) (X) (X) (X) (X) No health insurance coverage (X) (X) (X) (X) (X) (X) (X) (X) (X) (X) (X) (X) Not in labor force: (X) (X) (X) (X) (X) (X) (X) (X) (X) (X) (X) (X) With health insurance coverage (X) (X) (X) (X) (X) (X) (X) (X) (X) (X) (X) (X) With private health insurance (X) (X) (X) (X) (X) (X) (X) (X) (X) (X) (X) (X) With public coverage (X) (X) (X) (X) (X) (X) (X) (X) (X) (X) (X) (X) No health insurance coverage (X) (X) (X) (X) (X) (X) (X) (X) (X) (X) (X) (X)
All families (X) (X) 8.80% +/-0.1 (X) (X) 3.70% +/-0.2 (X) (X) 3.20% +/-0.8 With related children under 18 years (X) (X) 14.70% +/-0.2 (X) (X) 5.60% +/-0.5 (X) (X) 4.10% +/-1.6 With related children under 5 years only (X) (X) 16.50% +/-0.5 (X) (X) 6.30% +/-1.3 (X) (X) 2.20% +/-2.2 Married couple families (X) (X) 3.70% +/-0.1 (X) (X) 1.80% +/-0.2 (X) (X) 2.10% +/-0.7 With related children under 18 years (X) (X) 5.00% +/-0.1 (X) (X) 1.90% +/-0.3 (X) (X) 1.70% +/-1.1 With related children under 5 years only (X) (X) 4.00% +/-0.3 (X) (X) 1.10% +/-0.5 (X) (X) 0.80% +/-1.2 Families with female householder, no husband present (X) (X) 28.10% +/-0.4 (X) (X) 14.10% +/-1.4 (X) (X) 7.70% +/-2.9 With related children under 18 years (X) (X) 38.40% +/-0.6 (X) (X) 20.80% +/-2.1 (X) (X) 11.80% +/-5.3 With related children under 5 years only (X) (X) 47.00% +/-1.3 (X) (X) 29.50% +/-6.4 (X) (X) 5.90% +/-10.2
All people (X) (X) 12.60% +/-0.1 (X) (X) 5.70% +/-0.3 (X) (X) 5.50% +/-1.0 Under 18 years (X) (X) 17.70% +/-0.3 (X) (X) 6.30% +/-0.6 (X) (X) 4.30% +/-1.7 Related children under 18 years (X) (X) 17.40% +/-0.3 (X) (X) 6.20% +/-0.6 (X) (X) 4.20% +/-1.7 Related children under 5 years (X) (X) 21.00% +/-0.4 (X) (X) 7.00% +/-1.0 (X) (X) 1.90% +/-1.4 Related children 5 to 17 years (X) (X) 16.10% +/-0.3 (X) (X) 5.90% +/-0.6 (X) (X) 4.90% +/-2.2 18 years and over (X) (X) 11.20% +/-0.1 (X) (X) 5.50% +/-0.2 (X) (X) 5.80% +/-1.0 18 to 64 years (X) (X) 11.80% +/-0.1 (X) (X) 5.50% +/-0.3 (X) (X) 5.30% +/-1.1 65 years and over (X) (X) 8.40% +/-0.1 (X) (X) 5.60% +/-0.4 (X) (X) 7.50% +/-1.8 People in families (X) (X) 9.80% +/-0.1 (X) (X) 3.80% +/-0.3 (X) (X) 3.10% +/-1.0 Unrelated individuals 15 years and over (X) (X) 24.70% +/-0.2 (X) (X) 15.20% +/-0.9 (X) (X) 18.30% +/-3.2
PERCENTAGE OF FAMILIES AND PEOPLE WHOSE INCOME IN THE PAST 12 MONTHS IS BELOW THE POVERTY LEVEL

EstimateMargin of
ErrorPercent
Percent Margin
of ErrorEstimate
Margin of
ErrorPercent
Percent Margin
of ErrorEstimate
Margin of
ErrorPercent
Percent Margin
of Error
Total housing units 5,554,939 +/-821 5,554,939 (X) 324,427 +/-493 324,427 (X) 22,059 +/-421 22,059 (X) Occupied housing units 4,952,566 +/-9,681 89.20% +/-0.2 307,598 +/-1,198 94.80% +/-0.3 21,287 +/-420 96.50% +/-1.0 Vacant housing units 602,373 +/-9,250 10.80% +/-0.2 16,829 +/-1,083 5.20% +/-0.3 772 +/-216 3.50% +/-1.0
Homeowner vacancy rate 1.8 +/-0.1 (X) (X) 1.5 +/-0.2 (X) (X) 1.4 +/-0.8 (X) (X) Rental vacancy rate 6.5 +/-0.2 (X) (X) 7.8 +/-0.9 (X) (X) 4.4 +/-2.1 (X) (X)
Total housing units 5,554,939 +/-821 5,554,939 (X) 324,427 +/-493 324,427 (X) 22,059 +/-421 22,059 (X) 1-unit, detached 3,162,806 +/-7,119 56.90% +/-0.1 178,593 +/-1,262 55.00% +/-0.4 15,872 +/-411 72.00% +/-1.3 1-unit, attached 1,015,557 +/-5,065 18.30% +/-0.1 63,687 +/-1,058 19.60% +/-0.3 1,738 +/-195 7.90% +/-0.9 2 units 263,898 +/-3,677 4.80% +/-0.1 11,759 +/-855 3.60% +/-0.3 752 +/-220 3.40% +/-1.0 3 or 4 units 235,433 +/-2,919 4.20% +/-0.1 12,398 +/-752 3.80% +/-0.2 553 +/-145 2.50% +/-0.6 5 to 9 units 188,482 +/-2,852 3.40% +/-0.1 9,700 +/-606 3.00% +/-0.2 515 +/-133 2.30% +/-0.6 10 to 19 units 142,532 +/-2,443 2.60% +/-0.1 13,322 +/-760 4.10% +/-0.2 648 +/-141 2.90% +/-0.6 20 or more units 308,943 +/-2,437 5.60% +/-0.1 31,799 +/-891 9.80% +/-0.3 1,981 +/-204 9.00% +/-0.9 Mobile home 236,410 +/-2,908 4.30% +/-0.1 3,061 +/-300 0.90% +/-0.1 0 +/-81 0.00% +/-0.1 Boat, RV, van, etc. 878 +/-188 0.00% +/-0.1 108 +/-58 0.00% +/-0.1 0 +/-81 0.00% +/-0.1
Total housing units 5,554,939 +/-821 5,554,939 (X) 324,427 +/-493 324,427 (X) 22,059 +/-421 22,059 (X) Built 2010 or later 153,089 +/-2,494 2.80% +/-0.1 9,575 +/-533 3.00% +/-0.2 151 +/-59 0.70% +/-0.3 Built 2000 to 2009 268,856 +/-2,841 4.80% +/-0.1 18,246 +/-785 5.60% +/-0.2 285 +/-123 1.30% +/-0.6 Built 1990 to 1999 516,770 +/-4,354 9.30% +/-0.1 36,847 +/-826 11.40% +/-0.3 561 +/-115 2.50% +/-0.5 Built 1980 to 1989 548,524 +/-3,931 9.90% +/-0.1 37,036 +/-1,044 11.40% +/-0.3 1,148 +/-157 5.20% +/-0.7 Built 1970 to 1979 712,062 +/-5,345 12.80% +/-0.1 42,390 +/-964 13.10% +/-0.3 2,051 +/-270 9.30% +/-1.2 Built 1960 to 1969 558,992 +/-4,382 10.10% +/-0.1 40,425 +/-1,161 12.50% +/-0.4 2,793 +/-320 12.70% +/-1.4 Built 1950 to 1959 778,526 +/-4,852 14.00% +/-0.1 55,285 +/-1,259 17.00% +/-0.4 7,204 +/-415 32.70% +/-1.6 Built 1940 to 1949 471,633 +/-3,602 8.50% +/-0.1 23,282 +/-828 7.20% +/-0.3 2,635 +/-272 11.90% +/-1.3 Built 1939 or earlier 1,546,487 +/-7,164 27.80% +/-0.1 61,341 +/-1,150 18.90% +/-0.4 5,231 +/-368 23.70% +/-1.6
Total housing units 5,554,939 +/-821 5,554,939 (X) 324,427 +/-493 324,427 (X) 22,059 +/-421 22,059 (X) 1 room 83,894 +/-2,301 1.50% +/-0.1 4,009 +/-518 1.20% +/-0.2 235 +/-121 1.10% +/-0.5 2 rooms 100,368 +/-2,115 1.80% +/-0.1 5,614 +/-483 1.70% +/-0.1 482 +/-148 2.20% +/-0.7 3 rooms 397,335 +/-4,422 7.20% +/-0.1 24,191 +/-932 7.50% +/-0.3 1,249 +/-160 5.70% +/-0.7 4 rooms 696,740 +/-5,778 12.50% +/-0.1 36,747 +/-1,138 11.30% +/-0.4 1,876 +/-235 8.50% +/-1.1 5 rooms 928,113 +/-5,614 16.70% +/-0.1 37,747 +/-1,133 11.60% +/-0.3 2,400 +/-301 10.90% +/-1.3 6 rooms 1,231,307 +/-5,660 22.20% +/-0.1 54,407 +/-1,615 16.80% +/-0.5 4,587 +/-385 20.80% +/-1.6 7 rooms 827,926 +/-5,064 14.90% +/-0.1 50,508 +/-1,267 15.60% +/-0.4 4,377 +/-360 19.80% +/-1.6 8 rooms 596,964 +/-5,161 10.70% +/-0.1 44,303 +/-1,063 13.70% +/-0.3 2,998 +/-250 13.60% +/-1.2 9 rooms or more 692,292 +/-5,262 12.50% +/-0.1 66,901 +/-1,253 20.60% +/-0.4 3,855 +/-337 17.50% +/-1.5 Median rooms 6 +/-0.1 (X) (X) 6.5 +/-0.1 (X) (X) 6.5 +/-0.2 (X) (X)
Total housing units 5,554,939 +/-821 5,554,939 (X) 324,427 +/-493 324,427 (X) 22,059 +/-421 22,059 (X) No bedroom 95,114 +/-2,357 1.70% +/-0.1 4,685 +/-513 1.40% +/-0.2 243 +/-124 1.10% +/-0.6 1 bedroom 584,745 +/-4,713 10.50% +/-0.1 36,805 +/-1,152 11.30% +/-0.4 2,201 +/-275 10.00% +/-1.2 2 bedrooms 1,304,296 +/-6,558 23.50% +/-0.1 63,503 +/-1,178 19.60% +/-0.4 3,307 +/-341 15.00% +/-1.5 3 bedrooms 2,394,439 +/-6,592 43.10% +/-0.1 116,018 +/-1,434 35.80% +/-0.4 9,864 +/-564 44.70% +/-2.3 4 bedrooms 942,324 +/-5,481 17.00% +/-0.1 82,126 +/-1,176 25.30% +/-0.4 4,651 +/-368 21.10% +/-1.7 5 or more bedrooms 234,021 +/-3,038 4.20% +/-0.1 21,290 +/-835 6.60% +/-0.3 1,793 +/-198 8.10% +/-0.9
HOUSING OCCUPANCY
UNITS IN STRUCTURE
YEAR STRUCTURE BUILT
ROOMS
BEDROOMS
Montgomery County, PA Abington township, Montgomery County, PAPennsylvania
DP04: SELECTED HOUSING CHARACTERISTICS2007-2011 American Community Survey 5-Year Estimates

Occupied housing units 4,952,566 +/-9,681 4,952,566 (X) 307,598 +/-1,198 307,598 (X) 21,287 +/-420 21,287 (X) Owner-occupied 3,498,381 +/-14,656 70.60% +/-0.2 226,980 +/-1,720 73.80% +/-0.5 16,716 +/-404 78.50% +/-1.4 Renter-occupied 1,454,185 +/-8,267 29.40% +/-0.2 80,618 +/-1,639 26.20% +/-0.5 4,571 +/-332 21.50% +/-1.4
Average household size of owner-occupied unit 2.6 +/-0.01 (X) (X) 2.7 +/-0.01 (X) (X) 2.75 +/-0.05 (X) (X) Average household size of renter-occupied unit 2.16 +/-0.01 (X) (X) 2.01 +/-0.03 (X) (X) 1.89 +/-0.12 (X) (X)
Occupied housing units 4,952,566 +/-9,681 4,952,566 (X) 307,598 +/-1,198 307,598 (X) 21,287 +/-420 21,287 (X) Moved in 2010 or later 1,632,673 +/-6,594 33.00% +/-0.2 101,051 +/-1,572 32.90% +/-0.5 5,747 +/-393 27.00% +/-1.6 Moved in 2000 to 2009 919,163 +/-6,273 18.60% +/-0.1 63,616 +/-1,600 20.70% +/-0.5 4,030 +/-357 18.90% +/-1.7 Moved in 1990 to 1999 989,369 +/-6,465 20.00% +/-0.1 66,677 +/-1,311 21.70% +/-0.4 4,742 +/-373 22.30% +/-1.7 Moved in 1980 to 1989 549,394 +/-4,725 11.10% +/-0.1 34,714 +/-1,073 11.30% +/-0.3 2,752 +/-250 12.90% +/-1.2 Moved in 1970 to 1979 398,685 +/-3,361 8.10% +/-0.1 20,371 +/-730 6.60% +/-0.2 1,916 +/-256 9.00% +/-1.2 Moved in 1969 or earlier 463,282 +/-3,691 9.40% +/-0.1 21,169 +/-750 6.90% +/-0.2 2,100 +/-250 9.90% +/-1.1
Occupied housing units 4,952,566 +/-9,681 4,952,566 (X) 307,598 +/-1,198 307,598 (X) 21,287 +/-420 21,287 (X) No vehicles available 569,811 +/-4,639 11.50% +/-0.1 17,988 +/-958 5.80% +/-0.3 1,229 +/-201 5.80% +/-0.9 1 vehicle available 1,677,783 +/-6,895 33.90% +/-0.2 97,975 +/-1,725 31.90% +/-0.5 6,956 +/-516 32.70% +/-2.2 2 vehicles available 1,824,065 +/-8,383 36.80% +/-0.1 133,829 +/-1,761 43.50% +/-0.6 9,417 +/-474 44.20% +/-2.1 3 or more vehicles available 880,907 +/-5,227 17.80% +/-0.1 57,806 +/-1,303 18.80% +/-0.4 3,685 +/-346 17.30% +/-1.7
Occupied housing units 4,952,566 +/-9,681 4,952,566 (X) 307,598 +/-1,198 307,598 (X) 21,287 +/-420 21,287 (X) Utility gas 2,537,831 +/-7,880 51.20% +/-0.1 152,883 +/-1,594 49.70% +/-0.5 14,829 +/-494 69.70% +/-1.8 Bottled, tank, or LP gas 178,660 +/-2,574 3.60% +/-0.1 8,455 +/-552 2.70% +/-0.2 166 +/-78 0.80% +/-0.4 Electricity 969,160 +/-5,443 19.60% +/-0.1 69,609 +/-1,515 22.60% +/-0.5 2,964 +/-267 13.90% +/-1.2 Fuel oil, kerosene, etc. 1,034,922 +/-5,484 20.90% +/-0.1 72,258 +/-1,303 23.50% +/-0.4 3,186 +/-279 15.00% +/-1.3 Coal or coke 65,804 +/-1,432 1.30% +/-0.1 458 +/-147 0.10% +/-0.1 8 +/-13 0.00% +/-0.1 Wood 127,341 +/-1,916 2.60% +/-0.1 2,367 +/-266 0.80% +/-0.1 58 +/-41 0.30% +/-0.2 Solar energy 906 +/-164 0.00% +/-0.1 92 +/-66 0.00% +/-0.1 0 +/-81 0.00% +/-0.1 Other fuel 26,481 +/-985 0.50% +/-0.1 906 +/-178 0.30% +/-0.1 7 +/-11 0.00% +/-0.1 No fuel used 11,461 +/-694 0.20% +/-0.1 570 +/-143 0.20% +/-0.1 69 +/-45 0.30% +/-0.2
Occupied housing units 4,952,566 +/-9,681 4,952,566 (X) 307,598 +/-1,198 307,598 (X) 21,287 +/-420 21,287 (X) Lacking complete plumbing facilities 24,959 +/-1,214 0.50% +/-0.1 1,060 +/-284 0.30% +/-0.1 57 +/-45 0.30% +/-0.2 Lacking complete kitchen facilities 42,007 +/-1,408 0.80% +/-0.1 2,061 +/-390 0.70% +/-0.1 166 +/-77 0.80% +/-0.4 No telephone service available 119,322 +/-2,615 2.40% +/-0.1 5,773 +/-494 1.90% +/-0.2 283 +/-125 1.30% +/-0.6
Occupied housing units 4,952,566 +/-9,681 4,952,566 (X) 307,598 +/-1,198 307,598 (X) 21,287 +/-420 21,287 (X) 1.00 or less 4,894,550 +/-10,196 98.80% +/-0.1 305,155 +/-1,205 99.20% +/-0.1 21,071 +/-452 99.00% +/-0.5 1.01 to 1.50 41,617 +/-1,346 0.80% +/-0.1 1,737 +/-280 0.60% +/-0.1 118 +/-63 0.60% +/-0.3 1.51 or more 16,399 +/-965 0.30% +/-0.1 706 +/-164 0.20% +/-0.1 98 +/-82 0.50% +/-0.4
Owner-occupied units 3,498,381 +/-14,656 3,498,381 (X) 226,980 +/-1,720 226,980 (X) 16,716 +/-404 16,716 (X) Less than $50,000 315,780 +/-3,047 9.00% +/-0.1 3,706 +/-334 1.60% +/-0.1 168 +/-59 1.00% +/-0.4 $50,000 to $99,999 655,656 +/-4,965 18.70% +/-0.1 5,678 +/-424 2.50% +/-0.2 293 +/-97 1.80% +/-0.6 $100,000 to $149,999 601,445 +/-5,019 17.20% +/-0.1 11,566 +/-625 5.10% +/-0.3 584 +/-134 3.50% +/-0.8 $150,000 to $199,999 575,857 +/-4,480 16.50% +/-0.1 23,260 +/-750 10.20% +/-0.3 1,743 +/-243 10.40% +/-1.4 $200,000 to $299,999 686,023 +/-5,040 19.60% +/-0.1 70,737 +/-1,265 31.20% +/-0.5 7,656 +/-370 45.80% +/-2.0 $300,000 to $499,999 472,570 +/-3,993 13.50% +/-0.1 77,455 +/-1,378 34.10% +/-0.5 4,599 +/-335 27.50% +/-1.8 $500,000 to $999,999 159,675 +/-2,134 4.60% +/-0.1 28,886 +/-791 12.70% +/-0.3 1,428 +/-190 8.50% +/-1.1 $1,000,000 or more 31,375 +/-942 0.90% +/-0.1 5,692 +/-391 2.50% +/-0.2 245 +/-89 1.50% +/-0.5 Median (dollars) 163,200 +/-400 (X) (X) 297,900 +/-1,747 (X) (X) 272,000 +/-4,301 (X) (X)
Owner-occupied units 3,498,381 +/-14,656 3,498,381 (X) 226,980 +/-1,720 226,980 (X) 16,716 +/-404 16,716 (X) Housing units with a mortgage 2,206,344 +/-10,965 63.10% +/-0.1 163,049 +/-1,608 71.80% +/-0.4 11,738 +/-416 70.20% +/-2.0
MORTGAGE STATUS
VALUE
HOUSING TENURE
YEAR HOUSEHOLDER MOVED INTO UNIT
VEHICLES AVAILABLE
HOUSE HEATING FUEL
SELECTED CHARACTERISTICS
OCCUPANTS PER ROOM

Housing units without a mortgage 1,292,037 +/-6,045 36.90% +/-0.1 63,931 +/-1,036 28.20% +/-0.4 4,978 +/-369 29.80% +/-2.0
Housing units with a mortgage 2,206,344 +/-10,965 2,206,344 (X) 163,049 +/-1,608 163,049 (X) 11,738 +/-416 11,738 (X) Less than $300 3,635 +/-327 0.20% +/-0.1 55 +/-41 0.00% +/-0.1 10 +/-15 0.10% +/-0.1 $300 to $499 38,663 +/-1,187 1.80% +/-0.1 539 +/-145 0.30% +/-0.1 51 +/-40 0.40% +/-0.3 $500 to $699 126,426 +/-1,859 5.70% +/-0.1 1,909 +/-223 1.20% +/-0.1 115 +/-62 1.00% +/-0.5 $700 to $999 353,217 +/-4,115 16.00% +/-0.2 6,438 +/-418 3.90% +/-0.3 478 +/-114 4.10% +/-1.0 $1,000 to $1,499 663,348 +/-5,115 30.10% +/-0.2 26,886 +/-893 16.50% +/-0.5 2,061 +/-277 17.60% +/-2.2 $1,500 to $1,999 457,209 +/-4,073 20.70% +/-0.2 40,133 +/-1,149 24.60% +/-0.7 3,474 +/-304 29.60% +/-2.3 $2,000 or more 563,846 +/-4,822 25.60% +/-0.2 87,089 +/-1,553 53.40% +/-0.8 5,549 +/-303 47.30% +/-2.4 Median (dollars) 1,435 +/-3 (X) (X) 2,083 +/-17 (X) (X) 1,958 +/-34 (X) (X)
Housing units without a mortgage 1,292,037 +/-6,045 1,292,037 (X) 63,931 +/-1,036 63,931 (X) 4,978 +/-369 4,978 (X) Less than $100 7,171 +/-470 0.60% +/-0.1 549 +/-129 0.90% +/-0.2 20 +/-22 0.40% +/-0.4 $100 to $199 46,372 +/-1,188 3.60% +/-0.1 508 +/-128 0.80% +/-0.2 8 +/-14 0.20% +/-0.3 $200 to $299 148,205 +/-2,470 11.50% +/-0.2 1,805 +/-252 2.80% +/-0.4 100 +/-54 2.00% +/-1.0 $300 to $399 245,799 +/-2,588 19.00% +/-0.2 4,223 +/-330 6.60% +/-0.5 220 +/-79 4.40% +/-1.5 $400 or more 844,490 +/-4,849 65.40% +/-0.2 56,846 +/-998 88.90% +/-0.7 4,630 +/-337 93.00% +/-1.8 Median (dollars) 479 +/-1 (X) (X) 701 +/-7 (X) (X) 762 +/-24 (X) (X)
Housing units with a mortgage (excluding units where 2,198,247 +/-11,003 2,198,247 (X) 162,646 +/-1,615 162,646 (X) 11,714 +/-416 11,714 (X) Less than 20.0 percent 822,852 +/-6,810 37.40% +/-0.2 57,247 +/-1,171 35.20% +/-0.7 3,901 +/-322 33.30% +/-2.4 20.0 to 24.9 percent 374,473 +/-3,714 17.00% +/-0.1 27,546 +/-1,002 16.90% +/-0.6 1,890 +/-266 16.10% +/-2.1 25.0 to 29.9 percent 277,141 +/-2,926 12.60% +/-0.1 22,176 +/-844 13.60% +/-0.5 1,659 +/-225 14.20% +/-1.9 30.0 to 34.9 percent 191,052 +/-2,729 8.70% +/-0.1 15,268 +/-794 9.40% +/-0.5 1,415 +/-205 12.10% +/-1.7 35.0 percent or more 532,729 +/-4,090 24.20% +/-0.2 40,409 +/-1,022 24.80% +/-0.6 2,849 +/-264 24.30% +/-2.2
Not computed 8,097 +/-637 (X) (X) 403 +/-107 (X) (X) 24 +/-25 (X) (X)
Housing unit without a mortgage (excluding units where SMOCAPI cannot be computed)
1,280,435 +/-5,936 1,280,435 (X) 63,483 +/-1,030 63,483 (X) 4,926 +/-366 4,926 (X)
Less than 10.0 percent 438,323 +/-3,733 34.20% +/-0.3 21,131 +/-738 33.30% +/-1.0 1,442 +/-191 29.30% +/-3.7 10.0 to 14.9 percent 264,691 +/-2,946 20.70% +/-0.2 12,662 +/-599 19.90% +/-0.9 976 +/-177 19.80% +/-3.2 15.0 to 19.9 percent 173,028 +/-2,450 13.50% +/-0.2 8,135 +/-483 12.80% +/-0.7 752 +/-157 15.30% +/-2.9 20.0 to 24.9 percent 111,301 +/-1,801 8.70% +/-0.1 5,512 +/-393 8.70% +/-0.6 332 +/-99 6.70% +/-2.0 25.0 to 29.9 percent 77,173 +/-1,366 6.00% +/-0.1 3,730 +/-323 5.90% +/-0.5 320 +/-110 6.50% +/-2.0 30.0 to 34.9 percent 51,611 +/-1,297 4.00% +/-0.1 2,572 +/-265 4.10% +/-0.4 192 +/-71 3.90% +/-1.4 35.0 percent or more 164,308 +/-2,374 12.80% +/-0.2 9,741 +/-596 15.30% +/-0.9 912 +/-153 18.50% +/-3.0
Not computed 11,602 +/-791 (X) (X) 448 +/-104 (X) (X) 52 +/-38 (X) (X)
Occupied units paying rent 1,362,772 +/-8,047 1,362,772 (X) 77,381 +/-1,524 77,381 (X) 4,250 +/-303 4,250 (X) Less than $200 36,330 +/-1,232 2.70% +/-0.1 830 +/-192 1.10% +/-0.2 23 +/-27 0.50% +/-0.6 $200 to $299 60,621 +/-1,272 4.40% +/-0.1 1,252 +/-247 1.60% +/-0.3 126 +/-84 3.00% +/-2.0 $300 to $499 159,824 +/-2,114 11.70% +/-0.2 2,300 +/-294 3.00% +/-0.4 105 +/-67 2.50% +/-1.6 $500 to $749 391,990 +/-3,937 28.80% +/-0.2 8,997 +/-592 11.60% +/-0.7 430 +/-113 10.10% +/-2.6 $750 to $999 351,857 +/-3,726 25.80% +/-0.2 19,583 +/-1,035 25.30% +/-1.1 1,300 +/-204 30.60% +/-4.2 $1,000 to $1,499 267,896 +/-3,715 19.70% +/-0.2 29,978 +/-978 38.70% +/-1.1 1,402 +/-221 33.00% +/-4.5 $1,500 or more 94,254 +/-1,776 6.90% +/-0.1 14,441 +/-659 18.70% +/-0.8 864 +/-177 20.30% +/-4.0 Median (dollars) 770 +/-2 (X) (X) 1,078 +/-11 (X) (X) 1,040 +/-51 (X) (X)
No rent paid 91,413 +/-1,894 (X) (X) 3,237 +/-379 (X) (X) 321 +/-116 (X) (X)
Occupied units paying rent (excluding units where GRAPI cannot be computed)
1,335,309 +/-7,941 1,335,309 (X) 76,378 +/-1,528 76,378 (X) 4,198 +/-301 4,198 (X)
Less than 15.0 percent 177,048 +/-2,861 13.30% +/-0.2 10,117 +/-744 13.20% +/-0.9 333 +/-97 7.90% +/-2.3 15.0 to 19.9 percent 172,725 +/-2,928 12.90% +/-0.2 10,693 +/-710 14.00% +/-0.9 718 +/-173 17.10% +/-3.9 20.0 to 24.9 percent 171,573 +/-3,050 12.80% +/-0.2 10,687 +/-770 14.00% +/-1.0 472 +/-147 11.20% +/-3.4 25.0 to 29.9 percent 156,861 +/-3,004 11.70% +/-0.2 8,829 +/-623 11.60% +/-0.8 467 +/-128 11.10% +/-2.9
SELECTED MONTHLY OWNER COSTS (SMOC)
SELECTED MONTHLY OWNER COSTS AS A PERCENTAGE OF HOUSEHOLD INCOME (SMOCAPI)
GROSS RENT
GROSS RENT AS A PERCENTAGE OF HOUSEHOLD INCOME (GRAPI)

30.0 to 34.9 percent 115,660 +/-2,501 8.70% +/-0.2 6,572 +/-582 8.60% +/-0.7 341 +/-120 8.10% +/-2.8 35.0 percent or more 541,442 +/-5,140 40.50% +/-0.3 29,480 +/-1,005 38.60% +/-1.1 1,867 +/-249 44.50% +/-5.1
Not computed 118,876 +/-2,241 (X) (X) 4,240 +/-434 (X) (X) 373 +/-117 (X) (X)

EstimateMargin of
ErrorEstimate
Margin of
ErrorEstimate
Margin of
ErrorEstimate
Margin of
ErrorEstimate
Margin of
ErrorEstimate
Margin of
ErrorEstimate
Margin of
ErrorEstimate
Margin of
ErrorEstimate
Margin of
Error
Total population 12,660,739 ***** 6,167,949 +/-933 6,492,790 +/-933 794,921 ***** 385,372 +/-71 409,549 +/-71 55,429 +/-39 26,247 +/-495 29,182 +/-496
Under 5 years 5.70% +/-0.1 6.00% +/-0.1 5.50% +/-0.1 5.90% +/-0.1 6.20% +/-0.1 5.60% +/-0.1 5.40% +/-0.5 5.00% +/-0.7 5.80% +/-0.9 5 to 9 years 6.00% +/-0.1 6.30% +/-0.1 5.70% +/-0.1 6.30% +/-0.1 6.50% +/-0.2 6.10% +/-0.2 6.50% +/-0.6 7.40% +/-0.9 5.60% +/-0.7 10 to 14 years 6.30% +/-0.1 6.60% +/-0.1 6.00% +/-0.1 6.60% +/-0.1 7.00% +/-0.2 6.20% +/-0.2 5.80% +/-0.6 6.60% +/-0.9 5.10% +/-0.7 15 to 19 years 7.20% +/-0.1 7.60% +/-0.1 6.90% +/-0.1 6.60% +/-0.1 6.90% +/-0.1 6.20% +/-0.1 6.00% +/-0.6 6.60% +/-1.0 5.50% +/-0.8 20 to 24 years 6.80% +/-0.1 7.00% +/-0.1 6.50% +/-0.1 5.40% +/-0.1 5.60% +/-0.1 5.20% +/-0.1 5.30% +/-0.6 5.30% +/-0.8 5.40% +/-0.8 25 to 29 years 6.10% +/-0.1 6.30% +/-0.1 6.00% +/-0.1 6.00% +/-0.1 6.30% +/-0.1 5.80% +/-0.1 5.90% +/-0.6 6.50% +/-1.0 5.40% +/-0.8 30 to 34 years 5.70% +/-0.1 5.80% +/-0.1 5.60% +/-0.1 6.00% +/-0.1 6.10% +/-0.1 5.80% +/-0.1 5.30% +/-0.6 5.20% +/-0.7 5.40% +/-0.7 35 to 39 years 6.20% +/-0.1 6.40% +/-0.1 6.10% +/-0.1 6.60% +/-0.1 6.70% +/-0.2 6.60% +/-0.2 5.60% +/-0.7 5.50% +/-0.9 5.70% +/-0.8 40 to 44 years 6.80% +/-0.1 6.90% +/-0.1 6.70% +/-0.1 7.40% +/-0.2 7.50% +/-0.2 7.20% +/-0.2 7.40% +/-0.7 7.50% +/-0.9 7.30% +/-0.9 45 to 49 years 7.60% +/-0.1 7.70% +/-0.1 7.50% +/-0.1 8.10% +/-0.1 8.10% +/-0.1 8.10% +/-0.1 7.50% +/-0.6 7.40% +/-0.8 7.50% +/-0.8 50 to 54 years 7.70% +/-0.1 7.70% +/-0.1 7.60% +/-0.1 7.90% +/-0.1 7.90% +/-0.1 7.80% +/-0.1 8.80% +/-0.7 8.60% +/-0.8 9.00% +/-0.9 55 to 59 years 6.80% +/-0.1 6.80% +/-0.1 6.80% +/-0.1 6.60% +/-0.1 6.70% +/-0.2 6.60% +/-0.1 7.20% +/-0.7 7.30% +/-1.0 7.10% +/-0.8 60 to 64 years 5.70% +/-0.1 5.60% +/-0.1 5.80% +/-0.1 5.60% +/-0.1 5.50% +/-0.2 5.80% +/-0.1 5.90% +/-0.7 6.10% +/-1.0 5.70% +/-0.8 65 to 69 years 4.30% +/-0.1 4.10% +/-0.1 4.40% +/-0.1 4.10% +/-0.1 4.00% +/-0.1 4.20% +/-0.1 4.60% +/-0.4 4.80% +/-0.6 4.50% +/-0.6 70 to 74 years 3.30% +/-0.1 3.00% +/-0.1 3.60% +/-0.1 3.10% +/-0.1 2.80% +/-0.1 3.40% +/-0.1 3.00% +/-0.5 2.60% +/-0.5 3.40% +/-0.7 75 to 79 years 3.00% +/-0.1 2.50% +/-0.1 3.30% +/-0.1 2.90% +/-0.1 2.50% +/-0.1 3.30% +/-0.1 3.40% +/-0.5 3.40% +/-0.6 3.50% +/-0.6 80 to 84 years 2.50% +/-0.1 1.90% +/-0.1 3.00% +/-0.1 2.50% +/-0.1 2.00% +/-0.1 2.90% +/-0.1 2.90% +/-0.5 1.90% +/-0.5 3.90% +/-0.7 85 years and over 2.30% +/-0.1 1.50% +/-0.1 3.10% +/-0.1 2.40% +/-0.1 1.60% +/-0.1 3.20% +/-0.1 3.50% +/-0.5 2.60% +/-0.5 4.40% +/-0.8
5 to 14 years 12.30% +/-0.1 12.90% +/-0.1 11.70% +/-0.1 12.90% +/-0.1 13.50% +/-0.1 12.30% +/-0.1 12.30% +/-0.7 14.00% +/-1.0 10.70% +/-0.9 15 to 17 years 4.10% +/-0.1 4.40% +/-0.1 3.90% +/-0.1 4.20% +/-0.1 4.50% +/-0.1 4.00% +/-0.1 4.20% +/-0.5 3.90% +/-0.7 4.50% +/-0.7 18 to 24 years 9.80% +/-0.1 10.20% +/-0.1 9.50% +/-0.1 7.70% +/-0.1 8.00% +/-0.1 7.50% +/-0.1 7.10% +/-0.7 7.90% +/-1.0 6.30% +/-0.9 15 to 44 years 38.90% +/-0.1 40.10% +/-0.1 37.70% +/-0.1 37.90% +/-0.1 39.10% +/-0.1 36.80% +/-0.1 35.50% +/-0.9 36.50% +/-1.4 34.50% +/-1.1 16 years and over 80.60% +/-0.1 79.70% +/-0.1 81.60% +/-0.1 79.80% +/-0.1 78.80% +/-0.1 80.80% +/-0.1 80.90% +/-0.6 79.60% +/-1.2 82.10% +/-1.1 18 years and over 77.90% +/-0.1 76.70% +/-0.1 78.90% +/-0.1 77.00% +/-0.1 75.80% +/-0.1 78.10% +/-0.1 78.10% +/-0.6 77.10% +/-1.1 79.00% +/-1.2 60 years and over 21.10% +/-0.1 18.80% +/-0.1 23.20% +/-0.1 20.60% +/-0.1 18.40% +/-0.2 22.80% +/-0.1 23.40% +/-0.9 21.30% +/-1.2 25.30% +/-1.3 62 years and over 18.60% +/-0.1 16.30% +/-0.1 20.70% +/-0.1 18.10% +/-0.1 16.00% +/-0.2 20.20% +/-0.1 21.10% +/-0.8 19.20% +/-1.1 22.80% +/-1.2 65 years and over 15.40% +/-0.1 13.20% +/-0.1 17.40% +/-0.1 15.00% +/-0.1 12.90% +/-0.1 17.00% +/-0.1 17.50% +/-0.7 15.20% +/-0.9 19.60% +/-1.0 75 years and over 7.80% +/-0.1 6.00% +/-0.1 9.50% +/-0.1 7.80% +/-0.1 6.10% +/-0.1 9.40% +/-0.1 9.90% +/-0.7 7.90% +/-0.8 11.70% +/-0.9
Median age (years) 39.9 +/-0.2 38.5 +/-0.2 41.4 +/-0.1 40.4 +/-0.1 39.1 +/-0.2 41.8 +/-0.2 42.8 +/-0.7 41.1 +/-0.8 44.1 +/-0.9 Sex ratio (males per 100 females) 95 +/-0.1 (X) (X) (X) (X) 94.1 +/-0.1 (X) (X) (X) (X) 89.9 +/-3.2 (X) (X) (X) (X) Age dependency ratio 60 +/-0.1 (X) (X) (X) (X) 61.3 +/-0.1 (X) (X) (X) (X) 65 +/-2.1 (X) (X) (X) (X) Old-age dependency ratio 24.6 +/-0.1 (X) (X) (X) (X) 24.2 +/-0.1 (X) (X) (X) (X) 28.9 +/-1.4 (X) (X) (X) (X) Child dependency ratio 35.4 +/-0.1 (X) (X) (X) (X) 37.1 +/-0.1 (X) (X) (X) (X) 36.1 +/-1.3 (X) (X) (X) (X)
Sex 0.10% (X) (X) (X) (X) (X) 0.20% (X) (X) (X) (X) (X) 0.20% (X) (X) (X) (X) (X) Age 1.00% (X) (X) (X) (X) (X) 0.90% (X) (X) (X) (X) (X) 0.50% (X) (X) (X) (X) (X)
PERCENT IMPUTED
Female
Montgomery County, Pennsylvania Abington township, Montgomery County, Pennsylvania
Total Total Male
Pennsylvania
AGE
SELECTED AGE CATEGORIES
SUMMARY INDICATORS
S0101: AGE AND SEX 2007-2011 American Community Survey 5-Year Estimates
Total Male FemaleMale Female

EstimateMargin of
ErrorEstimate
Margin of
ErrorEstimate
Margin of
ErrorEstimate
Margin of
ErrorEstimate
Margin of
ErrorEstimate
Margin of
ErrorEstimate
Margin of
ErrorEstimate
Margin of
ErrorEstimate
Margin of
ErrorTotal civilian noninstitutionalized population 12,502,745 +/-731 1,641,794 +/-12,029 13.10% +/-0.1 787,244 +/-966 70,566 +/-2,065 9.00% +/-0.3 54,818 +/-298 6,435 +/-676 11.70% +/-1.2
Population under 5 years 726,758 +/-650 5,610 +/-726 0.80% +/-0.1 46,957 +/-75 298 +/-175 0.60% +/-0.4 2,817 +/-448 0 +/-104 0.00% +/-1.6With a hearing difficulty (X) (X) 3,584 +/-609 0.50% +/-0.1 (X) (X) 274 +/-165 0.60% +/-0.4 (X) (X) 0 +/-104 0.00% +/-1.6With a vision difficulty (X) (X) 3,037 +/-517 0.40% +/-0.1 (X) (X) 48 +/-54 0.10% +/-0.1 (X) (X) 0 +/-104 0.00% +/-1.6
Population 5 to 17 years 2,050,321 +/-924 130,907 +/-3,583 6.40% +/-0.2 135,309 +/-200 5,350 +/-559 4.00% +/-0.4 9,268 +/-631 581 +/-212 6.30% +/-2.3With a hearing difficulty (X) (X) 13,401 +/-1,342 0.70% +/-0.1 (X) (X) 793 +/-257 0.60% +/-0.2 (X) (X) 76 +/-65 0.80% +/-0.7With a vision difficulty (X) (X) 15,920 +/-1,214 0.80% +/-0.1 (X) (X) 481 +/-127 0.40% +/-0.1 (X) (X) 34 +/-39 0.40% +/-0.4With a cognitive difficulty (X) (X) 103,226 +/-3,279 5.00% +/-0.2 (X) (X) 3,847 +/-482 2.80% +/-0.4 (X) (X) 455 +/-209 4.90% +/-2.3With an ambulatory difficulty (X) (X) 12,571 +/-1,026 0.60% +/-0.1 (X) (X) 469 +/-133 0.30% +/-0.1 (X) (X) 31 +/-35 0.30% +/-0.4With a self-care difficulty (X) (X) 21,312 +/-1,279 1.00% +/-0.1 (X) (X) 1,338 +/-290 1.00% +/-0.2 (X) (X) 135 +/-84 1.50% +/-0.9
Population 18 to 64 years 7,842,462 +/-1,395 834,203 +/-8,612 10.60% +/-0.1 489,488 +/-825 30,454 +/-1,656 6.20% +/-0.3 33,632 +/-613 2,824 +/-426 8.40% +/-1.3With a hearing difficulty (X) (X) 161,029 +/-3,572 2.10% +/-0.1 (X) (X) 5,982 +/-744 1.20% +/-0.2 (X) (X) 549 +/-170 1.60% +/-0.5With a vision difficulty (X) (X) 124,112 +/-3,563 1.60% +/-0.1 (X) (X) 3,839 +/-617 0.80% +/-0.1 (X) (X) 438 +/-187 1.30% +/-0.6With a cognitive difficulty (X) (X) 367,057 +/-5,976 4.70% +/-0.1 (X) (X) 13,488 +/-1,165 2.80% +/-0.2 (X) (X) 1,037 +/-290 3.10% +/-0.8With an ambulatory difficulty (X) (X) 410,530 +/-5,948 5.20% +/-0.1 (X) (X) 14,499 +/-1,172 3.00% +/-0.2 (X) (X) 1,415 +/-333 4.20% +/-1.0With a self-care difficulty (X) (X) 141,882 +/-4,007 1.80% +/-0.1 (X) (X) 5,487 +/-672 1.10% +/-0.1 (X) (X) 430 +/-176 1.30% +/-0.5With an independent living difficulty (X) (X) 297,485 +/-4,478 3.80% +/-0.1 (X) (X) 11,231 +/-936 2.30% +/-0.2 (X) (X) 923 +/-249 2.70% +/-0.7
Population 65 years and over 1,883,204 +/-965 671,074 +/-4,958 35.60% +/-0.3 115,490 +/-621 34,464 +/-1,300 29.80% +/-1.1 9,101 +/-420 3,030 +/-415 33.30% +/-3.8With a hearing difficulty (X) (X) 278,998 +/-3,598 14.80% +/-0.2 (X) (X) 14,088 +/-824 12.20% +/-0.7 (X) (X) 1,308 +/-325 14.40% +/-3.3With a vision difficulty (X) (X) 117,396 +/-2,660 6.20% +/-0.1 (X) (X) 5,731 +/-593 5.00% +/-0.5 (X) (X) 569 +/-235 6.30% +/-2.5With a cognitive difficulty (X) (X) 156,181 +/-3,001 8.30% +/-0.2 (X) (X) 8,321 +/-691 7.20% +/-0.6 (X) (X) 631 +/-199 6.90% +/-2.1With an ambulatory difficulty (X) (X) 421,955 +/-3,882 22.40% +/-0.2 (X) (X) 20,786 +/-1,071 18.00% +/-0.9 (X) (X) 1,880 +/-333 20.70% +/-3.3With a self-care difficulty (X) (X) 145,934 +/-2,717 7.70% +/-0.1 (X) (X) 7,727 +/-740 6.70% +/-0.6 (X) (X) 934 +/-254 10.30% +/-2.6With an independent living difficulty (X) (X) 296,511 +/-3,356 15.70% +/-0.2 (X) (X) 16,103 +/-981 13.90% +/-0.8 (X) (X) 1,554 +/-322 17.10% +/-3.2
Male 6,061,006 +/-1,886 769,259 +/-7,489 12.70% +/-0.1 379,819 +/-807 32,708 +/-1,334 8.60% +/-0.4 26,255 +/-721 2,966 +/-404 11.30% +/-1.5 Female 6,441,739 +/-1,845 872,535 +/-7,337 13.50% +/-0.1 407,425 +/-488 37,858 +/-1,363 9.30% +/-0.3 28,563 +/-732 3,469 +/-474 12.10% +/-1.7
One Race 12,278,650 +/-6,362 1,612,813 +/-11,945 13.10% +/-0.1 N N N N N N N N N N N N White alone 10,355,966 +/-6,465 1,348,300 +/-9,639 13.00% +/-0.1 651,319 +/-1,453 60,654 +/-1,804 9.30% +/-0.3 43,854 +/-929 5,212 +/-705 11.90% +/-1.5 Black or African American alone 1,314,562 +/-5,923 204,839 +/-5,173 15.60% +/-0.4 65,640 +/-958 6,350 +/-811 9.70% +/-1.3 6,868 +/-677 864 +/-205 12.60% +/-2.7 American Indian and Alaska Native alone 16,991 +/-1,138 4,694 +/-628 27.60% +/-3.2 N N N N N N N N N N N N Asian alone 350,421 +/-2,611 20,665 +/-1,308 5.90% +/-0.4 51,231 +/-768 1,956 +/-363 3.80% +/-0.7 2,755 +/-536 228 +/-132 8.30% +/-4.1 Native Hawaiian and Other Pacific Islander 2,489 +/-594 287 +/-137 11.50% +/-4.7 N N N N N N N N N N N N Some other race alone 238,221 +/-6,561 34,028 +/-2,026 14.30% +/-0.8 4,508 +/-984 308 +/-170 6.80% +/-3.4 N N N N N N Two or more races 224,095 +/-6,226 28,981 +/-1,430 12.90% +/-0.6 13,789 +/-1,394 1,081 +/-325 7.80% +/-2.2 N N N N N N
White alone, not Hispanic or Latino 9,969,980 +/-2,758 1,301,206 +/-9,285 13.10% +/-0.1 624,833 +/-875 59,529 +/-1,787 9.50% +/-0.3 42,441 +/-1,132 5,026 +/-728 11.80% +/-1.6Hispanic or Latino (of any race) 704,691 +/-990 93,907 +/-2,962 13.30% +/-0.4 33,675 +/-172 1,541 +/-314 4.60% +/-0.9 2,113 +/-604 244 +/-154 11.50% +/-5.9
Disability status 4.70% (X) (X) (X) (X) (X) 3.60% (X) (X) (X) (X) (X) 3.60% (X) (X) (X) (X) (X) Hearing difficulty 3.20% (X) (X) (X) (X) (X) 2.20% (X) (X) (X) (X) (X) 1.90% (X) (X) (X) (X) (X) Vision difficulty 3.50% (X) (X) (X) (X) (X) 2.40% (X) (X) (X) (X) (X) 2.20% (X) (X) (X) (X) (X) Cognitive difficulty 3.50% (X) (X) (X) (X) (X) 2.50% (X) (X) (X) (X) (X) 2.30% (X) (X) (X) (X) (X) Ambulatory difficulty 3.50% (X) (X) (X) (X) (X) 2.60% (X) (X) (X) (X) (X) 2.30% (X) (X) (X) (X) (X) Self-care difficulty 3.50% (X) (X) (X) (X) (X) 2.50% (X) (X) (X) (X) (X) 2.40% (X) (X) (X) (X) (X) Independent living difficulty 3.50% (X) (X) (X) (X) (X) 2.60% (X) (X) (X) (X) (X) 2.20% (X) (X) (X) (X) (X)
RACE AND HISPANIC OR LATINO ORIGIN
PERCENT IMPUTED
Total With a disabilityPercent with a
disabilityTotal
SEX
With a disability
Pennsylvania
2007-2011 American Community Survey 5-Year EstimatesS1810: DISABILITY CHARACTERISTICS
Percent with a
disability
Montgomery County, PA Abington township, Montgomery County, PA
Total With a disabilityPercent with a
disability

Township of Abington, Pennsylvania
Analysis of Impediments to Fair Housing Choice Page 123 of 125
Appendix B – Home Mortgage Disclosure Act Data
HMDA Reports from 2013.

1ST ALLIANCE LENDING, LLC 21ST MORTGAGE 360 MORTGAGE GROUP LLC
3RD FED BANK AAKO INC D/B/A BOULEVARD MTG ABACUS FEDERAL SAVINGS BANK
ADVISORS MORTGAGE GROUP, LLC. AFFILIATED MORTGAGE COMPANY AFFINITY LENDING SOLUTIONS, LL
AHMC ALLIANCE BANK ALLIED MORTGAGE GROUP
ALLY BANK AMBLER SAVINGS BANK AMCAP MORTGAGE LTD
AMERICAN ADVISORS GROUP AMERICAN BANK AMERICAN EQUITY MORTGAGE, INC
AMERICAN FEDERAL MORTGAGE CORP AMERICAN FINANCIAL RESOURCES, AMERICAN HERITAGE FCU
AMERICAN INTERBANC MTG LLC AMERICAN INTERNET MORTGAGE INC AMERICAN NEIGHBORHOOD MORTGAGE
AMERICASH AMERISAVE MORTGAGE CORPORATION ASIAN BANK
ASSOCIATED MORTGAGE BANKERS, I ATLANTIC HOME LOANS, INC. ATLANTIC PACIFIC MORTGAGE CORP
AURORA FINANCIAL GROUP, INC. BANK OF AMERICA, N.A. BARRONS MORTGAGE GROUP LTD
BENCHMARK FEDERAL CREDIT UNION BENEFICIAL SAVINGS BANK BERKADIA COMMERCIAL MORTG LLC
BNY MELLON, N.A. BOEING HELICOPTERS C U BOND STREET MORTGAGE, LLC
BRIDGEVIEW BK MORTGAGE CO LLC BUCKS COUNTY BANK BUCKS FIRST FCU
C&F MORTGAGE CORP CALIBER FUNDING LLC CARDINAL FINANCIAL COMPANY
CARRINGTON MORTGAGE SERVICES CASTLE MORTGAGE CORPORATION CENTENNIAL LENDING GROUP, LLC
CHERRY CREEK MORTGAGE CO., INC CHRISTENSEN FINANCIAL, INC. CIS FINANCIAL SERVICES INC.
CITADEL FEDERAL CREDIT UNION CITIBANK, N.A. CITIMORTGAGE, INC
CITIZENS BANK OF PENNSYLVANIA CITYWORTH MORTGAGE LLC CLEARPOINT FUNDING, INC.
CMG FINANCIAL, INC COATESVILLE SAVINGS BANK COLE TAYLOR BANK
COLONIAL AMERICAN BANK COMTRUST FEDERAL CREDIT UNION CONESTOGA BANK
CONTINENTAL BANK CONTINENTAL HOME LOANS INC. CONTOUR MORTGAGE CORPORATION
CORRIDOR MTG CO LLC COUNTY SAVINGS BANK CRESCENT MORTGAGE COMPANY
CROSSCOUNTRY MORTGAGE CROSSLINE CAPITAL INC. CUSTOMERS BANK
DB PRIVATE WEALTH MORTGAGE LTD DIAMOND CREDIT UNION DISCOVER HOME LOANS, INC.
DNB FIRST, NA DVA FEDERAL CREDIT UNION E MORTGAGE MANAMGEMENT, LLC
EAGLE NATIONAL BANK EAGLE ONE FEDERAL CREDIT UNION EAST RIVER BANK
EMBRACE HOME LOANS, INC. EMIGRANT MORTGAGE COMPANY, INC ENVOY MORTGAGE, LTD.
Equity Loans LLC EQUITY RESOURCES INC EVERENCE FEDERAL CREDIT UNION
EXCEL MORTGAGE SERVICING, INC FAIRLESS CREDIT UNION FAIRWAY INDEPENDENT MORT CORP
FBC MORTGAGE, LLC FEARON FINANCIAL LLC FEDCHOICE FEDERAL CREDIT UNION
FEDERATED LENDING CORP FIDELITY S & LA OF BUCKS CTY FIFTH THIRD MORTGAGE COMPANY
FINANCIAL RESOURCES FEDERAL CU FIRST AMERICAN MORTGAGE TRUST FIRST ATLANTIC FCU
FIRST CHOICE LOAN SERVICES INC FIRST COMMUNITY MORTGAGE FIRST CORNERSTONE BANK
First Financial Services, Inc. FIRST FS&LA OF BUCKS CTY FIRST GUARANTY MORTGAGE CORP
FIRST HALLMARK MORTGAGE CORP FIRST HERITAGE FINANCIAL LLC FIRST HOME MORTGAGE
FIRST HOPE MORTGAGES, INC FIRST NATIONAL BANK AND TRUST FIRST NIAGARA BANK
FIRST PRIORITY BANK FIRST RESOURCE BANK FIRST SAVINGS BANK OF PERKASIE
FIRSTMERIT MORTGAGE CORP FIRSTRUST FLEETWOOD BANK
FOX CHASE BANK FRANKLIN FIRST FINANCIAL, LTD. FRANKLIN MINT FEDERAL CREDIT U
FRANLKIN AMERICAN MORTGAGE CO FREEDOM CREDIT UNION FREEDOM MORTGAGE CORPORATION
FULTON BANK, NA GATEWAY FUNDING DMS, LP GENERAL ELECTRIC EMP FED CREDI
GENERATION MORTGAGE COMPANY GENISYS CREDIT UNION GEORGE MASON MORTGAGE LLC
GFS CAPITAL GMAC MORTGAGE, LLC GOLD STAR MORTGAGE FINANCIAL
Greentree Mortgage Co., L.P. GS COMMERCIAL REAL ESTATE LP GSF MORTGAGE CORPORATION
GUARANTEED HOME MORTGAGE COMPA GUARANTEED RATE INC GUIDANCE RESIDENTIAL, LLC
Report Date: 06/02/2014
LIST OF FINANCIAL INSTITUTIONS WHOSE DATA MAKE UP THE 2013 MSA/MD AGGREGATE REPORT
MSA/MD: 37964 - PHILADELPHIA, PA
Page 1 of 7
INSTITUTIONS WHO HAVE A HOME OR BRANCH OFFICE IN THE MSA/MD

Hamilton National Mortgage Com HARLEYSVILLE SAVINGS BANK Hatboro Federal Savings
HOME FINANCE OF AMERICA HOMEAMERICAN MORTGAGE CORPORAT HOMEBRIDGE FINANCIAL SERVICES,
HOMEOWNERS MORTGAGE OF AMERICA HOMEPROMISE CORPORATION HOMEWARD RESIDENTIAL INC
HSBC BANK USA, NA HUNTINGDON VALLEY BANK HYPERION BANK
IFREEDOM DIRECT CORPORATION INTEGRITY FIRST FINANCIAL GROU INVESTORS BANK
IRON WORKERS BANK ISB HOME MORTGAGE LLC JAMES B. NUTTER & CO.
K. HOVNANIAN AMERICAN MORTGAGE KEYSTONE FCU KWIK MORTGAGE CORPORATION
LEADERONE FINANCIAL CORP ISAOA LENDMARK FINANCIAL SERVICES LENOX FINANCIAL MORTGAGE CORP
LIBERTY HOME EQUITY SOLUTIONS, LINCOLN MORTGAGE COMPANY LOANDEPOT.COM, LLC
LUXURY MORTGAGE CORP M&T BANK M&T REAL ESTATE TRUST
MALVERN FEDERAL SAVINGS BANK MAVERICK FUNDING CORP MB FINANCIAL BANK NA
MCS MORTGAGE BANKERS, INC MEADOWBROOK FINANCIAL MORTGAGE MEDIA MEMBERS FCU
MEMBER ADVANTAGE MORTGAGE LLC MEMBER FIRST MORTGAGE, LLC MERCK SHARP & DOHME FCU
MERIDIAN BANK MERIDIAN RESIDENTIAL CAPITAL MERRIMACK MORTGAGE COMPANY INC
MICHIGAN MUTUAL, INC. MID-ISLAND MORTGAGE CORP. MIDATLANTIC FARM CREDIT
MIDCOAST COMMUNITY BANK MIDWEST LOAN SERVICES INC MILEND, INC.
MILESTONE BANK MILITARY FAMILY HOME LOANS, LL MILLENIUM HOME MORTGAGE, LLC
Monument Bank MORTGAGE AMERICA, INC. MORTGAGE CAPITAL ASSOCIATES
MORTGAGE LENDERS OF AMERICA MORTGAGE MASTER MORTGAGE NETWORK
MORTGAGE RESEARCH CENTER MORTGAGE SERVICES III, L.L.C. MOVEMENT MORTGAGE, LLC
NATIONAL PENN BANK NATIONS LENDING CORPORATION NATIONSTAR MORTGAGE LLC
NATIONWIDE ADVANTAGE MORTGAGE NATIONWIDE EQUITIES CORP. NBA CREDIT UNION
NETWORK CAPITAL FUNDING CORP NETWORK FUNDING LP NEW AMERICA FINANCIAL CORP
NEW DAY FINANCIAL, LLC NEW PENN FINANCIAL, LLC NFCU
NFM, INC. NJ LENDERS CORP NOAH BANK
NORRISTOWN BELL CREDIT UNION NORTHERN STATES FUNDING GROUP NORWICH COMMERCIAL GROUP INC
NVR MORTGAGE FINANCE INC NYCB MORTGAGE COMPANY LLC OAK MORTGAGE COMPANY , LLC
OCEANFIRST BANK OCEANSIDE MORTGAGE COMPANY OCWEN LOAN SERVICING LLC
OMEGA FINANCIAL SERVICES, INC. ONE REVERSE MORTGAGE, LLC ONLINE MORTGAGE GROUP LLC
ORITANI FINANCE COMPANY PACIFIC UNION FINANCIAL, LLC PARKEBANK
PENN LIBERTY BANK PENNYMAC LOAN SERVICES LLC PEOPLES HOME EQUITY, INC
PHH HOME LOANS PHH MORTGAGE CORPORATION PHILADELPHIA FEDERAL CREDIT UN
PHILADELPHIA MORTGAGE ADVISORS PHOENIXVILLE FEDERAL BANK & TR PIKE CREEK MORTGAGE SERVICES
PINGORA LOAN SERVICING, LLC PLATINUM HOME MORTGAGE CORP PLAZA HOME MORTGAGE, INC.
PMAC LENDING SERVICES, INC. PNC BANK N.A. POLI MORTGAGE GROUP INC
POLICE AND FIRE FEDERAL CU POLONIA BANK PORT RICHMOND SAVINGS
PREMIA MORTGAGE, LLC PREMIER HOME MORTGAGE INC PRESIDENTIAL BANK, F.S.B.
PRIMARY RESIDENTIAL MORTGAGE PRIMELENDING PROSPECT MORTGAGE LLC
PROSPERITY MORTGAGE COMPANY PROVIDENT FUNDING ASSOCIATES PRUDENTIAL SAVINGS BANK
PULTE MORTGAGE LLC QNB BANK QUAINT OAK BANK
QUAINT OAK MORTGAGE, LLC QUICKEN LOANS RELIANCE FIRST CAPITAL LLC
REPUBLIC BANK RESIDENTIAL FINANCE CORPORATIO RESIDENTIAL HOME FUNDING CORP.
RESIDENTIAL HOME MORTGAGE CORP REVERSE MORTGAGE SOLUTIONS, IN ROUNDPOINT MORTGAGE COMPANY
ROYAL BANK AMERICA ROYAL UNITED MORTGAGE LLC SANTANDER BANK N.A.
SB1 FEDERAL CREDIT UNION SECURITY ONE LENDING SEMPER HOME LOANS, INC
SERVICE FINANCE COMPANY, LLC SHARON SAVINGS BANK SHARONVIEW FEDERAL CREDIT UNIO
Report Date: 06/02/2014
LIST OF FINANCIAL INSTITUTIONS WHOSE DATA MAKE UP THE 2013 MSA/MD AGGREGATE REPORT
MSA/MD: 37964 - PHILADELPHIA, PA
Page 2 of 7
INSTITUTIONS WHO HAVE A HOME OR BRANCH OFFICE IN THE MSA/MD

SHELTER MORTGAGE COMPANY, LLC SIERRA PACIFIC MORTGAGE SIRVA MORTGAGE, INC.
STEARNS LENDING STONEBRIDGE BANK STONEGATE MORTGAGE CORPORATION
SUMMIT MORTGAGE CORPORATION SUN EAST FEDERAL CREDIT SUN FEDERAL CREDIT UNION
SUN NATIONAL BANK SUN WEST MORTGAGE COMPANY, INC SUNTRUST MORTGAGE, INC
SUPERIOR CREDIT UNION SUSQUEHANNA BANK TAMMAC HOLDINGS CORPORATION
TBI Mortgage Company TD BANK N.A. TEAM CAPITAL BANK
THE BANCORP BANK THE BANK OF PRINCETON THE BRYN MAWR TRUST COMPANY
THE HAVERFORD TRUST COMPANY THE NATIONAL BANK OF MALVERN THE VICTORY BANK
TIDEWATER MORTGAGE SERVICES TOTAL MORTGAGE SERVICE, LLC TRI COUNTY AREA FCU
TRIDENT MORTGAGE COMPANY LP TRUHOME SOLUTIONS, LLC TRUMARK FINANCIAL CU
UKRAINIAN SELFRELIANCE FCU UNIFIRST MORTGAGE CORPORATION UNION HOME MORTGAGE CORP.
UNITED BANK OF PHILADELPHIA UNITED MORTGAGE CORP UNITED NORTHERN MORTGAGE BANKE
UNITED SAVINGS BANK United Security Financial UNITED SHORE FINANCIAL SERVICE
UNITED SOUTHWEST MTG CORP INC UNIVERSAL MORTGAGE & FINANCE UNIVERSITY ISLAMIC FINANCIAL
UNIVEST BANK AND TRUST CO. UPPER DARBY BELLTELCO URBAN FINANCIAL OF AMERICA, LL
US MORTGAGE CORPORATIOIN VALLEY GREEN BANK VANDERBILT MORTGAGE
VANGUARD FUNDING LLC VILLAGE CAPITAL & INVESTMENT VIRIVA COMMUNITY CREDIT UNION
VIST BANK WASHINGTON SAVINGS BANK WATERMARK CAPITAL, INC.
WATERSTONE MORTGAGE CORP WEICHERT FINANCIAL SERVICES WELLS FARGO BANK, NA
WESTSTAR MORTGAGE, INC WILLIAM PENN BANK WOODFOREST NATIONAL BANK
WOORI AMERICA BANK WSFS BANK WYNDHAM CAPITAL MORTGAGE
Report Date: 06/02/2014
LIST OF FINANCIAL INSTITUTIONS WHOSE DATA MAKE UP THE 2013 MSA/MD AGGREGATE REPORT
MSA/MD: 37964 - PHILADELPHIA, PA
Page 3 of 7
INSTITUTIONS WHO HAVE A HOME OR BRANCH OFFICE IN THE MSA/MD

1ST 2ND MORTGAGE CO. OF NJ INC 1ST ADVANTAGE MORTGAGE 1ST COLONIAL COMMUNITY BANK
1ST CONSTITUTION BANK 1ST MARINER BANK 1ST PREFERENCE MORTGAGE
1ST SUMMIT BANK ABCO FCU ACCESS NATIONAL BANK
ADMIRALS BANK ADP FCU ADVANCIAL FEDERAL CREDIT UNION
AFFILIATED BANK AFFINITY FEDERAL CREDIT UNION AGCHOICE FARM CREDIT, ACA
AIR FORCE FEDERAL CREDIT UNION ALERUS FINANCIAL, N.A. ALLEGACY FEDERAL CREDIT UNION
ALLEGENT CFCU ALLENTOWN FEDERAL CREDIT UNION ALLIANT CREDIT UNION
ALTOONA FIRST SAVINGS BANK ALTRA FEDERAL CREDIT UNION AMERICAN AIRLINES FCU
AMERICAN B & T C N.A. AMERICAN BANK AMERICAN BANK OF MISSOURI
AMERICAN FINANCIAL MORTGAGE CO AMERICAN FIRST C.U. AMERIHOME MORTGAGE CORPORATION
AMERISERV FINANCIAL BANK ANDREWS FEDERAL CREDIT UNION APCI FEDERAL CREDIT UNION
ARK-LA-TEX FINANCIAL SERVICES ARMED FORCES BANK, NA ARTISANS' BANK
ASHLAND CREDIT UNION ASTORIA FEDERAL SAVINGS & LOAN ATLANTIC FINANCIAL, INC.
ATLAS BANK AUDUBON SAVINGS BANK BALLSTON SPA NATIONAL BANK
BALLY SAVINGS BANK BANC OF CALIFORNIA, NA BANCO POPULAR NORTH AMERICA
BANK FUND STAFF FCU BANK OF BLUE VALLEY BANK OF CAMDEN
BANK OF ENGLAND BANK OF MANHATTAN BANK OF NEBRASKA
BANK OF NORTH CAROLINA BANK OF THE OZARKS Bank of Whittier, N.A.
BANKUNITED BARRINGTON BANK & TRUST CO.NA BAXTER CREDIT UNION
BAY BANK, FSB BCB COMMUNITY BANK BEECH STREET CAPITAL LLC
BELLCO FEDERAL CREDIT UNION BERKSHIRE BANK BETHPAGE FEDERAL CREDIT UNION
BM S FEDERAL CREDIT UNION BMO HARRIS BANK N.A. BNC NATIONAL BANK
BOEING EMPLOYEES CREDIT UNION BOFI FEDERAL BANK BOKF NA
BRANCH BANKING AND TRUST CO BROKER SOLUTIONS, INC. CAPE BANK
CAPITAL BANK OF NEW JERSEY CAPITAL BANK, NA CAPITAL ONE NA
CAPITOL FEDERAL SAVINGS BANK CAROLINA BANK CARROLL COMMUNITY BANK
CARVER FEDERAL SAVINGS BANK CBC NATIONAL BANK CELTIC BANK CORPORATION
CENTERLINE MORTGAGE CAPITAL IN CENTERLINE MORTGAGE PARTNERS I CENTIER BANK
CENTRA CREDIT UNION CERTUSBANK, N.A. CFG COMMUNITY BANK
CHARLES SCHWAB BANK CHARTWAY FEDERAL CREDIT UNION CHEMUNG CANAL TRUST COMPANY
CHEVRON FEDERAL CREDIT UNION CHICAGO MORTGAGE SOLUTIONS CHOICE ONE COMMUNITY FCU
CITY NATIONAL BANK CLEARVIEW FEDERAL CREDIT UNION CNB BANK
COLONIAL SAVINGS, F.A. COLORADO FEDERAL SAVINGS BANK COLUMBIA BANK
COMMERCE BANK COMMUNITY BANK COMMUNITY POWERED FCU
COMMUNITYONE BANK, N.A. COMPASS BANK CONGRESSIONAL BANK
CONGRESSIONAL FEDERAL CREDIT U CONSOLIDATED FEDERAL CU CORNERSTONE FEDERAL CREDIT UNI
CORNING FEDERAL CREDIT UNION CORPORATE AMERICA FAMILY CU CORRIDOR MORTGAGE GROUP, INC.
CORTLAND SAVINGS & BANKING CO CREDIT UNION OF NEW JERSEY CUC MORTGAGE CORPORATION
DE CAPITAL MORTGAGE, LLC Delaware State Police Federal DEPARTMENT OF COMMERCE FCU
DEPARTMENT OF THE INTERIOR FCU DEVON BANK DEXSTA FEDERAL CREDIT UNION
DIGITAL FEDERAL CREDIT UNION DISCOVERY FEDERAL CREDIT UNION DOLLAR BANK, FSB
DOVER FEDERAL CREDIT UNION DUBUQUE BANK & TRUST CO. DUPACO COMMUNITY CREDIT UNION
EAGLEBANK EASTMAN CREDIT UNION EMBASSY BANK FOR THE LEHIGH VA
EMERY FEDERAL CREDIT UNION ENT FEDERAL CREDIT UNION EQUITY NOW INC.
ERIE FEDERAL CREDIT UNION ESSA BANK & TRUST EVERBANK
EVOLVE BANK & TRUST FAIRFIELD COUNTY BANK FARMERS BANK AND TRUST
Report Date: 06/02/2014
LIST OF FINANCIAL INSTITUTIONS WHOSE DATA MAKE UP THE 2013 MSA/MD AGGREGATE REPORT
MSA/MD: 37964 - PHILADELPHIA, PA
Page 4 of 7
INSTITUTIONS WHO DO NOT HAVE A HOME OR BRANCH OFFICE IN THE MSA/MD
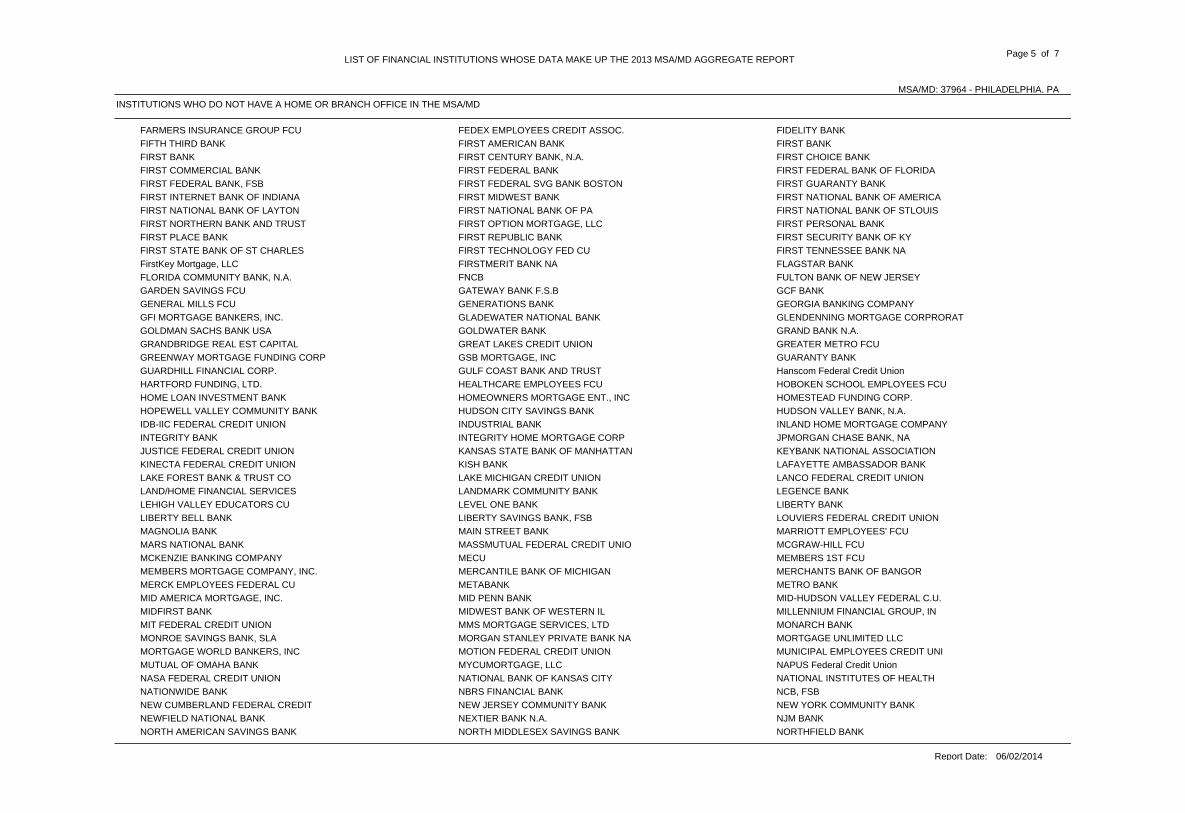
FARMERS INSURANCE GROUP FCU FEDEX EMPLOYEES CREDIT ASSOC. FIDELITY BANK
FIFTH THIRD BANK FIRST AMERICAN BANK FIRST BANK
FIRST BANK FIRST CENTURY BANK, N.A. FIRST CHOICE BANK
FIRST COMMERCIAL BANK FIRST FEDERAL BANK FIRST FEDERAL BANK OF FLORIDA
FIRST FEDERAL BANK, FSB FIRST FEDERAL SVG BANK BOSTON FIRST GUARANTY BANK
FIRST INTERNET BANK OF INDIANA FIRST MIDWEST BANK FIRST NATIONAL BANK OF AMERICA
FIRST NATIONAL BANK OF LAYTON FIRST NATIONAL BANK OF PA FIRST NATIONAL BANK OF STLOUIS
FIRST NORTHERN BANK AND TRUST FIRST OPTION MORTGAGE, LLC FIRST PERSONAL BANK
FIRST PLACE BANK FIRST REPUBLIC BANK FIRST SECURITY BANK OF KY
FIRST STATE BANK OF ST CHARLES FIRST TECHNOLOGY FED CU FIRST TENNESSEE BANK NA
FirstKey Mortgage, LLC FIRSTMERIT BANK NA FLAGSTAR BANK
FLORIDA COMMUNITY BANK, N.A. FNCB FULTON BANK OF NEW JERSEY
GARDEN SAVINGS FCU GATEWAY BANK F.S.B GCF BANK
GENERAL MILLS FCU GENERATIONS BANK GEORGIA BANKING COMPANY
GFI MORTGAGE BANKERS, INC. GLADEWATER NATIONAL BANK GLENDENNING MORTGAGE CORPRORAT
GOLDMAN SACHS BANK USA GOLDWATER BANK GRAND BANK N.A.
GRANDBRIDGE REAL EST CAPITAL GREAT LAKES CREDIT UNION GREATER METRO FCU
GREENWAY MORTGAGE FUNDING CORP GSB MORTGAGE, INC GUARANTY BANK
GUARDHILL FINANCIAL CORP. GULF COAST BANK AND TRUST Hanscom Federal Credit Union
HARTFORD FUNDING, LTD. HEALTHCARE EMPLOYEES FCU HOBOKEN SCHOOL EMPLOYEES FCU
HOME LOAN INVESTMENT BANK HOMEOWNERS MORTGAGE ENT., INC HOMESTEAD FUNDING CORP.
HOPEWELL VALLEY COMMUNITY BANK HUDSON CITY SAVINGS BANK HUDSON VALLEY BANK, N.A.
IDB-IIC FEDERAL CREDIT UNION INDUSTRIAL BANK INLAND HOME MORTGAGE COMPANY
INTEGRITY BANK INTEGRITY HOME MORTGAGE CORP JPMORGAN CHASE BANK, NA
JUSTICE FEDERAL CREDIT UNION KANSAS STATE BANK OF MANHATTAN KEYBANK NATIONAL ASSOCIATION
KINECTA FEDERAL CREDIT UNION KISH BANK LAFAYETTE AMBASSADOR BANK
LAKE FOREST BANK & TRUST CO LAKE MICHIGAN CREDIT UNION LANCO FEDERAL CREDIT UNION
LAND/HOME FINANCIAL SERVICES LANDMARK COMMUNITY BANK LEGENCE BANK
LEHIGH VALLEY EDUCATORS CU LEVEL ONE BANK LIBERTY BANK
LIBERTY BELL BANK LIBERTY SAVINGS BANK, FSB LOUVIERS FEDERAL CREDIT UNION
MAGNOLIA BANK MAIN STREET BANK MARRIOTT EMPLOYEES' FCU
MARS NATIONAL BANK MASSMUTUAL FEDERAL CREDIT UNIO MCGRAW-HILL FCU
MCKENZIE BANKING COMPANY MECU MEMBERS 1ST FCU
MEMBERS MORTGAGE COMPANY, INC. MERCANTILE BANK OF MICHIGAN MERCHANTS BANK OF BANGOR
MERCK EMPLOYEES FEDERAL CU METABANK METRO BANK
MID AMERICA MORTGAGE, INC. MID PENN BANK MID-HUDSON VALLEY FEDERAL C.U.
MIDFIRST BANK MIDWEST BANK OF WESTERN IL MILLENNIUM FINANCIAL GROUP, IN
MIT FEDERAL CREDIT UNION MMS MORTGAGE SERVICES, LTD MONARCH BANK
MONROE SAVINGS BANK, SLA MORGAN STANLEY PRIVATE BANK NA MORTGAGE UNLIMITED LLC
MORTGAGE WORLD BANKERS, INC MOTION FEDERAL CREDIT UNION MUNICIPAL EMPLOYEES CREDIT UNI
MUTUAL OF OMAHA BANK MYCUMORTGAGE, LLC NAPUS Federal Credit Union
NASA FEDERAL CREDIT UNION NATIONAL BANK OF KANSAS CITY NATIONAL INSTITUTES OF HEALTH
NATIONWIDE BANK NBRS FINANCIAL BANK NCB, FSB
NEW CUMBERLAND FEDERAL CREDIT NEW JERSEY COMMUNITY BANK NEW YORK COMMUNITY BANK
NEWFIELD NATIONAL BANK NEXTIER BANK N.A. NJM BANK
NORTH AMERICAN SAVINGS BANK NORTH MIDDLESEX SAVINGS BANK NORTHFIELD BANK
Report Date: 06/02/2014
LIST OF FINANCIAL INSTITUTIONS WHOSE DATA MAKE UP THE 2013 MSA/MD AGGREGATE REPORT
MSA/MD: 37964 - PHILADELPHIA, PA
Page 5 of 7
INSTITUTIONS WHO DO NOT HAVE A HOME OR BRANCH OFFICE IN THE MSA/MD

NORTHPOINTE BANK NORTHWEST FEDERAL CREDIT UNION NORTHWEST SAVINGS BANK
NORWAY SAVINGS BANK NOVARTIS FCU NTFN, INC.
OAKSTAR BANK OLD LINE BANK ONEWEST BANK, FSB
ORRSTOWN BANK PA CENTRAL FCU PA STATE EMPLOYEES C U
PARAMOUNT RESIDENTIAL MORTGAGE PARDA FEDERAL CREDIT UNION PATELCO CREDIT UNION
PATRIOT COMMUNITY BANK PEAPACK-GLADSTONE BANK PENTAGON FEDERAL CREDIT UNION
PEOPLE'S UNITED BANK PEOPLES BANK PEOPLESBANK A CODORUS VALLEY
PICATINNY FEDERAL CREDIT UNION PINNACLE FCU PLAINSCAPITAL BANK
POINT BREEZE CREDIT UNION Polish and Slavic Federal Cred PPL GOLD CREDIT UNION
PRINCETON FEDERAL CREDIT UNION PRINSBANK PROFICIO BANK
PROPONENT FEDERAL CREDIT UNION PROVIDENT BANK PULASKI BANK
PURDUE FEDERAL CREDIT UNION QUORUM FEDERAL CREDIT UNION RAYMOND JAMES BANK, NA
RBC BANK (GEORGIA), N.A. RBS CITIZENS, N.A. RED MORTGAGE CAPITAL, LLC
REGENT BANK RELIANCE SAVINGS BANK RIVERFRONT FEDERAL CREDIT UNIO
ROEBLING BK ROMA BANK ROMASIA BANK
S&T BANK SAGE BANK SAIL MORTGAGE CORP
SAN ANTONIO FEDERAL CREDIT UNI SCBT SCOTTRADE BANK
SERVICE 1ST FCU SEVERN SAVINGS BANK FSB SIGNATURE BANK
SIGNATURE BANK, N.A. SILICON VALLEY BANK SILVERGATE BANK
SOUTH CENTRAL BANK SOUTH JERSEY FCU SOUTHCREST BANK
SOUTHERN TRUST MORTGAGE LLC SOUTHWEST STAGE FUNDING LLC Spencer Savings Bank SLA
STANDARD BANK AND TRUST CO. STAR ONE CREDIT UNION STATE DEPARTMENT FCU
STATE EMP CREDIT UNION OF MD STATE FARM BANK STELLARONE BANK
STERLING NATIONAL BANK STIFEL BANK & TRUST SUFFOLK FEDERAL CREDIT UNION
SULLIVAN FINANCIAL SERVICES SUNFLOWER BANK, N.A. SUNTRUST BANK, INC
SUSSEX BANK SUTHERLAND MORTGAGE SERVICES TALMER BANK AND TRUST
TEACHERS FEDERAL CREDIT UNION TELCOE FEDERAL CREDIT UNION TERRACE MORTGAGE COMPANY
Texas Tech Federal Credit Unio THE ARLINGTON BANK THE COLUMBIA BANK
THE EPHRATA NATIONAL BANK THE FEDERAL SAVINGS BANK THE FIDELITY DEPOSIT & DISCOUN
THE FIRST NATIONAL BANK OF WYO THE HONESDALE NATIONAL BANK THE HUNTINGTON NATIONAL BANK
THE LYONS NATIONAL BANK THE MONEY SOURCE INC THE MUNCY BANK & TRUST COMPANY
THE NEFFS NATIONAL BANK THE NORTHERN TRUST CO. THE PRIVATEBANK AND TRUST CO.
THE PROVIDENT BANK THIRD FEDERAL SAVINGS AND LOAN THRIVENT FEDERAL CREDIT UNION
TIAA-CREF TRUST COMPANY, FSB TOBYHANNA FCU Top Flite Financial Inc
TOWER FEDERAL CREDIT UNION TOWN CENTER BANK TOWNEBANK
TOYOTA FINANCIAL SAVINGS BANK TRANSPORTATION FCU TREASURY DEPARTMENT FCU
TRICO FCU TRISTATE CAPITAL BANK U.S. POSTAL SERVICE FCU
UBS AG, TAMPA BRANCH UBS BANK, USA UKRAINIAN NATIONAL FCU
UMASSFIVE COLLEGE FCU UNION CENTER NATIONAL BANK UNION COMMUNITY BANK
UNION MORTGAGE GROUP UNITED BANK & TRUST UNITED BANK INC
UNITED NATIONS FEDERAL CU UNITY BANK US BANK, N.A.
USAA FEDERAL SAVINGS BANK USALLIANCE FCU - MTG OFFICE VALLEY NATIONAL BANK
VAN DYK MORTGAGE CORPORATION VICTORIAN FINANCE, LLC VIRGINIA COMMERCE BANK INC
VIRGINIA CREDIT UNION, INC VIRGINIA HERITAGE BANK VISIONS FEDERAL CREDIT UNION
WALKER & DUNLOP, LLC WASHINGTON TRUST BANK WAYNE BANK
WEBSTER BANK, N.A. WEI MORTGAGE CORPORATION WEST GATE BANK
Report Date: 06/02/2014
LIST OF FINANCIAL INSTITUTIONS WHOSE DATA MAKE UP THE 2013 MSA/MD AGGREGATE REPORT
MSA/MD: 37964 - PHILADELPHIA, PA
Page 6 of 7
INSTITUTIONS WHO DO NOT HAVE A HOME OR BRANCH OFFICE IN THE MSA/MD

WEST TOWN SAVINGS BANK WESTERN FEDERAL CREDIT UNION WESTFIELD BANK FSB
WINGS FINANCIAL CREDIT UNION WOLVERINE BANK FSB XCEED FINANCIAL FEDERAL CREDIT
Report Date: 06/02/2014
LIST OF FINANCIAL INSTITUTIONS WHOSE DATA MAKE UP THE 2013 MSA/MD AGGREGATE REPORT
MSA/MD: 37964 - PHILADELPHIA, PA
Page 7 of 7
INSTITUTIONS WHO DO NOT HAVE A HOME OR BRANCH OFFICE IN THE MSA/MD

PA/BUCKS COUNTY/1001.02 17 75
LOANS ORIGINATED 6 17 3 1 22 486 1232 3151 73 73728 385
APPS APPROVED, NOT ACCEPTED 3 432
APPS DENIED 2 9 2 12 474 540 1614 65 183
APPS WITHDRAWN 5 11 425 683 40
FILES CLOSED FOR INCOMPLETENESS 3 674
PA/BUCKS COUNTY/1001.03 21 72
LOANS ORIGINATED 10 29 4 67 1232 1450 3869 174 895
APPS APPROVED, NOT ACCEPTED 2 11 137 213 74
APPS DENIED 2 16 91 174 222 2487 243
APPS WITHDRAWN 41 159 713
FILES CLOSED FOR INCOMPLETENESS 3 310
PA/BUCKS COUNTY/1001.04 48 96
LOANS ORIGINATED 10 26 5 23 791 2332 4206 334 460
APPS APPROVED, NOT ACCEPTED 3 656
APPS DENIED 2 14 11 224 552 2594 15
APPS WITHDRAWN 1 262 377
FILES CLOSED FOR INCOMPLETENESS 7 1362
PA/BUCKS COUNTY/1001.05 9 99
LOANS ORIGINATED 11 67 11 412 2336 1827 11306 556 548
APPS APPROVED, NOT ACCEPTED 5 955
APPS DENIED 2 20 11 1 11 163 442 3991 735 253 75
APPS WITHDRAWN 4 12 22 356 797 1917 104
FILES CLOSED FOR INCOMPLETENESS 11 11940 119
PA/BUCKS COUNTY/1002.01 27 85
LOANS ORIGINATED 34 79 6 611 2019 5482 12962 260 796 10 628
APPS APPROVED, NOT ACCEPTED 6 8612 1455 4 328
APPS DENIED 10 38 53 528 1335 6003 345 7 379
APPS WITHDRAWN 3 19 11 383 420 3004 217
FILES CLOSED FOR INCOMPLETENESS 1 111 157 55 1956
06/02/2014Report Date:
AGGREGATE TABLE 1: DISPOSITION OF LOAN APPLICATIONS, BY LOCATION OF PROPERTY AND TYPE OF LOAN, 2013
MSA/MD: 37964 - PHILADELPHIA, PA
Page 1 of 199
ALL LOANS ON PROPERTY LOCATED IN MSA/MD 3/
CENSUS TRACT OR COUNTY NAME ANDDISPOSITION OF APPLICATION 1/(STATE/COUNTY/TRACT NUMBER) FHA, FSA/RHS & VA Conventional
Refinancings Home ImprovementLoans
Loans on DwellingsFor 5 or More
Families
NonoccupantLoans From
Columns A, B, Cand D
Number Number Number Number Number Number$000's $000's $000's $000's $000's $000's
A B C D E F
Home Purchase Loans
Loans on 1- to 4-Family and Manufactured Home Dwellings
Loans OnManufactured Home
Dwellings FromColumns A, B, C & D
G
Number $000's
%MinPop4/
MedianIncome As
PCT ofMSA/MDMedian
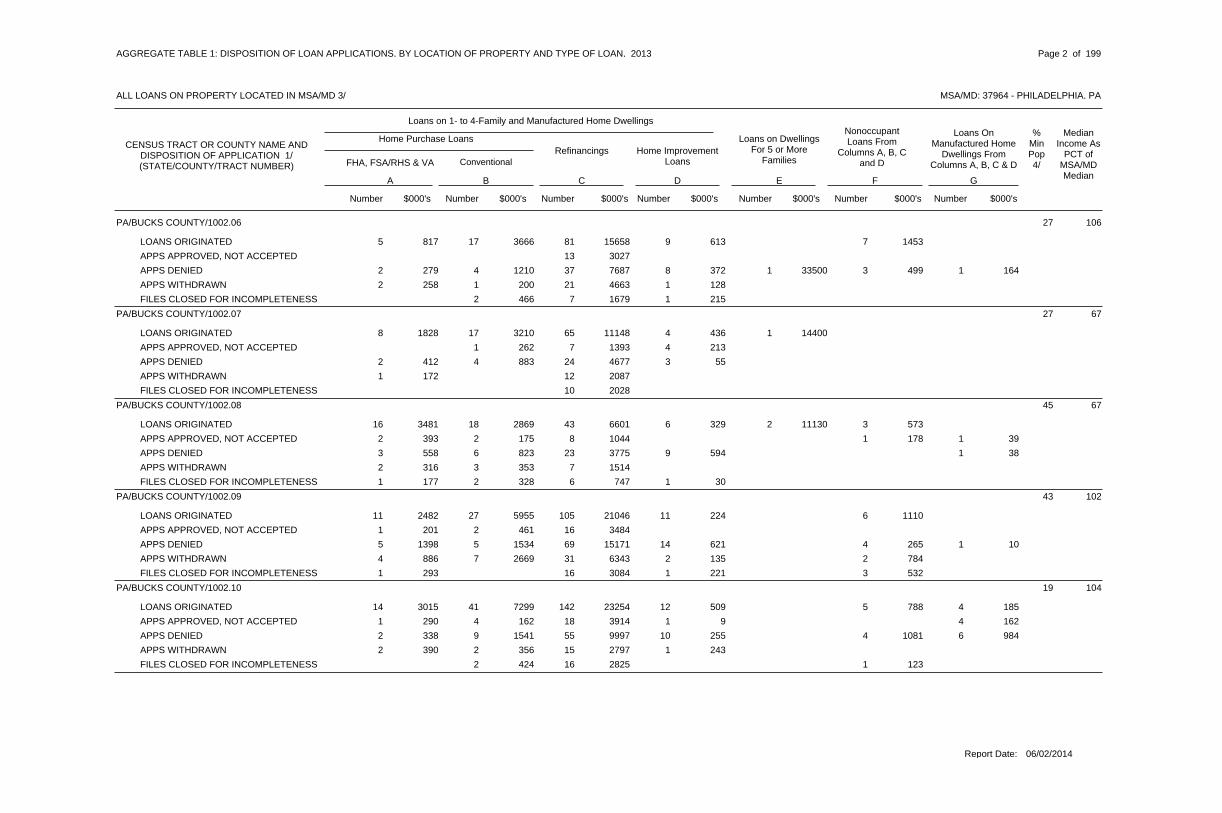
PA/BUCKS COUNTY/1002.06 27 106
LOANS ORIGINATED 17 81 9 75 817 3666 15658 613 1453
APPS APPROVED, NOT ACCEPTED 13 3027
APPS DENIED 4 37 8 1 32 279 1210 7687 372 33500 499 1 164
APPS WITHDRAWN 1 21 12 258 200 4663 128
FILES CLOSED FOR INCOMPLETENESS 2 7 1466 1679 215
PA/BUCKS COUNTY/1002.07 27 67
LOANS ORIGINATED 17 65 4 18 1828 3210 11148 436 14400
APPS APPROVED, NOT ACCEPTED 1 7 4262 1393 213
APPS DENIED 4 24 32 412 883 4677 55
APPS WITHDRAWN 121 172 2087
FILES CLOSED FOR INCOMPLETENESS 10 2028
PA/BUCKS COUNTY/1002.08 45 67
LOANS ORIGINATED 18 43 6 2 316 3481 2869 6601 329 11130 573
APPS APPROVED, NOT ACCEPTED 2 8 12 393 175 1044 178 1 39
APPS DENIED 6 23 93 558 823 3775 594 1 38
APPS WITHDRAWN 3 72 316 353 1514
FILES CLOSED FOR INCOMPLETENESS 2 6 11 177 328 747 30
PA/BUCKS COUNTY/1002.09 43 102
LOANS ORIGINATED 27 105 11 611 2482 5955 21046 224 1110
APPS APPROVED, NOT ACCEPTED 2 161 201 461 3484
APPS DENIED 5 69 14 45 1398 1534 15171 621 265 1 10
APPS WITHDRAWN 7 31 2 24 886 2669 6343 135 784
FILES CLOSED FOR INCOMPLETENESS 16 1 31 293 3084 221 532
PA/BUCKS COUNTY/1002.10 19 104
LOANS ORIGINATED 41 142 12 514 3015 7299 23254 509 788 4 185
APPS APPROVED, NOT ACCEPTED 4 18 11 290 162 3914 9 4 162
APPS DENIED 9 55 10 42 338 1541 9997 255 1081 6 984
APPS WITHDRAWN 2 15 12 390 356 2797 243
FILES CLOSED FOR INCOMPLETENESS 2 16 1424 2825 123
06/02/2014Report Date:
AGGREGATE TABLE 1: DISPOSITION OF LOAN APPLICATIONS, BY LOCATION OF PROPERTY AND TYPE OF LOAN, 2013
MSA/MD: 37964 - PHILADELPHIA, PA
Page 2 of 199
ALL LOANS ON PROPERTY LOCATED IN MSA/MD 3/
CENSUS TRACT OR COUNTY NAME ANDDISPOSITION OF APPLICATION 1/(STATE/COUNTY/TRACT NUMBER) FHA, FSA/RHS & VA Conventional
Refinancings Home ImprovementLoans
Loans on DwellingsFor 5 or More
Families
NonoccupantLoans From
Columns A, B, Cand D
Number Number Number Number Number Number$000's $000's $000's $000's $000's $000's
A B C D E F
Home Purchase Loans
Loans on 1- to 4-Family and Manufactured Home Dwellings
Loans OnManufactured Home
Dwellings FromColumns A, B, C & D
G
Number $000's
%MinPop4/
MedianIncome As
PCT ofMSA/MDMedian

PA/BUCKS COUNTY/1002.11 14 116
LOANS ORIGINATED 39 113 5 518 3803 7789 17764 191 883
APPS APPROVED, NOT ACCEPTED 4 12 1535 2055 145
APPS DENIED 1 40 14 13 585 160 6661 509 128 1 3
APPS WITHDRAWN 6 9 21137 1666 274
FILES CLOSED FOR INCOMPLETENESS 1 4 172 525 72
PA/BUCKS COUNTY/1002.12 13 121
LOANS ORIGINATED 19 86 13 115 3464 3517 15848 666 105 2 51
APPS APPROVED, NOT ACCEPTED 1 1570 2744
APPS DENIED 2 36 9 11 245 466 7128 252 10
APPS WITHDRAWN 4 21 12 546 704 3951 124
FILES CLOSED FOR INCOMPLETENESS 2 14 2434 2488 380
PA/BUCKS COUNTY/1003.02 11 93
LOANS ORIGINATED 19 84 5 1222 3458 2303 10660 77 1534
APPS APPROVED, NOT ACCEPTED 1 72 343 92 743
APPS DENIED 4 35 11 14 522 376 4610 500 75
APPS WITHDRAWN 2 10 1303 1137 103
FILES CLOSED FOR INCOMPLETENESS 1 13 3 1170 1728 34 158
PA/BUCKS COUNTY/1003.03 49 71
LOANS ORIGINATED 14 61 6 420 3084 1753 8090 324 530
APPS APPROVED, NOT ACCEPTED 4 24 629 619 51
APPS DENIED 2 35 9 26 905 320 4945 97 8 1 5
APPS WITHDRAWN 1 11 21 169 225 1462 111
FILES CLOSED FOR INCOMPLETENESS 2 383
PA/BUCKS COUNTY/1003.04 36 70
LOANS ORIGINATED 3 20 2 113 2223 434 3099 333 128
APPS APPROVED, NOT ACCEPTED 1 2 1113 121 20
APPS DENIED 3 12 2 12 309 501 1650 132 100
APPS WITHDRAWN 2 213
FILES CLOSED FOR INCOMPLETENESS 3 1577 140
06/02/2014Report Date:
AGGREGATE TABLE 1: DISPOSITION OF LOAN APPLICATIONS, BY LOCATION OF PROPERTY AND TYPE OF LOAN, 2013
MSA/MD: 37964 - PHILADELPHIA, PA
Page 3 of 199
ALL LOANS ON PROPERTY LOCATED IN MSA/MD 3/
CENSUS TRACT OR COUNTY NAME ANDDISPOSITION OF APPLICATION 1/(STATE/COUNTY/TRACT NUMBER) FHA, FSA/RHS & VA Conventional
Refinancings Home ImprovementLoans
Loans on DwellingsFor 5 or More
Families
NonoccupantLoans From
Columns A, B, Cand D
Number Number Number Number Number Number$000's $000's $000's $000's $000's $000's
A B C D E F
Home Purchase Loans
Loans on 1- to 4-Family and Manufactured Home Dwellings
Loans OnManufactured Home
Dwellings FromColumns A, B, C & D
G
Number $000's
%MinPop4/
MedianIncome As
PCT ofMSA/MDMedian

PA/BUCKS COUNTY/1003.06 39 73
LOANS ORIGINATED 9 40 4 410 1390 1298 6055 136 462
APPS APPROVED, NOT ACCEPTED 9 11789 40
APPS DENIED 1 20 6 35 691 175 3026 349 303
APPS WITHDRAWN 1 10 11 226 134 1516 37
FILES CLOSED FOR INCOMPLETENESS 1 10 1157 1685 70
PA/BUCKS COUNTY/1003.07 23 79
LOANS ORIGINATED 9 71 7 612 1836 1141 10323 213 1421
APPS APPROVED, NOT ACCEPTED 1 92 272 98 1301
APPS DENIED 2 43 9 13 345 257 5726 336 3
APPS WITHDRAWN 2 18 2 15 789 335 2841 11 177
FILES CLOSED FOR INCOMPLETENESS 2 10 1 11 120 339 1466 30 76
PA/BUCKS COUNTY/1004.01 21 79
LOANS ORIGINATED 32 109 8 2043 7494 4315 15276 328 2483
APPS APPROVED, NOT ACCEPTED 20 13089 225
APPS DENIED 2 46 26 48 1555 239 6209 1300 498
APPS WITHDRAWN 3 25 14 617 453 4114 135
FILES CLOSED FOR INCOMPLETENESS 2 19 2 11 224 311 3001 123 120
PA/BUCKS COUNTY/1004.02 16 87
LOANS ORIGINATED 18 91 15 1 939 6515 2493 12587 877 26000 1158
APPS APPROVED, NOT ACCEPTED 2 9 1 3161 1382 3 270
APPS DENIED 2 39 20 19 1404 382 5260 758 2 1 2
APPS WITHDRAWN 3 24 2 1 25 804 437 3671 155 25000 242
FILES CLOSED FOR INCOMPLETENESS 2 5302 630
PA/BUCKS COUNTY/1004.03 45 68
LOANS ORIGINATED 4 20 4 25 879 557 2566 89 245
APPS APPROVED, NOT ACCEPTED 1 1 1 1270 150 17 270
APPS DENIED 1 16 3 13 349 82 2748 163 3
APPS WITHDRAWN 1 7 11 172 100 818 3
FILES CLOSED FOR INCOMPLETENESS 31 98 539
06/02/2014Report Date:
AGGREGATE TABLE 1: DISPOSITION OF LOAN APPLICATIONS, BY LOCATION OF PROPERTY AND TYPE OF LOAN, 2013
MSA/MD: 37964 - PHILADELPHIA, PA
Page 4 of 199
ALL LOANS ON PROPERTY LOCATED IN MSA/MD 3/
CENSUS TRACT OR COUNTY NAME ANDDISPOSITION OF APPLICATION 1/(STATE/COUNTY/TRACT NUMBER) FHA, FSA/RHS & VA Conventional
Refinancings Home ImprovementLoans
Loans on DwellingsFor 5 or More
Families
NonoccupantLoans From
Columns A, B, Cand D
Number Number Number Number Number Number$000's $000's $000's $000's $000's $000's
A B C D E F
Home Purchase Loans
Loans on 1- to 4-Family and Manufactured Home Dwellings
Loans OnManufactured Home
Dwellings FromColumns A, B, C & D
G
Number $000's
%MinPop4/
MedianIncome As
PCT ofMSA/MDMedian

PA/BUCKS COUNTY/1004.04 16 92
LOANS ORIGINATED 20 108 11 2 1131 5171 2777 14332 292 12038 1500
APPS APPROVED, NOT ACCEPTED 2 18 1 13 411 305 2916 10 134
APPS DENIED 3 41 20 45 719 362 5908 447 644
APPS WITHDRAWN 2 23 27 1090 246 3294 156
FILES CLOSED FOR INCOMPLETENESS 9 23 432 1132 45
PA/BUCKS COUNTY/1004.06 16 118
LOANS ORIGINATED 16 69 1110 2576 3361 12311 924
APPS APPROVED, NOT ACCEPTED 10 11989 17
APPS DENIED 3 25 11 1594 5193 352 25
APPS WITHDRAWN 1 15 11 143 128 2510 225
FILES CLOSED FOR INCOMPLETENESS 1 10238 1533
PA/BUCKS COUNTY/1004.07 11 108
LOANS ORIGINATED 4 28 28 1309 465 3363 35
APPS APPROVED, NOT ACCEPTED 4 590
APPS DENIED 11 11248 3
APPS WITHDRAWN 3 11 109 396 170
FILES CLOSED FOR INCOMPLETENESS 3 486
PA/BUCKS COUNTY/1004.08 12 88
LOANS ORIGINATED 23 113 13 836 6108 3658 15370 732 1110
APPS APPROVED, NOT ACCEPTED 1 14 24 706 110 2313 622
APPS DENIED 4 49 17 58 1505 611 6842 336 474
APPS WITHDRAWN 1 28 26 1147 152 4036 102
FILES CLOSED FOR INCOMPLETENESS 123 608 1462
PA/BUCKS COUNTY/1005.00 9 90
LOANS ORIGINATED 22 36 8 67 1205 2875 4916 295 598 1 20
APPS APPROVED, NOT ACCEPTED 5 1837 63
APPS DENIED 2 26 3 3237 4644 72 365
APPS WITHDRAWN 1 15 1120 2559 210
FILES CLOSED FOR INCOMPLETENESS 9 1 11509 122 176
06/02/2014Report Date:
AGGREGATE TABLE 1: DISPOSITION OF LOAN APPLICATIONS, BY LOCATION OF PROPERTY AND TYPE OF LOAN, 2013
MSA/MD: 37964 - PHILADELPHIA, PA
Page 5 of 199
ALL LOANS ON PROPERTY LOCATED IN MSA/MD 3/
CENSUS TRACT OR COUNTY NAME ANDDISPOSITION OF APPLICATION 1/(STATE/COUNTY/TRACT NUMBER) FHA, FSA/RHS & VA Conventional
Refinancings Home ImprovementLoans
Loans on DwellingsFor 5 or More
Families
NonoccupantLoans From
Columns A, B, Cand D
Number Number Number Number Number Number$000's $000's $000's $000's $000's $000's
A B C D E F
Home Purchase Loans
Loans on 1- to 4-Family and Manufactured Home Dwellings
Loans OnManufactured Home
Dwellings FromColumns A, B, C & D
G
Number $000's
%MinPop4/
MedianIncome As
PCT ofMSA/MDMedian

PA/BUCKS COUNTY/1006.00 27 89
LOANS ORIGINATED 12 35 5 2 1410 1575 1724 4451 220 673 1333
APPS APPROVED, NOT ACCEPTED 7 1 1 21238 150 800 210
APPS DENIED 4 15 10 1 51 270 510 2055 500 2170 483
APPS WITHDRAWN 3 3 2 2565 413 45 4338
FILES CLOSED FOR INCOMPLETENESS 2 457
PA/BUCKS COUNTY/1007.00 39 69
LOANS ORIGINATED 14 31 5 149 1143 1268 4003 133 1661
APPS APPROVED, NOT ACCEPTED 1 11 128 278 278
APPS DENIED 2 24 6 22 225 158 2755 64 158
APPS WITHDRAWN 6 1 1677 110 90
FILES CLOSED FOR INCOMPLETENESS 6 3782 503
PA/BUCKS COUNTY/1008.03 11 113
LOANS ORIGINATED 21 86 18 523 5055 4302 15223 1238 812
APPS APPROVED, NOT ACCEPTED 1 61 179 200 927
APPS DENIED 2 22 12383 4524 420
APPS WITHDRAWN 3 11 1 11 211 652 1878 15 110
FILES CLOSED FOR INCOMPLETENESS 8 11591 10
PA/BUCKS COUNTY/1008.04 10 107
LOANS ORIGINATED 33 75 11 1 414 3640 8036 14613 738 5725 699
APPS APPROVED, NOT ACCEPTED 2 6 1417 1211 8
APPS DENIED 3 32 8749 7082 280
APPS WITHDRAWN 2 133 704 626 2587
FILES CLOSED FOR INCOMPLETENESS 1 101 219 233 2304
PA/BUCKS COUNTY/1008.05 7 113
LOANS ORIGINATED 27 127 12 1 827 5701 5098 20274 522 5600 1093
APPS APPROVED, NOT ACCEPTED 3 8 1 32 455 508 1324 5 463
APPS DENIED 5 36 15 43 591 1029 5906 528 510 1 10
APPS WITHDRAWN 1 24 32 307 234 4407 340
FILES CLOSED FOR INCOMPLETENESS 142 302 2134
06/02/2014Report Date:
AGGREGATE TABLE 1: DISPOSITION OF LOAN APPLICATIONS, BY LOCATION OF PROPERTY AND TYPE OF LOAN, 2013
MSA/MD: 37964 - PHILADELPHIA, PA
Page 6 of 199
ALL LOANS ON PROPERTY LOCATED IN MSA/MD 3/
CENSUS TRACT OR COUNTY NAME ANDDISPOSITION OF APPLICATION 1/(STATE/COUNTY/TRACT NUMBER) FHA, FSA/RHS & VA Conventional
Refinancings Home ImprovementLoans
Loans on DwellingsFor 5 or More
Families
NonoccupantLoans From
Columns A, B, Cand D
Number Number Number Number Number Number$000's $000's $000's $000's $000's $000's
A B C D E F
Home Purchase Loans
Loans on 1- to 4-Family and Manufactured Home Dwellings
Loans OnManufactured Home
Dwellings FromColumns A, B, C & D
G
Number $000's
%MinPop4/
MedianIncome As
PCT ofMSA/MDMedian

PA/BUCKS COUNTY/1008.07 12 121
LOANS ORIGINATED 32 85 73 813 8042 16077 492
APPS APPROVED, NOT ACCEPTED 2 13 1273 3038 173
APPS DENIED 1 23 2100 4404 22
APPS WITHDRAWN 4 13 2695 3492 199
FILES CLOSED FOR INCOMPLETENESS 6 11382 165
PA/BUCKS COUNTY/1008.08 8 145
LOANS ORIGINATED 26 108 11 413 4289 7308 23219 1628 757
APPS APPROVED, NOT ACCEPTED 2 11 11 407 467 3409 293
APPS DENIED 31 6 13 771 6888 143 150
APPS WITHDRAWN 5 141 250 1281 2786
FILES CLOSED FOR INCOMPLETENESS 3 131026 3008
PA/BUCKS COUNTY/1008.09 10 179
LOANS ORIGINATED 47 121 15 34 1672 15216 28583 1940 759
APPS APPROVED, NOT ACCEPTED 2 10646 2784
APPS DENIED 4 26 31269 7303 377
APPS WITHDRAWN 8 201 405 2459 4675
FILES CLOSED FOR INCOMPLETENESS 3 11 11070 2648 200
PA/BUCKS COUNTY/1008.11 35 94
LOANS ORIGINATED 8 54 8 79 2062 2507 10014 398 1181
APPS APPROVED, NOT ACCEPTED 41 241 416
APPS DENIED 3 20 3 22 381 468 3660 215 399 1 58
APPS WITHDRAWN 1 13 23 567 384 2881 288
FILES CLOSED FOR INCOMPLETENESS 2 3658 655
PA/BUCKS COUNTY/1009.00 8 132
LOANS ORIGINATED 64 172 22 721 5409 14823 32163 1556 1096
APPS APPROVED, NOT ACCEPTED 3 15 22 404 752 3053 53
APPS DENIED 4 56 13 2868 11550 785 225 2 501
APPS WITHDRAWN 7 27 2 34 1072 1657 5663 115 432
FILES CLOSED FOR INCOMPLETENESS 18 13931 237
06/02/2014Report Date:
AGGREGATE TABLE 1: DISPOSITION OF LOAN APPLICATIONS, BY LOCATION OF PROPERTY AND TYPE OF LOAN, 2013
MSA/MD: 37964 - PHILADELPHIA, PA
Page 7 of 199
ALL LOANS ON PROPERTY LOCATED IN MSA/MD 3/
CENSUS TRACT OR COUNTY NAME ANDDISPOSITION OF APPLICATION 1/(STATE/COUNTY/TRACT NUMBER) FHA, FSA/RHS & VA Conventional
Refinancings Home ImprovementLoans
Loans on DwellingsFor 5 or More
Families
NonoccupantLoans From
Columns A, B, Cand D
Number Number Number Number Number Number$000's $000's $000's $000's $000's $000's
A B C D E F
Home Purchase Loans
Loans on 1- to 4-Family and Manufactured Home Dwellings
Loans OnManufactured Home
Dwellings FromColumns A, B, C & D
G
Number $000's
%MinPop4/
MedianIncome As
PCT ofMSA/MDMedian

PA/BUCKS COUNTY/1011.00 18 95
LOANS ORIGINATED 9 33 4 33 635 1656 5975 116 447
APPS APPROVED, NOT ACCEPTED 61 184 748 1 65
APPS DENIED 1 11 4 1352 2153 92 130
APPS WITHDRAWN 1 1 1 21 344 263 106 60 166
FILES CLOSED FOR INCOMPLETENESS 1 12
PA/BUCKS COUNTY/1014.01 8 110
LOANS ORIGINATED 23 113 9 49 2194 4940 19895 458 847
APPS APPROVED, NOT ACCEPTED 1 9 1184 1781 25
APPS DENIED 4 29 52 402 795 6342 202 1 50
APPS WITHDRAWN 5 14 21066 2727 145
FILES CLOSED FOR INCOMPLETENESS 2 7 12 687 607 1504 40
PA/BUCKS COUNTY/1014.03 5 123
LOANS ORIGINATED 48 142 14 614 3480 8799 27235 914 851 13 650
APPS APPROVED, NOT ACCEPTED 7 12708 2220 9 712
APPS DENIED 11 44 5 34 1024 1309 8812 98 295 10 648
APPS WITHDRAWN 3 24 1 22 447 499 4676 100 265
FILES CLOSED FOR INCOMPLETENESS 1 71 216 192 1622
PA/BUCKS COUNTY/1014.04 8 112
LOANS ORIGINATED 7 49 5 15 1460 1469 9147 1047 210
APPS APPROVED, NOT ACCEPTED 10 12062 95
APPS DENIED 2 14 2316 2497 187
APPS WITHDRAWN 2 9 1298 1967 128
FILES CLOSED FOR INCOMPLETENESS 31 160 627
PA/BUCKS COUNTY/1014.05 10 104
LOANS ORIGINATED 33 125 10 612 2644 7432 20221 476 969
APPS APPROVED, NOT ACCEPTED 4 11 21 185 1304 1567 216 1 63
APPS DENIED 3 38 9 41 212 602 5632 150 406 1 23
APPS WITHDRAWN 3 29 2663 5259 400
FILES CLOSED FOR INCOMPLETENESS 2 12 2 1664 1763 65 171
06/02/2014Report Date:
AGGREGATE TABLE 1: DISPOSITION OF LOAN APPLICATIONS, BY LOCATION OF PROPERTY AND TYPE OF LOAN, 2013
MSA/MD: 37964 - PHILADELPHIA, PA
Page 8 of 199
ALL LOANS ON PROPERTY LOCATED IN MSA/MD 3/
CENSUS TRACT OR COUNTY NAME ANDDISPOSITION OF APPLICATION 1/(STATE/COUNTY/TRACT NUMBER) FHA, FSA/RHS & VA Conventional
Refinancings Home ImprovementLoans
Loans on DwellingsFor 5 or More
Families
NonoccupantLoans From
Columns A, B, Cand D
Number Number Number Number Number Number$000's $000's $000's $000's $000's $000's
A B C D E F
Home Purchase Loans
Loans on 1- to 4-Family and Manufactured Home Dwellings
Loans OnManufactured Home
Dwellings FromColumns A, B, C & D
G
Number $000's
%MinPop4/
MedianIncome As
PCT ofMSA/MDMedian

PA/BUCKS COUNTY/1015.03 7 108
LOANS ORIGINATED 30 74 4 88 1982 5873 13297 151 1030
APPS APPROVED, NOT ACCEPTED 2 5 1637 955 24
APPS DENIED 3 25 5 1584 5127 165 103
APPS WITHDRAWN 13 12809 178
FILES CLOSED FOR INCOMPLETENESS 2 11 1 1522 2407 238 85
PA/BUCKS COUNTY/1015.04 4 122
LOANS ORIGINATED 10 41 5 43 688 2261 8005 129 557
APPS APPROVED, NOT ACCEPTED 1 6 1417 1557 128
APPS DENIED 2 18 4 12 298 192 4012 128 94
APPS WITHDRAWN 1 5 11 177 192 1111 23
FILES CLOSED FOR INCOMPLETENESS 1 5 1417 1431 60
PA/BUCKS COUNTY/1015.05 5 131
LOANS ORIGINATED 23 69 7 13 791 5675 13353 437 227
APPS APPROVED, NOT ACCEPTED 7 11486 17
APPS DENIED 2 24 6 2527 6411 155 241
APPS WITHDRAWN 4 17 12 447 1105 3993 3
FILES CLOSED FOR INCOMPLETENESS 1 7 1 1370 1617 70 279
PA/BUCKS COUNTY/1015.06 5 118
LOANS ORIGINATED 40 115 9 513 3127 8381 19110 615 770
APPS APPROVED, NOT ACCEPTED 4 72 344 938 1272
APPS DENIED 2 45 72 380 323 7440 142
APPS WITHDRAWN 4 14 11181 2871 50
FILES CLOSED FOR INCOMPLETENESS 131 190 2089
PA/BUCKS COUNTY/1016.03 15 87
LOANS ORIGINATED 15 63 4 89 1987 2674 11091 216 1348
APPS APPROVED, NOT ACCEPTED 2 10 11 145 328 1646 115
APPS DENIED 5 36 3 21 249 796 5836 419 357
APPS WITHDRAWN 1 142 336 168 3115
FILES CLOSED FOR INCOMPLETENESS 3 9 1488 1465 220
06/02/2014Report Date:
AGGREGATE TABLE 1: DISPOSITION OF LOAN APPLICATIONS, BY LOCATION OF PROPERTY AND TYPE OF LOAN, 2013
MSA/MD: 37964 - PHILADELPHIA, PA
Page 9 of 199
ALL LOANS ON PROPERTY LOCATED IN MSA/MD 3/
CENSUS TRACT OR COUNTY NAME ANDDISPOSITION OF APPLICATION 1/(STATE/COUNTY/TRACT NUMBER) FHA, FSA/RHS & VA Conventional
Refinancings Home ImprovementLoans
Loans on DwellingsFor 5 or More
Families
NonoccupantLoans From
Columns A, B, Cand D
Number Number Number Number Number Number$000's $000's $000's $000's $000's $000's
A B C D E F
Home Purchase Loans
Loans on 1- to 4-Family and Manufactured Home Dwellings
Loans OnManufactured Home
Dwellings FromColumns A, B, C & D
G
Number $000's
%MinPop4/
MedianIncome As
PCT ofMSA/MDMedian

PA/BUCKS COUNTY/1016.05 52 55
LOANS ORIGINATED 4 19 1 14 1018 777 3740 16 500
APPS APPROVED, NOT ACCEPTED 1 1 1143 222 143
APPS DENIED 5 1892 10
APPS WITHDRAWN 1 6235 1027
FILES CLOSED FOR INCOMPLETENESS 3 1617 107
PA/BUCKS COUNTY/1016.07 9 110
LOANS ORIGINATED 22 63 11 411 2911 4614 11278 735 612
APPS APPROVED, NOT ACCEPTED 3 4680 821
APPS DENIED 4 16 1 21 207 487 2542 25 377
APPS WITHDRAWN 2 10 2 2265 1878 233 265
FILES CLOSED FOR INCOMPLETENESS 1 7 1151 1092 151
PA/BUCKS COUNTY/1016.09 7 102
LOANS ORIGINATED 48 98 9 1011 2569 10031 16919 762 959
APPS APPROVED, NOT ACCEPTED 3 12 1 1872 2095 90 117
APPS DENIED 3 33 5 61 127 693 5433 456 589
APPS WITHDRAWN 9 21 42195 3531 545
FILES CLOSED FOR INCOMPLETENESS 1 16 479 2582 567
PA/BUCKS COUNTY/1016.10 7 122
LOANS ORIGINATED 28 104 11 511 3105 5387 18587 585 429
APPS APPROVED, NOT ACCEPTED 1 11 1221 2555 10
APPS DENIED 4 30 5 21 46 406 6203 167 105
APPS WITHDRAWN 4 21910 4546
FILES CLOSED FOR INCOMPLETENESS 15 2781
PA/BUCKS COUNTY/1016.11 6 106
LOANS ORIGINATED 47 153 17 79 2420 11207 26403 1350 1329
APPS APPROVED, NOT ACCEPTED 142 547 2523
APPS DENIED 3 43 8 52 670 922 8287 438 1348
APPS WITHDRAWN 2 19 2 12 645 501 3692 85 222
FILES CLOSED FOR INCOMPLETENESS 1 12 11 258 156 1972 18
06/02/2014Report Date:
AGGREGATE TABLE 1: DISPOSITION OF LOAN APPLICATIONS, BY LOCATION OF PROPERTY AND TYPE OF LOAN, 2013
MSA/MD: 37964 - PHILADELPHIA, PA
Page 10 of 199
ALL LOANS ON PROPERTY LOCATED IN MSA/MD 3/
CENSUS TRACT OR COUNTY NAME ANDDISPOSITION OF APPLICATION 1/(STATE/COUNTY/TRACT NUMBER) FHA, FSA/RHS & VA Conventional
Refinancings Home ImprovementLoans
Loans on DwellingsFor 5 or More
Families
NonoccupantLoans From
Columns A, B, Cand D
Number Number Number Number Number Number$000's $000's $000's $000's $000's $000's
A B C D E F
Home Purchase Loans
Loans on 1- to 4-Family and Manufactured Home Dwellings
Loans OnManufactured Home
Dwellings FromColumns A, B, C & D
G
Number $000's
%MinPop4/
MedianIncome As
PCT ofMSA/MDMedian

PA/BUCKS COUNTY/1018.02 13 168
LOANS ORIGINATED 47 188 14 13 1147 16211 49711 2147 154
APPS APPROVED, NOT ACCEPTED 7 162445 4339
APPS DENIED 4 40 21465 10318 410
APPS WITHDRAWN 5 22 1 31369 6178 20 490
FILES CLOSED FOR INCOMPLETENESS 12 12747 150
PA/BUCKS COUNTY/1018.03 11 133
LOANS ORIGINATED 124 252 17 128 1871 37127 53403 1077 2041 2 114
APPS APPROVED, NOT ACCEPTED 17 22 17172 4951 297
APPS DENIED 24 59 4 41 295 7231 13751 609 782
APPS WITHDRAWN 14 41 1 22 695 4285 10343 40 411
FILES CLOSED FOR INCOMPLETENESS 5 27 21380 6858 375
PA/BUCKS COUNTY/1018.05 7 163
LOANS ORIGINATED 18 63 6 41 412 4690 13610 804 690
APPS APPROVED, NOT ACCEPTED 1 8172 2373
APPS DENIED 2 11 1 1682 2142 3 3
APPS WITHDRAWN 1 7 1286 1581 100
FILES CLOSED FOR INCOMPLETENESS 4 11157 20
PA/BUCKS COUNTY/1018.07 21 103
LOANS ORIGINATED 20 68 6 111 299 4615 12592 424 1406
APPS APPROVED, NOT ACCEPTED 4 2 1660 260 140
APPS DENIED 4 23 6 11 180 1605 4286 313 153
APPS WITHDRAWN 2 16 1771 4320 213
FILES CLOSED FOR INCOMPLETENESS 1 3811 624
PA/BUCKS COUNTY/1018.08 18 87
LOANS ORIGINATED 16 45 1 33 731 3911 6894 10 414
APPS APPROVED, NOT ACCEPTED 3 531
APPS DENIED 12 2 12530 180 45
APPS WITHDRAWN 2 5 1321 808 125
FILES CLOSED FOR INCOMPLETENESS 3 733
06/02/2014Report Date:
AGGREGATE TABLE 1: DISPOSITION OF LOAN APPLICATIONS, BY LOCATION OF PROPERTY AND TYPE OF LOAN, 2013
MSA/MD: 37964 - PHILADELPHIA, PA
Page 11 of 199
ALL LOANS ON PROPERTY LOCATED IN MSA/MD 3/
CENSUS TRACT OR COUNTY NAME ANDDISPOSITION OF APPLICATION 1/(STATE/COUNTY/TRACT NUMBER) FHA, FSA/RHS & VA Conventional
Refinancings Home ImprovementLoans
Loans on DwellingsFor 5 or More
Families
NonoccupantLoans From
Columns A, B, Cand D
Number Number Number Number Number Number$000's $000's $000's $000's $000's $000's
A B C D E F
Home Purchase Loans
Loans on 1- to 4-Family and Manufactured Home Dwellings
Loans OnManufactured Home
Dwellings FromColumns A, B, C & D
G
Number $000's
%MinPop4/
MedianIncome As
PCT ofMSA/MDMedian

PA/BUCKS COUNTY/1019.00 7 135
LOANS ORIGINATED 46 98 11 813 3920 12529 19550 656 1534
APPS APPROVED, NOT ACCEPTED 5 9 11 377 2052 1969 190
APPS DENIED 8 31 3 31 295 1931 6467 193 312
APPS WITHDRAWN 5 13 11180 2367 15
FILES CLOSED FOR INCOMPLETENESS 3 12 1 1887 1855 25 38
PA/BUCKS COUNTY/1020.02 6 135
LOANS ORIGINATED 19 62 6 24 1267 6225 14654 1239 494
APPS APPROVED, NOT ACCEPTED 1 3863 792
APPS DENIED 2 23 4 1 2523 5725 662 450 307
APPS WITHDRAWN 1 91 168 484 2534
FILES CLOSED FOR INCOMPLETENESS 1 10280 2285
PA/BUCKS COUNTY/1020.03 9 154
LOANS ORIGINATED 37 116 9 513 3628 10557 27507 988 938
APPS APPROVED, NOT ACCEPTED 2 14595 3175
APPS DENIED 2 35 4 1 21 226 505 8425 701 840 371
APPS WITHDRAWN 7 16 21 227 1810 4168 442
FILES CLOSED FOR INCOMPLETENESS 2 10 1 1485 2582 127 200
PA/BUCKS COUNTY/1020.04 8 140
LOANS ORIGINATED 43 107 10 1 813 3180 9996 19754 814 1500 1322
APPS APPROVED, NOT ACCEPTED 3 101 177 911 2338
APPS DENIED 5 19 3 42 390 869 3856 75 511
APPS WITHDRAWN 3 22 1853 5102 188
FILES CLOSED FOR INCOMPLETENESS 4 8 1520 1613 47
PA/BUCKS COUNTY/1021.02 4 133
LOANS ORIGINATED 14 63 7 1 37 1873 3380 14170 486 520 707
APPS APPROVED, NOT ACCEPTED 3 81010 1445
APPS DENIED 2 14 4 11 233 1050 3273 345 539
APPS WITHDRAWN 4 6 1 11138 2051 345 173
FILES CLOSED FOR INCOMPLETENESS 3 1355
06/02/2014Report Date:
AGGREGATE TABLE 1: DISPOSITION OF LOAN APPLICATIONS, BY LOCATION OF PROPERTY AND TYPE OF LOAN, 2013
MSA/MD: 37964 - PHILADELPHIA, PA
Page 12 of 199
ALL LOANS ON PROPERTY LOCATED IN MSA/MD 3/
CENSUS TRACT OR COUNTY NAME ANDDISPOSITION OF APPLICATION 1/(STATE/COUNTY/TRACT NUMBER) FHA, FSA/RHS & VA Conventional
Refinancings Home ImprovementLoans
Loans on DwellingsFor 5 or More
Families
NonoccupantLoans From
Columns A, B, Cand D
Number Number Number Number Number Number$000's $000's $000's $000's $000's $000's
A B C D E F
Home Purchase Loans
Loans on 1- to 4-Family and Manufactured Home Dwellings
Loans OnManufactured Home
Dwellings FromColumns A, B, C & D
G
Number $000's
%MinPop4/
MedianIncome As
PCT ofMSA/MDMedian

PA/BUCKS COUNTY/1021.04 12 104
LOANS ORIGINATED 48 129 13 1012 2888 13279 32615 905 1486
APPS APPROVED, NOT ACCEPTED 1 11255 3455
APPS DENIED 6 28 13 62 375 1332 6385 619 1153 2 242
APPS WITHDRAWN 2 27 1 33 783 567 5914 210 661
FILES CLOSED FOR INCOMPLETENESS 3 91 424 713 1798
PA/BUCKS COUNTY/1023.00 4 121
LOANS ORIGINATED 41 144 13 824 6256 11312 27563 1224 2026
APPS APPROVED, NOT ACCEPTED 2 7 12 616 349 1933 148
APPS DENIED 3 32 5 21 243 1338 8419 171 889
APPS WITHDRAWN 5 19 12 492 846 4123 65
FILES CLOSED FOR INCOMPLETENESS 1 82 442 750 2026
PA/BUCKS COUNTY/1024.01 6 107
LOANS ORIGINATED 28 86 4 1 136 1216 4664 14169 182 203 2027
APPS APPROVED, NOT ACCEPTED 5 1290
APPS DENIED 4 26 3 72 568 699 4879 302 1305
APPS WITHDRAWN 2 17 11 326 340 2691 203
FILES CLOSED FOR INCOMPLETENESS 7 908
PA/BUCKS COUNTY/1024.02 7 123
LOANS ORIGINATED 25 111 15 1118 3686 4809 17159 748 1433
APPS APPROVED, NOT ACCEPTED 5 9 2 21054 1768 39 459
APPS DENIED 4 25 7 31 255 501 4780 56 347
APPS WITHDRAWN 2 11 1 3300 1974 3 548
FILES CLOSED FOR INCOMPLETENESS 2 10 2 1246 1680 46 115 1 150
PA/BUCKS COUNTY/1025.00 8 82
LOANS ORIGINATED 26 91 12 926 4999 4731 13913 325 1298
APPS APPROVED, NOT ACCEPTED 1 41 137 106 682
APPS DENIED 3 33 5 52 383 526 5299 227 530
APPS WITHDRAWN 1 18 1 33 804 164 3422 2 458
FILES CLOSED FOR INCOMPLETENESS 1 8 1 2252 1343 80 221
06/02/2014Report Date:
AGGREGATE TABLE 1: DISPOSITION OF LOAN APPLICATIONS, BY LOCATION OF PROPERTY AND TYPE OF LOAN, 2013
MSA/MD: 37964 - PHILADELPHIA, PA
Page 13 of 199
ALL LOANS ON PROPERTY LOCATED IN MSA/MD 3/
CENSUS TRACT OR COUNTY NAME ANDDISPOSITION OF APPLICATION 1/(STATE/COUNTY/TRACT NUMBER) FHA, FSA/RHS & VA Conventional
Refinancings Home ImprovementLoans
Loans on DwellingsFor 5 or More
Families
NonoccupantLoans From
Columns A, B, Cand D
Number Number Number Number Number Number$000's $000's $000's $000's $000's $000's
A B C D E F
Home Purchase Loans
Loans on 1- to 4-Family and Manufactured Home Dwellings
Loans OnManufactured Home
Dwellings FromColumns A, B, C & D
G
Number $000's
%MinPop4/
MedianIncome As
PCT ofMSA/MDMedian

PA/BUCKS COUNTY/1026.00 14 87
LOANS ORIGINATED 16 48 3 59 1843 2996 7159 153 669
APPS APPROVED, NOT ACCEPTED 8 11 211 1077 98
APPS DENIED 2 14 4 31 202 512 2675 230 490
APPS WITHDRAWN 2 4372 538
FILES CLOSED FOR INCOMPLETENESS 2 2395 70
PA/BUCKS COUNTY/1027.00 5 97
LOANS ORIGINATED 31 105 19 56 1324 6869 21664 1298 640
APPS APPROVED, NOT ACCEPTED 4 8732 1712 1 32
APPS DENIED 9 46 8 31 179 2088 12065 365 328 2 387
APPS WITHDRAWN 6 15 21059 3524 475
FILES CLOSED FOR INCOMPLETENESS 1 11280 2503
PA/BUCKS COUNTY/1028.01 5 126
LOANS ORIGINATED 19 97 4 69 2235 4189 18017 380 1115
APPS APPROVED, NOT ACCEPTED 3 10 1468 2665 180
APPS DENIED 4 22 3 11 227 974 5675 150 324
APPS WITHDRAWN 6 13 1 21258 2646 258 210
FILES CLOSED FOR INCOMPLETENESS 8 1944
PA/BUCKS COUNTY/1031.01 10 92
LOANS ORIGINATED 9 42 4 712 1965 1446 5818 221 947
APPS APPROVED, NOT ACCEPTED 1 2 1165 289 165
APPS DENIED 10 7 25 866 1314 63 204
APPS WITHDRAWN 2 10 14 745 321 1576 126
FILES CLOSED FOR INCOMPLETENESS 7 11040 118
PA/BUCKS COUNTY/1031.02 11 72
LOANS ORIGINATED 12 35 5 93 492 1822 5691 254 1633
APPS APPROVED, NOT ACCEPTED 1 175
APPS DENIED 1 9 4 22 317 63 1791 48 315 1 63
APPS WITHDRAWN 4 1 2678 25 163
FILES CLOSED FOR INCOMPLETENESS 71 133 1401
06/02/2014Report Date:
AGGREGATE TABLE 1: DISPOSITION OF LOAN APPLICATIONS, BY LOCATION OF PROPERTY AND TYPE OF LOAN, 2013
MSA/MD: 37964 - PHILADELPHIA, PA
Page 14 of 199
ALL LOANS ON PROPERTY LOCATED IN MSA/MD 3/
CENSUS TRACT OR COUNTY NAME ANDDISPOSITION OF APPLICATION 1/(STATE/COUNTY/TRACT NUMBER) FHA, FSA/RHS & VA Conventional
Refinancings Home ImprovementLoans
Loans on DwellingsFor 5 or More
Families
NonoccupantLoans From
Columns A, B, Cand D
Number Number Number Number Number Number$000's $000's $000's $000's $000's $000's
A B C D E F
Home Purchase Loans
Loans on 1- to 4-Family and Manufactured Home Dwellings
Loans OnManufactured Home
Dwellings FromColumns A, B, C & D
G
Number $000's
%MinPop4/
MedianIncome As
PCT ofMSA/MDMedian

PA/BUCKS COUNTY/1031.03 13 91
LOANS ORIGINATED 17 81 8 825 4412 2668 11698 1422 1142
APPS APPROVED, NOT ACCEPTED 1 8 11 218 50 1114 130 2 68
APPS DENIED 1 33 9 1 64 615 54 5420 140 630 554
APPS WITHDRAWN 1 9 15 848 71 1091 115
FILES CLOSED FOR INCOMPLETENESS 2 3 1418 507 100
PA/BUCKS COUNTY/1033.00 4 116
LOANS ORIGINATED 20 47 4 52 411 4657 8093 523 1000
APPS APPROVED, NOT ACCEPTED 41 207 1419
APPS DENIED 5 19 7 11 413 1036 5427 1009 116
APPS WITHDRAWN 7 111931 2108
FILES CLOSED FOR INCOMPLETENESS 5 1591
PA/BUCKS COUNTY/1034.00 4 110
LOANS ORIGINATED 32 105 20 88 2327 9211 23046 2528 1375 1 271
APPS APPROVED, NOT ACCEPTED 3 101105 1998
APPS DENIED 5 37 2 11490 10933 80 257 1 50
APPS WITHDRAWN 5 18 23 730 1479 5110 447
FILES CLOSED FOR INCOMPLETENESS 3 10 1550 2645 180
PA/BUCKS COUNTY/1037.00 4 117
LOANS ORIGINATED 23 74 8 34 1601 7281 16627 307 725
APPS APPROVED, NOT ACCEPTED 1 101 158 69 2444 1 69
APPS DENIED 30 1 11 160 5455 80 125
APPS WITHDRAWN 4 9 12 532 748 2117 226
FILES CLOSED FOR INCOMPLETENESS 1 41 255 190 926
PA/BUCKS COUNTY/1038.00 4 93
LOANS ORIGINATED 12 27 4 62 440 2881 4993 657 2075
APPS APPROVED, NOT ACCEPTED 1 2 1 1138 491 39 306
APPS DENIED 10 2 12936 65 273
APPS WITHDRAWN 51 250 690
FILES CLOSED FOR INCOMPLETENESS 4 673
06/02/2014Report Date:
AGGREGATE TABLE 1: DISPOSITION OF LOAN APPLICATIONS, BY LOCATION OF PROPERTY AND TYPE OF LOAN, 2013
MSA/MD: 37964 - PHILADELPHIA, PA
Page 15 of 199
ALL LOANS ON PROPERTY LOCATED IN MSA/MD 3/
CENSUS TRACT OR COUNTY NAME ANDDISPOSITION OF APPLICATION 1/(STATE/COUNTY/TRACT NUMBER) FHA, FSA/RHS & VA Conventional
Refinancings Home ImprovementLoans
Loans on DwellingsFor 5 or More
Families
NonoccupantLoans From
Columns A, B, Cand D
Number Number Number Number Number Number$000's $000's $000's $000's $000's $000's
A B C D E F
Home Purchase Loans
Loans on 1- to 4-Family and Manufactured Home Dwellings
Loans OnManufactured Home
Dwellings FromColumns A, B, C & D
G
Number $000's
%MinPop4/
MedianIncome As
PCT ofMSA/MDMedian

PA/BUCKS COUNTY/1039.00 5 122
LOANS ORIGINATED 22 88 10 114 1106 8108 24756 2111 4367
APPS APPROVED, NOT ACCEPTED 2 5 11 187 765 1312 580
APPS DENIED 2 26 7 51045 9440 1082 1303
APPS WITHDRAWN 4 19 22787 7794 268
FILES CLOSED FOR INCOMPLETENESS 11 1 24387 352 385
PA/BUCKS COUNTY/1040.00 6 134
LOANS ORIGINATED 73 210 17 1323 7804 21897 53143 1754 2709 2 175
APPS APPROVED, NOT ACCEPTED 6 16 43 1096 2002 4768 1510
APPS DENIED 5 49 91 379 1191 13247 814
APPS WITHDRAWN 12 34 4 42 619 4238 10055 275 1277
FILES CLOSED FOR INCOMPLETENESS 1 11 3 12 611 290 2716 335 254
PA/BUCKS COUNTY/1041.00 13 97
LOANS ORIGINATED 8 38 4 1 43 459 1686 6759 641 4000 771
APPS APPROVED, NOT ACCEPTED 91 173 2469
APPS DENIED 13 1 12689 197 197
APPS WITHDRAWN 2 6 4 1372 1263 210 1900
FILES CLOSED FOR INCOMPLETENESS 2 2272 584
PA/BUCKS COUNTY/1042.01 5 136
LOANS ORIGINATED 26 90 13 62 844 9733 26275 2354 2007
APPS APPROVED, NOT ACCEPTED 4 11 1 21483 3045 255 425
APPS DENIED 5 20 2 12234 6766 40 415
APPS WITHDRAWN 1 7 2 1640 1962 607 348
FILES CLOSED FOR INCOMPLETENESS 2 3646 1618
PA/BUCKS COUNTY/1042.03 9 166
LOANS ORIGINATED 59 133 16 97 2142 22939 37519 1570 1876 3 147
APPS APPROVED, NOT ACCEPTED 7 10 1 12478 2496 15 86 2 85
APPS DENIED 9 28 3 13496 7844 30 319 3 42
APPS WITHDRAWN 8 20 11 286 2502 6884 413
FILES CLOSED FOR INCOMPLETENESS 2 15 1 21 370 792 4841 25 351
06/02/2014Report Date:
AGGREGATE TABLE 1: DISPOSITION OF LOAN APPLICATIONS, BY LOCATION OF PROPERTY AND TYPE OF LOAN, 2013
MSA/MD: 37964 - PHILADELPHIA, PA
Page 16 of 199
ALL LOANS ON PROPERTY LOCATED IN MSA/MD 3/
CENSUS TRACT OR COUNTY NAME ANDDISPOSITION OF APPLICATION 1/(STATE/COUNTY/TRACT NUMBER) FHA, FSA/RHS & VA Conventional
Refinancings Home ImprovementLoans
Loans on DwellingsFor 5 or More
Families
NonoccupantLoans From
Columns A, B, Cand D
Number Number Number Number Number Number$000's $000's $000's $000's $000's $000's
A B C D E F
Home Purchase Loans
Loans on 1- to 4-Family and Manufactured Home Dwellings
Loans OnManufactured Home
Dwellings FromColumns A, B, C & D
G
Number $000's
%MinPop4/
MedianIncome As
PCT ofMSA/MDMedian

PA/BUCKS COUNTY/1042.04 10 145
LOANS ORIGINATED 94 120 11 1728 7985 25877 23419 782 3024
APPS APPROVED, NOT ACCEPTED 4 101 241 1851 1955
APPS DENIED 8 37 3 32 662 2520 7099 430 634
APPS WITHDRAWN 12 17 1 32 460 3789 3550 150 456
FILES CLOSED FOR INCOMPLETENESS 3 7 1 1712 1109 50 168
PA/BUCKS COUNTY/1043.01 6 184
LOANS ORIGINATED 44 85 3 61 424 20840 33034 617 3101
APPS APPROVED, NOT ACCEPTED 1 5 2692 1693 541
APPS DENIED 7 21 3 33587 9393 435 2102
APPS WITHDRAWN 3 9 1 11746 3376 925 102
FILES CLOSED FOR INCOMPLETENESS 5 12314 44
PA/BUCKS COUNTY/1043.03 9 179
LOANS ORIGINATED 63 154 13 175 2060 23129 47459 2306 5167
APPS APPROVED, NOT ACCEPTED 2 15 1 2805 4201 90 650
APPS DENIED 8 36 4 51 269 3187 13338 790 2991
APPS WITHDRAWN 10 23 32 576 3631 10928 3036
FILES CLOSED FOR INCOMPLETENESS 2 11 2477 4803 263
PA/BUCKS COUNTY/1043.04 6 276
LOANS ORIGINATED 11 29 6 38605 15060 1490 1090
APPS APPROVED, NOT ACCEPTED 3 3 22195 1816 1890
APPS DENIED 2 12 1 2885 7028 190 797
APPS WITHDRAWN 4 5971 1922
FILES CLOSED FOR INCOMPLETENESS 4 13388 840
PA/BUCKS COUNTY/1044.00 11 156
LOANS ORIGINATED 54 70 6 1 192 476 18515 22666 988 985 5185
APPS APPROVED, NOT ACCEPTED 2 3 3725 926 975
APPS DENIED 9 12 1 53319 4608 40 1542
APPS WITHDRAWN 7 16 52657 5910 1892
FILES CLOSED FOR INCOMPLETENESS 2 1834 150
06/02/2014Report Date:
AGGREGATE TABLE 1: DISPOSITION OF LOAN APPLICATIONS, BY LOCATION OF PROPERTY AND TYPE OF LOAN, 2013
MSA/MD: 37964 - PHILADELPHIA, PA
Page 17 of 199
ALL LOANS ON PROPERTY LOCATED IN MSA/MD 3/
CENSUS TRACT OR COUNTY NAME ANDDISPOSITION OF APPLICATION 1/(STATE/COUNTY/TRACT NUMBER) FHA, FSA/RHS & VA Conventional
Refinancings Home ImprovementLoans
Loans on DwellingsFor 5 or More
Families
NonoccupantLoans From
Columns A, B, Cand D
Number Number Number Number Number Number$000's $000's $000's $000's $000's $000's
A B C D E F
Home Purchase Loans
Loans on 1- to 4-Family and Manufactured Home Dwellings
Loans OnManufactured Home
Dwellings FromColumns A, B, C & D
G
Number $000's
%MinPop4/
MedianIncome As
PCT ofMSA/MDMedian

PA/BUCKS COUNTY/1045.02 10 111
LOANS ORIGINATED 110 211 19 1712 3804 36334 66427 1448 4262 1 70
APPS APPROVED, NOT ACCEPTED 13 16 2 12 589 2654 5085 45 140 4 276
APPS DENIED 12 49 6 35403 16943 627 1217
APPS WITHDRAWN 14 24 1 43 854 6058 7566 20 705
FILES CLOSED FOR INCOMPLETENESS 2 14 1852 5115 60
PA/BUCKS COUNTY/1045.03 7 163
LOANS ORIGINATED 50 120 12 22 597 18582 34548 976 492
APPS APPROVED, NOT ACCEPTED 3 8900 2083
APPS DENIED 4 24 41313 9347 110
APPS WITHDRAWN 5 16 11 332 1687 5473 405
FILES CLOSED FOR INCOMPLETENESS 2 4539 906
PA/BUCKS COUNTY/1045.05 7 190
LOANS ORIGINATED 73 169 18 78 2741 25685 45837 2069 1593
APPS APPROVED, NOT ACCEPTED 10 16 1 14783 3354 12 900
APPS DENIED 7 20 53 1425 3118 5342 211
APPS WITHDRAWN 6 21 3 12188 7229 347 395
FILES CLOSED FOR INCOMPLETENESS 13 4157
PA/BUCKS COUNTY/1045.06 6 205
LOANS ORIGINATED 27 98 7 22 841 14522 37942 1189 666
APPS APPROVED, NOT ACCEPTED 2 8 11 248 126 3403 370 1 15
APPS DENIED 4 19 2 21101 8553 175 591 1 54
APPS WITHDRAWN 3 7 21585 3286 659
FILES CLOSED FOR INCOMPLETENESS 3 2645 390
PA/BUCKS COUNTY/1046.01 5 163
LOANS ORIGINATED 55 136 14 59 2652 19380 36569 1939 1321
APPS APPROVED, NOT ACCEPTED 4 71475 1948
APPS DENIED 5 31 9 12809 10533 466 2
APPS WITHDRAWN 3 21 2 12 711 1240 6608 693 88
FILES CLOSED FOR INCOMPLETENESS 1 6192 2580
06/02/2014Report Date:
AGGREGATE TABLE 1: DISPOSITION OF LOAN APPLICATIONS, BY LOCATION OF PROPERTY AND TYPE OF LOAN, 2013
MSA/MD: 37964 - PHILADELPHIA, PA
Page 18 of 199
ALL LOANS ON PROPERTY LOCATED IN MSA/MD 3/
CENSUS TRACT OR COUNTY NAME ANDDISPOSITION OF APPLICATION 1/(STATE/COUNTY/TRACT NUMBER) FHA, FSA/RHS & VA Conventional
Refinancings Home ImprovementLoans
Loans on DwellingsFor 5 or More
Families
NonoccupantLoans From
Columns A, B, Cand D
Number Number Number Number Number Number$000's $000's $000's $000's $000's $000's
A B C D E F
Home Purchase Loans
Loans on 1- to 4-Family and Manufactured Home Dwellings
Loans OnManufactured Home
Dwellings FromColumns A, B, C & D
G
Number $000's
%MinPop4/
MedianIncome As
PCT ofMSA/MDMedian

PA/BUCKS COUNTY/1046.03 10 155
LOANS ORIGINATED 48 138 15 1 114 1365 14681 36116 1507 460 2393
APPS APPROVED, NOT ACCEPTED 1 16 2 11 356 347 4602 70 50
APPS DENIED 3 33 52 631 1250 8784 217
APPS WITHDRAWN 2 19 1 21 262 666 4431 50 416
FILES CLOSED FOR INCOMPLETENESS 3 6 11091 1881 22
PA/BUCKS COUNTY/1046.04 6 154
LOANS ORIGINATED 61 141 16 186 1879 14930 32175 1848 4138 1 94
APPS APPROVED, NOT ACCEPTED 3 10 2 2433 1921 312 302 2 89
APPS DENIED 5 31 3 31 284 711 6414 86 549 2 111
APPS WITHDRAWN 8 23 2 32124 5394 275 576
FILES CLOSED FOR INCOMPLETENESS 2 10 1402 2456 249
PA/BUCKS COUNTY/1047.01 7 122
LOANS ORIGINATED 28 52 5 168 2436 6650 10274 524 2728
APPS APPROVED, NOT ACCEPTED 3 61 271 1039 1088 1 60
APPS DENIED 2 15 177 2787 45 2 77
APPS WITHDRAWN 4 7 3838 1096 383
FILES CLOSED FOR INCOMPLETENESS 1 3196 487
PA/BUCKS COUNTY/1047.02 7 137
LOANS ORIGINATED 26 57 6 2 124 1440 11278 16376 1090 2560 3136
APPS APPROVED, NOT ACCEPTED 6 11546 178
APPS DENIED 5 8 5 32637 2885 257 1400
APPS WITHDRAWN 2 12 1 41177 2545 50 1294
FILES CLOSED FOR INCOMPLETENESS 4 1 11095 1182 144
PA/BUCKS COUNTY/1047.03 5 133
LOANS ORIGINATED 24 48 7 48968 10078 1201 813
APPS APPROVED, NOT ACCEPTED 2 3 1585 526 100
APPS DENIED 3 13 41882 2966 917
APPS WITHDRAWN 4 6 12254 1709 237
FILES CLOSED FOR INCOMPLETENESS 3 495
06/02/2014Report Date:
AGGREGATE TABLE 1: DISPOSITION OF LOAN APPLICATIONS, BY LOCATION OF PROPERTY AND TYPE OF LOAN, 2013
MSA/MD: 37964 - PHILADELPHIA, PA
Page 19 of 199
ALL LOANS ON PROPERTY LOCATED IN MSA/MD 3/
CENSUS TRACT OR COUNTY NAME ANDDISPOSITION OF APPLICATION 1/(STATE/COUNTY/TRACT NUMBER) FHA, FSA/RHS & VA Conventional
Refinancings Home ImprovementLoans
Loans on DwellingsFor 5 or More
Families
NonoccupantLoans From
Columns A, B, Cand D
Number Number Number Number Number Number$000's $000's $000's $000's $000's $000's
A B C D E F
Home Purchase Loans
Loans on 1- to 4-Family and Manufactured Home Dwellings
Loans OnManufactured Home
Dwellings FromColumns A, B, C & D
G
Number $000's
%MinPop4/
MedianIncome As
PCT ofMSA/MDMedian

PA/BUCKS COUNTY/1048.00 7 121
LOANS ORIGINATED 21 57 4 75 1134 5014 10418 195 950 1 56
APPS APPROVED, NOT ACCEPTED 2 8 1469 1629 169 1 52
APPS DENIED 1 15 1 1544 3080 30 120
APPS WITHDRAWN 3 111294 2187
FILES CLOSED FOR INCOMPLETENESS 1 9194 1569
PA/BUCKS COUNTY/1049.01 9 185
LOANS ORIGINATED 66 204 13 27 2301 22877 52603 1136 642
APPS APPROVED, NOT ACCEPTED 10 10 1 13059 2832 10 417
APPS DENIED 5 40 6 11 457 1029 10722 187 193
APPS WITHDRAWN 7 28 2 12216 7287 145 190
FILES CLOSED FOR INCOMPLETENESS 1 14324 3839
PA/BUCKS COUNTY/1049.02 7 144
LOANS ORIGINATED 99 204 20 1211 2202 28858 42996 1675 1864
APPS APPROVED, NOT ACCEPTED 13 24 24580 5103 349
APPS DENIED 20 57 10 72 372 4345 11701 1163 910
APPS WITHDRAWN 18 30 2 12 392 5135 6158 397 82
FILES CLOSED FOR INCOMPLETENESS 1 23 3740 5099 444
PA/BUCKS COUNTY/1050.03 6 160
LOANS ORIGINATED 38 108 11 15 1736 15310 28970 1587 398
APPS APPROVED, NOT ACCEPTED 91 332 2671
APPS DENIED 3 37 4 22 667 1003 11222 419 253
APPS WITHDRAWN 4 24 2 11200 6874 640 330
FILES CLOSED FOR INCOMPLETENESS 2 10852 2639
PA/BUCKS COUNTY/1050.04 5 143
LOANS ORIGINATED 39 135 17 410 3479 12496 31081 1582 593 1 40
APPS APPROVED, NOT ACCEPTED 2 12 2365 3091 190
APPS DENIED 2 36 1 13 1084 644 9557 50 150
APPS WITHDRAWN 2 18 1900 4813 265
FILES CLOSED FOR INCOMPLETENESS 15 14086 100
06/02/2014Report Date:
AGGREGATE TABLE 1: DISPOSITION OF LOAN APPLICATIONS, BY LOCATION OF PROPERTY AND TYPE OF LOAN, 2013
MSA/MD: 37964 - PHILADELPHIA, PA
Page 20 of 199
ALL LOANS ON PROPERTY LOCATED IN MSA/MD 3/
CENSUS TRACT OR COUNTY NAME ANDDISPOSITION OF APPLICATION 1/(STATE/COUNTY/TRACT NUMBER) FHA, FSA/RHS & VA Conventional
Refinancings Home ImprovementLoans
Loans on DwellingsFor 5 or More
Families
NonoccupantLoans From
Columns A, B, Cand D
Number Number Number Number Number Number$000's $000's $000's $000's $000's $000's
A B C D E F
Home Purchase Loans
Loans on 1- to 4-Family and Manufactured Home Dwellings
Loans OnManufactured Home
Dwellings FromColumns A, B, C & D
G
Number $000's
%MinPop4/
MedianIncome As
PCT ofMSA/MDMedian

PA/BUCKS COUNTY/1050.06 6 170
LOANS ORIGINATED 45 152 9 58 2532 14347 35180 814 1024
APPS APPROVED, NOT ACCEPTED 10 2646
APPS DENIED 3 45 52 631 1025 13560 535
APPS WITHDRAWN 10 15 1 21 324 4000 4807 10 1090
FILES CLOSED FOR INCOMPLETENESS 91 393 1952
PA/BUCKS COUNTY/1050.08 6 167
LOANS ORIGINATED 44 80 10 219512 23139 1183 686
APPS APPROVED, NOT ACCEPTED 1 9 1 1550 3106 25 550
APPS DENIED 8 23 21 209 3956 9388 916
APPS WITHDRAWN 4 11 11 214 2206 3435 200
FILES CLOSED FOR INCOMPLETENESS 1 17 1545 5397 500
PA/BUCKS COUNTY/1050.09 5 121
LOANS ORIGINATED 34 80 4 128 1643 6953 15260 615 1773
APPS APPROVED, NOT ACCEPTED 9 2 21853 70 296
APPS DENIED 3 21 5 11 248 680 3785 572 166
APPS WITHDRAWN 4 9 1 31 255 750 1793 193 397
FILES CLOSED FOR INCOMPLETENESS 1 6185 1308
PA/BUCKS COUNTY/1050.10 8 139
LOANS ORIGINATED 30 126 5 156 1519 6692 24364 605 2444
APPS APPROVED, NOT ACCEPTED 1 650 1165
APPS DENIED 3 31 6 22 459 733 6828 417 121
APPS WITHDRAWN 4 16 1 12 585 1356 3044 50 98
FILES CLOSED FOR INCOMPLETENESS 2 7 1395 972 165
PA/BUCKS COUNTY/1050.11 9 156
LOANS ORIGINATED 43 96 6 206 1347 13166 20182 201 2690
APPS APPROVED, NOT ACCEPTED 2 15 1689 4282 350
APPS DENIED 3 32 1 41258 6828 10 464
APPS WITHDRAWN 4 18 1 31435 4615 78 416
FILES CLOSED FOR INCOMPLETENESS 2 11535 3161
06/02/2014Report Date:
AGGREGATE TABLE 1: DISPOSITION OF LOAN APPLICATIONS, BY LOCATION OF PROPERTY AND TYPE OF LOAN, 2013
MSA/MD: 37964 - PHILADELPHIA, PA
Page 21 of 199
ALL LOANS ON PROPERTY LOCATED IN MSA/MD 3/
CENSUS TRACT OR COUNTY NAME ANDDISPOSITION OF APPLICATION 1/(STATE/COUNTY/TRACT NUMBER) FHA, FSA/RHS & VA Conventional
Refinancings Home ImprovementLoans
Loans on DwellingsFor 5 or More
Families
NonoccupantLoans From
Columns A, B, Cand D
Number Number Number Number Number Number$000's $000's $000's $000's $000's $000's
A B C D E F
Home Purchase Loans
Loans on 1- to 4-Family and Manufactured Home Dwellings
Loans OnManufactured Home
Dwellings FromColumns A, B, C & D
G
Number $000's
%MinPop4/
MedianIncome As
PCT ofMSA/MDMedian
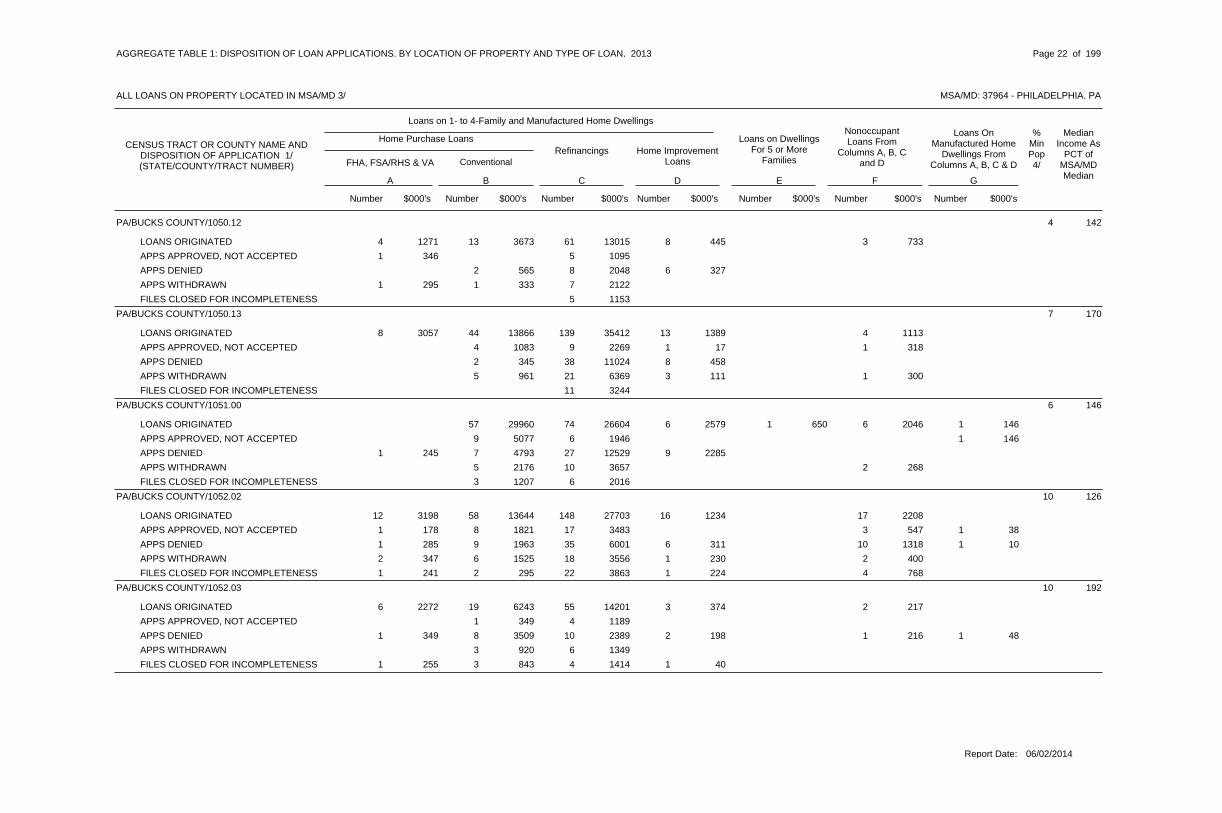
PA/BUCKS COUNTY/1050.12 4 142
LOANS ORIGINATED 13 61 8 34 1271 3673 13015 445 733
APPS APPROVED, NOT ACCEPTED 51 346 1095
APPS DENIED 2 8 6565 2048 327
APPS WITHDRAWN 1 71 295 333 2122
FILES CLOSED FOR INCOMPLETENESS 5 1153
PA/BUCKS COUNTY/1050.13 7 170
LOANS ORIGINATED 44 139 13 48 3057 13866 35412 1389 1113
APPS APPROVED, NOT ACCEPTED 4 9 1 11083 2269 17 318
APPS DENIED 2 38 8345 11024 458
APPS WITHDRAWN 5 21 3 1961 6369 111 300
FILES CLOSED FOR INCOMPLETENESS 11 3244
PA/BUCKS COUNTY/1051.00 6 146
LOANS ORIGINATED 57 74 6 1 629960 26604 2579 650 2046 1 146
APPS APPROVED, NOT ACCEPTED 9 65077 1946 1 146
APPS DENIED 7 27 91 245 4793 12529 2285
APPS WITHDRAWN 5 10 22176 3657 268
FILES CLOSED FOR INCOMPLETENESS 3 61207 2016
PA/BUCKS COUNTY/1052.02 10 126
LOANS ORIGINATED 58 148 16 1712 3198 13644 27703 1234 2208
APPS APPROVED, NOT ACCEPTED 8 17 31 178 1821 3483 547 1 38
APPS DENIED 9 35 6 101 285 1963 6001 311 1318 1 10
APPS WITHDRAWN 6 18 1 22 347 1525 3556 230 400
FILES CLOSED FOR INCOMPLETENESS 2 22 1 41 241 295 3863 224 768
PA/BUCKS COUNTY/1052.03 10 192
LOANS ORIGINATED 19 55 3 26 2272 6243 14201 374 217
APPS APPROVED, NOT ACCEPTED 1 4349 1189
APPS DENIED 8 10 2 11 349 3509 2389 198 216 1 48
APPS WITHDRAWN 3 6920 1349
FILES CLOSED FOR INCOMPLETENESS 3 4 11 255 843 1414 40
06/02/2014Report Date:
AGGREGATE TABLE 1: DISPOSITION OF LOAN APPLICATIONS, BY LOCATION OF PROPERTY AND TYPE OF LOAN, 2013
MSA/MD: 37964 - PHILADELPHIA, PA
Page 22 of 199
ALL LOANS ON PROPERTY LOCATED IN MSA/MD 3/
CENSUS TRACT OR COUNTY NAME ANDDISPOSITION OF APPLICATION 1/(STATE/COUNTY/TRACT NUMBER) FHA, FSA/RHS & VA Conventional
Refinancings Home ImprovementLoans
Loans on DwellingsFor 5 or More
Families
NonoccupantLoans From
Columns A, B, Cand D
Number Number Number Number Number Number$000's $000's $000's $000's $000's $000's
A B C D E F
Home Purchase Loans
Loans on 1- to 4-Family and Manufactured Home Dwellings
Loans OnManufactured Home
Dwellings FromColumns A, B, C & D
G
Number $000's
%MinPop4/
MedianIncome As
PCT ofMSA/MDMedian

PA/BUCKS COUNTY/1052.06 11 149
LOANS ORIGINATED 91 167 10 156 1945 29377 42600 1582 3064
APPS APPROVED, NOT ACCEPTED 3 111141 2825
APPS DENIED 14 24 3 74360 6561 115 1338
APPS WITHDRAWN 6 22 2 22 748 1547 5156 320 170
FILES CLOSED FOR INCOMPLETENESS 2 131 196 417 3256
PA/BUCKS COUNTY/1052.07 15 185
LOANS ORIGINATED 70 168 8 239 2708 22876 39716 1365 4259
APPS APPROVED, NOT ACCEPTED 15 13 21 329 6086 2587 593
APPS DENIED 11 33 4 12 353 3823 7110 205 136
APPS WITHDRAWN 4 20 21292 5732 380
FILES CLOSED FOR INCOMPLETENESS 3 14 1 1620 3484 25 108
PA/BUCKS COUNTY/1052.08 16 222
LOANS ORIGINATED 28 81 6 211516 24462 861 627
APPS APPROVED, NOT ACCEPTED 1 14 1415 4781 265
APPS DENIED 14 5 24295 77 269
APPS WITHDRAWN 5 10 22567 3133 195
FILES CLOSED FOR INCOMPLETENESS 3 1582
PA/BUCKS COUNTY/1053.00 5 144
LOANS ORIGINATED 28 62 7 113 825 10001 18502 617 4196
APPS APPROVED, NOT ACCEPTED 4 12129 488
APPS DENIED 2 13 1 3528 4060 30 361
APPS WITHDRAWN 4 10 21414 3138 332
FILES CLOSED FOR INCOMPLETENESS 1 6 1665 1494 125
PA/BUCKS COUNTY/1054.00 7 254
LOANS ORIGINATED 108 239 6 83 1248 53886 96203 2213 1844
APPS APPROVED, NOT ACCEPTED 9 30 44113 13139 5140
APPS DENIED 11 68 5 33 1343 6209 32860 258 538
APPS WITHDRAWN 17 35 1 21 137 8297 15011 230 649
FILES CLOSED FOR INCOMPLETENESS 3 17827 9543
06/02/2014Report Date:
AGGREGATE TABLE 1: DISPOSITION OF LOAN APPLICATIONS, BY LOCATION OF PROPERTY AND TYPE OF LOAN, 2013
MSA/MD: 37964 - PHILADELPHIA, PA
Page 23 of 199
ALL LOANS ON PROPERTY LOCATED IN MSA/MD 3/
CENSUS TRACT OR COUNTY NAME ANDDISPOSITION OF APPLICATION 1/(STATE/COUNTY/TRACT NUMBER) FHA, FSA/RHS & VA Conventional
Refinancings Home ImprovementLoans
Loans on DwellingsFor 5 or More
Families
NonoccupantLoans From
Columns A, B, Cand D
Number Number Number Number Number Number$000's $000's $000's $000's $000's $000's
A B C D E F
Home Purchase Loans
Loans on 1- to 4-Family and Manufactured Home Dwellings
Loans OnManufactured Home
Dwellings FromColumns A, B, C & D
G
Number $000's
%MinPop4/
MedianIncome As
PCT ofMSA/MDMedian

PA/BUCKS COUNTY/1055.05 9 172
LOANS ORIGINATED 47 132 5 66 1908 14427 31957 711 1038
APPS APPROVED, NOT ACCEPTED 1 18 1339 5090 35
APPS DENIED 6 27 21959 7603 376
APPS WITHDRAWN 3 20 2 1859 4524 828 261
FILES CLOSED FOR INCOMPLETENESS 3 6 11137 1315 500
PA/BUCKS COUNTY/1055.06 14 209
LOANS ORIGINATED 32 104 9 13 1138 13166 30049 1477 281
APPS APPROVED, NOT ACCEPTED 1 12 1540 3295 15
APPS DENIED 2 20 1 1753 6161 20 200
APPS WITHDRAWN 5 17 3 22 633 2340 4688 1140 165
FILES CLOSED FOR INCOMPLETENESS 1 13 1361 2990 360
PA/BUCKS COUNTY/1055.07 9 178
LOANS ORIGINATED 74 200 14 38 2606 24379 50408 1638 638
APPS APPROVED, NOT ACCEPTED 4 21 21006 6438 290
APPS DENIED 7 45 62197 11974 450 2 107
APPS WITHDRAWN 11 27 13529 7230 50
FILES CLOSED FOR INCOMPLETENESS 3 11 1 11102 3260 25 330
PA/BUCKS COUNTY/1055.08 12 235
LOANS ORIGINATED 48 88 1 32 852 20548 29997 60 1133
APPS APPROVED, NOT ACCEPTED 4 42178 1147
APPS DENIED 8 26 3 13 1720 2945 9290 717 504
APPS WITHDRAWN 7 13 13 1393 2833 4334 504
FILES CLOSED FOR INCOMPLETENESS 4 1850
PA/BUCKS COUNTY/1055.09 12 175
LOANS ORIGINATED 42 117 9 11 290 14060 32291 831 121
APPS APPROVED, NOT ACCEPTED 2 9870 2971
APPS DENIED 6 22 42412 7072 246
APPS WITHDRAWN 11 14 11 367 3712 4164 50
FILES CLOSED FOR INCOMPLETENESS 2 9713 2624
06/02/2014Report Date:
AGGREGATE TABLE 1: DISPOSITION OF LOAN APPLICATIONS, BY LOCATION OF PROPERTY AND TYPE OF LOAN, 2013
MSA/MD: 37964 - PHILADELPHIA, PA
Page 24 of 199
ALL LOANS ON PROPERTY LOCATED IN MSA/MD 3/
CENSUS TRACT OR COUNTY NAME ANDDISPOSITION OF APPLICATION 1/(STATE/COUNTY/TRACT NUMBER) FHA, FSA/RHS & VA Conventional
Refinancings Home ImprovementLoans
Loans on DwellingsFor 5 or More
Families
NonoccupantLoans From
Columns A, B, Cand D
Number Number Number Number Number Number$000's $000's $000's $000's $000's $000's
A B C D E F
Home Purchase Loans
Loans on 1- to 4-Family and Manufactured Home Dwellings
Loans OnManufactured Home
Dwellings FromColumns A, B, C & D
G
Number $000's
%MinPop4/
MedianIncome As
PCT ofMSA/MDMedian

PA/BUCKS COUNTY/1055.10 19 135
LOANS ORIGINATED 58 121 4 246 1261 13141 20158 365 4204 1 62
APPS APPROVED, NOT ACCEPTED 2 13 2 2549 2050 25 305
APPS DENIED 10 31 3 71971 6164 371 1202
APPS WITHDRAWN 6 13 1 34 1008 1030 2920 42 520
FILES CLOSED FOR INCOMPLETENESS 1 21 31 216 200 4011 572
PA/BUCKS COUNTY/1055.11 13 204
LOANS ORIGINATED 53 147 6 76 1817 14008 33067 185 1448 1 85
APPS APPROVED, NOT ACCEPTED 2 8678 2318
APPS DENIED 5 47 2 43 835 987 10655 87 745
APPS WITHDRAWN 7 13 22191 2944 615
FILES CLOSED FOR INCOMPLETENESS 1 6 1 2264 1534 190 535
PA/BUCKS COUNTY/1056.00 10 142
LOANS ORIGINATED 25 72 5 1 145 1382 6208 16612 533 667 2881
APPS APPROVED, NOT ACCEPTED 2 10 1553 3159 148
APPS DENIED 4 18 6 2994 3379 100 463 1 25
APPS WITHDRAWN 4 13 11 147 539 2431 86
FILES CLOSED FOR INCOMPLETENESS 1 6 1112 1434 308
PA/BUCKS COUNTY/1057.02 24 80
LOANS ORIGINATED 11 51 7 1 1817 2364 1331 6479 356 375 1824 1 84
APPS APPROVED, NOT ACCEPTED 1 4 265 490 216
APPS DENIED 6 23 1 53 406 693 3153 50 523
APPS WITHDRAWN 1 7115 1081
FILES CLOSED FOR INCOMPLETENESS 6 1808 102
PA/BUCKS COUNTY/1057.04 32 88
LOANS ORIGINATED 36 101 6 3 1221 3399 5365 15959 262 8440 1579
APPS APPROVED, NOT ACCEPTED 2 12 352 408 199
APPS DENIED 4 38 12 84 667 306 5769 290 669 1 2
APPS WITHDRAWN 5 17 2 32 195 564 3019 60 306
FILES CLOSED FOR INCOMPLETENESS 7 21 116 1163 253
06/02/2014Report Date:
AGGREGATE TABLE 1: DISPOSITION OF LOAN APPLICATIONS, BY LOCATION OF PROPERTY AND TYPE OF LOAN, 2013
MSA/MD: 37964 - PHILADELPHIA, PA
Page 25 of 199
ALL LOANS ON PROPERTY LOCATED IN MSA/MD 3/
CENSUS TRACT OR COUNTY NAME ANDDISPOSITION OF APPLICATION 1/(STATE/COUNTY/TRACT NUMBER) FHA, FSA/RHS & VA Conventional
Refinancings Home ImprovementLoans
Loans on DwellingsFor 5 or More
Families
NonoccupantLoans From
Columns A, B, Cand D
Number Number Number Number Number Number$000's $000's $000's $000's $000's $000's
A B C D E F
Home Purchase Loans
Loans on 1- to 4-Family and Manufactured Home Dwellings
Loans OnManufactured Home
Dwellings FromColumns A, B, C & D
G
Number $000's
%MinPop4/
MedianIncome As
PCT ofMSA/MDMedian

PA/BUCKS COUNTY/1058.01 31 128
LOANS ORIGINATED 22 118 7 215 3772 5879 22092 292 296
APPS APPROVED, NOT ACCEPTED 4 61051 1058
APPS DENIED 2 32 7500 7155 365
APPS WITHDRAWN 8 13 21775 2671 23
FILES CLOSED FOR INCOMPLETENESS 1 92 437 279 2045
PA/BUCKS COUNTY/1058.05 16 95
LOANS ORIGINATED 16 41 7 110 2224 2388 9645 435 208 10 369
APPS APPROVED, NOT ACCEPTED 2 662 1563 2 62
APPS DENIED 4 15 7 21 128 233 3202 125 9 9 295
APPS WITHDRAWN 3 41 277 539 1008
FILES CLOSED FOR INCOMPLETENESS 5 937
PA/BUCKS COUNTY/1058.07 24 103
LOANS ORIGINATED 18 58 4 611 2467 2994 9251 198 786
APPS APPROVED, NOT ACCEPTED 1 3216 857
APPS DENIED 7 17 2739 2877 276
APPS WITHDRAWN 1 9 13 459 182 1707 187
FILES CLOSED FOR INCOMPLETENESS 1 1189 145
PA/BUCKS COUNTY/1058.08 8 88
LOANS ORIGINATED 27 69 6 1 514 2755 4721 10798 370 3800 792
APPS APPROVED, NOT ACCEPTED 1 4 2 11 196 128 852 292 128
APPS DENIED 3 18 10 1 13 548 571 2983 112 4000 119 1 3
APPS WITHDRAWN 2 15 1235 2557 50
FILES CLOSED FOR INCOMPLETENESS 1 5 21 167 132 700 326
PA/BUCKS COUNTY/1058.09 10 95
LOANS ORIGINATED 24 95 15 121 4320 4669 14696 942 203
APPS APPROVED, NOT ACCEPTED 1 6 1216 958 25
APPS DENIED 4 37 5 42 308 682 6037 367 494 1 138
APPS WITHDRAWN 1 22 13 700 198 3215 205
FILES CLOSED FOR INCOMPLETENESS 42 393 501
06/02/2014Report Date:
AGGREGATE TABLE 1: DISPOSITION OF LOAN APPLICATIONS, BY LOCATION OF PROPERTY AND TYPE OF LOAN, 2013
MSA/MD: 37964 - PHILADELPHIA, PA
Page 26 of 199
ALL LOANS ON PROPERTY LOCATED IN MSA/MD 3/
CENSUS TRACT OR COUNTY NAME ANDDISPOSITION OF APPLICATION 1/(STATE/COUNTY/TRACT NUMBER) FHA, FSA/RHS & VA Conventional
Refinancings Home ImprovementLoans
Loans on DwellingsFor 5 or More
Families
NonoccupantLoans From
Columns A, B, Cand D
Number Number Number Number Number Number$000's $000's $000's $000's $000's $000's
A B C D E F
Home Purchase Loans
Loans on 1- to 4-Family and Manufactured Home Dwellings
Loans OnManufactured Home
Dwellings FromColumns A, B, C & D
G
Number $000's
%MinPop4/
MedianIncome As
PCT ofMSA/MDMedian

PA/BUCKS COUNTY/1058.10 6 91
LOANS ORIGINATED 10 34 17 416 3143 1901 5267 1043 642
APPS APPROVED, NOT ACCEPTED 5 812
APPS DENIED 1 14 9 25 892 177 2699 160 246
APPS WITHDRAWN 3 9 1 12 506 471 1329 30 112
FILES CLOSED FOR INCOMPLETENESS 61 196 1042
PA/BUCKS COUNTY/1058.11 9 93
LOANS ORIGINATED 26 102 16 635 6903 4974 15835 1209 834
APPS APPROVED, NOT ACCEPTED 2 12 2355 1901 160
APPS DENIED 3 41 20 84 598 660 6718 991 633 1 2
APPS WITHDRAWN 25 2 14 813 4172 43 250
FILES CLOSED FOR INCOMPLETENESS 1 10 2 12 405 209 1772 30 185
PA/BUCKS COUNTY/1058.12 8 114
LOANS ORIGINATED 11 38 4 48 1678 1752 5969 139 618
APPS APPROVED, NOT ACCEPTED 1 175
APPS DENIED 1 10 51 182 200 1848 764
APPS WITHDRAWN 2 4 11 242 339 673 161
FILES CLOSED FOR INCOMPLETENESS 1 60
PA/BUCKS COUNTY/1059.00 8 89
LOANS ORIGINATED 8 38 5 54 780 1330 5326 313 637
APPS APPROVED, NOT ACCEPTED 5 1701 121
APPS DENIED 1 14 2 22 410 25 1837 40 252
APPS WITHDRAWN 5 1653 131
FILES CLOSED FOR INCOMPLETENESS 4 1530 122
PA/BUCKS COUNTY/1060.00 10 97
LOANS ORIGINATED 21 65 7 211 2795 4466 11497 297 225
APPS APPROVED, NOT ACCEPTED 1 5 1 1210 867 200 183
APPS DENIED 1 21 5 21 68 290 3421 197 244 1 70
APPS WITHDRAWN 8 1 11 167 1641 15 106
FILES CLOSED FOR INCOMPLETENESS 1 10320 1310
06/02/2014Report Date:
AGGREGATE TABLE 1: DISPOSITION OF LOAN APPLICATIONS, BY LOCATION OF PROPERTY AND TYPE OF LOAN, 2013
MSA/MD: 37964 - PHILADELPHIA, PA
Page 27 of 199
ALL LOANS ON PROPERTY LOCATED IN MSA/MD 3/
CENSUS TRACT OR COUNTY NAME ANDDISPOSITION OF APPLICATION 1/(STATE/COUNTY/TRACT NUMBER) FHA, FSA/RHS & VA Conventional
Refinancings Home ImprovementLoans
Loans on DwellingsFor 5 or More
Families
NonoccupantLoans From
Columns A, B, Cand D
Number Number Number Number Number Number$000's $000's $000's $000's $000's $000's
A B C D E F
Home Purchase Loans
Loans on 1- to 4-Family and Manufactured Home Dwellings
Loans OnManufactured Home
Dwellings FromColumns A, B, C & D
G
Number $000's
%MinPop4/
MedianIncome As
PCT ofMSA/MDMedian

PA/BUCKS COUNTY/1061.00 12 135
LOANS ORIGINATED 16 54 7 95 1313 3672 9842 369 1850
APPS APPROVED, NOT ACCEPTED 1 394 540 1 94
APPS DENIED 3 14 2 1 21 343 437 2630 216 345 240
APPS WITHDRAWN 2 9 1 1 1621 2556 8 450 403
FILES CLOSED FOR INCOMPLETENESS 1 4204 979
PA/BUCKS COUNTY/1062.00 10 114
LOANS ORIGINATED 31 88 11 2 16 1719 7915 16997 668 60000 175
APPS APPROVED, NOT ACCEPTED 12 1 12934 25000 322
APPS DENIED 1 25 4 11 237 304 4624 70 20
APPS WITHDRAWN 4 9 21 191 1165 1937 1060
FILES CLOSED FOR INCOMPLETENESS 3 13647 2714
PA/BUCKS COUNTY/1063.00 8 131
LOANS ORIGINATED 68 178 22 1313 3009 20342 38650 3341 2486
APPS APPROVED, NOT ACCEPTED 7 16 2 12 643 2368 3215 458 104
APPS DENIED 9 47 3 23 1052 2712 11097 281 376
APPS WITHDRAWN 4 24 12 387 1176 5144 115
FILES CLOSED FOR INCOMPLETENESS 3 141 387 1234 3611
PA/BUCKS COUNTY/1064.01 11 135
LOANS ORIGINATED 48 151 18 1227 5319 10086 28954 943 1884 2 7
APPS APPROVED, NOT ACCEPTED 2 25 21 153 414 4725 282 3 170
APPS DENIED 9 56 9 73 716 1866 12403 226 1156 3 128
APPS WITHDRAWN 10 35 110 2813 2250 8375 17
FILES CLOSED FOR INCOMPLETENESS 19 13821 116
PA/BUCKS COUNTY/1064.02 6 112
LOANS ORIGINATED 69 142 19 1 929 6716 15680 25783 1248 275 1196
APPS APPROVED, NOT ACCEPTED 2 8 11 136 273 1324 95
APPS DENIED 2 51 14 21 306 648 10345 435 282
APPS WITHDRAWN 4 31 21 328 920 7228 261
FILES CLOSED FOR INCOMPLETENESS 111 260 2291
06/02/2014Report Date:
AGGREGATE TABLE 1: DISPOSITION OF LOAN APPLICATIONS, BY LOCATION OF PROPERTY AND TYPE OF LOAN, 2013
MSA/MD: 37964 - PHILADELPHIA, PA
Page 28 of 199
ALL LOANS ON PROPERTY LOCATED IN MSA/MD 3/
CENSUS TRACT OR COUNTY NAME ANDDISPOSITION OF APPLICATION 1/(STATE/COUNTY/TRACT NUMBER) FHA, FSA/RHS & VA Conventional
Refinancings Home ImprovementLoans
Loans on DwellingsFor 5 or More
Families
NonoccupantLoans From
Columns A, B, Cand D
Number Number Number Number Number Number$000's $000's $000's $000's $000's $000's
A B C D E F
Home Purchase Loans
Loans on 1- to 4-Family and Manufactured Home Dwellings
Loans OnManufactured Home
Dwellings FromColumns A, B, C & D
G
Number $000's
%MinPop4/
MedianIncome As
PCT ofMSA/MDMedian
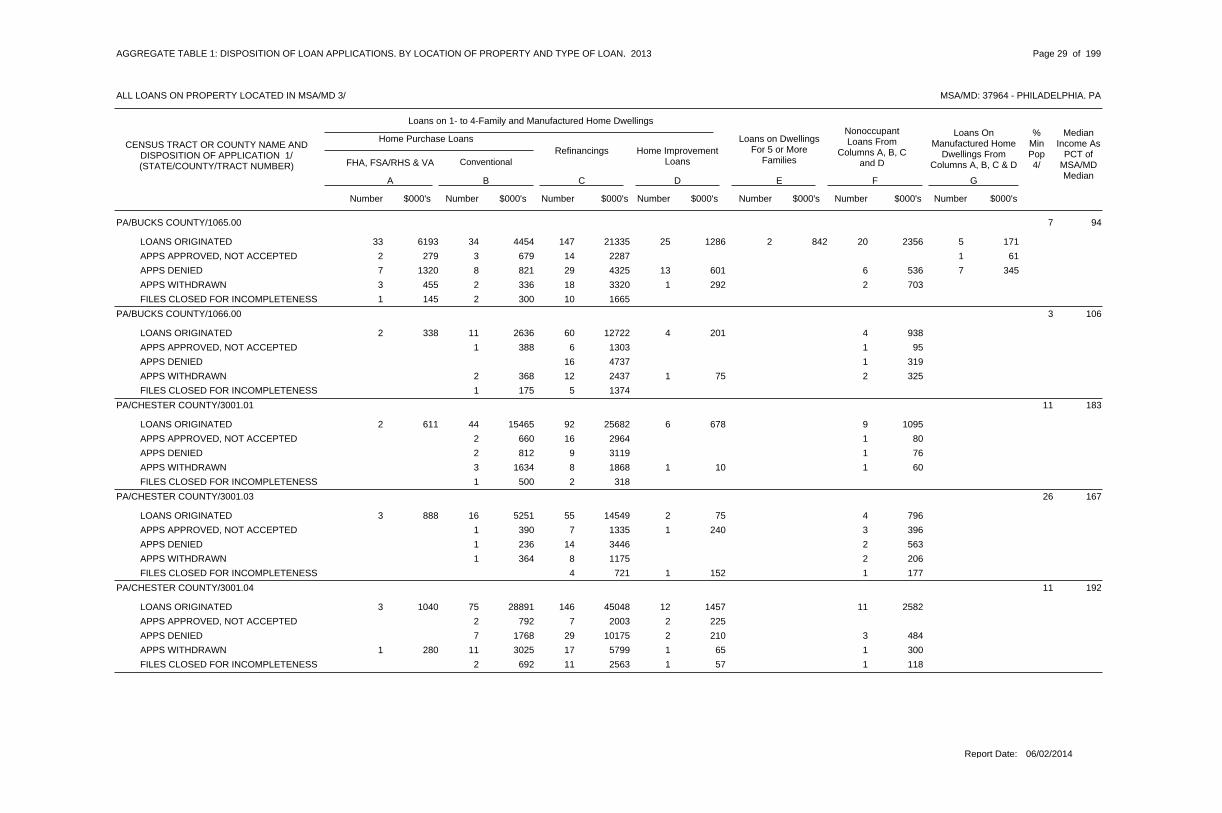
PA/BUCKS COUNTY/1065.00 7 94
LOANS ORIGINATED 34 147 25 2 2033 6193 4454 21335 1286 842 2356 5 171
APPS APPROVED, NOT ACCEPTED 3 142 279 679 2287 1 61
APPS DENIED 8 29 13 67 1320 821 4325 601 536 7 345
APPS WITHDRAWN 2 18 1 23 455 336 3320 292 703
FILES CLOSED FOR INCOMPLETENESS 2 101 145 300 1665
PA/BUCKS COUNTY/1066.00 3 106
LOANS ORIGINATED 11 60 4 42 338 2636 12722 201 938
APPS APPROVED, NOT ACCEPTED 1 6 1388 1303 95
APPS DENIED 16 14737 319
APPS WITHDRAWN 2 12 1 2368 2437 75 325
FILES CLOSED FOR INCOMPLETENESS 1 5175 1374
PA/CHESTER COUNTY/3001.01 11 183
LOANS ORIGINATED 44 92 6 92 611 15465 25682 678 1095
APPS APPROVED, NOT ACCEPTED 2 16 1660 2964 80
APPS DENIED 2 9 1812 3119 76
APPS WITHDRAWN 3 8 1 11634 1868 10 60
FILES CLOSED FOR INCOMPLETENESS 1 2500 318
PA/CHESTER COUNTY/3001.03 26 167
LOANS ORIGINATED 16 55 2 43 888 5251 14549 75 796
APPS APPROVED, NOT ACCEPTED 1 7 1 3390 1335 240 396
APPS DENIED 1 14 2236 3446 563
APPS WITHDRAWN 1 8 2364 1175 206
FILES CLOSED FOR INCOMPLETENESS 4 1 1721 152 177
PA/CHESTER COUNTY/3001.04 11 192
LOANS ORIGINATED 75 146 12 113 1040 28891 45048 1457 2582
APPS APPROVED, NOT ACCEPTED 2 7 2792 2003 225
APPS DENIED 7 29 2 31768 10175 210 484
APPS WITHDRAWN 11 17 1 11 280 3025 5799 65 300
FILES CLOSED FOR INCOMPLETENESS 2 11 1 1692 2563 57 118
06/02/2014Report Date:
AGGREGATE TABLE 1: DISPOSITION OF LOAN APPLICATIONS, BY LOCATION OF PROPERTY AND TYPE OF LOAN, 2013
MSA/MD: 37964 - PHILADELPHIA, PA
Page 29 of 199
ALL LOANS ON PROPERTY LOCATED IN MSA/MD 3/
CENSUS TRACT OR COUNTY NAME ANDDISPOSITION OF APPLICATION 1/(STATE/COUNTY/TRACT NUMBER) FHA, FSA/RHS & VA Conventional
Refinancings Home ImprovementLoans
Loans on DwellingsFor 5 or More
Families
NonoccupantLoans From
Columns A, B, Cand D
Number Number Number Number Number Number$000's $000's $000's $000's $000's $000's
A B C D E F
Home Purchase Loans
Loans on 1- to 4-Family and Manufactured Home Dwellings
Loans OnManufactured Home
Dwellings FromColumns A, B, C & D
G
Number $000's
%MinPop4/
MedianIncome As
PCT ofMSA/MDMedian

PA/CHESTER COUNTY/3001.06 23 134
LOANS ORIGINATED 91 181 6 413 514 20767 33135 588 6621 1 88
APPS APPROVED, NOT ACCEPTED 9 15 3 41915 2640 514 499
APPS DENIED 5 39 4 91219 7071 275 1043
APPS WITHDRAWN 22 21 45253 4217 951
FILES CLOSED FOR INCOMPLETENESS 2 14 2395 3249 323
PA/CHESTER COUNTY/3001.07 13 219
LOANS ORIGINATED 48 137 10 51 580 28309 46475 2962 1406
APPS APPROVED, NOT ACCEPTED 9 95157 2625
APPS DENIED 6 25 2 22390 12745 253 258
APPS WITHDRAWN 10 18 14733 8657 240
FILES CLOSED FOR INCOMPLETENESS 5 18 21576 10074 440
PA/CHESTER COUNTY/3001.08 22 163
LOANS ORIGINATED 66 144 3 1 153 420 22589 43706 1261 2197 2926
APPS APPROVED, NOT ACCEPTED 4 11 11824 2615 143
APPS DENIED 6 30 3 51 199 1945 8587 86 525
APPS WITHDRAWN 7 23 3 1 51 123 2437 6693 1230 2000 922
FILES CLOSED FOR INCOMPLETENESS 2 10 2470 3598 540
PA/CHESTER COUNTY/3001.09 10 210
LOANS ORIGINATED 52 106 5 106 2467 20689 39155 1489 2610
APPS APPROVED, NOT ACCEPTED 4 9 11998 1855 146
APPS DENIED 7 18 21 169 4570 6338 396
APPS WITHDRAWN 7 212454 7426
FILES CLOSED FOR INCOMPLETENESS 2 8837 1885
PA/CHESTER COUNTY/3002.01 12 178
LOANS ORIGINATED 75 150 21 2 163 950 29326 53326 4770 1000 3854
APPS APPROVED, NOT ACCEPTED 4 14 11314 5025 20
APPS DENIED 8 26 4 21 417 6352 9123 75 4068
APPS WITHDRAWN 7 181 319 2918 7430
FILES CLOSED FOR INCOMPLETENESS 1 8 1466 2341 407
06/02/2014Report Date:
AGGREGATE TABLE 1: DISPOSITION OF LOAN APPLICATIONS, BY LOCATION OF PROPERTY AND TYPE OF LOAN, 2013
MSA/MD: 37964 - PHILADELPHIA, PA
Page 30 of 199
ALL LOANS ON PROPERTY LOCATED IN MSA/MD 3/
CENSUS TRACT OR COUNTY NAME ANDDISPOSITION OF APPLICATION 1/(STATE/COUNTY/TRACT NUMBER) FHA, FSA/RHS & VA Conventional
Refinancings Home ImprovementLoans
Loans on DwellingsFor 5 or More
Families
NonoccupantLoans From
Columns A, B, Cand D
Number Number Number Number Number Number$000's $000's $000's $000's $000's $000's
A B C D E F
Home Purchase Loans
Loans on 1- to 4-Family and Manufactured Home Dwellings
Loans OnManufactured Home
Dwellings FromColumns A, B, C & D
G
Number $000's
%MinPop4/
MedianIncome As
PCT ofMSA/MDMedian

PA/CHESTER COUNTY/3002.02 9 234
LOANS ORIGINATED 75 145 9 83 842 41558 69825 2415 2706
APPS APPROVED, NOT ACCEPTED 5 4 1 13173 1418 173 394
APPS DENIED 5 33 61 667 2648 14808 380
APPS WITHDRAWN 7 18 23340 8559 527
FILES CLOSED FOR INCOMPLETENESS 3 102240 3215
PA/CHESTER COUNTY/3003.01 9 167
LOANS ORIGINATED 60 133 5 67 1975 21357 47217 6519 1089
APPS APPROVED, NOT ACCEPTED 4 112800 6988
APPS DENIED 4 29 51 340 4252 9914 893
APPS WITHDRAWN 4 181 340 1014 5812
FILES CLOSED FOR INCOMPLETENESS 3 6 11 211 1150 2589 120
PA/CHESTER COUNTY/3003.02 4 191
LOANS ORIGINATED 62 106 6 112 781 26901 44199 2250 4977
APPS APPROVED, NOT ACCEPTED 8 10 14050 3311 263
APPS DENIED 3 24 1 2881 8265 100 450
APPS WITHDRAWN 11 8 2 24133 2645 385 370
FILES CLOSED FOR INCOMPLETENESS 1 1 1300 106 932
PA/CHESTER COUNTY/3003.03 10 137
LOANS ORIGINATED 34 78 11 135 1333 8354 14836 1189 2103
APPS APPROVED, NOT ACCEPTED 1 3 2212 892 445
APPS DENIED 3 23 4 82 458 304 4939 351 1789
APPS WITHDRAWN 3 18 1 1502 3544 240 210
FILES CLOSED FOR INCOMPLETENESS 4 1610 25
PA/CHESTER COUNTY/3004.00 12 108
LOANS ORIGINATED 36 71 7 133 715 8750 14747 722 2242
APPS APPROVED, NOT ACCEPTED 1 3 1351 499 40
APPS DENIED 3 22 8 4585 3914 746 466
APPS WITHDRAWN 6 17 11858 4154 10
FILES CLOSED FOR INCOMPLETENESS 1 51 161 228 1024
06/02/2014Report Date:
AGGREGATE TABLE 1: DISPOSITION OF LOAN APPLICATIONS, BY LOCATION OF PROPERTY AND TYPE OF LOAN, 2013
MSA/MD: 37964 - PHILADELPHIA, PA
Page 31 of 199
ALL LOANS ON PROPERTY LOCATED IN MSA/MD 3/
CENSUS TRACT OR COUNTY NAME ANDDISPOSITION OF APPLICATION 1/(STATE/COUNTY/TRACT NUMBER) FHA, FSA/RHS & VA Conventional
Refinancings Home ImprovementLoans
Loans on DwellingsFor 5 or More
Families
NonoccupantLoans From
Columns A, B, Cand D
Number Number Number Number Number Number$000's $000's $000's $000's $000's $000's
A B C D E F
Home Purchase Loans
Loans on 1- to 4-Family and Manufactured Home Dwellings
Loans OnManufactured Home
Dwellings FromColumns A, B, C & D
G
Number $000's
%MinPop4/
MedianIncome As
PCT ofMSA/MDMedian

PA/CHESTER COUNTY/3005.01 9 228
LOANS ORIGINATED 46 158 10 32 769 15872 47234 1818 560
APPS APPROVED, NOT ACCEPTED 4 191686 8039
APPS DENIED 3 38 3 21 303 1081 14329 385 440
APPS WITHDRAWN 6 13 11849 4820 130
FILES CLOSED FOR INCOMPLETENESS 11 3749
PA/CHESTER COUNTY/3005.02 12 137
LOANS ORIGINATED 34 96 9 88 1838 8298 20994 941 1469 2 142
APPS APPROVED, NOT ACCEPTED 2 12281 3229 1 31
APPS DENIED 18 4 11 370 4735 60 36 1 10
APPS WITHDRAWN 3 25 2 32 416 719 5384 28 402
FILES CLOSED FOR INCOMPLETENESS 4 1979 100
PA/CHESTER COUNTY/3006.00 25 122
LOANS ORIGINATED 52 151 6 3320 4413 10316 28581 243 4553
APPS APPROVED, NOT ACCEPTED 2 19 1 4452 3741 20 557
APPS DENIED 4 37 7 61 145 792 6791 72 619
APPS WITHDRAWN 4 20 21 162 976 4065 255
FILES CLOSED FOR INCOMPLETENESS 11 22091 347
PA/CHESTER COUNTY/3007.00 27 95
LOANS ORIGINATED 61 92 7 1 2710 1932 9989 13127 431 2500 3535
APPS APPROVED, NOT ACCEPTED 2 13 11 160 254 2036 185
APPS DENIED 10 30 4 133 544 1176 4704 235 1353 2 67
APPS WITHDRAWN 7 22 31258 3544 348
FILES CLOSED FOR INCOMPLETENESS 4 1 1602 130 130
PA/CHESTER COUNTY/3008.00 17 95
LOANS ORIGINATED 44 68 4 1 1211 2089 10330 10323 212 3300 1575
APPS APPROVED, NOT ACCEPTED 11 61 155 4463 868
APPS DENIED 3 15 5 6868 2380 61 907
APPS WITHDRAWN 8 10 12 386 1899 1415 134
FILES CLOSED FOR INCOMPLETENESS 1 5 1162 806 125
06/02/2014Report Date:
AGGREGATE TABLE 1: DISPOSITION OF LOAN APPLICATIONS, BY LOCATION OF PROPERTY AND TYPE OF LOAN, 2013
MSA/MD: 37964 - PHILADELPHIA, PA
Page 32 of 199
ALL LOANS ON PROPERTY LOCATED IN MSA/MD 3/
CENSUS TRACT OR COUNTY NAME ANDDISPOSITION OF APPLICATION 1/(STATE/COUNTY/TRACT NUMBER) FHA, FSA/RHS & VA Conventional
Refinancings Home ImprovementLoans
Loans on DwellingsFor 5 or More
Families
NonoccupantLoans From
Columns A, B, Cand D
Number Number Number Number Number Number$000's $000's $000's $000's $000's $000's
A B C D E F
Home Purchase Loans
Loans on 1- to 4-Family and Manufactured Home Dwellings
Loans OnManufactured Home
Dwellings FromColumns A, B, C & D
G
Number $000's
%MinPop4/
MedianIncome As
PCT ofMSA/MDMedian

PA/CHESTER COUNTY/3009.00 14 91
LOANS ORIGINATED 29 39 5 47 1332 5369 6903 244 491
APPS APPROVED, NOT ACCEPTED 1 6 1 11 198 260 1163 17 198
APPS DENIED 3 18 6 11 133 622 3044 127 204
APPS WITHDRAWN 1 12 12 350 26 2110 140
FILES CLOSED FOR INCOMPLETENESS 3 542
PA/CHESTER COUNTY/3010.00 6 150
LOANS ORIGINATED 96 188 16 2 1817 4234 24245 37320 1912 20604 3523
APPS APPROVED, NOT ACCEPTED 3 27 2 31 289 1137 6983 432 676 1 15
APPS DENIED 7 52 15 2 53 610 1590 11067 429 20170 1141 1 121
APPS WITHDRAWN 8 32 2 37 1548 1750 7407 372 886
FILES CLOSED FOR INCOMPLETENESS 4 15 21 187 871 2117 318
PA/CHESTER COUNTY/3011.00 10 90
LOANS ORIGINATED 17 55 5 2 2017 2603 2406 7293 306 575 2655
APPS APPROVED, NOT ACCEPTED 1 8 2 23 603 125 1137 215 226
APPS DENIED 18 41 106 2293 116
APPS WITHDRAWN 5 8 2 23 352 817 1049 30 313
FILES CLOSED FOR INCOMPLETENESS 7 985
PA/CHESTER COUNTY/3013.00 7 125
LOANS ORIGINATED 39 161 13 1526 6395 9350 33137 572 2243
APPS APPROVED, NOT ACCEPTED 1 12158 3056
APPS DENIED 5 43 2 34 902 966 9092 61 442 1 97
APPS WITHDRAWN 1 20 45 1104 185 4524 140
FILES CLOSED FOR INCOMPLETENESS 13 3077
PA/CHESTER COUNTY/3014.01 10 95
LOANS ORIGINATED 30 31 6 413 2824 6598 4438 430 755
APPS APPROVED, NOT ACCEPTED 5 1 11013 12 320
APPS DENIED 20 15 924 3509 5
APPS WITHDRAWN 3 10 11 328 643 1819 307
FILES CLOSED FOR INCOMPLETENESS 2 31 178 504 465
06/02/2014Report Date:
AGGREGATE TABLE 1: DISPOSITION OF LOAN APPLICATIONS, BY LOCATION OF PROPERTY AND TYPE OF LOAN, 2013
MSA/MD: 37964 - PHILADELPHIA, PA
Page 33 of 199
ALL LOANS ON PROPERTY LOCATED IN MSA/MD 3/
CENSUS TRACT OR COUNTY NAME ANDDISPOSITION OF APPLICATION 1/(STATE/COUNTY/TRACT NUMBER) FHA, FSA/RHS & VA Conventional
Refinancings Home ImprovementLoans
Loans on DwellingsFor 5 or More
Families
NonoccupantLoans From
Columns A, B, Cand D
Number Number Number Number Number Number$000's $000's $000's $000's $000's $000's
A B C D E F
Home Purchase Loans
Loans on 1- to 4-Family and Manufactured Home Dwellings
Loans OnManufactured Home
Dwellings FromColumns A, B, C & D
G
Number $000's
%MinPop4/
MedianIncome As
PCT ofMSA/MDMedian

PA/CHESTER COUNTY/3014.02 7 124
LOANS ORIGINATED 32 114 8 214 3077 7464 21413 941 298
APPS APPROVED, NOT ACCEPTED 3 161 231 739 3544
APPS DENIED 3 38 5 57 1732 121 7653 570 639
APPS WITHDRAWN 1 25 12 708 264 5582 55
FILES CLOSED FOR INCOMPLETENESS 1 11366 1925
PA/CHESTER COUNTY/3015.00 4 139
LOANS ORIGINATED 23 69 8 37 1679 6611 14108 572 490 1 177
APPS APPROVED, NOT ACCEPTED 41 161 1037
APPS DENIED 3 22 1 24 994 602 5647 25 110
APPS WITHDRAWN 2 15 14 862 940 3825 300
FILES CLOSED FOR INCOMPLETENESS 1 6 1 1197 1254 391 135
PA/CHESTER COUNTY/3016.00 4 108
LOANS ORIGINATED 17 68 5 1 610 2287 4015 14536 505 1225 611 1 125
APPS APPROVED, NOT ACCEPTED 1 4 125 928 25
APPS DENIED 6 10 1 14 802 1540 2729 4 125 1 125
APPS WITHDRAWN 4 8 3 1575 2200 199 40 1 58
FILES CLOSED FOR INCOMPLETENESS 2 397
PA/CHESTER COUNTY/3017.00 4 152
LOANS ORIGINATED 11 40 91 495 3452 11025 1214
APPS APPROVED, NOT ACCEPTED 1 3156 658
APPS DENIED 2 14580 3334
APPS WITHDRAWN 3 5 21174 1264 405
FILES CLOSED FOR INCOMPLETENESS 6 1278
PA/CHESTER COUNTY/3018.00 6 199
LOANS ORIGINATED 76 131 12 1 42 846 28976 41467 579 382 831
APPS APPROVED, NOT ACCEPTED 8 15 13249 6168 275
APPS DENIED 4 39 7 31 178 2285 14117 785 433
APPS WITHDRAWN 18 21 21 451 7308 4970 80
FILES CLOSED FOR INCOMPLETENESS 2 10 1648 3189 75
06/02/2014Report Date:
AGGREGATE TABLE 1: DISPOSITION OF LOAN APPLICATIONS, BY LOCATION OF PROPERTY AND TYPE OF LOAN, 2013
MSA/MD: 37964 - PHILADELPHIA, PA
Page 34 of 199
ALL LOANS ON PROPERTY LOCATED IN MSA/MD 3/
CENSUS TRACT OR COUNTY NAME ANDDISPOSITION OF APPLICATION 1/(STATE/COUNTY/TRACT NUMBER) FHA, FSA/RHS & VA Conventional
Refinancings Home ImprovementLoans
Loans on DwellingsFor 5 or More
Families
NonoccupantLoans From
Columns A, B, Cand D
Number Number Number Number Number Number$000's $000's $000's $000's $000's $000's
A B C D E F
Home Purchase Loans
Loans on 1- to 4-Family and Manufactured Home Dwellings
Loans OnManufactured Home
Dwellings FromColumns A, B, C & D
G
Number $000's
%MinPop4/
MedianIncome As
PCT ofMSA/MDMedian

PA/CHESTER COUNTY/3019.00 7 189
LOANS ORIGINATED 52 134 8 53 1109 18584 41262 1701 2620
APPS APPROVED, NOT ACCEPTED 4 10 1 21674 3343 120 838
APPS DENIED 6 21 22069 5839 295
APPS WITHDRAWN 8 20 22012 6527 500
FILES CLOSED FOR INCOMPLETENESS 2 9 2 1996 2540 611 188
PA/CHESTER COUNTY/3020.00 16 200
LOANS ORIGINATED 63 168 10 85 2054 22045 49514 1317 2052
APPS APPROVED, NOT ACCEPTED 3 15 31167 3823 282
APPS DENIED 7 31 1 23 872 1732 14150 3 304
APPS WITHDRAWN 5 22 11390 8548 100
FILES CLOSED FOR INCOMPLETENESS 2 10 1545 3259 602
PA/CHESTER COUNTY/3021.01 27 133
LOANS ORIGINATED 62 141 17 1 149 2573 20678 38087 2277 23660 2495
APPS APPROVED, NOT ACCEPTED 8 16 13000 4220 175
APPS DENIED 12 41 4 22 642 4373 11556 159 457 2 266
APPS WITHDRAWN 10 25 12 465 3780 7204 213
FILES CLOSED FOR INCOMPLETENESS 6 10 12229 2640 240
PA/CHESTER COUNTY/3021.02 18 156
LOANS ORIGINATED 27 80 13 24 1239 8191 16874 1213 240
APPS APPROVED, NOT ACCEPTED 2 4 1780 1068 100
APPS DENIED 2 22 3 1529 3911 115 136
APPS WITHDRAWN 2 11 12 441 365 2611 210
FILES CLOSED FOR INCOMPLETENESS 1 5 1429 1005 429
PA/CHESTER COUNTY/3022.02 22 145
LOANS ORIGINATED 47 152 10 1 58 2047 14834 36821 648 37500 681
APPS APPROVED, NOT ACCEPTED 2 5 1615 1177 85
APPS DENIED 6 33 1 1 32053 8949 6 410 462
APPS WITHDRAWN 14 23 2 21 246 4214 5116 71000 475
FILES CLOSED FOR INCOMPLETENESS 2 11 11 196 590 3164 100
06/02/2014Report Date:
AGGREGATE TABLE 1: DISPOSITION OF LOAN APPLICATIONS, BY LOCATION OF PROPERTY AND TYPE OF LOAN, 2013
MSA/MD: 37964 - PHILADELPHIA, PA
Page 35 of 199
ALL LOANS ON PROPERTY LOCATED IN MSA/MD 3/
CENSUS TRACT OR COUNTY NAME ANDDISPOSITION OF APPLICATION 1/(STATE/COUNTY/TRACT NUMBER) FHA, FSA/RHS & VA Conventional
Refinancings Home ImprovementLoans
Loans on DwellingsFor 5 or More
Families
NonoccupantLoans From
Columns A, B, Cand D
Number Number Number Number Number Number$000's $000's $000's $000's $000's $000's
A B C D E F
Home Purchase Loans
Loans on 1- to 4-Family and Manufactured Home Dwellings
Loans OnManufactured Home
Dwellings FromColumns A, B, C & D
G
Number $000's
%MinPop4/
MedianIncome As
PCT ofMSA/MDMedian

PA/CHESTER COUNTY/3022.03 22 153
LOANS ORIGINATED 62 183 9 1519 4988 16527 39060 923 3164
APPS APPROVED, NOT ACCEPTED 2 22 11 295 481 4511 180
APPS DENIED 5 25 5 63 936 1111 5672 313 1148
APPS WITHDRAWN 6 21 2 32 476 1234 4359 35 515
FILES CLOSED FOR INCOMPLETENESS 2 16 11 269 618 2991 150
PA/CHESTER COUNTY/3022.04 19 141
LOANS ORIGINATED 79 176 11 2214 3313 18162 34663 1167 3836
APPS APPROVED, NOT ACCEPTED 2 19 1 1482 3613 15 100
APPS DENIED 3 38 8 9460 7069 392 1076 1 90
APPS WITHDRAWN 12 26 1 32990 4713 106 630
FILES CLOSED FOR INCOMPLETENESS 8 11 270 1525 183
PA/CHESTER COUNTY/3023.00 14 86
LOANS ORIGINATED 21 39 2 2 143 851 6081 9706 615 10600 3201
APPS APPROVED, NOT ACCEPTED 1 2 1195 540 195
APPS DENIED 4 7864 1744
APPS WITHDRAWN 1 7 11 308 342 1262 50
FILES CLOSED FOR INCOMPLETENESS 2 3660 1112
PA/CHESTER COUNTY/3024.00 50 84
LOANS ORIGINATED 23 60 5 4 98 1731 6043 12603 674 2978 1362
APPS APPROVED, NOT ACCEPTED 1 5 1 1195 1145 150 150
APPS DENIED 6 13 4 1 61624 2212 64 1210 989
APPS WITHDRAWN 2 8 1 11 201 397 1837 1430 98
FILES CLOSED FOR INCOMPLETENESS 2 1136 85
PA/CHESTER COUNTY/3025.00 13 154
LOANS ORIGINATED 35 86 4 3 268 2511 10105 19478 441 5054 5454
APPS APPROVED, NOT ACCEPTED 1 9 1 1 2460 2058 187 500 650
APPS DENIED 4 20 4 2 71 236 922 4779 270 1013 1556
APPS WITHDRAWN 2 11 1 1 2519 2758 204 559 461
FILES CLOSED FOR INCOMPLETENESS 7 1509
06/02/2014Report Date:
AGGREGATE TABLE 1: DISPOSITION OF LOAN APPLICATIONS, BY LOCATION OF PROPERTY AND TYPE OF LOAN, 2013
MSA/MD: 37964 - PHILADELPHIA, PA
Page 36 of 199
ALL LOANS ON PROPERTY LOCATED IN MSA/MD 3/
CENSUS TRACT OR COUNTY NAME ANDDISPOSITION OF APPLICATION 1/(STATE/COUNTY/TRACT NUMBER) FHA, FSA/RHS & VA Conventional
Refinancings Home ImprovementLoans
Loans on DwellingsFor 5 or More
Families
NonoccupantLoans From
Columns A, B, Cand D
Number Number Number Number Number Number$000's $000's $000's $000's $000's $000's
A B C D E F
Home Purchase Loans
Loans on 1- to 4-Family and Manufactured Home Dwellings
Loans OnManufactured Home
Dwellings FromColumns A, B, C & D
G
Number $000's
%MinPop4/
MedianIncome As
PCT ofMSA/MDMedian

PA/CHESTER COUNTY/3026.00 36 43
LOANS ORIGINATED 28 42 6 6 327 1749 6850 7722 829 47765 6720
APPS APPROVED, NOT ACCEPTED 5 1 11015 226 133
APPS DENIED 4 13 3 8709 2233 127 1160
APPS WITHDRAWN 3 19 1 1 7494 3158 100 26000 1291
FILES CLOSED FOR INCOMPLETENESS 2 7 2485 1164 278
PA/CHESTER COUNTY/3027.02 24 101
LOANS ORIGINATED 28 87 8 1012 3038 7471 17804 543 1442
APPS APPROVED, NOT ACCEPTED 1 62 407 305 1493
APPS DENIED 1 24233 4669
APPS WITHDRAWN 4 21 1 1754 4198 108 108
FILES CLOSED FOR INCOMPLETENESS 1 4 11 239 160 738 160
PA/CHESTER COUNTY/3027.03 7 174
LOANS ORIGINATED 68 99 10 42 655 22383 24641 1025 1123
APPS APPROVED, NOT ACCEPTED 4 6 1978 1511 50
APPS DENIED 4 20 6 11 352 1705 4747 220 341
APPS WITHDRAWN 10 23 1 12888 6655 475 165
FILES CLOSED FOR INCOMPLETENESS 2 5427 1664
PA/CHESTER COUNTY/3027.04 10 175
LOANS ORIGINATED 58 152 14 610 3218 16613 35364 1972 1267
APPS APPROVED, NOT ACCEPTED 3 18 1869 4296 153
APPS DENIED 4 30 2 21238 6811 30 284
APPS WITHDRAWN 7 15 12 827 1936 3594 100
FILES CLOSED FOR INCOMPLETENESS 7 22068 596
PA/CHESTER COUNTY/3027.05 16 125
LOANS ORIGINATED 30 71 8 13 1010 9311 17238 593 120
APPS APPROVED, NOT ACCEPTED 1 5 1600 1519 165
APPS DENIED 4 11 2 11 293 1138 2634 76 375
APPS WITHDRAWN 2 13518 2987
FILES CLOSED FOR INCOMPLETENESS 1 2 1500 449 95
06/02/2014Report Date:
AGGREGATE TABLE 1: DISPOSITION OF LOAN APPLICATIONS, BY LOCATION OF PROPERTY AND TYPE OF LOAN, 2013
MSA/MD: 37964 - PHILADELPHIA, PA
Page 37 of 199
ALL LOANS ON PROPERTY LOCATED IN MSA/MD 3/
CENSUS TRACT OR COUNTY NAME ANDDISPOSITION OF APPLICATION 1/(STATE/COUNTY/TRACT NUMBER) FHA, FSA/RHS & VA Conventional
Refinancings Home ImprovementLoans
Loans on DwellingsFor 5 or More
Families
NonoccupantLoans From
Columns A, B, Cand D
Number Number Number Number Number Number$000's $000's $000's $000's $000's $000's
A B C D E F
Home Purchase Loans
Loans on 1- to 4-Family and Manufactured Home Dwellings
Loans OnManufactured Home
Dwellings FromColumns A, B, C & D
G
Number $000's
%MinPop4/
MedianIncome As
PCT ofMSA/MDMedian

PA/CHESTER COUNTY/3027.06 10 136
LOANS ORIGINATED 54 102 8 711 3382 16876 22417 550 1179
APPS APPROVED, NOT ACCEPTED 2 10 2 1319 2589 55 145 1 29
APPS DENIED 3 27 4 11476 5982 390 145
APPS WITHDRAWN 4 14 11 251 849 3119 214
FILES CLOSED FOR INCOMPLETENESS 4 740
PA/CHESTER COUNTY/3028.02 5 180
LOANS ORIGINATED 57 124 14 62 821 21566 35169 2262 1328
APPS APPROVED, NOT ACCEPTED 4 10 11586 2668 417
APPS DENIED 3 20 1 2969 5596 20 345
APPS WITHDRAWN 9 262818 8117
FILES CLOSED FOR INCOMPLETENESS 9 2445
PA/CHESTER COUNTY/3028.03 1 109
LOANS ORIGINATED 42 29 2 46978 4473 35 1007
APPS APPROVED, NOT ACCEPTED 4 4630 747
APPS DENIED 3 6 1 11 309 321 1344 25 147
APPS WITHDRAWN 6 6 11119 960 30
FILES CLOSED FOR INCOMPLETENESS 1 12
PA/CHESTER COUNTY/3028.04 7 202
LOANS ORIGINATED 22 79 68024 27261 1248
APPS APPROVED, NOT ACCEPTED 1 4620 2386
APPS DENIED 3 15 21613 5596 20
APPS WITHDRAWN 3 6 21097 1971 45
FILES CLOSED FOR INCOMPLETENESS 6 22323 520
PA/CHESTER COUNTY/3028.05 15 102
LOANS ORIGINATED 61 160 9 2715 2693 12571 27983 1096 3227
APPS APPROVED, NOT ACCEPTED 3 13 1 22 297 391 2375 6 303
APPS DENIED 5 42 2 3924 7680 141 439
APPS WITHDRAWN 6 18 31 109 1430 2898 402
FILES CLOSED FOR INCOMPLETENESS 3 10 1 2300 1496 30 194
06/02/2014Report Date:
AGGREGATE TABLE 1: DISPOSITION OF LOAN APPLICATIONS, BY LOCATION OF PROPERTY AND TYPE OF LOAN, 2013
MSA/MD: 37964 - PHILADELPHIA, PA
Page 38 of 199
ALL LOANS ON PROPERTY LOCATED IN MSA/MD 3/
CENSUS TRACT OR COUNTY NAME ANDDISPOSITION OF APPLICATION 1/(STATE/COUNTY/TRACT NUMBER) FHA, FSA/RHS & VA Conventional
Refinancings Home ImprovementLoans
Loans on DwellingsFor 5 or More
Families
NonoccupantLoans From
Columns A, B, Cand D
Number Number Number Number Number Number$000's $000's $000's $000's $000's $000's
A B C D E F
Home Purchase Loans
Loans on 1- to 4-Family and Manufactured Home Dwellings
Loans OnManufactured Home
Dwellings FromColumns A, B, C & D
G
Number $000's
%MinPop4/
MedianIncome As
PCT ofMSA/MDMedian

PA/CHESTER COUNTY/3029.01 13 156
LOANS ORIGINATED 59 102 10 1 87 2330 18071 25342 1063 550 1853
APPS APPROVED, NOT ACCEPTED 4 121 216 1601 2087
APPS DENIED 3 19 3 11 261 1148 4233 320 140
APPS WITHDRAWN 6 16 1 21 245 1836 4488 125 304
FILES CLOSED FOR INCOMPLETENESS 9 2284
PA/CHESTER COUNTY/3029.02 9 161
LOANS ORIGINATED 61 142 12 75 1637 19357 33880 2193 1164
APPS APPROVED, NOT ACCEPTED 4 13 21375 3164 457
APPS DENIED 3 35 2 11 318 806 8632 61 237
APPS WITHDRAWN 7 12 12 668 2341 2747 417
FILES CLOSED FOR INCOMPLETENESS 101 284 2269
PA/CHESTER COUNTY/3030.00 14 180
LOANS ORIGINATED 32 85 5 21 295 12141 25024 652 367
APPS APPROVED, NOT ACCEPTED 3 5 11468 1809 280
APPS DENIED 2 17 4 2592 5746 662 667
APPS WITHDRAWN 8 16 11 568 2952 4585 250
FILES CLOSED FOR INCOMPLETENESS 1 8 2220 3269 823
PA/CHESTER COUNTY/3031.00 9 230
LOANS ORIGINATED 36 109 9 62 829 13998 35301 1389 1276
APPS APPROVED, NOT ACCEPTED 4 51600 1671
APPS DENIED 20 5 17146 233 387
APPS WITHDRAWN 4 22 2 11477 6788 58 218
FILES CLOSED FOR INCOMPLETENESS 1 8 1300 2556 371
PA/CHESTER COUNTY/3033.01 29 195
LOANS ORIGINATED 28 72 3 25 1235 10354 21540 244 425
APPS APPROVED, NOT ACCEPTED 1 71 159 410 1867
APPS DENIED 2 14 2471 4126 363
APPS WITHDRAWN 3 12 1 21 244 714 3706 40 234
FILES CLOSED FOR INCOMPLETENESS 1 9 1728 2587 269
06/02/2014Report Date:
AGGREGATE TABLE 1: DISPOSITION OF LOAN APPLICATIONS, BY LOCATION OF PROPERTY AND TYPE OF LOAN, 2013
MSA/MD: 37964 - PHILADELPHIA, PA
Page 39 of 199
ALL LOANS ON PROPERTY LOCATED IN MSA/MD 3/
CENSUS TRACT OR COUNTY NAME ANDDISPOSITION OF APPLICATION 1/(STATE/COUNTY/TRACT NUMBER) FHA, FSA/RHS & VA Conventional
Refinancings Home ImprovementLoans
Loans on DwellingsFor 5 or More
Families
NonoccupantLoans From
Columns A, B, Cand D
Number Number Number Number Number Number$000's $000's $000's $000's $000's $000's
A B C D E F
Home Purchase Loans
Loans on 1- to 4-Family and Manufactured Home Dwellings
Loans OnManufactured Home
Dwellings FromColumns A, B, C & D
G
Number $000's
%MinPop4/
MedianIncome As
PCT ofMSA/MDMedian

PA/CHESTER COUNTY/3033.02 8 167
LOANS ORIGINATED 44 136 14 57 2462 13876 38450 1261 901
APPS APPROVED, NOT ACCEPTED 2 121 355 704 2661
APPS DENIED 5 40 8 32265 13920 769 532
APPS WITHDRAWN 7 22 11 219 2834 7456 55
FILES CLOSED FOR INCOMPLETENESS 2 17 2430 4356 398
PA/CHESTER COUNTY/3034.01 60 92
LOANS ORIGINATED 19 61 4 3 88 1690 3182 8925 207 925 759
APPS APPROVED, NOT ACCEPTED 2 9 1202 1465 202
APPS DENIED 3 17 5 41 173 669 2579 125 218
APPS WITHDRAWN 4 14 12 352 782 2070 135
FILES CLOSED FOR INCOMPLETENESS 1 7 1200 1126 165
PA/CHESTER COUNTY/3034.02 51 77
LOANS ORIGINATED 7 29 1 42 386 1493 6505 403 1057
APPS APPROVED, NOT ACCEPTED 1 1117 176
APPS DENIED 14 3 71 240 3677 77 779
APPS WITHDRAWN 1 1270 308
FILES CLOSED FOR INCOMPLETENESS 1 2 1350 443 191
PA/CHESTER COUNTY/3035.01 11 165
LOANS ORIGINATED 73 116 16 1210 3059 26552 30540 2320 2792
APPS APPROVED, NOT ACCEPTED 5 9 12069 2903 20
APPS DENIED 11 35 7 24552 12097 313 344
APPS WITHDRAWN 7 18 1 11 285 2541 6184 30 140
FILES CLOSED FOR INCOMPLETENESS 1 8 2500 3053 630
PA/CHESTER COUNTY/3035.02 11 199
LOANS ORIGINATED 23 76 7 81 417 7424 25448 759 2030
APPS APPROVED, NOT ACCEPTED 2 61 419 379 1128
APPS DENIED 2 27 2 11 226 349 8439 475 59
APPS WITHDRAWN 5 10 1 11723 2547 308 56
FILES CLOSED FOR INCOMPLETENESS 8 2588
06/02/2014Report Date:
AGGREGATE TABLE 1: DISPOSITION OF LOAN APPLICATIONS, BY LOCATION OF PROPERTY AND TYPE OF LOAN, 2013
MSA/MD: 37964 - PHILADELPHIA, PA
Page 40 of 199
ALL LOANS ON PROPERTY LOCATED IN MSA/MD 3/
CENSUS TRACT OR COUNTY NAME ANDDISPOSITION OF APPLICATION 1/(STATE/COUNTY/TRACT NUMBER) FHA, FSA/RHS & VA Conventional
Refinancings Home ImprovementLoans
Loans on DwellingsFor 5 or More
Families
NonoccupantLoans From
Columns A, B, Cand D
Number Number Number Number Number Number$000's $000's $000's $000's $000's $000's
A B C D E F
Home Purchase Loans
Loans on 1- to 4-Family and Manufactured Home Dwellings
Loans OnManufactured Home
Dwellings FromColumns A, B, C & D
G
Number $000's
%MinPop4/
MedianIncome As
PCT ofMSA/MDMedian

PA/CHESTER COUNTY/3038.01 8 140
LOANS ORIGINATED 30 82 9 32 554 6388 21672 784 400 5 220
APPS APPROVED, NOT ACCEPTED 9 10 3494 2448 730 9 309
APPS DENIED 11 21 1 31 290 622 5960 5 334 9 272
APPS WITHDRAWN 3 11 14 901 678 2779 6 1 137
FILES CLOSED FOR INCOMPLETENESS 7 2063
PA/CHESTER COUNTY/3038.02 9 144
LOANS ORIGINATED 105 276 19 523 6186 32564 66011 1606 932
APPS APPROVED, NOT ACCEPTED 4 17 23 760 1028 4251 282
APPS DENIED 9 77 3 13 780 2500 19321 148 200
APPS WITHDRAWN 10 41 14 1109 3049 11998 5
FILES CLOSED FOR INCOMPLETENESS 3 16 11 244 844 3468 100
PA/CHESTER COUNTY/3039.01 11 211
LOANS ORIGINATED 49 132 13 26 1800 17509 37726 1982 296
APPS APPROVED, NOT ACCEPTED 9 113751 2886
APPS DENIED 9 21 64132 6095 195
APPS WITHDRAWN 8 20 13068 4817 75
FILES CLOSED FOR INCOMPLETENESS 11 13581 400
PA/CHESTER COUNTY/3039.02 7 167
LOANS ORIGINATED 69 161 10 112 701 20798 41870 857 2367
APPS APPROVED, NOT ACCEPTED 3 13 1 1859 4862 100 204
APPS DENIED 5 39 5 11427 11127 453 138
APPS WITHDRAWN 9 182 582 3205 4887
FILES CLOSED FOR INCOMPLETENESS 3 9 1962 2142 15
PA/CHESTER COUNTY/3040.00 28 155
LOANS ORIGINATED 57 135 2 198 2107 13019 29103 65 2638 1 23
APPS APPROVED, NOT ACCEPTED 2 8 1 21 393 470 1488 50 290
APPS DENIED 8 35 2 81 226 1801 8518 34 1693 1 42
APPS WITHDRAWN 4 23 2 3933 5273 30 870
FILES CLOSED FOR INCOMPLETENESS 3 7 11 329 847 1846 245
06/02/2014Report Date:
AGGREGATE TABLE 1: DISPOSITION OF LOAN APPLICATIONS, BY LOCATION OF PROPERTY AND TYPE OF LOAN, 2013
MSA/MD: 37964 - PHILADELPHIA, PA
Page 41 of 199
ALL LOANS ON PROPERTY LOCATED IN MSA/MD 3/
CENSUS TRACT OR COUNTY NAME ANDDISPOSITION OF APPLICATION 1/(STATE/COUNTY/TRACT NUMBER) FHA, FSA/RHS & VA Conventional
Refinancings Home ImprovementLoans
Loans on DwellingsFor 5 or More
Families
NonoccupantLoans From
Columns A, B, Cand D
Number Number Number Number Number Number$000's $000's $000's $000's $000's $000's
A B C D E F
Home Purchase Loans
Loans on 1- to 4-Family and Manufactured Home Dwellings
Loans OnManufactured Home
Dwellings FromColumns A, B, C & D
G
Number $000's
%MinPop4/
MedianIncome As
PCT ofMSA/MDMedian

PA/CHESTER COUNTY/3041.01 24 80
LOANS ORIGINATED 27 67 6 125 975 4580 9441 534 1327
APPS APPROVED, NOT ACCEPTED 1 12 4210 2022 600
APPS DENIED 1 27 5 22 340 214 4104 91 183
APPS WITHDRAWN 4 16 3 41 211 453 2157 300 415
FILES CLOSED FOR INCOMPLETENESS 1 8 1 21 193 99 1216 160 217
PA/CHESTER COUNTY/3041.02 24 77
LOANS ORIGINATED 24 59 2 913 2229 4111 9322 35 1203
APPS APPROVED, NOT ACCEPTED 1 5 1 2223 658 14 211
APPS DENIED 2 18 3 7214 2229 46 711
APPS WITHDRAWN 3 10 21 177 580 1109 75
FILES CLOSED FOR INCOMPLETENESS 2 8 2336 1544 371
PA/CHESTER COUNTY/3042.01 20 114
LOANS ORIGINATED 69 163 19 1633 6798 13382 25248 1299 2221
APPS APPROVED, NOT ACCEPTED 2 10 2 22 409 587 1745 123 318
APPS DENIED 8 44 9 64 878 1434 7161 207 754 1 34
APPS WITHDRAWN 7 38 1 31 216 1718 7050 100 464
FILES CLOSED FOR INCOMPLETENESS 1 20 1 32 407 252 3862 225 518
PA/CHESTER COUNTY/3043.00 7 149
LOANS ORIGINATED 187 206 11 1335 11179 56678 49352 1410 2393
APPS APPROVED, NOT ACCEPTED 21 202 632 7473 4408
APPS DENIED 17 47 75 1287 5066 13185 172 2 46
APPS WITHDRAWN 50 38 5 26 2012 16933 9048 163 723
FILES CLOSED FOR INCOMPLETENESS 8 20 1 32 509 2233 5628 71 895
PA/CHESTER COUNTY/3044.03 12 129
LOANS ORIGINATED 55 122 11 259 1912 10925 23711 942 3525
APPS APPROVED, NOT ACCEPTED 2 7 1420 1213 9
APPS DENIED 6 32 6 4975 5319 352 464
APPS WITHDRAWN 3 20 1 2534 3946 35 293
FILES CLOSED FOR INCOMPLETENESS 1 3 1194 654 167
06/02/2014Report Date:
AGGREGATE TABLE 1: DISPOSITION OF LOAN APPLICATIONS, BY LOCATION OF PROPERTY AND TYPE OF LOAN, 2013
MSA/MD: 37964 - PHILADELPHIA, PA
Page 42 of 199
ALL LOANS ON PROPERTY LOCATED IN MSA/MD 3/
CENSUS TRACT OR COUNTY NAME ANDDISPOSITION OF APPLICATION 1/(STATE/COUNTY/TRACT NUMBER) FHA, FSA/RHS & VA Conventional
Refinancings Home ImprovementLoans
Loans on DwellingsFor 5 or More
Families
NonoccupantLoans From
Columns A, B, Cand D
Number Number Number Number Number Number$000's $000's $000's $000's $000's $000's
A B C D E F
Home Purchase Loans
Loans on 1- to 4-Family and Manufactured Home Dwellings
Loans OnManufactured Home
Dwellings FromColumns A, B, C & D
G
Number $000's
%MinPop4/
MedianIncome As
PCT ofMSA/MDMedian
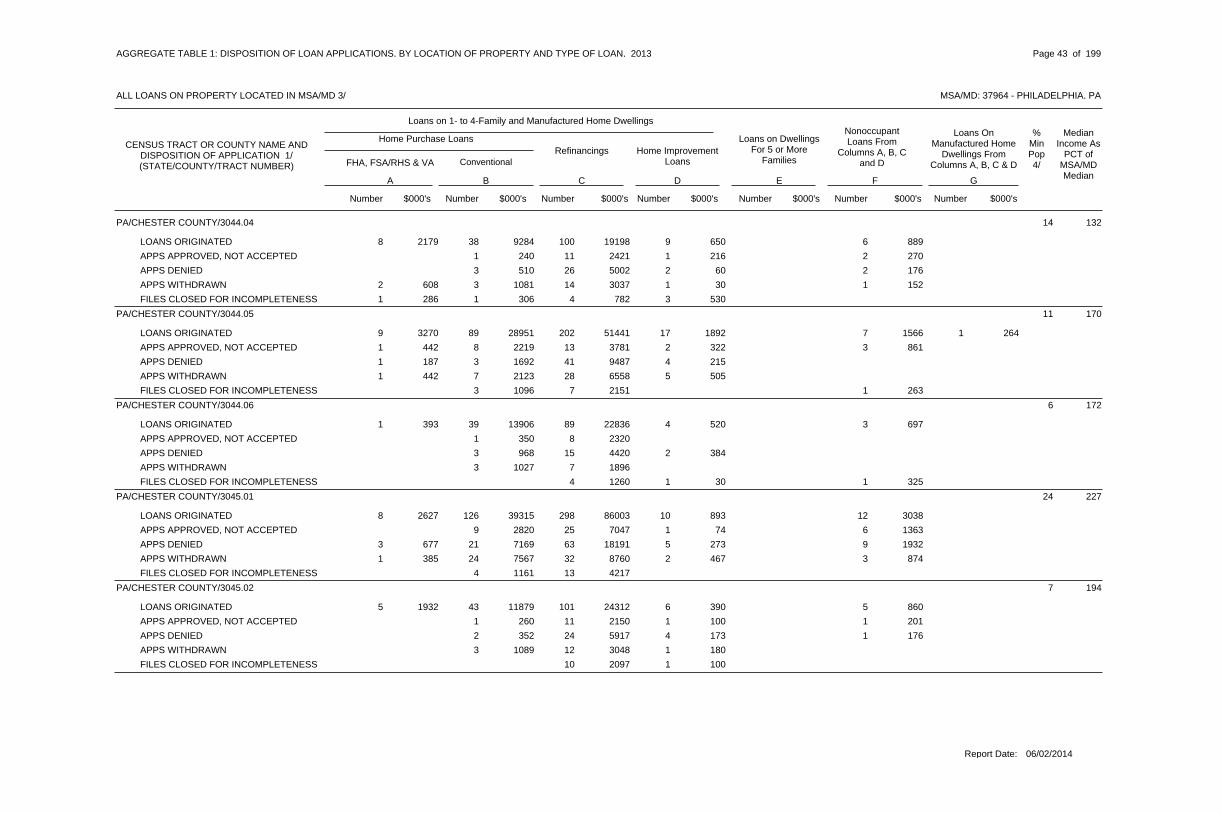
PA/CHESTER COUNTY/3044.04 14 132
LOANS ORIGINATED 38 100 9 68 2179 9284 19198 650 889
APPS APPROVED, NOT ACCEPTED 1 11 1 2240 2421 216 270
APPS DENIED 3 26 2 2510 5002 60 176
APPS WITHDRAWN 3 14 1 12 608 1081 3037 30 152
FILES CLOSED FOR INCOMPLETENESS 1 4 31 286 306 782 530
PA/CHESTER COUNTY/3044.05 11 170
LOANS ORIGINATED 89 202 17 79 3270 28951 51441 1892 1566 1 264
APPS APPROVED, NOT ACCEPTED 8 13 2 31 442 2219 3781 322 861
APPS DENIED 3 41 41 187 1692 9487 215
APPS WITHDRAWN 7 28 51 442 2123 6558 505
FILES CLOSED FOR INCOMPLETENESS 3 7 11096 2151 263
PA/CHESTER COUNTY/3044.06 6 172
LOANS ORIGINATED 39 89 4 31 393 13906 22836 520 697
APPS APPROVED, NOT ACCEPTED 1 8350 2320
APPS DENIED 3 15 2968 4420 384
APPS WITHDRAWN 3 71027 1896
FILES CLOSED FOR INCOMPLETENESS 4 1 11260 30 325
PA/CHESTER COUNTY/3045.01 24 227
LOANS ORIGINATED 126 298 10 128 2627 39315 86003 893 3038
APPS APPROVED, NOT ACCEPTED 9 25 1 62820 7047 74 1363
APPS DENIED 21 63 5 93 677 7169 18191 273 1932
APPS WITHDRAWN 24 32 2 31 385 7567 8760 467 874
FILES CLOSED FOR INCOMPLETENESS 4 131161 4217
PA/CHESTER COUNTY/3045.02 7 194
LOANS ORIGINATED 43 101 6 55 1932 11879 24312 390 860
APPS APPROVED, NOT ACCEPTED 1 11 1 1260 2150 100 201
APPS DENIED 2 24 4 1352 5917 173 176
APPS WITHDRAWN 3 12 11089 3048 180
FILES CLOSED FOR INCOMPLETENESS 10 12097 100
06/02/2014Report Date:
AGGREGATE TABLE 1: DISPOSITION OF LOAN APPLICATIONS, BY LOCATION OF PROPERTY AND TYPE OF LOAN, 2013
MSA/MD: 37964 - PHILADELPHIA, PA
Page 43 of 199
ALL LOANS ON PROPERTY LOCATED IN MSA/MD 3/
CENSUS TRACT OR COUNTY NAME ANDDISPOSITION OF APPLICATION 1/(STATE/COUNTY/TRACT NUMBER) FHA, FSA/RHS & VA Conventional
Refinancings Home ImprovementLoans
Loans on DwellingsFor 5 or More
Families
NonoccupantLoans From
Columns A, B, Cand D
Number Number Number Number Number Number$000's $000's $000's $000's $000's $000's
A B C D E F
Home Purchase Loans
Loans on 1- to 4-Family and Manufactured Home Dwellings
Loans OnManufactured Home
Dwellings FromColumns A, B, C & D
G
Number $000's
%MinPop4/
MedianIncome As
PCT ofMSA/MDMedian

PA/CHESTER COUNTY/3046.00 7 165
LOANS ORIGINATED 47 94 9 613 4390 15607 27132 1110 863 1 136
APPS APPROVED, NOT ACCEPTED 3 9824 2756
APPS DENIED 5 24 4 21 417 1367 8878 333 355 1 132
APPS WITHDRAWN 2 19 2 1615 5876 800 146
FILES CLOSED FOR INCOMPLETENESS 4 8 11147 2542 236
PA/CHESTER COUNTY/3049.00 5 113
LOANS ORIGINATED 41 97 10 416 4398 7849 19036 926 1224 10 650
APPS APPROVED, NOT ACCEPTED 13 7 1 21293 1496 8 367 10 415
APPS DENIED 26 32 7 13 583 2285 6657 542 6 23 1224
APPS WITHDRAWN 13 12 483 2658 140
FILES CLOSED FOR INCOMPLETENESS 1 5 11 147 162 1066 11
PA/CHESTER COUNTY/3050.00 7 108
LOANS ORIGINATED 12 34 5 35 882 1952 4812 272 425
APPS APPROVED, NOT ACCEPTED 2 302
APPS DENIED 3 61 195 71 837 4 110
APPS WITHDRAWN 3 5 1 21 178 616 775 200 240
FILES CLOSED FOR INCOMPLETENESS 21 167 301
PA/CHESTER COUNTY/3051.01 7 117
LOANS ORIGINATED 18 88 7 610 1979 3248 14453 800 845 4 327
APPS APPROVED, NOT ACCEPTED 7 20 11 198 756 2764 168 9 495
APPS DENIED 6 29 53 604 874 5427 115
APPS WITHDRAWN 1 16 22 369 299 2905 16
FILES CLOSED FOR INCOMPLETENESS 7 11155 121
PA/CHESTER COUNTY/3051.02 10 113
LOANS ORIGINATED 20 90 6 715 3655 3569 16139 467 1380 1 47
APPS APPROVED, NOT ACCEPTED 2 121 158 91 2100 2 91
APPS DENIED 8 37 73 543 1705 6491 173 6 850
APPS WITHDRAWN 2 25 13 769 294 4889 60 1 44
FILES CLOSED FOR INCOMPLETENESS 1 727 963 1 27
06/02/2014Report Date:
AGGREGATE TABLE 1: DISPOSITION OF LOAN APPLICATIONS, BY LOCATION OF PROPERTY AND TYPE OF LOAN, 2013
MSA/MD: 37964 - PHILADELPHIA, PA
Page 44 of 199
ALL LOANS ON PROPERTY LOCATED IN MSA/MD 3/
CENSUS TRACT OR COUNTY NAME ANDDISPOSITION OF APPLICATION 1/(STATE/COUNTY/TRACT NUMBER) FHA, FSA/RHS & VA Conventional
Refinancings Home ImprovementLoans
Loans on DwellingsFor 5 or More
Families
NonoccupantLoans From
Columns A, B, Cand D
Number Number Number Number Number Number$000's $000's $000's $000's $000's $000's
A B C D E F
Home Purchase Loans
Loans on 1- to 4-Family and Manufactured Home Dwellings
Loans OnManufactured Home
Dwellings FromColumns A, B, C & D
G
Number $000's
%MinPop4/
MedianIncome As
PCT ofMSA/MDMedian

PA/CHESTER COUNTY/3053.00 36 95
LOANS ORIGINATED 74 146 13 1655 11235 11910 23242 593 1951 1 122
APPS APPROVED, NOT ACCEPTED 5 16 35 945 763 2941 28
APPS DENIED 12 62 9 79 1591 1877 9282 123 878 2 124
APPS WITHDRAWN 9 47 3 411 2053 1330 7104 59 674 2 206
FILES CLOSED FOR INCOMPLETENESS 1 18 15 877 310 3041 128
PA/CHESTER COUNTY/3054.00 62 56
LOANS ORIGINATED 15 33 1 1721 4162 1606 4208 225 1337
APPS APPROVED, NOT ACCEPTED 5 1 3626 38 201
APPS DENIED 5 13 1 411 2161 412 1822 4 225
APPS WITHDRAWN 7 13 510 1904 985 1523 485
FILES CLOSED FOR INCOMPLETENESS 5 1 2446 7 121
PA/CHESTER COUNTY/3055.00 82 49
LOANS ORIGINATED 5 20 2 4 106 552 468 1687 26 1712 852
APPS APPROVED, NOT ACCEPTED 1 4 2 379 323 35 223 1 20
APPS DENIED 1 17 4 83 247 67 1670 165 656
APPS WITHDRAWN 4 12 297 421 88
FILES CLOSED FOR INCOMPLETENESS 5 3772 251
PA/CHESTER COUNTY/3056.00 86 46
LOANS ORIGINATED 3 24 2 1 143 286 486 2217 25 509 991
APPS APPROVED, NOT ACCEPTED 4 1350 67
APPS DENIED 21 5 91911 62 673
APPS WITHDRAWN 1 4 1 237 429 29 85
FILES CLOSED FOR INCOMPLETENESS 1 6 540 514 384
PA/CHESTER COUNTY/3057.00 60 107
LOANS ORIGINATED 8 36 4 99 986 900 4220 101 996
APPS APPROVED, NOT ACCEPTED 1 8 3187 726 219
APPS DENIED 1 16 1 32 254 62 2098 2 518
APPS WITHDRAWN 3 4 3301 615 335
FILES CLOSED FOR INCOMPLETENESS 1 3 11 144 133 255 80
06/02/2014Report Date:
AGGREGATE TABLE 1: DISPOSITION OF LOAN APPLICATIONS, BY LOCATION OF PROPERTY AND TYPE OF LOAN, 2013
MSA/MD: 37964 - PHILADELPHIA, PA
Page 45 of 199
ALL LOANS ON PROPERTY LOCATED IN MSA/MD 3/
CENSUS TRACT OR COUNTY NAME ANDDISPOSITION OF APPLICATION 1/(STATE/COUNTY/TRACT NUMBER) FHA, FSA/RHS & VA Conventional
Refinancings Home ImprovementLoans
Loans on DwellingsFor 5 or More
Families
NonoccupantLoans From
Columns A, B, Cand D
Number Number Number Number Number Number$000's $000's $000's $000's $000's $000's
A B C D E F
Home Purchase Loans
Loans on 1- to 4-Family and Manufactured Home Dwellings
Loans OnManufactured Home
Dwellings FromColumns A, B, C & D
G
Number $000's
%MinPop4/
MedianIncome As
PCT ofMSA/MDMedian

PA/CHESTER COUNTY/3060.00 18 116
LOANS ORIGINATED 49 189 11 1038 9146 10079 37013 695 2167 1 150
APPS APPROVED, NOT ACCEPTED 27 1 36215 25 543
APPS DENIED 7 62 13 45 1202 1845 11129 654 383
APPS WITHDRAWN 8 41 16 1560 1570 10883 163
FILES CLOSED FOR INCOMPLETENESS 2 14 13 820 361 3100 80
PA/CHESTER COUNTY/3063.00 43 85
LOANS ORIGINATED 15 41 6 711 1840 2780 6361 230 948
APPS APPROVED, NOT ACCEPTED 9 2 11 162 1989 24 219
APPS DENIED 1 15 3 278 2359 111 281
APPS WITHDRAWN 1 6 11 193 77 1087 173
FILES CLOSED FOR INCOMPLETENESS 7 1163
PA/CHESTER COUNTY/3065.01 15 221
LOANS ORIGINATED 37 125 12 46 1639 11451 33149 866 888
APPS APPROVED, NOT ACCEPTED 2 11608 3297
APPS DENIED 5 38 3 31737 10366 105 568
APPS WITHDRAWN 4 12 11568 3638 139
FILES CLOSED FOR INCOMPLETENESS 5 7 11615 1426 50
PA/CHESTER COUNTY/3065.03 53 67
LOANS ORIGINATED 9 36 2 54 1011 2471 6760 70 998
APPS APPROVED, NOT ACCEPTED 1 3 1300 672 233
APPS DENIED 1 10 344 2452 360 1 44
APPS WITHDRAWN 1 2 1356 357 25
FILES CLOSED FOR INCOMPLETENESS 1 1184 50
PA/CHESTER COUNTY/3065.04 37 177
LOANS ORIGINATED 50 90 4 67 1881 13560 23137 801 1530 1 116
APPS APPROVED, NOT ACCEPTED 6 10 11479 2386 120 1 67
APPS DENIED 5 33 3 13 853 1455 10225 325 286 1 84
APPS WITHDRAWN 4 11 11 289 772 3875 371
FILES CLOSED FOR INCOMPLETENESS 1 5 1346 1147 241
06/02/2014Report Date:
AGGREGATE TABLE 1: DISPOSITION OF LOAN APPLICATIONS, BY LOCATION OF PROPERTY AND TYPE OF LOAN, 2013
MSA/MD: 37964 - PHILADELPHIA, PA
Page 46 of 199
ALL LOANS ON PROPERTY LOCATED IN MSA/MD 3/
CENSUS TRACT OR COUNTY NAME ANDDISPOSITION OF APPLICATION 1/(STATE/COUNTY/TRACT NUMBER) FHA, FSA/RHS & VA Conventional
Refinancings Home ImprovementLoans
Loans on DwellingsFor 5 or More
Families
NonoccupantLoans From
Columns A, B, Cand D
Number Number Number Number Number Number$000's $000's $000's $000's $000's $000's
A B C D E F
Home Purchase Loans
Loans on 1- to 4-Family and Manufactured Home Dwellings
Loans OnManufactured Home
Dwellings FromColumns A, B, C & D
G
Number $000's
%MinPop4/
MedianIncome As
PCT ofMSA/MDMedian

PA/CHESTER COUNTY/3066.00 6 158
LOANS ORIGINATED 38 93 2 23 1094 12590 24940 375 492
APPS APPROVED, NOT ACCEPTED 2 6629 1338
APPS DENIED 5 17 1 12023 4003 50 225
APPS WITHDRAWN 6 112311 3222
FILES CLOSED FOR INCOMPLETENESS 1 4480 831
PA/CHESTER COUNTY/3067.00 8 157
LOANS ORIGINATED 28 107 7 37 2122 8226 26428 353 507
APPS APPROVED, NOT ACCEPTED 7 1 11525 3 391
APPS DENIED 3 28 3 21 161 783 8482 194 660
APPS WITHDRAWN 3 101 245 868 3064
FILES CLOSED FOR INCOMPLETENESS 41 358 990
PA/CHESTER COUNTY/3068.00 10 120
LOANS ORIGINATED 13 38 2 34 1167 2721 7891 200 431
APPS APPROVED, NOT ACCEPTED 7 1 11429 19 191
APPS DENIED 1 12148 2828 1 143
APPS WITHDRAWN 4 10 11 153 770 2327 198
FILES CLOSED FOR INCOMPLETENESS 2 409
PA/CHESTER COUNTY/3069.00 8 162
LOANS ORIGINATED 58 166 15 413 3692 17389 39874 1944 507
APPS APPROVED, NOT ACCEPTED 6 13 31 186 1693 2966 339
APPS DENIED 6 36 5 12 746 1624 9087 427 285
APPS WITHDRAWN 6 231 298 1826 5964
FILES CLOSED FOR INCOMPLETENESS 13 3093
PA/CHESTER COUNTY/3070.00 14 127
LOANS ORIGINATED 36 100 10 1 49 2677 7516 23137 860 2800 679 2 119
APPS APPROVED, NOT ACCEPTED 4 8 1636 1534 128 2 115
APPS DENIED 7 27 9 12 484 1187 6127 327 225 4 214
APPS WITHDRAWN 3 11 11 206 438 2348 40 1 64
FILES CLOSED FOR INCOMPLETENESS 2 8361 1742
06/02/2014Report Date:
AGGREGATE TABLE 1: DISPOSITION OF LOAN APPLICATIONS, BY LOCATION OF PROPERTY AND TYPE OF LOAN, 2013
MSA/MD: 37964 - PHILADELPHIA, PA
Page 47 of 199
ALL LOANS ON PROPERTY LOCATED IN MSA/MD 3/
CENSUS TRACT OR COUNTY NAME ANDDISPOSITION OF APPLICATION 1/(STATE/COUNTY/TRACT NUMBER) FHA, FSA/RHS & VA Conventional
Refinancings Home ImprovementLoans
Loans on DwellingsFor 5 or More
Families
NonoccupantLoans From
Columns A, B, Cand D
Number Number Number Number Number Number$000's $000's $000's $000's $000's $000's
A B C D E F
Home Purchase Loans
Loans on 1- to 4-Family and Manufactured Home Dwellings
Loans OnManufactured Home
Dwellings FromColumns A, B, C & D
G
Number $000's
%MinPop4/
MedianIncome As
PCT ofMSA/MDMedian

PA/CHESTER COUNTY/3071.00 9 135
LOANS ORIGINATED 22 53 5 36 1345 4359 13276 460 659 1 30
APPS APPROVED, NOT ACCEPTED 6 1599 1 216
APPS DENIED 4 17 11 133 817 4161 25
APPS WITHDRAWN 1 7 1 12 409 124 1455 10 285
FILES CLOSED FOR INCOMPLETENESS 4 1224
PA/CHESTER COUNTY/3072.00 14 80
LOANS ORIGINATED 6 27 13 442 1170 7751 150
APPS APPROVED, NOT ACCEPTED 2 384
APPS DENIED 3 16 1 2541 3718 100 267
APPS WITHDRAWN 1 216 386
FILES CLOSED FOR INCOMPLETENESS 2 1578 550
PA/CHESTER COUNTY/3073.00 17 105
LOANS ORIGINATED 23 61 5 524 4948 4450 9908 204 770
APPS APPROVED, NOT ACCEPTED 1 2 164 502 64
APPS DENIED 5 28 4 15 1182 1103 4795 160 252 1 38
APPS WITHDRAWN 2 13 12 535 556 2309 189
FILES CLOSED FOR INCOMPLETENESS 1 44 696 200 606
PA/CHESTER COUNTY/3074.00 19 91
LOANS ORIGINATED 21 63 2 2 1623 4276 2538 9712 33 650 1511
APPS APPROVED, NOT ACCEPTED 3 9 1 21 185 223 1173 3 139 2 99
APPS DENIED 5 24 6 310 1778 405 3965 62 394 1 29
APPS WITHDRAWN 2 24 1 3 33 523 323 3790 10 6576 500
FILES CLOSED FOR INCOMPLETENESS 2 7 1 12 242 315 733 30 30 1 132
PA/CHESTER COUNTY/3077.00 10 75
LOANS ORIGINATED 22 37 3 41 184 3942 7699 172 828 1 31
APPS APPROVED, NOT ACCEPTED 1 7417 1367 1 61
APPS DENIED 8 141 250 1026 2006 3 112
APPS WITHDRAWN 3 2 21 177 468 502 149
FILES CLOSED FOR INCOMPLETENESS 1 2135 506
06/02/2014Report Date:
AGGREGATE TABLE 1: DISPOSITION OF LOAN APPLICATIONS, BY LOCATION OF PROPERTY AND TYPE OF LOAN, 2013
MSA/MD: 37964 - PHILADELPHIA, PA
Page 48 of 199
ALL LOANS ON PROPERTY LOCATED IN MSA/MD 3/
CENSUS TRACT OR COUNTY NAME ANDDISPOSITION OF APPLICATION 1/(STATE/COUNTY/TRACT NUMBER) FHA, FSA/RHS & VA Conventional
Refinancings Home ImprovementLoans
Loans on DwellingsFor 5 or More
Families
NonoccupantLoans From
Columns A, B, Cand D
Number Number Number Number Number Number$000's $000's $000's $000's $000's $000's
A B C D E F
Home Purchase Loans
Loans on 1- to 4-Family and Manufactured Home Dwellings
Loans OnManufactured Home
Dwellings FromColumns A, B, C & D
G
Number $000's
%MinPop4/
MedianIncome As
PCT ofMSA/MDMedian

PA/CHESTER COUNTY/3078.00 14 117
LOANS ORIGINATED 16 41 2 21 211 3866 8070 438 563
APPS APPROVED, NOT ACCEPTED 3 7 1628 5633 4500
APPS DENIED 2 15 3 21 220 479 2849 197 321 1 20
APPS WITHDRAWN 1 52 446 391 1171
FILES CLOSED FOR INCOMPLETENESS 1 1128 236
PA/CHESTER COUNTY/3079.00 47 111
LOANS ORIGINATED 12 85 3 38 1629 2528 15955 390 661 1 103
APPS APPROVED, NOT ACCEPTED 2 71 161 378 1350
APPS DENIED 1 21 3 22 370 29 3990 120 260 1 10
APPS WITHDRAWN 84 722 1626
FILES CLOSED FOR INCOMPLETENESS 7 33 469 1994 855
PA/CHESTER COUNTY/3080.00 40 76
LOANS ORIGINATED 19 61 7 1920 3288 2812 8653 515 1770 1 90
APPS APPROVED, NOT ACCEPTED 1 5 156 587 158 1 56
APPS DENIED 7 20 8 34 697 1712 2533 441 68 5 204
APPS WITHDRAWN 16 13 433 2547 136
FILES CLOSED FOR INCOMPLETENESS 4 568
PA/CHESTER COUNTY/3081.01 10 122
LOANS ORIGINATED 25 105 13 214 3462 5302 20214 486 375 1 165
APPS APPROVED, NOT ACCEPTED 1 16230 3327
APPS DENIED 1 42 41 176 204 8575 626
APPS WITHDRAWN 2 20 1 12 373 269 4058 20 170
FILES CLOSED FOR INCOMPLETENESS 41 185 824
PA/CHESTER COUNTY/3081.02 19 97
LOANS ORIGINATED 22 70 5 310 2024 4141 13269 240 586 1 47
APPS APPROVED, NOT ACCEPTED 4 63 492 501 941 2 80
APPS DENIED 6 22 4 34 787 735 3659 58 569 2 177
APPS WITHDRAWN 3 11 11 204 834 1976 139
FILES CLOSED FOR INCOMPLETENESS 41 192 721
06/02/2014Report Date:
AGGREGATE TABLE 1: DISPOSITION OF LOAN APPLICATIONS, BY LOCATION OF PROPERTY AND TYPE OF LOAN, 2013
MSA/MD: 37964 - PHILADELPHIA, PA
Page 49 of 199
ALL LOANS ON PROPERTY LOCATED IN MSA/MD 3/
CENSUS TRACT OR COUNTY NAME ANDDISPOSITION OF APPLICATION 1/(STATE/COUNTY/TRACT NUMBER) FHA, FSA/RHS & VA Conventional
Refinancings Home ImprovementLoans
Loans on DwellingsFor 5 or More
Families
NonoccupantLoans From
Columns A, B, Cand D
Number Number Number Number Number Number$000's $000's $000's $000's $000's $000's
A B C D E F
Home Purchase Loans
Loans on 1- to 4-Family and Manufactured Home Dwellings
Loans OnManufactured Home
Dwellings FromColumns A, B, C & D
G
Number $000's
%MinPop4/
MedianIncome As
PCT ofMSA/MDMedian

PA/CHESTER COUNTY/3082.00 12 84
LOANS ORIGINATED 9 36 6 25 1297 942 6719 52 109 4 193
APPS APPROVED, NOT ACCEPTED 5 3 21 131 161 482 98 4 97
APPS DENIED 16 14 3 11114 2156 65 55 13 522
APPS WITHDRAWN 33 553 291 2 143
FILES CLOSED FOR INCOMPLETENESS 11 137 98
PA/CHESTER COUNTY/3110.00 11 142
LOANS ORIGINATED 48 161 16 613 3176 13568 35290 1910 1022 2 290
APPS APPROVED, NOT ACCEPTED 8 16 22844 3950 28
APPS DENIED 8 44 6 22 464 1999 10300 230 116 2 29
APPS WITHDRAWN 4 38 2 21 273 1048 9351 140 380
FILES CLOSED FOR INCOMPLETENESS 10 11 265 2313 392
PA/CHESTER COUNTY/3111.00 6 206
LOANS ORIGINATED 47 103 9 1 91 373 26364 38644 1917 22500 3828
APPS APPROVED, NOT ACCEPTED 3 8 11342 2503 100
APPS DENIED 7 21 4 11 281 6441 5960 463 416
APPS WITHDRAWN 8 11 11 236 3982 3547 290
FILES CLOSED FOR INCOMPLETENESS 2 7 11401 2553 174
PA/CHESTER COUNTY/3112.00 7 135
LOANS ORIGINATED 13 41 5 17042 17622 717 417
APPS APPROVED, NOT ACCEPTED 1 9 1808 3714 20
APPS DENIED 3 16 4 1913 6354 140 176
APPS WITHDRAWN 1 9 11 123 700 3180 50
FILES CLOSED FOR INCOMPLETENESS 5 1546
PA/CHESTER COUNTY/3113.00 18 203
LOANS ORIGINATED 52 88 7 23 939 22439 28936 2347 637
APPS APPROVED, NOT ACCEPTED 3 4 11566 747 13
APPS DENIED 7 20 4 11 290 3536 8147 588 143
APPS WITHDRAWN 8 16 21 244 2717 4742 255
FILES CLOSED FOR INCOMPLETENESS 1 71 329 390 2830
06/02/2014Report Date:
AGGREGATE TABLE 1: DISPOSITION OF LOAN APPLICATIONS, BY LOCATION OF PROPERTY AND TYPE OF LOAN, 2013
MSA/MD: 37964 - PHILADELPHIA, PA
Page 50 of 199
ALL LOANS ON PROPERTY LOCATED IN MSA/MD 3/
CENSUS TRACT OR COUNTY NAME ANDDISPOSITION OF APPLICATION 1/(STATE/COUNTY/TRACT NUMBER) FHA, FSA/RHS & VA Conventional
Refinancings Home ImprovementLoans
Loans on DwellingsFor 5 or More
Families
NonoccupantLoans From
Columns A, B, Cand D
Number Number Number Number Number Number$000's $000's $000's $000's $000's $000's
A B C D E F
Home Purchase Loans
Loans on 1- to 4-Family and Manufactured Home Dwellings
Loans OnManufactured Home
Dwellings FromColumns A, B, C & D
G
Number $000's
%MinPop4/
MedianIncome As
PCT ofMSA/MDMedian

PA/CHESTER COUNTY/3114.01 34 127
LOANS ORIGINATED 37 174 4 3 1538 7173 6526 30531 106 45833 2025
APPS APPROVED, NOT ACCEPTED 4 24 1 61 231 631 4493 15 917
APPS DENIED 6 54 14 124 689 776 8720 217 1693 1 201
APPS WITHDRAWN 3 36 1 31 103 368 6379 10 551
FILES CLOSED FOR INCOMPLETENESS 1 15 1 6144 2183 115 648
PA/CHESTER COUNTY/3114.03 9 132
LOANS ORIGINATED 10 68 7 19 2112 1914 12545 662 42 1 24
APPS APPROVED, NOT ACCEPTED 1 61 138 146 1327
APPS DENIED 1 30 3 14 957 109 4801 27 234
APPS WITHDRAWN 3 16 3 24 842 367 2604 125 240
FILES CLOSED FOR INCOMPLETENESS 12 351 160
PA/CHESTER COUNTY/3114.04 7 117
LOANS ORIGINATED 35 80 7 1 48 1942 8499 17765 184 440 2206 3 91
APPS APPROVED, NOT ACCEPTED 3 91 424 378 1834 1 40
APPS DENIED 3 29 3 22 569 498 7074 49 1238 2 81
APPS WITHDRAWN 5 22 12 471 815 4108 152 1 23
FILES CLOSED FOR INCOMPLETENESS 1 5203 816
PA/CHESTER COUNTY/3115.00 5 108
LOANS ORIGINATED 28 59 2 48 1726 5967 12309 462 523
APPS APPROVED, NOT ACCEPTED 1 142 427 165 2943
APPS DENIED 5 24 3 21 153 963 5727 60 285
APPS WITHDRAWN 2 13 13 544 506 3694 210
FILES CLOSED FOR INCOMPLETENESS 7 1473
PA/CHESTER COUNTY/3116.00 58 82
LOANS ORIGINATED 11 29 85 904 1319 3577 585
APPS APPROVED, NOT ACCEPTED 1 5 1 133 649 18 33
APPS DENIED 3 18 2 41 125 443 2435 8 359
APPS WITHDRAWN 5 21 96 710 181
FILES CLOSED FOR INCOMPLETENESS 5 1682 134
06/02/2014Report Date:
AGGREGATE TABLE 1: DISPOSITION OF LOAN APPLICATIONS, BY LOCATION OF PROPERTY AND TYPE OF LOAN, 2013
MSA/MD: 37964 - PHILADELPHIA, PA
Page 51 of 199
ALL LOANS ON PROPERTY LOCATED IN MSA/MD 3/
CENSUS TRACT OR COUNTY NAME ANDDISPOSITION OF APPLICATION 1/(STATE/COUNTY/TRACT NUMBER) FHA, FSA/RHS & VA Conventional
Refinancings Home ImprovementLoans
Loans on DwellingsFor 5 or More
Families
NonoccupantLoans From
Columns A, B, Cand D
Number Number Number Number Number Number$000's $000's $000's $000's $000's $000's
A B C D E F
Home Purchase Loans
Loans on 1- to 4-Family and Manufactured Home Dwellings
Loans OnManufactured Home
Dwellings FromColumns A, B, C & D
G
Number $000's
%MinPop4/
MedianIncome As
PCT ofMSA/MDMedian

PA/CHESTER COUNTY/3117.00 31 116
LOANS ORIGINATED 148 162 19 927 8073 37639 36902 1034 3245 5 257
APPS APPROVED, NOT ACCEPTED 14 26 2 11 187 2274 5767 450 116 6 323
APPS DENIED 15 50 20 29 2616 3308 8945 816 279 5 297
APPS WITHDRAWN 15 27 15 1240 4489 5869 3450
FILES CLOSED FOR INCOMPLETENESS 3 15 11 232 834 3435 12
PA/CHESTER COUNTY/3118.00 11 99
LOANS ORIGINATED 15 55 4 64 744 3211 9360 66 804
APPS APPROVED, NOT ACCEPTED 6 1 1940 8 263
APPS DENIED 4 24 4 1 13 469 405 4865 130 265 73 5 272
APPS WITHDRAWN 3 15588 2340
FILES CLOSED FOR INCOMPLETENESS 6 1463
PA/DELAWARE COUNTY/4003.01 82 47
LOANS ORIGINATED 2 43 3 2 187 362 104 2869 9 1871 1084
APPS APPROVED, NOT ACCEPTED 14 1 31003 2025 155
APPS DENIED 1 38 16 65 313 30 2671 279 268
APPS WITHDRAWN 1 14 22 131 55 973 115
FILES CLOSED FOR INCOMPLETENESS 11 1 4785 23 271
PA/DELAWARE COUNTY/4003.02 77 48
LOANS ORIGINATED 5 40 2 143 255 280 2901 24 1117
APPS APPROVED, NOT ACCEPTED 5 1388 95
APPS DENIED 3 28 12 101 74 126 3968 242 2563
APPS WITHDRAWN 52 109 357
FILES CLOSED FOR INCOMPLETENESS 11 3838 193
PA/DELAWARE COUNTY/4004.01 84 54
LOANS ORIGINATED 5 31 3 1 106 581 311 3096 137 3100 829
APPS APPROVED, NOT ACCEPTED 11 2810 94
APPS DENIED 3 43 16 1 93 250 197 4883 253 3000 1764
APPS WITHDRAWN 11 31 62 964 245
FILES CLOSED FOR INCOMPLETENESS 5 354
06/02/2014Report Date:
AGGREGATE TABLE 1: DISPOSITION OF LOAN APPLICATIONS, BY LOCATION OF PROPERTY AND TYPE OF LOAN, 2013
MSA/MD: 37964 - PHILADELPHIA, PA
Page 52 of 199
ALL LOANS ON PROPERTY LOCATED IN MSA/MD 3/
CENSUS TRACT OR COUNTY NAME ANDDISPOSITION OF APPLICATION 1/(STATE/COUNTY/TRACT NUMBER) FHA, FSA/RHS & VA Conventional
Refinancings Home ImprovementLoans
Loans on DwellingsFor 5 or More
Families
NonoccupantLoans From
Columns A, B, Cand D
Number Number Number Number Number Number$000's $000's $000's $000's $000's $000's
A B C D E F
Home Purchase Loans
Loans on 1- to 4-Family and Manufactured Home Dwellings
Loans OnManufactured Home
Dwellings FromColumns A, B, C & D
G
Number $000's
%MinPop4/
MedianIncome As
PCT ofMSA/MDMedian

PA/DELAWARE COUNTY/4004.02 80 53
LOANS ORIGINATED 5 26 4 115 415 256 3303 41 1911
APPS APPROVED, NOT ACCEPTED 6 3437 141
APPS DENIED 5 27 14 92 156 269 2256 172 677
APPS WITHDRAWN 2 13 1 32 145 91 1099 40 167
FILES CLOSED FOR INCOMPLETENESS 1 5 21 70 64 349 147
PA/DELAWARE COUNTY/4005.00 60 64
LOANS ORIGINATED 7 49 4 1510 988 447 4277 89 1300
APPS APPROVED, NOT ACCEPTED 3 21 98 270 22
APPS DENIED 1 22 10 64 407 53 1953 76 299
APPS WITHDRAWN 3 5 2 23 307 254 571 38 79
FILES CLOSED FOR INCOMPLETENESS 6 11 96 592 122
PA/DELAWARE COUNTY/4006.00 37 97
LOANS ORIGINATED 19 82 8 1516 1778 2397 9631 252 1997
APPS APPROVED, NOT ACCEPTED 1 16 283 1868 76
APPS DENIED 8 43 10 38 893 766 5109 275 219 1 12
APPS WITHDRAWN 2 25 2 22 199 201 3192 105 222
FILES CLOSED FOR INCOMPLETENESS 1 13 12 245 116 1531 20
PA/DELAWARE COUNTY/4007.00 68 106
LOANS ORIGINATED 16 66 5 1 719 2482 1673 7023 243 3500 610
APPS APPROVED, NOT ACCEPTED 1 18 1100 2250 118
APPS DENIED 4 48 14 87 790 516 5992 365 586
APPS WITHDRAWN 17 22 344 2102 134
FILES CLOSED FOR INCOMPLETENESS 1 13 13 441 80 1578 25
PA/DELAWARE COUNTY/4008.01 87 68
LOANS ORIGINATED 4 5 3316 522 280
APPS APPROVED, NOT ACCEPTED 4 490
APPS DENIED 3 3 1334 18 3 1 2
APPS WITHDRAWN 3 1343 140
FILES CLOSED FOR INCOMPLETENESS 1 1122 122
06/02/2014Report Date:
AGGREGATE TABLE 1: DISPOSITION OF LOAN APPLICATIONS, BY LOCATION OF PROPERTY AND TYPE OF LOAN, 2013
MSA/MD: 37964 - PHILADELPHIA, PA
Page 53 of 199
ALL LOANS ON PROPERTY LOCATED IN MSA/MD 3/
CENSUS TRACT OR COUNTY NAME ANDDISPOSITION OF APPLICATION 1/(STATE/COUNTY/TRACT NUMBER) FHA, FSA/RHS & VA Conventional
Refinancings Home ImprovementLoans
Loans on DwellingsFor 5 or More
Families
NonoccupantLoans From
Columns A, B, Cand D
Number Number Number Number Number Number$000's $000's $000's $000's $000's $000's
A B C D E F
Home Purchase Loans
Loans on 1- to 4-Family and Manufactured Home Dwellings
Loans OnManufactured Home
Dwellings FromColumns A, B, C & D
G
Number $000's
%MinPop4/
MedianIncome As
PCT ofMSA/MDMedian

PA/DELAWARE COUNTY/4008.02 30 97
LOANS ORIGINATED 10 69 1 1 516 2422 1423 9918 60 2300 560
APPS APPROVED, NOT ACCEPTED 131 152 2293
APPS DENIED 3 20 10 14 621 333 3176 156 132
APPS WITHDRAWN 1 17 24 493 208 2470 224
FILES CLOSED FOR INCOMPLETENESS 71 214 1175
PA/DELAWARE COUNTY/4009.00 12 155
LOANS ORIGINATED 14 36 33 465 3069 7354 484
APPS APPROVED, NOT ACCEPTED 5 1147
APPS DENIED 4 8 53 577 815 1332 310
APPS WITHDRAWN 7 11433 60
FILES CLOSED FOR INCOMPLETENESS
PA/DELAWARE COUNTY/4010.00 13 153
LOANS ORIGINATED 5 43 1 1 33 595 813 7229 17 880 347
APPS APPROVED, NOT ACCEPTED 1 6 1109 716 200
APPS DENIED 11 12 398 1642 178
APPS WITHDRAWN 1 64 752 225 655
FILES CLOSED FOR INCOMPLETENESS 3 689
PA/DELAWARE COUNTY/4011.01 12 88
LOANS ORIGINATED 14 47 7 1223 2719 1208 4935 277 1178
APPS APPROVED, NOT ACCEPTED 7 1854 105
APPS DENIED 18 11 41 76 1811 103 407
APPS WITHDRAWN 17 42 209 1960 401
FILES CLOSED FOR INCOMPLETENESS 6 1 1668 40 109
PA/DELAWARE COUNTY/4011.03 13 150
LOANS ORIGINATED 21 67 7 69 1880 4081 11241 441 1019
APPS APPROVED, NOT ACCEPTED 3 446
APPS DENIED 1 26 7 13 910 133 4735 223 5
APPS WITHDRAWN 2 9 1 1260 1726 200 116
FILES CLOSED FOR INCOMPLETENESS 1 13168 2677
06/02/2014Report Date:
AGGREGATE TABLE 1: DISPOSITION OF LOAN APPLICATIONS, BY LOCATION OF PROPERTY AND TYPE OF LOAN, 2013
MSA/MD: 37964 - PHILADELPHIA, PA
Page 54 of 199
ALL LOANS ON PROPERTY LOCATED IN MSA/MD 3/
CENSUS TRACT OR COUNTY NAME ANDDISPOSITION OF APPLICATION 1/(STATE/COUNTY/TRACT NUMBER) FHA, FSA/RHS & VA Conventional
Refinancings Home ImprovementLoans
Loans on DwellingsFor 5 or More
Families
NonoccupantLoans From
Columns A, B, Cand D
Number Number Number Number Number Number$000's $000's $000's $000's $000's $000's
A B C D E F
Home Purchase Loans
Loans on 1- to 4-Family and Manufactured Home Dwellings
Loans OnManufactured Home
Dwellings FromColumns A, B, C & D
G
Number $000's
%MinPop4/
MedianIncome As
PCT ofMSA/MDMedian

PA/DELAWARE COUNTY/4011.04 11 119
LOANS ORIGINATED 27 87 10 1 1118 2961 3177 11759 671 3660 950
APPS APPROVED, NOT ACCEPTED 1 13 1125 1806 113
APPS DENIED 2 37 6 63 405 173 4578 143 538
APPS WITHDRAWN 6 20 1 23 293 761 2637 20 333
FILES CLOSED FOR INCOMPLETENESS 14 1897
PA/DELAWARE COUNTY/4012.00 9 122
LOANS ORIGINATED 17 74 8 1620 3154 3074 10527 580 1790
APPS APPROVED, NOT ACCEPTED 1 8 184 1388 161
APPS DENIED 4 25 7 72 369 499 3769 440 942
APPS WITHDRAWN 3 14 1 2384 2895 45 240
FILES CLOSED FOR INCOMPLETENESS 4 1347 28
PA/DELAWARE COUNTY/4013.01 44 65
LOANS ORIGINATED
APPS APPROVED, NOT ACCEPTED
APPS DENIED 1 5
APPS WITHDRAWN
FILES CLOSED FOR INCOMPLETENESS
PA/DELAWARE COUNTY/4013.02 14 130
LOANS ORIGINATED 13 66 5 511 1602 1500 9514 391 763
APPS APPROVED, NOT ACCEPTED 10 21722 204
APPS DENIED 5 25 8 23 478 441 3906 430 299 1 19
APPS WITHDRAWN 3 16 32 230 373 2448 389
FILES CLOSED FOR INCOMPLETENESS 71 151 960
PA/DELAWARE COUNTY/4014.01 20 130
LOANS ORIGINATED 7 49 4 68 1063 698 6232 97 722
APPS APPROVED, NOT ACCEPTED 3 424
APPS DENIED 1 15 3 22 207 68 2039 44 266
APPS WITHDRAWN 5 11 157 666 40
FILES CLOSED FOR INCOMPLETENESS 7 2 1843 156 121
06/02/2014Report Date:
AGGREGATE TABLE 1: DISPOSITION OF LOAN APPLICATIONS, BY LOCATION OF PROPERTY AND TYPE OF LOAN, 2013
MSA/MD: 37964 - PHILADELPHIA, PA
Page 55 of 199
ALL LOANS ON PROPERTY LOCATED IN MSA/MD 3/
CENSUS TRACT OR COUNTY NAME ANDDISPOSITION OF APPLICATION 1/(STATE/COUNTY/TRACT NUMBER) FHA, FSA/RHS & VA Conventional
Refinancings Home ImprovementLoans
Loans on DwellingsFor 5 or More
Families
NonoccupantLoans From
Columns A, B, Cand D
Number Number Number Number Number Number$000's $000's $000's $000's $000's $000's
A B C D E F
Home Purchase Loans
Loans on 1- to 4-Family and Manufactured Home Dwellings
Loans OnManufactured Home
Dwellings FromColumns A, B, C & D
G
Number $000's
%MinPop4/
MedianIncome As
PCT ofMSA/MDMedian

PA/DELAWARE COUNTY/4014.02 23 97
LOANS ORIGINATED 8 46 1 1117 2196 958 5170 80 1230
APPS APPROVED, NOT ACCEPTED 6 1 2777 4 263
APPS DENIED 2 23 7 31 50 287 2948 175 449
APPS WITHDRAWN 3 16 13 363 394 1658 3
FILES CLOSED FOR INCOMPLETENESS 5 3571 356
PA/DELAWARE COUNTY/4015.01 6 86
LOANS ORIGINATED 20 61 1 1222 2607 2059 6768 12 1294
APPS APPROVED, NOT ACCEPTED 9 1231
APPS DENIED 28 4 42 232 3439 162 458
APPS WITHDRAWN 1 13 1 284 1521 25 212
FILES CLOSED FOR INCOMPLETENESS 2 73 388 85 895
PA/DELAWARE COUNTY/4015.02 30 73
LOANS ORIGINATED 8 50 3 47 1117 950 7407 20 498
APPS APPROVED, NOT ACCEPTED 1 5 186 522 108
APPS DENIED 5 17 4 46 895 558 2543 78 506
APPS WITHDRAWN 1 14 2104 2195 323
FILES CLOSED FOR INCOMPLETENESS 2 9 1193 992 70
PA/DELAWARE COUNTY/4016.00 37 107
LOANS ORIGINATED 7 16 4 1 311 1529 1080 2418 175 3500 407
APPS APPROVED, NOT ACCEPTED 2 1371 11
APPS DENIED 18 5 12329 125 143
APPS WITHDRAWN 82 272 1253
FILES CLOSED FOR INCOMPLETENESS 4 776
PA/DELAWARE COUNTY/4017.00 70 81
LOANS ORIGINATED 4 19 3 211 1224 449 1807 30 224
APPS APPROVED, NOT ACCEPTED 1 5 2 11 83 120 597 28 100
APPS DENIED 3 21 12 41 82 211 1949 479 279
APPS WITHDRAWN 12 1 11 153 1492 25 86
FILES CLOSED FOR INCOMPLETENESS 2 1156 37
06/02/2014Report Date:
AGGREGATE TABLE 1: DISPOSITION OF LOAN APPLICATIONS, BY LOCATION OF PROPERTY AND TYPE OF LOAN, 2013
MSA/MD: 37964 - PHILADELPHIA, PA
Page 56 of 199
ALL LOANS ON PROPERTY LOCATED IN MSA/MD 3/
CENSUS TRACT OR COUNTY NAME ANDDISPOSITION OF APPLICATION 1/(STATE/COUNTY/TRACT NUMBER) FHA, FSA/RHS & VA Conventional
Refinancings Home ImprovementLoans
Loans on DwellingsFor 5 or More
Families
NonoccupantLoans From
Columns A, B, Cand D
Number Number Number Number Number Number$000's $000's $000's $000's $000's $000's
A B C D E F
Home Purchase Loans
Loans on 1- to 4-Family and Manufactured Home Dwellings
Loans OnManufactured Home
Dwellings FromColumns A, B, C & D
G
Number $000's
%MinPop4/
MedianIncome As
PCT ofMSA/MDMedian

PA/DELAWARE COUNTY/4018.00 63 93
LOANS ORIGINATED 8 56 6 1 416 2370 943 6617 253 2250 409
APPS APPROVED, NOT ACCEPTED 11 1409
APPS DENIED 6 22 9 211 2037 771 3019 377 275 1 2
APPS WITHDRAWN 4 9 28 1016 401 1059 191
FILES CLOSED FOR INCOMPLETENESS 8 13 486 1047 150
PA/DELAWARE COUNTY/4019.00 46 96
LOANS ORIGINATED 19 91 8 1 624 3375 2328 12573 344 2500 691
APPS APPROVED, NOT ACCEPTED 2 131 88 233 2225
APPS DENIED 1 44 12 12 146 213 6100 225 143
APPS WITHDRAWN 5 14 1 14 624 681 2166 40 273
FILES CLOSED FOR INCOMPLETENESS 132 317 1779
PA/DELAWARE COUNTY/4020.00 56 101
LOANS ORIGINATED 4 33 5 1 95 726 276 3981 509 65 909
APPS APPROVED, NOT ACCEPTED 1 156 109
APPS DENIED 4 18 5 1 41 157 332 2138 61 154 263
APPS WITHDRAWN 2 7 2187 902 279
FILES CLOSED FOR INCOMPLETENESS 1 3 12 287 53 472 53
PA/DELAWARE COUNTY/4021.00 92 83
LOANS ORIGINATED 8 61 16 627 2977 1287 5931 413 1108
APPS APPROVED, NOT ACCEPTED 1 81 77 96 835
APPS DENIED 4 58 27 66 644 235 5860 809 318
APPS WITHDRAWN 1 27 1 164 2972 35 75
FILES CLOSED FOR INCOMPLETENESS 14 2 12 220 1050 94 65
PA/DELAWARE COUNTY/4022.00 88 74
LOANS ORIGINATED 5 16 3 1 25 516 807 1229 48 2600 150
APPS APPROVED, NOT ACCEPTED 3 366
APPS DENIED 2 21 5 11 123 204 2113 22 130
APPS WITHDRAWN 5 1 11 179 481 4 58
FILES CLOSED FOR INCOMPLETENESS 1 163
06/02/2014Report Date:
AGGREGATE TABLE 1: DISPOSITION OF LOAN APPLICATIONS, BY LOCATION OF PROPERTY AND TYPE OF LOAN, 2013
MSA/MD: 37964 - PHILADELPHIA, PA
Page 57 of 199
ALL LOANS ON PROPERTY LOCATED IN MSA/MD 3/
CENSUS TRACT OR COUNTY NAME ANDDISPOSITION OF APPLICATION 1/(STATE/COUNTY/TRACT NUMBER) FHA, FSA/RHS & VA Conventional
Refinancings Home ImprovementLoans
Loans on DwellingsFor 5 or More
Families
NonoccupantLoans From
Columns A, B, Cand D
Number Number Number Number Number Number$000's $000's $000's $000's $000's $000's
A B C D E F
Home Purchase Loans
Loans on 1- to 4-Family and Manufactured Home Dwellings
Loans OnManufactured Home
Dwellings FromColumns A, B, C & D
G
Number $000's
%MinPop4/
MedianIncome As
PCT ofMSA/MDMedian

PA/DELAWARE COUNTY/4023.00 96 73
LOANS ORIGINATED 13 3 27 804 1311 40 77
APPS APPROVED, NOT ACCEPTED 3 11 128 368 60
APPS DENIED 2 13 6 12 222 160 1697 78 5
APPS WITHDRAWN 1 8 192 914 10
FILES CLOSED FOR INCOMPLETENESS 5 433
PA/DELAWARE COUNTY/4024.00 91 46
LOANS ORIGINATED 2 7 2 33 167 91 484 27 122
APPS APPROVED, NOT ACCEPTED 3 11 74 171 50
APPS DENIED 2 21 15 770 1640 333 345
APPS WITHDRAWN 7 1 1672 49 50
FILES CLOSED FOR INCOMPLETENESS 4 1237 33
PA/DELAWARE COUNTY/4025.00 89 40
LOANS ORIGINATED 3 22 3 162 113 195 1328 83 810
APPS APPROVED, NOT ACCEPTED 1 1 21 38 26 72 98
APPS DENIED 1 14 19 443 987 196 198
APPS WITHDRAWN 4 13 226 215 29
FILES CLOSED FOR INCOMPLETENESS 3 204
PA/DELAWARE COUNTY/4026.00 72 50
LOANS ORIGINATED 3 15 3 83 193 139 925 13 437
APPS APPROVED, NOT ACCEPTED 8 1 21 76 569 5 131
APPS DENIED 1 28 8 63 178 37 1909 201 341
APPS WITHDRAWN 1 51 137 80 354
FILES CLOSED FOR INCOMPLETENESS 51 116 443
PA/DELAWARE COUNTY/4027.00 84 82
LOANS ORIGINATED 1 20 3 42 138 60 1378 37 247
APPS APPROVED, NOT ACCEPTED 1 5 265 302 111
APPS DENIED 1 15 16 51 49 38 998 190 212
APPS WITHDRAWN 2 3137 45
FILES CLOSED FOR INCOMPLETENESS 2 114
06/02/2014Report Date:
AGGREGATE TABLE 1: DISPOSITION OF LOAN APPLICATIONS, BY LOCATION OF PROPERTY AND TYPE OF LOAN, 2013
MSA/MD: 37964 - PHILADELPHIA, PA
Page 58 of 199
ALL LOANS ON PROPERTY LOCATED IN MSA/MD 3/
CENSUS TRACT OR COUNTY NAME ANDDISPOSITION OF APPLICATION 1/(STATE/COUNTY/TRACT NUMBER) FHA, FSA/RHS & VA Conventional
Refinancings Home ImprovementLoans
Loans on DwellingsFor 5 or More
Families
NonoccupantLoans From
Columns A, B, Cand D
Number Number Number Number Number Number$000's $000's $000's $000's $000's $000's
A B C D E F
Home Purchase Loans
Loans on 1- to 4-Family and Manufactured Home Dwellings
Loans OnManufactured Home
Dwellings FromColumns A, B, C & D
G
Number $000's
%MinPop4/
MedianIncome As
PCT ofMSA/MDMedian

PA/DELAWARE COUNTY/4028.00 68 73
LOANS ORIGINATED 9 57 9 1 827 2579 730 6021 206 216 1146
APPS APPROVED, NOT ACCEPTED 1 11 33 359 106 921 193
APPS DENIED 36 16 1 56 564 3521 272 200 309
APPS WITHDRAWN 4 14 1 41 82 420 1428 19 457
FILES CLOSED FOR INCOMPLETENESS 1 14 1 31 79 116 1340 11 248
PA/DELAWARE COUNTY/4029.00 98 50
LOANS ORIGINATED 1 27 2 1 32 216 78 2846 55 15229 277
APPS APPROVED, NOT ACCEPTED 4 373
APPS DENIED 21 9 32 174 1612 511 515
APPS WITHDRAWN 6 814
FILES CLOSED FOR INCOMPLETENESS 3 290
PA/DELAWARE COUNTY/4030.01 3 104
LOANS ORIGINATED 14 57 6 823 2400 1298 6182 121 833
APPS APPROVED, NOT ACCEPTED 9 1924 146
APPS DENIED 27 64 370 2863 180
APPS WITHDRAWN 11 21 118 1152 210
FILES CLOSED FOR INCOMPLETENESS 8 2671 150
PA/DELAWARE COUNTY/4030.02 17 78
LOANS ORIGINATED 8 49 8 1114 1493 567 4970 199 903
APPS APPROVED, NOT ACCEPTED 4 11 145 349 56
APPS DENIED 1 19 10 41 90 38 1998 150 272
APPS WITHDRAWN 1 12 453 1447 94
FILES CLOSED FOR INCOMPLETENESS 9 21 71 968 199
PA/DELAWARE COUNTY/4031.01 36 71
LOANS ORIGINATED 6 39 3 816 1463 593 3534 15 571
APPS APPROVED, NOT ACCEPTED 5 1678 48
APPS DENIED 8 28 11 75 687 378 2808 250 395
APPS WITHDRAWN 7 11 172 758 25
FILES CLOSED FOR INCOMPLETENESS 1 750 525
06/02/2014Report Date:
AGGREGATE TABLE 1: DISPOSITION OF LOAN APPLICATIONS, BY LOCATION OF PROPERTY AND TYPE OF LOAN, 2013
MSA/MD: 37964 - PHILADELPHIA, PA
Page 59 of 199
ALL LOANS ON PROPERTY LOCATED IN MSA/MD 3/
CENSUS TRACT OR COUNTY NAME ANDDISPOSITION OF APPLICATION 1/(STATE/COUNTY/TRACT NUMBER) FHA, FSA/RHS & VA Conventional
Refinancings Home ImprovementLoans
Loans on DwellingsFor 5 or More
Families
NonoccupantLoans From
Columns A, B, Cand D
Number Number Number Number Number Number$000's $000's $000's $000's $000's $000's
A B C D E F
Home Purchase Loans
Loans on 1- to 4-Family and Manufactured Home Dwellings
Loans OnManufactured Home
Dwellings FromColumns A, B, C & D
G
Number $000's
%MinPop4/
MedianIncome As
PCT ofMSA/MDMedian

PA/DELAWARE COUNTY/4031.03 42 73
LOANS ORIGINATED 5 35 5 1111 1244 427 2928 140 711
APPS APPROVED, NOT ACCEPTED 4 339
APPS DENIED 1 25 12 95 413 75 2211 282 709
APPS WITHDRAWN 13 1 11 134 1390 50 65
FILES CLOSED FOR INCOMPLETENESS 7 11 136 717 55
PA/DELAWARE COUNTY/4031.04 60 58
LOANS ORIGINATED 3 21 2 95 460 254 2009 53 950
APPS APPROVED, NOT ACCEPTED 1 2 11 114 47 198 47
APPS DENIED 17 7 46 598 1350 49 364
APPS WITHDRAWN 1 2 11 122 86 249 86
FILES CLOSED FOR INCOMPLETENESS 9 980
PA/DELAWARE COUNTY/4032.00 25 109
LOANS ORIGINATED 12 62 3 1317 2478 1447 7624 31 1294
APPS APPROVED, NOT ACCEPTED 1 9 1 12 237 78 1165 11 78
APPS DENIED 3 50 13 106 733 269 7316 455 811
APPS WITHDRAWN 1 15 3 1100 2102 155 127
FILES CLOSED FOR INCOMPLETENESS 10 1571
PA/DELAWARE COUNTY/4033.00 19 61
LOANS ORIGINATED 15 81 7 3 2425 2649 1326 10020 365 7895 4038
APPS APPROVED, NOT ACCEPTED 1 10 1 176 1067 3 130
APPS DENIED 2 31 15 1 56 554 162 3353 190 204 392
APPS WITHDRAWN 2 22 2 52 301 227 2316 56 552
FILES CLOSED FOR INCOMPLETENESS 18 13 346 1911 104
PA/DELAWARE COUNTY/4034.01 39 73
LOANS ORIGINATED 4 23 4 2 59 810 313 2399 120 3415 360
APPS APPROVED, NOT ACCEPTED 1 360 445
APPS DENIED 1 24 6 45 540 50 2375 85 324 1 3
APPS WITHDRAWN 2 12 1 3192 1368 23 378
FILES CLOSED FOR INCOMPLETENESS 10 1003
06/02/2014Report Date:
AGGREGATE TABLE 1: DISPOSITION OF LOAN APPLICATIONS, BY LOCATION OF PROPERTY AND TYPE OF LOAN, 2013
MSA/MD: 37964 - PHILADELPHIA, PA
Page 60 of 199
ALL LOANS ON PROPERTY LOCATED IN MSA/MD 3/
CENSUS TRACT OR COUNTY NAME ANDDISPOSITION OF APPLICATION 1/(STATE/COUNTY/TRACT NUMBER) FHA, FSA/RHS & VA Conventional
Refinancings Home ImprovementLoans
Loans on DwellingsFor 5 or More
Families
NonoccupantLoans From
Columns A, B, Cand D
Number Number Number Number Number Number$000's $000's $000's $000's $000's $000's
A B C D E F
Home Purchase Loans
Loans on 1- to 4-Family and Manufactured Home Dwellings
Loans OnManufactured Home
Dwellings FromColumns A, B, C & D
G
Number $000's
%MinPop4/
MedianIncome As
PCT ofMSA/MDMedian

PA/DELAWARE COUNTY/4034.02 32 84
LOANS ORIGINATED 8 36 3 1121 1695 660 3463 99 925
APPS APPROVED, NOT ACCEPTED 5 21 98 536 153
APPS DENIED 2 26 9 74 340 145 2717 100 518
APPS WITHDRAWN 1 13 13 220 39 1277 39
FILES CLOSED FOR INCOMPLETENESS 71 95 512
PA/DELAWARE COUNTY/4035.01 15 88
LOANS ORIGINATED 8 61 8 912 1828 922 7856 203 1716
APPS APPROVED, NOT ACCEPTED 71 102 1159
APPS DENIED 2 23 12211 3164 240
APPS WITHDRAWN 1 14 2 399 1658 75 331
FILES CLOSED FOR INCOMPLETENESS 5 1682 114
PA/DELAWARE COUNTY/4035.02 14 77
LOANS ORIGINATED 10 39 6 616 2224 1023 4826 175 789
APPS APPROVED, NOT ACCEPTED 3 1432 17
APPS DENIED 1 8 81 137 114 1096 206
APPS WITHDRAWN 2 9221 1295
FILES CLOSED FOR INCOMPLETENESS 6 878
PA/DELAWARE COUNTY/4036.01 7 103
LOANS ORIGINATED 7 47 8 2 216 2276 819 5557 245 1346 274
APPS APPROVED, NOT ACCEPTED 1 7 11 105 167 1132 5
APPS DENIED 1 23 8 1 21 94 100 3587 143 256 162
APPS WITHDRAWN 2 17 1 22 283 139 2158 70 214
FILES CLOSED FOR INCOMPLETENESS 10 975
PA/DELAWARE COUNTY/4036.02 4 84
LOANS ORIGINATED 4 27 7 29 1163 412 3426 319 281 1 116
APPS APPROVED, NOT ACCEPTED 1 676 656
APPS DENIED 2 21 3 11 93 152 2385 118 3
APPS WITHDRAWN 9 1162
FILES CLOSED FOR INCOMPLETENESS 5 1856 22
06/02/2014Report Date:
AGGREGATE TABLE 1: DISPOSITION OF LOAN APPLICATIONS, BY LOCATION OF PROPERTY AND TYPE OF LOAN, 2013
MSA/MD: 37964 - PHILADELPHIA, PA
Page 61 of 199
ALL LOANS ON PROPERTY LOCATED IN MSA/MD 3/
CENSUS TRACT OR COUNTY NAME ANDDISPOSITION OF APPLICATION 1/(STATE/COUNTY/TRACT NUMBER) FHA, FSA/RHS & VA Conventional
Refinancings Home ImprovementLoans
Loans on DwellingsFor 5 or More
Families
NonoccupantLoans From
Columns A, B, Cand D
Number Number Number Number Number Number$000's $000's $000's $000's $000's $000's
A B C D E F
Home Purchase Loans
Loans on 1- to 4-Family and Manufactured Home Dwellings
Loans OnManufactured Home
Dwellings FromColumns A, B, C & D
G
Number $000's
%MinPop4/
MedianIncome As
PCT ofMSA/MDMedian

PA/DELAWARE COUNTY/4037.01 7 63
LOANS ORIGINATED 6 27 5 65 809 626 3392 59 583
APPS APPROVED, NOT ACCEPTED 1 177
APPS DENIED 1 18 6 62 304 45 1931 79 273 1 45
APPS WITHDRAWN 3 377
FILES CLOSED FOR INCOMPLETENESS 4 504
PA/DELAWARE COUNTY/4037.02 8 86
LOANS ORIGINATED 7 32 6 1111 1279 667 3529 350 1042
APPS APPROVED, NOT ACCEPTED 4 12 305 460 105
APPS DENIED 2 23 3 6142 3002 121 647 1 5
APPS WITHDRAWN 1 12 2114 1398 194
FILES CLOSED FOR INCOMPLETENESS 1 7128 759
PA/DELAWARE COUNTY/4038.00 8 100
LOANS ORIGINATED 17 101 13 4 1523 3211 2401 12750 477 5534 1810
APPS APPROVED, NOT ACCEPTED 1 18 21 227 128 2888 368
APPS DENIED 2 33 10 26 762 173 3914 571 173
APPS WITHDRAWN 2 18 3 32 241 140 2695 73 322
FILES CLOSED FOR INCOMPLETENESS 153 494 2125
PA/DELAWARE COUNTY/4039.01 8 95
LOANS ORIGINATED 15 54 3 2 712 1966 1682 7088 59 4562 780
APPS APPROVED, NOT ACCEPTED 1 6 172 830 40
APPS DENIED 1 23 8 22 349 100 2803 101 163
APPS WITHDRAWN 1 12 13 437 184 1834 16
FILES CLOSED FOR INCOMPLETENESS 6 21 182 725 343
PA/DELAWARE COUNTY/4039.02 4 112
LOANS ORIGINATED 20 86 9 77 1283 2980 12474 385 984
APPS APPROVED, NOT ACCEPTED 1 81 236 83 1330
APPS DENIED 2 31 42 468 279 4848 165
APPS WITHDRAWN 2 142 315 292 2300
FILES CLOSED FOR INCOMPLETENESS 6 1024
06/02/2014Report Date:
AGGREGATE TABLE 1: DISPOSITION OF LOAN APPLICATIONS, BY LOCATION OF PROPERTY AND TYPE OF LOAN, 2013
MSA/MD: 37964 - PHILADELPHIA, PA
Page 62 of 199
ALL LOANS ON PROPERTY LOCATED IN MSA/MD 3/
CENSUS TRACT OR COUNTY NAME ANDDISPOSITION OF APPLICATION 1/(STATE/COUNTY/TRACT NUMBER) FHA, FSA/RHS & VA Conventional
Refinancings Home ImprovementLoans
Loans on DwellingsFor 5 or More
Families
NonoccupantLoans From
Columns A, B, Cand D
Number Number Number Number Number Number$000's $000's $000's $000's $000's $000's
A B C D E F
Home Purchase Loans
Loans on 1- to 4-Family and Manufactured Home Dwellings
Loans OnManufactured Home
Dwellings FromColumns A, B, C & D
G
Number $000's
%MinPop4/
MedianIncome As
PCT ofMSA/MDMedian

PA/DELAWARE COUNTY/4040.03 25 98
LOANS ORIGINATED 9 36 2 67 878 1177 4505 25 586
APPS APPROVED, NOT ACCEPTED 1 2250 360
APPS DENIED 2 10 7 22 270 152 1609 149 78
APPS WITHDRAWN 3 4 11 142 474 694 25
FILES CLOSED FOR INCOMPLETENESS 4 1865 417
PA/DELAWARE COUNTY/4040.04 6 95
LOANS ORIGINATED 33 114 4 527 4453 4388 15899 41 570
APPS APPROVED, NOT ACCEPTED 1 17 2 32 233 152 2562 217 424
APPS DENIED 4 55 15 73 505 456 8638 188 819
APPS WITHDRAWN 6 26 1 13 471 860 3725 140 93
FILES CLOSED FOR INCOMPLETENESS 1 13225 1813
PA/DELAWARE COUNTY/4041.01 13 82
LOANS ORIGINATED 36 115 14 419 3212 5638 15975 885 513
APPS APPROVED, NOT ACCEPTED 3 10 1558 1638 162
APPS DENIED 2 38 8 15 1035 312 6600 123 200
APPS WITHDRAWN 19 32 421 3120 147
FILES CLOSED FOR INCOMPLETENESS 1 13 1110 2126 30
PA/DELAWARE COUNTY/4041.02 18 90
LOANS ORIGINATED 10 52 5 523 3077 1215 6006 103 340 1 15
APPS APPROVED, NOT ACCEPTED 1 9 1 1110 1100 20 110
APPS DENIED 2 32 9 42 273 267 3968 133 388
APPS WITHDRAWN 3 83 381 353 951
FILES CLOSED FOR INCOMPLETENESS 10 1213
PA/DELAWARE COUNTY/4041.03 6 90
LOANS ORIGINATED 8 50 9 616 1855 867 6277 172 620
APPS APPROVED, NOT ACCEPTED 1 5 11 169 96 630 96
APPS DENIED 5 19 5 22 238 520 2565 215 220
APPS WITHDRAWN 11 21 160 1631 40
FILES CLOSED FOR INCOMPLETENESS 7 1 11 159 947 120 111
06/02/2014Report Date:
AGGREGATE TABLE 1: DISPOSITION OF LOAN APPLICATIONS, BY LOCATION OF PROPERTY AND TYPE OF LOAN, 2013
MSA/MD: 37964 - PHILADELPHIA, PA
Page 63 of 199
ALL LOANS ON PROPERTY LOCATED IN MSA/MD 3/
CENSUS TRACT OR COUNTY NAME ANDDISPOSITION OF APPLICATION 1/(STATE/COUNTY/TRACT NUMBER) FHA, FSA/RHS & VA Conventional
Refinancings Home ImprovementLoans
Loans on DwellingsFor 5 or More
Families
NonoccupantLoans From
Columns A, B, Cand D
Number Number Number Number Number Number$000's $000's $000's $000's $000's $000's
A B C D E F
Home Purchase Loans
Loans on 1- to 4-Family and Manufactured Home Dwellings
Loans OnManufactured Home
Dwellings FromColumns A, B, C & D
G
Number $000's
%MinPop4/
MedianIncome As
PCT ofMSA/MDMedian

PA/DELAWARE COUNTY/4043.00 20 60
LOANS ORIGINATED 1 22 2 47 605 49 1610 754 273
APPS APPROVED, NOT ACCEPTED 4 1 1370 525 92
APPS DENIED 1 19 9 83 304 86 1827 93 703 2 10
APPS WITHDRAWN 2 6 184 524 32
FILES CLOSED FOR INCOMPLETENESS 61 51 653
PA/DELAWARE COUNTY/4044.00 63 74
LOANS ORIGINATED 3 14 3 39 910 263 1359 228 243
APPS APPROVED, NOT ACCEPTED 1 187 87
APPS DENIED 16 3 11 79 1538 115 48
APPS WITHDRAWN 5 631
FILES CLOSED FOR INCOMPLETENESS 3 239
PA/DELAWARE COUNTY/4045.00 83 52
LOANS ORIGINATED 2 18 3 2 117 773 119 1312 40 10995 716
APPS APPROVED, NOT ACCEPTED 11 84 92
APPS DENIED 14 14 81138 260 439
APPS WITHDRAWN 5 1353 11
FILES CLOSED FOR INCOMPLETENESS 3 204
PA/DELAWARE COUNTY/4046.00 86 55
LOANS ORIGINATED 2 22 113 236 156 2935 2005
APPS APPROVED, NOT ACCEPTED 2 5 41 96 83 373 235
APPS DENIED 1 14 3 51 67 40 952 45 286
APPS WITHDRAWN 1 5 130 306 60
FILES CLOSED FOR INCOMPLETENESS 2 1130 40
PA/DELAWARE COUNTY/4047.00 51 43
LOANS ORIGINATED 1 9 4 750 543 10 378
APPS APPROVED, NOT ACCEPTED 1 150 50
APPS DENIED 10 4 61 98 638 13 260
APPS WITHDRAWN 1 88
FILES CLOSED FOR INCOMPLETENESS 1 194 46
06/02/2014Report Date:
AGGREGATE TABLE 1: DISPOSITION OF LOAN APPLICATIONS, BY LOCATION OF PROPERTY AND TYPE OF LOAN, 2013
MSA/MD: 37964 - PHILADELPHIA, PA
Page 64 of 199
ALL LOANS ON PROPERTY LOCATED IN MSA/MD 3/
CENSUS TRACT OR COUNTY NAME ANDDISPOSITION OF APPLICATION 1/(STATE/COUNTY/TRACT NUMBER) FHA, FSA/RHS & VA Conventional
Refinancings Home ImprovementLoans
Loans on DwellingsFor 5 or More
Families
NonoccupantLoans From
Columns A, B, Cand D
Number Number Number Number Number Number$000's $000's $000's $000's $000's $000's
A B C D E F
Home Purchase Loans
Loans on 1- to 4-Family and Manufactured Home Dwellings
Loans OnManufactured Home
Dwellings FromColumns A, B, C & D
G
Number $000's
%MinPop4/
MedianIncome As
PCT ofMSA/MDMedian

PA/DELAWARE COUNTY/4048.00 90 31
LOANS ORIGINATED 3 1 2121 24 96
APPS APPROVED, NOT ACCEPTED
APPS DENIED 2 3 11 726 156 194 160 1 50
APPS WITHDRAWN
FILES CLOSED FOR INCOMPLETENESS 1 3 120 152 20
PA/DELAWARE COUNTY/4049.00 94 46
LOANS ORIGINATED 3 1 3146 4 146
APPS APPROVED, NOT ACCEPTED
APPS DENIED 2 2 2111 52 52
APPS WITHDRAWN 1 325
FILES CLOSED FOR INCOMPLETENESS
PA/DELAWARE COUNTY/4050.00 94 34
LOANS ORIGINATED 4 1 21 47 135 1020 57
APPS APPROVED, NOT ACCEPTED 1 172 72
APPS DENIED 1 6 9 1 257 393 110 210 88
APPS WITHDRAWN
FILES CLOSED FOR INCOMPLETENESS
PA/DELAWARE COUNTY/4051.00 99 51
LOANS ORIGINATED 6 41 51 434 281
APPS APPROVED, NOT ACCEPTED
APPS DENIED 3 71 202 303 35
APPS WITHDRAWN 4 1 1325 525 56
FILES CLOSED FOR INCOMPLETENESS 2 122
PA/DELAWARE COUNTY/4052.00 99 38
LOANS ORIGINATED 2 10 1 1 31 55 73 712 6 3000 123
APPS APPROVED, NOT ACCEPTED 11 42 55
APPS DENIED 15 4 2845 48 82
APPS WITHDRAWN 2 122
FILES CLOSED FOR INCOMPLETENESS 2 1163 109
06/02/2014Report Date:
AGGREGATE TABLE 1: DISPOSITION OF LOAN APPLICATIONS, BY LOCATION OF PROPERTY AND TYPE OF LOAN, 2013
MSA/MD: 37964 - PHILADELPHIA, PA
Page 65 of 199
ALL LOANS ON PROPERTY LOCATED IN MSA/MD 3/
CENSUS TRACT OR COUNTY NAME ANDDISPOSITION OF APPLICATION 1/(STATE/COUNTY/TRACT NUMBER) FHA, FSA/RHS & VA Conventional
Refinancings Home ImprovementLoans
Loans on DwellingsFor 5 or More
Families
NonoccupantLoans From
Columns A, B, Cand D
Number Number Number Number Number Number$000's $000's $000's $000's $000's $000's
A B C D E F
Home Purchase Loans
Loans on 1- to 4-Family and Manufactured Home Dwellings
Loans OnManufactured Home
Dwellings FromColumns A, B, C & D
G
Number $000's
%MinPop4/
MedianIncome As
PCT ofMSA/MDMedian

PA/DELAWARE COUNTY/4053.00 92 48
LOANS ORIGINATED 2 3 4 35 395 180 103 52 228
APPS APPROVED, NOT ACCEPTED
APPS DENIED 1 4 6 21 55 20 237 70 71
APPS WITHDRAWN 2 2 11 55 80 101 9
FILES CLOSED FOR INCOMPLETENESS
PA/DELAWARE COUNTY/4054.00 91 27
LOANS ORIGINATED 2 5 2 5117 624 20 627
APPS APPROVED, NOT ACCEPTED 1 21
APPS DENIED 2 5 1203 49 2 1 2
APPS WITHDRAWN 4 3355 160
FILES CLOSED FOR INCOMPLETENESS 2 212
PA/DELAWARE COUNTY/4061.00 21 80
LOANS ORIGINATED 7 31 2 412 1355 693 3428 14 313
APPS APPROVED, NOT ACCEPTED 1 5124 571
APPS DENIED 2 22 6 65 597 52 3549 231 1431
APPS WITHDRAWN 1 103 386 138 891
FILES CLOSED FOR INCOMPLETENESS 1 11 137 86 154
PA/DELAWARE COUNTY/4062.01 9 96
LOANS ORIGINATED 13 70 7 521 3504 1689 10007 160 452
APPS APPROVED, NOT ACCEPTED 2 171 145 253 2294
APPS DENIED 5 32 12 26 711 328 4883 377 55
APPS WITHDRAWN 4 19 1 11 137 446 2736 10 95
FILES CLOSED FOR INCOMPLETENESS 9 11 137 1232 71
PA/DELAWARE COUNTY/4062.02 9 118
LOANS ORIGINATED 45 107 12 1722 3574 5715 15020 928 1627
APPS APPROVED, NOT ACCEPTED 5 11 1 3529 1420 25 394
APPS DENIED 4 39 8 91 150 981 4693 424 963
APPS WITHDRAWN 3 22 1433 2829 94
FILES CLOSED FOR INCOMPLETENESS 1 1584 2549
06/02/2014Report Date:
AGGREGATE TABLE 1: DISPOSITION OF LOAN APPLICATIONS, BY LOCATION OF PROPERTY AND TYPE OF LOAN, 2013
MSA/MD: 37964 - PHILADELPHIA, PA
Page 66 of 199
ALL LOANS ON PROPERTY LOCATED IN MSA/MD 3/
CENSUS TRACT OR COUNTY NAME ANDDISPOSITION OF APPLICATION 1/(STATE/COUNTY/TRACT NUMBER) FHA, FSA/RHS & VA Conventional
Refinancings Home ImprovementLoans
Loans on DwellingsFor 5 or More
Families
NonoccupantLoans From
Columns A, B, Cand D
Number Number Number Number Number Number$000's $000's $000's $000's $000's $000's
A B C D E F
Home Purchase Loans
Loans on 1- to 4-Family and Manufactured Home Dwellings
Loans OnManufactured Home
Dwellings FromColumns A, B, C & D
G
Number $000's
%MinPop4/
MedianIncome As
PCT ofMSA/MDMedian

PA/DELAWARE COUNTY/4063.00 50 70
LOANS ORIGINATED 7 29 5 64 327 681 2646 162 385
APPS APPROVED, NOT ACCEPTED
APPS DENIED 2 18 4 82 270 195 1667 33 518 1 2
APPS WITHDRAWN 1 7 1139 666 79
FILES CLOSED FOR INCOMPLETENESS 6 512 1 112
PA/DELAWARE COUNTY/4064.01 86 84
LOANS ORIGINATED 4 29 3 1610 758 249 1814 159 837
APPS APPROVED, NOT ACCEPTED 7 458
APPS DENIED 2 23 6 101 69 150 1556 72 486
APPS WITHDRAWN 6 1483 30
FILES CLOSED FOR INCOMPLETENESS 2 190
PA/DELAWARE COUNTY/4064.02 79 60
LOANS ORIGINATED 1 9 32 155 55 637 172
APPS APPROVED, NOT ACCEPTED 1 97
APPS DENIED 7 6 11 211 609 108 94
APPS WITHDRAWN 21 79 240
FILES CLOSED FOR INCOMPLETENESS
PA/DELAWARE COUNTY/4065.00 26 67
LOANS ORIGINATED 4 14 1 77 647 175 1160 4 537
APPS APPROVED, NOT ACCEPTED 2 122
APPS DENIED 12 9 75 395 1192 125 798
APPS WITHDRAWN 4 11 123 378 10
FILES CLOSED FOR INCOMPLETENESS 1 380 244
PA/DELAWARE COUNTY/4066.00 19 56
LOANS ORIGINATED 2 22 2 96 534 126 1665 45 582
APPS APPROVED, NOT ACCEPTED 2 171
APPS DENIED 1 8 1 12 152 52 742 10 78
APPS WITHDRAWN 11 36 79
FILES CLOSED FOR INCOMPLETENESS 1 7 2150 564 198
06/02/2014Report Date:
AGGREGATE TABLE 1: DISPOSITION OF LOAN APPLICATIONS, BY LOCATION OF PROPERTY AND TYPE OF LOAN, 2013
MSA/MD: 37964 - PHILADELPHIA, PA
Page 67 of 199
ALL LOANS ON PROPERTY LOCATED IN MSA/MD 3/
CENSUS TRACT OR COUNTY NAME ANDDISPOSITION OF APPLICATION 1/(STATE/COUNTY/TRACT NUMBER) FHA, FSA/RHS & VA Conventional
Refinancings Home ImprovementLoans
Loans on DwellingsFor 5 or More
Families
NonoccupantLoans From
Columns A, B, Cand D
Number Number Number Number Number Number$000's $000's $000's $000's $000's $000's
A B C D E F
Home Purchase Loans
Loans on 1- to 4-Family and Manufactured Home Dwellings
Loans OnManufactured Home
Dwellings FromColumns A, B, C & D
G
Number $000's
%MinPop4/
MedianIncome As
PCT ofMSA/MDMedian

PA/DELAWARE COUNTY/4067.00 15 76
LOANS ORIGINATED 9 44 6 1 157 599 570 4462 103 780 1344
APPS APPROVED, NOT ACCEPTED 6 3578 232
APPS DENIED 4 23 9 101 77 192 1977 192 555 1 3
APPS WITHDRAWN 1 12 11 74 62 1076 71
FILES CLOSED FOR INCOMPLETENESS 3 2267 129
PA/DELAWARE COUNTY/4068.01 19 109
LOANS ORIGINATED 30 89 8 617 2820 4402 13820 372 471
APPS APPROVED, NOT ACCEPTED 12 11 110 2140 15
APPS DENIED 1 22 5 15 788 150 3006 90 95
APPS WITHDRAWN 3 13 3 63 522 412 2133 185 815
FILES CLOSED FOR INCOMPLETENESS 1 101 142 155 1788
PA/DELAWARE COUNTY/4068.02 19 104
LOANS ORIGINATED 16 66 7 2 911 1671 2106 7365 127 1468 991
APPS APPROVED, NOT ACCEPTED 8 11050 97
APPS DENIED 5 37 8 63 383 342 4985 165 565
APPS WITHDRAWN 3 11 1 32 287 465 1357 41 387
FILES CLOSED FOR INCOMPLETENESS 3 4 11 121 381 529 25
PA/DELAWARE COUNTY/4068.03 16 121
LOANS ORIGINATED 38 165 11 1022 4298 5969 25257 665 1453 1 90
APPS APPROVED, NOT ACCEPTED 1 14 3 12 323 117 2350 201 117 1 55
APPS DENIED 4 44 15 23 535 266 6215 1080 65
APPS WITHDRAWN 5 28 3 21 162 746 4993 100 188
FILES CLOSED FOR INCOMPLETENESS 51 177 649
PA/DELAWARE COUNTY/4069.02 5 112
LOANS ORIGINATED 34 114 14 736 6945 5346 18297 956 817
APPS APPROVED, NOT ACCEPTED 2 6 13 404 276 1002 140
APPS DENIED 4 44 10 53 327 428 7180 174 476 1 2
APPS WITHDRAWN 3 28 2 25 680 641 4500 174 236
FILES CLOSED FOR INCOMPLETENESS 1 18 1274 3095 60
06/02/2014Report Date:
AGGREGATE TABLE 1: DISPOSITION OF LOAN APPLICATIONS, BY LOCATION OF PROPERTY AND TYPE OF LOAN, 2013
MSA/MD: 37964 - PHILADELPHIA, PA
Page 68 of 199
ALL LOANS ON PROPERTY LOCATED IN MSA/MD 3/
CENSUS TRACT OR COUNTY NAME ANDDISPOSITION OF APPLICATION 1/(STATE/COUNTY/TRACT NUMBER) FHA, FSA/RHS & VA Conventional
Refinancings Home ImprovementLoans
Loans on DwellingsFor 5 or More
Families
NonoccupantLoans From
Columns A, B, Cand D
Number Number Number Number Number Number$000's $000's $000's $000's $000's $000's
A B C D E F
Home Purchase Loans
Loans on 1- to 4-Family and Manufactured Home Dwellings
Loans OnManufactured Home
Dwellings FromColumns A, B, C & D
G
Number $000's
%MinPop4/
MedianIncome As
PCT ofMSA/MDMedian

PA/DELAWARE COUNTY/4069.03 4 116
LOANS ORIGINATED 36 103 10 415 3507 6740 17109 288 527
APPS APPROVED, NOT ACCEPTED 8 31 265 1583 24
APPS DENIED 5 25 11 11 287 1216 4071 708 147 1 25
APPS WITHDRAWN 6 131271 2589
FILES CLOSED FOR INCOMPLETENESS 2 8501 1496
PA/DELAWARE COUNTY/4069.04 11 136
LOANS ORIGINATED 48 125 11 109 1795 10948 22555 902 1492
APPS APPROVED, NOT ACCEPTED 3 17123 3383 3 123
APPS DENIED 7 42 10 41 15 1540 7693 440 598 1 45
APPS WITHDRAWN 4 22 1 12 240 1119 4428 40 42
FILES CLOSED FOR INCOMPLETENESS 1 10 11 359 379 1765 87
PA/DELAWARE COUNTY/4070.00 9 137
LOANS ORIGINATED 45 54 2 1 56 1500 11039 9626 111 37000 779
APPS APPROVED, NOT ACCEPTED 9 9 13072 2099 170
APPS DENIED 4 23 14 853 1163 3720 129
APPS WITHDRAWN 1 1490 3041
FILES CLOSED FOR INCOMPLETENESS 5 1082
PA/DELAWARE COUNTY/4071.01 10 135
LOANS ORIGINATED 41 104 12 2 56 2016 11346 20745 1594 7999 660
APPS APPROVED, NOT ACCEPTED 1 7 2250 1924 544
APPS DENIED 3 26 62 607 996 5766 1028
APPS WITHDRAWN 4 26 11 424 989 6373 205
FILES CLOSED FOR INCOMPLETENESS 1 6300 1336
PA/DELAWARE COUNTY/4071.02 6 138
LOANS ORIGINATED 21 81 1010 2497 5027 15461 944
APPS APPROVED, NOT ACCEPTED 15 3 13005 74 124
APPS DENIED 2 16 6 12 333 443 3187 449 182
APPS WITHDRAWN 4 7 11 110 1023 1712 84
FILES CLOSED FOR INCOMPLETENESS 6 1163
06/02/2014Report Date:
AGGREGATE TABLE 1: DISPOSITION OF LOAN APPLICATIONS, BY LOCATION OF PROPERTY AND TYPE OF LOAN, 2013
MSA/MD: 37964 - PHILADELPHIA, PA
Page 69 of 199
ALL LOANS ON PROPERTY LOCATED IN MSA/MD 3/
CENSUS TRACT OR COUNTY NAME ANDDISPOSITION OF APPLICATION 1/(STATE/COUNTY/TRACT NUMBER) FHA, FSA/RHS & VA Conventional
Refinancings Home ImprovementLoans
Loans on DwellingsFor 5 or More
Families
NonoccupantLoans From
Columns A, B, Cand D
Number Number Number Number Number Number$000's $000's $000's $000's $000's $000's
A B C D E F
Home Purchase Loans
Loans on 1- to 4-Family and Manufactured Home Dwellings
Loans OnManufactured Home
Dwellings FromColumns A, B, C & D
G
Number $000's
%MinPop4/
MedianIncome As
PCT ofMSA/MDMedian

PA/DELAWARE COUNTY/4072.01 9 174
LOANS ORIGINATED 51 95 9 1 43 780 17454 25847 1059 380 720
APPS APPROVED, NOT ACCEPTED 2 4733 701
APPS DENIED 7 182158 5503
APPS WITHDRAWN 10 83102 1973
FILES CLOSED FOR INCOMPLETENESS 6 11611 170
PA/DELAWARE COUNTY/4072.02 9 122
LOANS ORIGINATED 24 64 1 73 821 5836 12342 16 1171
APPS APPROVED, NOT ACCEPTED 1 7 11 177 180 1238 73
APPS DENIED 2 17 3 2124 3459 110 201
APPS WITHDRAWN 4 9 21 245 688 1787 396
FILES CLOSED FOR INCOMPLETENESS 1 4 1240 638 174
PA/DELAWARE COUNTY/4074.01 22 170
LOANS ORIGINATED 34 99 8 36 2197 10870 25162 1540 608
APPS APPROVED, NOT ACCEPTED 1 6 1263 1323 50
APPS DENIED 3 21 52 529 1253 6347 341
APPS WITHDRAWN 6 20 11 175 2138 5706 193
FILES CLOSED FOR INCOMPLETENESS 2 7 1705 1922 278
PA/DELAWARE COUNTY/4074.04 11 186
LOANS ORIGINATED 35 77 7 32 668 8574 17024 1462 497
APPS APPROVED, NOT ACCEPTED 2 81 236 285 2674
APPS DENIED 15 31 304 3327 345 1 9
APPS WITHDRAWN 4 10647 2186
FILES CLOSED FOR INCOMPLETENESS 1 3300 681
PA/DELAWARE COUNTY/4075.01 12 120
LOANS ORIGINATED 22 59 10 3 173 765 5257 12394 975 2635 3679
APPS APPROVED, NOT ACCEPTED 3 7 1 2899 1101 158 492
APPS DENIED 1 16 1 1 330 2976 17 550 455
APPS WITHDRAWN 4 6 1 1789 917 250 116
FILES CLOSED FOR INCOMPLETENESS 1 21 196 17 362
06/02/2014Report Date:
AGGREGATE TABLE 1: DISPOSITION OF LOAN APPLICATIONS, BY LOCATION OF PROPERTY AND TYPE OF LOAN, 2013
MSA/MD: 37964 - PHILADELPHIA, PA
Page 70 of 199
ALL LOANS ON PROPERTY LOCATED IN MSA/MD 3/
CENSUS TRACT OR COUNTY NAME ANDDISPOSITION OF APPLICATION 1/(STATE/COUNTY/TRACT NUMBER) FHA, FSA/RHS & VA Conventional
Refinancings Home ImprovementLoans
Loans on DwellingsFor 5 or More
Families
NonoccupantLoans From
Columns A, B, Cand D
Number Number Number Number Number Number$000's $000's $000's $000's $000's $000's
A B C D E F
Home Purchase Loans
Loans on 1- to 4-Family and Manufactured Home Dwellings
Loans OnManufactured Home
Dwellings FromColumns A, B, C & D
G
Number $000's
%MinPop4/
MedianIncome As
PCT ofMSA/MDMedian

PA/DELAWARE COUNTY/4075.02 23 75
LOANS ORIGINATED 22 33 8 3 86 1732 5943 6954 1117 2205 1782
APPS APPROVED, NOT ACCEPTED 1 4 1140 1041 180
APPS DENIED 3 9 3 31 378 1130 1847 331 781
APPS WITHDRAWN 2 5 1445 968 73
FILES CLOSED FOR INCOMPLETENESS 3 504
PA/DELAWARE COUNTY/4076.00 20 206
LOANS ORIGINATED 49 110 16 2 85 1677 14454 30184 2582 3700 1524
APPS APPROVED, NOT ACCEPTED 3 5 1969 1316 350
APPS DENIED 1 16 1 12 1214 600 3830 6 330
APPS WITHDRAWN 9 15 11 231 2931 4390 38
FILES CLOSED FOR INCOMPLETENESS 3 9 1998 1921 340
PA/DELAWARE COUNTY/4077.00 36 86
LOANS ORIGINATED 9 22 2 84 927 1672 2978 154 861
APPS APPROVED, NOT ACCEPTED 1 4 11 98 48 590 143
APPS DENIED 1 7 5 1 13 455 69 726 379 600 246
APPS WITHDRAWN 1 5 12 259 217 979 239
FILES CLOSED FOR INCOMPLETENESS 5 446
PA/DELAWARE COUNTY/4078.01 6 119
LOANS ORIGINATED 32 88 143 739 6530 16625 1062
APPS APPROVED, NOT ACCEPTED 1 9241 1999
APPS DENIED 4 22 8 1803 4249 547 210
APPS WITHDRAWN 3 14 3703 2924 743
FILES CLOSED FOR INCOMPLETENESS 7 1210
PA/DELAWARE COUNTY/4078.02 8 158
LOANS ORIGINATED 49 141 20 413 3389 11752 28066 1505 860
APPS APPROVED, NOT ACCEPTED 5 13 3 11 279 1468 2928 36 163
APPS DENIED 4 36 9 22 507 953 8524 529 343
APPS WITHDRAWN 4 18 43 565 772 4523 325
FILES CLOSED FOR INCOMPLETENESS 1 20 1200 4762 242
06/02/2014Report Date:
AGGREGATE TABLE 1: DISPOSITION OF LOAN APPLICATIONS, BY LOCATION OF PROPERTY AND TYPE OF LOAN, 2013
MSA/MD: 37964 - PHILADELPHIA, PA
Page 71 of 199
ALL LOANS ON PROPERTY LOCATED IN MSA/MD 3/
CENSUS TRACT OR COUNTY NAME ANDDISPOSITION OF APPLICATION 1/(STATE/COUNTY/TRACT NUMBER) FHA, FSA/RHS & VA Conventional
Refinancings Home ImprovementLoans
Loans on DwellingsFor 5 or More
Families
NonoccupantLoans From
Columns A, B, Cand D
Number Number Number Number Number Number$000's $000's $000's $000's $000's $000's
A B C D E F
Home Purchase Loans
Loans on 1- to 4-Family and Manufactured Home Dwellings
Loans OnManufactured Home
Dwellings FromColumns A, B, C & D
G
Number $000's
%MinPop4/
MedianIncome As
PCT ofMSA/MDMedian

PA/DELAWARE COUNTY/4078.03 6 130
LOANS ORIGINATED 45 120 17 419 4006 9981 22123 1276 592
APPS APPROVED, NOT ACCEPTED 3 7 2 2902 1688 48 276
APPS DENIED 1 42 10 32 467 247 8502 373 574
APPS WITHDRAWN 3 21 1 11 216 694 3838 3 64
FILES CLOSED FOR INCOMPLETENESS 2 12 1436 2729 291
PA/DELAWARE COUNTY/4078.04 5 139
LOANS ORIGINATED 27 103 13 38 2082 6060 18385 1100 627
APPS APPROVED, NOT ACCEPTED 1 11 1202 2191 7
APPS DENIED 2 29 10 2466 4963 506 298
APPS WITHDRAWN 1 27 22 535 233 5380 200
FILES CLOSED FOR INCOMPLETENESS 5 3996 100
PA/DELAWARE COUNTY/4078.05 9 111
LOANS ORIGINATED 24 28 5 43 814 5332 5355 216 863
APPS APPROVED, NOT ACCEPTED 1 1 1240 183 240
APPS DENIED 4 12 31025 2999 46
APPS WITHDRAWN 2 7 2478 1483 370
FILES CLOSED FOR INCOMPLETENESS 5 1108
PA/DELAWARE COUNTY/4078.06 16 105
LOANS ORIGINATED 15 34 3 22 439 2662 6039 335 360
APPS APPROVED, NOT ACCEPTED 4 1997 13
APPS DENIED 1 13 2 155 2490 41 102
APPS WITHDRAWN 1 81 199 199 1857
FILES CLOSED FOR INCOMPLETENESS 1 4 1148 728 148
PA/DELAWARE COUNTY/4079.01 7 184
LOANS ORIGINATED 41 97 9 44 1490 14442 32801 1301 1079
APPS APPROVED, NOT ACCEPTED 3 9 1 1757 2461 19 131
APPS DENIED 2 32 33 928 430 10795 170
APPS WITHDRAWN 6 13 2 12210 4181 40 125
FILES CLOSED FOR INCOMPLETENESS 1 3176 889
06/02/2014Report Date:
AGGREGATE TABLE 1: DISPOSITION OF LOAN APPLICATIONS, BY LOCATION OF PROPERTY AND TYPE OF LOAN, 2013
MSA/MD: 37964 - PHILADELPHIA, PA
Page 72 of 199
ALL LOANS ON PROPERTY LOCATED IN MSA/MD 3/
CENSUS TRACT OR COUNTY NAME ANDDISPOSITION OF APPLICATION 1/(STATE/COUNTY/TRACT NUMBER) FHA, FSA/RHS & VA Conventional
Refinancings Home ImprovementLoans
Loans on DwellingsFor 5 or More
Families
NonoccupantLoans From
Columns A, B, Cand D
Number Number Number Number Number Number$000's $000's $000's $000's $000's $000's
A B C D E F
Home Purchase Loans
Loans on 1- to 4-Family and Manufactured Home Dwellings
Loans OnManufactured Home
Dwellings FromColumns A, B, C & D
G
Number $000's
%MinPop4/
MedianIncome As
PCT ofMSA/MDMedian

PA/DELAWARE COUNTY/4079.02 12 137
LOANS ORIGINATED 36 86 1 112 501 10542 22387 390 2391
APPS APPROVED, NOT ACCEPTED 5 5 12116 1065 50
APPS DENIED 3 132 469 1017 2971
APPS WITHDRAWN 7 91 319 2383 1889
FILES CLOSED FOR INCOMPLETENESS 10 12598 161
PA/DELAWARE COUNTY/4079.03 16 118
LOANS ORIGINATED 37 68 6 71 256 7808 15045 677 962
APPS APPROVED, NOT ACCEPTED 3 7 5 2690 1365 344 109
APPS DENIED 4 20 2 21 335 995 4640 40 92
APPS WITHDRAWN 5 12 11 347 1294 2594 125
FILES CLOSED FOR INCOMPLETENESS 2 4 1 1694 741 100 100
PA/DELAWARE COUNTY/4080.01 10 134
LOANS ORIGINATED 38 141 12 74 1005 9835 34210 543 2128
APPS APPROVED, NOT ACCEPTED 3 11 41160 2613 500
APPS DENIED 8 36 5 72789 9393 121 703
APPS WITHDRAWN 6 27 2 11 280 1587 5737 175 181
FILES CLOSED FOR INCOMPLETENESS 12 1 22924 150 379
PA/DELAWARE COUNTY/4080.02 11 153
LOANS ORIGINATED 46 90 9 61 393 12272 23826 1126 1054
APPS APPROVED, NOT ACCEPTED 3 9 1780 2143 173
APPS DENIED 42 1 210474 150 263
APPS WITHDRAWN 6 131715 2898
FILES CLOSED FOR INCOMPLETENESS 2 6 1631 1940 115
PA/DELAWARE COUNTY/4081.01 11 115
LOANS ORIGINATED 32 93 4 210 2956 7956 21238 336 349
APPS APPROVED, NOT ACCEPTED 5 121498 3242
APPS DENIED 4 42 7 21000 8631 282 351
APPS WITHDRAWN 2 15 1 1828 3393 25 128
FILES CLOSED FOR INCOMPLETENESS 11 12310 128
06/02/2014Report Date:
AGGREGATE TABLE 1: DISPOSITION OF LOAN APPLICATIONS, BY LOCATION OF PROPERTY AND TYPE OF LOAN, 2013
MSA/MD: 37964 - PHILADELPHIA, PA
Page 73 of 199
ALL LOANS ON PROPERTY LOCATED IN MSA/MD 3/
CENSUS TRACT OR COUNTY NAME ANDDISPOSITION OF APPLICATION 1/(STATE/COUNTY/TRACT NUMBER) FHA, FSA/RHS & VA Conventional
Refinancings Home ImprovementLoans
Loans on DwellingsFor 5 or More
Families
NonoccupantLoans From
Columns A, B, Cand D
Number Number Number Number Number Number$000's $000's $000's $000's $000's $000's
A B C D E F
Home Purchase Loans
Loans on 1- to 4-Family and Manufactured Home Dwellings
Loans OnManufactured Home
Dwellings FromColumns A, B, C & D
G
Number $000's
%MinPop4/
MedianIncome As
PCT ofMSA/MDMedian

PA/DELAWARE COUNTY/4081.02 11 113
LOANS ORIGINATED 25 78 3 49 2254 5697 15699 227 780
APPS APPROVED, NOT ACCEPTED 2 6383 901
APPS DENIED 1 9 4 1276 1608 67 40
APPS WITHDRAWN 1 15 1 12 619 190 2772 50 190
FILES CLOSED FOR INCOMPLETENESS 1 4 1248 785 140
PA/DELAWARE COUNTY/4081.03 15 99
LOANS ORIGINATED 31 72 9 37 1993 6912 14082 819 477
APPS APPROVED, NOT ACCEPTED 2 61 309 475 1508
APPS DENIED 3 22 10 31 295 474 3593 365 561
APPS WITHDRAWN 4 13 11 275 658 2738 191
FILES CLOSED FOR INCOMPLETENESS 2 91 291 402 1961
PA/DELAWARE COUNTY/4083.00 18 205
LOANS ORIGINATED 35 88 6 42 459 11524 33613 900 693
APPS APPROVED, NOT ACCEPTED 1 9 2217 3265 258
APPS DENIED 3 19 2 11427 5906 35 202
APPS WITHDRAWN 4 14 1 2787 4110 182 262
FILES CLOSED FOR INCOMPLETENESS 18 11 397 6173 159
PA/DELAWARE COUNTY/4084.00 8 210
LOANS ORIGINATED 15 39 4 17699 17704 1351 1560
APPS APPROVED, NOT ACCEPTED 3 5 11830 1338 135
APPS DENIED 4 10 11841 3351 75
APPS WITHDRAWN 3 1 11052 476 75
FILES CLOSED FOR INCOMPLETENESS 4 1077
PA/DELAWARE COUNTY/4085.00 14 130
LOANS ORIGINATED 33 99 9 64 958 7911 19358 548 1116
APPS APPROVED, NOT ACCEPTED 7 11418 253
APPS DENIED 4 23 4 21 156 1012 4705 528 512
APPS WITHDRAWN 3 22 2 43 744 593 4888 177 805
FILES CLOSED FOR INCOMPLETENESS 1 4 295 1080 369
06/02/2014Report Date:
AGGREGATE TABLE 1: DISPOSITION OF LOAN APPLICATIONS, BY LOCATION OF PROPERTY AND TYPE OF LOAN, 2013
MSA/MD: 37964 - PHILADELPHIA, PA
Page 74 of 199
ALL LOANS ON PROPERTY LOCATED IN MSA/MD 3/
CENSUS TRACT OR COUNTY NAME ANDDISPOSITION OF APPLICATION 1/(STATE/COUNTY/TRACT NUMBER) FHA, FSA/RHS & VA Conventional
Refinancings Home ImprovementLoans
Loans on DwellingsFor 5 or More
Families
NonoccupantLoans From
Columns A, B, Cand D
Number Number Number Number Number Number$000's $000's $000's $000's $000's $000's
A B C D E F
Home Purchase Loans
Loans on 1- to 4-Family and Manufactured Home Dwellings
Loans OnManufactured Home
Dwellings FromColumns A, B, C & D
G
Number $000's
%MinPop4/
MedianIncome As
PCT ofMSA/MDMedian

PA/DELAWARE COUNTY/4086.00 7 155
LOANS ORIGINATED 35 76 5 1 77 1975 8875 15868 647 1610 984
APPS APPROVED, NOT ACCEPTED 2 71 358 437 1677
APPS DENIED 2 26 6 31 358 462 5815 208 581
APPS WITHDRAWN 3 16 11 358 716 3778 330
FILES CLOSED FOR INCOMPLETENESS 8 12083 243
PA/DELAWARE COUNTY/4087.00 7 167
LOANS ORIGINATED 57 123 15 1 76 1676 16092 27883 2148 3000 1560
APPS APPROVED, NOT ACCEPTED 1 11 1192 2917 38
APPS DENIED 3 33 2 1838 8281 29 141 1 4
APPS WITHDRAWN 5 13 1 11399 2389 75 225
FILES CLOSED FOR INCOMPLETENESS 1 6 1147 1036 270
PA/DELAWARE COUNTY/4088.00 13 130
LOANS ORIGINATED 52 150 11 1013 2917 11680 27181 1256 1418
APPS APPROVED, NOT ACCEPTED 3 14 21 206 831 2424 290
APPS DENIED 9 33 13 51 204 1928 5389 699 813
APPS WITHDRAWN 10 18 1 52073 3768 5 827
FILES CLOSED FOR INCOMPLETENESS 1 795 1182
PA/DELAWARE COUNTY/4089.00 9 145
LOANS ORIGINATED 33 70 6 33 954 9743 14867 1137 978
APPS APPROVED, NOT ACCEPTED 4 6546 1355
APPS DENIED 1 21 3 1206 5006 110 211
APPS WITHDRAWN 3 16 1 2697 3982 50 452
FILES CLOSED FOR INCOMPLETENESS 2 9734 2235
PA/DELAWARE COUNTY/4090.00 11 137
LOANS ORIGINATED 30 88 11 911 2553 7109 17274 803 1819
APPS APPROVED, NOT ACCEPTED 9 1 12032 8 297
APPS DENIED 2 23 10 2306 4985 510 346
APPS WITHDRAWN 4 16 1 12 397 775 2575 100 160
FILES CLOSED FOR INCOMPLETENESS 2 4356 767
06/02/2014Report Date:
AGGREGATE TABLE 1: DISPOSITION OF LOAN APPLICATIONS, BY LOCATION OF PROPERTY AND TYPE OF LOAN, 2013
MSA/MD: 37964 - PHILADELPHIA, PA
Page 75 of 199
ALL LOANS ON PROPERTY LOCATED IN MSA/MD 3/
CENSUS TRACT OR COUNTY NAME ANDDISPOSITION OF APPLICATION 1/(STATE/COUNTY/TRACT NUMBER) FHA, FSA/RHS & VA Conventional
Refinancings Home ImprovementLoans
Loans on DwellingsFor 5 or More
Families
NonoccupantLoans From
Columns A, B, Cand D
Number Number Number Number Number Number$000's $000's $000's $000's $000's $000's
A B C D E F
Home Purchase Loans
Loans on 1- to 4-Family and Manufactured Home Dwellings
Loans OnManufactured Home
Dwellings FromColumns A, B, C & D
G
Number $000's
%MinPop4/
MedianIncome As
PCT ofMSA/MDMedian

PA/DELAWARE COUNTY/4091.00 6 122
LOANS ORIGINATED 26 89 10 1 25 1327 6132 18334 848 2960 301
APPS APPROVED, NOT ACCEPTED 1 11 1176 2034 50
APPS DENIED 2 25 5 11 255 664 6111 435 219
APPS WITHDRAWN 6 16 1 11 220 1587 2868 86 206
FILES CLOSED FOR INCOMPLETENESS 1 10 11 162 240 1958 220
PA/DELAWARE COUNTY/4092.00 7 108
LOANS ORIGINATED 40 90 11 46 1641 8179 16508 631 640
APPS APPROVED, NOT ACCEPTED 10 2136
APPS DENIED 1 20 11 241 244 3905 50
APPS WITHDRAWN 4 17 22 406 866 2922 269
FILES CLOSED FOR INCOMPLETENESS 10 12 611 2004 228
PA/DELAWARE COUNTY/4093.00 10 131
LOANS ORIGINATED 23 36 5 1 45 988 5085 6699 702 2510 573
APPS APPROVED, NOT ACCEPTED 9 1929
APPS DENIED 3 15 5 1581 3048 419 113
APPS WITHDRAWN 6 71 226 1400 1461
FILES CLOSED FOR INCOMPLETENESS 7 1359
PA/DELAWARE COUNTY/4094.00 11 149
LOANS ORIGINATED 26 91 7 74 944 5487 15727 681 831
APPS APPROVED, NOT ACCEPTED 8 11715 318
APPS DENIED 3 26 5 2351 4767 218 267
APPS WITHDRAWN 5 15 3 11 196 1022 2841 341 75
FILES CLOSED FOR INCOMPLETENESS 10 11900 25
PA/DELAWARE COUNTY/4095.00 8 129
LOANS ORIGINATED 45 83 8 39 2325 11667 15781 556 502
APPS APPROVED, NOT ACCEPTED 1 11 2247 1781 300
APPS DENIED 6 30 5 12 531 1096 6340 310 146
APPS WITHDRAWN 6 22 2 12 495 1446 4476 174 24
FILES CLOSED FOR INCOMPLETENESS 1 7 1239 1427 25
06/02/2014Report Date:
AGGREGATE TABLE 1: DISPOSITION OF LOAN APPLICATIONS, BY LOCATION OF PROPERTY AND TYPE OF LOAN, 2013
MSA/MD: 37964 - PHILADELPHIA, PA
Page 76 of 199
ALL LOANS ON PROPERTY LOCATED IN MSA/MD 3/
CENSUS TRACT OR COUNTY NAME ANDDISPOSITION OF APPLICATION 1/(STATE/COUNTY/TRACT NUMBER) FHA, FSA/RHS & VA Conventional
Refinancings Home ImprovementLoans
Loans on DwellingsFor 5 or More
Families
NonoccupantLoans From
Columns A, B, Cand D
Number Number Number Number Number Number$000's $000's $000's $000's $000's $000's
A B C D E F
Home Purchase Loans
Loans on 1- to 4-Family and Manufactured Home Dwellings
Loans OnManufactured Home
Dwellings FromColumns A, B, C & D
G
Number $000's
%MinPop4/
MedianIncome As
PCT ofMSA/MDMedian

PA/DELAWARE COUNTY/4096.01 21 178
LOANS ORIGINATED 55 103 7 41 206 24719 44889 3287 742
APPS APPROVED, NOT ACCEPTED 2 81948 3596
APPS DENIED 7 28 1 23993 10448 50 585
APPS WITHDRAWN 10 82 623 4879 4327
FILES CLOSED FOR INCOMPLETENESS 6 11906 270
PA/DELAWARE COUNTY/4096.02 20 106
LOANS ORIGINATED 34 68 5 1 213 891 7255 13453 685 560 2711
APPS APPROVED, NOT ACCEPTED 1 11275 1765
APPS DENIED 6 13 1 5911 2862 10 891
APPS WITHDRAWN 8 8 12102 1597 68
FILES CLOSED FOR INCOMPLETENESS 8 11477 102
PA/DELAWARE COUNTY/4097.01 15 225
LOANS ORIGINATED 77 162 18 1 116 2056 43527 76893 4909 7200 5073
APPS APPROVED, NOT ACCEPTED 6 11 14269 4506 1440
APPS DENIED 4 34 10 52378 30830 2337 3356
APPS WITHDRAWN 13 27 36283 12850 739
FILES CLOSED FOR INCOMPLETENESS 2 21 388 1680 978
PA/DELAWARE COUNTY/4097.02 14 122
LOANS ORIGINATED 7 12 21 463 2443 3480 786
APPS APPROVED, NOT ACCEPTED 1 280
APPS DENIED 1 1372 304
APPS WITHDRAWN 2 690
FILES CLOSED FOR INCOMPLETENESS 1 675
PA/DELAWARE COUNTY/4098.02 15 157
LOANS ORIGINATED 53 93 7 1 101 196 30558 40778 2077 27000 3172
APPS APPROVED, NOT ACCEPTED 3 72498 2356
APPS DENIED 6 16 1 23150 10605 42 706
APPS WITHDRAWN 3 14 2 41517 6899 281 1107
FILES CLOSED FOR INCOMPLETENESS 6 23814 446
06/02/2014Report Date:
AGGREGATE TABLE 1: DISPOSITION OF LOAN APPLICATIONS, BY LOCATION OF PROPERTY AND TYPE OF LOAN, 2013
MSA/MD: 37964 - PHILADELPHIA, PA
Page 77 of 199
ALL LOANS ON PROPERTY LOCATED IN MSA/MD 3/
CENSUS TRACT OR COUNTY NAME ANDDISPOSITION OF APPLICATION 1/(STATE/COUNTY/TRACT NUMBER) FHA, FSA/RHS & VA Conventional
Refinancings Home ImprovementLoans
Loans on DwellingsFor 5 or More
Families
NonoccupantLoans From
Columns A, B, Cand D
Number Number Number Number Number Number$000's $000's $000's $000's $000's $000's
A B C D E F
Home Purchase Loans
Loans on 1- to 4-Family and Manufactured Home Dwellings
Loans OnManufactured Home
Dwellings FromColumns A, B, C & D
G
Number $000's
%MinPop4/
MedianIncome As
PCT ofMSA/MDMedian

PA/DELAWARE COUNTY/4098.03 14 161
LOANS ORIGINATED 77 157 11 4 281 422 32222 55030 2276 4245 6105
APPS APPROVED, NOT ACCEPTED 4 12 3 1 32273 3839 1044 850 1209
APPS DENIED 8 25 4 62370 8717 156 1077
APPS WITHDRAWN 10 22 2 43461 7085 185 593
FILES CLOSED FOR INCOMPLETENESS 1 6 160 3828 113
PA/DELAWARE COUNTY/4099.02 7 151
LOANS ORIGINATED 39 98 7 1 65 1444 12196 24350 1118 37830 1362
APPS APPROVED, NOT ACCEPTED 2 13 11504 3373 394
APPS DENIED 1 29 3 1176 8457 119 308
APPS WITHDRAWN 3 18 1 21 422 1936 3754 417 606
FILES CLOSED FOR INCOMPLETENESS 9 1726
PA/DELAWARE COUNTY/4099.03 5 134
LOANS ORIGINATED 41 98 16 1 711 3032 11437 21840 1612 275 970
APPS APPROVED, NOT ACCEPTED 4 8973 1727
APPS DENIED 1 24 3 22 589 328 5742 170 214
APPS WITHDRAWN 5 14 11 228 1609 3220 25
FILES CLOSED FOR INCOMPLETENESS 1 4 1238 894 223
PA/DELAWARE COUNTY/4099.04 6 244
LOANS ORIGINATED 39 98 11 717436 43020 1393 1130
APPS APPROVED, NOT ACCEPTED 6 6 13482 2039 175
APPS DENIED 7 33 3 45096 14404 113 707
APPS WITHDRAWN 7 224201 7142
FILES CLOSED FOR INCOMPLETENESS 2 11 2530 4134 520
PA/DELAWARE COUNTY/4100.00 7 199
LOANS ORIGINATED 55 79 6 33 906 19312 26610 810 1240
APPS APPROVED, NOT ACCEPTED 4 6 11835 1704 110
APPS DENIED 6 22 41 319 2244 7498 143
APPS WITHDRAWN 3 17521 6512
FILES CLOSED FOR INCOMPLETENESS 61 169 1960
06/02/2014Report Date:
AGGREGATE TABLE 1: DISPOSITION OF LOAN APPLICATIONS, BY LOCATION OF PROPERTY AND TYPE OF LOAN, 2013
MSA/MD: 37964 - PHILADELPHIA, PA
Page 78 of 199
ALL LOANS ON PROPERTY LOCATED IN MSA/MD 3/
CENSUS TRACT OR COUNTY NAME ANDDISPOSITION OF APPLICATION 1/(STATE/COUNTY/TRACT NUMBER) FHA, FSA/RHS & VA Conventional
Refinancings Home ImprovementLoans
Loans on DwellingsFor 5 or More
Families
NonoccupantLoans From
Columns A, B, Cand D
Number Number Number Number Number Number$000's $000's $000's $000's $000's $000's
A B C D E F
Home Purchase Loans
Loans on 1- to 4-Family and Manufactured Home Dwellings
Loans OnManufactured Home
Dwellings FromColumns A, B, C & D
G
Number $000's
%MinPop4/
MedianIncome As
PCT ofMSA/MDMedian
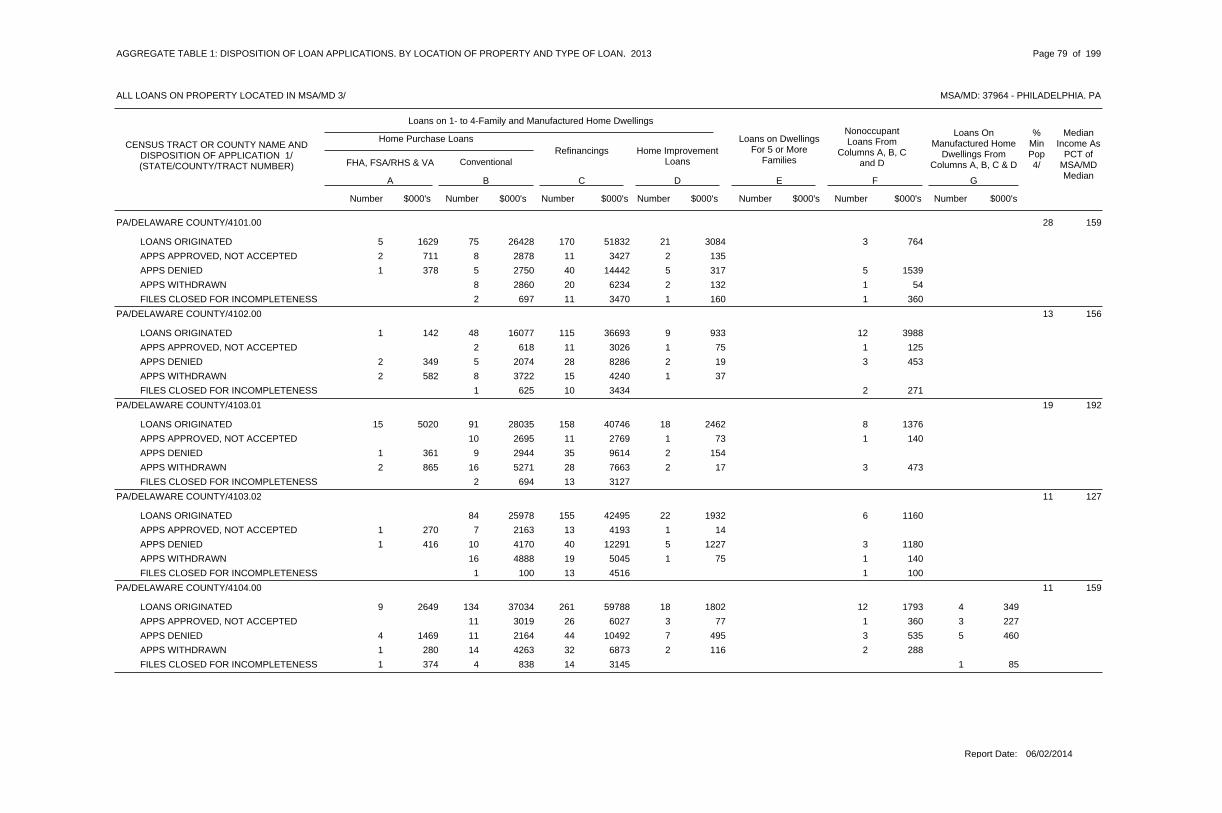
PA/DELAWARE COUNTY/4101.00 28 159
LOANS ORIGINATED 75 170 21 35 1629 26428 51832 3084 764
APPS APPROVED, NOT ACCEPTED 8 11 22 711 2878 3427 135
APPS DENIED 5 40 5 51 378 2750 14442 317 1539
APPS WITHDRAWN 8 20 2 12860 6234 132 54
FILES CLOSED FOR INCOMPLETENESS 2 11 1 1697 3470 160 360
PA/DELAWARE COUNTY/4102.00 13 156
LOANS ORIGINATED 48 115 9 121 142 16077 36693 933 3988
APPS APPROVED, NOT ACCEPTED 2 11 1 1618 3026 75 125
APPS DENIED 5 28 2 32 349 2074 8286 19 453
APPS WITHDRAWN 8 15 12 582 3722 4240 37
FILES CLOSED FOR INCOMPLETENESS 1 10 2625 3434 271
PA/DELAWARE COUNTY/4103.01 19 192
LOANS ORIGINATED 91 158 18 815 5020 28035 40746 2462 1376
APPS APPROVED, NOT ACCEPTED 10 11 1 12695 2769 73 140
APPS DENIED 9 35 21 361 2944 9614 154
APPS WITHDRAWN 16 28 2 32 865 5271 7663 17 473
FILES CLOSED FOR INCOMPLETENESS 2 13694 3127
PA/DELAWARE COUNTY/4103.02 11 127
LOANS ORIGINATED 84 155 22 625978 42495 1932 1160
APPS APPROVED, NOT ACCEPTED 7 13 11 270 2163 4193 14
APPS DENIED 10 40 5 31 416 4170 12291 1227 1180
APPS WITHDRAWN 16 19 1 14888 5045 75 140
FILES CLOSED FOR INCOMPLETENESS 1 13 1100 4516 100
PA/DELAWARE COUNTY/4104.00 11 159
LOANS ORIGINATED 134 261 18 129 2649 37034 59788 1802 1793 4 349
APPS APPROVED, NOT ACCEPTED 11 26 3 13019 6027 77 360 3 227
APPS DENIED 11 44 7 34 1469 2164 10492 495 535 5 460
APPS WITHDRAWN 14 32 2 21 280 4263 6873 116 288
FILES CLOSED FOR INCOMPLETENESS 4 141 374 838 3145 1 85
06/02/2014Report Date:
AGGREGATE TABLE 1: DISPOSITION OF LOAN APPLICATIONS, BY LOCATION OF PROPERTY AND TYPE OF LOAN, 2013
MSA/MD: 37964 - PHILADELPHIA, PA
Page 79 of 199
ALL LOANS ON PROPERTY LOCATED IN MSA/MD 3/
CENSUS TRACT OR COUNTY NAME ANDDISPOSITION OF APPLICATION 1/(STATE/COUNTY/TRACT NUMBER) FHA, FSA/RHS & VA Conventional
Refinancings Home ImprovementLoans
Loans on DwellingsFor 5 or More
Families
NonoccupantLoans From
Columns A, B, Cand D
Number Number Number Number Number Number$000's $000's $000's $000's $000's $000's
A B C D E F
Home Purchase Loans
Loans on 1- to 4-Family and Manufactured Home Dwellings
Loans OnManufactured Home
Dwellings FromColumns A, B, C & D
G
Number $000's
%MinPop4/
MedianIncome As
PCT ofMSA/MDMedian

PA/DELAWARE COUNTY/4105.00 85 56
LOANS ORIGINATED 8 29 6 77 622 585 2552 103 537
APPS APPROVED, NOT ACCEPTED 11 2 11228 30 132
APPS DENIED 9 23 11 23 259 931 2132 323 245
APPS WITHDRAWN 3 3 1 11 130 232 220 20 90
FILES CLOSED FOR INCOMPLETENESS 1 7 1102 476 103
PA/DELAWARE COUNTY/4106.01 6 108
LOANS ORIGINATED 19 58 5 717 2919 2732 7910 87 813
APPS APPROVED, NOT ACCEPTED 14 1 12231 30 78
APPS DENIED 1 21 2 41 75 133 3084 30 667
APPS WITHDRAWN 1 17 16 870 70 2371 87
FILES CLOSED FOR INCOMPLETENESS 6 723
PA/DELAWARE COUNTY/4106.02 9 116
LOANS ORIGINATED 29 93 22 1 412 2169 4998 14599 920 3383 461
APPS APPROVED, NOT ACCEPTED 18 2742
APPS DENIED 3 32 8 13 564 431 4614 230 80
APPS WITHDRAWN 3 22 2 1508 3378 215 81
FILES CLOSED FOR INCOMPLETENESS 11 11464 25
PA/DELAWARE COUNTY/4107.00 88 38
LOANS ORIGINATED 1 5 1 1 41 38 153 1609 15 620 1732
APPS APPROVED, NOT ACCEPTED 1 26
APPS DENIED 1 6 22 91 70 29 312 395 281
APPS WITHDRAWN 4 2148 79
FILES CLOSED FOR INCOMPLETENESS 1 21
PA/DELAWARE COUNTY/4108.00 14 131
LOANS ORIGINATED 80 185 24 1420 4707 19070 35076 1663 1505
APPS APPROVED, NOT ACCEPTED 3 19 2 1586 4459 45 150
APPS DENIED 5 43 11 43 523 1012 9552 284 394
APPS WITHDRAWN 14 34 3 51 227 2736 6566 289 743
FILES CLOSED FOR INCOMPLETENESS 2 6 11 255 447 962 65
06/02/2014Report Date:
AGGREGATE TABLE 1: DISPOSITION OF LOAN APPLICATIONS, BY LOCATION OF PROPERTY AND TYPE OF LOAN, 2013
MSA/MD: 37964 - PHILADELPHIA, PA
Page 80 of 199
ALL LOANS ON PROPERTY LOCATED IN MSA/MD 3/
CENSUS TRACT OR COUNTY NAME ANDDISPOSITION OF APPLICATION 1/(STATE/COUNTY/TRACT NUMBER) FHA, FSA/RHS & VA Conventional
Refinancings Home ImprovementLoans
Loans on DwellingsFor 5 or More
Families
NonoccupantLoans From
Columns A, B, Cand D
Number Number Number Number Number Number$000's $000's $000's $000's $000's $000's
A B C D E F
Home Purchase Loans
Loans on 1- to 4-Family and Manufactured Home Dwellings
Loans OnManufactured Home
Dwellings FromColumns A, B, C & D
G
Number $000's
%MinPop4/
MedianIncome As
PCT ofMSA/MDMedian

PA/MONTGOMERY COUNTY/2001.03 12 157
LOANS ORIGINATED 34 92 61 259 12367 25769 836
APPS APPROVED, NOT ACCEPTED 4 91 248 1441 2704
APPS DENIED 5 31 31526 9699 345
APPS WITHDRAWN 7 92739 2397
FILES CLOSED FOR INCOMPLETENESS 10 12267 260
PA/MONTGOMERY COUNTY/2001.04 9 129
LOANS ORIGINATED 26 104 4 46 1765 7093 24411 350 833
APPS APPROVED, NOT ACCEPTED 2 11 11214 2813 175
APPS DENIED 2 18 5 2410 5412 395 412
APPS WITHDRAWN 3 15 1882 3438 16
FILES CLOSED FOR INCOMPLETENESS 6 1186
PA/MONTGOMERY COUNTY/2001.05 20 155
LOANS ORIGINATED 32 57 7 1 22 736 9264 13982 726 425 604
APPS APPROVED, NOT ACCEPTED 3 5 1779 1349 75
APPS DENIED 4 16 11 292 1590 3994 40
APPS WITHDRAWN 5 11 1 11236 3345 150 130
FILES CLOSED FOR INCOMPLETENESS 2 6 1420 1506 203
PA/MONTGOMERY COUNTY/2001.06 13 185
LOANS ORIGINATED 11 38 6 32 428 2432 12353 675 784
APPS APPROVED, NOT ACCEPTED 8 12088 10
APPS DENIED 1 13 247 4298 558 1 47
APPS WITHDRAWN 2 81010 2145
FILES CLOSED FOR INCOMPLETENESS 2 9 2624 2101 507
PA/MONTGOMERY COUNTY/2002.00 9 117
LOANS ORIGINATED 9 26 4 53147 6080 166 1684
APPS APPROVED, NOT ACCEPTED 3 804
APPS DENIED 7 12210 163
APPS WITHDRAWN 4 955
FILES CLOSED FOR INCOMPLETENESS 3 11459 289
06/02/2014Report Date:
AGGREGATE TABLE 1: DISPOSITION OF LOAN APPLICATIONS, BY LOCATION OF PROPERTY AND TYPE OF LOAN, 2013
MSA/MD: 37964 - PHILADELPHIA, PA
Page 81 of 199
ALL LOANS ON PROPERTY LOCATED IN MSA/MD 3/
CENSUS TRACT OR COUNTY NAME ANDDISPOSITION OF APPLICATION 1/(STATE/COUNTY/TRACT NUMBER) FHA, FSA/RHS & VA Conventional
Refinancings Home ImprovementLoans
Loans on DwellingsFor 5 or More
Families
NonoccupantLoans From
Columns A, B, Cand D
Number Number Number Number Number Number$000's $000's $000's $000's $000's $000's
A B C D E F
Home Purchase Loans
Loans on 1- to 4-Family and Manufactured Home Dwellings
Loans OnManufactured Home
Dwellings FromColumns A, B, C & D
G
Number $000's
%MinPop4/
MedianIncome As
PCT ofMSA/MDMedian

PA/MONTGOMERY COUNTY/2003.01 24 100
LOANS ORIGINATED 29 72 8 512 2690 5319 12685 610 639
APPS APPROVED, NOT ACCEPTED 1 10 11 200 406 1946 272
APPS DENIED 4 19 3 13 843 745 3190 52 210
APPS WITHDRAWN 6 91 177 1016 1734
FILES CLOSED FOR INCOMPLETENESS 1 9 1170 1669 155
PA/MONTGOMERY COUNTY/2003.05 5 121
LOANS ORIGINATED 24 51 6 37 1487 5204 8841 324 411
APPS APPROVED, NOT ACCEPTED 4 1 1754 5 180
APPS DENIED 16 32930 90
APPS WITHDRAWN 8 1384
FILES CLOSED FOR INCOMPLETENESS 13 2623
PA/MONTGOMERY COUNTY/2003.06 7 113
LOANS ORIGINATED 21 63 1 81 286 4649 12545 120 1355
APPS APPROVED, NOT ACCEPTED 1 4 11 123 220 969 50
APPS DENIED 2 23 1 12 351 385 4636 40 224
APPS WITHDRAWN 6 17 1 21227 3211 100 304
FILES CLOSED FOR INCOMPLETENESS 2 5378 909
PA/MONTGOMERY COUNTY/2003.07 20 102
LOANS ORIGINATED 11 47 4 33 562 2184 7219 209 557
APPS APPROVED, NOT ACCEPTED 4 801
APPS DENIED 14 4 12687 164 130
APPS WITHDRAWN 2 6 1544 847 40
FILES CLOSED FOR INCOMPLETENESS 1 208
PA/MONTGOMERY COUNTY/2003.08 20 92
LOANS ORIGINATED 22 57 5 812 2468 4333 9395 430 1328
APPS APPROVED, NOT ACCEPTED 2 9 11 187 462 1655 229
APPS DENIED 2 22 5 61 172 166 3373 193 512
APPS WITHDRAWN 3 11 1 21 191 732 1871 176 214
FILES CLOSED FOR INCOMPLETENESS 8 1473
06/02/2014Report Date:
AGGREGATE TABLE 1: DISPOSITION OF LOAN APPLICATIONS, BY LOCATION OF PROPERTY AND TYPE OF LOAN, 2013
MSA/MD: 37964 - PHILADELPHIA, PA
Page 82 of 199
ALL LOANS ON PROPERTY LOCATED IN MSA/MD 3/
CENSUS TRACT OR COUNTY NAME ANDDISPOSITION OF APPLICATION 1/(STATE/COUNTY/TRACT NUMBER) FHA, FSA/RHS & VA Conventional
Refinancings Home ImprovementLoans
Loans on DwellingsFor 5 or More
Families
NonoccupantLoans From
Columns A, B, Cand D
Number Number Number Number Number Number$000's $000's $000's $000's $000's $000's
A B C D E F
Home Purchase Loans
Loans on 1- to 4-Family and Manufactured Home Dwellings
Loans OnManufactured Home
Dwellings FromColumns A, B, C & D
G
Number $000's
%MinPop4/
MedianIncome As
PCT ofMSA/MDMedian

PA/MONTGOMERY COUNTY/2003.09 7 93
LOANS ORIGINATED 19 66 9 310 2270 3789 10487 437 518
APPS APPROVED, NOT ACCEPTED 1 6 2 1275 1108 111 115
APPS DENIED 1 14 54 856 38 2583 49
APPS WITHDRAWN 2 92 435 470 1185
FILES CLOSED FOR INCOMPLETENESS 7 1345
PA/MONTGOMERY COUNTY/2003.10 6 141
LOANS ORIGINATED 25 46 65 1409 6408 10815 648
APPS APPROVED, NOT ACCEPTED 1 2288 341
APPS DENIED 12 33294 1061
APPS WITHDRAWN 3 13775 2916
FILES CLOSED FOR INCOMPLETENESS 7 1223
PA/MONTGOMERY COUNTY/2004.01 7 100
LOANS ORIGINATED 19 59 4 1 88 1942 3573 10095 377 315 1437
APPS APPROVED, NOT ACCEPTED 1 5 11 81 140 854 5
APPS DENIED 2 19 3 1 1405 3342 65 510 263
APPS WITHDRAWN 1 16 1 22 374 209 3131 25 279
FILES CLOSED FOR INCOMPLETENESS 7 1387
PA/MONTGOMERY COUNTY/2004.02 12 105
LOANS ORIGINATED 24 83 13 715 3010 4367 14256 410 1066 1 8
APPS APPROVED, NOT ACCEPTED 8 1646
APPS DENIED 1 20 42 390 109 3693 63
APPS WITHDRAWN 1 9 1 21 225 200 1516 5 246
FILES CLOSED FOR INCOMPLETENESS 6 1776 112
PA/MONTGOMERY COUNTY/2005.01 8 127
LOANS ORIGINATED 37 98 16 410 2585 10241 18347 764 759
APPS APPROVED, NOT ACCEPTED 2 7 1638 1209 328
APPS DENIED 4 25 31 299 936 5960 110
APPS WITHDRAWN 2 141 280 594 2205
FILES CLOSED FOR INCOMPLETENESS 1 101 204 372 2163
06/02/2014Report Date:
AGGREGATE TABLE 1: DISPOSITION OF LOAN APPLICATIONS, BY LOCATION OF PROPERTY AND TYPE OF LOAN, 2013
MSA/MD: 37964 - PHILADELPHIA, PA
Page 83 of 199
ALL LOANS ON PROPERTY LOCATED IN MSA/MD 3/
CENSUS TRACT OR COUNTY NAME ANDDISPOSITION OF APPLICATION 1/(STATE/COUNTY/TRACT NUMBER) FHA, FSA/RHS & VA Conventional
Refinancings Home ImprovementLoans
Loans on DwellingsFor 5 or More
Families
NonoccupantLoans From
Columns A, B, Cand D
Number Number Number Number Number Number$000's $000's $000's $000's $000's $000's
A B C D E F
Home Purchase Loans
Loans on 1- to 4-Family and Manufactured Home Dwellings
Loans OnManufactured Home
Dwellings FromColumns A, B, C & D
G
Number $000's
%MinPop4/
MedianIncome As
PCT ofMSA/MDMedian

PA/MONTGOMERY COUNTY/2005.02 21 70
LOANS ORIGINATED 23 82 4 1 209 1850 4433 14021 128 9100 3818
APPS APPROVED, NOT ACCEPTED 2 5 1 2249 586 30 364 1 99
APPS DENIED 2 25 1 32 407 407 3995 7 570
APPS WITHDRAWN 2 13 11 334 384 2448 218
FILES CLOSED FOR INCOMPLETENESS 1 5183 808
PA/MONTGOMERY COUNTY/2005.05 18 202
LOANS ORIGINATED 45 170 13 1 11 417 18174 53483 1746 600 303
APPS APPROVED, NOT ACCEPTED 1 141776 3578
APPS DENIED 3 361047 10108
APPS WITHDRAWN 8 193682 5377
FILES CLOSED FOR INCOMPLETENESS 1 15143 4541
PA/MONTGOMERY COUNTY/2005.06 13 137
LOANS ORIGINATED 42 101 8 76 1250 14929 20553 1330 1279
APPS APPROVED, NOT ACCEPTED 4 10 11 239 1490 2538 17
APPS DENIED 2 33 11 22 768 957 6523 208 627 1 25
APPS WITHDRAWN 6 18 12146 4448 14
FILES CLOSED FOR INCOMPLETENESS 2 6323 1480
PA/MONTGOMERY COUNTY/2005.07 17 112
LOANS ORIGINATED 48 150 8 2316 3415 9537 24943 580 3281
APPS APPROVED, NOT ACCEPTED 3 24 1 22 326 695 4508 22 320
APPS DENIED 2 49 10 74 760 610 9469 702 1119
APPS WITHDRAWN 4 27 2 31315 5006 482 528
FILES CLOSED FOR INCOMPLETENESS 4 101 164 1315 2373
PA/MONTGOMERY COUNTY/2006.02 32 130
LOANS ORIGINATED 113 226 23 1 2815 4611 26925 46820 1814 28750 4993
APPS APPROVED, NOT ACCEPTED 7 12 1 21516 2666 208 241
APPS DENIED 9 56 6 52 492 1945 14155 381 1013 1 28
APPS WITHDRAWN 14 25 2 33457 5832 68 629
FILES CLOSED FOR INCOMPLETENESS 5 12 1684 2638 100
06/02/2014Report Date:
AGGREGATE TABLE 1: DISPOSITION OF LOAN APPLICATIONS, BY LOCATION OF PROPERTY AND TYPE OF LOAN, 2013
MSA/MD: 37964 - PHILADELPHIA, PA
Page 84 of 199
ALL LOANS ON PROPERTY LOCATED IN MSA/MD 3/
CENSUS TRACT OR COUNTY NAME ANDDISPOSITION OF APPLICATION 1/(STATE/COUNTY/TRACT NUMBER) FHA, FSA/RHS & VA Conventional
Refinancings Home ImprovementLoans
Loans on DwellingsFor 5 or More
Families
NonoccupantLoans From
Columns A, B, Cand D
Number Number Number Number Number Number$000's $000's $000's $000's $000's $000's
A B C D E F
Home Purchase Loans
Loans on 1- to 4-Family and Manufactured Home Dwellings
Loans OnManufactured Home
Dwellings FromColumns A, B, C & D
G
Number $000's
%MinPop4/
MedianIncome As
PCT ofMSA/MDMedian

PA/MONTGOMERY COUNTY/2006.03 18 156
LOANS ORIGINATED 29 100 8 813 3291 8064 19281 624 1675
APPS APPROVED, NOT ACCEPTED 2 17 1552 3891 100
APPS DENIED 2 28 3 11 246 618 6691 143 141
APPS WITHDRAWN 3 10 1978 2066 22
FILES CLOSED FOR INCOMPLETENESS 3 7 11019 1096 163
PA/MONTGOMERY COUNTY/2006.05 23 166
LOANS ORIGINATED 96 130 11 134 1338 30213 36635 1341 3428 4 209
APPS APPROVED, NOT ACCEPTED 17 11 2 13096 2983 335 100 10 694
APPS DENIED 12 20 5 15 1583 2608 5803 137 79 3 98
APPS WITHDRAWN 15 255025 7947
FILES CLOSED FOR INCOMPLETENESS 4 6 21 285 1209 1641 195
PA/MONTGOMERY COUNTY/2006.06 21 164
LOANS ORIGINATED 23 95 10 1311 1903 4863 15686 1146 1358
APPS APPROVED, NOT ACCEPTED 1 7 1283 1139 98
APPS DENIED 1 24 3 2128 3637 185 333
APPS WITHDRAWN 4 16 12 325 869 3089 110
FILES CLOSED FOR INCOMPLETENESS 3 3874 424
PA/MONTGOMERY COUNTY/2006.07 23 150
LOANS ORIGINATED 51 141 8 67 1875 12159 28827 604 806
APPS APPROVED, NOT ACCEPTED 2 7 1470 1548 7
APPS DENIED 1 23 3 3250 5087 70 693
APPS WITHDRAWN 5 19 1 21262 3986 346 380
FILES CLOSED FOR INCOMPLETENESS 10 2252
PA/MONTGOMERY COUNTY/2007.03 24 119
LOANS ORIGINATED 33 100 12 1 29 2283 7756 18441 900 650 267
APPS APPROVED, NOT ACCEPTED 1 13 1192 2893 244
APPS DENIED 4 25 6 1867 5238 133 60
APPS WITHDRAWN 3 16 2689 3530 40
FILES CLOSED FOR INCOMPLETENESS 1 7155 1501
06/02/2014Report Date:
AGGREGATE TABLE 1: DISPOSITION OF LOAN APPLICATIONS, BY LOCATION OF PROPERTY AND TYPE OF LOAN, 2013
MSA/MD: 37964 - PHILADELPHIA, PA
Page 85 of 199
ALL LOANS ON PROPERTY LOCATED IN MSA/MD 3/
CENSUS TRACT OR COUNTY NAME ANDDISPOSITION OF APPLICATION 1/(STATE/COUNTY/TRACT NUMBER) FHA, FSA/RHS & VA Conventional
Refinancings Home ImprovementLoans
Loans on DwellingsFor 5 or More
Families
NonoccupantLoans From
Columns A, B, Cand D
Number Number Number Number Number Number$000's $000's $000's $000's $000's $000's
A B C D E F
Home Purchase Loans
Loans on 1- to 4-Family and Manufactured Home Dwellings
Loans OnManufactured Home
Dwellings FromColumns A, B, C & D
G
Number $000's
%MinPop4/
MedianIncome As
PCT ofMSA/MDMedian

PA/MONTGOMERY COUNTY/2007.04 17 91
LOANS ORIGINATED 24 54 6 32 465 5106 10409 256 507
APPS APPROVED, NOT ACCEPTED 7 1364
APPS DENIED 4 11 7 23 612 776 2885 268 185
APPS WITHDRAWN 3 4 1690 978 20
FILES CLOSED FOR INCOMPLETENESS 51 324 1321
PA/MONTGOMERY COUNTY/2007.07 38 86
LOANS ORIGINATED 11 51 8 44 966 2224 9500 462 569 2 64
APPS APPROVED, NOT ACCEPTED 1 4 134 737 140 1 34
APPS DENIED 1 9 32 625 199 1596 76
APPS WITHDRAWN 1 6168 1248
FILES CLOSED FOR INCOMPLETENESS 3 545
PA/MONTGOMERY COUNTY/2007.08 25 112
LOANS ORIGINATED 31 143 14 711 2511 6654 28930 1301 1324
APPS APPROVED, NOT ACCEPTED 1 11 1162 2460 135
APPS DENIED 5 40 6 14 854 755 8396 67 181 2 128
APPS WITHDRAWN 1 18288 3348
FILES CLOSED FOR INCOMPLETENESS 1 736 1488 1 36
PA/MONTGOMERY COUNTY/2008.00 37 96
LOANS ORIGINATED 28 50 7 1 1614 2897 5147 8381 169 2000 2915
APPS APPROVED, NOT ACCEPTED 3 7 4387 1410 500
APPS DENIED 2 20 23 586 200 3233 386
APPS WITHDRAWN 4 13 2709 2095 354
FILES CLOSED FOR INCOMPLETENESS 1 31 295 276 478
PA/MONTGOMERY COUNTY/2009.01 32 85
LOANS ORIGINATED 28 61 10 814 2562 5372 9677 290 964
APPS APPROVED, NOT ACCEPTED 3 3 2263 552 185
APPS DENIED 1 19 73 435 104 2927 137 1 5
APPS WITHDRAWN 18 11 192 2502 208
FILES CLOSED FOR INCOMPLETENESS 9 21757 237
06/02/2014Report Date:
AGGREGATE TABLE 1: DISPOSITION OF LOAN APPLICATIONS, BY LOCATION OF PROPERTY AND TYPE OF LOAN, 2013
MSA/MD: 37964 - PHILADELPHIA, PA
Page 86 of 199
ALL LOANS ON PROPERTY LOCATED IN MSA/MD 3/
CENSUS TRACT OR COUNTY NAME ANDDISPOSITION OF APPLICATION 1/(STATE/COUNTY/TRACT NUMBER) FHA, FSA/RHS & VA Conventional
Refinancings Home ImprovementLoans
Loans on DwellingsFor 5 or More
Families
NonoccupantLoans From
Columns A, B, Cand D
Number Number Number Number Number Number$000's $000's $000's $000's $000's $000's
A B C D E F
Home Purchase Loans
Loans on 1- to 4-Family and Manufactured Home Dwellings
Loans OnManufactured Home
Dwellings FromColumns A, B, C & D
G
Number $000's
%MinPop4/
MedianIncome As
PCT ofMSA/MDMedian

PA/MONTGOMERY COUNTY/2009.02 28 66
LOANS ORIGINATED 6 18 1 1 128 1252 853 2514 122 500 1775
APPS APPROVED, NOT ACCEPTED 11 85 73
APPS DENIED 3 2 5 13 662 210 194 40 500
APPS WITHDRAWN 1 31 157 140 601
FILES CLOSED FOR INCOMPLETENESS 2 359
PA/MONTGOMERY COUNTY/2009.03 30 87
LOANS ORIGINATED 26 47 2 1 710 1965 4617 7274 12 172 718
APPS APPROVED, NOT ACCEPTED 3 8 13 585 616 1209 154
APPS DENIED 4 15 8 46 1198 842 2200 128 669
APPS WITHDRAWN 5 14 32 493 828 2213 549
FILES CLOSED FOR INCOMPLETENESS 1 4243 885
PA/MONTGOMERY COUNTY/2009.06 26 105
LOANS ORIGINATED 13 35 5 11 206 3131 5830 373 109
APPS APPROVED, NOT ACCEPTED 1 3307 643
APPS DENIED 13 21 405 1999 125
APPS WITHDRAWN 11 304 250
FILES CLOSED FOR INCOMPLETENESS 1 20
PA/MONTGOMERY COUNTY/2009.07 11 97
LOANS ORIGINATED 18 59 4 68 1502 3328 9594 77 1079
APPS APPROVED, NOT ACCEPTED 2 8 1285 1380 111
APPS DENIED 26 1 11 260 4610 180 109
APPS WITHDRAWN 4 16 22 611 731 3269 233
FILES CLOSED FOR INCOMPLETENESS 1 8 1105 1425 105
PA/MONTGOMERY COUNTY/2009.08 26 95
LOANS ORIGINATED 15 46 4 3 134 746 2788 6835 1205 2467 1850
APPS APPROVED, NOT ACCEPTED 1 41 168 254 593
APPS DENIED 1 13 1 1209 1991 160 210
APPS WITHDRAWN 2 71 140 165 1210
FILES CLOSED FOR INCOMPLETENESS 6 863
06/02/2014Report Date:
AGGREGATE TABLE 1: DISPOSITION OF LOAN APPLICATIONS, BY LOCATION OF PROPERTY AND TYPE OF LOAN, 2013
MSA/MD: 37964 - PHILADELPHIA, PA
Page 87 of 199
ALL LOANS ON PROPERTY LOCATED IN MSA/MD 3/
CENSUS TRACT OR COUNTY NAME ANDDISPOSITION OF APPLICATION 1/(STATE/COUNTY/TRACT NUMBER) FHA, FSA/RHS & VA Conventional
Refinancings Home ImprovementLoans
Loans on DwellingsFor 5 or More
Families
NonoccupantLoans From
Columns A, B, Cand D
Number Number Number Number Number Number$000's $000's $000's $000's $000's $000's
A B C D E F
Home Purchase Loans
Loans on 1- to 4-Family and Manufactured Home Dwellings
Loans OnManufactured Home
Dwellings FromColumns A, B, C & D
G
Number $000's
%MinPop4/
MedianIncome As
PCT ofMSA/MDMedian
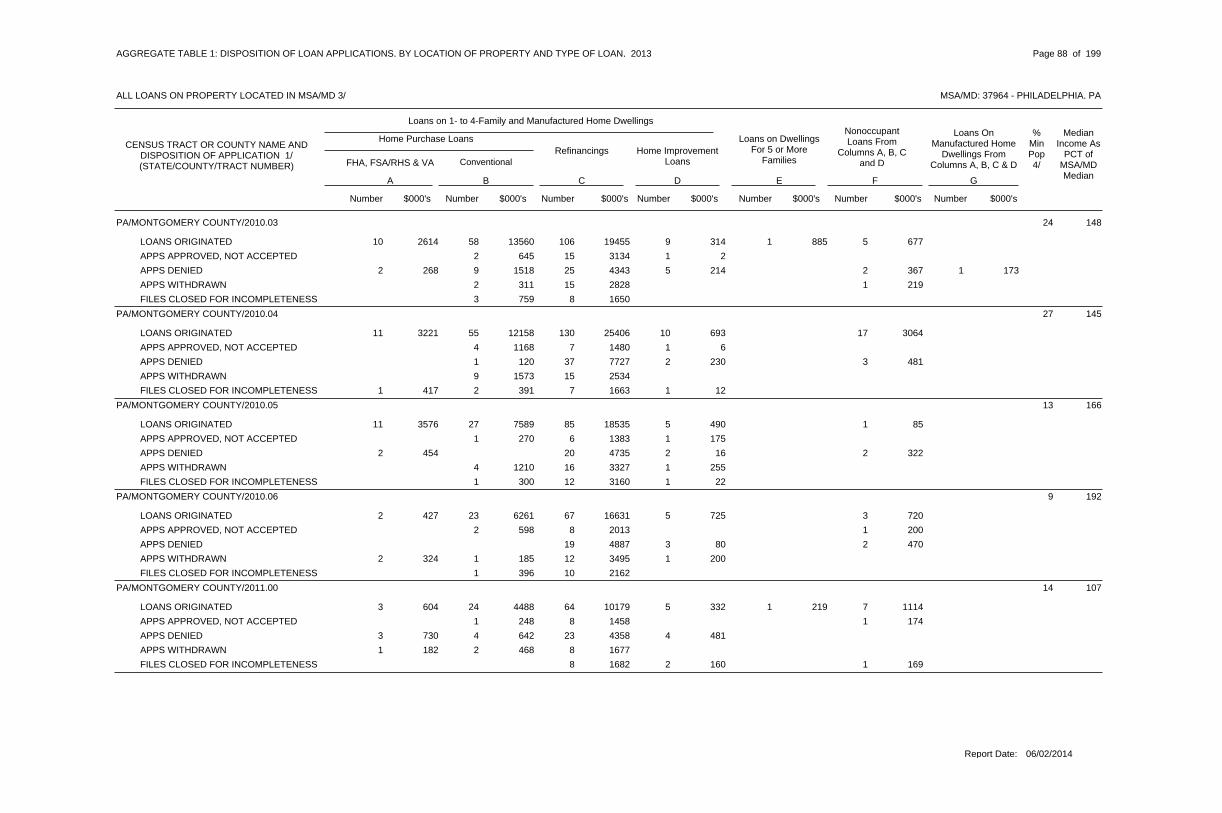
PA/MONTGOMERY COUNTY/2010.03 24 148
LOANS ORIGINATED 58 106 9 1 510 2614 13560 19455 314 885 677
APPS APPROVED, NOT ACCEPTED 2 15 1645 3134 2
APPS DENIED 9 25 5 22 268 1518 4343 214 367 1 173
APPS WITHDRAWN 2 15 1311 2828 219
FILES CLOSED FOR INCOMPLETENESS 3 8759 1650
PA/MONTGOMERY COUNTY/2010.04 27 145
LOANS ORIGINATED 55 130 10 1711 3221 12158 25406 693 3064
APPS APPROVED, NOT ACCEPTED 4 7 11168 1480 6
APPS DENIED 1 37 2 3120 7727 230 481
APPS WITHDRAWN 9 151573 2534
FILES CLOSED FOR INCOMPLETENESS 2 7 11 417 391 1663 12
PA/MONTGOMERY COUNTY/2010.05 13 166
LOANS ORIGINATED 27 85 5 111 3576 7589 18535 490 85
APPS APPROVED, NOT ACCEPTED 1 6 1270 1383 175
APPS DENIED 20 2 22 454 4735 16 322
APPS WITHDRAWN 4 16 11210 3327 255
FILES CLOSED FOR INCOMPLETENESS 1 12 1300 3160 22
PA/MONTGOMERY COUNTY/2010.06 9 192
LOANS ORIGINATED 23 67 5 32 427 6261 16631 725 720
APPS APPROVED, NOT ACCEPTED 2 8 1598 2013 200
APPS DENIED 19 3 24887 80 470
APPS WITHDRAWN 1 12 12 324 185 3495 200
FILES CLOSED FOR INCOMPLETENESS 1 10396 2162
PA/MONTGOMERY COUNTY/2011.00 14 107
LOANS ORIGINATED 24 64 5 1 73 604 4488 10179 332 219 1114
APPS APPROVED, NOT ACCEPTED 1 8 1248 1458 174
APPS DENIED 4 23 43 730 642 4358 481
APPS WITHDRAWN 2 81 182 468 1677
FILES CLOSED FOR INCOMPLETENESS 8 2 11682 160 169
06/02/2014Report Date:
AGGREGATE TABLE 1: DISPOSITION OF LOAN APPLICATIONS, BY LOCATION OF PROPERTY AND TYPE OF LOAN, 2013
MSA/MD: 37964 - PHILADELPHIA, PA
Page 88 of 199
ALL LOANS ON PROPERTY LOCATED IN MSA/MD 3/
CENSUS TRACT OR COUNTY NAME ANDDISPOSITION OF APPLICATION 1/(STATE/COUNTY/TRACT NUMBER) FHA, FSA/RHS & VA Conventional
Refinancings Home ImprovementLoans
Loans on DwellingsFor 5 or More
Families
NonoccupantLoans From
Columns A, B, Cand D
Number Number Number Number Number Number$000's $000's $000's $000's $000's $000's
A B C D E F
Home Purchase Loans
Loans on 1- to 4-Family and Manufactured Home Dwellings
Loans OnManufactured Home
Dwellings FromColumns A, B, C & D
G
Number $000's
%MinPop4/
MedianIncome As
PCT ofMSA/MDMedian

PA/MONTGOMERY COUNTY/2012.01 17 207
LOANS ORIGINATED 65 148 6 32 842 30859 53631 1122 600
APPS APPROVED, NOT ACCEPTED 3 16 11 335 848 5282 279
APPS DENIED 12 26 2 12 946 4792 12315 82 7
APPS WITHDRAWN 6 15 13360 6647 131
FILES CLOSED FOR INCOMPLETENESS 6 103965 3347
PA/MONTGOMERY COUNTY/2012.03 9 190
LOANS ORIGINATED 27 80 7 210239 29494 1378 428
APPS APPROVED, NOT ACCEPTED 3 4 11186 1620 150
APPS DENIED 5 21 1 24354 9533 35 473
APPS WITHDRAWN 9 8 23219 2268 280
FILES CLOSED FOR INCOMPLETENESS 3 1721 180
PA/MONTGOMERY COUNTY/2012.04 31 111
LOANS ORIGINATED 19 72 5 79 1817 3592 13912 244 905
APPS APPROVED, NOT ACCEPTED 2 12 2 1158 1998 225 169
APPS DENIED 1 23 1 12 471 135 4644 172 96
APPS WITHDRAWN 5 12 41145 2472 631
FILES CLOSED FOR INCOMPLETENESS 4 1881 15
PA/MONTGOMERY COUNTY/2013.01 22 95
LOANS ORIGINATED 20 57 9 3 62 572 4699 10278 1193 3514 1113
APPS APPROVED, NOT ACCEPTED 1 6238 1203
APPS DENIED 17 4 12802 140 168
APPS WITHDRAWN 1 8236 1767
FILES CLOSED FOR INCOMPLETENESS 1 4 1386 560 386
PA/MONTGOMERY COUNTY/2013.02 33 100
LOANS ORIGINATED 22 55 8 184 791 3873 9080 568 2232
APPS APPROVED, NOT ACCEPTED 2 5 1 3276 697 5 308
APPS DENIED 2 22 1 9329 3092 17 823
APPS WITHDRAWN 1 5 12 384 169 921 88
FILES CLOSED FOR INCOMPLETENESS 2 322
06/02/2014Report Date:
AGGREGATE TABLE 1: DISPOSITION OF LOAN APPLICATIONS, BY LOCATION OF PROPERTY AND TYPE OF LOAN, 2013
MSA/MD: 37964 - PHILADELPHIA, PA
Page 89 of 199
ALL LOANS ON PROPERTY LOCATED IN MSA/MD 3/
CENSUS TRACT OR COUNTY NAME ANDDISPOSITION OF APPLICATION 1/(STATE/COUNTY/TRACT NUMBER) FHA, FSA/RHS & VA Conventional
Refinancings Home ImprovementLoans
Loans on DwellingsFor 5 or More
Families
NonoccupantLoans From
Columns A, B, Cand D
Number Number Number Number Number Number$000's $000's $000's $000's $000's $000's
A B C D E F
Home Purchase Loans
Loans on 1- to 4-Family and Manufactured Home Dwellings
Loans OnManufactured Home
Dwellings FromColumns A, B, C & D
G
Number $000's
%MinPop4/
MedianIncome As
PCT ofMSA/MDMedian

PA/MONTGOMERY COUNTY/2014.04 17 196
LOANS ORIGINATED 41 82 7 62 872 13834 21942 1212 1171
APPS APPROVED, NOT ACCEPTED 3 4 21213 1112 579
APPS DENIED 2 24 2 1885 8152 455 244
APPS WITHDRAWN 3 12956 4227
FILES CLOSED FOR INCOMPLETENESS 10 2611
PA/MONTGOMERY COUNTY/2014.06 18 162
LOANS ORIGINATED 39 122 11 46 1485 11247 28997 1211 1153
APPS APPROVED, NOT ACCEPTED 4 122 379 916 2814
APPS DENIED 3 21 31244 4229 57
APPS WITHDRAWN 5 16 1 12 496 784 3252 352 30
FILES CLOSED FOR INCOMPLETENESS 9 1798
PA/MONTGOMERY COUNTY/2014.07 34 116
LOANS ORIGINATED 21 57 6 47 1537 4614 11557 806 594
APPS APPROVED, NOT ACCEPTED 9 1811
APPS DENIED 11 11584 6
APPS WITHDRAWN 5 8 21 119 1319 1842 524
FILES CLOSED FOR INCOMPLETENESS 3 1 1575 75 197
PA/MONTGOMERY COUNTY/2014.08 16 208
LOANS ORIGINATED 41 124 16 131 313 11097 31228 3034 2158
APPS APPROVED, NOT ACCEPTED 2 9 1 11 196 360 2303 250 80
APPS DENIED 3 20 21 290 1061 4891 623
APPS WITHDRAWN 6 15 2 22216 3826 160 325
FILES CLOSED FOR INCOMPLETENESS 71 282 2136
PA/MONTGOMERY COUNTY/2014.09 14 192
LOANS ORIGINATED 54 115 11 24 1182 16647 32077 1315 395
APPS APPROVED, NOT ACCEPTED 3 15 1971 3746 51
APPS DENIED 4 22 32 628 1034 6400 385
APPS WITHDRAWN 8 16 41 302 2039 3320 776
FILES CLOSED FOR INCOMPLETENESS 2 6 22 674 393 1553 441
06/02/2014Report Date:
AGGREGATE TABLE 1: DISPOSITION OF LOAN APPLICATIONS, BY LOCATION OF PROPERTY AND TYPE OF LOAN, 2013
MSA/MD: 37964 - PHILADELPHIA, PA
Page 90 of 199
ALL LOANS ON PROPERTY LOCATED IN MSA/MD 3/
CENSUS TRACT OR COUNTY NAME ANDDISPOSITION OF APPLICATION 1/(STATE/COUNTY/TRACT NUMBER) FHA, FSA/RHS & VA Conventional
Refinancings Home ImprovementLoans
Loans on DwellingsFor 5 or More
Families
NonoccupantLoans From
Columns A, B, Cand D
Number Number Number Number Number Number$000's $000's $000's $000's $000's $000's
A B C D E F
Home Purchase Loans
Loans on 1- to 4-Family and Manufactured Home Dwellings
Loans OnManufactured Home
Dwellings FromColumns A, B, C & D
G
Number $000's
%MinPop4/
MedianIncome As
PCT ofMSA/MDMedian

PA/MONTGOMERY COUNTY/2014.10 18 133
LOANS ORIGINATED 25 45 7 77 1866 6623 7940 1274 1015
APPS APPROVED, NOT ACCEPTED 6 11235 110
APPS DENIED 6 12 11200 1923 111
APPS WITHDRAWN 2 4 1633 708 158
FILES CLOSED FOR INCOMPLETENESS 4 1536 175
PA/MONTGOMERY COUNTY/2014.11 14 131
LOANS ORIGINATED 26 68 5 1 114 972 6991 15134 440 500 1933
APPS APPROVED, NOT ACCEPTED 4 5 1721 1298 219
APPS DENIED 20 2 34815 11 328
APPS WITHDRAWN 3 12 1483 2475 5
FILES CLOSED FOR INCOMPLETENESS 8 11 236 1850 122
PA/MONTGOMERY COUNTY/2015.01 14 161
LOANS ORIGINATED 10 49 2 11 255 3642 11893 190 183
APPS APPROVED, NOT ACCEPTED 1 21 80 380 249
APPS DENIED 3 13 31113 5084 95
APPS WITHDRAWN 2 9 1 11 255 446 2340 15 175
FILES CLOSED FOR INCOMPLETENESS 4 879
PA/MONTGOMERY COUNTY/2015.02 11 211
LOANS ORIGINATED 24 43 1 12 760 7767 12825 60 378
APPS APPROVED, NOT ACCEPTED 1 4576 898
APPS DENIED 4 16 21264 5094 105
APPS WITHDRAWN 2 9 2377 2524 391
FILES CLOSED FOR INCOMPLETENESS 3 802
PA/MONTGOMERY COUNTY/2016.03 49 117
LOANS ORIGINATED 28 99 7 823 4541 4484 14839 776 1055
APPS APPROVED, NOT ACCEPTED 17 11 208 2733 21
APPS DENIED 1 36 8 22 475 155 6265 153 273
APPS WITHDRAWN 1 15 12 408 211 2575 95
FILES CLOSED FOR INCOMPLETENESS 1 8 2122 1029 271
06/02/2014Report Date:
AGGREGATE TABLE 1: DISPOSITION OF LOAN APPLICATIONS, BY LOCATION OF PROPERTY AND TYPE OF LOAN, 2013
MSA/MD: 37964 - PHILADELPHIA, PA
Page 91 of 199
ALL LOANS ON PROPERTY LOCATED IN MSA/MD 3/
CENSUS TRACT OR COUNTY NAME ANDDISPOSITION OF APPLICATION 1/(STATE/COUNTY/TRACT NUMBER) FHA, FSA/RHS & VA Conventional
Refinancings Home ImprovementLoans
Loans on DwellingsFor 5 or More
Families
NonoccupantLoans From
Columns A, B, Cand D
Number Number Number Number Number Number$000's $000's $000's $000's $000's $000's
A B C D E F
Home Purchase Loans
Loans on 1- to 4-Family and Manufactured Home Dwellings
Loans OnManufactured Home
Dwellings FromColumns A, B, C & D
G
Number $000's
%MinPop4/
MedianIncome As
PCT ofMSA/MDMedian

PA/MONTGOMERY COUNTY/2016.04 41 111
LOANS ORIGINATED 15 75 6 513 2610 2357 11700 222 695
APPS APPROVED, NOT ACCEPTED 5 3838 105
APPS DENIED 2 32 8 26 993 293 4548 74 60
APPS WITHDRAWN 182 412 2847
FILES CLOSED FOR INCOMPLETENESS 1 5148 814
PA/MONTGOMERY COUNTY/2016.05 22 129
LOANS ORIGINATED 28 67 6 513 2813 5780 10692 312 664
APPS APPROVED, NOT ACCEPTED 1 16 2200 2662 29
APPS DENIED 3 22 72 288 291 3119 341
APPS WITHDRAWN 2 112 404 335 1928
FILES CLOSED FOR INCOMPLETENESS 1 10 1 1216 1782 30 146
PA/MONTGOMERY COUNTY/2016.06 44 81
LOANS ORIGINATED 4 36 2 311 2110 647 6068 103 533
APPS APPROVED, NOT ACCEPTED 3 424
APPS DENIED 1 17 1 52 320 90 2761 24 868
APPS WITHDRAWN 1 9 1200 1614 277
FILES CLOSED FOR INCOMPLETENESS 5 763
PA/MONTGOMERY COUNTY/2016.07 19 129
LOANS ORIGINATED 20 77 10 46 1223 3560 13440 895 582
APPS APPROVED, NOT ACCEPTED 1 5 188 808 88
APPS DENIED 1 28 7 3299 4820 205 383
APPS WITHDRAWN 4 9 2624 1466 35
FILES CLOSED FOR INCOMPLETENESS 1 13 1 11 152 100 2320 10 172
PA/MONTGOMERY COUNTY/2016.08 13 131
LOANS ORIGINATED 37 115 5 118 1960 11017 28208 240 2170
APPS APPROVED, NOT ACCEPTED 2 11 12 395 528 2329 30
APPS DENIED 5 34 2 12 416 1036 8994 345 302
APPS WITHDRAWN 7 21 3 31613 4774 800 669
FILES CLOSED FOR INCOMPLETENESS 13 11 271 2875 10
06/02/2014Report Date:
AGGREGATE TABLE 1: DISPOSITION OF LOAN APPLICATIONS, BY LOCATION OF PROPERTY AND TYPE OF LOAN, 2013
MSA/MD: 37964 - PHILADELPHIA, PA
Page 92 of 199
ALL LOANS ON PROPERTY LOCATED IN MSA/MD 3/
CENSUS TRACT OR COUNTY NAME ANDDISPOSITION OF APPLICATION 1/(STATE/COUNTY/TRACT NUMBER) FHA, FSA/RHS & VA Conventional
Refinancings Home ImprovementLoans
Loans on DwellingsFor 5 or More
Families
NonoccupantLoans From
Columns A, B, Cand D
Number Number Number Number Number Number$000's $000's $000's $000's $000's $000's
A B C D E F
Home Purchase Loans
Loans on 1- to 4-Family and Manufactured Home Dwellings
Loans OnManufactured Home
Dwellings FromColumns A, B, C & D
G
Number $000's
%MinPop4/
MedianIncome As
PCT ofMSA/MDMedian

PA/MONTGOMERY COUNTY/2017.03 10 126
LOANS ORIGINATED 21 71 6 611 2233 3540 11618 346 905
APPS APPROVED, NOT ACCEPTED 2 10307 1835
APPS DENIED 2 18 4 1318 2913 103 5 1 5
APPS WITHDRAWN 2 12 2 2374 2073 33 391
FILES CLOSED FOR INCOMPLETENESS 9 1 11425 23 173
PA/MONTGOMERY COUNTY/2017.04 22 122
LOANS ORIGINATED 32 89 5 98 1808 6033 15083 277 1226
APPS APPROVED, NOT ACCEPTED 9 21918 403
APPS DENIED 1 23 6 31 278 190 3343 323 367
APPS WITHDRAWN 3 20 12 489 539 3445 169
FILES CLOSED FOR INCOMPLETENESS 1 13 21 251 118 1955 263
PA/MONTGOMERY COUNTY/2017.05 11 119
LOANS ORIGINATED 25 91 7 712 2900 5506 17688 411 1056
APPS APPROVED, NOT ACCEPTED 4 7 1 21 231 806 1687 7 413
APPS DENIED 1 21 5 11 258 208 4165 254 309
APPS WITHDRAWN 2 18 2 22 349 303 3210 40 197
FILES CLOSED FOR INCOMPLETENESS 1 13 1220 2493 170
PA/MONTGOMERY COUNTY/2017.06 23 108
LOANS ORIGINATED 37 97 8 1 88 1766 7311 17766 441 4100 1063
APPS APPROVED, NOT ACCEPTED 3 12 1 1600 2285 189 165
APPS DENIED 3 13 8672 2108 942
APPS WITHDRAWN 3 22 2 3691 4020 210 418
FILES CLOSED FOR INCOMPLETENESS 1 72 402 254 1345
PA/MONTGOMERY COUNTY/2018.00 12 155
LOANS ORIGINATED 26 54 5 52 628 7268 12639 499 1295
APPS APPROVED, NOT ACCEPTED 1 6139 1274
APPS DENIED 1 9 1212 2303 10
APPS WITHDRAWN 1 7 11 333 300 1523 252
FILES CLOSED FOR INCOMPLETENESS 1 6 1 1151 1060 25 285
06/02/2014Report Date:
AGGREGATE TABLE 1: DISPOSITION OF LOAN APPLICATIONS, BY LOCATION OF PROPERTY AND TYPE OF LOAN, 2013
MSA/MD: 37964 - PHILADELPHIA, PA
Page 93 of 199
ALL LOANS ON PROPERTY LOCATED IN MSA/MD 3/
CENSUS TRACT OR COUNTY NAME ANDDISPOSITION OF APPLICATION 1/(STATE/COUNTY/TRACT NUMBER) FHA, FSA/RHS & VA Conventional
Refinancings Home ImprovementLoans
Loans on DwellingsFor 5 or More
Families
NonoccupantLoans From
Columns A, B, Cand D
Number Number Number Number Number Number$000's $000's $000's $000's $000's $000's
A B C D E F
Home Purchase Loans
Loans on 1- to 4-Family and Manufactured Home Dwellings
Loans OnManufactured Home
Dwellings FromColumns A, B, C & D
G
Number $000's
%MinPop4/
MedianIncome As
PCT ofMSA/MDMedian

PA/MONTGOMERY COUNTY/2019.01 10 139
LOANS ORIGINATED 39 110 12 29 2731 12151 25906 979 310
APPS APPROVED, NOT ACCEPTED 2 91 154 867 2004
APPS DENIED 3 23 51 270 448 5761 345
APPS WITHDRAWN 4 25 11 370 1092 5200 197
FILES CLOSED FOR INCOMPLETENESS 12 3177
PA/MONTGOMERY COUNTY/2019.02 28 144
LOANS ORIGINATED 36 122 10 1 1012 2440 6837 23749 895 275 1570
APPS APPROVED, NOT ACCEPTED 2 15 2391 3316 132
APPS DENIED 3 38 5 44 871 424 8077 154 670
APPS WITHDRAWN 4 15 13 599 733 2911 30
FILES CLOSED FOR INCOMPLETENESS 1 16 1 1152 3381 100 178
PA/MONTGOMERY COUNTY/2020.00 5 106
LOANS ORIGINATED 13 37 7 1 35 909 2180 5936 363 311 424
APPS APPROVED, NOT ACCEPTED 6 11131 660
APPS DENIED 2 13 2 1426 2308 49 700
APPS WITHDRAWN 12 11 233 2217 59
FILES CLOSED FOR INCOMPLETENESS 9 1323
PA/MONTGOMERY COUNTY/2021.00 12 133
LOANS ORIGINATED 36 99 7 2 125 1054 8800 19429 1125 4290 1953
APPS APPROVED, NOT ACCEPTED 1 15 1 3238 2883 125 331
APPS DENIED 1 35 4 51 287 216 6523 654 1013
APPS WITHDRAWN 1 9 12 528 52 1584 15
FILES CLOSED FOR INCOMPLETENESS 1 11 1 472 2315 25 709
PA/MONTGOMERY COUNTY/2022.01 29 129
LOANS ORIGINATED 32 87 13 1 1223 3928 4942 13983 663 350 1467
APPS APPROVED, NOT ACCEPTED 14 1 21 133 2395 120 319
APPS DENIED 2 31 7 34 705 358 5227 182 510
APPS WITHDRAWN 2 21 1 43 560 194 3920 34 488
FILES CLOSED FOR INCOMPLETENESS 1 9 11 173 100 1221 60
06/02/2014Report Date:
AGGREGATE TABLE 1: DISPOSITION OF LOAN APPLICATIONS, BY LOCATION OF PROPERTY AND TYPE OF LOAN, 2013
MSA/MD: 37964 - PHILADELPHIA, PA
Page 94 of 199
ALL LOANS ON PROPERTY LOCATED IN MSA/MD 3/
CENSUS TRACT OR COUNTY NAME ANDDISPOSITION OF APPLICATION 1/(STATE/COUNTY/TRACT NUMBER) FHA, FSA/RHS & VA Conventional
Refinancings Home ImprovementLoans
Loans on DwellingsFor 5 or More
Families
NonoccupantLoans From
Columns A, B, Cand D
Number Number Number Number Number Number$000's $000's $000's $000's $000's $000's
A B C D E F
Home Purchase Loans
Loans on 1- to 4-Family and Manufactured Home Dwellings
Loans OnManufactured Home
Dwellings FromColumns A, B, C & D
G
Number $000's
%MinPop4/
MedianIncome As
PCT ofMSA/MDMedian

PA/MONTGOMERY COUNTY/2022.02 69 115
LOANS ORIGINATED 9 54 3 211 2369 1787 8870 53 347
APPS APPROVED, NOT ACCEPTED 2 41 116 251 898
APPS DENIED 1 28 3 17 1293 143 4713 60 190
APPS WITHDRAWN 12 1 11 218 2685 65 173
FILES CLOSED FOR INCOMPLETENESS 7 1396
PA/MONTGOMERY COUNTY/2023.01 22 160
LOANS ORIGINATED 37 81 5 1 310 2219 8164 16714 788 644 331
APPS APPROVED, NOT ACCEPTED 1 81 240 170 1588
APPS DENIED 5 31 5 26 1231 989 6522 318 286
APPS WITHDRAWN 8 16 2 22 392 1787 4021 122 493
FILES CLOSED FOR INCOMPLETENESS 1 3 1 11 245 200 847 270 270
PA/MONTGOMERY COUNTY/2023.02 33 133
LOANS ORIGINATED 18 54 3 77 1526 2905 10189 162 1253
APPS APPROVED, NOT ACCEPTED 41 254 1010
APPS DENIED 5 25 92 357 704 6188 547
APPS WITHDRAWN 11 12131 60
FILES CLOSED FOR INCOMPLETENESS 2 271
PA/MONTGOMERY COUNTY/2024.01 95 54
LOANS ORIGINATED 1 1120 35
APPS APPROVED, NOT ACCEPTED 1 207
APPS DENIED
APPS WITHDRAWN 1 188
FILES CLOSED FOR INCOMPLETENESS
PA/MONTGOMERY COUNTY/2024.02 55 135
LOANS ORIGINATED 22 75 9 517 3363 4472 14830 1397 770
APPS APPROVED, NOT ACCEPTED 8 2 31 123 1313 264 534
APPS DENIED 6 51 8 44 884 1269 8745 735 735
APPS WITHDRAWN 1 20 2 12 220 360 3482 554 240
FILES CLOSED FOR INCOMPLETENESS 102 302 1760
06/02/2014Report Date:
AGGREGATE TABLE 1: DISPOSITION OF LOAN APPLICATIONS, BY LOCATION OF PROPERTY AND TYPE OF LOAN, 2013
MSA/MD: 37964 - PHILADELPHIA, PA
Page 95 of 199
ALL LOANS ON PROPERTY LOCATED IN MSA/MD 3/
CENSUS TRACT OR COUNTY NAME ANDDISPOSITION OF APPLICATION 1/(STATE/COUNTY/TRACT NUMBER) FHA, FSA/RHS & VA Conventional
Refinancings Home ImprovementLoans
Loans on DwellingsFor 5 or More
Families
NonoccupantLoans From
Columns A, B, Cand D
Number Number Number Number Number Number$000's $000's $000's $000's $000's $000's
A B C D E F
Home Purchase Loans
Loans on 1- to 4-Family and Manufactured Home Dwellings
Loans OnManufactured Home
Dwellings FromColumns A, B, C & D
G
Number $000's
%MinPop4/
MedianIncome As
PCT ofMSA/MDMedian

PA/MONTGOMERY COUNTY/2025.00 64 112
LOANS ORIGINATED 13 70 4 611 2443 2847 13641 395 1474
APPS APPROVED, NOT ACCEPTED 91 147 1935
APPS DENIED 4 37 55 1007 864 8488 483
APPS WITHDRAWN 1 164 867 100 3490
FILES CLOSED FOR INCOMPLETENESS 9 1384
PA/MONTGOMERY COUNTY/2026.02 23 161
LOANS ORIGINATED 20 50 6 11 362 4867 10682 982 134
APPS APPROVED, NOT ACCEPTED 6 1299
APPS DENIED 2 16 3 13 891 770 2852 71 450
APPS WITHDRAWN 3 7 1 1941 1474 275 142
FILES CLOSED FOR INCOMPLETENESS 2 288
PA/MONTGOMERY COUNTY/2026.03 17 131
LOANS ORIGINATED 12 52 6 1 714 2767 2282 9225 440 9000 1053
APPS APPROVED, NOT ACCEPTED 8 11834 106
APPS DENIED 3 28 3 31 179 578 5251 57 497
APPS WITHDRAWN 1 11 24 545 370 2040 416
FILES CLOSED FOR INCOMPLETENESS 1 6 2238 1158 322
PA/MONTGOMERY COUNTY/2026.04 27 133
LOANS ORIGINATED 18 42 4 44 670 4302 8187 434 632
APPS APPROVED, NOT ACCEPTED 1 7 1 11 257 126 1072 16 245
APPS DENIED 1 20 71 118 309 4624 143
APPS WITHDRAWN 3 15 2 32 489 461 3205 139 533
FILES CLOSED FOR INCOMPLETENESS 1 6270 1527
PA/MONTGOMERY COUNTY/2030.00 17 181
LOANS ORIGINATED 29 88 7 71 287 10168 35327 1817 2469
APPS APPROVED, NOT ACCEPTED 4 5 11684 1433 193
APPS DENIED 9 16 1 24896 7858 12 207
APPS WITHDRAWN 5 10 11501 4641 229
FILES CLOSED FOR INCOMPLETENESS 9 2563
06/02/2014Report Date:
AGGREGATE TABLE 1: DISPOSITION OF LOAN APPLICATIONS, BY LOCATION OF PROPERTY AND TYPE OF LOAN, 2013
MSA/MD: 37964 - PHILADELPHIA, PA
Page 96 of 199
ALL LOANS ON PROPERTY LOCATED IN MSA/MD 3/
CENSUS TRACT OR COUNTY NAME ANDDISPOSITION OF APPLICATION 1/(STATE/COUNTY/TRACT NUMBER) FHA, FSA/RHS & VA Conventional
Refinancings Home ImprovementLoans
Loans on DwellingsFor 5 or More
Families
NonoccupantLoans From
Columns A, B, Cand D
Number Number Number Number Number Number$000's $000's $000's $000's $000's $000's
A B C D E F
Home Purchase Loans
Loans on 1- to 4-Family and Manufactured Home Dwellings
Loans OnManufactured Home
Dwellings FromColumns A, B, C & D
G
Number $000's
%MinPop4/
MedianIncome As
PCT ofMSA/MDMedian

PA/MONTGOMERY COUNTY/2031.03 8 162
LOANS ORIGINATED 34 88 9 34 1166 10408 18742 930 510
APPS APPROVED, NOT ACCEPTED 3 11 245 542 145
APPS DENIED 5 17 4 12 505 1757 4898 206 190
APPS WITHDRAWN 8 19 21 231 2092 4245 213
FILES CLOSED FOR INCOMPLETENESS 7 1839
PA/MONTGOMERY COUNTY/2031.04 6 151
LOANS ORIGINATED 30 96 10 34 927 9130 21288 1349 750
APPS APPROVED, NOT ACCEPTED 2 10 1 1332 2704 35 103
APPS DENIED 3 20 41 250 1040 5698 363
APPS WITHDRAWN 12 203386 4805
FILES CLOSED FOR INCOMPLETENESS 1 11 1 1417 2413 30 141
PA/MONTGOMERY COUNTY/2031.05 11 170
LOANS ORIGINATED 68 145 8 2 45 1497 19566 34837 298 69621 634
APPS APPROVED, NOT ACCEPTED 2 22 21 148 675 5295 357
APPS DENIED 5 21 7 13 867 1429 6079 538 94
APPS WITHDRAWN 8 171867 3224
FILES CLOSED FOR INCOMPLETENESS 1 14 1360 3334 620
PA/MONTGOMERY COUNTY/2031.06 12 119
LOANS ORIGINATED 8 34 5 71 196 1991 6251 234 1034
APPS APPROVED, NOT ACCEPTED 1 4179 530
APPS DENIED 2 5 3542 1130 130
APPS WITHDRAWN 1 31 212 280 578
FILES CLOSED FOR INCOMPLETENESS 1 1101 25
PA/MONTGOMERY COUNTY/2032.03 27 160
LOANS ORIGINATED 26 74 7 47 1925 6770 17826 739 911
APPS APPROVED, NOT ACCEPTED 2 8 1538 2054 158
APPS DENIED 1 8 4 11 287 487 1455 22 173
APPS WITHDRAWN 6 41 241 1608 1127
FILES CLOSED FOR INCOMPLETENESS 1 2 1314 295 110
06/02/2014Report Date:
AGGREGATE TABLE 1: DISPOSITION OF LOAN APPLICATIONS, BY LOCATION OF PROPERTY AND TYPE OF LOAN, 2013
MSA/MD: 37964 - PHILADELPHIA, PA
Page 97 of 199
ALL LOANS ON PROPERTY LOCATED IN MSA/MD 3/
CENSUS TRACT OR COUNTY NAME ANDDISPOSITION OF APPLICATION 1/(STATE/COUNTY/TRACT NUMBER) FHA, FSA/RHS & VA Conventional
Refinancings Home ImprovementLoans
Loans on DwellingsFor 5 or More
Families
NonoccupantLoans From
Columns A, B, Cand D
Number Number Number Number Number Number$000's $000's $000's $000's $000's $000's
A B C D E F
Home Purchase Loans
Loans on 1- to 4-Family and Manufactured Home Dwellings
Loans OnManufactured Home
Dwellings FromColumns A, B, C & D
G
Number $000's
%MinPop4/
MedianIncome As
PCT ofMSA/MDMedian

PA/MONTGOMERY COUNTY/2032.04 21 177
LOANS ORIGINATED 82 173 8 2 233 673 26562 45049 696 2536 6102 2 240
APPS APPROVED, NOT ACCEPTED 9 211 160 2576 4563 2 399
APPS DENIED 10 43 4 42 276 2230 13761 193 855
APPS WITHDRAWN 13 21 22 279 4790 5199 671
FILES CLOSED FOR INCOMPLETENESS 4 152576 3229
PA/MONTGOMERY COUNTY/2032.05 22 184
LOANS ORIGINATED 27 43 4 22 540 9917 11879 153 319
APPS APPROVED, NOT ACCEPTED 3 4 1 11446 941 518 518
APPS DENIED 2 13 3 1682 3794 100 264
APPS WITHDRAWN 2 10 2989 3165 210
FILES CLOSED FOR INCOMPLETENESS 41 296 883
PA/MONTGOMERY COUNTY/2032.07 12 146
LOANS ORIGINATED 18 99 6 35 1969 5817 27539 939 831
APPS APPROVED, NOT ACCEPTED 1 8416 1736
APPS DENIED 3 22 3 11 265 1085 5441 842 30
APPS WITHDRAWN 6 111598 3059
FILES CLOSED FOR INCOMPLETENESS 1 6296 1830
PA/MONTGOMERY COUNTY/2032.08 14 199
LOANS ORIGINATED 50 110 3 235 1238 12863 29254 1643 3683
APPS APPROVED, NOT ACCEPTED 1 19398 6271
APPS DENIED 7 31 2 41366 9274 53 1729
APPS WITHDRAWN 4 30 1 51 102 940 8104 200 667
FILES CLOSED FOR INCOMPLETENESS 91 117 2112
PA/MONTGOMERY COUNTY/2033.02 14 122
LOANS ORIGINATED 65 149 7 1427 6057 14437 28600 403 2120
APPS APPROVED, NOT ACCEPTED 3 23 1 11 81 793 5218 10 140
APPS DENIED 10 52 12 44 942 2413 11456 748 569
APPS WITHDRAWN 7 24 2 11 245 1246 4599 48 27
FILES CLOSED FOR INCOMPLETENESS 17 13350 164
06/02/2014Report Date:
AGGREGATE TABLE 1: DISPOSITION OF LOAN APPLICATIONS, BY LOCATION OF PROPERTY AND TYPE OF LOAN, 2013
MSA/MD: 37964 - PHILADELPHIA, PA
Page 98 of 199
ALL LOANS ON PROPERTY LOCATED IN MSA/MD 3/
CENSUS TRACT OR COUNTY NAME ANDDISPOSITION OF APPLICATION 1/(STATE/COUNTY/TRACT NUMBER) FHA, FSA/RHS & VA Conventional
Refinancings Home ImprovementLoans
Loans on DwellingsFor 5 or More
Families
NonoccupantLoans From
Columns A, B, Cand D
Number Number Number Number Number Number$000's $000's $000's $000's $000's $000's
A B C D E F
Home Purchase Loans
Loans on 1- to 4-Family and Manufactured Home Dwellings
Loans OnManufactured Home
Dwellings FromColumns A, B, C & D
G
Number $000's
%MinPop4/
MedianIncome As
PCT ofMSA/MDMedian

PA/MONTGOMERY COUNTY/2033.03 24 110
LOANS ORIGINATED 28 74 3 811 2469 5002 12075 89 1036
APPS APPROVED, NOT ACCEPTED 1 16 1140 3385 177
APPS DENIED 4 28 4 4558 6158 138 587
APPS WITHDRAWN 3 16 2 12 393 439 3234 20 158
FILES CLOSED FOR INCOMPLETENESS 2 131 304 307 2579
PA/MONTGOMERY COUNTY/2033.04 24 117
LOANS ORIGINATED 33 61 5 410 2316 6161 9991 182 752
APPS APPROVED, NOT ACCEPTED 1 5 13 526 70 548 70
APPS DENIED 22 2 41 125 3863 35 442
APPS WITHDRAWN 4 5 11 177 617 1027 25
FILES CLOSED FOR INCOMPLETENESS 1 101 155 128 1574
PA/MONTGOMERY COUNTY/2034.01 20 111
LOANS ORIGINATED 49 149 8 1723 4061 6505 21133 141 2176
APPS APPROVED, NOT ACCEPTED 5 20 1 41 147 420 2820 50 467
APPS DENIED 6 36 8 63 458 755 5726 249 478
APPS WITHDRAWN 6 28 1 2927 3962 15 208
FILES CLOSED FOR INCOMPLETENESS 15 31 108 2556 531
PA/MONTGOMERY COUNTY/2034.02 20 126
LOANS ORIGINATED 43 144 7 1219 3997 7709 25499 466 2313
APPS APPROVED, NOT ACCEPTED 2 21 31 250 251 3794 331
APPS DENIED 7 36 7 35 3161 1736 6588 119 216
APPS WITHDRAWN 5 22 31 162 979 3977 361
FILES CLOSED FOR INCOMPLETENESS 1 10 32 433 117 1379 368
PA/MONTGOMERY COUNTY/2034.03 13 129
LOANS ORIGINATED 26 79 9 1 57 1707 4038 12911 596 22350 665
APPS APPROVED, NOT ACCEPTED 2 151 204 264 2316
APPS DENIED 4 31 32 515 586 5585 227
APPS WITHDRAWN 3 12 11 80 354 2136 123
FILES CLOSED FOR INCOMPLETENESS 5 1770 98
06/02/2014Report Date:
AGGREGATE TABLE 1: DISPOSITION OF LOAN APPLICATIONS, BY LOCATION OF PROPERTY AND TYPE OF LOAN, 2013
MSA/MD: 37964 - PHILADELPHIA, PA
Page 99 of 199
ALL LOANS ON PROPERTY LOCATED IN MSA/MD 3/
CENSUS TRACT OR COUNTY NAME ANDDISPOSITION OF APPLICATION 1/(STATE/COUNTY/TRACT NUMBER) FHA, FSA/RHS & VA Conventional
Refinancings Home ImprovementLoans
Loans on DwellingsFor 5 or More
Families
NonoccupantLoans From
Columns A, B, Cand D
Number Number Number Number Number Number$000's $000's $000's $000's $000's $000's
A B C D E F
Home Purchase Loans
Loans on 1- to 4-Family and Manufactured Home Dwellings
Loans OnManufactured Home
Dwellings FromColumns A, B, C & D
G
Number $000's
%MinPop4/
MedianIncome As
PCT ofMSA/MDMedian

PA/MONTGOMERY COUNTY/2035.00 56 69
LOANS ORIGINATED 23 68 5 1320 2936 2663 8321 129 1146
APPS APPROVED, NOT ACCEPTED 5 1 1907 3 88
APPS DENIED 3 33 6 76 967 420 4269 93 826
APPS WITHDRAWN 4 17 1 15 816 383 2205 8 61
FILES CLOSED FOR INCOMPLETENESS 10 32 251 1369 434
PA/MONTGOMERY COUNTY/2036.01 87 59
LOANS ORIGINATED 4 21 7 2 134 448 269 1930 215 346 942
APPS APPROVED, NOT ACCEPTED 8 11 50 1084 230
APPS DENIED 3 11 9 6204 1153 114 395
APPS WITHDRAWN 5 1 1516 1450 124
FILES CLOSED FOR INCOMPLETENESS 3 1318 79
PA/MONTGOMERY COUNTY/2036.02 52 83
LOANS ORIGINATED 15 65 3 1 1823 3409 2380 8553 53 200 1874
APPS APPROVED, NOT ACCEPTED 83 360 1139
APPS DENIED 2 26 4 61 99 134 3297 43 669
APPS WITHDRAWN 1 15 12 304 140 1809 140
FILES CLOSED FOR INCOMPLETENESS 6 11 122 508 128
PA/MONTGOMERY COUNTY/2037.00 55 59
LOANS ORIGINATED 2 10 1 1 36 643 268 1019 9 2300 199
APPS APPROVED, NOT ACCEPTED 3 2418 220
APPS DENIED 5 2642 53
APPS WITHDRAWN 1 4 1218 486 245
FILES CLOSED FOR INCOMPLETENESS 21 103 397
PA/MONTGOMERY COUNTY/2038.01 59 72
LOANS ORIGINATED 14 40 3 1 1712 1402 1291 4257 77 1525 1294 1 19
APPS APPROVED, NOT ACCEPTED 1 7 32 261 56 1530 946
APPS DENIED 27 11 52978 316 355
APPS WITHDRAWN 4 10 11 81 492 1127 79
FILES CLOSED FOR INCOMPLETENESS 6 22 312 683 218
06/02/2014Report Date:
AGGREGATE TABLE 1: DISPOSITION OF LOAN APPLICATIONS, BY LOCATION OF PROPERTY AND TYPE OF LOAN, 2013
MSA/MD: 37964 - PHILADELPHIA, PA
Page 100 of 199
ALL LOANS ON PROPERTY LOCATED IN MSA/MD 3/
CENSUS TRACT OR COUNTY NAME ANDDISPOSITION OF APPLICATION 1/(STATE/COUNTY/TRACT NUMBER) FHA, FSA/RHS & VA Conventional
Refinancings Home ImprovementLoans
Loans on DwellingsFor 5 or More
Families
NonoccupantLoans From
Columns A, B, Cand D
Number Number Number Number Number Number$000's $000's $000's $000's $000's $000's
A B C D E F
Home Purchase Loans
Loans on 1- to 4-Family and Manufactured Home Dwellings
Loans OnManufactured Home
Dwellings FromColumns A, B, C & D
G
Number $000's
%MinPop4/
MedianIncome As
PCT ofMSA/MDMedian

PA/MONTGOMERY COUNTY/2038.03 73 61
LOANS ORIGINATED 7 45 4 1 297 882 666 5133 85 4900 3249
APPS APPROVED, NOT ACCEPTED 1 5 1 32 307 86 378 4900 291
APPS DENIED 1 23 11 133 295 29 2425 640 1404
APPS WITHDRAWN 1 8 41 147 69 745 281
FILES CLOSED FOR INCOMPLETENESS 5 1 5531 400 531
PA/MONTGOMERY COUNTY/2038.04 73 49
LOANS ORIGINATED 8 32 3 1 187 640 575 2798 113 97 1263
APPS APPROVED, NOT ACCEPTED 7 1 31 123 470 12 180
APPS DENIED 10 4 31 66 942 420 233
APPS WITHDRAWN 5 3430 265
FILES CLOSED FOR INCOMPLETENESS 2 1168 121
PA/MONTGOMERY COUNTY/2039.01 89 44
LOANS ORIGINATED 3 12 3 102 218 177 1410 1097 1215
APPS APPROVED, NOT ACCEPTED 1 140 40
APPS DENIED 2 7 3 1 91 108 196 639 19 150 776
APPS WITHDRAWN 3 21 319 246 143
FILES CLOSED FOR INCOMPLETENESS 1 11 98 77 77
PA/MONTGOMERY COUNTY/2039.02 72 69
LOANS ORIGINATED 4 15 2 1 103 322 438 1778 8 512 1100
APPS APPROVED, NOT ACCEPTED 1 1160 10
APPS DENIED 9 4 41 79 716 48 272
APPS WITHDRAWN 5 1 1 4501 177 4720 317
FILES CLOSED FOR INCOMPLETENESS 1 11 69 62 74
PA/MONTGOMERY COUNTY/2040.02 27 95
LOANS ORIGINATED 18 50 4 2 73 872 4469 11675 375 8393 1052
APPS APPROVED, NOT ACCEPTED 1 9380 1792
APPS DENIED 1 9 2 1272 1821 6 147
APPS WITHDRAWN 5 82322 1585
FILES CLOSED FOR INCOMPLETENESS 1 5 1158 1032 158
06/02/2014Report Date:
AGGREGATE TABLE 1: DISPOSITION OF LOAN APPLICATIONS, BY LOCATION OF PROPERTY AND TYPE OF LOAN, 2013
MSA/MD: 37964 - PHILADELPHIA, PA
Page 101 of 199
ALL LOANS ON PROPERTY LOCATED IN MSA/MD 3/
CENSUS TRACT OR COUNTY NAME ANDDISPOSITION OF APPLICATION 1/(STATE/COUNTY/TRACT NUMBER) FHA, FSA/RHS & VA Conventional
Refinancings Home ImprovementLoans
Loans on DwellingsFor 5 or More
Families
NonoccupantLoans From
Columns A, B, Cand D
Number Number Number Number Number Number$000's $000's $000's $000's $000's $000's
A B C D E F
Home Purchase Loans
Loans on 1- to 4-Family and Manufactured Home Dwellings
Loans OnManufactured Home
Dwellings FromColumns A, B, C & D
G
Number $000's
%MinPop4/
MedianIncome As
PCT ofMSA/MDMedian

PA/MONTGOMERY COUNTY/2040.07 20 82
LOANS ORIGINATED 19 38 2 1 53 863 4774 7584 264 450 1077
APPS APPROVED, NOT ACCEPTED 1 2376 328
APPS DENIED 9 2370
APPS WITHDRAWN 1 5 1186 1271 266
FILES CLOSED FOR INCOMPLETENESS 5 1101
PA/MONTGOMERY COUNTY/2040.08 13 98
LOANS ORIGINATED 31 53 5 49 2027 7843 10178 144 666 1 111
APPS APPROVED, NOT ACCEPTED 5 1089
APPS DENIED 2 17 3 2324 3644 264 396
APPS WITHDRAWN 4 8 2941 2116 334
FILES CLOSED FOR INCOMPLETENESS 2 279
PA/MONTGOMERY COUNTY/2040.09 15 108
LOANS ORIGINATED 29 42 1 1 33 371 8986 24504 417 28000 323
APPS APPROVED, NOT ACCEPTED 5 1097
APPS DENIED 3 18 1 11 102 533 3714 7 86
APPS WITHDRAWN 2 8755 1306
FILES CLOSED FOR INCOMPLETENESS 1 2367 1626
PA/MONTGOMERY COUNTY/2040.10 11 144
LOANS ORIGINATED 26 62 5 36 2152 7395 13075 492 486
APPS APPROVED, NOT ACCEPTED 1 8 2276 1146 16
APPS DENIED 3 16 21 352 732 3010 49
APPS WITHDRAWN 2 10629 2527
FILES CLOSED FOR INCOMPLETENESS 1 1 11 335 313 255 200
PA/MONTGOMERY COUNTY/2041.01 8 101
LOANS ORIGINATED 71 119 15 1 3312 3171 16696 22074 1178 270 5910
APPS APPROVED, NOT ACCEPTED 6 11 2 51533 1868 195 822
APPS DENIED 6 25 4 31 294 1486 4490 77 288
APPS WITHDRAWN 8 13 2 42 579 1950 2401 40 623
FILES CLOSED FOR INCOMPLETENESS 13 21 75 2005 144
06/02/2014Report Date:
AGGREGATE TABLE 1: DISPOSITION OF LOAN APPLICATIONS, BY LOCATION OF PROPERTY AND TYPE OF LOAN, 2013
MSA/MD: 37964 - PHILADELPHIA, PA
Page 102 of 199
ALL LOANS ON PROPERTY LOCATED IN MSA/MD 3/
CENSUS TRACT OR COUNTY NAME ANDDISPOSITION OF APPLICATION 1/(STATE/COUNTY/TRACT NUMBER) FHA, FSA/RHS & VA Conventional
Refinancings Home ImprovementLoans
Loans on DwellingsFor 5 or More
Families
NonoccupantLoans From
Columns A, B, Cand D
Number Number Number Number Number Number$000's $000's $000's $000's $000's $000's
A B C D E F
Home Purchase Loans
Loans on 1- to 4-Family and Manufactured Home Dwellings
Loans OnManufactured Home
Dwellings FromColumns A, B, C & D
G
Number $000's
%MinPop4/
MedianIncome As
PCT ofMSA/MDMedian

PA/MONTGOMERY COUNTY/2041.02 19 95
LOANS ORIGINATED 61 105 2 1 355 1155 14443 20881 220 275 6219
APPS APPROVED, NOT ACCEPTED 4 7 42 341 1091 1599 786
APPS DENIED 5 24 3 71 119 982 5278 38 1459
APPS WITHDRAWN 4 17 1 31 240 769 3441 1455 453
FILES CLOSED FOR INCOMPLETENESS 7 21 288 1151 315
PA/MONTGOMERY COUNTY/2042.00 13 126
LOANS ORIGINATED 32 45 2 116 1564 8901 9497 77 2199
APPS APPROVED, NOT ACCEPTED 2 7557 1645
APPS DENIED 1 14 21 199 308 3375 414
APPS WITHDRAWN 5 8 31444 2101 456
FILES CLOSED FOR INCOMPLETENESS 4 1 11080 326 357
PA/MONTGOMERY COUNTY/2043.00 17 184
LOANS ORIGINATED 32 58 4 1 126 1529 9682 16420 564 3038 2842
APPS APPROVED, NOT ACCEPTED 1 5 1417 1250 200
APPS DENIED 3 34 2 41 108 1440 9614 450 1136
APPS WITHDRAWN 4 7 1 41403 1786 20 1067
FILES CLOSED FOR INCOMPLETENESS 1 276
PA/MONTGOMERY COUNTY/2044.00 12 218
LOANS ORIGINATED 34 83 7 514010 26137 1557 1049
APPS APPROVED, NOT ACCEPTED 2 6 2792 2380 355
APPS DENIED 6 21 32660 6989 205
APPS WITHDRAWN 4 51455 2130
FILES CLOSED FOR INCOMPLETENESS 1 7417 1641
PA/MONTGOMERY COUNTY/2045.00 10 190
LOANS ORIGINATED 45 123 8 516340 44815 2099 1064
APPS APPROVED, NOT ACCEPTED 2 14 1 1567 4630 116 263
APPS DENIED 12 25 2 54681 10799 496 974
APPS WITHDRAWN 11 12 3 31 315 4505 3051 1166 558
FILES CLOSED FOR INCOMPLETENESS 1 6 1940 1622 1388
06/02/2014Report Date:
AGGREGATE TABLE 1: DISPOSITION OF LOAN APPLICATIONS, BY LOCATION OF PROPERTY AND TYPE OF LOAN, 2013
MSA/MD: 37964 - PHILADELPHIA, PA
Page 103 of 199
ALL LOANS ON PROPERTY LOCATED IN MSA/MD 3/
CENSUS TRACT OR COUNTY NAME ANDDISPOSITION OF APPLICATION 1/(STATE/COUNTY/TRACT NUMBER) FHA, FSA/RHS & VA Conventional
Refinancings Home ImprovementLoans
Loans on DwellingsFor 5 or More
Families
NonoccupantLoans From
Columns A, B, Cand D
Number Number Number Number Number Number$000's $000's $000's $000's $000's $000's
A B C D E F
Home Purchase Loans
Loans on 1- to 4-Family and Manufactured Home Dwellings
Loans OnManufactured Home
Dwellings FromColumns A, B, C & D
G
Number $000's
%MinPop4/
MedianIncome As
PCT ofMSA/MDMedian
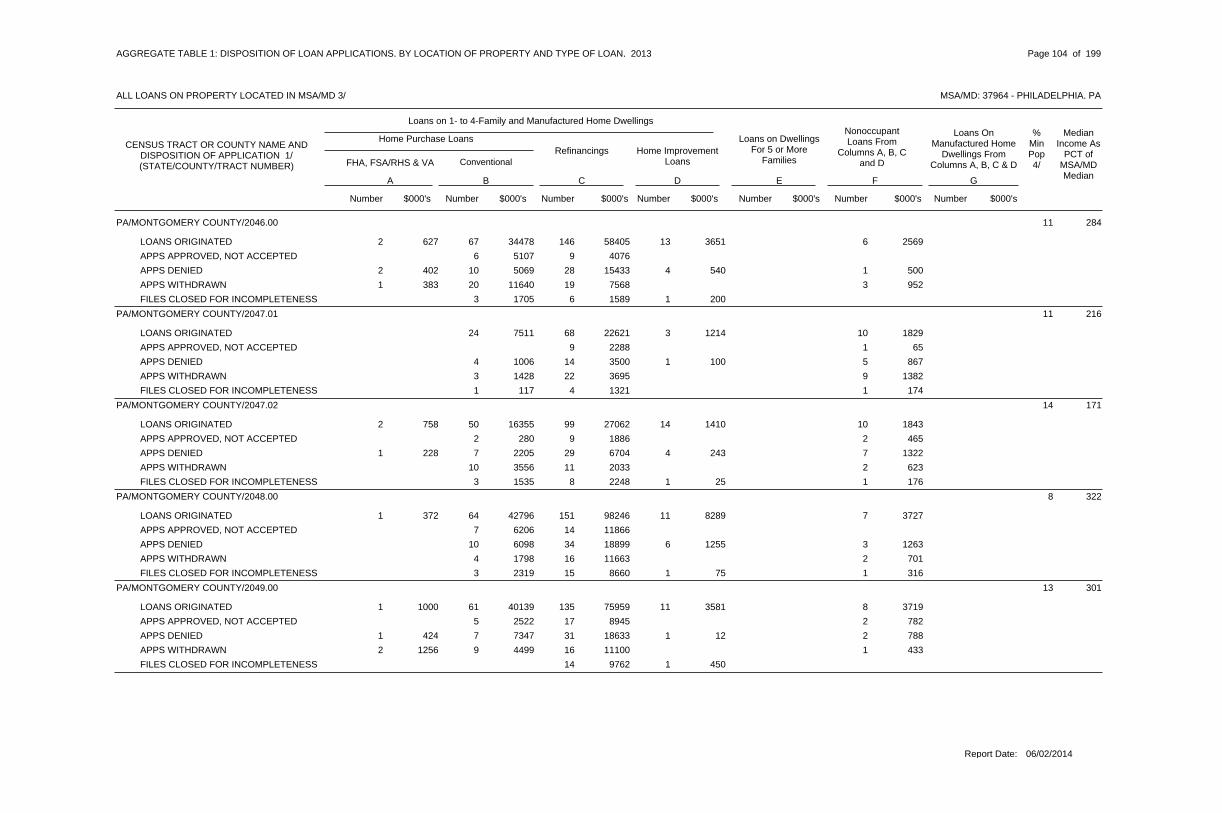
PA/MONTGOMERY COUNTY/2046.00 11 284
LOANS ORIGINATED 67 146 13 62 627 34478 58405 3651 2569
APPS APPROVED, NOT ACCEPTED 6 95107 4076
APPS DENIED 10 28 4 12 402 5069 15433 540 500
APPS WITHDRAWN 20 19 31 383 11640 7568 952
FILES CLOSED FOR INCOMPLETENESS 3 6 11705 1589 200
PA/MONTGOMERY COUNTY/2047.01 11 216
LOANS ORIGINATED 24 68 3 107511 22621 1214 1829
APPS APPROVED, NOT ACCEPTED 9 12288 65
APPS DENIED 4 14 1 51006 3500 100 867
APPS WITHDRAWN 3 22 91428 3695 1382
FILES CLOSED FOR INCOMPLETENESS 1 4 1117 1321 174
PA/MONTGOMERY COUNTY/2047.02 14 171
LOANS ORIGINATED 50 99 14 102 758 16355 27062 1410 1843
APPS APPROVED, NOT ACCEPTED 2 9 2280 1886 465
APPS DENIED 7 29 4 71 228 2205 6704 243 1322
APPS WITHDRAWN 10 11 23556 2033 623
FILES CLOSED FOR INCOMPLETENESS 3 8 1 11535 2248 25 176
PA/MONTGOMERY COUNTY/2048.00 8 322
LOANS ORIGINATED 64 151 11 71 372 42796 98246 8289 3727
APPS APPROVED, NOT ACCEPTED 7 146206 11866
APPS DENIED 10 34 6 36098 18899 1255 1263
APPS WITHDRAWN 4 16 21798 11663 701
FILES CLOSED FOR INCOMPLETENESS 3 15 1 12319 8660 75 316
PA/MONTGOMERY COUNTY/2049.00 13 301
LOANS ORIGINATED 61 135 11 81 1000 40139 75959 3581 3719
APPS APPROVED, NOT ACCEPTED 5 17 22522 8945 782
APPS DENIED 7 31 1 21 424 7347 18633 12 788
APPS WITHDRAWN 9 16 12 1256 4499 11100 433
FILES CLOSED FOR INCOMPLETENESS 14 19762 450
06/02/2014Report Date:
AGGREGATE TABLE 1: DISPOSITION OF LOAN APPLICATIONS, BY LOCATION OF PROPERTY AND TYPE OF LOAN, 2013
MSA/MD: 37964 - PHILADELPHIA, PA
Page 104 of 199
ALL LOANS ON PROPERTY LOCATED IN MSA/MD 3/
CENSUS TRACT OR COUNTY NAME ANDDISPOSITION OF APPLICATION 1/(STATE/COUNTY/TRACT NUMBER) FHA, FSA/RHS & VA Conventional
Refinancings Home ImprovementLoans
Loans on DwellingsFor 5 or More
Families
NonoccupantLoans From
Columns A, B, Cand D
Number Number Number Number Number Number$000's $000's $000's $000's $000's $000's
A B C D E F
Home Purchase Loans
Loans on 1- to 4-Family and Manufactured Home Dwellings
Loans OnManufactured Home
Dwellings FromColumns A, B, C & D
G
Number $000's
%MinPop4/
MedianIncome As
PCT ofMSA/MDMedian

PA/MONTGOMERY COUNTY/2050.00 27 134
LOANS ORIGINATED 22 34 1 78501 12517 15 948
APPS APPROVED, NOT ACCEPTED 3 1 11318 1069 73
APPS DENIED 5 17 32551 5969 417
APPS WITHDRAWN 4 1 2 21499 791 56 556
FILES CLOSED FOR INCOMPLETENESS 1 1 1326 417 417
PA/MONTGOMERY COUNTY/2051.00 24 178
LOANS ORIGINATED 14 19 31 306 5001 10584 596
APPS APPROVED, NOT ACCEPTED 11 290 502
APPS DENIED 1 3 2 1716 1376 2162 716
APPS WITHDRAWN 2 770
FILES CLOSED FOR INCOMPLETENESS 5 11884 417
PA/MONTGOMERY COUNTY/2052.00 10 255
LOANS ORIGINATED 46 88 2 101 347 26398 46753 1350 2380
APPS APPROVED, NOT ACCEPTED 6 6 14846 2784 157
APPS DENIED 8 15 2 16045 6111 230 275
APPS WITHDRAWN 11 8 37388 3139 584
FILES CLOSED FOR INCOMPLETENESS 3 11239 675
PA/MONTGOMERY COUNTY/2053.00 46 111
LOANS ORIGINATED 21 36 3 1 161 142 6430 8134 158 1920 4269
APPS APPROVED, NOT ACCEPTED 2 6 4460 1322 957
APPS DENIED 3 11 4 1 51 204 921 2186 160 275 1010
APPS WITHDRAWN 2 7834 1653
FILES CLOSED FOR INCOMPLETENESS 7 11204 170
PA/MONTGOMERY COUNTY/2054.00 18 211
LOANS ORIGINATED 61 146 5 1 1126427 57257 1804 706 3158
APPS APPROVED, NOT ACCEPTED 5 9 11510 5339 236
APPS DENIED 9 25 2 1 16042 20211 315 1190 173
APPS WITHDRAWN 13 16 1 41 102 5133 13312 417 944
FILES CLOSED FOR INCOMPLETENESS 4 10 2 12587 5818 200 100
06/02/2014Report Date:
AGGREGATE TABLE 1: DISPOSITION OF LOAN APPLICATIONS, BY LOCATION OF PROPERTY AND TYPE OF LOAN, 2013
MSA/MD: 37964 - PHILADELPHIA, PA
Page 105 of 199
ALL LOANS ON PROPERTY LOCATED IN MSA/MD 3/
CENSUS TRACT OR COUNTY NAME ANDDISPOSITION OF APPLICATION 1/(STATE/COUNTY/TRACT NUMBER) FHA, FSA/RHS & VA Conventional
Refinancings Home ImprovementLoans
Loans on DwellingsFor 5 or More
Families
NonoccupantLoans From
Columns A, B, Cand D
Number Number Number Number Number Number$000's $000's $000's $000's $000's $000's
A B C D E F
Home Purchase Loans
Loans on 1- to 4-Family and Manufactured Home Dwellings
Loans OnManufactured Home
Dwellings FromColumns A, B, C & D
G
Number $000's
%MinPop4/
MedianIncome As
PCT ofMSA/MDMedian

PA/MONTGOMERY COUNTY/2055.01 30 86
LOANS ORIGINATED 44 48 4 1 145 1180 10570 9089 280 2700 2221
APPS APPROVED, NOT ACCEPTED 1 8 3109 1365 428
APPS DENIED 1 15 1 1 21 158 158 2696 50 400 254
APPS WITHDRAWN 7 9 11 297 2114 2362 189
FILES CLOSED FOR INCOMPLETENESS 3 525
PA/MONTGOMERY COUNTY/2055.02 13 210
LOANS ORIGINATED 43 113 4 42 695 18204 35314 507 817
APPS APPROVED, NOT ACCEPTED 2 13 1368 3370 220
APPS DENIED 6 23 1 22 498 2905 7455 10 526
APPS WITHDRAWN 7 24 32615 7970 583
FILES CLOSED FOR INCOMPLETENESS 1 8516 2897
PA/MONTGOMERY COUNTY/2055.03 22 163
LOANS ORIGINATED 56 139 3 1 63 890 15514 35670 324 11500 1009
APPS APPROVED, NOT ACCEPTED 2 81155 1714
APPS DENIED 13 42 2 33622 11361 30 441
APPS WITHDRAWN 8 14 1 12488 3230 240 232
FILES CLOSED FOR INCOMPLETENESS 9 12799 10
PA/MONTGOMERY COUNTY/2056.00 12 135
LOANS ORIGINATED 62 131 12 1 213 907 18325 33722 2482 2000 4111
APPS APPROVED, NOT ACCEPTED 9 2529
APPS DENIED 7 16 9 61 424 1938 3941 949 793
APPS WITHDRAWN 8 14 42341 3289 986
FILES CLOSED FOR INCOMPLETENESS 5 2 11 425 1781 749 119
PA/MONTGOMERY COUNTY/2057.00 26 74
LOANS ORIGINATED 22 65 6 1 2113 2313 2961 10045 289 320 3017
APPS APPROVED, NOT ACCEPTED 7 3865 401
APPS DENIED 13 29 6 1 94 597 1812 4503 64 315 1216 1 15
APPS WITHDRAWN 2 15 2 32 324 249 2416 110 480
FILES CLOSED FOR INCOMPLETENESS 1 101 214 113 1518
06/02/2014Report Date:
AGGREGATE TABLE 1: DISPOSITION OF LOAN APPLICATIONS, BY LOCATION OF PROPERTY AND TYPE OF LOAN, 2013
MSA/MD: 37964 - PHILADELPHIA, PA
Page 106 of 199
ALL LOANS ON PROPERTY LOCATED IN MSA/MD 3/
CENSUS TRACT OR COUNTY NAME ANDDISPOSITION OF APPLICATION 1/(STATE/COUNTY/TRACT NUMBER) FHA, FSA/RHS & VA Conventional
Refinancings Home ImprovementLoans
Loans on DwellingsFor 5 or More
Families
NonoccupantLoans From
Columns A, B, Cand D
Number Number Number Number Number Number$000's $000's $000's $000's $000's $000's
A B C D E F
Home Purchase Loans
Loans on 1- to 4-Family and Manufactured Home Dwellings
Loans OnManufactured Home
Dwellings FromColumns A, B, C & D
G
Number $000's
%MinPop4/
MedianIncome As
PCT ofMSA/MDMedian

PA/MONTGOMERY COUNTY/2058.01 43 87
LOANS ORIGINATED 13 23 61418 3084 728
APPS APPROVED, NOT ACCEPTED 1 2107 377
APPS DENIED 4 12 1 2396 1282 14 180
APPS WITHDRAWN 1 3 2144 368 72000
FILES CLOSED FOR INCOMPLETENESS 2 2193 348
PA/MONTGOMERY COUNTY/2058.05 26 124
LOANS ORIGINATED 30 69 6 84 900 6464 11770 185 1031
APPS APPROVED, NOT ACCEPTED 2 9 1258 1292 7
APPS DENIED 2 14 6 2212 2014 420 334
APPS WITHDRAWN 5 133 663 1015 2242
FILES CLOSED FOR INCOMPLETENESS 5 716
PA/MONTGOMERY COUNTY/2058.06 21 85
LOANS ORIGINATED 9 43 106 1059 1620 6601 1030
APPS APPROVED, NOT ACCEPTED 3 1444 149
APPS DENIED 11 2 21898 20 262
APPS WITHDRAWN 1 255 191
FILES CLOSED FOR INCOMPLETENESS 1 2280 294
PA/MONTGOMERY COUNTY/2058.07 49 107
LOANS ORIGINATED 13 22 1 66 1201 2219 3498 77000 960
APPS APPROVED, NOT ACCEPTED
APPS DENIED 2 7 2 22 372 371 884 19 177
APPS WITHDRAWN 1 4125 629
FILES CLOSED FOR INCOMPLETENESS 1 2166 412
PA/MONTGOMERY COUNTY/2058.08 25 146
LOANS ORIGINATED 38 127 7 134 1238 10403 26103 954 2278
APPS APPROVED, NOT ACCEPTED 1 9279 2188
APPS DENIED 2 28 3 2621 5223 350 270
APPS WITHDRAWN 2 12 1 2562 2761 20 602
FILES CLOSED FOR INCOMPLETENESS 7 1790
06/02/2014Report Date:
AGGREGATE TABLE 1: DISPOSITION OF LOAN APPLICATIONS, BY LOCATION OF PROPERTY AND TYPE OF LOAN, 2013
MSA/MD: 37964 - PHILADELPHIA, PA
Page 107 of 199
ALL LOANS ON PROPERTY LOCATED IN MSA/MD 3/
CENSUS TRACT OR COUNTY NAME ANDDISPOSITION OF APPLICATION 1/(STATE/COUNTY/TRACT NUMBER) FHA, FSA/RHS & VA Conventional
Refinancings Home ImprovementLoans
Loans on DwellingsFor 5 or More
Families
NonoccupantLoans From
Columns A, B, Cand D
Number Number Number Number Number Number$000's $000's $000's $000's $000's $000's
A B C D E F
Home Purchase Loans
Loans on 1- to 4-Family and Manufactured Home Dwellings
Loans OnManufactured Home
Dwellings FromColumns A, B, C & D
G
Number $000's
%MinPop4/
MedianIncome As
PCT ofMSA/MDMedian

PA/MONTGOMERY COUNTY/2058.09 19 159
LOANS ORIGINATED 12 53 4 36 1472 3285 10356 215 380
APPS APPROVED, NOT ACCEPTED 1 6295 1138
APPS DENIED 10 22531 50
APPS WITHDRAWN 2 7 2480 1717 255
FILES CLOSED FOR INCOMPLETENESS 4 827
PA/MONTGOMERY COUNTY/2059.03 14 189
LOANS ORIGINATED 32 82 8 62 1039 14203 26050 1725 1749
APPS APPROVED, NOT ACCEPTED 2 13 31 358 886 3680 628
APPS DENIED 4 24 2 22410 7339 370 530
APPS WITHDRAWN 3 8 2 1806 2048 405 228
FILES CLOSED FOR INCOMPLETENESS 1 6417 1720
PA/MONTGOMERY COUNTY/2059.04 14 164
LOANS ORIGINATED 29 74 4 23 924 10802 23883 996 651
APPS APPROVED, NOT ACCEPTED 9 2246
APPS DENIED 3 18 2 21 365 999 6780 25 462
APPS WITHDRAWN 2 11 21 147 768 3537 537
FILES CLOSED FOR INCOMPLETENESS 2 2586 416
PA/MONTGOMERY COUNTY/2059.05 31 119
LOANS ORIGINATED 17 48 4 65 1024 3780 10271 232 1717
APPS APPROVED, NOT ACCEPTED 1 3 1204 813 35
APPS DENIED 3 16 3 21 254 481 3876 338 378
APPS WITHDRAWN 4 9 11 218 682 1849 33
FILES CLOSED FOR INCOMPLETENESS 1 3100 636
PA/MONTGOMERY COUNTY/2059.06 20 153
LOANS ORIGINATED 22 57 2 137 1470 5642 10469 184 2505
APPS APPROVED, NOT ACCEPTED 2 11 1440 1978 60
APPS DENIED 2 20 1524 4316 96
APPS WITHDRAWN 2 12 5627 1985 539
FILES CLOSED FOR INCOMPLETENESS 4 977
06/02/2014Report Date:
AGGREGATE TABLE 1: DISPOSITION OF LOAN APPLICATIONS, BY LOCATION OF PROPERTY AND TYPE OF LOAN, 2013
MSA/MD: 37964 - PHILADELPHIA, PA
Page 108 of 199
ALL LOANS ON PROPERTY LOCATED IN MSA/MD 3/
CENSUS TRACT OR COUNTY NAME ANDDISPOSITION OF APPLICATION 1/(STATE/COUNTY/TRACT NUMBER) FHA, FSA/RHS & VA Conventional
Refinancings Home ImprovementLoans
Loans on DwellingsFor 5 or More
Families
NonoccupantLoans From
Columns A, B, Cand D
Number Number Number Number Number Number$000's $000's $000's $000's $000's $000's
A B C D E F
Home Purchase Loans
Loans on 1- to 4-Family and Manufactured Home Dwellings
Loans OnManufactured Home
Dwellings FromColumns A, B, C & D
G
Number $000's
%MinPop4/
MedianIncome As
PCT ofMSA/MDMedian

PA/MONTGOMERY COUNTY/2060.04 29 134
LOANS ORIGINATED 29 88 10 54 621 7385 17067 851 592
APPS APPROVED, NOT ACCEPTED 2 101 172 549 2465
APPS DENIED 2 23 4 4462 4589 90 418
APPS WITHDRAWN 4 9 12 610 1166 1865 274
FILES CLOSED FOR INCOMPLETENESS 1 5400 1017
PA/MONTGOMERY COUNTY/2060.05 13 126
LOANS ORIGINATED 30 90 5 38 1423 7658 20548 347 472 1 20
APPS APPROVED, NOT ACCEPTED 10 12194 5
APPS DENIED 3 16 9 13 805 818 3170 370 157 1 4
APPS WITHDRAWN 18 21 81 4370 221
FILES CLOSED FOR INCOMPLETENESS 5 889
PA/MONTGOMERY COUNTY/2060.06 6 127
LOANS ORIGINATED 14 48 5 45 1279 3066 9333 371 419
APPS APPROVED, NOT ACCEPTED 2 5 11 213 369 795 120
APPS DENIED 4 4722 35
APPS WITHDRAWN 3 6 1 1668 1384 260 60
FILES CLOSED FOR INCOMPLETENESS 1 2 1215 475 121
PA/MONTGOMERY COUNTY/2060.07 28 126
LOANS ORIGINATED 33 100 8 48 1991 7647 24989 743 1166 4 104
APPS APPROVED, NOT ACCEPTED 6 3 3518 665 255 4 178
APPS DENIED 3 35 3 11 245 764 6932 164 4
APPS WITHDRAWN 4 16 1 11 189 969 4040 63 128
FILES CLOSED FOR INCOMPLETENESS 2 11 1520 2933 50
PA/MONTGOMERY COUNTY/2061.02 20 168
LOANS ORIGINATED 102 233 16 2123 4729 27367 50174 2319 4228
APPS APPROVED, NOT ACCEPTED 6 14 3 12076 3544 53 24
APPS DENIED 15 65 10 85 1370 4559 17768 605 1267
APPS WITHDRAWN 19 41 1 41 230 5339 9400 35 855
FILES CLOSED FOR INCOMPLETENESS 2 14 41 327 556 3946 910
06/02/2014Report Date:
AGGREGATE TABLE 1: DISPOSITION OF LOAN APPLICATIONS, BY LOCATION OF PROPERTY AND TYPE OF LOAN, 2013
MSA/MD: 37964 - PHILADELPHIA, PA
Page 109 of 199
ALL LOANS ON PROPERTY LOCATED IN MSA/MD 3/
CENSUS TRACT OR COUNTY NAME ANDDISPOSITION OF APPLICATION 1/(STATE/COUNTY/TRACT NUMBER) FHA, FSA/RHS & VA Conventional
Refinancings Home ImprovementLoans
Loans on DwellingsFor 5 or More
Families
NonoccupantLoans From
Columns A, B, Cand D
Number Number Number Number Number Number$000's $000's $000's $000's $000's $000's
A B C D E F
Home Purchase Loans
Loans on 1- to 4-Family and Manufactured Home Dwellings
Loans OnManufactured Home
Dwellings FromColumns A, B, C & D
G
Number $000's
%MinPop4/
MedianIncome As
PCT ofMSA/MDMedian

PA/MONTGOMERY COUNTY/2061.04 15 172
LOANS ORIGINATED 42 96 6 87 1584 12681 22199 527 1202
APPS APPROVED, NOT ACCEPTED 2 9 11 172 808 2560 233
APPS DENIED 5 14 5 11554 2635 96 20
APPS WITHDRAWN 5 91 177 1349 2427
FILES CLOSED FOR INCOMPLETENESS 2 10 1727 2327 158
PA/MONTGOMERY COUNTY/2061.05 12 183
LOANS ORIGINATED 65 145 16 26 1854 21456 37547 1069 393
APPS APPROVED, NOT ACCEPTED 7 13 12837 3859 264
APPS DENIED 5 31 8 14 1110 1222 9043 275 2
APPS WITHDRAWN 6 173 789 1328 4553
FILES CLOSED FOR INCOMPLETENESS 2 9 3908 2035 375
PA/MONTGOMERY COUNTY/2061.06 9 140
LOANS ORIGINATED 40 114 4 717 3247 8346 20097 431 840
APPS APPROVED, NOT ACCEPTED 2 71 242 279 1563
APPS DENIED 30 54 852 5339 440
APPS WITHDRAWN 4 18 1 11 258 1075 3471 51 70
FILES CLOSED FOR INCOMPLETENESS 2 9235 1620
PA/MONTGOMERY COUNTY/2062.01 13 98
LOANS ORIGINATED 16 48 3 912 2257 3362 6959 34 2088
APPS APPROVED, NOT ACCEPTED 2 1 2176 97 176
APPS DENIED 2 10 2 2125 1474 45 125
APPS WITHDRAWN 1 12189 2031
FILES CLOSED FOR INCOMPLETENESS 3 1498 173
PA/MONTGOMERY COUNTY/2062.02 13 109
LOANS ORIGINATED 12 32 3 1 66 989 1722 4843 206 375 1342
APPS APPROVED, NOT ACCEPTED 2 252
APPS DENIED 1 18 3 11 163 87 2451 22 250
APPS WITHDRAWN 2 8 1250 1127 114
FILES CLOSED FOR INCOMPLETENESS 4 593
06/02/2014Report Date:
AGGREGATE TABLE 1: DISPOSITION OF LOAN APPLICATIONS, BY LOCATION OF PROPERTY AND TYPE OF LOAN, 2013
MSA/MD: 37964 - PHILADELPHIA, PA
Page 110 of 199
ALL LOANS ON PROPERTY LOCATED IN MSA/MD 3/
CENSUS TRACT OR COUNTY NAME ANDDISPOSITION OF APPLICATION 1/(STATE/COUNTY/TRACT NUMBER) FHA, FSA/RHS & VA Conventional
Refinancings Home ImprovementLoans
Loans on DwellingsFor 5 or More
Families
NonoccupantLoans From
Columns A, B, Cand D
Number Number Number Number Number Number$000's $000's $000's $000's $000's $000's
A B C D E F
Home Purchase Loans
Loans on 1- to 4-Family and Manufactured Home Dwellings
Loans OnManufactured Home
Dwellings FromColumns A, B, C & D
G
Number $000's
%MinPop4/
MedianIncome As
PCT ofMSA/MDMedian

PA/MONTGOMERY COUNTY/2063.00 12 158
LOANS ORIGINATED 26 64 7 64 972 6693 13868 901 842
APPS APPROVED, NOT ACCEPTED 1 8209 1838
APPS DENIED 4 21 7 21 229 797 5236 230 298
APPS WITHDRAWN 3 14 1578 3253 180
FILES CLOSED FOR INCOMPLETENESS 1 9 2 1250 2156 141 220
PA/MONTGOMERY COUNTY/2064.00 13 119
LOANS ORIGINATED 52 115 7 147 1523 12021 19446 644 2113
APPS APPROVED, NOT ACCEPTED 1 6190 1239
APPS DENIED 1 24 8 21 206 157 5170 152 333
APPS WITHDRAWN 9 21 1 22 482 1696 4016 150 299
FILES CLOSED FOR INCOMPLETENESS 7 1 11 157 1419 10 162
PA/MONTGOMERY COUNTY/2065.01 18 145
LOANS ORIGINATED 37 118 13 314 3472 8718 24803 413 568
APPS APPROVED, NOT ACCEPTED 1 14 12 540 172 3141 185
APPS DENIED 2 29 72 512 555 6512 100
APPS WITHDRAWN 2 25 3 31 201 413 5700 74 560
FILES CLOSED FOR INCOMPLETENESS 9 11843 20
PA/MONTGOMERY COUNTY/2065.02 11 141
LOANS ORIGINATED 40 131 11 423 4145 9452 24135 857 325
APPS APPROVED, NOT ACCEPTED 1 11 11 182 61 2010 61
APPS DENIED 1 35 6 1149 7891 157 122
APPS WITHDRAWN 7 211 155 1350 3861
FILES CLOSED FOR INCOMPLETENESS 1 11 1 2100 1974 35 232
PA/MONTGOMERY COUNTY/2066.00 7 84
LOANS ORIGINATED 8 21 2 1 33 635 1021 2555 31 318 213
APPS APPROVED, NOT ACCEPTED 2 2107 112
APPS DENIED 2 7 1207 679 80
APPS WITHDRAWN 1 21 103 198 474
FILES CLOSED FOR INCOMPLETENESS 2 176
06/02/2014Report Date:
AGGREGATE TABLE 1: DISPOSITION OF LOAN APPLICATIONS, BY LOCATION OF PROPERTY AND TYPE OF LOAN, 2013
MSA/MD: 37964 - PHILADELPHIA, PA
Page 111 of 199
ALL LOANS ON PROPERTY LOCATED IN MSA/MD 3/
CENSUS TRACT OR COUNTY NAME ANDDISPOSITION OF APPLICATION 1/(STATE/COUNTY/TRACT NUMBER) FHA, FSA/RHS & VA Conventional
Refinancings Home ImprovementLoans
Loans on DwellingsFor 5 or More
Families
NonoccupantLoans From
Columns A, B, Cand D
Number Number Number Number Number Number$000's $000's $000's $000's $000's $000's
A B C D E F
Home Purchase Loans
Loans on 1- to 4-Family and Manufactured Home Dwellings
Loans OnManufactured Home
Dwellings FromColumns A, B, C & D
G
Number $000's
%MinPop4/
MedianIncome As
PCT ofMSA/MDMedian

PA/MONTGOMERY COUNTY/2067.02 72 0
LOANS ORIGINATED 11 219 30
APPS APPROVED, NOT ACCEPTED
APPS DENIED 1 46
APPS WITHDRAWN
FILES CLOSED FOR INCOMPLETENESS
PA/MONTGOMERY COUNTY/2067.03 11 138
LOANS ORIGINATED 57 84 7 1 311 3032 14677 17730 395 45 565 1 10
APPS APPROVED, NOT ACCEPTED 5 10 1971 2161 144
APPS DENIED 6 25 41 209 2104 6357 140
APPS WITHDRAWN 3 17 1545 4609 128
FILES CLOSED FOR INCOMPLETENESS 1 6285 1717
PA/MONTGOMERY COUNTY/2067.04 11 157
LOANS ORIGINATED 88 208 11 1126 5846 25487 50073 1249 1893
APPS APPROVED, NOT ACCEPTED 1 28 31 195 400 6925 606
APPS DENIED 5 50 11 23 586 1313 13345 470 263
APPS WITHDRAWN 11 30 1 21 327 2888 7123 15 319
FILES CLOSED FOR INCOMPLETENESS 5 12 2 11480 3427 105 269
PA/MONTGOMERY COUNTY/2068.01 17 169
LOANS ORIGINATED 93 187 16 1011 2890 30839 53971 1699 1885
APPS APPROVED, NOT ACCEPTED 6 16 1 12739 4082 10 248
APPS DENIED 8 42 3 21 373 3344 13172 512 456
APPS WITHDRAWN 12 26 4 43411 9215 134 904
FILES CLOSED FOR INCOMPLETENESS 4 13 31716 4113 1267
PA/MONTGOMERY COUNTY/2068.02 13 144
LOANS ORIGINATED 22 86 13 96 1305 6254 20111 1517 1932
APPS APPROVED, NOT ACCEPTED 1 8 1 1248 2447 25 248
APPS DENIED 4 19 2 21529 5066 200 1139
APPS WITHDRAWN 7 9 11965 2044 200
FILES CLOSED FOR INCOMPLETENESS 2 7967 1487
06/02/2014Report Date:
AGGREGATE TABLE 1: DISPOSITION OF LOAN APPLICATIONS, BY LOCATION OF PROPERTY AND TYPE OF LOAN, 2013
MSA/MD: 37964 - PHILADELPHIA, PA
Page 112 of 199
ALL LOANS ON PROPERTY LOCATED IN MSA/MD 3/
CENSUS TRACT OR COUNTY NAME ANDDISPOSITION OF APPLICATION 1/(STATE/COUNTY/TRACT NUMBER) FHA, FSA/RHS & VA Conventional
Refinancings Home ImprovementLoans
Loans on DwellingsFor 5 or More
Families
NonoccupantLoans From
Columns A, B, Cand D
Number Number Number Number Number Number$000's $000's $000's $000's $000's $000's
A B C D E F
Home Purchase Loans
Loans on 1- to 4-Family and Manufactured Home Dwellings
Loans OnManufactured Home
Dwellings FromColumns A, B, C & D
G
Number $000's
%MinPop4/
MedianIncome As
PCT ofMSA/MDMedian

PA/MONTGOMERY COUNTY/2069.01 22 113
LOANS ORIGINATED 27 82 12 1 45 1399 7463 16608 1409 123 554
APPS APPROVED, NOT ACCEPTED 1 1 1235 236 18
APPS DENIED 17 21 412 3726 11
APPS WITHDRAWN 3 16 2 1881 3502 253 237
FILES CLOSED FOR INCOMPLETENESS 1 3262 674
PA/MONTGOMERY COUNTY/2069.04 16 118
LOANS ORIGINATED 60 102 9 1 1510 2511 12937 18114 508 208 1952 2 112
APPS APPROVED, NOT ACCEPTED 4 6 32 573 508 1209 397 1 32
APPS DENIED 3 30 4 5776 6541 90 931
APPS WITHDRAWN 3 12 1 11 361 347 2515 25 73
FILES CLOSED FOR INCOMPLETENESS 5 11 299 872 36
PA/MONTGOMERY COUNTY/2069.05 17 156
LOANS ORIGINATED 37 156 20 167 1807 7225 26550 1204 2135
APPS APPROVED, NOT ACCEPTED 1 14 1 2130 3460 55 236
APPS DENIED 2 37 3 5285 6836 120 710
APPS WITHDRAWN 4 26 21079 5174 170
FILES CLOSED FOR INCOMPLETENESS 1 13 1126 2129 80
PA/MONTGOMERY COUNTY/2069.06 10 136
LOANS ORIGINATED 21 81 10 104400 15934 803 1010
APPS APPROVED, NOT ACCEPTED 2 12 1524 2452 82
APPS DENIED 1 24 4 21 424 60 5685 92 242
APPS WITHDRAWN 1 14 1 2268 2973 9 197
FILES CLOSED FOR INCOMPLETENESS 2 9564 2263
PA/MONTGOMERY COUNTY/2070.01 13 145
LOANS ORIGINATED 57 212 26 1 910 2580 16780 51058 2293 10720 2085 1 25
APPS APPROVED, NOT ACCEPTED 6 25 11 494 1755 6417 177
APPS DENIED 6 61 61 410 2446 16871 506
APPS WITHDRAWN 7 31 32 535 1918 8081 849
FILES CLOSED FOR INCOMPLETENESS 3 13 1748 4078 350
06/02/2014Report Date:
AGGREGATE TABLE 1: DISPOSITION OF LOAN APPLICATIONS, BY LOCATION OF PROPERTY AND TYPE OF LOAN, 2013
MSA/MD: 37964 - PHILADELPHIA, PA
Page 113 of 199
ALL LOANS ON PROPERTY LOCATED IN MSA/MD 3/
CENSUS TRACT OR COUNTY NAME ANDDISPOSITION OF APPLICATION 1/(STATE/COUNTY/TRACT NUMBER) FHA, FSA/RHS & VA Conventional
Refinancings Home ImprovementLoans
Loans on DwellingsFor 5 or More
Families
NonoccupantLoans From
Columns A, B, Cand D
Number Number Number Number Number Number$000's $000's $000's $000's $000's $000's
A B C D E F
Home Purchase Loans
Loans on 1- to 4-Family and Manufactured Home Dwellings
Loans OnManufactured Home
Dwellings FromColumns A, B, C & D
G
Number $000's
%MinPop4/
MedianIncome As
PCT ofMSA/MDMedian

PA/MONTGOMERY COUNTY/2070.03 10 151
LOANS ORIGINATED 14 70 12 21 287 3376 14095 1044 205
APPS APPROVED, NOT ACCEPTED 1 4417 933
APPS DENIED 1 16 2264 4099 95
APPS WITHDRAWN 1 8 11 229 128 1703 270
FILES CLOSED FOR INCOMPLETENESS 4 975
PA/MONTGOMERY COUNTY/2070.04 10 120
LOANS ORIGINATED 30 98 8 813 3146 6361 16891 1110 1446
APPS APPROVED, NOT ACCEPTED 2 13 32 539 438 2377 587
APPS DENIED 2 28 4 3476 5384 266 580
APPS WITHDRAWN 5 17 13 755 1345 3405 170
FILES CLOSED FOR INCOMPLETENESS 5 839
PA/MONTGOMERY COUNTY/2071.01 8 122
LOANS ORIGINATED 26 137 26 34 1099 6662 27520 1552 741
APPS APPROVED, NOT ACCEPTED 3 12 11 219 745 2782 235
APPS DENIED 2 33 4 22 526 635 9350 190 596
APPS WITHDRAWN 5 20 52 420 1285 4934 667
FILES CLOSED FOR INCOMPLETENESS 1 6 2486 1220 305
PA/MONTGOMERY COUNTY/2071.03 10 126
LOANS ORIGINATED 38 123 13 58 1918 7979 23299 1049 500
APPS APPROVED, NOT ACCEPTED 1 7244 1029
APPS DENIED 1 32 5 11 236 400 6867 114 177
APPS WITHDRAWN 6 24 2 11 227 1160 4463 60 160
FILES CLOSED FOR INCOMPLETENESS 1 8260 1983
PA/MONTGOMERY COUNTY/2071.04 5 99
LOANS ORIGINATED 12 47 9 13 800 2533 10319 583 145 2 110
APPS APPROVED, NOT ACCEPTED 2 8317 1524 2 59
APPS DENIED 4 4 6515 804 162
APPS WITHDRAWN 3 17 1684 3811 120
FILES CLOSED FOR INCOMPLETENESS 7 21620 45
06/02/2014Report Date:
AGGREGATE TABLE 1: DISPOSITION OF LOAN APPLICATIONS, BY LOCATION OF PROPERTY AND TYPE OF LOAN, 2013
MSA/MD: 37964 - PHILADELPHIA, PA
Page 114 of 199
ALL LOANS ON PROPERTY LOCATED IN MSA/MD 3/
CENSUS TRACT OR COUNTY NAME ANDDISPOSITION OF APPLICATION 1/(STATE/COUNTY/TRACT NUMBER) FHA, FSA/RHS & VA Conventional
Refinancings Home ImprovementLoans
Loans on DwellingsFor 5 or More
Families
NonoccupantLoans From
Columns A, B, Cand D
Number Number Number Number Number Number$000's $000's $000's $000's $000's $000's
A B C D E F
Home Purchase Loans
Loans on 1- to 4-Family and Manufactured Home Dwellings
Loans OnManufactured Home
Dwellings FromColumns A, B, C & D
G
Number $000's
%MinPop4/
MedianIncome As
PCT ofMSA/MDMedian
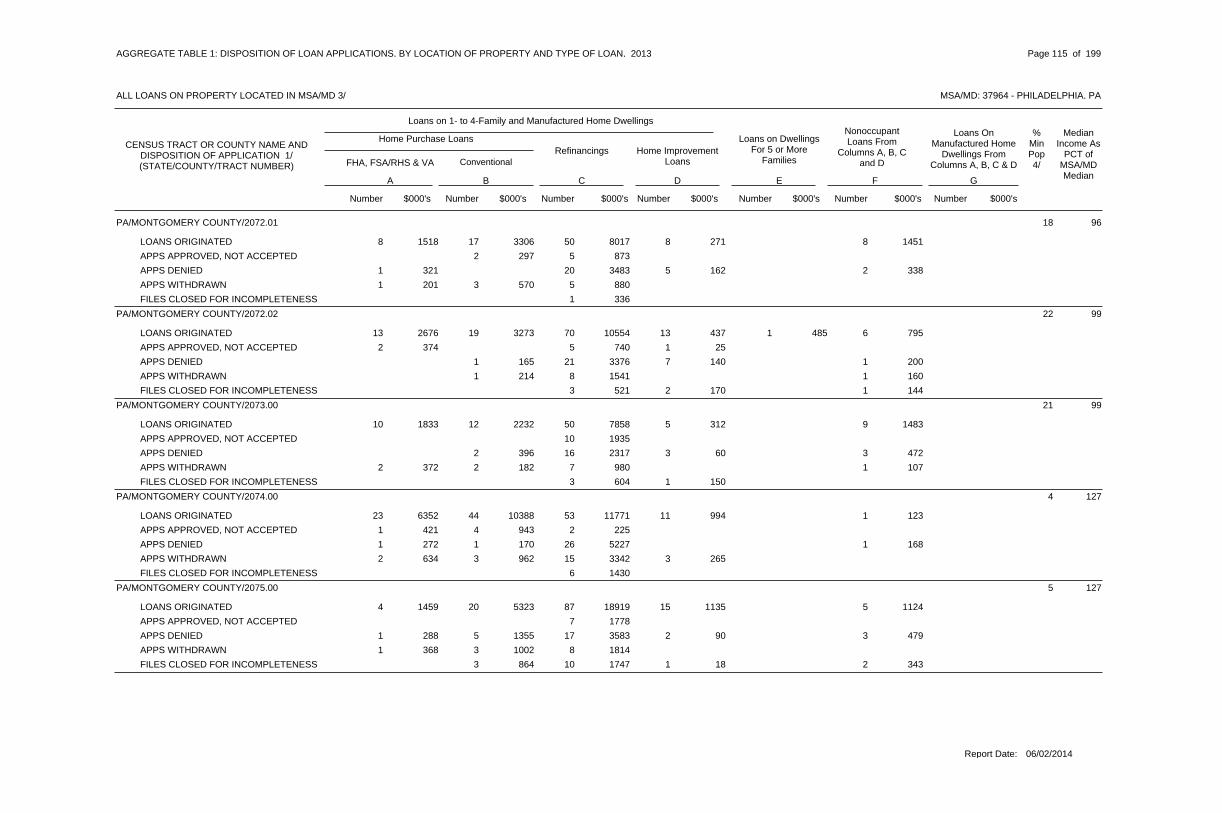
PA/MONTGOMERY COUNTY/2072.01 18 96
LOANS ORIGINATED 17 50 8 88 1518 3306 8017 271 1451
APPS APPROVED, NOT ACCEPTED 2 5297 873
APPS DENIED 20 5 21 321 3483 162 338
APPS WITHDRAWN 3 51 201 570 880
FILES CLOSED FOR INCOMPLETENESS 1 336
PA/MONTGOMERY COUNTY/2072.02 22 99
LOANS ORIGINATED 19 70 13 1 613 2676 3273 10554 437 485 795
APPS APPROVED, NOT ACCEPTED 5 12 374 740 25
APPS DENIED 1 21 7 1165 3376 140 200
APPS WITHDRAWN 1 8 1214 1541 160
FILES CLOSED FOR INCOMPLETENESS 3 2 1521 170 144
PA/MONTGOMERY COUNTY/2073.00 21 99
LOANS ORIGINATED 12 50 5 910 1833 2232 7858 312 1483
APPS APPROVED, NOT ACCEPTED 10 1935
APPS DENIED 2 16 3 3396 2317 60 472
APPS WITHDRAWN 2 7 12 372 182 980 107
FILES CLOSED FOR INCOMPLETENESS 3 1604 150
PA/MONTGOMERY COUNTY/2074.00 4 127
LOANS ORIGINATED 44 53 11 123 6352 10388 11771 994 123
APPS APPROVED, NOT ACCEPTED 4 21 421 943 225
APPS DENIED 1 26 11 272 170 5227 168
APPS WITHDRAWN 3 15 32 634 962 3342 265
FILES CLOSED FOR INCOMPLETENESS 6 1430
PA/MONTGOMERY COUNTY/2075.00 5 127
LOANS ORIGINATED 20 87 15 54 1459 5323 18919 1135 1124
APPS APPROVED, NOT ACCEPTED 7 1778
APPS DENIED 5 17 2 31 288 1355 3583 90 479
APPS WITHDRAWN 3 81 368 1002 1814
FILES CLOSED FOR INCOMPLETENESS 3 10 1 2864 1747 18 343
06/02/2014Report Date:
AGGREGATE TABLE 1: DISPOSITION OF LOAN APPLICATIONS, BY LOCATION OF PROPERTY AND TYPE OF LOAN, 2013
MSA/MD: 37964 - PHILADELPHIA, PA
Page 115 of 199
ALL LOANS ON PROPERTY LOCATED IN MSA/MD 3/
CENSUS TRACT OR COUNTY NAME ANDDISPOSITION OF APPLICATION 1/(STATE/COUNTY/TRACT NUMBER) FHA, FSA/RHS & VA Conventional
Refinancings Home ImprovementLoans
Loans on DwellingsFor 5 or More
Families
NonoccupantLoans From
Columns A, B, Cand D
Number Number Number Number Number Number$000's $000's $000's $000's $000's $000's
A B C D E F
Home Purchase Loans
Loans on 1- to 4-Family and Manufactured Home Dwellings
Loans OnManufactured Home
Dwellings FromColumns A, B, C & D
G
Number $000's
%MinPop4/
MedianIncome As
PCT ofMSA/MDMedian

PA/MONTGOMERY COUNTY/2076.00 3 104
LOANS ORIGINATED 30 79 23 514 3116 7058 15582 1287 649 1 21
APPS APPROVED, NOT ACCEPTED 1 9 1 12 315 150 1537 100 122
APPS DENIED 3 29 5 31 143 452 5895 161 374 1 40
APPS WITHDRAWN 7 8 21706 1600 120
FILES CLOSED FOR INCOMPLETENESS 1 7417 1967
PA/MONTGOMERY COUNTY/2078.00 5 106
LOANS ORIGINATED 64 173 21 733 7567 15025 32686 1228 1082
APPS APPROVED, NOT ACCEPTED 1 15 13 620 282 3142 165
APPS DENIED 9 52 7 48 1684 2416 13561 574 619
APPS WITHDRAWN 8 27 14 1090 1680 6727 23
FILES CLOSED FOR INCOMPLETENESS 15 3850
PA/MONTGOMERY COUNTY/2079.00 5 100
LOANS ORIGINATED 11 38 7 1012 2287 1561 5526 416 1388
APPS APPROVED, NOT ACCEPTED 2 3279 480 1 30
APPS DENIED 10 2 13 538 1486 40 147 1 65
APPS WITHDRAWN 4 5 1 11 104 590 759 30 85
FILES CLOSED FOR INCOMPLETENESS 4 1538 123
PA/MONTGOMERY COUNTY/2080.00 12 91
LOANS ORIGINATED 21 66 6 617 2911 3155 9982 134 636
APPS APPROVED, NOT ACCEPTED 1 4 12 301 127 679 10
APPS DENIED 3 14 6 3434 2032 234 312
APPS WITHDRAWN 2 21 2 15 848 320 3160 527 64
FILES CLOSED FOR INCOMPLETENESS 12 21 147 1750 234
PA/MONTGOMERY COUNTY/2081.00 8 81
LOANS ORIGINATED 19 49 4 1 1215 1898 2503 6473 156 45 1347
APPS APPROVED, NOT ACCEPTED 3 1454 25
APPS DENIED 5 22 5629 3164 43
APPS WITHDRAWN 5 91 173 707 1205
FILES CLOSED FOR INCOMPLETENESS 9 11248 159
06/02/2014Report Date:
AGGREGATE TABLE 1: DISPOSITION OF LOAN APPLICATIONS, BY LOCATION OF PROPERTY AND TYPE OF LOAN, 2013
MSA/MD: 37964 - PHILADELPHIA, PA
Page 116 of 199
ALL LOANS ON PROPERTY LOCATED IN MSA/MD 3/
CENSUS TRACT OR COUNTY NAME ANDDISPOSITION OF APPLICATION 1/(STATE/COUNTY/TRACT NUMBER) FHA, FSA/RHS & VA Conventional
Refinancings Home ImprovementLoans
Loans on DwellingsFor 5 or More
Families
NonoccupantLoans From
Columns A, B, Cand D
Number Number Number Number Number Number$000's $000's $000's $000's $000's $000's
A B C D E F
Home Purchase Loans
Loans on 1- to 4-Family and Manufactured Home Dwellings
Loans OnManufactured Home
Dwellings FromColumns A, B, C & D
G
Number $000's
%MinPop4/
MedianIncome As
PCT ofMSA/MDMedian

PA/MONTGOMERY COUNTY/2082.01 2 107
LOANS ORIGINATED 7 51 38 1795 1318 9447 201 1 146
APPS APPROVED, NOT ACCEPTED 4 997
APPS DENIED 3 13 1 11 123 566 2030 6 6
APPS WITHDRAWN 1 4179 1248
FILES CLOSED FOR INCOMPLETENESS 5 1247
PA/MONTGOMERY COUNTY/2082.03 6 100
LOANS ORIGINATED 30 82 8 1 318 3752 5851 14080 413 5550 465
APPS APPROVED, NOT ACCEPTED 3 83 759 623 1592
APPS DENIED 6 262 317 1282 4951
APPS WITHDRAWN 2 112 493 468 2294
FILES CLOSED FOR INCOMPLETENESS 1 5248 1030
PA/MONTGOMERY COUNTY/2082.04 6 131
LOANS ORIGINATED 19 89 6 45 1157 4008 17290 364 716
APPS APPROVED, NOT ACCEPTED 1 9234 1648
APPS DENIED 30 4 26816 31 451
APPS WITHDRAWN 1 1135 2286
FILES CLOSED FOR INCOMPLETENESS 1 3 1181 520 25
PA/MONTGOMERY COUNTY/2083.01 5 108
LOANS ORIGINATED 12 64 5 24 837 2761 28827 307 15803 1 38
APPS APPROVED, NOT ACCEPTED 3 11 137 862 15
APPS DENIED 2 18 5 12 361 583 3218 26 230
APPS WITHDRAWN 2 131 188 575 3102
FILES CLOSED FOR INCOMPLETENESS 3 468
PA/MONTGOMERY COUNTY/2083.02 6 143
LOANS ORIGINATED 98 232 19 951 13309 25090 48137 509 1912
APPS APPROVED, NOT ACCEPTED 4 17 1 15 1154 1147 3985 15 125
APPS DENIED 6 62 8 68 1958 1692 14675 715 1333
APPS WITHDRAWN 10 43 46 1409 3170 10248 283
FILES CLOSED FOR INCOMPLETENESS 81 357 2147
06/02/2014Report Date:
AGGREGATE TABLE 1: DISPOSITION OF LOAN APPLICATIONS, BY LOCATION OF PROPERTY AND TYPE OF LOAN, 2013
MSA/MD: 37964 - PHILADELPHIA, PA
Page 117 of 199
ALL LOANS ON PROPERTY LOCATED IN MSA/MD 3/
CENSUS TRACT OR COUNTY NAME ANDDISPOSITION OF APPLICATION 1/(STATE/COUNTY/TRACT NUMBER) FHA, FSA/RHS & VA Conventional
Refinancings Home ImprovementLoans
Loans on DwellingsFor 5 or More
Families
NonoccupantLoans From
Columns A, B, Cand D
Number Number Number Number Number Number$000's $000's $000's $000's $000's $000's
A B C D E F
Home Purchase Loans
Loans on 1- to 4-Family and Manufactured Home Dwellings
Loans OnManufactured Home
Dwellings FromColumns A, B, C & D
G
Number $000's
%MinPop4/
MedianIncome As
PCT ofMSA/MDMedian

PA/MONTGOMERY COUNTY/2084.00 5 111
LOANS ORIGINATED 23 91 8 69 1497 5208 15007 579 833
APPS APPROVED, NOT ACCEPTED 3 6477 1346
APPS DENIED 1 22 51 169 240 4332 102
APPS WITHDRAWN 4 21 22 406 868 4642 452
FILES CLOSED FOR INCOMPLETENESS 1 11 1260 1610 29
PA/MONTGOMERY COUNTY/2085.00 7 113
LOANS ORIGINATED 30 142 11 528 5344 6448 23548 589 543 1 161
APPS APPROVED, NOT ACCEPTED 7 15 2 11 190 1868 2129 480 75
APPS DENIED 6 40 5 1 13 474 1568 7336 201 315 125
APPS WITHDRAWN 5 19 1 12 345 830 3015 175 146
FILES CLOSED FOR INCOMPLETENESS 1 9 11 177 97 1390 104
PA/MONTGOMERY COUNTY/2086.01 8 135
LOANS ORIGINATED 65 178 17 824 7505 18120 39595 782 1796 5 278
APPS APPROVED, NOT ACCEPTED 7 18 2 12 660 886 4533 250 336 7 605
APPS DENIED 7 45 7 11 363 1752 9473 453 150 1 87
APPS WITHDRAWN 11 181 365 2500 5160
FILES CLOSED FOR INCOMPLETENESS 5 11 2 11356 2559 530 162
PA/MONTGOMERY COUNTY/2086.03 9 134
LOANS ORIGINATED 60 172 6 933 7620 13829 31163 193 1601
APPS APPROVED, NOT ACCEPTED 4 24707 4488
APPS DENIED 3 48 8 34 823 469 8976 208 369
APPS WITHDRAWN 7 29 51 221 1392 5618 812
FILES CLOSED FOR INCOMPLETENESS 3 16 1 1637 2816 30 140
PA/MONTGOMERY COUNTY/2086.04 12 135
LOANS ORIGINATED 79 147 12 1017 4396 20713 27724 345 1211
APPS APPROVED, NOT ACCEPTED 7 12 2 21 178 1582 2766 23 288
APPS DENIED 4 32 4 23 611 1102 6876 435 305 2 23
APPS WITHDRAWN 5 8 15 1336 1269 1789 142
FILES CLOSED FOR INCOMPLETENESS 2 12 1392 1695 146
06/02/2014Report Date:
AGGREGATE TABLE 1: DISPOSITION OF LOAN APPLICATIONS, BY LOCATION OF PROPERTY AND TYPE OF LOAN, 2013
MSA/MD: 37964 - PHILADELPHIA, PA
Page 118 of 199
ALL LOANS ON PROPERTY LOCATED IN MSA/MD 3/
CENSUS TRACT OR COUNTY NAME ANDDISPOSITION OF APPLICATION 1/(STATE/COUNTY/TRACT NUMBER) FHA, FSA/RHS & VA Conventional
Refinancings Home ImprovementLoans
Loans on DwellingsFor 5 or More
Families
NonoccupantLoans From
Columns A, B, Cand D
Number Number Number Number Number Number$000's $000's $000's $000's $000's $000's
A B C D E F
Home Purchase Loans
Loans on 1- to 4-Family and Manufactured Home Dwellings
Loans OnManufactured Home
Dwellings FromColumns A, B, C & D
G
Number $000's
%MinPop4/
MedianIncome As
PCT ofMSA/MDMedian

PA/MONTGOMERY COUNTY/2087.02 7 133
LOANS ORIGINATED 31 96 5 1 522 3940 5432 15676 145 337 558
APPS APPROVED, NOT ACCEPTED 2 122 428 269 2658
APPS DENIED 30 5 22 263 5804 415 204
APPS WITHDRAWN 3 15 3 13 564 484 3107 319 162
FILES CLOSED FOR INCOMPLETENESS 2 6 11 141 721 1140 155
PA/MONTGOMERY COUNTY/2087.03 9 113
LOANS ORIGINATED 19 85 5 414 2700 3409 14235 443 869
APPS APPROVED, NOT ACCEPTED 1 122 303 25 2282 2 175
APPS DENIED 2 26 5 17 1319 488 5002 158 265
APPS WITHDRAWN 1 16 32 241 342 3220 1105
FILES CLOSED FOR INCOMPLETENESS 1 9 2212 2189 629
PA/MONTGOMERY COUNTY/2087.04 29 93
LOANS ORIGINATED 18 100 6 1422 3778 2133 16285 83 2055 1 47
APPS APPROVED, NOT ACCEPTED 13 12205 55
APPS DENIED 1 38 9 46 736 280 6011 240 198
APPS WITHDRAWN 2 15 1264 2197 68
FILES CLOSED FOR INCOMPLETENESS 63 454 760
PA/MONTGOMERY COUNTY/2088.01 34 61
LOANS ORIGINATED 8 11 3 94 581 3606 1287 185 3951
APPS APPROVED, NOT ACCEPTED 3 31 103 309 309
APPS DENIED 6 2 42 271 541 13 206
APPS WITHDRAWN 1 1 1105 95 105
FILES CLOSED FOR INCOMPLETENESS 2 140
PA/MONTGOMERY COUNTY/2088.02 20 85
LOANS ORIGINATED 11 38 7 717 1726 817 3838 143 362
APPS APPROVED, NOT ACCEPTED 1 3 1 197 327 1280 135
APPS DENIED 4 19 6 1 111 136 138 2469 122 875 791
APPS WITHDRAWN 2 9 2130 899 133
FILES CLOSED FOR INCOMPLETENESS 1 61 92 130 610
06/02/2014Report Date:
AGGREGATE TABLE 1: DISPOSITION OF LOAN APPLICATIONS, BY LOCATION OF PROPERTY AND TYPE OF LOAN, 2013
MSA/MD: 37964 - PHILADELPHIA, PA
Page 119 of 199
ALL LOANS ON PROPERTY LOCATED IN MSA/MD 3/
CENSUS TRACT OR COUNTY NAME ANDDISPOSITION OF APPLICATION 1/(STATE/COUNTY/TRACT NUMBER) FHA, FSA/RHS & VA Conventional
Refinancings Home ImprovementLoans
Loans on DwellingsFor 5 or More
Families
NonoccupantLoans From
Columns A, B, Cand D
Number Number Number Number Number Number$000's $000's $000's $000's $000's $000's
A B C D E F
Home Purchase Loans
Loans on 1- to 4-Family and Manufactured Home Dwellings
Loans OnManufactured Home
Dwellings FromColumns A, B, C & D
G
Number $000's
%MinPop4/
MedianIncome As
PCT ofMSA/MDMedian

PA/MONTGOMERY COUNTY/2089.01 23 95
LOANS ORIGINATED 20 59 2 1 1413 1382 1911 5620 22 290 934 1 20
APPS APPROVED, NOT ACCEPTED 8 2909 14
APPS DENIED 7 17 2 82 137 996 1775 35 999
APPS WITHDRAWN 3 10 3305 1079 238
FILES CLOSED FOR INCOMPLETENESS 5 2 1585 30 82
PA/MONTGOMERY COUNTY/2089.03 37 85
LOANS ORIGINATED 12 46 3 116 689 1529 5520 73 1021
APPS APPROVED, NOT ACCEPTED 4 1489 73
APPS DENIED 2 18 7 43 610 361 2300 291 310 1 3
APPS WITHDRAWN 1 9 1 11 78 39 991 25 39
FILES CLOSED FOR INCOMPLETENESS 4 21 111 536 188
PA/MONTGOMERY COUNTY/2089.04 51 61
LOANS ORIGINATED 7 14 2 3 144 387 463 1269 164 526 1060
APPS APPROVED, NOT ACCEPTED 1 88
APPS DENIED 3 18 5 9111 1780 161 924 1 8
APPS WITHDRAWN 1 2 128 134 28
FILES CLOSED FOR INCOMPLETENESS 3 2294 218
PA/MONTGOMERY COUNTY/2089.05 12 75
LOANS ORIGINATED 16 53 5 321 2623 1616 6171 122 367
APPS APPROVED, NOT ACCEPTED 5 581
APPS DENIED 4 23 4 33 366 411 2803 129 376
APPS WITHDRAWN 143 361 1274
FILES CLOSED FOR INCOMPLETENESS
PA/MONTGOMERY COUNTY/2089.06 35 63
LOANS ORIGINATED 13 49 2 2 179 893 964 4255 14 3210 1172
APPS APPROVED, NOT ACCEPTED 2 9 42 192 66 838 371
APPS DENIED 2 29 11 52 206 178 2740 127 470
APPS WITHDRAWN 5 12 177 529 125
FILES CLOSED FOR INCOMPLETENESS 3 2330 199
06/02/2014Report Date:
AGGREGATE TABLE 1: DISPOSITION OF LOAN APPLICATIONS, BY LOCATION OF PROPERTY AND TYPE OF LOAN, 2013
MSA/MD: 37964 - PHILADELPHIA, PA
Page 120 of 199
ALL LOANS ON PROPERTY LOCATED IN MSA/MD 3/
CENSUS TRACT OR COUNTY NAME ANDDISPOSITION OF APPLICATION 1/(STATE/COUNTY/TRACT NUMBER) FHA, FSA/RHS & VA Conventional
Refinancings Home ImprovementLoans
Loans on DwellingsFor 5 or More
Families
NonoccupantLoans From
Columns A, B, Cand D
Number Number Number Number Number Number$000's $000's $000's $000's $000's $000's
A B C D E F
Home Purchase Loans
Loans on 1- to 4-Family and Manufactured Home Dwellings
Loans OnManufactured Home
Dwellings FromColumns A, B, C & D
G
Number $000's
%MinPop4/
MedianIncome As
PCT ofMSA/MDMedian

PA/MONTGOMERY COUNTY/2090.00 41 59
LOANS ORIGINATED 5 29 97 830 494 2968 927
APPS APPROVED, NOT ACCEPTED 1 1 1150 117 60
APPS DENIED 2 7 2 51 83 103 817 110 273
APPS WITHDRAWN 22 148 339
FILES CLOSED FOR INCOMPLETENESS 2 234
PA/MONTGOMERY COUNTY/2091.00 12 127
LOANS ORIGINATED 23 149 13 2 1222 4146 3851 24185 643 519 2013
APPS APPROVED, NOT ACCEPTED 2 14 1 14 708 168 2423 10 109
APPS DENIED 6 46 9 56 1147 872 8050 280 799 1 100
APPS WITHDRAWN 6 28 2 36 1082 1083 4654 314 447
FILES CLOSED FOR INCOMPLETENESS 2 10 1 1370 1850 25 149 1 80
PA/MONTGOMERY COUNTY/2092.01 15 71
LOANS ORIGINATED 2 17 25 838 188 2212 24
APPS APPROVED, NOT ACCEPTED 1 4 1 196 1037 15 96
APPS DENIED 1 17 3 53 424 73 1980 37 680
APPS WITHDRAWN 8 11268 89
FILES CLOSED FOR INCOMPLETENESS 1 131
PA/MONTGOMERY COUNTY/2092.02 17 86
LOANS ORIGINATED 12 38 2 72 282 1190 4150 58 692 1 52
APPS APPROVED, NOT ACCEPTED 3 1420 115
APPS DENIED 19 2 22197 23 244
APPS WITHDRAWN 1 864 1012
FILES CLOSED FOR INCOMPLETENESS 6 2805 262
PA/MONTGOMERY COUNTY/2101.00 13 132
LOANS ORIGINATED 28 98 10 1 712 2811 6034 18389 974 1000 1076
APPS APPROVED, NOT ACCEPTED 1 10 1298 1784 103
APPS DENIED 1 19 5 14 922 171 2976 194 150
APPS WITHDRAWN 2 20 1 12 388 492 4542 25 175
FILES CLOSED FOR INCOMPLETENESS 102 324 2262
06/02/2014Report Date:
AGGREGATE TABLE 1: DISPOSITION OF LOAN APPLICATIONS, BY LOCATION OF PROPERTY AND TYPE OF LOAN, 2013
MSA/MD: 37964 - PHILADELPHIA, PA
Page 121 of 199
ALL LOANS ON PROPERTY LOCATED IN MSA/MD 3/
CENSUS TRACT OR COUNTY NAME ANDDISPOSITION OF APPLICATION 1/(STATE/COUNTY/TRACT NUMBER) FHA, FSA/RHS & VA Conventional
Refinancings Home ImprovementLoans
Loans on DwellingsFor 5 or More
Families
NonoccupantLoans From
Columns A, B, Cand D
Number Number Number Number Number Number$000's $000's $000's $000's $000's $000's
A B C D E F
Home Purchase Loans
Loans on 1- to 4-Family and Manufactured Home Dwellings
Loans OnManufactured Home
Dwellings FromColumns A, B, C & D
G
Number $000's
%MinPop4/
MedianIncome As
PCT ofMSA/MDMedian

PA/MONTGOMERY COUNTY/2102.00 16 152
LOANS ORIGINATED 34 68 57 1888 7800 14196 408
APPS APPROVED, NOT ACCEPTED 11 12744 30
APPS DENIED 3 16 5 2820 3597 299 283
APPS WITHDRAWN 4 17 2 11 190 1141 4445 356 225
FILES CLOSED FOR INCOMPLETENESS 1 21 279 308 489
PA/MONTGOMERY COUNTY/2103.00 12 149
LOANS ORIGINATED 37 66 12 1 24 1239 10205 15911 653 25500 406
APPS APPROVED, NOT ACCEPTED 1 7271 2227
APPS DENIED 4 22 2 11 361 1016 4420 20 236
APPS WITHDRAWN 1 5 2108 936 470
FILES CLOSED FOR INCOMPLETENESS 3 725
PA/MONTGOMERY COUNTY/2104.00 22 133
LOANS ORIGINATED 34 100 9 54 900 9043 20018 1368 779
APPS APPROVED, NOT ACCEPTED 1 12 2 31 281 200 2238 500 577
APPS DENIED 2 24 2 3568 4925 309 490
APPS WITHDRAWN 3 15 1899 3199 138
FILES CLOSED FOR INCOMPLETENESS 2 12 1630 2534 175
PA/MONTGOMERY COUNTY/2105.00 24 158
LOANS ORIGINATED 45 130 9 135 916 14175 32138 1188 3249
APPS APPROVED, NOT ACCEPTED 2 12 2611 2212 431
APPS DENIED 4 29 3 2978 7215 80 372
APPS WITHDRAWN 2 25 11 196 396 7010 137
FILES CLOSED FOR INCOMPLETENESS 1 11 1158 3013 66
PA/MONTGOMERY COUNTY/2106.00 21 123
LOANS ORIGINATED 29 77 7 38 1755 6528 15352 179 418
APPS APPROVED, NOT ACCEPTED 4 81462 1647
APPS DENIED 2 22 7 31 201 455 4457 345 793
APPS WITHDRAWN 3 10868 1475
FILES CLOSED FOR INCOMPLETENESS 10 11942 165
06/02/2014Report Date:
AGGREGATE TABLE 1: DISPOSITION OF LOAN APPLICATIONS, BY LOCATION OF PROPERTY AND TYPE OF LOAN, 2013
MSA/MD: 37964 - PHILADELPHIA, PA
Page 122 of 199
ALL LOANS ON PROPERTY LOCATED IN MSA/MD 3/
CENSUS TRACT OR COUNTY NAME ANDDISPOSITION OF APPLICATION 1/(STATE/COUNTY/TRACT NUMBER) FHA, FSA/RHS & VA Conventional
Refinancings Home ImprovementLoans
Loans on DwellingsFor 5 or More
Families
NonoccupantLoans From
Columns A, B, Cand D
Number Number Number Number Number Number$000's $000's $000's $000's $000's $000's
A B C D E F
Home Purchase Loans
Loans on 1- to 4-Family and Manufactured Home Dwellings
Loans OnManufactured Home
Dwellings FromColumns A, B, C & D
G
Number $000's
%MinPop4/
MedianIncome As
PCT ofMSA/MDMedian

PA/MONTGOMERY COUNTY/2107.00 18 173
LOANS ORIGINATED 54 163 10 1212 3283 14139 37026 568 2333
APPS APPROVED, NOT ACCEPTED 6 18 1 11 250 1638 4497 10 300
APPS DENIED 5 24 3 31 227 679 5271 603 548
APPS WITHDRAWN 1 26 2 41 196 332 6072 90 936
FILES CLOSED FOR INCOMPLETENESS 2 19 1575 3520 158
PA/PHILADELPHIA COUNTY/0001.00 17 175
LOANS ORIGINATED 60 109 1 6 544 975 15215 29953 20 20431 14741
APPS APPROVED, NOT ACCEPTED 4 24 91059 7337 1738
APPS DENIED 14 65 3 2 363 700 3298 16585 630 2265 7768
APPS WITHDRAWN 8 16 1 31 187 2871 3687 248 768
FILES CLOSED FOR INCOMPLETENESS 3 11 1 4792 3062 185 887
PA/PHILADELPHIA COUNTY/0002.00 77 47
LOANS ORIGINATED 17 30 5 181 127 3011 6391 5130 3846
APPS APPROVED, NOT ACCEPTED 2 9 1 1 5591 2016 500 8500 1243
APPS DENIED 7 16 2 71321 3843 12025 1462
APPS WITHDRAWN 4 9 61 271 971 1846 1267
FILES CLOSED FOR INCOMPLETENESS 1 6 5192 1219 956
PA/PHILADELPHIA COUNTY/0003.00 28 162
LOANS ORIGINATED 32 36 5 2 911223 12244 758 33000 2171
APPS APPROVED, NOT ACCEPTED 4 6 1 21263 1613 780 359
APPS DENIED 3 9 1 5799 1704 405 999
APPS WITHDRAWN 4 5 2 2 11 102 1528 1608 310 52635 300
FILES CLOSED FOR INCOMPLETENESS 2 1517 15
PA/PHILADELPHIA COUNTY/0004.01 51 13
LOANS ORIGINATED 52 67 1 1 5520617 16918 700 83700 13298
APPS APPROVED, NOT ACCEPTED 8 9 63492 2350 1904
APPS DENIED 9 38 194219 9503 4120
APPS WITHDRAWN 8 11 72841 3031 1863
FILES CLOSED FOR INCOMPLETENESS 7 31988 779
06/02/2014Report Date:
AGGREGATE TABLE 1: DISPOSITION OF LOAN APPLICATIONS, BY LOCATION OF PROPERTY AND TYPE OF LOAN, 2013
MSA/MD: 37964 - PHILADELPHIA, PA
Page 123 of 199
ALL LOANS ON PROPERTY LOCATED IN MSA/MD 3/
CENSUS TRACT OR COUNTY NAME ANDDISPOSITION OF APPLICATION 1/(STATE/COUNTY/TRACT NUMBER) FHA, FSA/RHS & VA Conventional
Refinancings Home ImprovementLoans
Loans on DwellingsFor 5 or More
Families
NonoccupantLoans From
Columns A, B, Cand D
Number Number Number Number Number Number$000's $000's $000's $000's $000's $000's
A B C D E F
Home Purchase Loans
Loans on 1- to 4-Family and Manufactured Home Dwellings
Loans OnManufactured Home
Dwellings FromColumns A, B, C & D
G
Number $000's
%MinPop4/
MedianIncome As
PCT ofMSA/MDMedian

PA/PHILADELPHIA COUNTY/0004.02 22 134
LOANS ORIGINATED 66 42 3 301 266 19821 17405 111 11527
APPS APPROVED, NOT ACCEPTED 7 1 21880 4 798
APPS DENIED 9 28 3 182358 9575 2560 8596
APPS WITHDRAWN 6 5 1 31 611 2803 1679 1500 794
FILES CLOSED FOR INCOMPLETENESS 4 1 12046 25 133
PA/PHILADELPHIA COUNTY/0005.00 68 83
LOANS ORIGINATED 2 12 2 8439 2577 25175 1820
APPS APPROVED, NOT ACCEPTED 1 1181 282
APPS DENIED 5 1 61365 417 1782
APPS WITHDRAWN 2 2 1350 339 114
FILES CLOSED FOR INCOMPLETENESS
PA/PHILADELPHIA COUNTY/0006.00 35 142
LOANS ORIGINATED 5 2 1 1 21412 665 400 1394 433
APPS APPROVED, NOT ACCEPTED 1 242
APPS DENIED 1 2332 95500
APPS WITHDRAWN 1 1160 504
FILES CLOSED FOR INCOMPLETENESS 1 320
PA/PHILADELPHIA COUNTY/0007.00 31 111
LOANS ORIGINATED 41 45 5 3724974 16491 21727 18075
APPS APPROVED, NOT ACCEPTED 2 5 3659 1321 889
APPS DENIED 11 16 1 74716 5632 65 3747
APPS WITHDRAWN 4 9 22767 2611 547
FILES CLOSED FOR INCOMPLETENESS 3 2 1642 1017 254
PA/PHILADELPHIA COUNTY/0008.01 22 246
LOANS ORIGINATED 16 34 4 1 135345 11162 458 650 3653
APPS APPROVED, NOT ACCEPTED 1 236
APPS DENIED 1 12 2356 3762 499
APPS WITHDRAWN 4 7 11392 2119 290
FILES CLOSED FOR INCOMPLETENESS 2 423
06/02/2014Report Date:
AGGREGATE TABLE 1: DISPOSITION OF LOAN APPLICATIONS, BY LOCATION OF PROPERTY AND TYPE OF LOAN, 2013
MSA/MD: 37964 - PHILADELPHIA, PA
Page 124 of 199
ALL LOANS ON PROPERTY LOCATED IN MSA/MD 3/
CENSUS TRACT OR COUNTY NAME ANDDISPOSITION OF APPLICATION 1/(STATE/COUNTY/TRACT NUMBER) FHA, FSA/RHS & VA Conventional
Refinancings Home ImprovementLoans
Loans on DwellingsFor 5 or More
Families
NonoccupantLoans From
Columns A, B, Cand D
Number Number Number Number Number Number$000's $000's $000's $000's $000's $000's
A B C D E F
Home Purchase Loans
Loans on 1- to 4-Family and Manufactured Home Dwellings
Loans OnManufactured Home
Dwellings FromColumns A, B, C & D
G
Number $000's
%MinPop4/
MedianIncome As
PCT ofMSA/MDMedian

PA/PHILADELPHIA COUNTY/0008.03 20 249
LOANS ORIGINATED 26 79 2 8 391 339 10098 33827 243 9575 10528
APPS APPROVED, NOT ACCEPTED 2 10 1 1 51 339 877 2491 500 475 896
APPS DENIED 1 24 2 91 339 220 10174 55 2494
APPS WITHDRAWN 2 11 11208 3163 133
FILES CLOSED FOR INCOMPLETENESS 3 5 5640 2313 951
PA/PHILADELPHIA COUNTY/0008.04 21 110
LOANS ORIGINATED 38 88 1 2 4814849 35790 225 61200 13702
APPS APPROVED, NOT ACCEPTED 2 6 1 5293 1792 1500 1049
APPS DENIED 3 30 123653 11348 2698
APPS WITHDRAWN 3 10 8675 2971 2331
FILES CLOSED FOR INCOMPLETENESS 8 43445 684
PA/PHILADELPHIA COUNTY/0009.01 33 141
LOANS ORIGINATED 9 44 3 3 372120 8168 438 4492 6036
APPS APPROVED, NOT ACCEPTED 9 51992 806
APPS DENIED 6 18 1 121 231 946 2599 15 1585
APPS WITHDRAWN 7 6 2 1 83015 1112 1100 1463 3306
FILES CLOSED FOR INCOMPLETENESS 6 3990 263
PA/PHILADELPHIA COUNTY/0009.02 35 136
LOANS ORIGINATED 16 33 1 111 339 5075 14602 475 3080
APPS APPROVED, NOT ACCEPTED 4 2002
APPS DENIED 7 7 1 1 12414 2089 820 110 294
APPS WITHDRAWN 5 5 11 137 2281 1985 350
FILES CLOSED FOR INCOMPLETENESS 2 5 1 4537 1533 403 1116
PA/PHILADELPHIA COUNTY/0010.01 12 181
LOANS ORIGINATED 43 94 2 2 3416954 27200 180 1713 9069
APPS APPROVED, NOT ACCEPTED 2 5 1 3923 1333 485 862
APPS DENIED 5 22 71968 5926 2049
APPS WITHDRAWN 6 8 53485 1393 699
FILES CLOSED FOR INCOMPLETENESS 2 5 11022 1276 417
06/02/2014Report Date:
AGGREGATE TABLE 1: DISPOSITION OF LOAN APPLICATIONS, BY LOCATION OF PROPERTY AND TYPE OF LOAN, 2013
MSA/MD: 37964 - PHILADELPHIA, PA
Page 125 of 199
ALL LOANS ON PROPERTY LOCATED IN MSA/MD 3/
CENSUS TRACT OR COUNTY NAME ANDDISPOSITION OF APPLICATION 1/(STATE/COUNTY/TRACT NUMBER) FHA, FSA/RHS & VA Conventional
Refinancings Home ImprovementLoans
Loans on DwellingsFor 5 or More
Families
NonoccupantLoans From
Columns A, B, Cand D
Number Number Number Number Number Number$000's $000's $000's $000's $000's $000's
A B C D E F
Home Purchase Loans
Loans on 1- to 4-Family and Manufactured Home Dwellings
Loans OnManufactured Home
Dwellings FromColumns A, B, C & D
G
Number $000's
%MinPop4/
MedianIncome As
PCT ofMSA/MDMedian

PA/PHILADELPHIA COUNTY/0010.02 14 229
LOANS ORIGINATED 57 112 3 4 282 601 24773 36404 955 24176 6379
APPS APPROVED, NOT ACCEPTED 3 11 21133 3000 216
APPS DENIED 13 27 2 81 208 5149 8093 1015 2606
APPS WITHDRAWN 7 17 23791 5726 471
FILES CLOSED FOR INCOMPLETENESS 1 10 1143 2612 390
PA/PHILADELPHIA COUNTY/0011.01 23 161
LOANS ORIGINATED 46 61 5 7 282 1135 17839 17043 911 26400 6916
APPS APPROVED, NOT ACCEPTED 5 9 1 32565 2828 50 1217
APPS DENIED 7 8 6 1 82023 1925 828 800 2131
APPS WITHDRAWN 5 12 21749 3690 649
FILES CLOSED FOR INCOMPLETENESS 3 4 11141 841 10000
PA/PHILADELPHIA COUNTY/0011.02 19 208
LOANS ORIGINATED 30 61 2 4 198949 18121 370 3733 4875
APPS APPROVED, NOT ACCEPTED 4 8 21037 2328 595
APPS DENIED 7 12 3 1 42916 3556 136 250 1067
APPS WITHDRAWN 4 6 5940 1755 1247
FILES CLOSED FOR INCOMPLETENESS 1 3200 813
PA/PHILADELPHIA COUNTY/0012.01 14 149
LOANS ORIGINATED 42 108 4 2 223 1089 18991 42968 508 1860 5231
APPS APPROVED, NOT ACCEPTED 1 10 2 41500 3449 62 790
APPS DENIED 6 21 3 2 53057 8266 57 5050 697
APPS WITHDRAWN 7 15 3 51 311 2779 8663 460 1234
FILES CLOSED FOR INCOMPLETENESS 3 12 2 51676 4195 420 1523
PA/PHILADELPHIA COUNTY/0012.02 20 161
LOANS ORIGINATED 71 101 8 10 421 343 34600 39005 2048 10917 13981
APPS APPROVED, NOT ACCEPTED 9 7 43109 2027 1328
APPS DENIED 14 28 79648 10634 1996
APPS WITHDRAWN 10 14 1 41 368 6229 4733 360 1352
FILES CLOSED FOR INCOMPLETENESS 2 9 2 2606 2838 412 746
06/02/2014Report Date:
AGGREGATE TABLE 1: DISPOSITION OF LOAN APPLICATIONS, BY LOCATION OF PROPERTY AND TYPE OF LOAN, 2013
MSA/MD: 37964 - PHILADELPHIA, PA
Page 126 of 199
ALL LOANS ON PROPERTY LOCATED IN MSA/MD 3/
CENSUS TRACT OR COUNTY NAME ANDDISPOSITION OF APPLICATION 1/(STATE/COUNTY/TRACT NUMBER) FHA, FSA/RHS & VA Conventional
Refinancings Home ImprovementLoans
Loans on DwellingsFor 5 or More
Families
NonoccupantLoans From
Columns A, B, Cand D
Number Number Number Number Number Number$000's $000's $000's $000's $000's $000's
A B C D E F
Home Purchase Loans
Loans on 1- to 4-Family and Manufactured Home Dwellings
Loans OnManufactured Home
Dwellings FromColumns A, B, C & D
G
Number $000's
%MinPop4/
MedianIncome As
PCT ofMSA/MDMedian

PA/PHILADELPHIA COUNTY/0013.00 44 82
LOANS ORIGINATED 187 191 9 2 7312 3556 59182 51141 1011 5925 18702
APPS APPROVED, NOT ACCEPTED 13 15 1 73 835 4649 4360 75 2372
APPS DENIED 25 72 17 1 282 564 7808 16841 401 750 5609
APPS WITHDRAWN 29 33 1 1 165 1695 9218 7641 100 1336 3814
FILES CLOSED FOR INCOMPLETENESS 1 19 41 373 344 4903 1075
PA/PHILADELPHIA COUNTY/0014.00 40 144
LOANS ORIGINATED 84 124 5 6 357 2164 33288 34840 788 3054 9838
APPS APPROVED, NOT ACCEPTED 2 11 41 353 934 2967 1366
APPS DENIED 12 40 3 132 872 11095 12590 74 7150
APPS WITHDRAWN 12 21 1 1 54617 5469 399 5162 1435
FILES CLOSED FOR INCOMPLETENESS 3 9 31862 1859 754
PA/PHILADELPHIA COUNTY/0015.00 32 93
LOANS ORIGINATED 54 64 5 4 121 402 19989 16139 822 2545 3148
APPS APPROVED, NOT ACCEPTED 2 10 1908 3008 404
APPS DENIED 9 25 6 84100 6847 842 1939
APPS WITHDRAWN 7 14 2 1 42 517 2716 4084 220 2101 1013
FILES CLOSED FOR INCOMPLETENESS 3 8 21316 2179 649
PA/PHILADELPHIA COUNTY/0016.00 18 209
LOANS ORIGINATED 29 60 4 2 224 1178 12032 21374 996 4350 7279
APPS APPROVED, NOT ACCEPTED 2 7 1 2699 2361 251 1097
APPS DENIED 2 17 2 24 965 568 5540 90 305
APPS WITHDRAWN 6 11 2 21 263 2684 3480 4213 634
FILES CLOSED FOR INCOMPLETENESS 5 21602 654
PA/PHILADELPHIA COUNTY/0017.00 16 171
LOANS ORIGINATED 46 87 4 1 183 1305 15657 22357 430 1400 4792
APPS APPROVED, NOT ACCEPTED 1 14 1502 4328 228
APPS DENIED 4 32 7 111 476 997 9494 537 1752
APPS WITHDRAWN 7 13 2 32401 4546 301 693
FILES CLOSED FOR INCOMPLETENESS 1 12 11 385 252 3009 84
06/02/2014Report Date:
AGGREGATE TABLE 1: DISPOSITION OF LOAN APPLICATIONS, BY LOCATION OF PROPERTY AND TYPE OF LOAN, 2013
MSA/MD: 37964 - PHILADELPHIA, PA
Page 127 of 199
ALL LOANS ON PROPERTY LOCATED IN MSA/MD 3/
CENSUS TRACT OR COUNTY NAME ANDDISPOSITION OF APPLICATION 1/(STATE/COUNTY/TRACT NUMBER) FHA, FSA/RHS & VA Conventional
Refinancings Home ImprovementLoans
Loans on DwellingsFor 5 or More
Families
NonoccupantLoans From
Columns A, B, Cand D
Number Number Number Number Number Number$000's $000's $000's $000's $000's $000's
A B C D E F
Home Purchase Loans
Loans on 1- to 4-Family and Manufactured Home Dwellings
Loans OnManufactured Home
Dwellings FromColumns A, B, C & D
G
Number $000's
%MinPop4/
MedianIncome As
PCT ofMSA/MDMedian
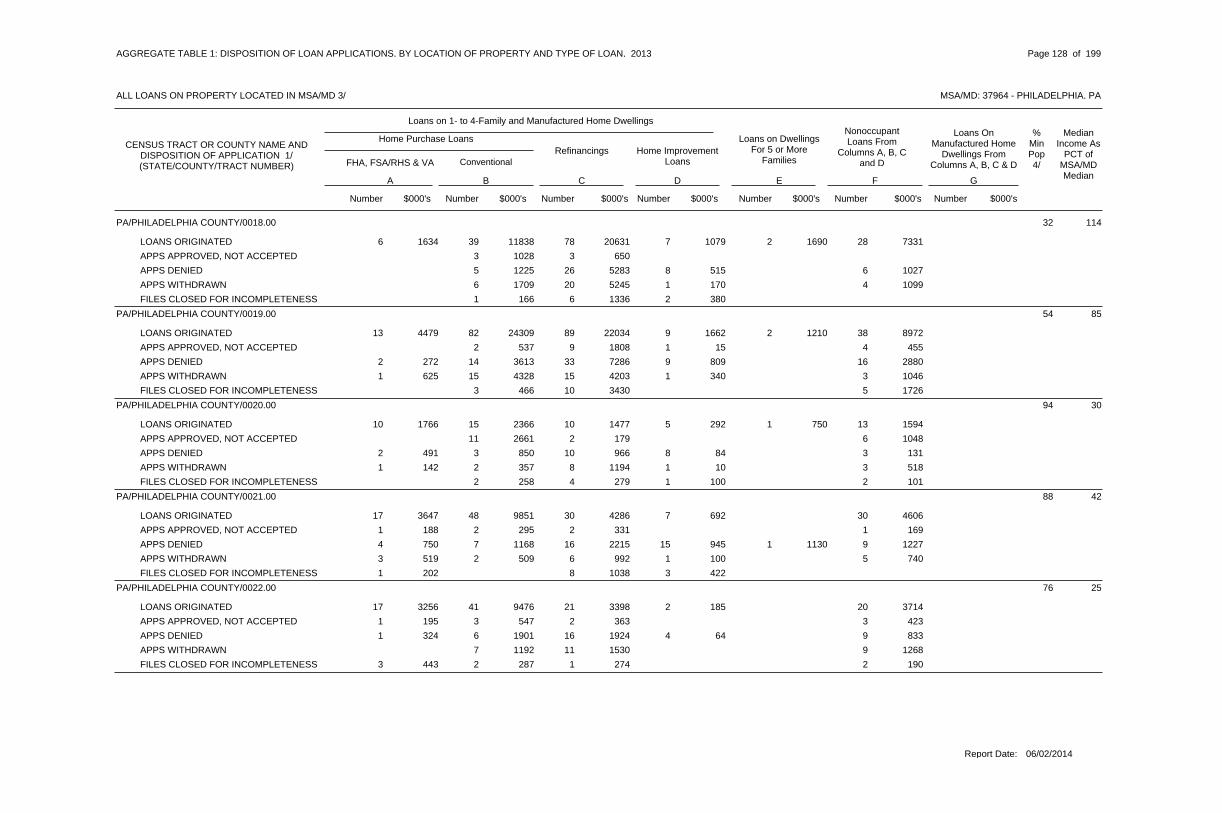
PA/PHILADELPHIA COUNTY/0018.00 32 114
LOANS ORIGINATED 39 78 7 2 286 1634 11838 20631 1079 1690 7331
APPS APPROVED, NOT ACCEPTED 3 31028 650
APPS DENIED 5 26 8 61225 5283 515 1027
APPS WITHDRAWN 6 20 1 41709 5245 170 1099
FILES CLOSED FOR INCOMPLETENESS 1 6 2166 1336 380
PA/PHILADELPHIA COUNTY/0019.00 54 85
LOANS ORIGINATED 82 89 9 2 3813 4479 24309 22034 1662 1210 8972
APPS APPROVED, NOT ACCEPTED 2 9 1 4537 1808 15 455
APPS DENIED 14 33 9 162 272 3613 7286 809 2880
APPS WITHDRAWN 15 15 1 31 625 4328 4203 340 1046
FILES CLOSED FOR INCOMPLETENESS 3 10 5466 3430 1726
PA/PHILADELPHIA COUNTY/0020.00 94 30
LOANS ORIGINATED 15 10 5 1 1310 1766 2366 1477 292 750 1594
APPS APPROVED, NOT ACCEPTED 11 2 62661 179 1048
APPS DENIED 3 10 8 32 491 850 966 84 131
APPS WITHDRAWN 2 8 1 31 142 357 1194 10 518
FILES CLOSED FOR INCOMPLETENESS 2 4 1 2258 279 100 101
PA/PHILADELPHIA COUNTY/0021.00 88 42
LOANS ORIGINATED 48 30 7 3017 3647 9851 4286 692 4606
APPS APPROVED, NOT ACCEPTED 2 2 11 188 295 331 169
APPS DENIED 7 16 15 1 94 750 1168 2215 945 1130 1227
APPS WITHDRAWN 2 6 1 53 519 509 992 100 740
FILES CLOSED FOR INCOMPLETENESS 8 31 202 1038 422
PA/PHILADELPHIA COUNTY/0022.00 76 25
LOANS ORIGINATED 41 21 2 2017 3256 9476 3398 185 3714
APPS APPROVED, NOT ACCEPTED 3 2 31 195 547 363 423
APPS DENIED 6 16 4 91 324 1901 1924 64 833
APPS WITHDRAWN 7 11 91192 1530 1268
FILES CLOSED FOR INCOMPLETENESS 2 1 23 443 287 274 190
06/02/2014Report Date:
AGGREGATE TABLE 1: DISPOSITION OF LOAN APPLICATIONS, BY LOCATION OF PROPERTY AND TYPE OF LOAN, 2013
MSA/MD: 37964 - PHILADELPHIA, PA
Page 128 of 199
ALL LOANS ON PROPERTY LOCATED IN MSA/MD 3/
CENSUS TRACT OR COUNTY NAME ANDDISPOSITION OF APPLICATION 1/(STATE/COUNTY/TRACT NUMBER) FHA, FSA/RHS & VA Conventional
Refinancings Home ImprovementLoans
Loans on DwellingsFor 5 or More
Families
NonoccupantLoans From
Columns A, B, Cand D
Number Number Number Number Number Number$000's $000's $000's $000's $000's $000's
A B C D E F
Home Purchase Loans
Loans on 1- to 4-Family and Manufactured Home Dwellings
Loans OnManufactured Home
Dwellings FromColumns A, B, C & D
G
Number $000's
%MinPop4/
MedianIncome As
PCT ofMSA/MDMedian

PA/PHILADELPHIA COUNTY/0023.00 35 77
LOANS ORIGINATED 43 64 6 1 196 1859 11610 14309 729 281 3386
APPS APPROVED, NOT ACCEPTED 6 62333 1293
APPS DENIED 4 22 7 51271 4427 354 717
APPS WITHDRAWN 6 8 4 41672 2199 315 762
FILES CLOSED FOR INCOMPLETENESS 2 6 2384 1041 343
PA/PHILADELPHIA COUNTY/0024.00 44 51
LOANS ORIGINATED 67 104 8 3 328 2291 19572 23453 654 1134 7160
APPS APPROVED, NOT ACCEPTED 4 15 3 71 211 1085 3191 697 1607
APPS DENIED 7 38 10 122652 8191 424 3009
APPS WITHDRAWN 6 21 21 98 1144 4463 184
FILES CLOSED FOR INCOMPLETENESS 10 12509 176
PA/PHILADELPHIA COUNTY/0025.00 52 54
LOANS ORIGINATED 55 88 5 1 443 768 14762 22910 1275 975 11903
APPS APPROVED, NOT ACCEPTED 15 1 33970 50 1035
APPS DENIED 8 28 6 71 290 1915 7570 231 2113
APPS WITHDRAWN 9 14 51923 3670 1087
FILES CLOSED FOR INCOMPLETENESS 2 8 5513 2068 1588
PA/PHILADELPHIA COUNTY/0027.01 71 46
LOANS ORIGINATED 22 38 8 1 1511 2273 4054 5759 629 181 2206
APPS APPROVED, NOT ACCEPTED 1 6 2162 1019 376
APPS DENIED 5 17 8 72 268 440 2146 576 1067
APPS WITHDRAWN 6 8 1 44 670 991 1026 100 449
FILES CLOSED FOR INCOMPLETENESS 1 4 3144 667 547
PA/PHILADELPHIA COUNTY/0027.02 12 120
LOANS ORIGINATED 46 99 11 3711 2156 9819 16346 633 6467
APPS APPROVED, NOT ACCEPTED 5 6 2 11 424 1183 1246 67 143
APPS DENIED 5 34 7 6590 5138 325 765
APPS WITHDRAWN 11 13 2 22 535 2067 1999 146 331
FILES CLOSED FOR INCOMPLETENESS 1 14 1 3384 3174 73 819
06/02/2014Report Date:
AGGREGATE TABLE 1: DISPOSITION OF LOAN APPLICATIONS, BY LOCATION OF PROPERTY AND TYPE OF LOAN, 2013
MSA/MD: 37964 - PHILADELPHIA, PA
Page 129 of 199
ALL LOANS ON PROPERTY LOCATED IN MSA/MD 3/
CENSUS TRACT OR COUNTY NAME ANDDISPOSITION OF APPLICATION 1/(STATE/COUNTY/TRACT NUMBER) FHA, FSA/RHS & VA Conventional
Refinancings Home ImprovementLoans
Loans on DwellingsFor 5 or More
Families
NonoccupantLoans From
Columns A, B, Cand D
Number Number Number Number Number Number$000's $000's $000's $000's $000's $000's
A B C D E F
Home Purchase Loans
Loans on 1- to 4-Family and Manufactured Home Dwellings
Loans OnManufactured Home
Dwellings FromColumns A, B, C & D
G
Number $000's
%MinPop4/
MedianIncome As
PCT ofMSA/MDMedian

PA/PHILADELPHIA COUNTY/0028.01 70 43
LOANS ORIGINATED 31 40 8 2314 2155 5296 5571 220 2992
APPS APPROVED, NOT ACCEPTED 5 1634 25
APPS DENIED 2 13 13 72 198 368 1647 263 1054
APPS WITHDRAWN 6 5 3879 804 470
FILES CLOSED FOR INCOMPLETENESS 3 3 2626 325 320
PA/PHILADELPHIA COUNTY/0028.02 35 63
LOANS ORIGINATED 71 90 19 3311 2263 15872 13654 2091 5617
APPS APPROVED, NOT ACCEPTED 6 15 2 51150 2960 35 960
APPS DENIED 3 32 5 83 706 396 5224 58 1202
APPS WITHDRAWN 10 20 41 245 1616 3868 333
FILES CLOSED FOR INCOMPLETENESS 2 12 2295 2037 153
PA/PHILADELPHIA COUNTY/0029.00 19 91
LOANS ORIGINATED 56 101 15 1 339 2248 13547 18674 1286 1050 5507
APPS APPROVED, NOT ACCEPTED 12 41972 576
APPS DENIED 7 43 22 1 101605 8566 1187 395 1549 1 77
APPS WITHDRAWN 7 26 3 32135 5356 109 369
FILES CLOSED FOR INCOMPLETENESS 13 22295 371
PA/PHILADELPHIA COUNTY/0030.01 81 43
LOANS ORIGINATED 23 27 12 175 920 3331 2485 544 2063
APPS APPROVED, NOT ACCEPTED 7 1 1680 10 124
APPS DENIED 4 28 13 102 291 674 2710 449 751
APPS WITHDRAWN 4 10 3 1525 739 85 60
FILES CLOSED FOR INCOMPLETENESS 2 9 1127 769 20
PA/PHILADELPHIA COUNTY/0030.02 83 41
LOANS ORIGINATED 27 36 4 2615 2863 4557 4928 212 3877
APPS APPROVED, NOT ACCEPTED 5 4 11 270 987 492 105
APPS DENIED 3 21 13 84 931 430 2050 458 663
APPS WITHDRAWN 1 6 21 186 212 594 182
FILES CLOSED FOR INCOMPLETENESS 1 3 1162 483 50
06/02/2014Report Date:
AGGREGATE TABLE 1: DISPOSITION OF LOAN APPLICATIONS, BY LOCATION OF PROPERTY AND TYPE OF LOAN, 2013
MSA/MD: 37964 - PHILADELPHIA, PA
Page 130 of 199
ALL LOANS ON PROPERTY LOCATED IN MSA/MD 3/
CENSUS TRACT OR COUNTY NAME ANDDISPOSITION OF APPLICATION 1/(STATE/COUNTY/TRACT NUMBER) FHA, FSA/RHS & VA Conventional
Refinancings Home ImprovementLoans
Loans on DwellingsFor 5 or More
Families
NonoccupantLoans From
Columns A, B, Cand D
Number Number Number Number Number Number$000's $000's $000's $000's $000's $000's
A B C D E F
Home Purchase Loans
Loans on 1- to 4-Family and Manufactured Home Dwellings
Loans OnManufactured Home
Dwellings FromColumns A, B, C & D
G
Number $000's
%MinPop4/
MedianIncome As
PCT ofMSA/MDMedian

PA/PHILADELPHIA COUNTY/0031.00 96 48
LOANS ORIGINATED 25 32 8 2922 3386 3020 3586 661 3197
APPS APPROVED, NOT ACCEPTED 3 3 1 41 166 505 305 50 304
APPS DENIED 2 23 25 84 378 191 1639 900 481
APPS WITHDRAWN 8 7 1 61 118 1272 535 25 445
FILES CLOSED FOR INCOMPLETENESS 5 31 66 418 230
PA/PHILADELPHIA COUNTY/0032.00 96 34
LOANS ORIGINATED 11 15 8 248 877 823 1101 526 1657
APPS APPROVED, NOT ACCEPTED 1 2 131 192 31
APPS DENIED 4 15 9 53 315 193 1289 124 295
APPS WITHDRAWN 2 5 1315 577 285
FILES CLOSED FOR INCOMPLETENESS 2 2 1336 51 10
PA/PHILADELPHIA COUNTY/0033.00 74 37
LOANS ORIGINATED 13 30 6 217 619 1347 1672 245 1205
APPS APPROVED, NOT ACCEPTED 1 6 370 549 189
APPS DENIED 4 33 28 161 79 212 2129 364 865
APPS WITHDRAWN 1 5 1 320 339 5 214
FILES CLOSED FOR INCOMPLETENESS 4 1 21 86 237 10 90
PA/PHILADELPHIA COUNTY/0036.00 79 27
LOANS ORIGINATED 10 46 9 1213 1440 915 4455 274 1101
APPS APPROVED, NOT ACCEPTED 11 11 64 1223 10
APPS DENIED 5 37 12 83 288 401 3451 392 739
APPS WITHDRAWN 2 10 1213 1015 77
FILES CLOSED FOR INCOMPLETENESS 2 8 21 133 117 752 79
PA/PHILADELPHIA COUNTY/0037.01 92 42
LOANS ORIGINATED 13 28 10 1 2213 1413 1180 2281 235 123 1819
APPS APPROVED, NOT ACCEPTED 2 31 129 208 227
APPS DENIED 7 33 18 124 442 783 2667 275 1013 1 2
APPS WITHDRAWN 2 4 1 23 417 169 171 65 125
FILES CLOSED FOR INCOMPLETENESS 5 1 2333 68 108
06/02/2014Report Date:
AGGREGATE TABLE 1: DISPOSITION OF LOAN APPLICATIONS, BY LOCATION OF PROPERTY AND TYPE OF LOAN, 2013
MSA/MD: 37964 - PHILADELPHIA, PA
Page 131 of 199
ALL LOANS ON PROPERTY LOCATED IN MSA/MD 3/
CENSUS TRACT OR COUNTY NAME ANDDISPOSITION OF APPLICATION 1/(STATE/COUNTY/TRACT NUMBER) FHA, FSA/RHS & VA Conventional
Refinancings Home ImprovementLoans
Loans on DwellingsFor 5 or More
Families
NonoccupantLoans From
Columns A, B, Cand D
Number Number Number Number Number Number$000's $000's $000's $000's $000's $000's
A B C D E F
Home Purchase Loans
Loans on 1- to 4-Family and Manufactured Home Dwellings
Loans OnManufactured Home
Dwellings FromColumns A, B, C & D
G
Number $000's
%MinPop4/
MedianIncome As
PCT ofMSA/MDMedian

PA/PHILADELPHIA COUNTY/0037.02 73 47
LOANS ORIGINATED 13 37 4 179 812 1399 3249 141 1220
APPS APPROVED, NOT ACCEPTED 2 9 1 2107 802 48 107
APPS DENIED 3 35 8 66 562 270 2743 128 356
APPS WITHDRAWN 1 3 1 23 266 100 373 60 256
FILES CLOSED FOR INCOMPLETENESS 2 5 1 1150 437 60 60
PA/PHILADELPHIA COUNTY/0038.00 11 80
LOANS ORIGINATED 26 57 10 1218 2883 4432 8113 457 1381
APPS APPROVED, NOT ACCEPTED 2 5 1 11 143 408 955 213 163
APPS DENIED 6 30 8 71049 4194 288 732
APPS WITHDRAWN 5 14 1 31 116 624 1913 48 410
FILES CLOSED FOR INCOMPLETENESS 1 8 1 1103 1491 25 128
PA/PHILADELPHIA COUNTY/0039.01 36 65
LOANS ORIGINATED 30 78 11 1 2722 3414 4052 11594 777 336 4841
APPS APPROVED, NOT ACCEPTED 2 22 302 232 216
APPS DENIED 7 31 18 103 531 851 3306 645 1196
APPS WITHDRAWN 5 16 3 74 743 842 2227 265 956
FILES CLOSED FOR INCOMPLETENESS 4 16 1 21 216 425 2042 20 191
PA/PHILADELPHIA COUNTY/0039.02 4 87
LOANS ORIGINATED 27 116 21 1223 4392 4371 14609 901 1546
APPS APPROVED, NOT ACCEPTED 1 51 213 160 480
APPS DENIED 10 33 15 26 795 1498 4700 583 342
APPS WITHDRAWN 4 20 4 45 805 516 3229 223 574
FILES CLOSED FOR INCOMPLETENESS 2 22 2 21 135 236 2883 263 326
PA/PHILADELPHIA COUNTY/0040.01 24 71
LOANS ORIGINATED 47 99 8 1 288 1599 7286 13774 311 675 3675
APPS APPROVED, NOT ACCEPTED 1 9 21 147 206 1523 295
APPS DENIED 2 37 14 42 376 268 4881 520 696
APPS WITHDRAWN 1 15 2 1164 2524 242 205
FILES CLOSED FOR INCOMPLETENESS 2 8 1179 1122 60
06/02/2014Report Date:
AGGREGATE TABLE 1: DISPOSITION OF LOAN APPLICATIONS, BY LOCATION OF PROPERTY AND TYPE OF LOAN, 2013
MSA/MD: 37964 - PHILADELPHIA, PA
Page 132 of 199
ALL LOANS ON PROPERTY LOCATED IN MSA/MD 3/
CENSUS TRACT OR COUNTY NAME ANDDISPOSITION OF APPLICATION 1/(STATE/COUNTY/TRACT NUMBER) FHA, FSA/RHS & VA Conventional
Refinancings Home ImprovementLoans
Loans on DwellingsFor 5 or More
Families
NonoccupantLoans From
Columns A, B, Cand D
Number Number Number Number Number Number$000's $000's $000's $000's $000's $000's
A B C D E F
Home Purchase Loans
Loans on 1- to 4-Family and Manufactured Home Dwellings
Loans OnManufactured Home
Dwellings FromColumns A, B, C & D
G
Number $000's
%MinPop4/
MedianIncome As
PCT ofMSA/MDMedian

PA/PHILADELPHIA COUNTY/0040.02 10 79
LOANS ORIGINATED 34 105 7 2318 3171 5294 13408 382 3289
APPS APPROVED, NOT ACCEPTED 3 9 2 3354 1233 177 423
APPS DENIED 4 38 11 61 170 538 4923 610 832
APPS WITHDRAWN 8 29 3 31 244 1391 3661 193 390
FILES CLOSED FOR INCOMPLETENESS 1 81 142 148 1201
PA/PHILADELPHIA COUNTY/0041.01 77 39
LOANS ORIGINATED 22 47 6 3011 1450 2662 6154 268 4390
APPS APPROVED, NOT ACCEPTED 1 7 167 796 15
APPS DENIED 4 26 17 76 511 436 3294 608 567 1 3
APPS WITHDRAWN 2 13 3 33 365 130 1198 66 272 1 10
FILES CLOSED FOR INCOMPLETENESS 1 3140 352
PA/PHILADELPHIA COUNTY/0041.02 57 48
LOANS ORIGINATED 29 60 4 206 659 2756 5411 118 1551
APPS APPROVED, NOT ACCEPTED 1 10 42 207 85 1057 486
APPS DENIED 5 49 15 93 342 543 4318 681 901
APPS WITHDRAWN 5 11 2 51 123 407 1138 145 413
FILES CLOSED FOR INCOMPLETENESS 1 13 268 1190 162
PA/PHILADELPHIA COUNTY/0042.01 21 70
LOANS ORIGINATED 32 105 10 1516 2950 4940 13681 433 2494
APPS APPROVED, NOT ACCEPTED 3 5 11 188 527 882 124
APPS DENIED 2 51 10 83 358 156 6212 136 1024
APPS WITHDRAWN 5 19 2 16 1024 808 2620 73 50
FILES CLOSED FOR INCOMPLETENESS 3 14 2 11 108 319 1739 30 91
PA/PHILADELPHIA COUNTY/0042.02 24 60
LOANS ORIGINATED 20 64 12 1517 2319 2316 6760 775 1764
APPS APPROVED, NOT ACCEPTED 2 10 1291 1400 135
APPS DENIED 1 38 23 73 297 162 3912 456 533
APPS WITHDRAWN 1 11 3 21 156 124 1530 190 272
FILES CLOSED FOR INCOMPLETENESS 111 83 1144
06/02/2014Report Date:
AGGREGATE TABLE 1: DISPOSITION OF LOAN APPLICATIONS, BY LOCATION OF PROPERTY AND TYPE OF LOAN, 2013
MSA/MD: 37964 - PHILADELPHIA, PA
Page 133 of 199
ALL LOANS ON PROPERTY LOCATED IN MSA/MD 3/
CENSUS TRACT OR COUNTY NAME ANDDISPOSITION OF APPLICATION 1/(STATE/COUNTY/TRACT NUMBER) FHA, FSA/RHS & VA Conventional
Refinancings Home ImprovementLoans
Loans on DwellingsFor 5 or More
Families
NonoccupantLoans From
Columns A, B, Cand D
Number Number Number Number Number Number$000's $000's $000's $000's $000's $000's
A B C D E F
Home Purchase Loans
Loans on 1- to 4-Family and Manufactured Home Dwellings
Loans OnManufactured Home
Dwellings FromColumns A, B, C & D
G
Number $000's
%MinPop4/
MedianIncome As
PCT ofMSA/MDMedian

PA/PHILADELPHIA COUNTY/0050.00 38 0
LOANS ORIGINATED 1 1296 296
APPS APPROVED, NOT ACCEPTED 1 296
APPS DENIED
APPS WITHDRAWN
FILES CLOSED FOR INCOMPLETENESS
PA/PHILADELPHIA COUNTY/0054.00 88 82
LOANS ORIGINATED 8 2 1826 100 50
APPS APPROVED, NOT ACCEPTED 6 738
APPS DENIED 1 10 51 142 138 1310 43
APPS WITHDRAWN 1 6 1119 808 139
FILES CLOSED FOR INCOMPLETENESS 2 330
PA/PHILADELPHIA COUNTY/0055.00 87 77
LOANS ORIGINATED 6 78 17 414 1581 611 7495 294 357
APPS APPROVED, NOT ACCEPTED 13 22 255 1323 85
APPS DENIED 3 63 21 513 1536 234 6128 456 568
APPS WITHDRAWN 4 26 2 12 246 364 2716 19 80
FILES CLOSED FOR INCOMPLETENESS 152 293 1579
PA/PHILADELPHIA COUNTY/0056.00 92 83
LOANS ORIGINATED 1 11 137 50 87
APPS APPROVED, NOT ACCEPTED 1 135
APPS DENIED 3 171
APPS WITHDRAWN 1 157
FILES CLOSED FOR INCOMPLETENESS 1 125
PA/PHILADELPHIA COUNTY/0060.00 83 69
LOANS ORIGINATED 11 51 6 1013 1373 949 4589 76 762
APPS APPROVED, NOT ACCEPTED 1 11 11 149 140 1193 45
APPS DENIED 5 43 26 74 366 306 3788 418 280
APPS WITHDRAWN 1 15124 1746
FILES CLOSED FOR INCOMPLETENESS 2 113 284 162 1118
06/02/2014Report Date:
AGGREGATE TABLE 1: DISPOSITION OF LOAN APPLICATIONS, BY LOCATION OF PROPERTY AND TYPE OF LOAN, 2013
MSA/MD: 37964 - PHILADELPHIA, PA
Page 134 of 199
ALL LOANS ON PROPERTY LOCATED IN MSA/MD 3/
CENSUS TRACT OR COUNTY NAME ANDDISPOSITION OF APPLICATION 1/(STATE/COUNTY/TRACT NUMBER) FHA, FSA/RHS & VA Conventional
Refinancings Home ImprovementLoans
Loans on DwellingsFor 5 or More
Families
NonoccupantLoans From
Columns A, B, Cand D
Number Number Number Number Number Number$000's $000's $000's $000's $000's $000's
A B C D E F
Home Purchase Loans
Loans on 1- to 4-Family and Manufactured Home Dwellings
Loans OnManufactured Home
Dwellings FromColumns A, B, C & D
G
Number $000's
%MinPop4/
MedianIncome As
PCT ofMSA/MDMedian

PA/PHILADELPHIA COUNTY/0061.00 87 65
LOANS ORIGINATED 6 21 4 411 1229 367 1559 50 242
APPS APPROVED, NOT ACCEPTED 4 390
APPS DENIED 3 37 17 15 519 249 2988 184 10
APPS WITHDRAWN 14 1 11 78 1143 30 80
FILES CLOSED FOR INCOMPLETENESS 8 766
PA/PHILADELPHIA COUNTY/0062.00 91 41
LOANS ORIGINATED 24 7 56 424 1466 58 239
APPS APPROVED, NOT ACCEPTED 8 1469 48
APPS DENIED 2 21 15 23 187 97 1286 299 87
APPS WITHDRAWN 8 563
FILES CLOSED FOR INCOMPLETENESS 5 258
PA/PHILADELPHIA COUNTY/0063.00 95 37
LOANS ORIGINATED 1 6 23 171 81 237 84
APPS APPROVED, NOT ACCEPTED 1 75
APPS DENIED 2 16 10 1 71 58 83 764 421 550 301
APPS WITHDRAWN 4 11 64 318 60
FILES CLOSED FOR INCOMPLETENESS 3 1 2195 55 101
PA/PHILADELPHIA COUNTY/0064.00 93 46
LOANS ORIGINATED 4 17 2 13 215 264 1253 56 50
APPS APPROVED, NOT ACCEPTED 5 11 69 344 10
APPS DENIED 30 23 31 93 1951 515 105
APPS WITHDRAWN 1 1259 878
FILES CLOSED FOR INCOMPLETENESS 1 10 21 103 15 707 96
PA/PHILADELPHIA COUNTY/0065.00 99 52
LOANS ORIGINATED 15 6 84 324 815 215 508
APPS APPROVED, NOT ACCEPTED 3 1214 23
APPS DENIED 27 18 72 186 1730 347 378
APPS WITHDRAWN 4 2 11 44 439 20 277
FILES CLOSED FOR INCOMPLETENESS 1 266 138
06/02/2014Report Date:
AGGREGATE TABLE 1: DISPOSITION OF LOAN APPLICATIONS, BY LOCATION OF PROPERTY AND TYPE OF LOAN, 2013
MSA/MD: 37964 - PHILADELPHIA, PA
Page 135 of 199
ALL LOANS ON PROPERTY LOCATED IN MSA/MD 3/
CENSUS TRACT OR COUNTY NAME ANDDISPOSITION OF APPLICATION 1/(STATE/COUNTY/TRACT NUMBER) FHA, FSA/RHS & VA Conventional
Refinancings Home ImprovementLoans
Loans on DwellingsFor 5 or More
Families
NonoccupantLoans From
Columns A, B, Cand D
Number Number Number Number Number Number$000's $000's $000's $000's $000's $000's
A B C D E F
Home Purchase Loans
Loans on 1- to 4-Family and Manufactured Home Dwellings
Loans OnManufactured Home
Dwellings FromColumns A, B, C & D
G
Number $000's
%MinPop4/
MedianIncome As
PCT ofMSA/MDMedian

PA/PHILADELPHIA COUNTY/0066.00 95 36
LOANS ORIGINATED 2 9 4 5155 405 50 267
APPS APPROVED, NOT ACCEPTED 2 1116 48
APPS DENIED 10 16 41 68 439 192 96
APPS WITHDRAWN 2 198 44
FILES CLOSED FOR INCOMPLETENESS 3 141
PA/PHILADELPHIA COUNTY/0067.00 90 38
LOANS ORIGINATED 4 35 6 814 1100 191 2869 116 791
APPS APPROVED, NOT ACCEPTED 9 21 39 595 129
APPS DENIED 3 46 24 131 59 207 2918 459 401 1 2
APPS WITHDRAWN 3 12 1 1208 830 10 50
FILES CLOSED FOR INCOMPLETENESS 1 989 580
PA/PHILADELPHIA COUNTY/0069.00 98 28
LOANS ORIGINATED 7 11 57 259 1
APPS APPROVED, NOT ACCEPTED
APPS DENIED 6 15 1213 193 33
APPS WITHDRAWN 4 1194 45
FILES CLOSED FOR INCOMPLETENESS 3 1 167 17 33
PA/PHILADELPHIA COUNTY/0070.00 99 56
LOANS ORIGINATED 9 5 21081 54 741
APPS APPROVED, NOT ACCEPTED 1 2 1152 111 10
APPS DENIED 10 22 21 36 503 335 67 1 2
APPS WITHDRAWN 1 40
FILES CLOSED FOR INCOMPLETENESS 1 50
PA/PHILADELPHIA COUNTY/0071.01 95 39
LOANS ORIGINATED 2 2 12 241 60 33 35
APPS APPROVED, NOT ACCEPTED 1 160 7
APPS DENIED 12 11 41 296 597 259 129
APPS WITHDRAWN 1 1 11 115 26 93 5
FILES CLOSED FOR INCOMPLETENESS 3 2174 77
06/02/2014Report Date:
AGGREGATE TABLE 1: DISPOSITION OF LOAN APPLICATIONS, BY LOCATION OF PROPERTY AND TYPE OF LOAN, 2013
MSA/MD: 37964 - PHILADELPHIA, PA
Page 136 of 199
ALL LOANS ON PROPERTY LOCATED IN MSA/MD 3/
CENSUS TRACT OR COUNTY NAME ANDDISPOSITION OF APPLICATION 1/(STATE/COUNTY/TRACT NUMBER) FHA, FSA/RHS & VA Conventional
Refinancings Home ImprovementLoans
Loans on DwellingsFor 5 or More
Families
NonoccupantLoans From
Columns A, B, Cand D
Number Number Number Number Number Number$000's $000's $000's $000's $000's $000's
A B C D E F
Home Purchase Loans
Loans on 1- to 4-Family and Manufactured Home Dwellings
Loans OnManufactured Home
Dwellings FromColumns A, B, C & D
G
Number $000's
%MinPop4/
MedianIncome As
PCT ofMSA/MDMedian

PA/PHILADELPHIA COUNTY/0071.02 99 49
LOANS ORIGINATED 1 9 4 24 261 33 324 113 105
APPS APPROVED, NOT ACCEPTED
APPS DENIED 1 12 34 64 254 56 702 477 124
APPS WITHDRAWN 1 2 216 117 58
FILES CLOSED FOR INCOMPLETENESS 7 11 66 292 51
PA/PHILADELPHIA COUNTY/0072.00 99 47
LOANS ORIGINATED 2 10 3 71 58 296 534 87 623
APPS APPROVED, NOT ACCEPTED 1 250 75
APPS DENIED 1 27 28 96 572 53 1483 632 277
APPS WITHDRAWN 1 7 2 367 363 65 133
FILES CLOSED FOR INCOMPLETENESS 3 1161 48
PA/PHILADELPHIA COUNTY/0073.00 94 46
LOANS ORIGINATED 8 14 4 55 907 1053 1631 63 666
APPS APPROVED, NOT ACCEPTED 11 263 65
APPS DENIED 2 17 10 82 371 187 1221 156 404 2 51
APPS WITHDRAWN 3 2 2 23 329 372 140 77 114
FILES CLOSED FOR INCOMPLETENESS 5 2 11 221 223 50 72
PA/PHILADELPHIA COUNTY/0074.00 93 41
LOANS ORIGINATED 6 14 4 86 387 481 2353 150 1837
APPS APPROVED, NOT ACCEPTED 1 28
APPS DENIED 3 11 24 101 68 170 993 285 515 1 3
APPS WITHDRAWN 2 2 1 2105 45 1700 85
FILES CLOSED FOR INCOMPLETENESS 1 31 87 87 180
PA/PHILADELPHIA COUNTY/0077.00 59 67
LOANS ORIGINATED 4 10 1 1 7693 2080 140 431 1520
APPS APPROVED, NOT ACCEPTED 1 1 1315 448 315
APPS DENIED 1 5 5 3259 1036 33 754
APPS WITHDRAWN 1 1276 276
FILES CLOSED FOR INCOMPLETENESS 1 125
06/02/2014Report Date:
AGGREGATE TABLE 1: DISPOSITION OF LOAN APPLICATIONS, BY LOCATION OF PROPERTY AND TYPE OF LOAN, 2013
MSA/MD: 37964 - PHILADELPHIA, PA
Page 137 of 199
ALL LOANS ON PROPERTY LOCATED IN MSA/MD 3/
CENSUS TRACT OR COUNTY NAME ANDDISPOSITION OF APPLICATION 1/(STATE/COUNTY/TRACT NUMBER) FHA, FSA/RHS & VA Conventional
Refinancings Home ImprovementLoans
Loans on DwellingsFor 5 or More
Families
NonoccupantLoans From
Columns A, B, Cand D
Number Number Number Number Number Number$000's $000's $000's $000's $000's $000's
A B C D E F
Home Purchase Loans
Loans on 1- to 4-Family and Manufactured Home Dwellings
Loans OnManufactured Home
Dwellings FromColumns A, B, C & D
G
Number $000's
%MinPop4/
MedianIncome As
PCT ofMSA/MDMedian

PA/PHILADELPHIA COUNTY/0078.00 50 103
LOANS ORIGINATED 24 43 6 2 243 1071 7968 11087 777 2062 7859
APPS APPROVED, NOT ACCEPTED 1 3 1100 610 209
APPS DENIED 3 19 3 8455 3734 302 1442 1 6
APPS WITHDRAWN 4 8 31 181 980 1681 490
FILES CLOSED FOR INCOMPLETENESS 2 6500 990
PA/PHILADELPHIA COUNTY/0079.00 53 83
LOANS ORIGINATED 32 73 7 4 214 962 8415 16147 975 3625 4657
APPS APPROVED, NOT ACCEPTED 9 1 32 738 1851 4 760
APPS DENIED 4 27 6 8624 6863 187 1340
APPS WITHDRAWN 5 14 41 79 1271 3474 1022
FILES CLOSED FOR INCOMPLETENESS 6 21710 365
PA/PHILADELPHIA COUNTY/0080.00 91 48
LOANS ORIGINATED 20 37 6 1 197 1203 3455 3493 476 1350 2460
APPS APPROVED, NOT ACCEPTED 2 6 1 1300 761 35 84
APPS DENIED 4 29 19 151 128 493 3151 365 1164
APPS WITHDRAWN 4 6 1 22 200 707 759 79 106
FILES CLOSED FOR INCOMPLETENESS 1 4 12 297 174 518 75
PA/PHILADELPHIA COUNTY/0081.01 99 33
LOANS ORIGINATED 1 10 4 24 394 96 658 46 121
APPS APPROVED, NOT ACCEPTED 1 74
APPS DENIED 1 7 9 31 40 41 470 187 188
APPS WITHDRAWN 5 1 22 123 455 20 78
FILES CLOSED FOR INCOMPLETENESS
PA/PHILADELPHIA COUNTY/0081.02 99 60
LOANS ORIGINATED 2 22 10 77 657 201 1366 153 360
APPS APPROVED, NOT ACCEPTED 2 24 623 103 91
APPS DENIED 2 23 44 102 245 167 1314 651 446
APPS WITHDRAWN 5 2 11 72 210 77 24
FILES CLOSED FOR INCOMPLETENESS 4 245
06/02/2014Report Date:
AGGREGATE TABLE 1: DISPOSITION OF LOAN APPLICATIONS, BY LOCATION OF PROPERTY AND TYPE OF LOAN, 2013
MSA/MD: 37964 - PHILADELPHIA, PA
Page 138 of 199
ALL LOANS ON PROPERTY LOCATED IN MSA/MD 3/
CENSUS TRACT OR COUNTY NAME ANDDISPOSITION OF APPLICATION 1/(STATE/COUNTY/TRACT NUMBER) FHA, FSA/RHS & VA Conventional
Refinancings Home ImprovementLoans
Loans on DwellingsFor 5 or More
Families
NonoccupantLoans From
Columns A, B, Cand D
Number Number Number Number Number Number$000's $000's $000's $000's $000's $000's
A B C D E F
Home Purchase Loans
Loans on 1- to 4-Family and Manufactured Home Dwellings
Loans OnManufactured Home
Dwellings FromColumns A, B, C & D
G
Number $000's
%MinPop4/
MedianIncome As
PCT ofMSA/MDMedian

PA/PHILADELPHIA COUNTY/0082.00 99 69
LOANS ORIGINATED 4 38 20 815 1493 220 3549 325 744 1 2
APPS APPROVED, NOT ACCEPTED 1 6 2 381 565 35 236
APPS DENIED 5 55 34 145 429 380 4459 773 909
APPS WITHDRAWN 5 14 3 21 49 447 1186 187 72
FILES CLOSED FOR INCOMPLETENESS 9 11 236 960 14
PA/PHILADELPHIA COUNTY/0083.01 98 44
LOANS ORIGINATED 10 7 1 59 691 1258 172 2340 898
APPS APPROVED, NOT ACCEPTED
APPS DENIED 1 18 23 93 161 88 1238 228 367
APPS WITHDRAWN 53 246 329
FILES CLOSED FOR INCOMPLETENESS 6 430
PA/PHILADELPHIA COUNTY/0083.02 99 36
LOANS ORIGINATED 1 9 3 62 182 40 756 236 775
APPS APPROVED, NOT ACCEPTED 1 21 62 1 143
APPS DENIED 3 24 20 54 398 172 1249 270 221
APPS WITHDRAWN 3 2190 65
FILES CLOSED FOR INCOMPLETENESS 1 2 23 130 2 127 20
PA/PHILADELPHIA COUNTY/0084.00 99 41
LOANS ORIGINATED 5 13 5 35 427 495 662 70 347
APPS APPROVED, NOT ACCEPTED 1 2 1 2235 181 7 304
APPS DENIED 4 16 24 1 23 278 255 1124 631 80 183
APPS WITHDRAWN 1 12 221 60 60
FILES CLOSED FOR INCOMPLETENESS 31 108 150
PA/PHILADELPHIA COUNTY/0085.00 97 46
LOANS ORIGINATED 12 39 9 2 238 1324 2817 3770 182 793 3905
APPS APPROVED, NOT ACCEPTED 3 3395 395
APPS DENIED 2 28 37 152 113 290 2715 529 1328
APPS WITHDRAWN 1 9 1 42 193 153 980 3 559
FILES CLOSED FOR INCOMPLETENESS 1 7 1 52 206 1 726 12 666
06/02/2014Report Date:
AGGREGATE TABLE 1: DISPOSITION OF LOAN APPLICATIONS, BY LOCATION OF PROPERTY AND TYPE OF LOAN, 2013
MSA/MD: 37964 - PHILADELPHIA, PA
Page 139 of 199
ALL LOANS ON PROPERTY LOCATED IN MSA/MD 3/
CENSUS TRACT OR COUNTY NAME ANDDISPOSITION OF APPLICATION 1/(STATE/COUNTY/TRACT NUMBER) FHA, FSA/RHS & VA Conventional
Refinancings Home ImprovementLoans
Loans on DwellingsFor 5 or More
Families
NonoccupantLoans From
Columns A, B, Cand D
Number Number Number Number Number Number$000's $000's $000's $000's $000's $000's
A B C D E F
Home Purchase Loans
Loans on 1- to 4-Family and Manufactured Home Dwellings
Loans OnManufactured Home
Dwellings FromColumns A, B, C & D
G
Number $000's
%MinPop4/
MedianIncome As
PCT ofMSA/MDMedian

PA/PHILADELPHIA COUNTY/0086.01 54 75
LOANS ORIGINATED 19 23 4 1 103 831 5380 5806 466 370 2798
APPS APPROVED, NOT ACCEPTED 1 1119 316
APPS DENIED 2 12 1 31 280 542 2128 190 733
APPS WITHDRAWN 4 4 1805 644 212
FILES CLOSED FOR INCOMPLETENESS 1 49
PA/PHILADELPHIA COUNTY/0086.02 90 43
LOANS ORIGINATED 9 22 7 3 182 351 1855 3447 437 1147 3118
APPS APPROVED, NOT ACCEPTED 1 1 2 3 1118 121 33 1300 121
APPS DENIED 3 12 6 33 488 561 1661 245 573
APPS WITHDRAWN 11 1 33 445 1555 130 678
FILES CLOSED FOR INCOMPLETENESS 1 3 1 1115 515 25 362
PA/PHILADELPHIA COUNTY/0087.01 51 75
LOANS ORIGINATED 6 23 7 123671 6123 8940 4990
APPS APPROVED, NOT ACCEPTED 2 2285 521
APPS DENIED 2 3 2490 877 260
APPS WITHDRAWN 2 3 4518 418 531
FILES CLOSED FOR INCOMPLETENESS 2 1073
PA/PHILADELPHIA COUNTY/0087.02 44 162
LOANS ORIGINATED 8 15 3 52 299 2922 3445 1925 1316
APPS APPROVED, NOT ACCEPTED 2 2 1872 760 2225
APPS DENIED 8 12838 375
APPS WITHDRAWN 1 5 1315 1502 361
FILES CLOSED FOR INCOMPLETENESS 1 5220 1405
PA/PHILADELPHIA COUNTY/0088.01 48 0
LOANS ORIGINATED
APPS APPROVED, NOT ACCEPTED
APPS DENIED 1 61035
APPS WITHDRAWN
FILES CLOSED FOR INCOMPLETENESS
06/02/2014Report Date:
AGGREGATE TABLE 1: DISPOSITION OF LOAN APPLICATIONS, BY LOCATION OF PROPERTY AND TYPE OF LOAN, 2013
MSA/MD: 37964 - PHILADELPHIA, PA
Page 140 of 199
ALL LOANS ON PROPERTY LOCATED IN MSA/MD 3/
CENSUS TRACT OR COUNTY NAME ANDDISPOSITION OF APPLICATION 1/(STATE/COUNTY/TRACT NUMBER) FHA, FSA/RHS & VA Conventional
Refinancings Home ImprovementLoans
Loans on DwellingsFor 5 or More
Families
NonoccupantLoans From
Columns A, B, Cand D
Number Number Number Number Number Number$000's $000's $000's $000's $000's $000's
A B C D E F
Home Purchase Loans
Loans on 1- to 4-Family and Manufactured Home Dwellings
Loans OnManufactured Home
Dwellings FromColumns A, B, C & D
G
Number $000's
%MinPop4/
MedianIncome As
PCT ofMSA/MDMedian

PA/PHILADELPHIA COUNTY/0088.02 48 32
LOANS ORIGINATED 2 8 3 9900 1329 7169 1997
APPS APPROVED, NOT ACCEPTED 1 126
APPS DENIED 6 11891 417
APPS WITHDRAWN 2 1499 13500
FILES CLOSED FOR INCOMPLETENESS 4 1713 176
PA/PHILADELPHIA COUNTY/0090.00 32 144
LOANS ORIGINATED 4 19 2 1 161402 4969 59 323 4140
APPS APPROVED, NOT ACCEPTED 1 1500 280
APPS DENIED 10 62216 1327
APPS WITHDRAWN 5 51534 1534
FILES CLOSED FOR INCOMPLETENESS 1 444
PA/PHILADELPHIA COUNTY/0091.00 61 67
LOANS ORIGINATED 8 22 2 6 152403 4011 96 77008 3235
APPS APPROVED, NOT ACCEPTED 4 970
APPS DENIED 1 11 3 41 147 153 1847 219 806
APPS WITHDRAWN 1 6 2 1 2377 1019 265 3865 622
FILES CLOSED FOR INCOMPLETENESS 2 2486 486
PA/PHILADELPHIA COUNTY/0092.00 89 26
LOANS ORIGINATED 18 22 3 3 214 957 4098 3445 500 3890 4730
APPS APPROVED, NOT ACCEPTED 2 2 3371 319 539
APPS DENIED 3 13 9 102 187 396 1295 299 1099
APPS WITHDRAWN 7 1 3863 130 486
FILES CLOSED FOR INCOMPLETENESS 1 3 2 2417 310 50 557
PA/PHILADELPHIA COUNTY/0093.00 98 41
LOANS ORIGINATED 1 18 4 1 124 348 119 1766 18 350 1280
APPS APPROVED, NOT ACCEPTED 2 2 22 224 135 162 143
APPS DENIED 31 27 201 91 3662 752 3048
APPS WITHDRAWN 1 7 1 62 230 42 735 20 599
FILES CLOSED FOR INCOMPLETENESS 1 1 166 20 66
06/02/2014Report Date:
AGGREGATE TABLE 1: DISPOSITION OF LOAN APPLICATIONS, BY LOCATION OF PROPERTY AND TYPE OF LOAN, 2013
MSA/MD: 37964 - PHILADELPHIA, PA
Page 141 of 199
ALL LOANS ON PROPERTY LOCATED IN MSA/MD 3/
CENSUS TRACT OR COUNTY NAME ANDDISPOSITION OF APPLICATION 1/(STATE/COUNTY/TRACT NUMBER) FHA, FSA/RHS & VA Conventional
Refinancings Home ImprovementLoans
Loans on DwellingsFor 5 or More
Families
NonoccupantLoans From
Columns A, B, Cand D
Number Number Number Number Number Number$000's $000's $000's $000's $000's $000's
A B C D E F
Home Purchase Loans
Loans on 1- to 4-Family and Manufactured Home Dwellings
Loans OnManufactured Home
Dwellings FromColumns A, B, C & D
G
Number $000's
%MinPop4/
MedianIncome As
PCT ofMSA/MDMedian

PA/PHILADELPHIA COUNTY/0094.00 99 30
LOANS ORIGINATED 1 13 7 43 231 55 692 102 214
APPS APPROVED, NOT ACCEPTED
APPS DENIED 1 7 28 62 71 104 400 410 223
APPS WITHDRAWN 1 2 124 70 30
FILES CLOSED FOR INCOMPLETENESS 1 15
PA/PHILADELPHIA COUNTY/0095.00 99 36
LOANS ORIGINATED 1 5 3 43 209 40 314 23 226
APPS APPROVED, NOT ACCEPTED 1 140 3
APPS DENIED 1 8 20 41 59 10 374 206 115
APPS WITHDRAWN 2 2 21 59 100 17 89
FILES CLOSED FOR INCOMPLETENESS 5 1270 64
PA/PHILADELPHIA COUNTY/0096.00 99 36
LOANS ORIGINATED 6 16 6 57 592 378 924 88 541
APPS APPROVED, NOT ACCEPTED 3 1135 44
APPS DENIED 2 17 20 65 339 135 1110 215 356
APPS WITHDRAWN 1 8 12 260 88 624 32
FILES CLOSED FOR INCOMPLETENESS 4 2179 95
PA/PHILADELPHIA COUNTY/0098.01 89 69
LOANS ORIGINATED 3 29 6 613 1452 324 2294 71 485
APPS APPROVED, NOT ACCEPTED 51 134 572
APPS DENIED 2 22 8 72 298 44 2025 87 606
APPS WITHDRAWN 8 11 79 808 10
FILES CLOSED FOR INCOMPLETENESS 7 579
PA/PHILADELPHIA COUNTY/0098.02 89 71
LOANS ORIGINATED 11 90 12 2 1224 3026 1245 8678 622 3480 1441
APPS APPROVED, NOT ACCEPTED 1 15 1 173 1472 5 73
APPS DENIED 3 65 33 911 1228 325 5809 371 785 1 10
APPS WITHDRAWN 1 16 1 32 273 80 1521 69 316
FILES CLOSED FOR INCOMPLETENESS 2 18 11 164 92 1578 84
06/02/2014Report Date:
AGGREGATE TABLE 1: DISPOSITION OF LOAN APPLICATIONS, BY LOCATION OF PROPERTY AND TYPE OF LOAN, 2013
MSA/MD: 37964 - PHILADELPHIA, PA
Page 142 of 199
ALL LOANS ON PROPERTY LOCATED IN MSA/MD 3/
CENSUS TRACT OR COUNTY NAME ANDDISPOSITION OF APPLICATION 1/(STATE/COUNTY/TRACT NUMBER) FHA, FSA/RHS & VA Conventional
Refinancings Home ImprovementLoans
Loans on DwellingsFor 5 or More
Families
NonoccupantLoans From
Columns A, B, Cand D
Number Number Number Number Number Number$000's $000's $000's $000's $000's $000's
A B C D E F
Home Purchase Loans
Loans on 1- to 4-Family and Manufactured Home Dwellings
Loans OnManufactured Home
Dwellings FromColumns A, B, C & D
G
Number $000's
%MinPop4/
MedianIncome As
PCT ofMSA/MDMedian

PA/PHILADELPHIA COUNTY/0100.00 90 65
LOANS ORIGINATED 7 36 6 1 510 1156 410 2700 196 530 412
APPS APPROVED, NOT ACCEPTED 1 6 11 168 87 502 68
APPS DENIED 1 38 22 98 691 38 3137 343 578 1 5
APPS WITHDRAWN 13 2 23 255 1183 64 132
FILES CLOSED FOR INCOMPLETENESS 1 11 1 139 699 49 23
PA/PHILADELPHIA COUNTY/0101.00 98 70
LOANS ORIGINATED 5 20 9 65 462 404 1464 102 510
APPS APPROVED, NOT ACCEPTED 3 1217 108
APPS DENIED 4 30 32 57 536 165 1994 518 193
APPS WITHDRAWN 1 1 11 81 74 53 53
FILES CLOSED FOR INCOMPLETENESS 7 1 2522 23 130
PA/PHILADELPHIA COUNTY/0102.00 99 35
LOANS ORIGINATED 4 4 1 12 194 221 65 350 25
APPS APPROVED, NOT ACCEPTED
APPS DENIED 1 14 25 71 50 67 1014 221 409
APPS WITHDRAWN 1 2 152 142 80
FILES CLOSED FOR INCOMPLETENESS 1 94
PA/PHILADELPHIA COUNTY/0103.00 100 28
LOANS ORIGINATED 5 3 4551 45 470
APPS APPROVED, NOT ACCEPTED
APPS DENIED 1 9 19 81 49 33 765 377 496
APPS WITHDRAWN 4 21 49 271 118
FILES CLOSED FOR INCOMPLETENESS 1 1 140 77 77
PA/PHILADELPHIA COUNTY/0104.00 98 38
LOANS ORIGINATED 10 3 52 113 401 154 263
APPS APPROVED, NOT ACCEPTED 1 132 32
APPS DENIED 1 11 15 1 630 571 120 2900 365
APPS WITHDRAWN 3 1213 12
FILES CLOSED FOR INCOMPLETENESS 3 127
06/02/2014Report Date:
AGGREGATE TABLE 1: DISPOSITION OF LOAN APPLICATIONS, BY LOCATION OF PROPERTY AND TYPE OF LOAN, 2013
MSA/MD: 37964 - PHILADELPHIA, PA
Page 143 of 199
ALL LOANS ON PROPERTY LOCATED IN MSA/MD 3/
CENSUS TRACT OR COUNTY NAME ANDDISPOSITION OF APPLICATION 1/(STATE/COUNTY/TRACT NUMBER) FHA, FSA/RHS & VA Conventional
Refinancings Home ImprovementLoans
Loans on DwellingsFor 5 or More
Families
NonoccupantLoans From
Columns A, B, Cand D
Number Number Number Number Number Number$000's $000's $000's $000's $000's $000's
A B C D E F
Home Purchase Loans
Loans on 1- to 4-Family and Manufactured Home Dwellings
Loans OnManufactured Home
Dwellings FromColumns A, B, C & D
G
Number $000's
%MinPop4/
MedianIncome As
PCT ofMSA/MDMedian

PA/PHILADELPHIA COUNTY/0105.00 97 44
LOANS ORIGINATED 4 9 1 11 113 368 738 3 79
APPS APPROVED, NOT ACCEPTED 1 106
APPS DENIED 1 21 15 21 113 38 1921 302 160 1 38
APPS WITHDRAWN 6 12 216 526 80
FILES CLOSED FOR INCOMPLETENESS 1 126 25
PA/PHILADELPHIA COUNTY/0106.00 97 60
LOANS ORIGINATED 4 5 1 61086 240 10 1153
APPS APPROVED, NOT ACCEPTED 1 166
APPS DENIED 8 2 4763 8 207
APPS WITHDRAWN 5 31 122 643 512
FILES CLOSED FOR INCOMPLETENESS 1 188
PA/PHILADELPHIA COUNTY/0107.00 98 30
LOANS ORIGINATED 5 6 5 71 93 389 417 193 576
APPS APPROVED, NOT ACCEPTED 2 1100 96
APPS DENIED 1 11 13 1 51 93 2 711 321 900 220
APPS WITHDRAWN 2 2 1100 261 13
FILES CLOSED FOR INCOMPLETENESS 1 115 150
PA/PHILADELPHIA COUNTY/0108.00 93 29
LOANS ORIGINATED 2 17 4 1 155 480 317 2877 49 1635 3055
APPS APPROVED, NOT ACCEPTED 2 2296 296
APPS DENIED 14 14 63 211 1000 320 322
APPS WITHDRAWN 1 6 2 31 186 133 526 90 148
FILES CLOSED FOR INCOMPLETENESS 1 99
PA/PHILADELPHIA COUNTY/0109.00 83 30
LOANS ORIGINATED 4 8 1 1 91 168 970 1683 6 427 2086
APPS APPROVED, NOT ACCEPTED 1 190 90
APPS DENIED 8 4938 18
APPS WITHDRAWN 2 4 1 53 326 238 559 154 660
FILES CLOSED FOR INCOMPLETENESS 2 1 1347 100 100
06/02/2014Report Date:
AGGREGATE TABLE 1: DISPOSITION OF LOAN APPLICATIONS, BY LOCATION OF PROPERTY AND TYPE OF LOAN, 2013
MSA/MD: 37964 - PHILADELPHIA, PA
Page 144 of 199
ALL LOANS ON PROPERTY LOCATED IN MSA/MD 3/
CENSUS TRACT OR COUNTY NAME ANDDISPOSITION OF APPLICATION 1/(STATE/COUNTY/TRACT NUMBER) FHA, FSA/RHS & VA Conventional
Refinancings Home ImprovementLoans
Loans on DwellingsFor 5 or More
Families
NonoccupantLoans From
Columns A, B, Cand D
Number Number Number Number Number Number$000's $000's $000's $000's $000's $000's
A B C D E F
Home Purchase Loans
Loans on 1- to 4-Family and Manufactured Home Dwellings
Loans OnManufactured Home
Dwellings FromColumns A, B, C & D
G
Number $000's
%MinPop4/
MedianIncome As
PCT ofMSA/MDMedian

PA/PHILADELPHIA COUNTY/0110.00 97 48
LOANS ORIGINATED 3 10 4 91 83 447 1199 620 1601
APPS APPROVED, NOT ACCEPTED 1 1387 89
APPS DENIED 1 10 13 52 138 315 738 695 231
APPS WITHDRAWN 6 4451 152
FILES CLOSED FOR INCOMPLETENESS
PA/PHILADELPHIA COUNTY/0111.00 98 33
LOANS ORIGINATED 2 9 3 14 349 57 524 35 90
APPS APPROVED, NOT ACCEPTED 1 74
APPS DENIED 1 11 25 91 97 48 619 326 265 1 3
APPS WITHDRAWN 2 1132 3
FILES CLOSED FOR INCOMPLETENESS 1 175
PA/PHILADELPHIA COUNTY/0112.00 99 38
LOANS ORIGINATED 25 10 67 528 1645 192 369
APPS APPROVED, NOT ACCEPTED 3 209
APPS DENIED 2 22 26 84 305 78 1323 271 267
APPS WITHDRAWN 4 11 93 270 18
FILES CLOSED FOR INCOMPLETENESS 1 10 3 12 171 29 535 85 40
PA/PHILADELPHIA COUNTY/0113.00 99 52
LOANS ORIGINATED 1 11 5 44 368 160 577 75 325
APPS APPROVED, NOT ACCEPTED 2 1141 62
APPS DENIED 26 23 61885 329 136
APPS WITHDRAWN 1 5 1 190 400 15 15
FILES CLOSED FOR INCOMPLETENESS
PA/PHILADELPHIA COUNTY/0114.00 98 53
LOANS ORIGINATED 6 45 12 1 1312 1755 788 4748 364 4200 1241
APPS APPROVED, NOT ACCEPTED 1 7 1 5109 433 10 327
APPS DENIED 2 37 28 1 47 849 89 3664 374 400 252
APPS WITHDRAWN 14 5 33 373 1389 236 328
FILES CLOSED FOR INCOMPLETENESS 13 3 11 130 1105 75 85
06/02/2014Report Date:
AGGREGATE TABLE 1: DISPOSITION OF LOAN APPLICATIONS, BY LOCATION OF PROPERTY AND TYPE OF LOAN, 2013
MSA/MD: 37964 - PHILADELPHIA, PA
Page 145 of 199
ALL LOANS ON PROPERTY LOCATED IN MSA/MD 3/
CENSUS TRACT OR COUNTY NAME ANDDISPOSITION OF APPLICATION 1/(STATE/COUNTY/TRACT NUMBER) FHA, FSA/RHS & VA Conventional
Refinancings Home ImprovementLoans
Loans on DwellingsFor 5 or More
Families
NonoccupantLoans From
Columns A, B, Cand D
Number Number Number Number Number Number$000's $000's $000's $000's $000's $000's
A B C D E F
Home Purchase Loans
Loans on 1- to 4-Family and Manufactured Home Dwellings
Loans OnManufactured Home
Dwellings FromColumns A, B, C & D
G
Number $000's
%MinPop4/
MedianIncome As
PCT ofMSA/MDMedian

PA/PHILADELPHIA COUNTY/0115.00 92 72
LOANS ORIGINATED 2 56 12 1016 1819 192 4644 772 1072
APPS APPROVED, NOT ACCEPTED 1 8 251 769 105
APPS DENIED 2 61 27 77 1042 92 5766 535 475
APPS WITHDRAWN 2 17 4 33 334 258 1734 101 219
FILES CLOSED FOR INCOMPLETENESS 10 11 221 933 23
PA/PHILADELPHIA COUNTY/0117.00 43 119
LOANS ORIGINATED 6 15 1 73 680 1087 2371 55 1117
APPS APPROVED, NOT ACCEPTED 2 5 11 220 193 902 143
APPS DENIED 15 2 22 539 4222 20 375
APPS WITHDRAWN 7 1844
FILES CLOSED FOR INCOMPLETENESS 3 1 1472 15 115
PA/PHILADELPHIA COUNTY/0118.00 97 79
LOANS ORIGINATED 6 47 9 816 1972 659 6111 144 1911
APPS APPROVED, NOT ACCEPTED 10 2 11 128 739 65 60
APPS DENIED 5 58 34 910 1198 435 5304 595 470 1 2
APPS WITHDRAWN 2 18 23 412 275 1724 217
FILES CLOSED FOR INCOMPLETENESS 2 6 1180 696 80
PA/PHILADELPHIA COUNTY/0119.00 98 62
LOANS ORIGINATED 4 41 6 58 922 347 3524 160 328
APPS APPROVED, NOT ACCEPTED 1 9 21 64 20 748 87
APPS DENIED 2 49 28 101 111 160 4266 428 986
APPS WITHDRAWN 2 12 2 33 348 160 1179 263 347
FILES CLOSED FOR INCOMPLETENESS 9 3 21 142 697 250 69
PA/PHILADELPHIA COUNTY/0120.00 63 79
LOANS ORIGINATED 4 13 3 33 805 805 2349 62 430
APPS APPROVED, NOT ACCEPTED 1 3 1 280 720 30 380
APPS DENIED 1 9 4 184 2144 122 84
APPS WITHDRAWN 1 2 1 1275 526 250 700
FILES CLOSED FOR INCOMPLETENESS 4 448
06/02/2014Report Date:
AGGREGATE TABLE 1: DISPOSITION OF LOAN APPLICATIONS, BY LOCATION OF PROPERTY AND TYPE OF LOAN, 2013
MSA/MD: 37964 - PHILADELPHIA, PA
Page 146 of 199
ALL LOANS ON PROPERTY LOCATED IN MSA/MD 3/
CENSUS TRACT OR COUNTY NAME ANDDISPOSITION OF APPLICATION 1/(STATE/COUNTY/TRACT NUMBER) FHA, FSA/RHS & VA Conventional
Refinancings Home ImprovementLoans
Loans on DwellingsFor 5 or More
Families
NonoccupantLoans From
Columns A, B, Cand D
Number Number Number Number Number Number$000's $000's $000's $000's $000's $000's
A B C D E F
Home Purchase Loans
Loans on 1- to 4-Family and Manufactured Home Dwellings
Loans OnManufactured Home
Dwellings FromColumns A, B, C & D
G
Number $000's
%MinPop4/
MedianIncome As
PCT ofMSA/MDMedian

PA/PHILADELPHIA COUNTY/0121.00 75 60
LOANS ORIGINATED 2 31 4 1 35 1067 249 3307 281 2681 466
APPS APPROVED, NOT ACCEPTED 5 419
APPS DENIED 1 15 7 12 547 126 1046 112 67
APPS WITHDRAWN 6 666
FILES CLOSED FOR INCOMPLETENESS 4 1400 74
PA/PHILADELPHIA COUNTY/0122.01 60 64
LOANS ORIGINATED 1 1 1133 27000 133
APPS APPROVED, NOT ACCEPTED
APPS DENIED 1 13 3
APPS WITHDRAWN
FILES CLOSED FOR INCOMPLETENESS
PA/PHILADELPHIA COUNTY/0122.03 60 45
LOANS ORIGINATED
APPS APPROVED, NOT ACCEPTED
APPS DENIED 1 1 1150 5 5
APPS WITHDRAWN
FILES CLOSED FOR INCOMPLETENESS
PA/PHILADELPHIA COUNTY/0122.04 75 68
LOANS ORIGINATED 7 50 2 149 1432 558 5788 55 1720
APPS APPROVED, NOT ACCEPTED 10 1324
APPS DENIED 3 45 4 94 627 205 5067 103 880
APPS WITHDRAWN 2 12 1 2173 1456 20 243
FILES CLOSED FOR INCOMPLETENESS 10 11 185 1426 155
PA/PHILADELPHIA COUNTY/0125.00 34 184
LOANS ORIGINATED 26 57 1 6 341 231 5939 13095 125 72506 7506
APPS APPROVED, NOT ACCEPTED 10 42637 1144
APPS DENIED 1 40 1 1 22410 8919 10 370 4139
APPS WITHDRAWN 2 12 1 1 71 142 669 2887 1878 380 3235
FILES CLOSED FOR INCOMPLETENESS 7 1 11870 15 298
06/02/2014Report Date:
AGGREGATE TABLE 1: DISPOSITION OF LOAN APPLICATIONS, BY LOCATION OF PROPERTY AND TYPE OF LOAN, 2013
MSA/MD: 37964 - PHILADELPHIA, PA
Page 147 of 199
ALL LOANS ON PROPERTY LOCATED IN MSA/MD 3/
CENSUS TRACT OR COUNTY NAME ANDDISPOSITION OF APPLICATION 1/(STATE/COUNTY/TRACT NUMBER) FHA, FSA/RHS & VA Conventional
Refinancings Home ImprovementLoans
Loans on DwellingsFor 5 or More
Families
NonoccupantLoans From
Columns A, B, Cand D
Number Number Number Number Number Number$000's $000's $000's $000's $000's $000's
A B C D E F
Home Purchase Loans
Loans on 1- to 4-Family and Manufactured Home Dwellings
Loans OnManufactured Home
Dwellings FromColumns A, B, C & D
G
Number $000's
%MinPop4/
MedianIncome As
PCT ofMSA/MDMedian

PA/PHILADELPHIA COUNTY/0131.00 83 36
LOANS ORIGINATED 6 26 1 171460 3924 40 2850
APPS APPROVED, NOT ACCEPTED 2 1222 96
APPS DENIED 7 3 41639 51 798
APPS WITHDRAWN 5 31 109 1198 305
FILES CLOSED FOR INCOMPLETENESS 4 2478 270
PA/PHILADELPHIA COUNTY/0132.00 92 46
LOANS ORIGINATED 16 17 2 1 113927 3236 83 5334 2933
APPS APPROVED, NOT ACCEPTED 2 1 1 2282 308 305 282
APPS DENIED 10 5 2750 153 135
APPS WITHDRAWN 2 1392 245
FILES CLOSED FOR INCOMPLETENESS 2 1 1493 350 330
PA/PHILADELPHIA COUNTY/0133.00 53 88
LOANS ORIGINATED 33 34 3 2 175 1896 9430 8703 1148 4935 4767
APPS APPROVED, NOT ACCEPTED 1 3 1520 1711 219
APPS DENIED 4 6 4 5 21470 1439 38 10748 420
APPS WITHDRAWN 4 5 1 2760 941 6000 285
FILES CLOSED FOR INCOMPLETENESS 4 1412
PA/PHILADELPHIA COUNTY/0134.01 10 160
LOANS ORIGINATED 49 57 5 1 141 154 14534 14258 597 375 3419
APPS APPROVED, NOT ACCEPTED 2 2 1 1772 535 50 160
APPS DENIED 4 31 2 101024 8024 750 2218
APPS WITHDRAWN 2 9 3 3881 2349 570 913
FILES CLOSED FOR INCOMPLETENESS 2 7 2 2355 1230 703 695
PA/PHILADELPHIA COUNTY/0134.02 29 175
LOANS ORIGINATED 34 70 5 2 329497 19157 1265 1535 7341
APPS APPROVED, NOT ACCEPTED 2 5 3332 1433 645
APPS DENIED 3 23 3 8433 5345 112 2072
APPS WITHDRAWN 6 10 2 42377 2747 467 1154
FILES CLOSED FOR INCOMPLETENESS 6 21205 433
06/02/2014Report Date:
AGGREGATE TABLE 1: DISPOSITION OF LOAN APPLICATIONS, BY LOCATION OF PROPERTY AND TYPE OF LOAN, 2013
MSA/MD: 37964 - PHILADELPHIA, PA
Page 148 of 199
ALL LOANS ON PROPERTY LOCATED IN MSA/MD 3/
CENSUS TRACT OR COUNTY NAME ANDDISPOSITION OF APPLICATION 1/(STATE/COUNTY/TRACT NUMBER) FHA, FSA/RHS & VA Conventional
Refinancings Home ImprovementLoans
Loans on DwellingsFor 5 or More
Families
NonoccupantLoans From
Columns A, B, Cand D
Number Number Number Number Number Number$000's $000's $000's $000's $000's $000's
A B C D E F
Home Purchase Loans
Loans on 1- to 4-Family and Manufactured Home Dwellings
Loans OnManufactured Home
Dwellings FromColumns A, B, C & D
G
Number $000's
%MinPop4/
MedianIncome As
PCT ofMSA/MDMedian

PA/PHILADELPHIA COUNTY/0135.00 51 80
LOANS ORIGINATED 66 68 7 6 205 1787 20929 16012 120 9291 5185
APPS APPROVED, NOT ACCEPTED 4 5 1 4953 1244 100 830
APPS DENIED 10 22 6 1 132613 3960 151 401 2762
APPS WITHDRAWN 10 15 31 236 2887 4014 798
FILES CLOSED FOR INCOMPLETENESS 1 4 1397 738 25
PA/PHILADELPHIA COUNTY/0136.01 13 183
LOANS ORIGINATED 66 116 1 1 453 1005 19173 23654 15 300 8679
APPS APPROVED, NOT ACCEPTED 7 18 61937 3732 1181
APPS DENIED 7 35 3 141 118 1898 7524 180 2363
APPS WITHDRAWN 7 18 81710 2985 1266
FILES CLOSED FOR INCOMPLETENESS 3 11 1 3685 2296 381 761
PA/PHILADELPHIA COUNTY/0136.02 17 148
LOANS ORIGINATED 65 135 7 406 1615 19202 30599 499 8768
APPS APPROVED, NOT ACCEPTED 5 11 3 81 314 1531 2123 184 1648
APPS DENIED 7 41 6 131 275 2399 8327 150 2812
APPS WITHDRAWN 10 23 1 102870 4988 50 2038
FILES CLOSED FOR INCOMPLETENESS 2 7 1686 1492 212
PA/PHILADELPHIA COUNTY/0137.00 84 24
LOANS ORIGINATED 29 70 10 1 4013 2820 6152 15473 395 1066 10411
APPS APPROVED, NOT ACCEPTED 4 2 1 3411 178 492 163
APPS DENIED 3 36 15 191 320 386 4783 404 1836 1 2
APPS WITHDRAWN 5 12 3 2 53 447 1010 2650 392 2056 1095
FILES CLOSED FOR INCOMPLETENESS 7 21801 464
PA/PHILADELPHIA COUNTY/0138.00 94 35
LOANS ORIGINATED 2 13 8 2 81 127 260 1510 848 3775 1323
APPS APPROVED, NOT ACCEPTED
APPS DENIED 1 6 7 3109 825 136 179
APPS WITHDRAWN 1 3 1 2238 422 275 525
FILES CLOSED FOR INCOMPLETENESS 1 22
06/02/2014Report Date:
AGGREGATE TABLE 1: DISPOSITION OF LOAN APPLICATIONS, BY LOCATION OF PROPERTY AND TYPE OF LOAN, 2013
MSA/MD: 37964 - PHILADELPHIA, PA
Page 149 of 199
ALL LOANS ON PROPERTY LOCATED IN MSA/MD 3/
CENSUS TRACT OR COUNTY NAME ANDDISPOSITION OF APPLICATION 1/(STATE/COUNTY/TRACT NUMBER) FHA, FSA/RHS & VA Conventional
Refinancings Home ImprovementLoans
Loans on DwellingsFor 5 or More
Families
NonoccupantLoans From
Columns A, B, Cand D
Number Number Number Number Number Number$000's $000's $000's $000's $000's $000's
A B C D E F
Home Purchase Loans
Loans on 1- to 4-Family and Manufactured Home Dwellings
Loans OnManufactured Home
Dwellings FromColumns A, B, C & D
G
Number $000's
%MinPop4/
MedianIncome As
PCT ofMSA/MDMedian

PA/PHILADELPHIA COUNTY/0139.00 89 18
LOANS ORIGINATED 7 11 1 1 51 253 2126 2221 60 2100 1206
APPS APPROVED, NOT ACCEPTED 1 197
APPS DENIED 7 5 31018 100 285
APPS WITHDRAWN 1 5 280 611 221 1 25
FILES CLOSED FOR INCOMPLETENESS 2 255
PA/PHILADELPHIA COUNTY/0140.00 87 33
LOANS ORIGINATED 17 15 3 5 195 1298 5109 3019 43 7722 5122
APPS APPROVED, NOT ACCEPTED 2 2 1 1 4133 425 5 2300 558
APPS DENIED 1 15 8 1 52 767 240 2541 459 278 1076
APPS WITHDRAWN 2 3 1 1 3623 577 70 807 831
FILES CLOSED FOR INCOMPLETENESS 1 2 2325 879 879
PA/PHILADELPHIA COUNTY/0141.00 91 42
LOANS ORIGINATED 5 12 1 2 31391 1537 6 1800 508
APPS APPROVED, NOT ACCEPTED 4 1 1523 3 150
APPS DENIED 3 11 7 5452 2047 143 1015
APPS WITHDRAWN 4 2735 312
FILES CLOSED FOR INCOMPLETENESS 1 100
PA/PHILADELPHIA COUNTY/0142.00 26 98
LOANS ORIGINATED 98 136 10 5 781 415 32662 37581 1411 53145 23894
APPS APPROVED, NOT ACCEPTED 4 18 1 91 79 970 5847 25 2728
APPS DENIED 17 58 6 191 424 5409 14543 540 4388
APPS WITHDRAWN 17 23 151 396 5511 7582 5282
FILES CLOSED FOR INCOMPLETENESS 7 12 41 424 2170 3984 1771
PA/PHILADELPHIA COUNTY/0143.00 17 91
LOANS ORIGINATED 25 40 3 3 123 738 5739 7499 500 1465 2094
APPS APPROVED, NOT ACCEPTED 2 7 13 600 548 1360 129
APPS DENIED 2 12 2 12 431 609 1563 20 131
APPS WITHDRAWN 5 8 41116 1252 583
FILES CLOSED FOR INCOMPLETENESS 1 5 1 1350 1079 10 79
06/02/2014Report Date:
AGGREGATE TABLE 1: DISPOSITION OF LOAN APPLICATIONS, BY LOCATION OF PROPERTY AND TYPE OF LOAN, 2013
MSA/MD: 37964 - PHILADELPHIA, PA
Page 150 of 199
ALL LOANS ON PROPERTY LOCATED IN MSA/MD 3/
CENSUS TRACT OR COUNTY NAME ANDDISPOSITION OF APPLICATION 1/(STATE/COUNTY/TRACT NUMBER) FHA, FSA/RHS & VA Conventional
Refinancings Home ImprovementLoans
Loans on DwellingsFor 5 or More
Families
NonoccupantLoans From
Columns A, B, Cand D
Number Number Number Number Number Number$000's $000's $000's $000's $000's $000's
A B C D E F
Home Purchase Loans
Loans on 1- to 4-Family and Manufactured Home Dwellings
Loans OnManufactured Home
Dwellings FromColumns A, B, C & D
G
Number $000's
%MinPop4/
MedianIncome As
PCT ofMSA/MDMedian

PA/PHILADELPHIA COUNTY/0144.00 58 36
LOANS ORIGINATED 35 38 7 258 2219 8230 6165 631 4068
APPS APPROVED, NOT ACCEPTED 2 6 2639 1136 130
APPS DENIED 8 17 4 22 481 1750 2901 52 155
APPS WITHDRAWN 5 11 2 41 226 741 2035 130 249
FILES CLOSED FOR INCOMPLETENESS 5 710
PA/PHILADELPHIA COUNTY/0145.00 81 29
LOANS ORIGINATED 101 137 895
APPS APPROVED, NOT ACCEPTED 2 204
APPS DENIED 7 1772 131
APPS WITHDRAWN 1 177 77
FILES CLOSED FOR INCOMPLETENESS
PA/PHILADELPHIA COUNTY/0146.00 62 51
LOANS ORIGINATED 6 13 8 62 159 723 1400 103 688
APPS APPROVED, NOT ACCEPTED 11 108 146
APPS DENIED 1 14 3 253 1374 95 209
APPS WITHDRAWN 2 7 1229 708 132
FILES CLOSED FOR INCOMPLETENESS 2 372
PA/PHILADELPHIA COUNTY/0147.00 56 37
LOANS ORIGINATED 14 15 1 4 241 216 4942 5470 50 1707 9834
APPS APPROVED, NOT ACCEPTED 1 2 1 3311 522 7 833
APPS DENIED 1 3 4 45 1402 501 254 23 755
APPS WITHDRAWN 2 11 339 264 161
FILES CLOSED FOR INCOMPLETENESS 1 35
PA/PHILADELPHIA COUNTY/0148.00 98 65
LOANS ORIGINATED 2 4 1 42 376 829 742 2 1222
APPS APPROVED, NOT ACCEPTED 1 119
APPS DENIED 2 7 2 2436 509 30 501
APPS WITHDRAWN 2 229
FILES CLOSED FOR INCOMPLETENESS
06/02/2014Report Date:
AGGREGATE TABLE 1: DISPOSITION OF LOAN APPLICATIONS, BY LOCATION OF PROPERTY AND TYPE OF LOAN, 2013
MSA/MD: 37964 - PHILADELPHIA, PA
Page 151 of 199
ALL LOANS ON PROPERTY LOCATED IN MSA/MD 3/
CENSUS TRACT OR COUNTY NAME ANDDISPOSITION OF APPLICATION 1/(STATE/COUNTY/TRACT NUMBER) FHA, FSA/RHS & VA Conventional
Refinancings Home ImprovementLoans
Loans on DwellingsFor 5 or More
Families
NonoccupantLoans From
Columns A, B, Cand D
Number Number Number Number Number Number$000's $000's $000's $000's $000's $000's
A B C D E F
Home Purchase Loans
Loans on 1- to 4-Family and Manufactured Home Dwellings
Loans OnManufactured Home
Dwellings FromColumns A, B, C & D
G
Number $000's
%MinPop4/
MedianIncome As
PCT ofMSA/MDMedian

PA/PHILADELPHIA COUNTY/0149.00 99 40
LOANS ORIGINATED 2 10 7 1 53 284 157 695 510 400 720
APPS APPROVED, NOT ACCEPTED 3 338
APPS DENIED 1 17 25 1240 1185 337 453
APPS WITHDRAWN 3 1 1217 20 88
FILES CLOSED FOR INCOMPLETENESS 51 123 312
PA/PHILADELPHIA COUNTY/0151.01 99 54
LOANS ORIGINATED 3 1 1 13 349 273 25 791 140
APPS APPROVED, NOT ACCEPTED
APPS DENIED 2 4 10 1165 198 130 20
APPS WITHDRAWN 2 284
FILES CLOSED FOR INCOMPLETENESS 1 95
PA/PHILADELPHIA COUNTY/0151.02 100 13
LOANS ORIGINATED 4 6 2 13 260 326 229 35 30
APPS APPROVED, NOT ACCEPTED
APPS DENIED 3 10 22 42 138 246 564 326 76
APPS WITHDRAWN 1 4 1 220 431 12 346
FILES CLOSED FOR INCOMPLETENESS 4 1 2291 20 217
PA/PHILADELPHIA COUNTY/0152.00 98 25
LOANS ORIGINATED 3 9 5 1 71 75 399 1353 93 397 1381
APPS APPROVED, NOT ACCEPTED 3 205
APPS DENIED 1 10 15 1 62 150 67 1206 249 150 676 3 9
APPS WITHDRAWN 1 5 2157 569 432
FILES CLOSED FOR INCOMPLETENESS 1 4 2214 255 274
PA/PHILADELPHIA COUNTY/0153.00 55 26
LOANS ORIGINATED 29 25 10 6 553 850 7047 8915 2539 11509 17751
APPS APPROVED, NOT ACCEPTED
APPS DENIED 4 6 14 81 535 858 844 241 1535
APPS WITHDRAWN 6 2 2 81610 407 362 2092
FILES CLOSED FOR INCOMPLETENESS 2 5 5478 579 778
06/02/2014Report Date:
AGGREGATE TABLE 1: DISPOSITION OF LOAN APPLICATIONS, BY LOCATION OF PROPERTY AND TYPE OF LOAN, 2013
MSA/MD: 37964 - PHILADELPHIA, PA
Page 152 of 199
ALL LOANS ON PROPERTY LOCATED IN MSA/MD 3/
CENSUS TRACT OR COUNTY NAME ANDDISPOSITION OF APPLICATION 1/(STATE/COUNTY/TRACT NUMBER) FHA, FSA/RHS & VA Conventional
Refinancings Home ImprovementLoans
Loans on DwellingsFor 5 or More
Families
NonoccupantLoans From
Columns A, B, Cand D
Number Number Number Number Number Number$000's $000's $000's $000's $000's $000's
A B C D E F
Home Purchase Loans
Loans on 1- to 4-Family and Manufactured Home Dwellings
Loans OnManufactured Home
Dwellings FromColumns A, B, C & D
G
Number $000's
%MinPop4/
MedianIncome As
PCT ofMSA/MDMedian

PA/PHILADELPHIA COUNTY/0156.00 88 36
LOANS ORIGINATED 2 11 4 1 61 174 258 1108 58 2888 786
APPS APPROVED, NOT ACCEPTED
APPS DENIED 2 7 4 41 79 110 500 60 238
APPS WITHDRAWN 1 3 160 338 60
FILES CLOSED FOR INCOMPLETENESS 2 1274 120
PA/PHILADELPHIA COUNTY/0157.00 69 43
LOANS ORIGINATED 9 20 6 1 74 681 1669 2209 215 3363 1051
APPS APPROVED, NOT ACCEPTED 1 8 3 2180 792 390 305
APPS DENIED 6 15 9 3414 1112 208 135
APPS WITHDRAWN 2 7 1 31 105 454 687 160 518
FILES CLOSED FOR INCOMPLETENESS 5 2422 318
PA/PHILADELPHIA COUNTY/0158.00 11 77
LOANS ORIGINATED 108 130 33 5332 7302 25905 24022 2205 10317 1 25
APPS APPROVED, NOT ACCEPTED 2 9 31 285 286 1468 354
APPS DENIED 10 54 27 175 1384 2267 9241 1230 3026
APPS WITHDRAWN 18 32 1 151 225 3580 5118 10 2141
FILES CLOSED FOR INCOMPLETENESS 7 15 2 42 438 1533 3166 89 846
PA/PHILADELPHIA COUNTY/0160.00 13 68
LOANS ORIGINATED 100 149 26 1 6446 9632 17784 20832 1176 950 7909
APPS APPROVED, NOT ACCEPTED 7 18 2 72 523 1458 2518 40 832
APPS DENIED 5 34 39 2 149 1423 706 4080 1238 864 1613
APPS WITHDRAWN 11 24 3 1 87 1322 2015 3387 162 850 938
FILES CLOSED FOR INCOMPLETENESS 1 19 1 61 247 30 2171 15 672
PA/PHILADELPHIA COUNTY/0161.00 58 37
LOANS ORIGINATED 62 45 15 1 3624 4825 12292 6296 1227 605 5980
APPS APPROVED, NOT ACCEPTED 2 10 4593 1529 678
APPS DENIED 9 34 14 107 1335 1322 4173 302 1057
APPS WITHDRAWN 5 16 91 65 687 3106 1292
FILES CLOSED FOR INCOMPLETENESS 1 8 698 1307 1142
06/02/2014Report Date:
AGGREGATE TABLE 1: DISPOSITION OF LOAN APPLICATIONS, BY LOCATION OF PROPERTY AND TYPE OF LOAN, 2013
MSA/MD: 37964 - PHILADELPHIA, PA
Page 153 of 199
ALL LOANS ON PROPERTY LOCATED IN MSA/MD 3/
CENSUS TRACT OR COUNTY NAME ANDDISPOSITION OF APPLICATION 1/(STATE/COUNTY/TRACT NUMBER) FHA, FSA/RHS & VA Conventional
Refinancings Home ImprovementLoans
Loans on DwellingsFor 5 or More
Families
NonoccupantLoans From
Columns A, B, Cand D
Number Number Number Number Number Number$000's $000's $000's $000's $000's $000's
A B C D E F
Home Purchase Loans
Loans on 1- to 4-Family and Manufactured Home Dwellings
Loans OnManufactured Home
Dwellings FromColumns A, B, C & D
G
Number $000's
%MinPop4/
MedianIncome As
PCT ofMSA/MDMedian

PA/PHILADELPHIA COUNTY/0162.00 96 27
LOANS ORIGINATED 5 1 2 21 59 536 67 146 311
APPS APPROVED, NOT ACCEPTED 1 58
APPS DENIED 1 9 375 234 63
APPS WITHDRAWN 1 1104 102
FILES CLOSED FOR INCOMPLETENESS 1 25
PA/PHILADELPHIA COUNTY/0163.00 95 21
LOANS ORIGINATED 3 1 7 15 365 258 280 156 280
APPS APPROVED, NOT ACCEPTED 1 3
APPS DENIED 1 9 11 1100 461 145 1 1 3
APPS WITHDRAWN 31 108 509
FILES CLOSED FOR INCOMPLETENESS 2 171
PA/PHILADELPHIA COUNTY/0164.00 99 26
LOANS ORIGINATED 2 6 1 11 54 88 37 250 15
APPS APPROVED, NOT ACCEPTED
APPS DENIED 9 22 6552 210 308
APPS WITHDRAWN 1 2 130 118 78
FILES CLOSED FOR INCOMPLETENESS
PA/PHILADELPHIA COUNTY/0165.00 98 24
LOANS ORIGINATED 2 43 212 53 92
APPS APPROVED, NOT ACCEPTED
APPS DENIED 1 3 16 350 121 74 131
APPS WITHDRAWN 1 25
FILES CLOSED FOR INCOMPLETENESS 1 132 32
PA/PHILADELPHIA COUNTY/0166.00 86 30
LOANS ORIGINATED 9 4 4 2 121 378 2009 370 258 1538 2099
APPS APPROVED, NOT ACCEPTED 2 21108 1108
APPS DENIED 2 2 6 5340 186 126 293 1 2
APPS WITHDRAWN 1 3 1168 245 168
FILES CLOSED FOR INCOMPLETENESS 1 15
06/02/2014Report Date:
AGGREGATE TABLE 1: DISPOSITION OF LOAN APPLICATIONS, BY LOCATION OF PROPERTY AND TYPE OF LOAN, 2013
MSA/MD: 37964 - PHILADELPHIA, PA
Page 154 of 199
ALL LOANS ON PROPERTY LOCATED IN MSA/MD 3/
CENSUS TRACT OR COUNTY NAME ANDDISPOSITION OF APPLICATION 1/(STATE/COUNTY/TRACT NUMBER) FHA, FSA/RHS & VA Conventional
Refinancings Home ImprovementLoans
Loans on DwellingsFor 5 or More
Families
NonoccupantLoans From
Columns A, B, Cand D
Number Number Number Number Number Number$000's $000's $000's $000's $000's $000's
A B C D E F
Home Purchase Loans
Loans on 1- to 4-Family and Manufactured Home Dwellings
Loans OnManufactured Home
Dwellings FromColumns A, B, C & D
G
Number $000's
%MinPop4/
MedianIncome As
PCT ofMSA/MDMedian

PA/PHILADELPHIA COUNTY/0167.01 98 49
LOANS ORIGINATED 5 3 1473 10 270
APPS APPROVED, NOT ACCEPTED 1 1101 101
APPS DENIED 8 11 4817 411 460
APPS WITHDRAWN
FILES CLOSED FOR INCOMPLETENESS 1 60
PA/PHILADELPHIA COUNTY/0167.02 94 34
LOANS ORIGINATED 4 4 5 1 62 281 428 1110 119 373 1038
APPS APPROVED, NOT ACCEPTED 1 72
APPS DENIED 3 4 23 81 139 293 260 252 336 1 3
APPS WITHDRAWN 1 3 1 272 153 15 105
FILES CLOSED FOR INCOMPLETENESS 1 2 272 82 144
PA/PHILADELPHIA COUNTY/0168.00 99 46
LOANS ORIGINATED 2 9 4 42 112 75 305 60 138
APPS APPROVED, NOT ACCEPTED 1 61
APPS DENIED 5 19 3337 195 81
APPS WITHDRAWN 21 61 155
FILES CLOSED FOR INCOMPLETENESS 2 1149 53
PA/PHILADELPHIA COUNTY/0169.01 99 33
LOANS ORIGINATED 6 187
APPS APPROVED, NOT ACCEPTED
APPS DENIED 3 6 23 10216 355 299 378
APPS WITHDRAWN 1 162 31
FILES CLOSED FOR INCOMPLETENESS 2 152 25
PA/PHILADELPHIA COUNTY/0169.02 100 40
LOANS ORIGINATED 1 12 6 51 99 39 1059 115 811
APPS APPROVED, NOT ACCEPTED 1 77
APPS DENIED 9 21 4499 385 115
APPS WITHDRAWN 1 3 1 268 406 43 228
FILES CLOSED FOR INCOMPLETENESS 1 1100 100
06/02/2014Report Date:
AGGREGATE TABLE 1: DISPOSITION OF LOAN APPLICATIONS, BY LOCATION OF PROPERTY AND TYPE OF LOAN, 2013
MSA/MD: 37964 - PHILADELPHIA, PA
Page 155 of 199
ALL LOANS ON PROPERTY LOCATED IN MSA/MD 3/
CENSUS TRACT OR COUNTY NAME ANDDISPOSITION OF APPLICATION 1/(STATE/COUNTY/TRACT NUMBER) FHA, FSA/RHS & VA Conventional
Refinancings Home ImprovementLoans
Loans on DwellingsFor 5 or More
Families
NonoccupantLoans From
Columns A, B, Cand D
Number Number Number Number Number Number$000's $000's $000's $000's $000's $000's
A B C D E F
Home Purchase Loans
Loans on 1- to 4-Family and Manufactured Home Dwellings
Loans OnManufactured Home
Dwellings FromColumns A, B, C & D
G
Number $000's
%MinPop4/
MedianIncome As
PCT ofMSA/MDMedian
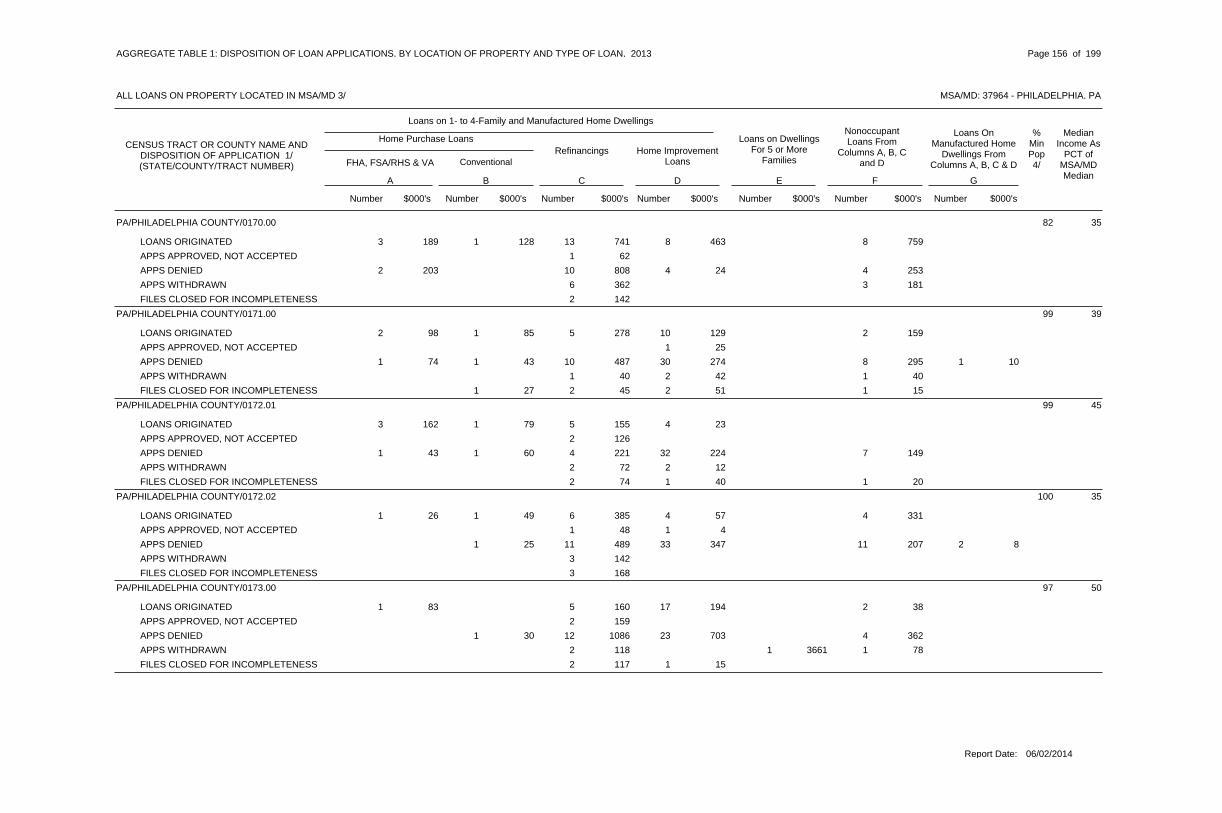
PA/PHILADELPHIA COUNTY/0170.00 82 35
LOANS ORIGINATED 1 13 8 83 189 128 741 463 759
APPS APPROVED, NOT ACCEPTED 1 62
APPS DENIED 10 4 42 203 808 24 253
APPS WITHDRAWN 6 3362 181
FILES CLOSED FOR INCOMPLETENESS 2 142
PA/PHILADELPHIA COUNTY/0171.00 99 39
LOANS ORIGINATED 1 5 10 22 98 85 278 129 159
APPS APPROVED, NOT ACCEPTED 1 25
APPS DENIED 1 10 30 81 74 43 487 274 295 1 10
APPS WITHDRAWN 1 2 140 42 40
FILES CLOSED FOR INCOMPLETENESS 1 2 2 127 45 51 15
PA/PHILADELPHIA COUNTY/0172.01 99 45
LOANS ORIGINATED 1 5 43 162 79 155 23
APPS APPROVED, NOT ACCEPTED 2 126
APPS DENIED 1 4 32 71 43 60 221 224 149
APPS WITHDRAWN 2 272 12
FILES CLOSED FOR INCOMPLETENESS 2 1 174 40 20
PA/PHILADELPHIA COUNTY/0172.02 100 35
LOANS ORIGINATED 1 6 4 41 26 49 385 57 331
APPS APPROVED, NOT ACCEPTED 1 148 4
APPS DENIED 1 11 33 1125 489 347 207 2 8
APPS WITHDRAWN 3 142
FILES CLOSED FOR INCOMPLETENESS 3 168
PA/PHILADELPHIA COUNTY/0173.00 97 50
LOANS ORIGINATED 5 17 21 83 160 194 38
APPS APPROVED, NOT ACCEPTED 2 159
APPS DENIED 1 12 23 430 1086 703 362
APPS WITHDRAWN 2 1 1118 3661 78
FILES CLOSED FOR INCOMPLETENESS 2 1117 15
06/02/2014Report Date:
AGGREGATE TABLE 1: DISPOSITION OF LOAN APPLICATIONS, BY LOCATION OF PROPERTY AND TYPE OF LOAN, 2013
MSA/MD: 37964 - PHILADELPHIA, PA
Page 156 of 199
ALL LOANS ON PROPERTY LOCATED IN MSA/MD 3/
CENSUS TRACT OR COUNTY NAME ANDDISPOSITION OF APPLICATION 1/(STATE/COUNTY/TRACT NUMBER) FHA, FSA/RHS & VA Conventional
Refinancings Home ImprovementLoans
Loans on DwellingsFor 5 or More
Families
NonoccupantLoans From
Columns A, B, Cand D
Number Number Number Number Number Number$000's $000's $000's $000's $000's $000's
A B C D E F
Home Purchase Loans
Loans on 1- to 4-Family and Manufactured Home Dwellings
Loans OnManufactured Home
Dwellings FromColumns A, B, C & D
G
Number $000's
%MinPop4/
MedianIncome As
PCT ofMSA/MDMedian

PA/PHILADELPHIA COUNTY/0174.00 99 30
LOANS ORIGINATED 2 11 44 77 35
APPS APPROVED, NOT ACCEPTED 1 1 144 8 44
APPS DENIED 7 12310 110
APPS WITHDRAWN
FILES CLOSED FOR INCOMPLETENESS 1 155 12
PA/PHILADELPHIA COUNTY/0175.00 99 19
LOANS ORIGINATED 3 8 5 43 829 169 619 48 486
APPS APPROVED, NOT ACCEPTED 2 2 2255 22 255
APPS DENIED 3 10 56 81 72 105 381 512 137 2 19
APPS WITHDRAWN 2 1 198 15 38
FILES CLOSED FOR INCOMPLETENESS 1 30
PA/PHILADELPHIA COUNTY/0176.01 98 21
LOANS ORIGINATED 2 2 1 177 5 6613 32
APPS APPROVED, NOT ACCEPTED 11 46 59
APPS DENIED 1 6 14 71 39 35 161 223 156
APPS WITHDRAWN
FILES CLOSED FOR INCOMPLETENESS 1 125 25
PA/PHILADELPHIA COUNTY/0176.02 96 28
LOANS ORIGINATED 4 7 11 55 154 66 5
APPS APPROVED, NOT ACCEPTED
APPS DENIED 1 6 20 130 219 372 2
APPS WITHDRAWN 1 6
FILES CLOSED FOR INCOMPLETENESS 1 120 65
PA/PHILADELPHIA COUNTY/0177.01 92 22
LOANS ORIGINATED 3 9 1 113 172 525 664 20 1141
APPS APPROVED, NOT ACCEPTED 1 143 43
APPS DENIED 2 8 14 72 131 186 512 147 385
APPS WITHDRAWN 4 1 3181 70 187
FILES CLOSED FOR INCOMPLETENESS 1 19
06/02/2014Report Date:
AGGREGATE TABLE 1: DISPOSITION OF LOAN APPLICATIONS, BY LOCATION OF PROPERTY AND TYPE OF LOAN, 2013
MSA/MD: 37964 - PHILADELPHIA, PA
Page 157 of 199
ALL LOANS ON PROPERTY LOCATED IN MSA/MD 3/
CENSUS TRACT OR COUNTY NAME ANDDISPOSITION OF APPLICATION 1/(STATE/COUNTY/TRACT NUMBER) FHA, FSA/RHS & VA Conventional
Refinancings Home ImprovementLoans
Loans on DwellingsFor 5 or More
Families
NonoccupantLoans From
Columns A, B, Cand D
Number Number Number Number Number Number$000's $000's $000's $000's $000's $000's
A B C D E F
Home Purchase Loans
Loans on 1- to 4-Family and Manufactured Home Dwellings
Loans OnManufactured Home
Dwellings FromColumns A, B, C & D
G
Number $000's
%MinPop4/
MedianIncome As
PCT ofMSA/MDMedian
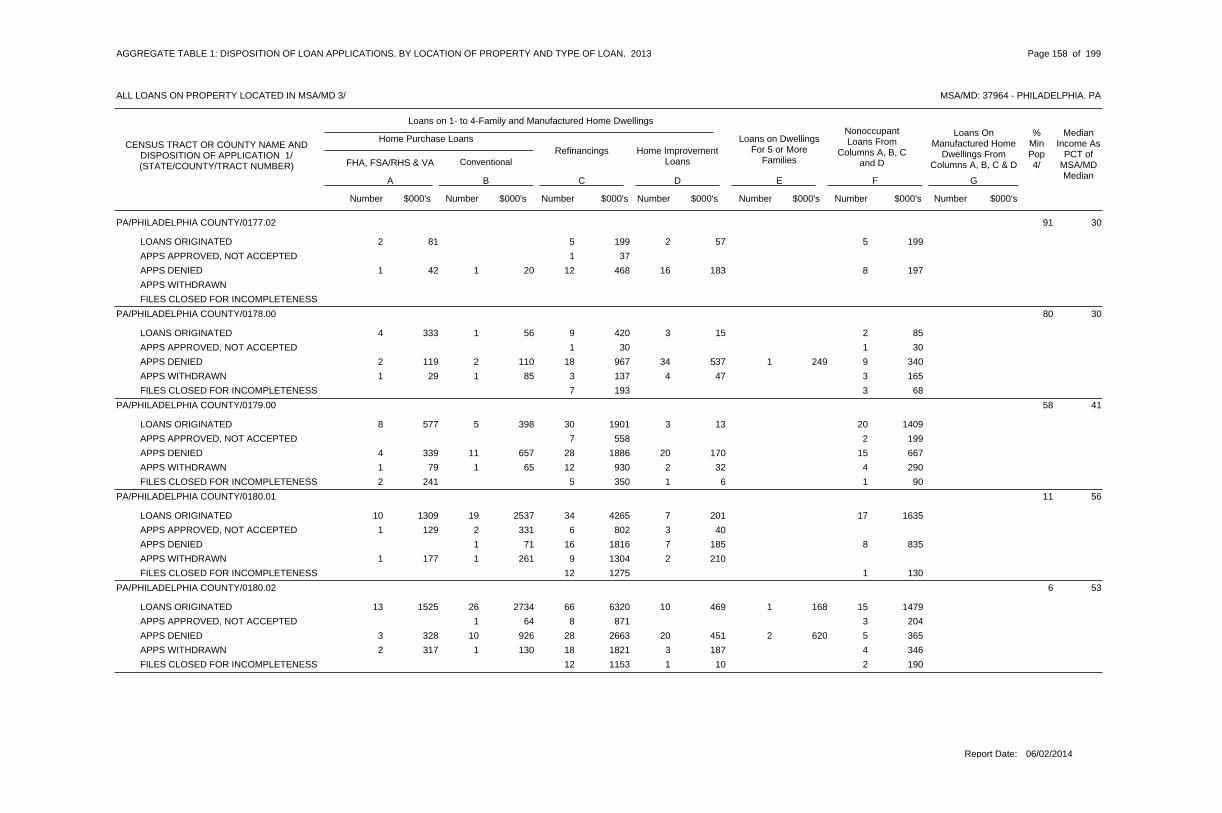
PA/PHILADELPHIA COUNTY/0177.02 91 30
LOANS ORIGINATED 5 2 52 81 199 57 199
APPS APPROVED, NOT ACCEPTED 1 37
APPS DENIED 1 12 16 81 42 20 468 183 197
APPS WITHDRAWN
FILES CLOSED FOR INCOMPLETENESS
PA/PHILADELPHIA COUNTY/0178.00 80 30
LOANS ORIGINATED 1 9 3 24 333 56 420 15 85
APPS APPROVED, NOT ACCEPTED 1 130 30
APPS DENIED 2 18 34 1 92 119 110 967 537 249 340
APPS WITHDRAWN 1 3 4 31 29 85 137 47 165
FILES CLOSED FOR INCOMPLETENESS 7 3193 68
PA/PHILADELPHIA COUNTY/0179.00 58 41
LOANS ORIGINATED 5 30 3 208 577 398 1901 13 1409
APPS APPROVED, NOT ACCEPTED 7 2558 199
APPS DENIED 11 28 20 154 339 657 1886 170 667
APPS WITHDRAWN 1 12 2 41 79 65 930 32 290
FILES CLOSED FOR INCOMPLETENESS 5 1 12 241 350 6 90
PA/PHILADELPHIA COUNTY/0180.01 11 56
LOANS ORIGINATED 19 34 7 1710 1309 2537 4265 201 1635
APPS APPROVED, NOT ACCEPTED 2 6 31 129 331 802 40
APPS DENIED 1 16 7 871 1816 185 835
APPS WITHDRAWN 1 9 21 177 261 1304 210
FILES CLOSED FOR INCOMPLETENESS 12 11275 130
PA/PHILADELPHIA COUNTY/0180.02 6 53
LOANS ORIGINATED 26 66 10 1 1513 1525 2734 6320 469 168 1479
APPS APPROVED, NOT ACCEPTED 1 8 364 871 204
APPS DENIED 10 28 20 2 53 328 926 2663 451 620 365
APPS WITHDRAWN 1 18 3 42 317 130 1821 187 346
FILES CLOSED FOR INCOMPLETENESS 12 1 21153 10 190
06/02/2014Report Date:
AGGREGATE TABLE 1: DISPOSITION OF LOAN APPLICATIONS, BY LOCATION OF PROPERTY AND TYPE OF LOAN, 2013
MSA/MD: 37964 - PHILADELPHIA, PA
Page 158 of 199
ALL LOANS ON PROPERTY LOCATED IN MSA/MD 3/
CENSUS TRACT OR COUNTY NAME ANDDISPOSITION OF APPLICATION 1/(STATE/COUNTY/TRACT NUMBER) FHA, FSA/RHS & VA Conventional
Refinancings Home ImprovementLoans
Loans on DwellingsFor 5 or More
Families
NonoccupantLoans From
Columns A, B, Cand D
Number Number Number Number Number Number$000's $000's $000's $000's $000's $000's
A B C D E F
Home Purchase Loans
Loans on 1- to 4-Family and Manufactured Home Dwellings
Loans OnManufactured Home
Dwellings FromColumns A, B, C & D
G
Number $000's
%MinPop4/
MedianIncome As
PCT ofMSA/MDMedian

PA/PHILADELPHIA COUNTY/0183.00 4 62
LOANS ORIGINATED 15 62 16 914 1874 1753 6362 575 863
APPS APPROVED, NOT ACCEPTED 1 5 2100 503 99
APPS DENIED 7 39 12 44 655 825 3837 403 321 1 2
APPS WITHDRAWN 2 15 21 226 191 1741 45
FILES CLOSED FOR INCOMPLETENESS 1 11 1 11 81 76 1377 40 76
PA/PHILADELPHIA COUNTY/0184.00 7 63
LOANS ORIGINATED 16 41 6 811 1715 1894 4233 324 676
APPS APPROVED, NOT ACCEPTED 2 3296 484
APPS DENIED 3 18 8 31 126 264 1708 145 402
APPS WITHDRAWN 2 12 2193 1741 305
FILES CLOSED FOR INCOMPLETENESS 8 1976 133
PA/PHILADELPHIA COUNTY/0188.00 75 27
LOANS ORIGINATED 3 17 10 1 1310 454 123 1205 140 108 651
APPS APPROVED, NOT ACCEPTED 2 1246 170
APPS DENIED 3 27 22 133 166 180 1584 302 469
APPS WITHDRAWN 4 11 78 318 42
FILES CLOSED FOR INCOMPLETENESS 5 1453 35
PA/PHILADELPHIA COUNTY/0190.00 83 44
LOANS ORIGINATED 3 45 8 1026 2270 214 4188 325 1430
APPS APPROVED, NOT ACCEPTED 1 11 390 1025 137
APPS DENIED 2 62 22 56 538 127 4518 515 313
APPS WITHDRAWN 13 43 336 1082 258
FILES CLOSED FOR INCOMPLETENESS 7 21 69 532 144
PA/PHILADELPHIA COUNTY/0191.00 81 45
LOANS ORIGINATED 14 64 11 934 2933 1022 4539 294 439
APPS APPROVED, NOT ACCEPTED 2 12 2137 949 30
APPS DENIED 4 72 28 84 466 184 5824 542 416 1 13
APPS WITHDRAWN 1 23 2 43 251 58 2034 60 230
FILES CLOSED FOR INCOMPLETENESS 1 13 1 264 959 70 114
06/02/2014Report Date:
AGGREGATE TABLE 1: DISPOSITION OF LOAN APPLICATIONS, BY LOCATION OF PROPERTY AND TYPE OF LOAN, 2013
MSA/MD: 37964 - PHILADELPHIA, PA
Page 159 of 199
ALL LOANS ON PROPERTY LOCATED IN MSA/MD 3/
CENSUS TRACT OR COUNTY NAME ANDDISPOSITION OF APPLICATION 1/(STATE/COUNTY/TRACT NUMBER) FHA, FSA/RHS & VA Conventional
Refinancings Home ImprovementLoans
Loans on DwellingsFor 5 or More
Families
NonoccupantLoans From
Columns A, B, Cand D
Number Number Number Number Number Number$000's $000's $000's $000's $000's $000's
A B C D E F
Home Purchase Loans
Loans on 1- to 4-Family and Manufactured Home Dwellings
Loans OnManufactured Home
Dwellings FromColumns A, B, C & D
G
Number $000's
%MinPop4/
MedianIncome As
PCT ofMSA/MDMedian

PA/PHILADELPHIA COUNTY/0192.00 90 20
LOANS ORIGINATED 1 17 3 91 66 46 802 23 363
APPS APPROVED, NOT ACCEPTED 1 53
APPS DENIED 3 19 31 142 98 173 1270 495 716
APPS WITHDRAWN 21 69 83
FILES CLOSED FOR INCOMPLETENESS 2 1 176 6 46
PA/PHILADELPHIA COUNTY/0195.01 96 31
LOANS ORIGINATED 3 3 3 25 335 261 109 23 69
APPS APPROVED, NOT ACCEPTED 1 146 46
APPS DENIED 3 9 22 62 175 200 516 245 110
APPS WITHDRAWN 1 4 2 180 190 48 80
FILES CLOSED FOR INCOMPLETENESS 1 1 14 330 35 45 35
PA/PHILADELPHIA COUNTY/0195.02 95 27
LOANS ORIGINATED 1 6 5 22 158 39 528 61 324
APPS APPROVED, NOT ACCEPTED
APPS DENIED 2 5 24 3130 203 374 106
APPS WITHDRAWN 1 120 45
FILES CLOSED FOR INCOMPLETENESS
PA/PHILADELPHIA COUNTY/0197.00 98 33
LOANS ORIGINATED 2 9 8 19 541 118 342 86 34
APPS APPROVED, NOT ACCEPTED
APPS DENIED 2 20 30 92 131 129 1164 350 243
APPS WITHDRAWN 2 1 137 30 30
FILES CLOSED FOR INCOMPLETENESS 2 110
PA/PHILADELPHIA COUNTY/0198.00 98 30
LOANS ORIGINATED 10 11 55 288 460 115 187
APPS APPROVED, NOT ACCEPTED 1 54
APPS DENIED 2 14 25 73 267 65 645 422 278
APPS WITHDRAWN 2 1 168 30 43
FILES CLOSED FOR INCOMPLETENESS 1 12 129 17 40
06/02/2014Report Date:
AGGREGATE TABLE 1: DISPOSITION OF LOAN APPLICATIONS, BY LOCATION OF PROPERTY AND TYPE OF LOAN, 2013
MSA/MD: 37964 - PHILADELPHIA, PA
Page 160 of 199
ALL LOANS ON PROPERTY LOCATED IN MSA/MD 3/
CENSUS TRACT OR COUNTY NAME ANDDISPOSITION OF APPLICATION 1/(STATE/COUNTY/TRACT NUMBER) FHA, FSA/RHS & VA Conventional
Refinancings Home ImprovementLoans
Loans on DwellingsFor 5 or More
Families
NonoccupantLoans From
Columns A, B, Cand D
Number Number Number Number Number Number$000's $000's $000's $000's $000's $000's
A B C D E F
Home Purchase Loans
Loans on 1- to 4-Family and Manufactured Home Dwellings
Loans OnManufactured Home
Dwellings FromColumns A, B, C & D
G
Number $000's
%MinPop4/
MedianIncome As
PCT ofMSA/MDMedian
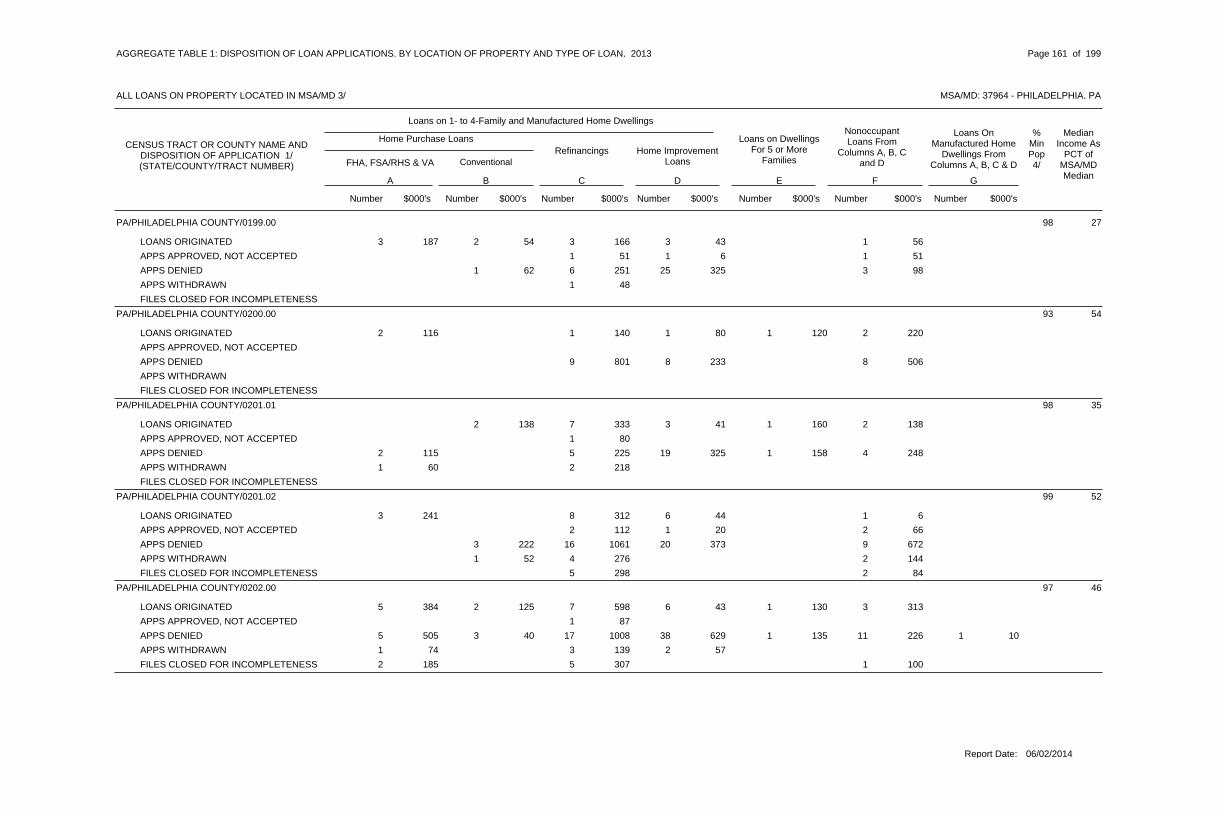
PA/PHILADELPHIA COUNTY/0199.00 98 27
LOANS ORIGINATED 2 3 3 13 187 54 166 43 56
APPS APPROVED, NOT ACCEPTED 1 1 151 6 51
APPS DENIED 1 6 25 362 251 325 98
APPS WITHDRAWN 1 48
FILES CLOSED FOR INCOMPLETENESS
PA/PHILADELPHIA COUNTY/0200.00 93 54
LOANS ORIGINATED 1 1 1 22 116 140 80 120 220
APPS APPROVED, NOT ACCEPTED
APPS DENIED 9 8 8801 233 506
APPS WITHDRAWN
FILES CLOSED FOR INCOMPLETENESS
PA/PHILADELPHIA COUNTY/0201.01 98 35
LOANS ORIGINATED 2 7 3 1 2138 333 41 160 138
APPS APPROVED, NOT ACCEPTED 1 80
APPS DENIED 5 19 1 42 115 225 325 158 248
APPS WITHDRAWN 21 60 218
FILES CLOSED FOR INCOMPLETENESS
PA/PHILADELPHIA COUNTY/0201.02 99 52
LOANS ORIGINATED 8 6 13 241 312 44 6
APPS APPROVED, NOT ACCEPTED 2 1 2112 20 66
APPS DENIED 3 16 20 9222 1061 373 672
APPS WITHDRAWN 1 4 252 276 144
FILES CLOSED FOR INCOMPLETENESS 5 2298 84
PA/PHILADELPHIA COUNTY/0202.00 97 46
LOANS ORIGINATED 2 7 6 1 35 384 125 598 43 130 313
APPS APPROVED, NOT ACCEPTED 1 87
APPS DENIED 3 17 38 1 115 505 40 1008 629 135 226 1 10
APPS WITHDRAWN 3 21 74 139 57
FILES CLOSED FOR INCOMPLETENESS 5 12 185 307 100
06/02/2014Report Date:
AGGREGATE TABLE 1: DISPOSITION OF LOAN APPLICATIONS, BY LOCATION OF PROPERTY AND TYPE OF LOAN, 2013
MSA/MD: 37964 - PHILADELPHIA, PA
Page 161 of 199
ALL LOANS ON PROPERTY LOCATED IN MSA/MD 3/
CENSUS TRACT OR COUNTY NAME ANDDISPOSITION OF APPLICATION 1/(STATE/COUNTY/TRACT NUMBER) FHA, FSA/RHS & VA Conventional
Refinancings Home ImprovementLoans
Loans on DwellingsFor 5 or More
Families
NonoccupantLoans From
Columns A, B, Cand D
Number Number Number Number Number Number$000's $000's $000's $000's $000's $000's
A B C D E F
Home Purchase Loans
Loans on 1- to 4-Family and Manufactured Home Dwellings
Loans OnManufactured Home
Dwellings FromColumns A, B, C & D
G
Number $000's
%MinPop4/
MedianIncome As
PCT ofMSA/MDMedian

PA/PHILADELPHIA COUNTY/0203.00 96 40
LOANS ORIGINATED 1 7 11 39 35 53 35
APPS APPROVED, NOT ACCEPTED 2 134 30
APPS DENIED 1 4 18 42 329 40 390 128 190
APPS WITHDRAWN 2 11 54 69 19
FILES CLOSED FOR INCOMPLETENESS
PA/PHILADELPHIA COUNTY/0204.00 98 49
LOANS ORIGINATED 4 1 3177 28 105
APPS APPROVED, NOT ACCEPTED 1 2 332 142 174
APPS DENIED 1 19 27 910 936 490 278
APPS WITHDRAWN 4 2229 139
FILES CLOSED FOR INCOMPLETENESS 1 84
PA/PHILADELPHIA COUNTY/0205.00 97 39
LOANS ORIGINATED 4 4 31 31 192 109 182
APPS APPROVED, NOT ACCEPTED 1 5
APPS DENIED 1 8 10 31 29 25 415 244 123
APPS WITHDRAWN 1 1 12 328 32 12 32
FILES CLOSED FOR INCOMPLETENESS 1 1 148 54 48
PA/PHILADELPHIA COUNTY/0206.00 48 140
LOANS ORIGINATED 10 13 1 1 13689 3371 6 2625 360
APPS APPROVED, NOT ACCEPTED 2 230
APPS DENIED 1 7 1417 1654 3
APPS WITHDRAWN
FILES CLOSED FOR INCOMPLETENESS
PA/PHILADELPHIA COUNTY/0207.00 22 134
LOANS ORIGINATED 85 134 11 1 4416 3384 18916 21846 621 130 6102
APPS APPROVED, NOT ACCEPTED 3 16 1 41 206 678 3143 5 535
APPS DENIED 9 45 11 1 115 995 2192 8887 1341 1400 1524
APPS WITHDRAWN 11 28 1 85 1279 2791 4241 30 1188
FILES CLOSED FOR INCOMPLETENESS 2 12 1 3371 2103 5 435
06/02/2014Report Date:
AGGREGATE TABLE 1: DISPOSITION OF LOAN APPLICATIONS, BY LOCATION OF PROPERTY AND TYPE OF LOAN, 2013
MSA/MD: 37964 - PHILADELPHIA, PA
Page 162 of 199
ALL LOANS ON PROPERTY LOCATED IN MSA/MD 3/
CENSUS TRACT OR COUNTY NAME ANDDISPOSITION OF APPLICATION 1/(STATE/COUNTY/TRACT NUMBER) FHA, FSA/RHS & VA Conventional
Refinancings Home ImprovementLoans
Loans on DwellingsFor 5 or More
Families
NonoccupantLoans From
Columns A, B, Cand D
Number Number Number Number Number Number$000's $000's $000's $000's $000's $000's
A B C D E F
Home Purchase Loans
Loans on 1- to 4-Family and Manufactured Home Dwellings
Loans OnManufactured Home
Dwellings FromColumns A, B, C & D
G
Number $000's
%MinPop4/
MedianIncome As
PCT ofMSA/MDMedian

PA/PHILADELPHIA COUNTY/0208.00 46 65
LOANS ORIGINATED 9 25 2 53 377 1954 3825 261 558
APPS APPROVED, NOT ACCEPTED 4 2790 259
APPS DENIED 1 13 2 21 111 155 1773 23 297
APPS WITHDRAWN 8 1 3961 400 403
FILES CLOSED FOR INCOMPLETENESS 3 388
PA/PHILADELPHIA COUNTY/0209.00 13 96
LOANS ORIGINATED 32 71 6 2912 2899 5897 12425 403 4940
APPS APPROVED, NOT ACCEPTED 1 3 1 1 11 148 158 431 13 675 88
APPS DENIED 6 19 5 71230 3527 145 1407
APPS WITHDRAWN 5 9 1 2 42 471 942 1484 8 11800 652
FILES CLOSED FOR INCOMPLETENESS 1 3 12 363 104 510 218
PA/PHILADELPHIA COUNTY/0210.00 9 95
LOANS ORIGINATED 72 145 12 3 7214 3175 13921 24457 459 10410 12412
APPS APPROVED, NOT ACCEPTED 7 11 1 1 43 623 1392 1681 55 8000 648
APPS DENIED 8 34 10 131 230 1831 5649 350 2082
APPS WITHDRAWN 13 19 1 102 416 2774 3273 30 1697
FILES CLOSED FOR INCOMPLETENESS 4 5 1 22 278 1045 939 20 415
PA/PHILADELPHIA COUNTY/0211.00 15 101
LOANS ORIGINATED 20 56 5 186 1165 3577 9054 172 2919
APPS APPROVED, NOT ACCEPTED 3 10 1 3856 1852 80 584
APPS DENIED 3 17 4 31 65 508 2802 24 487
APPS WITHDRAWN 1 10 1 21 155 180 1903 75 365
FILES CLOSED FOR INCOMPLETENESS 8 3824 402
PA/PHILADELPHIA COUNTY/0212.00 15 125
LOANS ORIGINATED 21 47 6 1 1910 2101 3569 6511 277 2650 2821
APPS APPROVED, NOT ACCEPTED 1 3 1150 716 25
APPS DENIED 4 9 10 21 286 505 1554 150 521
APPS WITHDRAWN 1 8 2120 1372 382
FILES CLOSED FOR INCOMPLETENESS 4 1605 114
06/02/2014Report Date:
AGGREGATE TABLE 1: DISPOSITION OF LOAN APPLICATIONS, BY LOCATION OF PROPERTY AND TYPE OF LOAN, 2013
MSA/MD: 37964 - PHILADELPHIA, PA
Page 163 of 199
ALL LOANS ON PROPERTY LOCATED IN MSA/MD 3/
CENSUS TRACT OR COUNTY NAME ANDDISPOSITION OF APPLICATION 1/(STATE/COUNTY/TRACT NUMBER) FHA, FSA/RHS & VA Conventional
Refinancings Home ImprovementLoans
Loans on DwellingsFor 5 or More
Families
NonoccupantLoans From
Columns A, B, Cand D
Number Number Number Number Number Number$000's $000's $000's $000's $000's $000's
A B C D E F
Home Purchase Loans
Loans on 1- to 4-Family and Manufactured Home Dwellings
Loans OnManufactured Home
Dwellings FromColumns A, B, C & D
G
Number $000's
%MinPop4/
MedianIncome As
PCT ofMSA/MDMedian

PA/PHILADELPHIA COUNTY/0213.00 12 84
LOANS ORIGINATED 32 86 10 3715 3401 6169 13875 1168 6080
APPS APPROVED, NOT ACCEPTED 6 1 21870 25 1114
APPS DENIED 6 22 5 1 171 236 997 2860 150 1198 2429
APPS WITHDRAWN 2 7 1 13 583 378 1235 132 165
FILES CLOSED FOR INCOMPLETENESS 3 7 1 1455 1119 310 95
PA/PHILADELPHIA COUNTY/0214.00 13 90
LOANS ORIGINATED 54 104 5 7511 2695 12164 20290 462 15328
APPS APPROVED, NOT ACCEPTED 6 11 61408 1892 724
APPS DENIED 6 36 2 212 363 1290 6617 85 3814
APPS WITHDRAWN 6 21 111 121 1351 4689 2860
FILES CLOSED FOR INCOMPLETENESS 2 14 2 6533 2718 205 1108
PA/PHILADELPHIA COUNTY/0215.00 11 86
LOANS ORIGINATED 38 111 6 1 458 1844 9135 19319 1240 3000 8551
APPS APPROVED, NOT ACCEPTED 2 14 6287 2983 1186
APPS DENIED 5 44 5 101531 7854 95 1756 1 35
APPS WITHDRAWN 2 23 61 316 498 4064 1000
FILES CLOSED FOR INCOMPLETENESS 11 1 31399 158 295
PA/PHILADELPHIA COUNTY/0216.00 18 86
LOANS ORIGINATED 14 35 4 2 25 1192 3746 6334 334 18900 410
APPS APPROVED, NOT ACCEPTED 5 740
APPS DENIED 1 13 2315 3181 361
APPS WITHDRAWN 6 1379
FILES CLOSED FOR INCOMPLETENESS 41 239 709
PA/PHILADELPHIA COUNTY/0217.00 17 127
LOANS ORIGINATED 45 126 12 2022 4728 9141 19029 382 2766
APPS APPROVED, NOT ACCEPTED 2 21 5 21 231 573 2980 136 218
APPS DENIED 5 37 13 32 292 715 5967 404 212 1 10
APPS WITHDRAWN 4 242 438 821 4180
FILES CLOSED FOR INCOMPLETENESS 16 1 11 145 2278 50 154
06/02/2014Report Date:
AGGREGATE TABLE 1: DISPOSITION OF LOAN APPLICATIONS, BY LOCATION OF PROPERTY AND TYPE OF LOAN, 2013
MSA/MD: 37964 - PHILADELPHIA, PA
Page 164 of 199
ALL LOANS ON PROPERTY LOCATED IN MSA/MD 3/
CENSUS TRACT OR COUNTY NAME ANDDISPOSITION OF APPLICATION 1/(STATE/COUNTY/TRACT NUMBER) FHA, FSA/RHS & VA Conventional
Refinancings Home ImprovementLoans
Loans on DwellingsFor 5 or More
Families
NonoccupantLoans From
Columns A, B, Cand D
Number Number Number Number Number Number$000's $000's $000's $000's $000's $000's
A B C D E F
Home Purchase Loans
Loans on 1- to 4-Family and Manufactured Home Dwellings
Loans OnManufactured Home
Dwellings FromColumns A, B, C & D
G
Number $000's
%MinPop4/
MedianIncome As
PCT ofMSA/MDMedian

PA/PHILADELPHIA COUNTY/0218.00 25 89
LOANS ORIGINATED 22 52 23 942 5297 7998 8
APPS APPROVED, NOT ACCEPTED 2 4408 677
APPS DENIED 1 11 1 1118 2461 40 118
APPS WITHDRAWN 3 8 1414 1553 95
FILES CLOSED FOR INCOMPLETENESS 41 193 991
PA/PHILADELPHIA COUNTY/0219.00 11 116
LOANS ORIGINATED 13 43 10 42416 6046 505 470
APPS APPROVED, NOT ACCEPTED 2 3 1544 713 184
APPS DENIED 1 17 3 41 210 360 3491 271 484
APPS WITHDRAWN 1 6 1200 708 117
FILES CLOSED FOR INCOMPLETENESS 2 5 2 1470 914 283 95
PA/PHILADELPHIA COUNTY/0220.00 16 151
LOANS ORIGINATED 14 36 3 15 1283 3166 6717 79 210
APPS APPROVED, NOT ACCEPTED 1 5 11 217 345 1149 147
APPS DENIED 11 21 362 2759 367
APPS WITHDRAWN 1 4 1222 616 147
FILES CLOSED FOR INCOMPLETENESS 1 130 150
PA/PHILADELPHIA COUNTY/0231.00 11 288
LOANS ORIGINATED 19 38 37103 12014 859
APPS APPROVED, NOT ACCEPTED 2 1270 135
APPS DENIED 2 7 21 255 808 2840 506
APPS WITHDRAWN 2 3 1480 716 100
FILES CLOSED FOR INCOMPLETENESS 1 124 246
PA/PHILADELPHIA COUNTY/0235.00 44 124
LOANS ORIGINATED 10 31 2 42 349 4623 8284 397 412
APPS APPROVED, NOT ACCEPTED 5 999
APPS DENIED 1 7417 1157
APPS WITHDRAWN 2 4799 1532
FILES CLOSED FOR INCOMPLETENESS 1 2403 352
06/02/2014Report Date:
AGGREGATE TABLE 1: DISPOSITION OF LOAN APPLICATIONS, BY LOCATION OF PROPERTY AND TYPE OF LOAN, 2013
MSA/MD: 37964 - PHILADELPHIA, PA
Page 165 of 199
ALL LOANS ON PROPERTY LOCATED IN MSA/MD 3/
CENSUS TRACT OR COUNTY NAME ANDDISPOSITION OF APPLICATION 1/(STATE/COUNTY/TRACT NUMBER) FHA, FSA/RHS & VA Conventional
Refinancings Home ImprovementLoans
Loans on DwellingsFor 5 or More
Families
NonoccupantLoans From
Columns A, B, Cand D
Number Number Number Number Number Number$000's $000's $000's $000's $000's $000's
A B C D E F
Home Purchase Loans
Loans on 1- to 4-Family and Manufactured Home Dwellings
Loans OnManufactured Home
Dwellings FromColumns A, B, C & D
G
Number $000's
%MinPop4/
MedianIncome As
PCT ofMSA/MDMedian
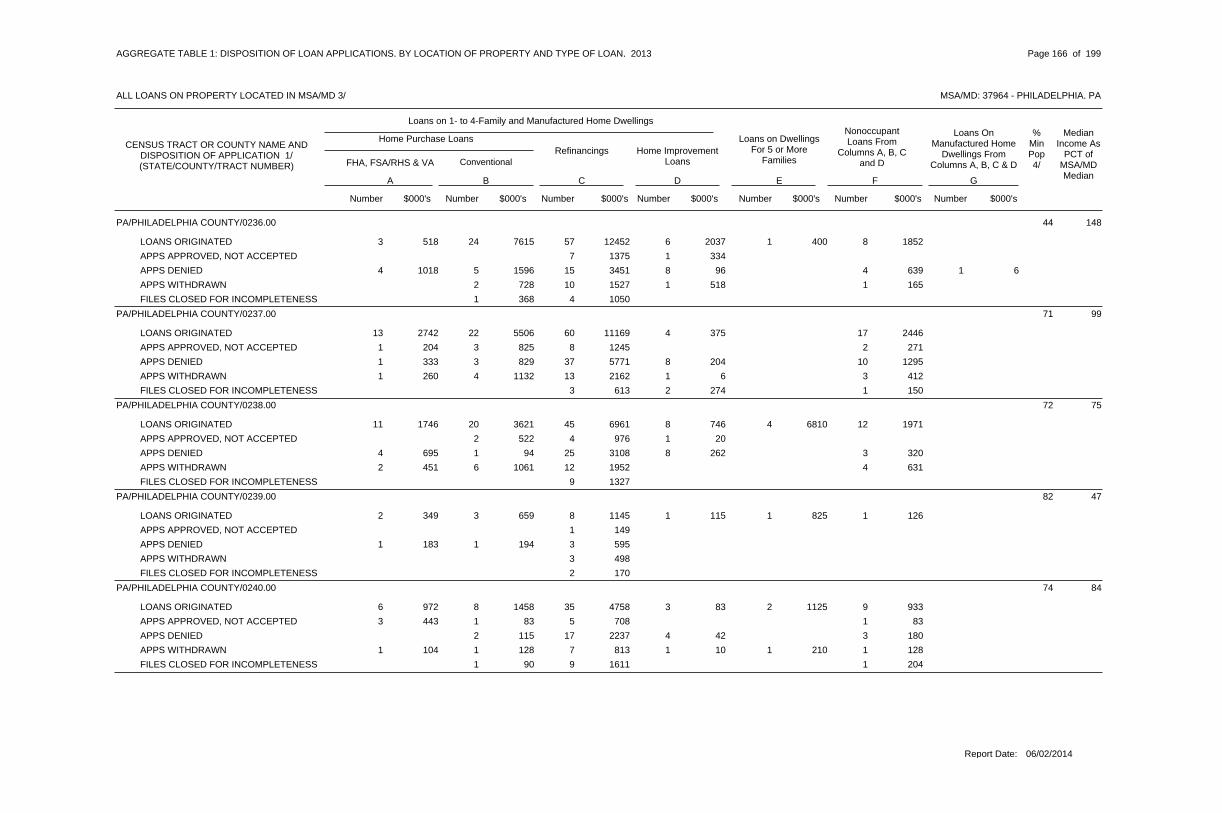
PA/PHILADELPHIA COUNTY/0236.00 44 148
LOANS ORIGINATED 24 57 6 1 83 518 7615 12452 2037 400 1852
APPS APPROVED, NOT ACCEPTED 7 11375 334
APPS DENIED 5 15 8 44 1018 1596 3451 96 639 1 6
APPS WITHDRAWN 2 10 1 1728 1527 518 165
FILES CLOSED FOR INCOMPLETENESS 1 4368 1050
PA/PHILADELPHIA COUNTY/0237.00 71 99
LOANS ORIGINATED 22 60 4 1713 2742 5506 11169 375 2446
APPS APPROVED, NOT ACCEPTED 3 8 21 204 825 1245 271
APPS DENIED 3 37 8 101 333 829 5771 204 1295
APPS WITHDRAWN 4 13 1 31 260 1132 2162 6 412
FILES CLOSED FOR INCOMPLETENESS 3 2 1613 274 150
PA/PHILADELPHIA COUNTY/0238.00 72 75
LOANS ORIGINATED 20 45 8 4 1211 1746 3621 6961 746 6810 1971
APPS APPROVED, NOT ACCEPTED 2 4 1522 976 20
APPS DENIED 1 25 8 34 695 94 3108 262 320
APPS WITHDRAWN 6 12 42 451 1061 1952 631
FILES CLOSED FOR INCOMPLETENESS 9 1327
PA/PHILADELPHIA COUNTY/0239.00 82 47
LOANS ORIGINATED 3 8 1 1 12 349 659 1145 115 825 126
APPS APPROVED, NOT ACCEPTED 1 149
APPS DENIED 1 31 183 194 595
APPS WITHDRAWN 3 498
FILES CLOSED FOR INCOMPLETENESS 2 170
PA/PHILADELPHIA COUNTY/0240.00 74 84
LOANS ORIGINATED 8 35 3 2 96 972 1458 4758 83 1125 933
APPS APPROVED, NOT ACCEPTED 1 5 13 443 83 708 83
APPS DENIED 2 17 4 3115 2237 42 180
APPS WITHDRAWN 1 7 1 1 11 104 128 813 10 210 128
FILES CLOSED FOR INCOMPLETENESS 1 9 190 1611 204
06/02/2014Report Date:
AGGREGATE TABLE 1: DISPOSITION OF LOAN APPLICATIONS, BY LOCATION OF PROPERTY AND TYPE OF LOAN, 2013
MSA/MD: 37964 - PHILADELPHIA, PA
Page 166 of 199
ALL LOANS ON PROPERTY LOCATED IN MSA/MD 3/
CENSUS TRACT OR COUNTY NAME ANDDISPOSITION OF APPLICATION 1/(STATE/COUNTY/TRACT NUMBER) FHA, FSA/RHS & VA Conventional
Refinancings Home ImprovementLoans
Loans on DwellingsFor 5 or More
Families
NonoccupantLoans From
Columns A, B, Cand D
Number Number Number Number Number Number$000's $000's $000's $000's $000's $000's
A B C D E F
Home Purchase Loans
Loans on 1- to 4-Family and Manufactured Home Dwellings
Loans OnManufactured Home
Dwellings FromColumns A, B, C & D
G
Number $000's
%MinPop4/
MedianIncome As
PCT ofMSA/MDMedian

PA/PHILADELPHIA COUNTY/0241.00 86 105
LOANS ORIGINATED 5 11 92 922 41
APPS APPROVED, NOT ACCEPTED 2 11 133 423 228
APPS DENIED 5 2 11 201 997 10 300
APPS WITHDRAWN 1 4 1218 703 245
FILES CLOSED FOR INCOMPLETENESS 1 1231 220
PA/PHILADELPHIA COUNTY/0242.00 89 42
LOANS ORIGINATED 7 25 5 2 125 718 577 3450 34 872 1959
APPS APPROVED, NOT ACCEPTED 4 1 11 122 585 19 1240
APPS DENIED 3 20 15 1 63 546 269 2134 244 175 398
APPS WITHDRAWN 2 5 2 1 2304 610 33 535 343
FILES CLOSED FOR INCOMPLETENESS 2 233
PA/PHILADELPHIA COUNTY/0243.00 90 59
LOANS ORIGINATED 9 42 4 1 1210 1222 2269 3782 456 67 2430
APPS APPROVED, NOT ACCEPTED 8 2687 188
APPS DENIED 4 25 12 63 392 666 2502 585 973
APPS WITHDRAWN 1 11 2 1 24 434 50 1153 21 1300 200
FILES CLOSED FOR INCOMPLETENESS 2 7 22 211 188 770 175
PA/PHILADELPHIA COUNTY/0244.00 95 58
LOANS ORIGINATED 1 21 4 1 89 967 64 2031 104 645 835
APPS APPROVED, NOT ACCEPTED 2 1 2252 56 242
APPS DENIED 3 18 16 56 551 301 1572 369 161
APPS WITHDRAWN 1 21 113 66 101
FILES CLOSED FOR INCOMPLETENESS 2 1 12 274 353 30 103
PA/PHILADELPHIA COUNTY/0245.00 97 49
LOANS ORIGINATED 2 12 6 1 62 197 52 881 137 250 250
APPS APPROVED, NOT ACCEPTED 3 1 1 1348 50 200 44
APPS DENIED 1 16 17 760 1221 522 291
APPS WITHDRAWN 4 331
FILES CLOSED FOR INCOMPLETENESS 1 2 164 180 64
06/02/2014Report Date:
AGGREGATE TABLE 1: DISPOSITION OF LOAN APPLICATIONS, BY LOCATION OF PROPERTY AND TYPE OF LOAN, 2013
MSA/MD: 37964 - PHILADELPHIA, PA
Page 167 of 199
ALL LOANS ON PROPERTY LOCATED IN MSA/MD 3/
CENSUS TRACT OR COUNTY NAME ANDDISPOSITION OF APPLICATION 1/(STATE/COUNTY/TRACT NUMBER) FHA, FSA/RHS & VA Conventional
Refinancings Home ImprovementLoans
Loans on DwellingsFor 5 or More
Families
NonoccupantLoans From
Columns A, B, Cand D
Number Number Number Number Number Number$000's $000's $000's $000's $000's $000's
A B C D E F
Home Purchase Loans
Loans on 1- to 4-Family and Manufactured Home Dwellings
Loans OnManufactured Home
Dwellings FromColumns A, B, C & D
G
Number $000's
%MinPop4/
MedianIncome As
PCT ofMSA/MDMedian

PA/PHILADELPHIA COUNTY/0246.00 93 27
LOANS ORIGINATED 1 9 2 32 301 81 814 9 245
APPS APPROVED, NOT ACCEPTED 1 3 1 261 333 130 282
APPS DENIED 1 15 12 952 1337 375 431
APPS WITHDRAWN 2 324
FILES CLOSED FOR INCOMPLETENESS
PA/PHILADELPHIA COUNTY/0247.00 94 45
LOANS ORIGINATED 6 29 5 3 128 833 481 2331 51 4151 714
APPS APPROVED, NOT ACCEPTED 4 1344 73
APPS DENIED 3 11 19 86 641 188 964 531 535
APPS WITHDRAWN 8 1 2720 11 142
FILES CLOSED FOR INCOMPLETENESS 3 2391 185
PA/PHILADELPHIA COUNTY/0248.00 99 50
LOANS ORIGINATED 6 2 22 390 422 11 109
APPS APPROVED, NOT ACCEPTED
APPS DENIED 11 7 12 148 763 110 44
APPS WITHDRAWN 1 7415 856
FILES CLOSED FOR INCOMPLETENESS
PA/PHILADELPHIA COUNTY/0249.00 99 40
LOANS ORIGINATED 3 17 7 57 749 223 986 143 310
APPS APPROVED, NOT ACCEPTED 1 1 153 5 53
APPS DENIED 25 16 61846 139 96 1 10
APPS WITHDRAWN 1 4 2 31 55 65 441 80 145
FILES CLOSED FOR INCOMPLETENESS 4 168
PA/PHILADELPHIA COUNTY/0252.00 95 59
LOANS ORIGINATED 4 50 13 2 1914 1993 620 5905 1162 3350 3149
APPS APPROVED, NOT ACCEPTED 13 1 41293 5 310
APPS DENIED 3 25 23 52 199 204 2366 428 440
APPS WITHDRAWN 1 17 2 1 14 434 30 1658 31 1320 95
FILES CLOSED FOR INCOMPLETENESS 9 11 113 761 180
06/02/2014Report Date:
AGGREGATE TABLE 1: DISPOSITION OF LOAN APPLICATIONS, BY LOCATION OF PROPERTY AND TYPE OF LOAN, 2013
MSA/MD: 37964 - PHILADELPHIA, PA
Page 168 of 199
ALL LOANS ON PROPERTY LOCATED IN MSA/MD 3/
CENSUS TRACT OR COUNTY NAME ANDDISPOSITION OF APPLICATION 1/(STATE/COUNTY/TRACT NUMBER) FHA, FSA/RHS & VA Conventional
Refinancings Home ImprovementLoans
Loans on DwellingsFor 5 or More
Families
NonoccupantLoans From
Columns A, B, Cand D
Number Number Number Number Number Number$000's $000's $000's $000's $000's $000's
A B C D E F
Home Purchase Loans
Loans on 1- to 4-Family and Manufactured Home Dwellings
Loans OnManufactured Home
Dwellings FromColumns A, B, C & D
G
Number $000's
%MinPop4/
MedianIncome As
PCT ofMSA/MDMedian
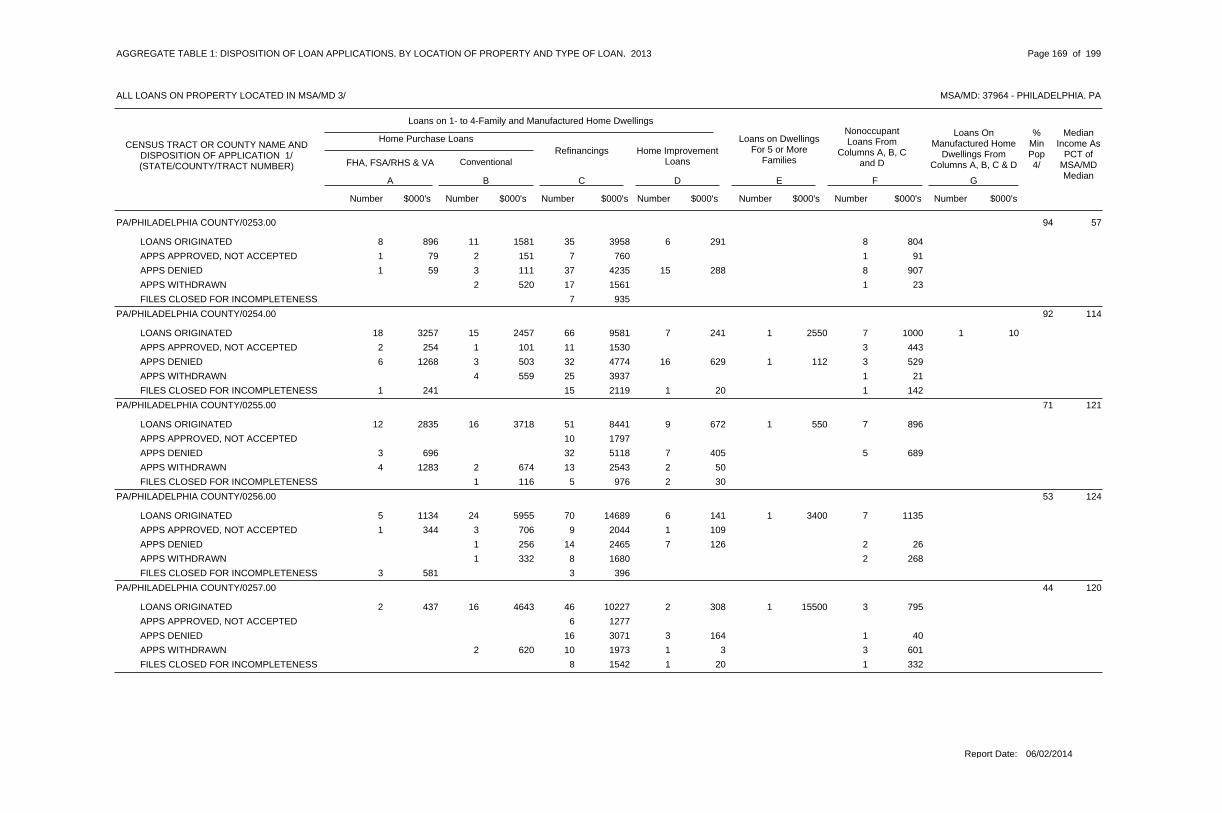
PA/PHILADELPHIA COUNTY/0253.00 94 57
LOANS ORIGINATED 11 35 6 88 896 1581 3958 291 804
APPS APPROVED, NOT ACCEPTED 2 7 11 79 151 760 91
APPS DENIED 3 37 15 81 59 111 4235 288 907
APPS WITHDRAWN 2 17 1520 1561 23
FILES CLOSED FOR INCOMPLETENESS 7 935
PA/PHILADELPHIA COUNTY/0254.00 92 114
LOANS ORIGINATED 15 66 7 1 718 3257 2457 9581 241 2550 1000 1 10
APPS APPROVED, NOT ACCEPTED 1 11 32 254 101 1530 443
APPS DENIED 3 32 16 1 36 1268 503 4774 629 112 529
APPS WITHDRAWN 4 25 1559 3937 21
FILES CLOSED FOR INCOMPLETENESS 15 1 11 241 2119 20 142
PA/PHILADELPHIA COUNTY/0255.00 71 121
LOANS ORIGINATED 16 51 9 1 712 2835 3718 8441 672 550 896
APPS APPROVED, NOT ACCEPTED 10 1797
APPS DENIED 32 7 53 696 5118 405 689
APPS WITHDRAWN 2 13 24 1283 674 2543 50
FILES CLOSED FOR INCOMPLETENESS 1 5 2116 976 30
PA/PHILADELPHIA COUNTY/0256.00 53 124
LOANS ORIGINATED 24 70 6 1 75 1134 5955 14689 141 3400 1135
APPS APPROVED, NOT ACCEPTED 3 9 11 344 706 2044 109
APPS DENIED 1 14 7 2256 2465 126 26
APPS WITHDRAWN 1 8 2332 1680 268
FILES CLOSED FOR INCOMPLETENESS 33 581 396
PA/PHILADELPHIA COUNTY/0257.00 44 120
LOANS ORIGINATED 16 46 2 1 32 437 4643 10227 308 15500 795
APPS APPROVED, NOT ACCEPTED 6 1277
APPS DENIED 16 3 13071 164 40
APPS WITHDRAWN 2 10 1 3620 1973 3 601
FILES CLOSED FOR INCOMPLETENESS 8 1 11542 20 332
06/02/2014Report Date:
AGGREGATE TABLE 1: DISPOSITION OF LOAN APPLICATIONS, BY LOCATION OF PROPERTY AND TYPE OF LOAN, 2013
MSA/MD: 37964 - PHILADELPHIA, PA
Page 169 of 199
ALL LOANS ON PROPERTY LOCATED IN MSA/MD 3/
CENSUS TRACT OR COUNTY NAME ANDDISPOSITION OF APPLICATION 1/(STATE/COUNTY/TRACT NUMBER) FHA, FSA/RHS & VA Conventional
Refinancings Home ImprovementLoans
Loans on DwellingsFor 5 or More
Families
NonoccupantLoans From
Columns A, B, Cand D
Number Number Number Number Number Number$000's $000's $000's $000's $000's $000's
A B C D E F
Home Purchase Loans
Loans on 1- to 4-Family and Manufactured Home Dwellings
Loans OnManufactured Home
Dwellings FromColumns A, B, C & D
G
Number $000's
%MinPop4/
MedianIncome As
PCT ofMSA/MDMedian

PA/PHILADELPHIA COUNTY/0258.00 97 105
LOANS ORIGINATED 3 27 7 17 1067 411 2977 55 180
APPS APPROVED, NOT ACCEPTED 4 11 136 754 88
APPS DENIED 2 23 8 21 114 297 3522 78 243
APPS WITHDRAWN 8 603
FILES CLOSED FOR INCOMPLETENESS 6 1058
PA/PHILADELPHIA COUNTY/0259.00 99 69
LOANS ORIGINATED 7 45 18 1218 2333 764 4451 436 1258
APPS APPROVED, NOT ACCEPTED 12 11 150 1411 151
APPS DENIED 3 37 21 55 592 392 3554 439 342 1 5
APPS WITHDRAWN 1 17 42 309 101 1738 317
FILES CLOSED FOR INCOMPLETENESS 7 11 152 544 89
PA/PHILADELPHIA COUNTY/0260.00 98 75
LOANS ORIGINATED 6 27 5 513 1851 751 2791 42 601
APPS APPROVED, NOT ACCEPTED 32 343 296
APPS DENIED 23 12 24 620 2548 287 200
APPS WITHDRAWN 13 21 79 1307 149
FILES CLOSED FOR INCOMPLETENESS 4 11 145 509 100
PA/PHILADELPHIA COUNTY/0261.00 98 101
LOANS ORIGINATED 4 48 8 26 1219 633 5943 178 266
APPS APPROVED, NOT ACCEPTED 1 6 11 111 198 781 125
APPS DENIED 3 34 16 42 365 241 5102 348 438 1 55
APPS WITHDRAWN 13 11 142 2045 158
FILES CLOSED FOR INCOMPLETENESS 11 1 21615 100 331
PA/PHILADELPHIA COUNTY/0262.00 99 84
LOANS ORIGINATED 6 68 10 918 2732 765 6836 441 947
APPS APPROVED, NOT ACCEPTED 83 460 826
APPS DENIED 42 17 44651 413 458 1 4
APPS WITHDRAWN 19 3 13 406 2239 68 79
FILES CLOSED FOR INCOMPLETENESS 112 275 1003
06/02/2014Report Date:
AGGREGATE TABLE 1: DISPOSITION OF LOAN APPLICATIONS, BY LOCATION OF PROPERTY AND TYPE OF LOAN, 2013
MSA/MD: 37964 - PHILADELPHIA, PA
Page 170 of 199
ALL LOANS ON PROPERTY LOCATED IN MSA/MD 3/
CENSUS TRACT OR COUNTY NAME ANDDISPOSITION OF APPLICATION 1/(STATE/COUNTY/TRACT NUMBER) FHA, FSA/RHS & VA Conventional
Refinancings Home ImprovementLoans
Loans on DwellingsFor 5 or More
Families
NonoccupantLoans From
Columns A, B, Cand D
Number Number Number Number Number Number$000's $000's $000's $000's $000's $000's
A B C D E F
Home Purchase Loans
Loans on 1- to 4-Family and Manufactured Home Dwellings
Loans OnManufactured Home
Dwellings FromColumns A, B, C & D
G
Number $000's
%MinPop4/
MedianIncome As
PCT ofMSA/MDMedian

PA/PHILADELPHIA COUNTY/0263.01 98 79
LOANS ORIGINATED 6 51 11 623 2800 461 4582 186 603
APPS APPROVED, NOT ACCEPTED 9 1 3992 14 295
APPS DENIED 4 30 14 35 528 213 2776 386 225
APPS WITHDRAWN 1 12 2 13 341 96 1196 13 96
FILES CLOSED FOR INCOMPLETENESS 10 21052 162
PA/PHILADELPHIA COUNTY/0263.02 99 75
LOANS ORIGINATED 7 50 10 624 3415 636 4458 135 564
APPS APPROVED, NOT ACCEPTED 9 1 2859 102 185
APPS DENIED 2 43 32 55 527 246 3851 589 446
APPS WITHDRAWN 2 19 1 11 132 160 1925 15 40
FILES CLOSED FOR INCOMPLETENESS 1 131 132 118 1420
PA/PHILADELPHIA COUNTY/0264.00 99 71
LOANS ORIGINATED 7 61 8 1324 3217 894 5657 106 1155
APPS APPROVED, NOT ACCEPTED 93 457 764
APPS DENIED 3 69 35 1 126 833 299 6583 384 15 929 1 2
APPS WITHDRAWN 4 26 2 26 780 625 2757 25 360
FILES CLOSED FOR INCOMPLETENESS 1 19 1144 1572 81
PA/PHILADELPHIA COUNTY/0265.00 99 62
LOANS ORIGINATED 6 33 6 714 1551 475 2379 206 439
APPS APPROVED, NOT ACCEPTED 1 91 135 80 763
APPS DENIED 3 32 34 75 524 278 2416 554 304 2 6
APPS WITHDRAWN 2 8 2 25 536 153 599 48 109
FILES CLOSED FOR INCOMPLETENESS 5 4 11 135 371 180 70 1 15
PA/PHILADELPHIA COUNTY/0266.00 100 69
LOANS ORIGINATED 5 59 18 938 4695 606 4609 521 788
APPS APPROVED, NOT ACCEPTED 1 5 21 79 101 444 226
APPS DENIED 7 65 28 109 1072 460 5077 405 672
APPS WITHDRAWN 1 22 3 33 481 68 2032 184 226
FILES CLOSED FOR INCOMPLETENESS 10 31 145 798 85
06/02/2014Report Date:
AGGREGATE TABLE 1: DISPOSITION OF LOAN APPLICATIONS, BY LOCATION OF PROPERTY AND TYPE OF LOAN, 2013
MSA/MD: 37964 - PHILADELPHIA, PA
Page 171 of 199
ALL LOANS ON PROPERTY LOCATED IN MSA/MD 3/
CENSUS TRACT OR COUNTY NAME ANDDISPOSITION OF APPLICATION 1/(STATE/COUNTY/TRACT NUMBER) FHA, FSA/RHS & VA Conventional
Refinancings Home ImprovementLoans
Loans on DwellingsFor 5 or More
Families
NonoccupantLoans From
Columns A, B, Cand D
Number Number Number Number Number Number$000's $000's $000's $000's $000's $000's
A B C D E F
Home Purchase Loans
Loans on 1- to 4-Family and Manufactured Home Dwellings
Loans OnManufactured Home
Dwellings FromColumns A, B, C & D
G
Number $000's
%MinPop4/
MedianIncome As
PCT ofMSA/MDMedian

PA/PHILADELPHIA COUNTY/0267.00 99 70
LOANS ORIGINATED 7 38 14 429 3371 474 2959 367 343 1 9
APPS APPROVED, NOT ACCEPTED 1 4 2 13 251 41 338 93 41
APPS DENIED 4 47 23 64 529 287 3791 591 329
APPS WITHDRAWN 16 25 595 1290 33
FILES CLOSED FOR INCOMPLETENESS 4 2 1354 84 86
PA/PHILADELPHIA COUNTY/0268.00 95 55
LOANS ORIGINATED 2 23 6 5 68 1251 341 2517 172 10725 606
APPS APPROVED, NOT ACCEPTED 1 3 31 147 73 289 268
APPS DENIED 4 28 16 21 107 460 3211 520 175
APPS WITHDRAWN 1 11 2 3138 1703 3000 297
FILES CLOSED FOR INCOMPLETENESS 9 3 1 21461 147 1200 241
PA/PHILADELPHIA COUNTY/0269.00 81 85
LOANS ORIGINATED 1 24 4 52 529 116 4397 90 679
APPS APPROVED, NOT ACCEPTED 1 4 1 1266 569 10 263
APPS DENIED 2 22 9 24 701 245 3438 233 350
APPS WITHDRAWN 5 702
FILES CLOSED FOR INCOMPLETENESS 3 11 129 543 15
PA/PHILADELPHIA COUNTY/0270.00 89 97
LOANS ORIGINATED 6 29 2 49 2068 945 4146 40 406
APPS APPROVED, NOT ACCEPTED 1 2243 395
APPS DENIED 2 28 13 42 488 272 4526 740 193
APPS WITHDRAWN 1 9 2 21 260 25 1681 50 7700
FILES CLOSED FOR INCOMPLETENESS 41 141 660
PA/PHILADELPHIA COUNTY/0271.00 92 66
LOANS ORIGINATED 7 31 5 45 699 570 2605 151 338
APPS APPROVED, NOT ACCEPTED 4 1391 50
APPS DENIED 3 23 14 3242 2204 342 233 1 3
APPS WITHDRAWN 7 21 76 738 2600
FILES CLOSED FOR INCOMPLETENESS 9 657
06/02/2014Report Date:
AGGREGATE TABLE 1: DISPOSITION OF LOAN APPLICATIONS, BY LOCATION OF PROPERTY AND TYPE OF LOAN, 2013
MSA/MD: 37964 - PHILADELPHIA, PA
Page 172 of 199
ALL LOANS ON PROPERTY LOCATED IN MSA/MD 3/
CENSUS TRACT OR COUNTY NAME ANDDISPOSITION OF APPLICATION 1/(STATE/COUNTY/TRACT NUMBER) FHA, FSA/RHS & VA Conventional
Refinancings Home ImprovementLoans
Loans on DwellingsFor 5 or More
Families
NonoccupantLoans From
Columns A, B, Cand D
Number Number Number Number Number Number$000's $000's $000's $000's $000's $000's
A B C D E F
Home Purchase Loans
Loans on 1- to 4-Family and Manufactured Home Dwellings
Loans OnManufactured Home
Dwellings FromColumns A, B, C & D
G
Number $000's
%MinPop4/
MedianIncome As
PCT ofMSA/MDMedian

PA/PHILADELPHIA COUNTY/0272.00 93 75
LOANS ORIGINATED 10 48 9 618 2211 1019 4403 198 491
APPS APPROVED, NOT ACCEPTED 8 21 152 853 175
APPS DENIED 2 40 15 31 147 260 3913 378 155
APPS WITHDRAWN 16 1 1 13 361 1745 25 30000 47
FILES CLOSED FOR INCOMPLETENESS 8 2810 100
PA/PHILADELPHIA COUNTY/0273.00 93 62
LOANS ORIGINATED 5 46 6 127 682 285 3985 47 812
APPS APPROVED, NOT ACCEPTED 6 1493 4
APPS DENIED 3 39 25 71 92 113 3076 460 537
APPS WITHDRAWN 18 2 21288 79 164
FILES CLOSED FOR INCOMPLETENESS 5 3 1438 93 75
PA/PHILADELPHIA COUNTY/0274.01 93 51
LOANS ORIGINATED 1 17 5 23 250 91 1072 110 176
APPS APPROVED, NOT ACCEPTED 5 389
APPS DENIED 4 15 16 43 172 280 1206 210 254 1 10
APPS WITHDRAWN 5 1 1378 20 57
FILES CLOSED FOR INCOMPLETENESS 4 248
PA/PHILADELPHIA COUNTY/0274.02 93 43
LOANS ORIGINATED 2 30 5 912 1220 111 2032 134 719
APPS APPROVED, NOT ACCEPTED 2 4 2 1190 201 25 51
APPS DENIED 6 45 24 101 127 518 3244 363 607 1 2
APPS WITHDRAWN 2 7 1 13 315 134 482 40 51
FILES CLOSED FOR INCOMPLETENESS 15 2 21096 130 103
PA/PHILADELPHIA COUNTY/0275.00 91 64
LOANS ORIGINATED 1 47 2 128 629 88 3800 103 875
APPS APPROVED, NOT ACCEPTED 61 59 603
APPS DENIED 2 32 16 63 267 108 2517 440 376
APPS WITHDRAWN 1 8 1 1106 789 46 77
FILES CLOSED FOR INCOMPLETENESS 81 79 550
06/02/2014Report Date:
AGGREGATE TABLE 1: DISPOSITION OF LOAN APPLICATIONS, BY LOCATION OF PROPERTY AND TYPE OF LOAN, 2013
MSA/MD: 37964 - PHILADELPHIA, PA
Page 173 of 199
ALL LOANS ON PROPERTY LOCATED IN MSA/MD 3/
CENSUS TRACT OR COUNTY NAME ANDDISPOSITION OF APPLICATION 1/(STATE/COUNTY/TRACT NUMBER) FHA, FSA/RHS & VA Conventional
Refinancings Home ImprovementLoans
Loans on DwellingsFor 5 or More
Families
NonoccupantLoans From
Columns A, B, Cand D
Number Number Number Number Number Number$000's $000's $000's $000's $000's $000's
A B C D E F
Home Purchase Loans
Loans on 1- to 4-Family and Manufactured Home Dwellings
Loans OnManufactured Home
Dwellings FromColumns A, B, C & D
G
Number $000's
%MinPop4/
MedianIncome As
PCT ofMSA/MDMedian
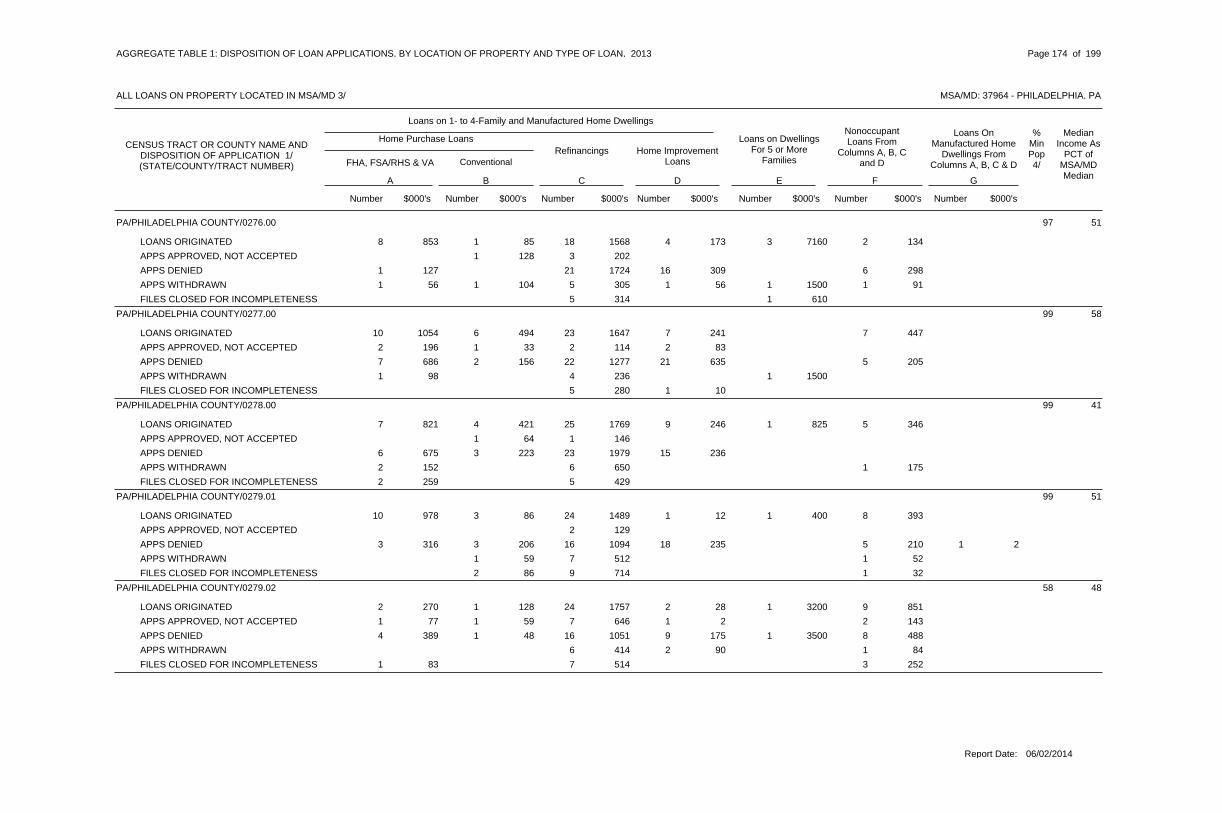
PA/PHILADELPHIA COUNTY/0276.00 97 51
LOANS ORIGINATED 1 18 4 3 28 853 85 1568 173 7160 134
APPS APPROVED, NOT ACCEPTED 1 3128 202
APPS DENIED 21 16 61 127 1724 309 298
APPS WITHDRAWN 1 5 1 1 11 56 104 305 56 1500 91
FILES CLOSED FOR INCOMPLETENESS 5 1314 610
PA/PHILADELPHIA COUNTY/0277.00 99 58
LOANS ORIGINATED 6 23 7 710 1054 494 1647 241 447
APPS APPROVED, NOT ACCEPTED 1 2 22 196 33 114 83
APPS DENIED 2 22 21 57 686 156 1277 635 205
APPS WITHDRAWN 4 11 98 236 1500
FILES CLOSED FOR INCOMPLETENESS 5 1280 10
PA/PHILADELPHIA COUNTY/0278.00 99 41
LOANS ORIGINATED 4 25 9 1 57 821 421 1769 246 825 346
APPS APPROVED, NOT ACCEPTED 1 164 146
APPS DENIED 3 23 156 675 223 1979 236
APPS WITHDRAWN 6 12 152 650 175
FILES CLOSED FOR INCOMPLETENESS 52 259 429
PA/PHILADELPHIA COUNTY/0279.01 99 51
LOANS ORIGINATED 3 24 1 1 810 978 86 1489 12 400 393
APPS APPROVED, NOT ACCEPTED 2 129
APPS DENIED 3 16 18 53 316 206 1094 235 210 1 2
APPS WITHDRAWN 1 7 159 512 52
FILES CLOSED FOR INCOMPLETENESS 2 9 186 714 32
PA/PHILADELPHIA COUNTY/0279.02 58 48
LOANS ORIGINATED 1 24 2 1 92 270 128 1757 28 3200 851
APPS APPROVED, NOT ACCEPTED 1 7 1 21 77 59 646 2 143
APPS DENIED 1 16 9 1 84 389 48 1051 175 3500 488
APPS WITHDRAWN 6 2 1414 90 84
FILES CLOSED FOR INCOMPLETENESS 7 31 83 514 252
06/02/2014Report Date:
AGGREGATE TABLE 1: DISPOSITION OF LOAN APPLICATIONS, BY LOCATION OF PROPERTY AND TYPE OF LOAN, 2013
MSA/MD: 37964 - PHILADELPHIA, PA
Page 174 of 199
ALL LOANS ON PROPERTY LOCATED IN MSA/MD 3/
CENSUS TRACT OR COUNTY NAME ANDDISPOSITION OF APPLICATION 1/(STATE/COUNTY/TRACT NUMBER) FHA, FSA/RHS & VA Conventional
Refinancings Home ImprovementLoans
Loans on DwellingsFor 5 or More
Families
NonoccupantLoans From
Columns A, B, Cand D
Number Number Number Number Number Number$000's $000's $000's $000's $000's $000's
A B C D E F
Home Purchase Loans
Loans on 1- to 4-Family and Manufactured Home Dwellings
Loans OnManufactured Home
Dwellings FromColumns A, B, C & D
G
Number $000's
%MinPop4/
MedianIncome As
PCT ofMSA/MDMedian
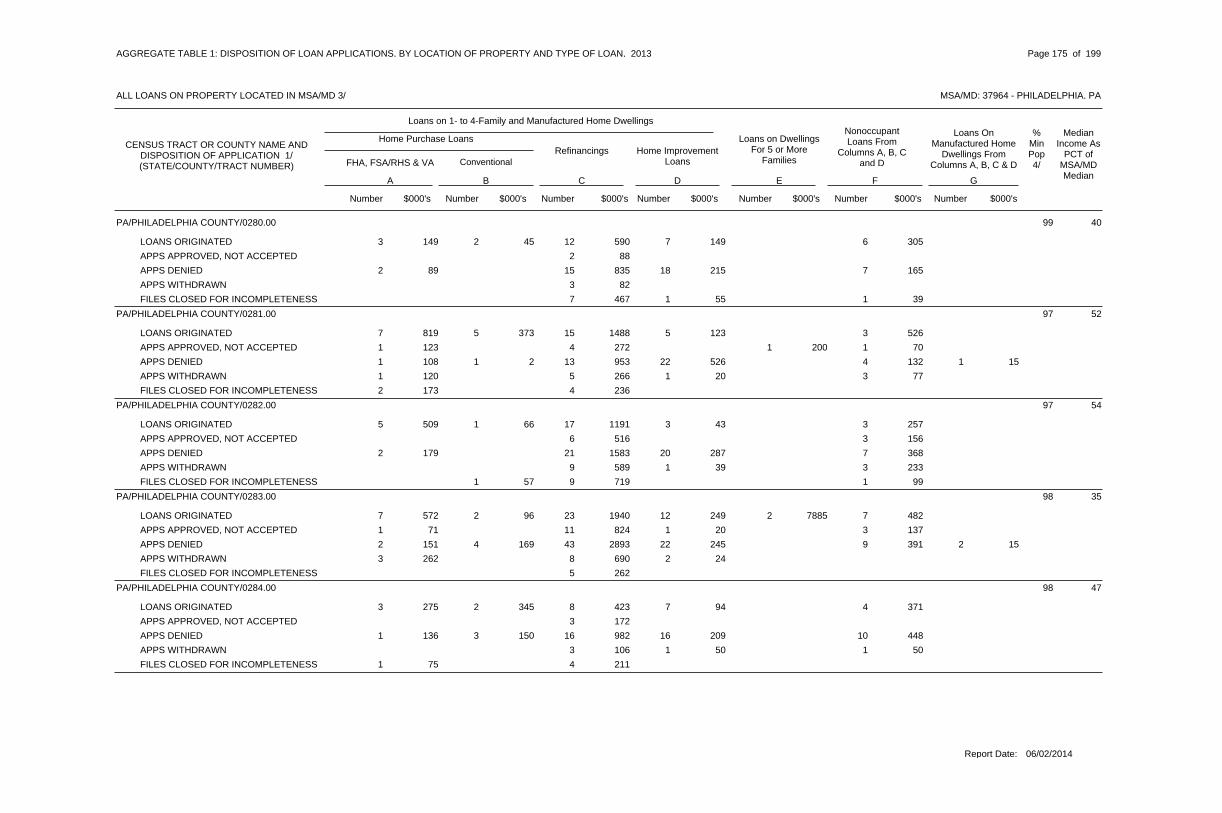
PA/PHILADELPHIA COUNTY/0280.00 99 40
LOANS ORIGINATED 2 12 7 63 149 45 590 149 305
APPS APPROVED, NOT ACCEPTED 2 88
APPS DENIED 15 18 72 89 835 215 165
APPS WITHDRAWN 3 82
FILES CLOSED FOR INCOMPLETENESS 7 1 1467 55 39
PA/PHILADELPHIA COUNTY/0281.00 97 52
LOANS ORIGINATED 5 15 5 37 819 373 1488 123 526
APPS APPROVED, NOT ACCEPTED 4 1 11 123 272 200 70
APPS DENIED 1 13 22 41 108 2 953 526 132 1 15
APPS WITHDRAWN 5 1 31 120 266 20 77
FILES CLOSED FOR INCOMPLETENESS 42 173 236
PA/PHILADELPHIA COUNTY/0282.00 97 54
LOANS ORIGINATED 1 17 3 35 509 66 1191 43 257
APPS APPROVED, NOT ACCEPTED 6 3516 156
APPS DENIED 21 20 72 179 1583 287 368
APPS WITHDRAWN 9 1 3589 39 233
FILES CLOSED FOR INCOMPLETENESS 1 9 157 719 99
PA/PHILADELPHIA COUNTY/0283.00 98 35
LOANS ORIGINATED 2 23 12 2 77 572 96 1940 249 7885 482
APPS APPROVED, NOT ACCEPTED 11 1 31 71 824 20 137
APPS DENIED 4 43 22 92 151 169 2893 245 391 2 15
APPS WITHDRAWN 8 23 262 690 24
FILES CLOSED FOR INCOMPLETENESS 5 262
PA/PHILADELPHIA COUNTY/0284.00 98 47
LOANS ORIGINATED 2 8 7 43 275 345 423 94 371
APPS APPROVED, NOT ACCEPTED 3 172
APPS DENIED 3 16 16 101 136 150 982 209 448
APPS WITHDRAWN 3 1 1106 50 50
FILES CLOSED FOR INCOMPLETENESS 41 75 211
06/02/2014Report Date:
AGGREGATE TABLE 1: DISPOSITION OF LOAN APPLICATIONS, BY LOCATION OF PROPERTY AND TYPE OF LOAN, 2013
MSA/MD: 37964 - PHILADELPHIA, PA
Page 175 of 199
ALL LOANS ON PROPERTY LOCATED IN MSA/MD 3/
CENSUS TRACT OR COUNTY NAME ANDDISPOSITION OF APPLICATION 1/(STATE/COUNTY/TRACT NUMBER) FHA, FSA/RHS & VA Conventional
Refinancings Home ImprovementLoans
Loans on DwellingsFor 5 or More
Families
NonoccupantLoans From
Columns A, B, Cand D
Number Number Number Number Number Number$000's $000's $000's $000's $000's $000's
A B C D E F
Home Purchase Loans
Loans on 1- to 4-Family and Manufactured Home Dwellings
Loans OnManufactured Home
Dwellings FromColumns A, B, C & D
G
Number $000's
%MinPop4/
MedianIncome As
PCT ofMSA/MDMedian
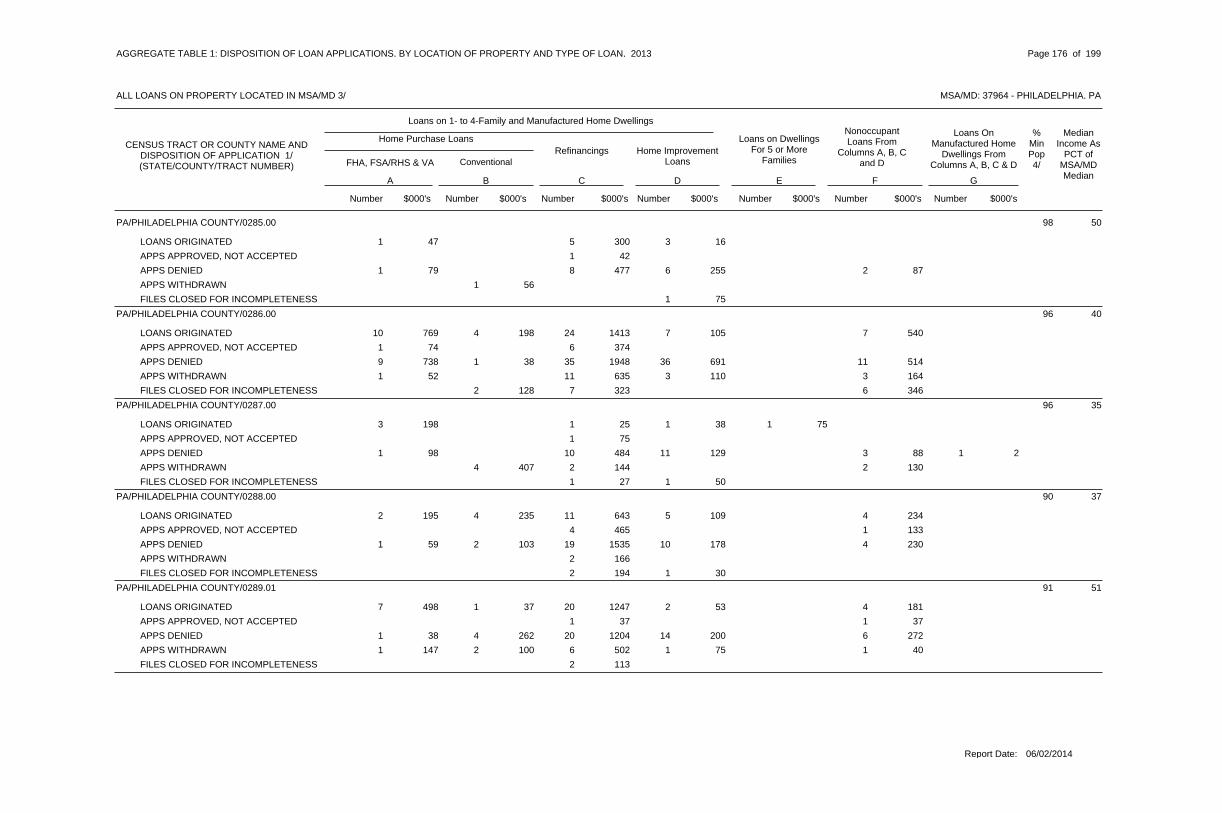
PA/PHILADELPHIA COUNTY/0285.00 98 50
LOANS ORIGINATED 5 31 47 300 16
APPS APPROVED, NOT ACCEPTED 1 42
APPS DENIED 8 6 21 79 477 255 87
APPS WITHDRAWN 1 56
FILES CLOSED FOR INCOMPLETENESS 1 75
PA/PHILADELPHIA COUNTY/0286.00 96 40
LOANS ORIGINATED 4 24 7 710 769 198 1413 105 540
APPS APPROVED, NOT ACCEPTED 61 74 374
APPS DENIED 1 35 36 119 738 38 1948 691 514
APPS WITHDRAWN 11 3 31 52 635 110 164
FILES CLOSED FOR INCOMPLETENESS 2 7 6128 323 346
PA/PHILADELPHIA COUNTY/0287.00 96 35
LOANS ORIGINATED 1 1 13 198 25 38 75
APPS APPROVED, NOT ACCEPTED 1 75
APPS DENIED 10 11 31 98 484 129 88 1 2
APPS WITHDRAWN 4 2 2407 144 130
FILES CLOSED FOR INCOMPLETENESS 1 127 50
PA/PHILADELPHIA COUNTY/0288.00 90 37
LOANS ORIGINATED 4 11 5 42 195 235 643 109 234
APPS APPROVED, NOT ACCEPTED 4 1465 133
APPS DENIED 2 19 10 41 59 103 1535 178 230
APPS WITHDRAWN 2 166
FILES CLOSED FOR INCOMPLETENESS 2 1194 30
PA/PHILADELPHIA COUNTY/0289.01 91 51
LOANS ORIGINATED 1 20 2 47 498 37 1247 53 181
APPS APPROVED, NOT ACCEPTED 1 137 37
APPS DENIED 4 20 14 61 38 262 1204 200 272
APPS WITHDRAWN 2 6 1 11 147 100 502 75 40
FILES CLOSED FOR INCOMPLETENESS 2 113
06/02/2014Report Date:
AGGREGATE TABLE 1: DISPOSITION OF LOAN APPLICATIONS, BY LOCATION OF PROPERTY AND TYPE OF LOAN, 2013
MSA/MD: 37964 - PHILADELPHIA, PA
Page 176 of 199
ALL LOANS ON PROPERTY LOCATED IN MSA/MD 3/
CENSUS TRACT OR COUNTY NAME ANDDISPOSITION OF APPLICATION 1/(STATE/COUNTY/TRACT NUMBER) FHA, FSA/RHS & VA Conventional
Refinancings Home ImprovementLoans
Loans on DwellingsFor 5 or More
Families
NonoccupantLoans From
Columns A, B, Cand D
Number Number Number Number Number Number$000's $000's $000's $000's $000's $000's
A B C D E F
Home Purchase Loans
Loans on 1- to 4-Family and Manufactured Home Dwellings
Loans OnManufactured Home
Dwellings FromColumns A, B, C & D
G
Number $000's
%MinPop4/
MedianIncome As
PCT ofMSA/MDMedian

PA/PHILADELPHIA COUNTY/0289.02 92 42
LOANS ORIGINATED 2 20 9 612 991 96 1355 263 384
APPS APPROVED, NOT ACCEPTED 1 6 31 8 34 356 127
APPS DENIED 2 23 19 62 104 74 1532 272 319
APPS WITHDRAWN 1 10 2 2120 820 75 184
FILES CLOSED FOR INCOMPLETENESS 7 2515 35
PA/PHILADELPHIA COUNTY/0290.00 93 49
LOANS ORIGINATED 4 48 7 713 1140 312 4121 125 383
APPS APPROVED, NOT ACCEPTED 33 327 244
APPS DENIED 34 23 61 93 2765 328 353
APPS WITHDRAWN 1 9 2 187 715 26 45
FILES CLOSED FOR INCOMPLETENESS 10 2943 120
PA/PHILADELPHIA COUNTY/0291.00 90 37
LOANS ORIGINATED 8 26 8 147 699 620 2484 220 1685
APPS APPROVED, NOT ACCEPTED 1 388 258
APPS DENIED 5 24 6 131 93 366 1761 150 1029 1 2
APPS WITHDRAWN 9 41 102 668 293
FILES CLOSED FOR INCOMPLETENESS 2 184
PA/PHILADELPHIA COUNTY/0292.00 83 49
LOANS ORIGINATED 3 31 2 311 1210 477 3232 15 324
APPS APPROVED, NOT ACCEPTED 5 11 195 695 10
APPS DENIED 1 33 19 52 273 50 3063 256 263
APPS WITHDRAWN 17 13 396 1815 81
FILES CLOSED FOR INCOMPLETENESS 2 13 261 1228 108
PA/PHILADELPHIA COUNTY/0293.00 74 35
LOANS ORIGINATED 1 5 2 34 168 30 273 2 170
APPS APPROVED, NOT ACCEPTED 1 5 199 355 99
APPS DENIED 2 15 8 31 128 146 1082 53 266
APPS WITHDRAWN 31 141 244
FILES CLOSED FOR INCOMPLETENESS 2 1194 137
06/02/2014Report Date:
AGGREGATE TABLE 1: DISPOSITION OF LOAN APPLICATIONS, BY LOCATION OF PROPERTY AND TYPE OF LOAN, 2013
MSA/MD: 37964 - PHILADELPHIA, PA
Page 177 of 199
ALL LOANS ON PROPERTY LOCATED IN MSA/MD 3/
CENSUS TRACT OR COUNTY NAME ANDDISPOSITION OF APPLICATION 1/(STATE/COUNTY/TRACT NUMBER) FHA, FSA/RHS & VA Conventional
Refinancings Home ImprovementLoans
Loans on DwellingsFor 5 or More
Families
NonoccupantLoans From
Columns A, B, Cand D
Number Number Number Number Number Number$000's $000's $000's $000's $000's $000's
A B C D E F
Home Purchase Loans
Loans on 1- to 4-Family and Manufactured Home Dwellings
Loans OnManufactured Home
Dwellings FromColumns A, B, C & D
G
Number $000's
%MinPop4/
MedianIncome As
PCT ofMSA/MDMedian

PA/PHILADELPHIA COUNTY/0294.00 79 32
LOANS ORIGINATED 12 1 41153 5 621
APPS APPROVED, NOT ACCEPTED 3 1240 52
APPS DENIED 2 7 10 81 31 214 451 188 291
APPS WITHDRAWN 2 2 1146 122 76
FILES CLOSED FOR INCOMPLETENESS 2 143
PA/PHILADELPHIA COUNTY/0298.00 64 50
LOANS ORIGINATED 5 46 2 2717 1412 354 2896 35 1520
APPS APPROVED, NOT ACCEPTED 4 3263 191
APPS DENIED 35 16 71 91 2521 221 358
APPS WITHDRAWN 1 9 550 609 294
FILES CLOSED FOR INCOMPLETENESS 5 1419 60
PA/PHILADELPHIA COUNTY/0299.00 82 33
LOANS ORIGINATED 3 20 3 105 414 144 1164 12 554
APPS APPROVED, NOT ACCEPTED 6 3396 150
APPS DENIED 1 10 20 24 254 40 712 254 77
APPS WITHDRAWN 1 8 31 178 75 502 170
FILES CLOSED FOR INCOMPLETENESS 3 1198 61
PA/PHILADELPHIA COUNTY/0300.00 84 37
LOANS ORIGINATED 4 32 5 148 642 452 1712 94 1011
APPS APPROVED, NOT ACCEPTED 1 6 1 41 156 38 501 28 258
APPS DENIED 2 41 38 153 225 150 2902 571 756
APPS WITHDRAWN 81 113 637
FILES CLOSED FOR INCOMPLETENESS 42 180 276
PA/PHILADELPHIA COUNTY/0301.00 77 55
LOANS ORIGINATED 6 44 7 2 321 2599 631 4273 89 329 260
APPS APPROVED, NOT ACCEPTED 1 5 11 137 144 455 84
APPS DENIED 38 24 83 323 3876 641 446
APPS WITHDRAWN 1 8 1 21 98 131 904 20 157
FILES CLOSED FOR INCOMPLETENESS 1 8176 758
06/02/2014Report Date:
AGGREGATE TABLE 1: DISPOSITION OF LOAN APPLICATIONS, BY LOCATION OF PROPERTY AND TYPE OF LOAN, 2013
MSA/MD: 37964 - PHILADELPHIA, PA
Page 178 of 199
ALL LOANS ON PROPERTY LOCATED IN MSA/MD 3/
CENSUS TRACT OR COUNTY NAME ANDDISPOSITION OF APPLICATION 1/(STATE/COUNTY/TRACT NUMBER) FHA, FSA/RHS & VA Conventional
Refinancings Home ImprovementLoans
Loans on DwellingsFor 5 or More
Families
NonoccupantLoans From
Columns A, B, Cand D
Number Number Number Number Number Number$000's $000's $000's $000's $000's $000's
A B C D E F
Home Purchase Loans
Loans on 1- to 4-Family and Manufactured Home Dwellings
Loans OnManufactured Home
Dwellings FromColumns A, B, C & D
G
Number $000's
%MinPop4/
MedianIncome As
PCT ofMSA/MDMedian

PA/PHILADELPHIA COUNTY/0302.00 79 51
LOANS ORIGINATED 6 62 8 1521 2441 859 5909 79 1224 1 11
APPS APPROVED, NOT ACCEPTED 1 13 3180 1349 240
APPS DENIED 2 70 31 1 114 449 278 7238 658 50 688 1 20
APPS WITHDRAWN 1 19 1 21 93 150 1975 15 164
FILES CLOSED FOR INCOMPLETENESS 21 1 32 208 2423 152 364
PA/PHILADELPHIA COUNTY/0305.01 84 55
LOANS ORIGINATED 6 33 12 1318 1590 291 3545 167 2070
APPS APPROVED, NOT ACCEPTED 21 61 167
APPS DENIED 5 39 13 123 272 432 2884 206 590
APPS WITHDRAWN 3 9 1 25 485 184 789 65 115
FILES CLOSED FOR INCOMPLETENESS 2 62 133 4 478
PA/PHILADELPHIA COUNTY/0305.02 80 77
LOANS ORIGINATED 8 64 7 1 1420 1997 600 5634 57 175 1126
APPS APPROVED, NOT ACCEPTED 1 8 1 31 80 45 736 49 240
APPS DENIED 2 40 21 1 33 304 116 3710 269 900 167
APPS WITHDRAWN 2 17 1 33 363 284 1645 3 317
FILES CLOSED FOR INCOMPLETENESS 1 15 3256 1385 224
PA/PHILADELPHIA COUNTY/0306.00 54 85
LOANS ORIGINATED 11 79 10 1 1032 4240 1051 9447 246 3800 1339
APPS APPROVED, NOT ACCEPTED 2 10 2142 1479 302
APPS DENIED 5 52 18 132 300 379 5883 361 1814
APPS WITHDRAWN 2 17 2 11 113 208 1932 68 66
FILES CLOSED FOR INCOMPLETENESS 1 15 2 33 517 114 1437 79 289
PA/PHILADELPHIA COUNTY/0307.00 47 73
LOANS ORIGINATED 3 30 3 1 310 1306 444 3137 81 180 233
APPS APPROVED, NOT ACCEPTED 4 1505 62
APPS DENIED 3 14 15 32 253 266 1231 538 273
APPS WITHDRAWN 31 131 348
FILES CLOSED FOR INCOMPLETENESS 7 761
06/02/2014Report Date:
AGGREGATE TABLE 1: DISPOSITION OF LOAN APPLICATIONS, BY LOCATION OF PROPERTY AND TYPE OF LOAN, 2013
MSA/MD: 37964 - PHILADELPHIA, PA
Page 179 of 199
ALL LOANS ON PROPERTY LOCATED IN MSA/MD 3/
CENSUS TRACT OR COUNTY NAME ANDDISPOSITION OF APPLICATION 1/(STATE/COUNTY/TRACT NUMBER) FHA, FSA/RHS & VA Conventional
Refinancings Home ImprovementLoans
Loans on DwellingsFor 5 or More
Families
NonoccupantLoans From
Columns A, B, Cand D
Number Number Number Number Number Number$000's $000's $000's $000's $000's $000's
A B C D E F
Home Purchase Loans
Loans on 1- to 4-Family and Manufactured Home Dwellings
Loans OnManufactured Home
Dwellings FromColumns A, B, C & D
G
Number $000's
%MinPop4/
MedianIncome As
PCT ofMSA/MDMedian

PA/PHILADELPHIA COUNTY/0308.00 46 87
LOANS ORIGINATED 13 73 8 919 2843 1633 8149 442 919
APPS APPROVED, NOT ACCEPTED 13 12 270 1732 20
APPS DENIED 4 40 11 45 839 415 5419 383 393
APPS WITHDRAWN 4 9 1 21 221 427 1345 50 178
FILES CLOSED FOR INCOMPLETENESS 9 1356
PA/PHILADELPHIA COUNTY/0309.00 75 49
LOANS ORIGINATED 5 38 5 1112 1425 638 3952 71 1045
APPS APPROVED, NOT ACCEPTED 5 2716 105
APPS DENIED 30 8 63 377 3537 259 623
APPS WITHDRAWN 1 161 118 176 1971
FILES CLOSED FOR INCOMPLETENESS 8 22 276 848 222
PA/PHILADELPHIA COUNTY/0310.00 63 74
LOANS ORIGINATED 20 73 6 1725 3603 2418 8958 237 1882
APPS APPROVED, NOT ACCEPTED 1 14 1 13 357 120 1608 30 112
APPS DENIED 7 54 25 134 494 1083 6034 926 1385
APPS WITHDRAWN 4 19 2 42 233 284 2655 160 421
FILES CLOSED FOR INCOMPLETENESS 14 13 390 1624 25
PA/PHILADELPHIA COUNTY/0311.01 78 52
LOANS ORIGINATED 7 45 5 2617 1823 564 4202 69 2277
APPS APPROVED, NOT ACCEPTED 3 1316 108
APPS DENIED 2 31 12 93 356 167 3191 435 739
APPS WITHDRAWN 1 15 23 371 450 1330 544
FILES CLOSED FOR INCOMPLETENESS 11 51 118 1132 523
PA/PHILADELPHIA COUNTY/0311.02 80 41
LOANS ORIGINATED 5 43 2 1119 1881 406 3547 166 844
APPS APPROVED, NOT ACCEPTED 1 10 2 21 74 167 796 20 159
APPS DENIED 2 40 19 53 325 151 3309 269 480
APPS WITHDRAWN 2 12 5115 1021 380
FILES CLOSED FOR INCOMPLETENESS 121 62 1138
06/02/2014Report Date:
AGGREGATE TABLE 1: DISPOSITION OF LOAN APPLICATIONS, BY LOCATION OF PROPERTY AND TYPE OF LOAN, 2013
MSA/MD: 37964 - PHILADELPHIA, PA
Page 180 of 199
ALL LOANS ON PROPERTY LOCATED IN MSA/MD 3/
CENSUS TRACT OR COUNTY NAME ANDDISPOSITION OF APPLICATION 1/(STATE/COUNTY/TRACT NUMBER) FHA, FSA/RHS & VA Conventional
Refinancings Home ImprovementLoans
Loans on DwellingsFor 5 or More
Families
NonoccupantLoans From
Columns A, B, Cand D
Number Number Number Number Number Number$000's $000's $000's $000's $000's $000's
A B C D E F
Home Purchase Loans
Loans on 1- to 4-Family and Manufactured Home Dwellings
Loans OnManufactured Home
Dwellings FromColumns A, B, C & D
G
Number $000's
%MinPop4/
MedianIncome As
PCT ofMSA/MDMedian

PA/PHILADELPHIA COUNTY/0312.00 79 67
LOANS ORIGINATED 6 33 3 1218 2041 637 2930 107 1098
APPS APPROVED, NOT ACCEPTED 10 2 1 4977 29 15400 347
APPS DENIED 2 22 10 1 43 337 205 2048 89 15000 171
APPS WITHDRAWN 12 12 243 1158 75
FILES CLOSED FOR INCOMPLETENESS 9 1615 73
PA/PHILADELPHIA COUNTY/0313.00 73 48
LOANS ORIGINATED 13 56 8 246 612 1142 5084 343 2319
APPS APPROVED, NOT ACCEPTED 1 6 175 573 75
APPS DENIED 2 30 12 52 219 166 2854 256 510
APPS WITHDRAWN 1 11 1 31 123 40 1056 10 249
FILES CLOSED FOR INCOMPLETENESS 72 234 772
PA/PHILADELPHIA COUNTY/0314.01 69 45
LOANS ORIGINATED 17 40 4 217 856 1355 3699 65 1979
APPS APPROVED, NOT ACCEPTED 5 3618 292
APPS DENIED 1 38 21 112 292 64 3527 275 465 1 2
APPS WITHDRAWN 2 13 81 136 146 1140 668
FILES CLOSED FOR INCOMPLETENESS 3 4 1 1239 414 55 73
PA/PHILADELPHIA COUNTY/0314.02 64 67
LOANS ORIGINATED 23 37 6 164 440 2009 3435 125 1494
APPS APPROVED, NOT ACCEPTED 1 5 2 11 133 75 389 20 75
APPS DENIED 2 15 16 41 119 185 1099 350 281 1 6
APPS WITHDRAWN 1 12 2162 1125 222
FILES CLOSED FOR INCOMPLETENESS 8 1 11 121 737 50 113
PA/PHILADELPHIA COUNTY/0315.01 19 86
LOANS ORIGINATED 26 107 10 1429 3913 2521 10657 240 1277
APPS APPROVED, NOT ACCEPTED 2 11 31 120 143 1119 283
APPS DENIED 5 43 15 64 525 485 5013 313 604
APPS WITHDRAWN 3 23 1 6317 2176 10 591
FILES CLOSED FOR INCOMPLETENESS 1 9 2 12 273 87 833 134 87
06/02/2014Report Date:
AGGREGATE TABLE 1: DISPOSITION OF LOAN APPLICATIONS, BY LOCATION OF PROPERTY AND TYPE OF LOAN, 2013
MSA/MD: 37964 - PHILADELPHIA, PA
Page 181 of 199
ALL LOANS ON PROPERTY LOCATED IN MSA/MD 3/
CENSUS TRACT OR COUNTY NAME ANDDISPOSITION OF APPLICATION 1/(STATE/COUNTY/TRACT NUMBER) FHA, FSA/RHS & VA Conventional
Refinancings Home ImprovementLoans
Loans on DwellingsFor 5 or More
Families
NonoccupantLoans From
Columns A, B, Cand D
Number Number Number Number Number Number$000's $000's $000's $000's $000's $000's
A B C D E F
Home Purchase Loans
Loans on 1- to 4-Family and Manufactured Home Dwellings
Loans OnManufactured Home
Dwellings FromColumns A, B, C & D
G
Number $000's
%MinPop4/
MedianIncome As
PCT ofMSA/MDMedian
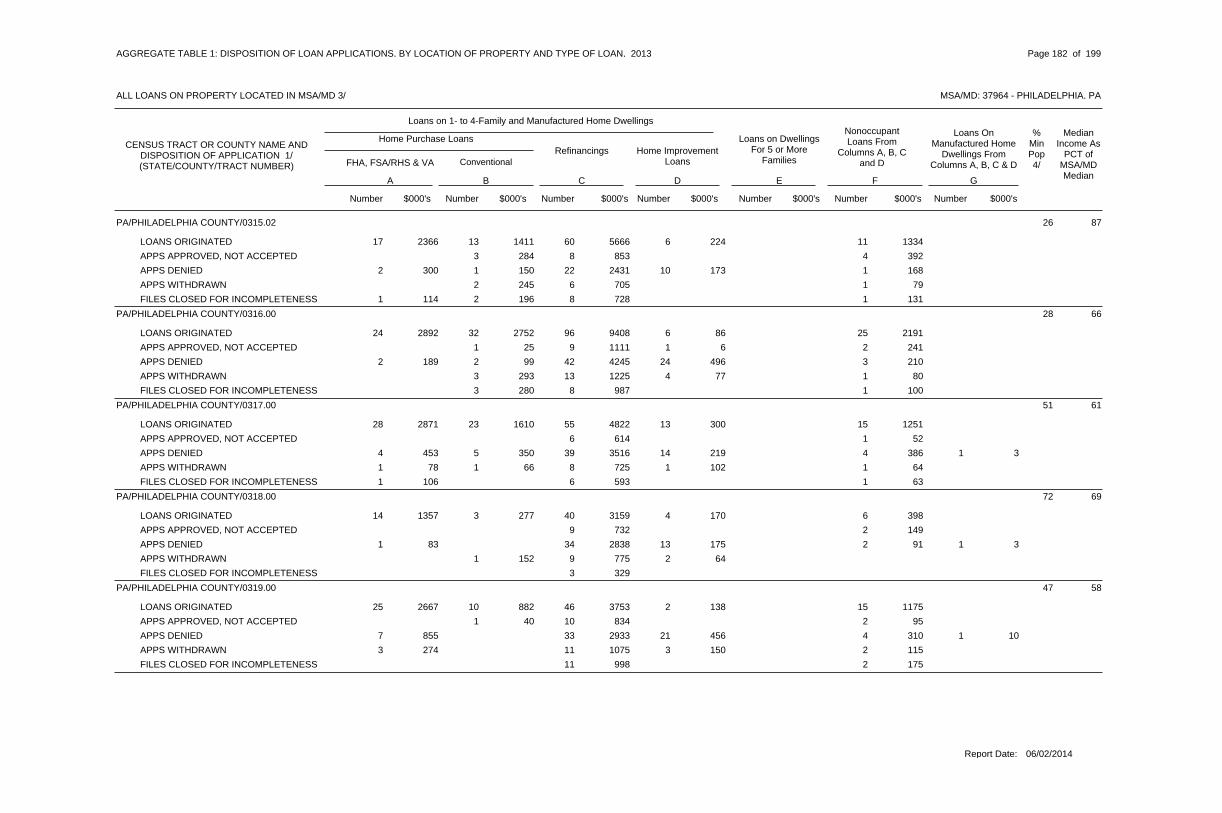
PA/PHILADELPHIA COUNTY/0315.02 26 87
LOANS ORIGINATED 13 60 6 1117 2366 1411 5666 224 1334
APPS APPROVED, NOT ACCEPTED 3 8 4284 853 392
APPS DENIED 1 22 10 12 300 150 2431 173 168
APPS WITHDRAWN 2 6 1245 705 79
FILES CLOSED FOR INCOMPLETENESS 2 8 11 114 196 728 131
PA/PHILADELPHIA COUNTY/0316.00 28 66
LOANS ORIGINATED 32 96 6 2524 2892 2752 9408 86 2191
APPS APPROVED, NOT ACCEPTED 1 9 1 225 1111 6 241
APPS DENIED 2 42 24 32 189 99 4245 496 210
APPS WITHDRAWN 3 13 4 1293 1225 77 80
FILES CLOSED FOR INCOMPLETENESS 3 8 1280 987 100
PA/PHILADELPHIA COUNTY/0317.00 51 61
LOANS ORIGINATED 23 55 13 1528 2871 1610 4822 300 1251
APPS APPROVED, NOT ACCEPTED 6 1614 52
APPS DENIED 5 39 14 44 453 350 3516 219 386 1 3
APPS WITHDRAWN 1 8 1 11 78 66 725 102 64
FILES CLOSED FOR INCOMPLETENESS 6 11 106 593 63
PA/PHILADELPHIA COUNTY/0318.00 72 69
LOANS ORIGINATED 3 40 4 614 1357 277 3159 170 398
APPS APPROVED, NOT ACCEPTED 9 2732 149
APPS DENIED 34 13 21 83 2838 175 91 1 3
APPS WITHDRAWN 1 9 2152 775 64
FILES CLOSED FOR INCOMPLETENESS 3 329
PA/PHILADELPHIA COUNTY/0319.00 47 58
LOANS ORIGINATED 10 46 2 1525 2667 882 3753 138 1175
APPS APPROVED, NOT ACCEPTED 1 10 240 834 95
APPS DENIED 33 21 47 855 2933 456 310 1 10
APPS WITHDRAWN 11 3 23 274 1075 150 115
FILES CLOSED FOR INCOMPLETENESS 11 2998 175
06/02/2014Report Date:
AGGREGATE TABLE 1: DISPOSITION OF LOAN APPLICATIONS, BY LOCATION OF PROPERTY AND TYPE OF LOAN, 2013
MSA/MD: 37964 - PHILADELPHIA, PA
Page 182 of 199
ALL LOANS ON PROPERTY LOCATED IN MSA/MD 3/
CENSUS TRACT OR COUNTY NAME ANDDISPOSITION OF APPLICATION 1/(STATE/COUNTY/TRACT NUMBER) FHA, FSA/RHS & VA Conventional
Refinancings Home ImprovementLoans
Loans on DwellingsFor 5 or More
Families
NonoccupantLoans From
Columns A, B, Cand D
Number Number Number Number Number Number$000's $000's $000's $000's $000's $000's
A B C D E F
Home Purchase Loans
Loans on 1- to 4-Family and Manufactured Home Dwellings
Loans OnManufactured Home
Dwellings FromColumns A, B, C & D
G
Number $000's
%MinPop4/
MedianIncome As
PCT ofMSA/MDMedian

PA/PHILADELPHIA COUNTY/0320.00 36 58
LOANS ORIGINATED 19 89 9 2548 4719 1387 7653 195 1973
APPS APPROVED, NOT ACCEPTED 14 21 80 1451 289
APPS DENIED 4 52 22 84 378 389 4558 451 462
APPS WITHDRAWN 2 16 1 32 191 166 1585 15 293
FILES CLOSED FOR INCOMPLETENESS 20 1 32 157 1830 120 245
PA/PHILADELPHIA COUNTY/0321.00 46 50
LOANS ORIGINATED 3 32 6 1 916 1775 273 2740 173 962 598
APPS APPROVED, NOT ACCEPTED 6 21 123 534 126
APPS DENIED 1 21 13 32 116 120 1869 201 121
APPS WITHDRAWN 8 12 270 710 78
FILES CLOSED FOR INCOMPLETENESS 6 1 1481 5 5
PA/PHILADELPHIA COUNTY/0323.00 45 63
LOANS ORIGINATED 5 34 9 1 1519 1905 412 2626 237 425 993
APPS APPROVED, NOT ACCEPTED 1 4118 449
APPS DENIED 3 34 6 63 274 310 2815 89 421 1 7
APPS WITHDRAWN 2 7 2130 823 115
FILES CLOSED FOR INCOMPLETENESS 7 2691 114
PA/PHILADELPHIA COUNTY/0325.00 35 60
LOANS ORIGINATED 13 68 9 1 1228 2694 987 6130 216 245 921
APPS APPROVED, NOT ACCEPTED 1 32 136 91 254
APPS DENIED 7 44 11 63 299 468 4101 179 384
APPS WITHDRAWN 6 20 3 42 165 511 1807 94 197
FILES CLOSED FOR INCOMPLETENESS 12 11109 30
PA/PHILADELPHIA COUNTY/0326.00 30 66
LOANS ORIGINATED 14 91 9 2148 5191 1277 8429 218 1789
APPS APPROVED, NOT ACCEPTED 1 11 22 230 75 1122 176
APPS DENIED 1 47 17 85 519 88 4710 304 652
APPS WITHDRAWN 2 13 2150 1336 149
FILES CLOSED FOR INCOMPLETENESS 12 1 11229 18 116
06/02/2014Report Date:
AGGREGATE TABLE 1: DISPOSITION OF LOAN APPLICATIONS, BY LOCATION OF PROPERTY AND TYPE OF LOAN, 2013
MSA/MD: 37964 - PHILADELPHIA, PA
Page 183 of 199
ALL LOANS ON PROPERTY LOCATED IN MSA/MD 3/
CENSUS TRACT OR COUNTY NAME ANDDISPOSITION OF APPLICATION 1/(STATE/COUNTY/TRACT NUMBER) FHA, FSA/RHS & VA Conventional
Refinancings Home ImprovementLoans
Loans on DwellingsFor 5 or More
Families
NonoccupantLoans From
Columns A, B, Cand D
Number Number Number Number Number Number$000's $000's $000's $000's $000's $000's
A B C D E F
Home Purchase Loans
Loans on 1- to 4-Family and Manufactured Home Dwellings
Loans OnManufactured Home
Dwellings FromColumns A, B, C & D
G
Number $000's
%MinPop4/
MedianIncome As
PCT ofMSA/MDMedian

PA/PHILADELPHIA COUNTY/0329.00 40 59
LOANS ORIGINATED 11 50 8 1729 3104 872 5099 174 1592
APPS APPROVED, NOT ACCEPTED 9 21042 119
APPS DENIED 1 36 7 92 254 124 3385 44 781
APPS WITHDRAWN 2 14 23 372 101 1577 176
FILES CLOSED FOR INCOMPLETENESS 1 5 1 11 72 47 610 112 147
PA/PHILADELPHIA COUNTY/0330.00 36 54
LOANS ORIGINATED 20 104 15 3131 3357 1565 10444 470 3637
APPS APPROVED, NOT ACCEPTED 1 13 1 22 217 68 1118 25 176
APPS DENIED 2 39 27 53 235 115 4026 305 452
APPS WITHDRAWN 4 21 1 34 426 359 2105 12 203
FILES CLOSED FOR INCOMPLETENESS 2 23 1 13 282 134 2159 85 70
PA/PHILADELPHIA COUNTY/0331.01 13 91
LOANS ORIGINATED 29 83 4 1835 4675 2832 8343 162 1641
APPS APPROVED, NOT ACCEPTED 102 231 1083
APPS DENIED 3 32 21 73 321 297 3362 448 703
APPS WITHDRAWN 2 13 1 11 280 200 1584 53 94
FILES CLOSED FOR INCOMPLETENESS 13 11277 50
PA/PHILADELPHIA COUNTY/0331.02 16 82
LOANS ORIGINATED 17 58 4 1 618 2539 1977 5289 184 3900 575
APPS APPROVED, NOT ACCEPTED 8 12 254 1240 154
APPS DENIED 3 26 3 21 172 411 3209 194 181
APPS WITHDRAWN 2 10 4 21 112 253 1132 263 146
FILES CLOSED FOR INCOMPLETENESS 1 11 1 173 1397 80 315
PA/PHILADELPHIA COUNTY/0332.00 17 102
LOANS ORIGINATED 12 45 7 48 1442 1471 5748 305 516
APPS APPROVED, NOT ACCEPTED 3 1570 131
APPS DENIED 3 17 4 47 1083 465 2505 46 573
APPS WITHDRAWN 2 8 1 1229 1042 20 109
FILES CLOSED FOR INCOMPLETENESS 7 938
06/02/2014Report Date:
AGGREGATE TABLE 1: DISPOSITION OF LOAN APPLICATIONS, BY LOCATION OF PROPERTY AND TYPE OF LOAN, 2013
MSA/MD: 37964 - PHILADELPHIA, PA
Page 184 of 199
ALL LOANS ON PROPERTY LOCATED IN MSA/MD 3/
CENSUS TRACT OR COUNTY NAME ANDDISPOSITION OF APPLICATION 1/(STATE/COUNTY/TRACT NUMBER) FHA, FSA/RHS & VA Conventional
Refinancings Home ImprovementLoans
Loans on DwellingsFor 5 or More
Families
NonoccupantLoans From
Columns A, B, Cand D
Number Number Number Number Number Number$000's $000's $000's $000's $000's $000's
A B C D E F
Home Purchase Loans
Loans on 1- to 4-Family and Manufactured Home Dwellings
Loans OnManufactured Home
Dwellings FromColumns A, B, C & D
G
Number $000's
%MinPop4/
MedianIncome As
PCT ofMSA/MDMedian

PA/PHILADELPHIA COUNTY/0333.00 21 93
LOANS ORIGINATED 12 68 6 2 214 2213 1926 8265 258 1350 119 1 28
APPS APPROVED, NOT ACCEPTED 6 1040
APPS DENIED 20 11 12816 214 2125 1 10
APPS WITHDRAWN 1 12 1 1173 1613 15 200
FILES CLOSED FOR INCOMPLETENESS 6 11033 100
PA/PHILADELPHIA COUNTY/0334.00 40 70
LOANS ORIGINATED 17 47 7 813 2208 2018 5757 328 998 1 136
APPS APPROVED, NOT ACCEPTED 1 13 1 31 182 206 2033 5 465
APPS DENIED 5 22 9 31 98 293 2989 290 321
APPS WITHDRAWN 2 14 21 156 264 1752 255
FILES CLOSED FOR INCOMPLETENESS 10 1211
PA/PHILADELPHIA COUNTY/0335.00 41 65
LOANS ORIGINATED 21 42 2 1411 1739 2524 5312 148 1810
APPS APPROVED, NOT ACCEPTED 1 4 175 424 75
APPS DENIED 2 23 5 33 428 165 2630 172 335
APPS WITHDRAWN 1 10 1 21 144 143 1381 154 299
FILES CLOSED FOR INCOMPLETENESS 2 9 1 2219 1357 40 233
PA/PHILADELPHIA COUNTY/0336.00 30 91
LOANS ORIGINATED 18 100 12 1 2215 2424 2694 12479 539 350 2636
APPS APPROVED, NOT ACCEPTED 1 12 22 482 122 1703 271
APPS DENIED 7 30 4 33 503 737 4226 130 185
APPS WITHDRAWN 1 26 1 31 157 244 3996 10 477
FILES CLOSED FOR INCOMPLETENESS 1 92 419 180 1245
PA/PHILADELPHIA COUNTY/0337.01 25 62
LOANS ORIGINATED 15 44 5 916 2556 1728 5619 222 1065
APPS APPROVED, NOT ACCEPTED 1 3 11 124 34 268 60
APPS DENIED 3 18 17 1333 2293 585 55 1 2
APPS WITHDRAWN 2 12 1 11 182 230 1721 20 143
FILES CLOSED FOR INCOMPLETENESS 8 1109
06/02/2014Report Date:
AGGREGATE TABLE 1: DISPOSITION OF LOAN APPLICATIONS, BY LOCATION OF PROPERTY AND TYPE OF LOAN, 2013
MSA/MD: 37964 - PHILADELPHIA, PA
Page 185 of 199
ALL LOANS ON PROPERTY LOCATED IN MSA/MD 3/
CENSUS TRACT OR COUNTY NAME ANDDISPOSITION OF APPLICATION 1/(STATE/COUNTY/TRACT NUMBER) FHA, FSA/RHS & VA Conventional
Refinancings Home ImprovementLoans
Loans on DwellingsFor 5 or More
Families
NonoccupantLoans From
Columns A, B, Cand D
Number Number Number Number Number Number$000's $000's $000's $000's $000's $000's
A B C D E F
Home Purchase Loans
Loans on 1- to 4-Family and Manufactured Home Dwellings
Loans OnManufactured Home
Dwellings FromColumns A, B, C & D
G
Number $000's
%MinPop4/
MedianIncome As
PCT ofMSA/MDMedian

PA/PHILADELPHIA COUNTY/0337.02 30 87
LOANS ORIGINATED 23 84 5 713 2129 2805 12264 337 899
APPS APPROVED, NOT ACCEPTED 1 12185 2348
APPS DENIED 3 36 9 62 286 340 4935 367 493
APPS WITHDRAWN 3 22 1 11 169 401 3164 50 160
FILES CLOSED FOR INCOMPLETENESS 1 9 2 21 172 192 1516 145 169
PA/PHILADELPHIA COUNTY/0338.00 25 80
LOANS ORIGINATED 7 99 9 3 831 4647 836 12161 204 8096 939
APPS APPROVED, NOT ACCEPTED 2 10 1 11 157 198 1485 130 10 1 32
APPS DENIED 3 30 20 43 523 311 3666 495 323
APPS WITHDRAWN 3 19 1 14 600 354 3040 40 105
FILES CLOSED FOR INCOMPLETENESS 9 11 172 980 15
PA/PHILADELPHIA COUNTY/0339.00 23 100
LOANS ORIGINATED 15 58 2 2 915 2657 2246 7398 19 366 1121
APPS APPROVED, NOT ACCEPTED 1 10158 1628
APPS DENIED 1 19 54 818 105 2331 471
APPS WITHDRAWN 2 12 11 133 284 1684 375
FILES CLOSED FOR INCOMPLETENESS 71 219 1273
PA/PHILADELPHIA COUNTY/0340.00 19 104
LOANS ORIGINATED 12 53 5 620 3781 1667 7790 302 886
APPS APPROVED, NOT ACCEPTED 12 1956
APPS DENIED 5 16 4 17 1334 965 3256 200 140
APPS WITHDRAWN 1 102 576 288 1406
FILES CLOSED FOR INCOMPLETENESS 8 1400 1 290
PA/PHILADELPHIA COUNTY/0341.00 15 91
LOANS ORIGINATED 27 85 8 1223 4035 4074 11359 220 1680
APPS APPROVED, NOT ACCEPTED 10 11362 79
APPS DENIED 4 33 14 27 1075 573 5330 393 305
APPS WITHDRAWN 2 20303 3238
FILES CLOSED FOR INCOMPLETENESS 3 22 3 41 202 303 3003 157 458
06/02/2014Report Date:
AGGREGATE TABLE 1: DISPOSITION OF LOAN APPLICATIONS, BY LOCATION OF PROPERTY AND TYPE OF LOAN, 2013
MSA/MD: 37964 - PHILADELPHIA, PA
Page 186 of 199
ALL LOANS ON PROPERTY LOCATED IN MSA/MD 3/
CENSUS TRACT OR COUNTY NAME ANDDISPOSITION OF APPLICATION 1/(STATE/COUNTY/TRACT NUMBER) FHA, FSA/RHS & VA Conventional
Refinancings Home ImprovementLoans
Loans on DwellingsFor 5 or More
Families
NonoccupantLoans From
Columns A, B, Cand D
Number Number Number Number Number Number$000's $000's $000's $000's $000's $000's
A B C D E F
Home Purchase Loans
Loans on 1- to 4-Family and Manufactured Home Dwellings
Loans OnManufactured Home
Dwellings FromColumns A, B, C & D
G
Number $000's
%MinPop4/
MedianIncome As
PCT ofMSA/MDMedian

PA/PHILADELPHIA COUNTY/0342.00 17 82
LOANS ORIGINATED 17 47 4 46 1203 3087 6774 255 748
APPS APPROVED, NOT ACCEPTED 21 383 292
APPS DENIED 3 18 7 1490 3313 63 115
APPS WITHDRAWN 2 6 1211 961 168
FILES CLOSED FOR INCOMPLETENESS 1 6175 961
PA/PHILADELPHIA COUNTY/0344.00 21 123
LOANS ORIGINATED 49 148 19 619 4152 8888 27408 896 711 1 20
APPS APPROVED, NOT ACCEPTED 1 14 22 415 237 3310 45
APPS DENIED 5 59 9 13 627 1137 11922 219 98
APPS WITHDRAWN 4 29 2 12 316 671 6675 145 250
FILES CLOSED FOR INCOMPLETENESS 29 2 11 168 5214 185 166
PA/PHILADELPHIA COUNTY/0345.01 31 37
LOANS ORIGINATED 7 22 1 44 639 1641 3494 105 596
APPS APPROVED, NOT ACCEPTED 2 289
APPS DENIED 3 21 216 666 85
APPS WITHDRAWN 1 4174 643
FILES CLOSED FOR INCOMPLETENESS 2 1157 6
PA/PHILADELPHIA COUNTY/0345.02 36 71
LOANS ORIGINATED 18 54 4 105 951 3104 6649 111 2259
APPS APPROVED, NOT ACCEPTED 9 21167 271
APPS DENIED 7 40 7 93 445 822 5034 185 794
APPS WITHDRAWN 4 20 4478 3216 506
FILES CLOSED FOR INCOMPLETENESS 1 18 3114 2635 425
PA/PHILADELPHIA COUNTY/0346.00 48 66
LOANS ORIGINATED 11 19 3 21 328 1407 3497 88 220
APPS APPROVED, NOT ACCEPTED 10 11887 74
APPS DENIED 4 10 2 1593 2157 30 80
APPS WITHDRAWN 1 6356 944
FILES CLOSED FOR INCOMPLETENESS 1 6 1300 1533 10
06/02/2014Report Date:
AGGREGATE TABLE 1: DISPOSITION OF LOAN APPLICATIONS, BY LOCATION OF PROPERTY AND TYPE OF LOAN, 2013
MSA/MD: 37964 - PHILADELPHIA, PA
Page 187 of 199
ALL LOANS ON PROPERTY LOCATED IN MSA/MD 3/
CENSUS TRACT OR COUNTY NAME ANDDISPOSITION OF APPLICATION 1/(STATE/COUNTY/TRACT NUMBER) FHA, FSA/RHS & VA Conventional
Refinancings Home ImprovementLoans
Loans on DwellingsFor 5 or More
Families
NonoccupantLoans From
Columns A, B, Cand D
Number Number Number Number Number Number$000's $000's $000's $000's $000's $000's
A B C D E F
Home Purchase Loans
Loans on 1- to 4-Family and Manufactured Home Dwellings
Loans OnManufactured Home
Dwellings FromColumns A, B, C & D
G
Number $000's
%MinPop4/
MedianIncome As
PCT ofMSA/MDMedian

PA/PHILADELPHIA COUNTY/0347.01 35 81
LOANS ORIGINATED 20 96 14 626 4444 2612 12906 675 676
APPS APPROVED, NOT ACCEPTED 1 11 22 415 64 1521 133
APPS DENIED 4 49 8 13 537 699 7413 62 176
APPS WITHDRAWN 2 19 1 12 333 337 2562 15 69
FILES CLOSED FOR INCOMPLETENESS 1 10 1 1124 1666 35 124
PA/PHILADELPHIA COUNTY/0347.02 19 108
LOANS ORIGINATED 22 97 6 214 2411 3997 13481 312 235
APPS APPROVED, NOT ACCEPTED 9 1 21 203 1722 20 267
APPS DENIED 2 33 10 1165 5574 160 128
APPS WITHDRAWN 2 23280 3838
FILES CLOSED FOR INCOMPLETENESS 1 9 1244 1633 25
PA/PHILADELPHIA COUNTY/0348.01 12 91
LOANS ORIGINATED 5 50 12 720 2932 492 6247 504 760
APPS APPROVED, NOT ACCEPTED 4 1536 139
APPS DENIED 1 19 3 11 120 67 2289 60 156
APPS WITHDRAWN 1 11 21 162 153 1285 262
FILES CLOSED FOR INCOMPLETENESS 3 1 1325 25 147
PA/PHILADELPHIA COUNTY/0348.02 36 100
LOANS ORIGINATED 9 68 13 817 3043 1172 8684 526 968
APPS APPROVED, NOT ACCEPTED 2 7 1280 932 31
APPS DENIED 3 28 10 11 136 276 4076 220 99
APPS WITHDRAWN 1 14 21 173 143 2005 266
FILES CLOSED FOR INCOMPLETENESS 2 13 3227 1287 350
PA/PHILADELPHIA COUNTY/0348.03 15 81
LOANS ORIGINATED 21 85 18 619 3443 2925 9496 431 581
APPS APPROVED, NOT ACCEPTED 141 181 2294
APPS DENIED 1 29 11 31 176 113 4216 276 284
APPS WITHDRAWN 3 17 1421 2652 129
FILES CLOSED FOR INCOMPLETENESS 1 10120 1294
06/02/2014Report Date:
AGGREGATE TABLE 1: DISPOSITION OF LOAN APPLICATIONS, BY LOCATION OF PROPERTY AND TYPE OF LOAN, 2013
MSA/MD: 37964 - PHILADELPHIA, PA
Page 188 of 199
ALL LOANS ON PROPERTY LOCATED IN MSA/MD 3/
CENSUS TRACT OR COUNTY NAME ANDDISPOSITION OF APPLICATION 1/(STATE/COUNTY/TRACT NUMBER) FHA, FSA/RHS & VA Conventional
Refinancings Home ImprovementLoans
Loans on DwellingsFor 5 or More
Families
NonoccupantLoans From
Columns A, B, Cand D
Number Number Number Number Number Number$000's $000's $000's $000's $000's $000's
A B C D E F
Home Purchase Loans
Loans on 1- to 4-Family and Manufactured Home Dwellings
Loans OnManufactured Home
Dwellings FromColumns A, B, C & D
G
Number $000's
%MinPop4/
MedianIncome As
PCT ofMSA/MDMedian

PA/PHILADELPHIA COUNTY/0349.00 38 56
LOANS ORIGINATED 16 64 9 2 1219 2821 1508 6423 236 2435 1480
APPS APPROVED, NOT ACCEPTED 2 12 1 1179 1181 50 115
APPS DENIED 10 47 17 92 192 927 5043 584 1025 1 3
APPS WITHDRAWN 2 20 3116 2508 188
FILES CLOSED FOR INCOMPLETENESS 13 1 21 175 1604 75 162
PA/PHILADELPHIA COUNTY/0351.00 9 97
LOANS ORIGINATED 38 71 3 1 57 875 4247 8491 264 16000 508
APPS APPROVED, NOT ACCEPTED 3 9 1 3283 1112 25 356
APPS DENIED 6 23 4 32 191 614 3190 201 418
APPS WITHDRAWN 1 17196 2189
FILES CLOSED FOR INCOMPLETENESS 3 4 2279 413 215
PA/PHILADELPHIA COUNTY/0352.00 12 105
LOANS ORIGINATED 32 93 17 109 2105 5995 15063 1185 1358
APPS APPROVED, NOT ACCEPTED 12 12 348 2081 123
APPS DENIED 6 27 53 613 1325 5561 268
APPS WITHDRAWN 8 21 2 32 474 1439 3574 105 469
FILES CLOSED FOR INCOMPLETENESS 1 13 11 130 200 2428 225
PA/PHILADELPHIA COUNTY/0353.01 13 95
LOANS ORIGINATED 17 106 11 516 2626 2155 11875 524 578
APPS APPROVED, NOT ACCEPTED 10 21 173 1485 15
APPS DENIED 3 29 9 33 492 334 3431 225 224
APPS WITHDRAWN 1 21 3 11 170 170 2918 216 139
FILES CLOSED FOR INCOMPLETENESS 19 2 32728 57 348
PA/PHILADELPHIA COUNTY/0353.02 16 85
LOANS ORIGINATED 14 71 12 918 3062 2178 7939 317 1102
APPS APPROVED, NOT ACCEPTED 11 2 31 287 1509 520 718
APPS DENIED 3 37 9 32 584 473 5421 288 333
APPS WITHDRAWN 2 14 4 62 301 280 2273 555 837
FILES CLOSED FOR INCOMPLETENESS 1 11 164 1743 25
06/02/2014Report Date:
AGGREGATE TABLE 1: DISPOSITION OF LOAN APPLICATIONS, BY LOCATION OF PROPERTY AND TYPE OF LOAN, 2013
MSA/MD: 37964 - PHILADELPHIA, PA
Page 189 of 199
ALL LOANS ON PROPERTY LOCATED IN MSA/MD 3/
CENSUS TRACT OR COUNTY NAME ANDDISPOSITION OF APPLICATION 1/(STATE/COUNTY/TRACT NUMBER) FHA, FSA/RHS & VA Conventional
Refinancings Home ImprovementLoans
Loans on DwellingsFor 5 or More
Families
NonoccupantLoans From
Columns A, B, Cand D
Number Number Number Number Number Number$000's $000's $000's $000's $000's $000's
A B C D E F
Home Purchase Loans
Loans on 1- to 4-Family and Manufactured Home Dwellings
Loans OnManufactured Home
Dwellings FromColumns A, B, C & D
G
Number $000's
%MinPop4/
MedianIncome As
PCT ofMSA/MDMedian

PA/PHILADELPHIA COUNTY/0355.00 24 87
LOANS ORIGINATED 50 97 16 3 1818 3715 7141 14177 796 9068 2072
APPS APPROVED, NOT ACCEPTED 3 13 2274 2437 175
APPS DENIED 2 45 17 42 358 228 7649 433 434 2 179
APPS WITHDRAWN 8 22 52 395 1067 3952 639
FILES CLOSED FOR INCOMPLETENESS 2 13 2 2434 1876 130 173
PA/PHILADELPHIA COUNTY/0356.01 14 113
LOANS ORIGINATED 22 84 13 912 2789 4059 12107 908 1205
APPS APPROVED, NOT ACCEPTED 2 7529 864
APPS DENIED 2 36 4 24 962 250 5473 424 117
APPS WITHDRAWN 3 18 2 2319 3195 37 145
FILES CLOSED FOR INCOMPLETENESS 3 17 21 285 438 3515 515
PA/PHILADELPHIA COUNTY/0356.02 32 113
LOANS ORIGINATED 23 61 1 17 1598 4366 12277 36 199
APPS APPROVED, NOT ACCEPTED 9 21635 310
APPS DENIED 4 21 5 1882 3897 68 108
APPS WITHDRAWN 2 17 1 2440 2690 40 240
FILES CLOSED FOR INCOMPLETENESS 1 13 1256 2875 12
PA/PHILADELPHIA COUNTY/0357.01 45 66
LOANS ORIGINATED 9 51 3 1 226 1226 1127 6763 102 12900 2740 1 125
APPS APPROVED, NOT ACCEPTED 1 73 532 123 1019
APPS DENIED 4 21 11 72 358 445 2635 171 772
APPS WITHDRAWN 2 14 1 1 73 400 226 1671 70 12091 795
FILES CLOSED FOR INCOMPLETENESS 3 5 3333 827 350
PA/PHILADELPHIA COUNTY/0357.02 19 78
LOANS ORIGINATED 12 51 3 1712 2409 1772 7247 12 2236 1 4
APPS APPROVED, NOT ACCEPTED 1 4 1 1192 613 140 140
APPS DENIED 5 22 5 2813 3345 84 322 1 4
APPS WITHDRAWN 2 12 1 63 591 310 1713 173 751
FILES CLOSED FOR INCOMPLETENESS 1 3 1188 420 105
06/02/2014Report Date:
AGGREGATE TABLE 1: DISPOSITION OF LOAN APPLICATIONS, BY LOCATION OF PROPERTY AND TYPE OF LOAN, 2013
MSA/MD: 37964 - PHILADELPHIA, PA
Page 190 of 199
ALL LOANS ON PROPERTY LOCATED IN MSA/MD 3/
CENSUS TRACT OR COUNTY NAME ANDDISPOSITION OF APPLICATION 1/(STATE/COUNTY/TRACT NUMBER) FHA, FSA/RHS & VA Conventional
Refinancings Home ImprovementLoans
Loans on DwellingsFor 5 or More
Families
NonoccupantLoans From
Columns A, B, Cand D
Number Number Number Number Number Number$000's $000's $000's $000's $000's $000's
A B C D E F
Home Purchase Loans
Loans on 1- to 4-Family and Manufactured Home Dwellings
Loans OnManufactured Home
Dwellings FromColumns A, B, C & D
G
Number $000's
%MinPop4/
MedianIncome As
PCT ofMSA/MDMedian

PA/PHILADELPHIA COUNTY/0358.00 21 101
LOANS ORIGINATED 33 120 10 1126 5129 5531 19651 564 2673
APPS APPROVED, NOT ACCEPTED 1 131 178 152 2475
APPS DENIED 7 52 5 41 177 1153 7576 135 255
APPS WITHDRAWN 2 23 2 2485 3555 50 252
FILES CLOSED FOR INCOMPLETENESS 17 1 12410 25 100
PA/PHILADELPHIA COUNTY/0359.00 22 99
LOANS ORIGINATED 17 107 6 114 2842 2914 14495 269 137
APPS APPROVED, NOT ACCEPTED 17 22519 195
APPS DENIED 6 45 8 11 211 1005 6694 228 5 2 17
APPS WITHDRAWN 2 25 11 210 328 3664 139
FILES CLOSED FOR INCOMPLETENESS 1 13 2114 1501 70
PA/PHILADELPHIA COUNTY/0360.00 37 98
LOANS ORIGINATED 11 53 56 1109 2317 8675 595
APPS APPROVED, NOT ACCEPTED 7 11385 140
APPS DENIED 1 32 2 2417 5750 36 198
APPS WITHDRAWN 3 101 183 669 2109
FILES CLOSED FOR INCOMPLETENESS 2 1382 69
PA/PHILADELPHIA COUNTY/0361.00 28 77
LOANS ORIGINATED 15 64 10 618 3120 2175 7479 658 725
APPS APPROVED, NOT ACCEPTED 6 1019
APPS DENIED 4 22 10 11 225 596 3507 341 138
APPS WITHDRAWN 1 19 12 348 140 2919 23
FILES CLOSED FOR INCOMPLETENESS 1 5 11 155 192 814 26
PA/PHILADELPHIA COUNTY/0362.01 15 87
LOANS ORIGINATED 22 94 11 1 615 2515 2892 12002 613 3000 581
APPS APPROVED, NOT ACCEPTED 7 11 145 1030 158
APPS DENIED 4 30 12 32 356 580 4330 273 323
APPS WITHDRAWN 2 11 1 1246 1076 30 100
FILES CLOSED FOR INCOMPLETENESS 1 11 2162 1270 340
06/02/2014Report Date:
AGGREGATE TABLE 1: DISPOSITION OF LOAN APPLICATIONS, BY LOCATION OF PROPERTY AND TYPE OF LOAN, 2013
MSA/MD: 37964 - PHILADELPHIA, PA
Page 191 of 199
ALL LOANS ON PROPERTY LOCATED IN MSA/MD 3/
CENSUS TRACT OR COUNTY NAME ANDDISPOSITION OF APPLICATION 1/(STATE/COUNTY/TRACT NUMBER) FHA, FSA/RHS & VA Conventional
Refinancings Home ImprovementLoans
Loans on DwellingsFor 5 or More
Families
NonoccupantLoans From
Columns A, B, Cand D
Number Number Number Number Number Number$000's $000's $000's $000's $000's $000's
A B C D E F
Home Purchase Loans
Loans on 1- to 4-Family and Manufactured Home Dwellings
Loans OnManufactured Home
Dwellings FromColumns A, B, C & D
G
Number $000's
%MinPop4/
MedianIncome As
PCT ofMSA/MDMedian

PA/PHILADELPHIA COUNTY/0362.02 15 108
LOANS ORIGINATED 25 130 18 1419 3407 3526 17094 632 1872
APPS APPROVED, NOT ACCEPTED 1 13 1 31 138 157 2061 4 486
APPS DENIED 5 47 13 12 403 721 6218 321 51
APPS WITHDRAWN 2 30 2 42 266 261 3924 130 363
FILES CLOSED FOR INCOMPLETENESS 14 1794
PA/PHILADELPHIA COUNTY/0362.03 12 98
LOANS ORIGINATED 24 110 17 314 2844 3626 13544 1124 373
APPS APPROVED, NOT ACCEPTED 1 7 11 167 171 1200 175
APPS DENIED 8 35 14 43 521 1115 4759 686 491
APPS WITHDRAWN 1 35 12 370 171 5055 50
FILES CLOSED FOR INCOMPLETENESS 1 19 1214 2968 15
PA/PHILADELPHIA COUNTY/0363.01 21 95
LOANS ORIGINATED 18 76 14 59 1541 3031 9436 1002 563
APPS APPROVED, NOT ACCEPTED 5 956
APPS DENIED 3 43 8 61 180 501 6463 88 615
APPS WITHDRAWN 19 1 12782 20 168
FILES CLOSED FOR INCOMPLETENESS 7 11060 134
PA/PHILADELPHIA COUNTY/0363.02 31 85
LOANS ORIGINATED 12 57 6 220 3343 1637 5957 339 280
APPS APPROVED, NOT ACCEPTED 1 8 260 1090 195
APPS DENIED 1 26 3 32 385 42 3322 20 361
APPS WITHDRAWN 1 12 13 534 76 1827 76
FILES CLOSED FOR INCOMPLETENESS 6 730
PA/PHILADELPHIA COUNTY/0363.03 8 89
LOANS ORIGINATED 25 136 17 329 5174 3796 15900 666 238
APPS APPROVED, NOT ACCEPTED 1 15 1 21 206 152 1841 6 217
APPS DENIED 50 19 22 283 7330 365 102
APPS WITHDRAWN 5 24 22 365 775 3367 83
FILES CLOSED FOR INCOMPLETENESS 1 25 33 519 180 3551 156
06/02/2014Report Date:
AGGREGATE TABLE 1: DISPOSITION OF LOAN APPLICATIONS, BY LOCATION OF PROPERTY AND TYPE OF LOAN, 2013
MSA/MD: 37964 - PHILADELPHIA, PA
Page 192 of 199
ALL LOANS ON PROPERTY LOCATED IN MSA/MD 3/
CENSUS TRACT OR COUNTY NAME ANDDISPOSITION OF APPLICATION 1/(STATE/COUNTY/TRACT NUMBER) FHA, FSA/RHS & VA Conventional
Refinancings Home ImprovementLoans
Loans on DwellingsFor 5 or More
Families
NonoccupantLoans From
Columns A, B, Cand D
Number Number Number Number Number Number$000's $000's $000's $000's $000's $000's
A B C D E F
Home Purchase Loans
Loans on 1- to 4-Family and Manufactured Home Dwellings
Loans OnManufactured Home
Dwellings FromColumns A, B, C & D
G
Number $000's
%MinPop4/
MedianIncome As
PCT ofMSA/MDMedian

PA/PHILADELPHIA COUNTY/0364.00 26 0
LOANS ORIGINATED 17 101 270 3017 1360
APPS APPROVED, NOT ACCEPTED 1 125
APPS DENIED 2 41 285 273 1001
APPS WITHDRAWN 1 300
FILES CLOSED FOR INCOMPLETENESS 2 2536 400
PA/PHILADELPHIA COUNTY/0365.01 19 109
LOANS ORIGINATED 23 106 6 2 614 3498 3863 17674 261 6250 911
APPS APPROVED, NOT ACCEPTED 4 7 1 4567 1449 165 563
APPS DENIED 5 27 6 45 925 1166 4996 116 442
APPS WITHDRAWN 5 18 2 3763 2412 75 396
FILES CLOSED FOR INCOMPLETENESS 2 20 3497 3588 52
PA/PHILADELPHIA COUNTY/0365.02 10 109
LOANS ORIGINATED 30 97 7 416 3658 5460 15001 444 534
APPS APPROVED, NOT ACCEPTED 1 62 434 175 1154
APPS DENIED 8 30 4 42 491 1549 6202 215 436
APPS WITHDRAWN 3 19 11 165 558 3643 35
FILES CLOSED FOR INCOMPLETENESS 2 19 11 177 444 3600 182
PA/PHILADELPHIA COUNTY/0366.00 23 173
LOANS ORIGINATED 28 29 3 2 1211082 9025 252 34500 4783
APPS APPROVED, NOT ACCEPTED 3 3 1 1749 1066 2 252
APPS DENIED 5 22 51828 6953 1735
APPS WITHDRAWN 1 4 1 1512 953 10 638
FILES CLOSED FOR INCOMPLETENESS 2 3 1687 1034 548
PA/PHILADELPHIA COUNTY/0367.00 29 122
LOANS ORIGINATED 58 85 3 2 5218332 41587 811 1300 32662
APPS APPROVED, NOT ACCEPTED 5 21 111669 6714 4049
APPS DENIED 17 42 3 1 194600 12410 260 9000 5196
APPS WITHDRAWN 9 27 1 132824 8550 30 5120
FILES CLOSED FOR INCOMPLETENESS 1 29 21370 10086 7517
06/02/2014Report Date:
AGGREGATE TABLE 1: DISPOSITION OF LOAN APPLICATIONS, BY LOCATION OF PROPERTY AND TYPE OF LOAN, 2013
MSA/MD: 37964 - PHILADELPHIA, PA
Page 193 of 199
ALL LOANS ON PROPERTY LOCATED IN MSA/MD 3/
CENSUS TRACT OR COUNTY NAME ANDDISPOSITION OF APPLICATION 1/(STATE/COUNTY/TRACT NUMBER) FHA, FSA/RHS & VA Conventional
Refinancings Home ImprovementLoans
Loans on DwellingsFor 5 or More
Families
NonoccupantLoans From
Columns A, B, Cand D
Number Number Number Number Number Number$000's $000's $000's $000's $000's $000's
A B C D E F
Home Purchase Loans
Loans on 1- to 4-Family and Manufactured Home Dwellings
Loans OnManufactured Home
Dwellings FromColumns A, B, C & D
G
Number $000's
%MinPop4/
MedianIncome As
PCT ofMSA/MDMedian

PA/PHILADELPHIA COUNTY/0369.00 52 99
LOANS ORIGINATED
APPS APPROVED, NOT ACCEPTED
APPS DENIED
APPS WITHDRAWN
FILES CLOSED FOR INCOMPLETENESS 1 143
PA/PHILADELPHIA COUNTY/0372.00 27 66
LOANS ORIGINATED 28 72 7 149 1578 4369 9079 422 1618
APPS APPROVED, NOT ACCEPTED 1 8 279 1126 229
APPS DENIED 2 36 12 72 330 276 5053 670 854
APPS WITHDRAWN 2 19 2 21 165 410 2882 290 250
FILES CLOSED FOR INCOMPLETENESS 111 98 1377
PA/PHILADELPHIA COUNTY/0373.00 19 85
LOANS ORIGINATED 38 96 11 1 78 2676 10779 19882 657 6400 1960
APPS APPROVED, NOT ACCEPTED 111 219 2591
APPS DENIED 3 42 5 33 821 785 9235 132 945
APPS WITHDRAWN 6 21 1 11711 4850 25 25
FILES CLOSED FOR INCOMPLETENESS 1 11 1233 1856 200
PA/PHILADELPHIA COUNTY/0375.00 50 97
LOANS ORIGINATED 9 58 3 1 129 1468 1929 10284 77 6900 1624
APPS APPROVED, NOT ACCEPTED 2 5 2450 983 450
APPS DENIED 2 29 4 58 2170 404 5808 129 550
APPS WITHDRAWN 1 8 1 11 260 100 1363 2 112
FILES CLOSED FOR INCOMPLETENESS 7 1 1884 220 220
PA/PHILADELPHIA COUNTY/0376.00 65 79
LOANS ORIGINATED 11 35 2 242702 6085 1394 3780
APPS APPROVED, NOT ACCEPTED 2 6 1 3431 1294 980 549
APPS DENIED 1 19 1 61 142 140 3669 200 1095
APPS WITHDRAWN 3 6 3528 1451 899
FILES CLOSED FOR INCOMPLETENESS 1 6 1 4168 735 165 771
06/02/2014Report Date:
AGGREGATE TABLE 1: DISPOSITION OF LOAN APPLICATIONS, BY LOCATION OF PROPERTY AND TYPE OF LOAN, 2013
MSA/MD: 37964 - PHILADELPHIA, PA
Page 194 of 199
ALL LOANS ON PROPERTY LOCATED IN MSA/MD 3/
CENSUS TRACT OR COUNTY NAME ANDDISPOSITION OF APPLICATION 1/(STATE/COUNTY/TRACT NUMBER) FHA, FSA/RHS & VA Conventional
Refinancings Home ImprovementLoans
Loans on DwellingsFor 5 or More
Families
NonoccupantLoans From
Columns A, B, Cand D
Number Number Number Number Number Number$000's $000's $000's $000's $000's $000's
A B C D E F
Home Purchase Loans
Loans on 1- to 4-Family and Manufactured Home Dwellings
Loans OnManufactured Home
Dwellings FromColumns A, B, C & D
G
Number $000's
%MinPop4/
MedianIncome As
PCT ofMSA/MDMedian

PA/PHILADELPHIA COUNTY/0377.00 69 26
LOANS ORIGINATED 4 8 1 2 55 755 2368 1201 10 26450 2797
APPS APPROVED, NOT ACCEPTED 1 1285 45
APPS DENIED 1 14 7 42 197 100 1238 46 268
APPS WITHDRAWN 6 2705 400
FILES CLOSED FOR INCOMPLETENESS 4 11 98 658 267
PA/PHILADELPHIA COUNTY/0378.00 13 64
LOANS ORIGINATED 24 43 4 1814 2008 3186 5013 202 1643
APPS APPROVED, NOT ACCEPTED 7 4696 461
APPS DENIED 17 6 54 561 1824 267 390
APPS WITHDRAWN 1 6 1 3165 780 18 369
FILES CLOSED FOR INCOMPLETENESS 1 6 2 21 187 161 574 94 204
PA/PHILADELPHIA COUNTY/0379.00 7 62
LOANS ORIGINATED 31 76 15 2523 2388 2510 7927 424 2153
APPS APPROVED, NOT ACCEPTED 10 31263 261
APPS DENIED 8 29 21 66 940 610 3787 889 553
APPS WITHDRAWN 4 20 3436 2593 336
FILES CLOSED FOR INCOMPLETENESS 3 13 1 2208 1436 79 140
PA/PHILADELPHIA COUNTY/0380.00 31 71
LOANS ORIGINATED 4 12 9 77 701 415 1195 711 1204
APPS APPROVED, NOT ACCEPTED 41 147 440
APPS DENIED 2 9 7 22 234 119 733 73 141
APPS WITHDRAWN 4 11 78 384 130
FILES CLOSED FOR INCOMPLETENESS 3 178
PA/PHILADELPHIA COUNTY/0381.00 48 48
LOANS ORIGINATED 4 1257 10
APPS APPROVED, NOT ACCEPTED
APPS DENIED 2 5110 23
APPS WITHDRAWN 2 79
FILES CLOSED FOR INCOMPLETENESS 2 1131 55
06/02/2014Report Date:
AGGREGATE TABLE 1: DISPOSITION OF LOAN APPLICATIONS, BY LOCATION OF PROPERTY AND TYPE OF LOAN, 2013
MSA/MD: 37964 - PHILADELPHIA, PA
Page 195 of 199
ALL LOANS ON PROPERTY LOCATED IN MSA/MD 3/
CENSUS TRACT OR COUNTY NAME ANDDISPOSITION OF APPLICATION 1/(STATE/COUNTY/TRACT NUMBER) FHA, FSA/RHS & VA Conventional
Refinancings Home ImprovementLoans
Loans on DwellingsFor 5 or More
Families
NonoccupantLoans From
Columns A, B, Cand D
Number Number Number Number Number Number$000's $000's $000's $000's $000's $000's
A B C D E F
Home Purchase Loans
Loans on 1- to 4-Family and Manufactured Home Dwellings
Loans OnManufactured Home
Dwellings FromColumns A, B, C & D
G
Number $000's
%MinPop4/
MedianIncome As
PCT ofMSA/MDMedian

PA/PHILADELPHIA COUNTY/0382.00 45 31
LOANS ORIGINATED 4 11 8 89 690 358 894 292 762
APPS APPROVED, NOT ACCEPTED 4 1384 51
APPS DENIED 1 5 9 22 195 17 388 76 163
APPS WITHDRAWN 4 1177 16
FILES CLOSED FOR INCOMPLETENESS 2 238
PA/PHILADELPHIA COUNTY/0383.00 93 24
LOANS ORIGINATED 2 7 7 65 251 344 416 158 529
APPS APPROVED, NOT ACCEPTED 3 150
APPS DENIED 3 10 16 64 295 125 565 107 160
APPS WITHDRAWN 1 11 69 125 25
FILES CLOSED FOR INCOMPLETENESS 1 72
PA/PHILADELPHIA COUNTY/0384.00 15 133
LOANS ORIGINATED 24 49 5 26 1286 4974 8367 361 385
APPS APPROVED, NOT ACCEPTED 1 4350 768
APPS DENIED 2 20 1 11 230 550 3961 25 176
APPS WITHDRAWN 1 11 1 11 331 225 2403 24 151
FILES CLOSED FOR INCOMPLETENESS 1 10 1148 1929 30
PA/PHILADELPHIA COUNTY/0385.00 13 243
LOANS ORIGINATED 16 49 2 31 343 6955 16427 823 1350
APPS APPROVED, NOT ACCEPTED 2 6 11280 1951 206
APPS DENIED 3 4 2 2966 1669 710 549
APPS WITHDRAWN 2 13 11694 3745 440
FILES CLOSED FOR INCOMPLETENESS 2 923
PA/PHILADELPHIA COUNTY/0386.00 18 173
LOANS ORIGINATED 16 38 2 38983 15298 50 721
APPS APPROVED, NOT ACCEPTED 1 249
APPS DENIED 1 9163 3327
APPS WITHDRAWN 2 4 1753 717 60
FILES CLOSED FOR INCOMPLETENESS 5 1019
06/02/2014Report Date:
AGGREGATE TABLE 1: DISPOSITION OF LOAN APPLICATIONS, BY LOCATION OF PROPERTY AND TYPE OF LOAN, 2013
MSA/MD: 37964 - PHILADELPHIA, PA
Page 196 of 199
ALL LOANS ON PROPERTY LOCATED IN MSA/MD 3/
CENSUS TRACT OR COUNTY NAME ANDDISPOSITION OF APPLICATION 1/(STATE/COUNTY/TRACT NUMBER) FHA, FSA/RHS & VA Conventional
Refinancings Home ImprovementLoans
Loans on DwellingsFor 5 or More
Families
NonoccupantLoans From
Columns A, B, Cand D
Number Number Number Number Number Number$000's $000's $000's $000's $000's $000's
A B C D E F
Home Purchase Loans
Loans on 1- to 4-Family and Manufactured Home Dwellings
Loans OnManufactured Home
Dwellings FromColumns A, B, C & D
G
Number $000's
%MinPop4/
MedianIncome As
PCT ofMSA/MDMedian

PA/PHILADELPHIA COUNTY/0387.00 20 198
LOANS ORIGINATED 31 56 3 39784 18508 658 555
APPS APPROVED, NOT ACCEPTED 3 51009 1346
APPS DENIED 1 10 2 2200 2731 25 336
APPS WITHDRAWN 2 5462 2708
FILES CLOSED FOR INCOMPLETENESS 1 1313 60
PA/PHILADELPHIA COUNTY/0388.00 42 147
LOANS ORIGINATED 36 87 10 2 1210 2219 8868 17773 1026 4550 1999
APPS APPROVED, NOT ACCEPTED 2 4 1 2580 572 25 2050
APPS DENIED 2 22 6 51 245 381 4803 104 644
APPS WITHDRAWN 4 12 11406 2526 1000
FILES CLOSED FOR INCOMPLETENESS 10 21 290 1342 344
PA/PHILADELPHIA COUNTY/0389.00 96 76
LOANS ORIGINATED 9 33 8 310 1833 1456 4406 225 350
APPS APPROVED, NOT ACCEPTED 5 1 1880 129 470
APPS DENIED 2 25 11 24 702 154 3247 308 481
APPS WITHDRAWN 4 3 1 21 226 813 47 3100 523
FILES CLOSED FOR INCOMPLETENESS 1 5 22 422 83 623 226
PA/PHILADELPHIA COUNTY/0390.00 85 48
LOANS ORIGINATED 11 58 7 1921 2077 847 4279 175 1289
APPS APPROVED, NOT ACCEPTED 12 1 5931 29 357
APPS DENIED 6 51 24 125 482 381 4400 387 629
APPS WITHDRAWN 2 19 2 41 98 87 1677 144 317
FILES CLOSED FOR INCOMPLETENESS 9 11 77 679 50
PA/PHILADELPHIA COUNTY/9800.00 44 118
LOANS ORIGINATED 1 6 1 198 717 50 195
APPS APPROVED, NOT ACCEPTED 1 1153 153
APPS DENIED 1 1 192 169 169
APPS WITHDRAWN
FILES CLOSED FOR INCOMPLETENESS
06/02/2014Report Date:
AGGREGATE TABLE 1: DISPOSITION OF LOAN APPLICATIONS, BY LOCATION OF PROPERTY AND TYPE OF LOAN, 2013
MSA/MD: 37964 - PHILADELPHIA, PA
Page 197 of 199
ALL LOANS ON PROPERTY LOCATED IN MSA/MD 3/
CENSUS TRACT OR COUNTY NAME ANDDISPOSITION OF APPLICATION 1/(STATE/COUNTY/TRACT NUMBER) FHA, FSA/RHS & VA Conventional
Refinancings Home ImprovementLoans
Loans on DwellingsFor 5 or More
Families
NonoccupantLoans From
Columns A, B, Cand D
Number Number Number Number Number Number$000's $000's $000's $000's $000's $000's
A B C D E F
Home Purchase Loans
Loans on 1- to 4-Family and Manufactured Home Dwellings
Loans OnManufactured Home
Dwellings FromColumns A, B, C & D
G
Number $000's
%MinPop4/
MedianIncome As
PCT ofMSA/MDMedian

PA/PHILADELPHIA COUNTY/9801.00 18 0
LOANS ORIGINATED 7 11429 169
APPS APPROVED, NOT ACCEPTED
APPS DENIED 2 1010
APPS WITHDRAWN 1 160 60
FILES CLOSED FOR INCOMPLETENESS 1 56
PA/PHILADELPHIA COUNTY/9802.00 6 54
LOANS ORIGINATED 2 73 660 64 1273
APPS APPROVED, NOT ACCEPTED 1 96
APPS DENIED 31 304 471
APPS WITHDRAWN 2 607
FILES CLOSED FOR INCOMPLETENESS
PA/PHILADELPHIA COUNTY/9803.00 0 0
LOANS ORIGINATED 1 177
APPS APPROVED, NOT ACCEPTED
APPS DENIED
APPS WITHDRAWN
FILES CLOSED FOR INCOMPLETENESS
PA/PHILADELPHIA COUNTY/9804.00 0 0
LOANS ORIGINATED 1 98
APPS APPROVED, NOT ACCEPTED
APPS DENIED
APPS WITHDRAWN
FILES CLOSED FOR INCOMPLETENESS
PA/PHILADELPHIA COUNTY/9807.00 100 0
LOANS ORIGINATED
APPS APPROVED, NOT ACCEPTED
APPS DENIED 1 163
APPS WITHDRAWN
FILES CLOSED FOR INCOMPLETENESS
06/02/2014Report Date:
AGGREGATE TABLE 1: DISPOSITION OF LOAN APPLICATIONS, BY LOCATION OF PROPERTY AND TYPE OF LOAN, 2013
MSA/MD: 37964 - PHILADELPHIA, PA
Page 198 of 199
ALL LOANS ON PROPERTY LOCATED IN MSA/MD 3/
CENSUS TRACT OR COUNTY NAME ANDDISPOSITION OF APPLICATION 1/(STATE/COUNTY/TRACT NUMBER) FHA, FSA/RHS & VA Conventional
Refinancings Home ImprovementLoans
Loans on DwellingsFor 5 or More
Families
NonoccupantLoans From
Columns A, B, Cand D
Number Number Number Number Number Number$000's $000's $000's $000's $000's $000's
A B C D E F
Home Purchase Loans
Loans on 1- to 4-Family and Manufactured Home Dwellings
Loans OnManufactured Home
Dwellings FromColumns A, B, C & D
G
Number $000's
%MinPop4/
MedianIncome As
PCT ofMSA/MDMedian

PA/PHILADELPHIA COUNTY/9808.00 33 0
LOANS ORIGINATED 5 6 3399 743 272
APPS APPROVED, NOT ACCEPTED 1 155 284
APPS DENIED 5 10 1413 1026 115
APPS WITHDRAWN 1 7 132 874 55
FILES CLOSED FOR INCOMPLETENESS 1 85
PA/PHILADELPHIA COUNTY/9809.00 70 0
LOANS ORIGINATED 1 68
APPS APPROVED, NOT ACCEPTED
APPS DENIED 1 2 11 89 65 35 5
APPS WITHDRAWN
FILES CLOSED FOR INCOMPLETENESS
MSA/MD(TOTAL) 0 0
LOANS ORIGINATED 25212 67689 6899 511 93078833 1683314 6630590 13960137 562177 2029561 1619382 168 10187
APPS APPROVED, NOT ACCEPTED 1665 7267 461 35 962421 77579 462399 1477257 33349 84671 167082 138 7987
APPS DENIED 3381 24120 7872 87 37351735 301356 806074 4506008 258278 309450 477654 292 13450
APPS WITHDRAWN 3232 12134 816 66 14741028 195472 860710 2437637 73940 404448 240623 11 710
FILES CLOSED FOR INCOMPLETENESS 783 6834 400 6 712338 59210 196659 1305119 41014 13422 114866 9 927
INVALID GEOGRAPHIC IDENTIFIERS 2/ 0 0
LOANS ORIGINATED
APPS APPROVED, NOT ACCEPTED
APPS DENIED
APPS WITHDRAWN
FILES CLOSED FOR INCOMPLETENESS
06/02/2014Report Date:
AGGREGATE TABLE 1: DISPOSITION OF LOAN APPLICATIONS, BY LOCATION OF PROPERTY AND TYPE OF LOAN, 2013
MSA/MD: 37964 - PHILADELPHIA, PA
Page 199 of 199
ALL LOANS ON PROPERTY LOCATED IN MSA/MD 3/
CENSUS TRACT OR COUNTY NAME ANDDISPOSITION OF APPLICATION 1/(STATE/COUNTY/TRACT NUMBER) FHA, FSA/RHS & VA Conventional
Refinancings Home ImprovementLoans
Loans on DwellingsFor 5 or More
Families
NonoccupantLoans From
Columns A, B, Cand D
Number Number Number Number Number Number$000's $000's $000's $000's $000's $000's
A B C D E F
Home Purchase Loans
Loans on 1- to 4-Family and Manufactured Home Dwellings
Loans OnManufactured Home
Dwellings FromColumns A, B, C & D
G
Number $000's
%MinPop4/
MedianIncome As
PCT ofMSA/MDMedian

PA/BUCKS COUNTY/1001.02 23 509 222
PA/BUCKS COUNTY/1001.03 2 17 1278 325 107
PA/BUCKS COUNTY/1001.04 1 61 378 309 1210
PA/BUCKS COUNTY/1001.05 2 1110 1745 440 2100
PA/BUCKS COUNTY/1002.01 8 21 216 3520 1564 3872 278
PA/BUCKS COUNTY/1002.06 4 29 24 625 1116 5843 511
PA/BUCKS COUNTY/1002.07 3 15 26 1320 696 2708 547
PA/BUCKS COUNTY/1002.08 4 204 823 604 3658
PA/BUCKS COUNTY/1002.09 8 27 28 1759 1917 5732 490
PA/BUCKS COUNTY/1002.10 15 43 210 2309 3048 8143 253
PA/BUCKS COUNTY/1002.11 14 34 211 2366 3116 6020 281
PA/BUCKS COUNTY/1002.12 5 27 112 2465 978 4973 105
PA/BUCKS COUNTY/1003.02 9 27 2 523 3544 1068 4169 254 555
PA/BUCKS COUNTY/1003.03 5 1221 3199 675 79099
PA/BUCKS COUNTY/1003.04 6 110 1848 816 208
PA/BUCKS COUNTY/1003.06 7 10 111 1734 783 1781 79
PA/BUCKS COUNTY/1003.07 7 25 2 221 3382 1139 3922 247 298
PA/BUCKS COUNTY/1004.01 9 32 1 442 7425 1060 4671 148 596
PA/BUCKS COUNTY/1004.02 3 37 224 3839 386 5831 272
PA/BUCKS COUNTY/1004.03 1 73 493 284 997
PA/BUCKS COUNTY/1004.04 6 3026 4343 831 4861
PA/BUCKS COUNTY/1004.06 5 169 2234 1103 3201
PA/BUCKS COUNTY/1004.07 1 107 1202 106 75883
PA/BUCKS COUNTY/1004.08 6 43 330 4676 950 17878 382
PA/BUCKS COUNTY/1005.00 3 4 1 14 482 384 865 85 70
PA/BUCKS COUNTY/1006.00 15 110 1592 14791 130
PA/BUCKS COUNTY/1007.00 1 15 211 1421 92 2244 182
06/02/2014Report Date:
AGGREGATE TABLE 2: LOANS PURCHASED, BY LOCATION OF PROPERTY AND TYPE OF LOAN, 2013
MSA/MD: 37964 - PHILADELPHIA, PA
Page 1 of 37
ALL LOANS ON PROPERTY LOCATED IN MSA/MD 3/
CENSUS TRACT OR COUNTY NAME 1/(STATE/COUNTY/TRACT NUMBER)
FHA, FSA/RHS & VA Conventional
Refinancings Home ImprovementLoans
Loans on DwellingsFor 5 or More
Families
Nonoccupant LoansFrom Columns A, B, C
& D
Number Number Number Number Number Number$000's $000's $000's $000's $000's $000's
A B C D E F
Home Purchase Loans
Loans on 1- to 4-Family and Manufactured Home Dwellings
Loans on ManufacturedHome Dwellings FromColumns A,B,C & D
G
Number $000's

PA/BUCKS COUNTY/1008.03 5 28 115 3528 1062 5485 219
PA/BUCKS COUNTY/1008.04 11 24 18 1997 2752 4164 82
PA/BUCKS COUNTY/1008.05 7 4221 4335 1306 7585
PA/BUCKS COUNTY/1008.07 12 20 32 489 3101 26000 442
PA/BUCKS COUNTY/1008.08 9 26 112 3883 2648 6489 327
PA/BUCKS COUNTY/1008.09 17 36 22 727 5368 9450 281
PA/BUCKS COUNTY/1008.11 2 16 24 871 304 3673 182
PA/BUCKS COUNTY/1009.00 20 35 3 112 3280 4672 7428 296 81
PA/BUCKS COUNTY/1011.00 1 11 32 368 180 1488 284
PA/BUCKS COUNTY/1014.01 7 278 1742 1547 5341
PA/BUCKS COUNTY/1014.03 24 28 1 213 3439 4739 5637 167 188
PA/BUCKS COUNTY/1014.04 113 695 2300
PA/BUCKS COUNTY/1014.05 5 22 1 113 2953 1095 17328 163 228
PA/BUCKS COUNTY/1015.03 9 28 1 44 1084 1770 5496 189 502
PA/BUCKS COUNTY/1015.04 1 102 482 347 1777
PA/BUCKS COUNTY/1015.05 7 12 1 15 1353 1794 3016 325 228
PA/BUCKS COUNTY/1015.06 11 27 1 18 2290 2462 5135 115 100
PA/BUCKS COUNTY/1016.03 3 19 1 27 1508 657 3596 234 317
PA/BUCKS COUNTY/1016.05 2 64 1006 430 1261
PA/BUCKS COUNTY/1016.07 25 12 16 1530 5744 2220 291
PA/BUCKS COUNTY/1016.09 15 34 1 512 2622 2897 6726 190 473
PA/BUCKS COUNTY/1016.10 8 28 1 17 1926 1317 5912 190 60
PA/BUCKS COUNTY/1016.11 9 50 210 2208 2010 9468 373
PA/BUCKS COUNTY/1018.02 24 55 31 410 8333 15710 639
PA/BUCKS COUNTY/1018.03 36 60 19 1916 10992 34276 82
PA/BUCKS COUNTY/1018.05 11 12 1 12791 3188 300 131
PA/BUCKS COUNTY/1018.07 9 19 1 11 302 2208 3676 153 164
06/02/2014Report Date:
AGGREGATE TABLE 2: LOANS PURCHASED, BY LOCATION OF PROPERTY AND TYPE OF LOAN, 2013
MSA/MD: 37964 - PHILADELPHIA, PA
Page 2 of 37
ALL LOANS ON PROPERTY LOCATED IN MSA/MD 3/
CENSUS TRACT OR COUNTY NAME 1/(STATE/COUNTY/TRACT NUMBER)
FHA, FSA/RHS & VA Conventional
Refinancings Home ImprovementLoans
Loans on DwellingsFor 5 or More
Families
Nonoccupant LoansFrom Columns A, B, C
& D
Number Number Number Number Number Number$000's $000's $000's $000's $000's $000's
A B C D E F
Home Purchase Loans
Loans on 1- to 4-Family and Manufactured Home Dwellings
Loans on ManufacturedHome Dwellings FromColumns A,B,C & D
G
Number $000's

PA/BUCKS COUNTY/1018.08 11 91 184 3698 1639
PA/BUCKS COUNTY/1019.00 17 23 111 3175 3952 5598 219
PA/BUCKS COUNTY/1020.02 5 153 860 1524 2911
PA/BUCKS COUNTY/1020.03 9 30 17 2017 2561 23197 164
PA/BUCKS COUNTY/1020.04 12 26 110 2574 2663 5082 125
PA/BUCKS COUNTY/1021.02 5 89 2466 1266 1991
PA/BUCKS COUNTY/1021.04 14 27 37 1762 4654 6541 466
PA/BUCKS COUNTY/1023.00 10 31 2 213 3291 2250 5791 363 432
PA/BUCKS COUNTY/1024.01 5 186 1218 1169 3569
PA/BUCKS COUNTY/1024.02 10 1619 3788 2327 2825
PA/BUCKS COUNTY/1025.00 5 2416 3000 1208 4384
PA/BUCKS COUNTY/1026.00 6 11 24 816 1051 1996 259
PA/BUCKS COUNTY/1027.00 9 24 15 1099 2381 4453 60
PA/BUCKS COUNTY/1028.01 5 19 19 2177 1475 4361 305
PA/BUCKS COUNTY/1031.01 11 110 1450 1487 116
PA/BUCKS COUNTY/1031.02 2 7 15 794 351 1228 13
PA/BUCKS COUNTY/1031.03 7 20 123 3568 975 2883 116
PA/BUCKS COUNTY/1033.00 8 9 22 472 2135 1763 292
PA/BUCKS COUNTY/1034.00 2 159 2377 371 3647
PA/BUCKS COUNTY/1037.00 6 18 14 1601 1648 30042 127
PA/BUCKS COUNTY/1038.00 3 6 11 189 513 1464 208
PA/BUCKS COUNTY/1039.00 2 15 23 971 643 3992 672
PA/BUCKS COUNTY/1040.00 32 47 1 415 5117 9944 12134 100 1022
PA/BUCKS COUNTY/1041.00 1 8 2 14 594 312 1695 515 209
PA/BUCKS COUNTY/1042.01 4 15 11 427 1546 4464 291
PA/BUCKS COUNTY/1042.03 20 38 25 1416 8087 10555 592
PA/BUCKS COUNTY/1042.04 49 24 419 4911 12720 5450 732
06/02/2014Report Date:
AGGREGATE TABLE 2: LOANS PURCHASED, BY LOCATION OF PROPERTY AND TYPE OF LOAN, 2013
MSA/MD: 37964 - PHILADELPHIA, PA
Page 3 of 37
ALL LOANS ON PROPERTY LOCATED IN MSA/MD 3/
CENSUS TRACT OR COUNTY NAME 1/(STATE/COUNTY/TRACT NUMBER)
FHA, FSA/RHS & VA Conventional
Refinancings Home ImprovementLoans
Loans on DwellingsFor 5 or More
Families
Nonoccupant LoansFrom Columns A, B, C
& D
Number Number Number Number Number Number$000's $000's $000's $000's $000's $000's
A B C D E F
Home Purchase Loans
Loans on 1- to 4-Family and Manufactured Home Dwellings
Loans on ManufacturedHome Dwellings FromColumns A,B,C & D
G
Number $000's

PA/BUCKS COUNTY/1043.01 11 20 11 272 4198 6547 301
PA/BUCKS COUNTY/1043.03 29 46 3 72 830 8618 12681 610 1923
PA/BUCKS COUNTY/1043.04 6 10 22748 3642 1095
PA/BUCKS COUNTY/1044.00 17 22 1 61 234 4961 7173 222 1496
PA/BUCKS COUNTY/1045.02 22 58 2 211 3463 7718 17754 710 480
PA/BUCKS COUNTY/1045.03 25 30 13 978 9642 8719 116
PA/BUCKS COUNTY/1045.05 28 42 311 3773 8725 12315 826
PA/BUCKS COUNTY/1045.06 3 22 11 424 1086 7151 265
PA/BUCKS COUNTY/1046.01 16 318 2378 4655 7469
PA/BUCKS COUNTY/1046.03 21 40 15 1484 6728 11897 263
PA/BUCKS COUNTY/1046.04 19 41 2 35 1488 4106 9445 784 502
PA/BUCKS COUNTY/1047.01 11 16 75 1350 3110 3216 1196
PA/BUCKS COUNTY/1047.02 3 8 23 699 958 2258 374
PA/BUCKS COUNTY/1047.03 4 12 11180 2953 325
PA/BUCKS COUNTY/1048.00 7 18 16 1386 2030 3925 141
PA/BUCKS COUNTY/1049.01 23 724 1266 7346 18803
PA/BUCKS COUNTY/1049.02 40 51 310 2062 13022 22718 492
PA/BUCKS COUNTY/1050.03 8 32 2 12 650 2582 8040 521 398
PA/BUCKS COUNTY/1050.04 12 26 47 2543 3534 6786 904
PA/BUCKS COUNTY/1050.06 13 46 2 16 1930 4330 12492 304 200
PA/BUCKS COUNTY/1050.08 6 23 11 314 2276 7222 157
PA/BUCKS COUNTY/1050.09 12 31 1 313 2482 3004 6473 250 384
PA/BUCKS COUNTY/1050.10 13 31 16 1615 2962 6733 176
PA/BUCKS COUNTY/1050.11 14 26 46 1481 4021 6627 458
PA/BUCKS COUNTY/1050.12 4 193 995 1264 4298
PA/BUCKS COUNTY/1050.13 17 44 11 539 5696 11988 374
PA/BUCKS COUNTY/1051.00 15 215489 7899
06/02/2014Report Date:
AGGREGATE TABLE 2: LOANS PURCHASED, BY LOCATION OF PROPERTY AND TYPE OF LOAN, 2013
MSA/MD: 37964 - PHILADELPHIA, PA
Page 4 of 37
ALL LOANS ON PROPERTY LOCATED IN MSA/MD 3/
CENSUS TRACT OR COUNTY NAME 1/(STATE/COUNTY/TRACT NUMBER)
FHA, FSA/RHS & VA Conventional
Refinancings Home ImprovementLoans
Loans on DwellingsFor 5 or More
Families
Nonoccupant LoansFrom Columns A, B, C
& D
Number Number Number Number Number Number$000's $000's $000's $000's $000's $000's
A B C D E F
Home Purchase Loans
Loans on 1- to 4-Family and Manufactured Home Dwellings
Loans on ManufacturedHome Dwellings FromColumns A,B,C & D
G
Number $000's

PA/BUCKS COUNTY/1052.02 31 43 58 2022 6795 8794 597
PA/BUCKS COUNTY/1052.03 7 14 15 1776 2265 3496 214
PA/BUCKS COUNTY/1052.06 31 40 1 27 2097 10173 10774 310 373
PA/BUCKS COUNTY/1052.07 16 51 1 53 939 4963 12260 300 884
PA/BUCKS COUNTY/1052.08 11 18 23998 6402 627
PA/BUCKS COUNTY/1053.00 11 20 1 21 325 4678 5802 1 845
PA/BUCKS COUNTY/1054.00 25 75 2 41 417 8525 24995 617 901
PA/BUCKS COUNTY/1055.05 27 39 23 1055 8355 92578 306
PA/BUCKS COUNTY/1055.06 9 412 609 2830 12199
PA/BUCKS COUNTY/1055.07 34 62 1 1 19 14579 11192 15944 342 301 263
PA/BUCKS COUNTY/1055.08 19 25 17143 8174 407
PA/BUCKS COUNTY/1055.09 16 36 21 290 5678 10426 233
PA/BUCKS COUNTY/1055.10 26 43 76 1393 5312 7166 1139
PA/BUCKS COUNTY/1055.11 24 53 38 2381 6513 11356 415
PA/BUCKS COUNTY/1056.00 8 17 1 13 797 2151 4118 164 116
PA/BUCKS COUNTY/1057.02 2 16 418 2598 155 2238 361
PA/BUCKS COUNTY/1057.04 17 34 2 420 3417 2939 5217 403 521
PA/BUCKS COUNTY/1058.01 7 30 110 2623 1887 23983 228
PA/BUCKS COUNTY/1058.05 4 17 14 984 1268 4833 208
PA/BUCKS COUNTY/1058.07 9 18 17 1624 1561 2863 75
PA/BUCKS COUNTY/1058.08 4 20 19 1679 736 3775 128
PA/BUCKS COUNTY/1058.09 5 2714 3212 1106 4635
PA/BUCKS COUNTY/1058.10 2 16 113 2608 216 2787 152
PA/BUCKS COUNTY/1058.11 11 30 224 4514 2519 5789 301
PA/BUCKS COUNTY/1058.12 7 108 1670 1122 1644
PA/BUCKS COUNTY/1059.00 1 11 13 496 200 1863 151
PA/BUCKS COUNTY/1060.00 9 30 1 110 2364 2024 6583 145 145
06/02/2014Report Date:
AGGREGATE TABLE 2: LOANS PURCHASED, BY LOCATION OF PROPERTY AND TYPE OF LOAN, 2013
MSA/MD: 37964 - PHILADELPHIA, PA
Page 5 of 37
ALL LOANS ON PROPERTY LOCATED IN MSA/MD 3/
CENSUS TRACT OR COUNTY NAME 1/(STATE/COUNTY/TRACT NUMBER)
FHA, FSA/RHS & VA Conventional
Refinancings Home ImprovementLoans
Loans on DwellingsFor 5 or More
Families
Nonoccupant LoansFrom Columns A, B, C
& D
Number Number Number Number Number Number$000's $000's $000's $000's $000's $000's
A B C D E F
Home Purchase Loans
Loans on 1- to 4-Family and Manufactured Home Dwellings
Loans on ManufacturedHome Dwellings FromColumns A,B,C & D
G
Number $000's

PA/BUCKS COUNTY/1061.00 7 15 14 941 1523 3518 216
PA/BUCKS COUNTY/1062.00 10 245 1562 2842 4981
PA/BUCKS COUNTY/1063.00 23 40 1 312 2871 7133 9443 194 470
PA/BUCKS COUNTY/1064.01 13 45 322 4345 2991 10105 501
PA/BUCKS COUNTY/1064.02 14 33 126 5751 3256 6684 172
PA/BUCKS COUNTY/1065.00 8 36 2 223 4123 1228 5802 578 101
PA/BUCKS COUNTY/1066.00 2 9 11 245 331 1961 400
PA/CHESTER COUNTY/3001.01 15 34 14 560 4541 9045 166
PA/CHESTER COUNTY/3001.03 7 15 12511 3751 347
PA/CHESTER COUNTY/3001.04 25 47 22 743 8835 14192 319
PA/CHESTER COUNTY/3001.06 47 64 1 202 356 11344 12529 150 3431
PA/CHESTER COUNTY/3001.07 14 46 2 15229 14836 1620 200
PA/CHESTER COUNTY/3001.08 32 45 72 328 12141 11338 1070
PA/CHESTER COUNTY/3001.09 22 36 19850 12738 160
PA/CHESTER COUNTY/3002.01 26 45 3 1 45 1352 8683 14734 964 279 977
PA/CHESTER COUNTY/3002.02 22 38 12 544 8874 13795 181
PA/CHESTER COUNTY/3003.01 23 335 1399 8128 7582
PA/CHESTER COUNTY/3003.02 35 29 211746 10959 658
PA/CHESTER COUNTY/3003.03 16 22 1 24 966 4386 5547 203 371
PA/CHESTER COUNTY/3004.00 12 21 2 52165 3955 394 751
PA/CHESTER COUNTY/3005.01 23 35 1 12 695 8365 9654 350 146
PA/CHESTER COUNTY/3005.02 16 336 1575 4166 24993
PA/CHESTER COUNTY/3006.00 20 35 1 320 19047 4338 20662 112 444
PA/CHESTER COUNTY/3007.00 31 24 1 115 868 4898 17778 172 1496
PA/CHESTER COUNTY/3008.00 16 17 215 2779 3160 2223 250
PA/CHESTER COUNTY/3009.00 17 10 1 15 1130 2872 1830 176 134
PA/CHESTER COUNTY/3010.00 35 60 1 415 3447 8633 13622 167 558
06/02/2014Report Date:
AGGREGATE TABLE 2: LOANS PURCHASED, BY LOCATION OF PROPERTY AND TYPE OF LOAN, 2013
MSA/MD: 37964 - PHILADELPHIA, PA
Page 6 of 37
ALL LOANS ON PROPERTY LOCATED IN MSA/MD 3/
CENSUS TRACT OR COUNTY NAME 1/(STATE/COUNTY/TRACT NUMBER)
FHA, FSA/RHS & VA Conventional
Refinancings Home ImprovementLoans
Loans on DwellingsFor 5 or More
Families
Nonoccupant LoansFrom Columns A, B, C
& D
Number Number Number Number Number Number$000's $000's $000's $000's $000's $000's
A B C D E F
Home Purchase Loans
Loans on 1- to 4-Family and Manufactured Home Dwellings
Loans on ManufacturedHome Dwellings FromColumns A,B,C & D
G
Number $000's

PA/CHESTER COUNTY/3011.00 5 12 316 2618 751 1674 439
PA/CHESTER COUNTY/3013.00 20 47 2 327 6189 4005 10759 394 449
PA/CHESTER COUNTY/3014.01 11 8 1 214 3401 2330 1211 11 405
PA/CHESTER COUNTY/3014.02 11 3410 2387 2248 7062
PA/CHESTER COUNTY/3015.00 6 17 15 980 1240 4106 126
PA/CHESTER COUNTY/3016.00 3 25 1 19 2229 526 6280 101 101
PA/CHESTER COUNTY/3017.00 8 161 495 2690 3996
PA/CHESTER COUNTY/3018.00 28 42 1 13 1222 10722 15623 300 271
PA/CHESTER COUNTY/3019.00 18 44 11 475 6249 12157 417
PA/CHESTER COUNTY/3020.00 25 63 33 1089 7721 19768 842
PA/CHESTER COUNTY/3021.01 17 40 2 26 1936 5280 10425 495 448
PA/CHESTER COUNTY/3021.02 17 294 1094 5364 6543
PA/CHESTER COUNTY/3022.02 17 43 28 1900 5346 31174 282
PA/CHESTER COUNTY/3022.03 17 59 511 2534 4389 13220 1126
PA/CHESTER COUNTY/3022.04 35 61 511 2558 8124 12855 859
PA/CHESTER COUNTY/3023.00 8 13 35 1290 2128 3750 533
PA/CHESTER COUNTY/3024.00 8 17 1 27 1620 1872 45452 5940 383
PA/CHESTER COUNTY/3025.00 16 32 67 2319 4582 6931 1127
PA/CHESTER COUNTY/3026.00 4 16 46 1507 772 3023 833
PA/CHESTER COUNTY/3027.02 10 30 3 74 922 2160 5842 889 1033
PA/CHESTER COUNTY/3027.03 24 241 341 7134 6075
PA/CHESTER COUNTY/3027.04 24 44 16 2221 6851 10887 160
PA/CHESTER COUNTY/3027.05 10 34 21 288 3083 6445 215
PA/CHESTER COUNTY/3027.06 19 29 13 971 6245 6082 210
PA/CHESTER COUNTY/3028.02 14 39 1 21 246 4796 11646 251 556
PA/CHESTER COUNTY/3028.03 26 5 11 177 4901 793 206
PA/CHESTER COUNTY/3028.04 4 281554 8612
06/02/2014Report Date:
AGGREGATE TABLE 2: LOANS PURCHASED, BY LOCATION OF PROPERTY AND TYPE OF LOAN, 2013
MSA/MD: 37964 - PHILADELPHIA, PA
Page 7 of 37
ALL LOANS ON PROPERTY LOCATED IN MSA/MD 3/
CENSUS TRACT OR COUNTY NAME 1/(STATE/COUNTY/TRACT NUMBER)
FHA, FSA/RHS & VA Conventional
Refinancings Home ImprovementLoans
Loans on DwellingsFor 5 or More
Families
Nonoccupant LoansFrom Columns A, B, C
& D
Number Number Number Number Number Number$000's $000's $000's $000's $000's $000's
A B C D E F
Home Purchase Loans
Loans on 1- to 4-Family and Manufactured Home Dwellings
Loans on ManufacturedHome Dwellings FromColumns A,B,C & D
G
Number $000's

PA/CHESTER COUNTY/3028.05 28 54 99 1765 6679 9368 888
PA/CHESTER COUNTY/3029.01 23 31 38 2445 6626 6811 695
PA/CHESTER COUNTY/3029.02 31 43 1 14 1164 10173 10833 295 142
PA/CHESTER COUNTY/3030.00 7 21 1 11938 7064 252 150
PA/CHESTER COUNTY/3031.00 13 35 12 829 4406 10286 247
PA/CHESTER COUNTY/3033.01 10 133 850 2929 3024
PA/CHESTER COUNTY/3033.02 21 424 1264 6383 13160
PA/CHESTER COUNTY/3034.01 7 13 19 1681 966 2052 47
PA/CHESTER COUNTY/3034.02 4 12 14 798 666 2187 145
PA/CHESTER COUNTY/3035.01 24 44 44 1079 6833 36339 815
PA/CHESTER COUNTY/3035.02 4 191 400 1156 5309
PA/CHESTER COUNTY/3038.01 12 261 159 3420 6926
PA/CHESTER COUNTY/3038.02 32 98 3 416 4506 10464 24495 554 1021
PA/CHESTER COUNTY/3039.01 18 45 36 1684 4819 12109 496
PA/CHESTER COUNTY/3039.02 33 50 1 34 1108 10569 53902 230 624
PA/CHESTER COUNTY/3040.00 23 46 29 2570 6097 10341 375 1 12
PA/CHESTER COUNTY/3041.01 6 193 548 1073 3118
PA/CHESTER COUNTY/3041.02 8 20 19 1447 1382 2930 126
PA/CHESTER COUNTY/3042.01 18 46 2 319 3730 3699 7169 351 196
PA/CHESTER COUNTY/3043.00 43 73 418 5489 13260 17889 1218
PA/CHESTER COUNTY/3044.03 19 41 2 77 1508 3695 21270 188 1114
PA/CHESTER COUNTY/3044.04 11 22 2 37 1880 2731 3940 480 557
PA/CHESTER COUNTY/3044.05 31 67 16 2184 10498 17149 201
PA/CHESTER COUNTY/3044.06 12 231 393 4298 6098
PA/CHESTER COUNTY/3045.01 38 85 1 65 1552 11666 25244 193 1266
PA/CHESTER COUNTY/3045.02 16 263 1028 5265 6957
PA/CHESTER COUNTY/3046.00 14 24 28 2356 4273 6222 517
06/02/2014Report Date:
AGGREGATE TABLE 2: LOANS PURCHASED, BY LOCATION OF PROPERTY AND TYPE OF LOAN, 2013
MSA/MD: 37964 - PHILADELPHIA, PA
Page 8 of 37
ALL LOANS ON PROPERTY LOCATED IN MSA/MD 3/
CENSUS TRACT OR COUNTY NAME 1/(STATE/COUNTY/TRACT NUMBER)
FHA, FSA/RHS & VA Conventional
Refinancings Home ImprovementLoans
Loans on DwellingsFor 5 or More
Families
Nonoccupant LoansFrom Columns A, B, C
& D
Number Number Number Number Number Number$000's $000's $000's $000's $000's $000's
A B C D E F
Home Purchase Loans
Loans on 1- to 4-Family and Manufactured Home Dwellings
Loans on ManufacturedHome Dwellings FromColumns A,B,C & D
G
Number $000's

PA/CHESTER COUNTY/3049.00 10 2213 3523 1925 23644 1 28
PA/CHESTER COUNTY/3050.00 4 136 1115 568 1910
PA/CHESTER COUNTY/3051.01 9 197 1418 1625 4023
PA/CHESTER COUNTY/3051.02 6 2216 3685 952 4577 1 47
PA/CHESTER COUNTY/3053.00 29 49 1 336 7010 5005 8764 184 546
PA/CHESTER COUNTY/3054.00 1011 1863 1477
PA/CHESTER COUNTY/3055.00 4 15 492 489 73
PA/CHESTER COUNTY/3056.00 4 8 312 2174 446 832 246
PA/CHESTER COUNTY/3057.00 1 8 110 952 166 758 66
PA/CHESTER COUNTY/3060.00 13 56 126 6209 3261 11997 225
PA/CHESTER COUNTY/3063.00 10 10 213 2060 1915 1589 298
PA/CHESTER COUNTY/3065.01 16 32 1 12 575 4766 8896 187 186
PA/CHESTER COUNTY/3065.03 4 101 362 1107 2240
PA/CHESTER COUNTY/3065.04 22 18 1 17 1744 6031 4627 276 357
PA/CHESTER COUNTY/3066.00 17 28 13 790 5632 7420 279
PA/CHESTER COUNTY/3067.00 9 26 15 1317 3125 6987 353
PA/CHESTER COUNTY/3068.00 5 122 573 1418 2214
PA/CHESTER COUNTY/3069.00 19 52 411 3143 5483 13324 746
PA/CHESTER COUNTY/3070.00 12 35 1 16 1649 2332 7914 93 117
PA/CHESTER COUNTY/3071.00 5 146 1427 993 3250
PA/CHESTER COUNTY/3072.00 42 252 597
PA/CHESTER COUNTY/3073.00 3 17 114 3032 677 2950 58
PA/CHESTER COUNTY/3074.00 7 14 117 2507 999 2425 117
PA/CHESTER COUNTY/3077.00 3 10 12 273 547 2223 270
PA/CHESTER COUNTY/3078.00 4 112 353 1005 2087
PA/CHESTER COUNTY/3079.00 2 21 17 1070 411 4379 1 1 1
PA/CHESTER COUNTY/3080.00 5 8 315 2374 681 1361 297
06/02/2014Report Date:
AGGREGATE TABLE 2: LOANS PURCHASED, BY LOCATION OF PROPERTY AND TYPE OF LOAN, 2013
MSA/MD: 37964 - PHILADELPHIA, PA
Page 9 of 37
ALL LOANS ON PROPERTY LOCATED IN MSA/MD 3/
CENSUS TRACT OR COUNTY NAME 1/(STATE/COUNTY/TRACT NUMBER)
FHA, FSA/RHS & VA Conventional
Refinancings Home ImprovementLoans
Loans on DwellingsFor 5 or More
Families
Nonoccupant LoansFrom Columns A, B, C
& D
Number Number Number Number Number Number$000's $000's $000's $000's $000's $000's
A B C D E F
Home Purchase Loans
Loans on 1- to 4-Family and Manufactured Home Dwellings
Loans on ManufacturedHome Dwellings FromColumns A,B,C & D
G
Number $000's

PA/CHESTER COUNTY/3081.01 6 309 2085 1336 6121
PA/CHESTER COUNTY/3081.02 6 20 28 1854 1250 3764 344
PA/CHESTER COUNTY/3082.00 4 16 23 701 465 2803 205 1 74
PA/CHESTER COUNTY/3110.00 21 47 28 1735 6037 11187 195
PA/CHESTER COUNTY/3111.00 15 28 25810 8066 559
PA/CHESTER COUNTY/3112.00 3 10 1 11 353 990 2889 416 226
PA/CHESTER COUNTY/3113.00 16 18 1 15 1876 5904 5121 176 414
PA/CHESTER COUNTY/3114.01 17 38 230 5689 2870 6900 229
PA/CHESTER COUNTY/3114.03 3 169 1864 608 3150
PA/CHESTER COUNTY/3114.04 14 274 871 3498 5634
PA/CHESTER COUNTY/3115.00 3 125 1157 721 2207
PA/CHESTER COUNTY/3116.00 5 85 703 922 1069
PA/CHESTER COUNTY/3117.00 59 39 2 224 6795 16137 8878 290 352
PA/CHESTER COUNTY/3118.00 1 103 489 245 1741
PA/DELAWARE COUNTY/4003.01 2 6 212 677 77 396 79
PA/DELAWARE COUNTY/4003.02 3 10 313 1004 204 625 117
PA/DELAWARE COUNTY/4004.01 5 1 17 647 442 96 33
PA/DELAWARE COUNTY/4004.02 2 9 1 29 673 141 835 99 97
PA/DELAWARE COUNTY/4005.00 5 13 1 1011 960 312 1079 86 798
PA/DELAWARE COUNTY/4006.00 5 19 1 319 2388 573 59924 187 361
PA/DELAWARE COUNTY/4007.00 5 13 117 1989 481 1768 76
PA/DELAWARE COUNTY/4008.01 1 2 11 119 102 87379 81
PA/DELAWARE COUNTY/4008.02 5 19 1 212 2166 1024 2405 100 212
PA/DELAWARE COUNTY/4009.00 82 319 1249
PA/DELAWARE COUNTY/4010.00 2 153 594 424 2834
PA/DELAWARE COUNTY/4011.01 6 19 613 1477 445 2188 552
PA/DELAWARE COUNTY/4011.03 4 21 19 2028 734 4139 146
06/02/2014Report Date:
AGGREGATE TABLE 2: LOANS PURCHASED, BY LOCATION OF PROPERTY AND TYPE OF LOAN, 2013
MSA/MD: 37964 - PHILADELPHIA, PA
Page 10 of 37
ALL LOANS ON PROPERTY LOCATED IN MSA/MD 3/
CENSUS TRACT OR COUNTY NAME 1/(STATE/COUNTY/TRACT NUMBER)
FHA, FSA/RHS & VA Conventional
Refinancings Home ImprovementLoans
Loans on DwellingsFor 5 or More
Families
Nonoccupant LoansFrom Columns A, B, C
& D
Number Number Number Number Number Number$000's $000's $000's $000's $000's $000's
A B C D E F
Home Purchase Loans
Loans on 1- to 4-Family and Manufactured Home Dwellings
Loans on ManufacturedHome Dwellings FromColumns A,B,C & D
G
Number $000's

PA/DELAWARE COUNTY/4011.04 6 22 1 114 2434 707 3108 257 78
PA/DELAWARE COUNTY/4012.00 7 17 217 2799 967 2771 287
PA/DELAWARE COUNTY/4013.02 4 22 211 1687 430 14081 253
PA/DELAWARE COUNTY/4014.01 5 11 216 2025 526 1714 213
PA/DELAWARE COUNTY/4014.02 2 14 115 2027 283 1580 129
PA/DELAWARE COUNTY/4015.01 3 19 216 2176 305 2354 209
PA/DELAWARE COUNTY/4015.02 1 12 16 859 88 1844 88
PA/DELAWARE COUNTY/4016.00 5 5 212 1559 621 765 227
PA/DELAWARE COUNTY/4017.00 1 1312 1434 198 1750
PA/DELAWARE COUNTY/4018.00 4 17 1 118 2607 671 2270 94 94
PA/DELAWARE COUNTY/4019.00 5 2823 3404 537 14952
PA/DELAWARE COUNTY/4020.00 2 11 13 503 240 1759 74
PA/DELAWARE COUNTY/4021.00 2 2325 2958 286 2468
PA/DELAWARE COUNTY/4022.00 1 6 2 16 544 171 12192 251 1
PA/DELAWARE COUNTY/4023.00 1 86 709 176 989
PA/DELAWARE COUNTY/4024.00 2 115 832 197 51
PA/DELAWARE COUNTY/4025.00 6 36 414 461 245
PA/DELAWARE COUNTY/4026.00 1 5 319 1309 25 209 109
PA/DELAWARE COUNTY/4027.00 2 1 217 1153 169 112 155
PA/DELAWARE COUNTY/4028.00 3 10 1 128 2410 346 945 7 66
PA/DELAWARE COUNTY/4029.00 312 1161 246
PA/DELAWARE COUNTY/4030.01 5 12 220 2115 470 1357 217
PA/DELAWARE COUNTY/4030.02 4 16 1 220 2375 296 1913 110 175
PA/DELAWARE COUNTY/4031.01 3 8 117 1784 336 1028 42
PA/DELAWARE COUNTY/4031.03 3 9 118 2097 233 1120 78
PA/DELAWARE COUNTY/4031.04 2 6 28 765 114 583 114
PA/DELAWARE COUNTY/4032.00 5 23 422 3320 732 3248 402
06/02/2014Report Date:
AGGREGATE TABLE 2: LOANS PURCHASED, BY LOCATION OF PROPERTY AND TYPE OF LOAN, 2013
MSA/MD: 37964 - PHILADELPHIA, PA
Page 11 of 37
ALL LOANS ON PROPERTY LOCATED IN MSA/MD 3/
CENSUS TRACT OR COUNTY NAME 1/(STATE/COUNTY/TRACT NUMBER)
FHA, FSA/RHS & VA Conventional
Refinancings Home ImprovementLoans
Loans on DwellingsFor 5 or More
Families
Nonoccupant LoansFrom Columns A, B, C
& D
Number Number Number Number Number Number$000's $000's $000's $000's $000's $000's
A B C D E F
Home Purchase Loans
Loans on 1- to 4-Family and Manufactured Home Dwellings
Loans on ManufacturedHome Dwellings FromColumns A,B,C & D
G
Number $000's

PA/DELAWARE COUNTY/4033.00 1 21 2 329 3173 161 2351 181 351
PA/DELAWARE COUNTY/4034.01 2 9 115 1575 127 1090 55
PA/DELAWARE COUNTY/4034.02 4 12 127 2276 313 1501 53
PA/DELAWARE COUNTY/4035.01 2 2110 1548 192 2762
PA/DELAWARE COUNTY/4035.02 2 1120 2864 273 1424
PA/DELAWARE COUNTY/4036.01 1516 2439 2377
PA/DELAWARE COUNTY/4036.02 10 110 1294 1534 136
PA/DELAWARE COUNTY/4037.01 2 5 24 721 157 12056 157
PA/DELAWARE COUNTY/4037.02 3 5 1 16 754 270 601 153 94
PA/DELAWARE COUNTY/4038.00 3 21 319 2703 378 13283 284
PA/DELAWARE COUNTY/4039.01 2 22 26 1066 321 14580 82
PA/DELAWARE COUNTY/4039.02 5 24 1 19 1497 596 3778 126 105
PA/DELAWARE COUNTY/4040.03 4 66 738 575 955
PA/DELAWARE COUNTY/4040.04 11 37 2 121 3697 1531 6296 286 132
PA/DELAWARE COUNTY/4041.01 12 1821 3547 2004 2659
PA/DELAWARE COUNTY/4041.02 4 15 315 2039 382 2306 287
PA/DELAWARE COUNTY/4041.03 2 20 29 1076 226 2765 82
PA/DELAWARE COUNTY/4043.00 1 7 1 19 790 82 771 111 82
PA/DELAWARE COUNTY/4044.00 3 13 380 292 60
PA/DELAWARE COUNTY/4045.00 5 1 29 711 350 91 97
PA/DELAWARE COUNTY/4046.00 5 24 220 405 102
PA/DELAWARE COUNTY/4047.00 2 22 93 116 90
PA/DELAWARE COUNTY/4048.00 2 11 20 48082 72
PA/DELAWARE COUNTY/4049.00 1 130 30
PA/DELAWARE COUNTY/4050.00 2 13 189 26893 81
PA/DELAWARE COUNTY/4051.00 2 11 60 181 80
PA/DELAWARE COUNTY/4052.00 6 422
06/02/2014Report Date:
AGGREGATE TABLE 2: LOANS PURCHASED, BY LOCATION OF PROPERTY AND TYPE OF LOAN, 2013
MSA/MD: 37964 - PHILADELPHIA, PA
Page 12 of 37
ALL LOANS ON PROPERTY LOCATED IN MSA/MD 3/
CENSUS TRACT OR COUNTY NAME 1/(STATE/COUNTY/TRACT NUMBER)
FHA, FSA/RHS & VA Conventional
Refinancings Home ImprovementLoans
Loans on DwellingsFor 5 or More
Families
Nonoccupant LoansFrom Columns A, B, C
& D
Number Number Number Number Number Number$000's $000's $000's $000's $000's $000's
A B C D E F
Home Purchase Loans
Loans on 1- to 4-Family and Manufactured Home Dwellings
Loans on ManufacturedHome Dwellings FromColumns A,B,C & D
G
Number $000's

PA/DELAWARE COUNTY/4053.00 6 250
PA/DELAWARE COUNTY/4054.00 14 113 35
PA/DELAWARE COUNTY/4061.00 1 11 122 2850 58 1238 42
PA/DELAWARE COUNTY/4062.01 4 15 1 111 1819 547 2523 82 118
PA/DELAWARE COUNTY/4062.02 14 28 214 2285 1785 4426 105
PA/DELAWARE COUNTY/4063.00 4 4 27 877 455 458 237
PA/DELAWARE COUNTY/4064.01 14 611 788 36579 344
PA/DELAWARE COUNTY/4064.02 12 216 87
PA/DELAWARE COUNTY/4065.00 46 541 416
PA/DELAWARE COUNTY/4066.00 2 311 1010 157 337
PA/DELAWARE COUNTY/4067.00 1 12 315 1218 44 46831 45850
PA/DELAWARE COUNTY/4068.01 8 22 117 2823 823 3860 92
PA/DELAWARE COUNTY/4068.02 9 2212 1722 1109 3006
PA/DELAWARE COUNTY/4068.03 23 47 1 527 4879 3078 8541 137 329
PA/DELAWARE COUNTY/4069.02 13 44 1 128 5237 2384 7519 158 187
PA/DELAWARE COUNTY/4069.03 9 34 18 1692 1620 28034 150
PA/DELAWARE COUNTY/4069.04 18 31 1 29 1831 3297 6457 216 288
PA/DELAWARE COUNTY/4070.00 11 144 869 2555 3687
PA/DELAWARE COUNTY/4071.01 16 20 11 244 5168 4133 170
PA/DELAWARE COUNTY/4071.02 6 22 19 2367 1521 3736 203
PA/DELAWARE COUNTY/4072.01 16 173 751 5680 3894
PA/DELAWARE COUNTY/4072.02 9 14 24 919 1821 2332 310
PA/DELAWARE COUNTY/4074.01 12 29 16 2117 3539 59271 141
PA/DELAWARE COUNTY/4074.04 13 221 363 3596 4948
PA/DELAWARE COUNTY/4075.01 10 18 1 33 690 2257 3259 252 448
PA/DELAWARE COUNTY/4075.02 8 7 2 13 948 1787 1142 384 119
PA/DELAWARE COUNTY/4076.00 18 32 13 859 5896 8994 278
06/02/2014Report Date:
AGGREGATE TABLE 2: LOANS PURCHASED, BY LOCATION OF PROPERTY AND TYPE OF LOAN, 2013
MSA/MD: 37964 - PHILADELPHIA, PA
Page 13 of 37
ALL LOANS ON PROPERTY LOCATED IN MSA/MD 3/
CENSUS TRACT OR COUNTY NAME 1/(STATE/COUNTY/TRACT NUMBER)
FHA, FSA/RHS & VA Conventional
Refinancings Home ImprovementLoans
Loans on DwellingsFor 5 or More
Families
Nonoccupant LoansFrom Columns A, B, C
& D
Number Number Number Number Number Number$000's $000's $000's $000's $000's $000's
A B C D E F
Home Purchase Loans
Loans on 1- to 4-Family and Manufactured Home Dwellings
Loans on ManufacturedHome Dwellings FromColumns A,B,C & D
G
Number $000's

PA/DELAWARE COUNTY/4077.00 2 7 1 13 640 475 950 198 171
PA/DELAWARE COUNTY/4078.01 11 26 15 1169 2410 4739 145
PA/DELAWARE COUNTY/4078.02 23 49 211 2706 5954 29491 350
PA/DELAWARE COUNTY/4078.03 20 30 1 118 4063 4318 5987 200 185
PA/DELAWARE COUNTY/4078.04 11 30 110 2584 2604 5975 165
PA/DELAWARE COUNTY/4078.05 8 6 1 11 247 1796 1108 199 199
PA/DELAWARE COUNTY/4078.06 6 13 14 908 1111 19957 167
PA/DELAWARE COUNTY/4079.01 12 21 11 424 3866 6352 408
PA/DELAWARE COUNTY/4079.02 13 21 23 973 3908 5922 206
PA/DELAWARE COUNTY/4079.03 22 19 12 491 5120 4667 92
PA/DELAWARE COUNTY/4080.01 13 406 1246 4163 37766
PA/DELAWARE COUNTY/4080.02 19 27 34579 7115 379
PA/DELAWARE COUNTY/4081.01 17 41 13 746 4760 32872 160
PA/DELAWARE COUNTY/4081.02 13 24 1 16 1687 2987 5154 155 184
PA/DELAWARE COUNTY/4081.03 16 23 17 1930 3293 4816 82
PA/DELAWARE COUNTY/4083.00 13 20 11 245 3812 6072 875
PA/DELAWARE COUNTY/4084.00 5 9 12474 3180 415
PA/DELAWARE COUNTY/4085.00 12 305 1154 2569 5969
PA/DELAWARE COUNTY/4086.00 14 26 16 1629 4059 6098 113
PA/DELAWARE COUNTY/4087.00 24 34 14 831 6357 8533 250
PA/DELAWARE COUNTY/4088.00 19 51 1 210 2214 4416 10318 276 299
PA/DELAWARE COUNTY/4089.00 20 18 14 927 5455 4126 394
PA/DELAWARE COUNTY/4090.00 11 26 18 1853 2860 25140 255
PA/DELAWARE COUNTY/4091.00 17 30 13 811 4287 6257 240
PA/DELAWARE COUNTY/4092.00 14 19 26 1257 2886 3700 187
PA/DELAWARE COUNTY/4093.00 11 13 1 24 739 2182 3133 302 278
PA/DELAWARE COUNTY/4094.00 8 30 32 435 1585 5202 507
06/02/2014Report Date:
AGGREGATE TABLE 2: LOANS PURCHASED, BY LOCATION OF PROPERTY AND TYPE OF LOAN, 2013
MSA/MD: 37964 - PHILADELPHIA, PA
Page 14 of 37
ALL LOANS ON PROPERTY LOCATED IN MSA/MD 3/
CENSUS TRACT OR COUNTY NAME 1/(STATE/COUNTY/TRACT NUMBER)
FHA, FSA/RHS & VA Conventional
Refinancings Home ImprovementLoans
Loans on DwellingsFor 5 or More
Families
Nonoccupant LoansFrom Columns A, B, C
& D
Number Number Number Number Number Number$000's $000's $000's $000's $000's $000's
A B C D E F
Home Purchase Loans
Loans on 1- to 4-Family and Manufactured Home Dwellings
Loans on ManufacturedHome Dwellings FromColumns A,B,C & D
G
Number $000's

PA/DELAWARE COUNTY/4095.00 21 219 2313 5782 4332
PA/DELAWARE COUNTY/4096.01 24 3013240 12112
PA/DELAWARE COUNTY/4096.02 14 15 1 51 207 3027 2899 150 740
PA/DELAWARE COUNTY/4097.01 26 38 1 51 314 14379 12335 368 1189
PA/DELAWARE COUNTY/4097.02 4 41 463 1543 1278
PA/DELAWARE COUNTY/4098.02 19 28 1 28150 50516 417 239
PA/DELAWARE COUNTY/4098.03 26 45 78668 14878 1871
PA/DELAWARE COUNTY/4099.02 14 29 1 1 12 713 3550 7571 415 37830 237
PA/DELAWARE COUNTY/4099.03 15 19 16 1672 3662 4388 200
PA/DELAWARE COUNTY/4099.04 12 19 15648 6240 400
PA/DELAWARE COUNTY/4100.00 14 201 412 4199 7046
PA/DELAWARE COUNTY/4101.00 21 47 2 13 1092 7197 14334 704 292
PA/DELAWARE COUNTY/4102.00 24 31 22 372 7470 7553 192
PA/DELAWARE COUNTY/4103.01 25 47 1 212 3919 8300 13136 230 337
PA/DELAWARE COUNTY/4103.02 39 39 1 31 308 11681 9706 18 1242
PA/DELAWARE COUNTY/4104.00 44 82 3 24 1330 12327 32678 937 243
PA/DELAWARE COUNTY/4105.00 7 24 372 693 125
PA/DELAWARE COUNTY/4106.01 7 1416 2814 1018 2322
PA/DELAWARE COUNTY/4106.02 6 31 110 2135 1167 5551 98
PA/DELAWARE COUNTY/4107.00 1 2 24 91 36 28579 31
PA/DELAWARE COUNTY/4108.00 32 56 211 2940 7918 27505 216
PA/MONTGOMERY COUNTY/2001.03 14 292 680 5129 8245
PA/MONTGOMERY COUNTY/2001.04 7 20 13 904 2077 4017 208
PA/MONTGOMERY COUNTY/2001.05 10 11 11 368 3307 2316 303
PA/MONTGOMERY COUNTY/2001.06 7 10 11 196 1991 1960 241
PA/MONTGOMERY COUNTY/2002.00 3 5 1885 1179 270
PA/MONTGOMERY COUNTY/2003.01 5 17 1 111 2346 1198 3542 197 242
06/02/2014Report Date:
AGGREGATE TABLE 2: LOANS PURCHASED, BY LOCATION OF PROPERTY AND TYPE OF LOAN, 2013
MSA/MD: 37964 - PHILADELPHIA, PA
Page 15 of 37
ALL LOANS ON PROPERTY LOCATED IN MSA/MD 3/
CENSUS TRACT OR COUNTY NAME 1/(STATE/COUNTY/TRACT NUMBER)
FHA, FSA/RHS & VA Conventional
Refinancings Home ImprovementLoans
Loans on DwellingsFor 5 or More
Families
Nonoccupant LoansFrom Columns A, B, C
& D
Number Number Number Number Number Number$000's $000's $000's $000's $000's $000's
A B C D E F
Home Purchase Loans
Loans on 1- to 4-Family and Manufactured Home Dwellings
Loans on ManufacturedHome Dwellings FromColumns A,B,C & D
G
Number $000's

PA/MONTGOMERY COUNTY/2003.05 4 12 12 441 680 1989 142
PA/MONTGOMERY COUNTY/2003.06 5 19 21 183 996 4115 367
PA/MONTGOMERY COUNTY/2003.07 7 12 1 14 731 1386 2016 167 96
PA/MONTGOMERY COUNTY/2003.08 13 17 19 1823 2197 3009 4
PA/MONTGOMERY COUNTY/2003.09 2 15 17 1588 427 3197 87
PA/MONTGOMERY COUNTY/2003.10 12 17 14 1010 3279 3802 194
PA/MONTGOMERY COUNTY/2004.01 6 20 1 58 2065 1129 3593 6463 953
PA/MONTGOMERY COUNTY/2004.02 8 19 1 315 2726 1169 3538 187 383
PA/MONTGOMERY COUNTY/2005.01 14 2710 2617 4311 6102
PA/MONTGOMERY COUNTY/2005.02 8 20 29 1914 2125 3898 360
PA/MONTGOMERY COUNTY/2005.05 20 41 2 12 1024 7182 12122 628 302
PA/MONTGOMERY COUNTY/2005.06 10 39 1 32 399 2826 8418 70 449
PA/MONTGOMERY COUNTY/2005.07 20 48 911 2434 4240 8808 1442
PA/MONTGOMERY COUNTY/2006.02 37 49 311 3558 9538 10351 442
PA/MONTGOMERY COUNTY/2006.03 11 307 1843 3083 6211
PA/MONTGOMERY COUNTY/2006.05 28 351 336 9431 9427
PA/MONTGOMERY COUNTY/2006.06 11 30 1 48 1295 2433 86710 240 418
PA/MONTGOMERY COUNTY/2006.07 13 424 892 2934 9522
PA/MONTGOMERY COUNTY/2007.03 9 256 1688 2091 4691
PA/MONTGOMERY COUNTY/2007.04 5 12 12 257 1132 2507 1
PA/MONTGOMERY COUNTY/2007.07 4 134 963 901 2783
PA/MONTGOMERY COUNTY/2007.08 9 35 19 1790 2202 6757 162
PA/MONTGOMERY COUNTY/2008.00 5 7 111 2246 805 1423 108
PA/MONTGOMERY COUNTY/2009.01 10 23 1 414 2515 1664 3437 107 390
PA/MONTGOMERY COUNTY/2009.02 4 17 1082 513 124
PA/MONTGOMERY COUNTY/2009.03 10 14 210 2031 1866 14498 447
PA/MONTGOMERY COUNTY/2009.06 5 14 12 367 946 2482 109
06/02/2014Report Date:
AGGREGATE TABLE 2: LOANS PURCHASED, BY LOCATION OF PROPERTY AND TYPE OF LOAN, 2013
MSA/MD: 37964 - PHILADELPHIA, PA
Page 16 of 37
ALL LOANS ON PROPERTY LOCATED IN MSA/MD 3/
CENSUS TRACT OR COUNTY NAME 1/(STATE/COUNTY/TRACT NUMBER)
FHA, FSA/RHS & VA Conventional
Refinancings Home ImprovementLoans
Loans on DwellingsFor 5 or More
Families
Nonoccupant LoansFrom Columns A, B, C
& D
Number Number Number Number Number Number$000's $000's $000's $000's $000's $000's
A B C D E F
Home Purchase Loans
Loans on 1- to 4-Family and Manufactured Home Dwellings
Loans on ManufacturedHome Dwellings FromColumns A,B,C & D
G
Number $000's

PA/MONTGOMERY COUNTY/2009.07 13 13 1 19 2048 2901 2376 155 142
PA/MONTGOMERY COUNTY/2009.08 6 14 1 36 1119 1086 2168 135 468
PA/MONTGOMERY COUNTY/2010.03 19 28 1 17 2028 4922 5581 22 205
PA/MONTGOMERY COUNTY/2010.04 16 39 110 2836 3235 7386 239
PA/MONTGOMERY COUNTY/2010.05 13 26 16 1464 3361 5880 85
PA/MONTGOMERY COUNTY/2010.06 11 171 345 2611 4158
PA/MONTGOMERY COUNTY/2011.00 9 21 28 1431 1812 3530 405
PA/MONTGOMERY COUNTY/2012.01 26 291 265 9140 8645
PA/MONTGOMERY COUNTY/2012.03 8 23 21 102 2847 7843 427
PA/MONTGOMERY COUNTY/2012.04 5 21 2 110 1861 1054 3786 312 99
PA/MONTGOMERY COUNTY/2013.01 6 17 44 1089 1286 3143 703
PA/MONTGOMERY COUNTY/2013.02 7 10 34 769 1105 1952 438
PA/MONTGOMERY COUNTY/2014.04 15 22 21 424 5567 6347 464
PA/MONTGOMERY COUNTY/2014.06 7 37 14 1107 2281 9433 196
PA/MONTGOMERY COUNTY/2014.07 10 156 1236 2489 3218
PA/MONTGOMERY COUNTY/2014.08 13 38 1 11 232 4462 9628 340 244
PA/MONTGOMERY COUNTY/2014.09 17 37 22 687 5453 35587 422
PA/MONTGOMERY COUNTY/2014.10 15 15 1 43 674 4267 2758 100 500
PA/MONTGOMERY COUNTY/2014.11 9 18 1 25 1197 2265 3779 247 384
PA/MONTGOMERY COUNTY/2015.01 8 121 409 2372 3165
PA/MONTGOMERY COUNTY/2015.02 8 92313 2489
PA/MONTGOMERY COUNTY/2016.03 10 3314 15076 1721 4952
PA/MONTGOMERY COUNTY/2016.04 4 22 1 213 2445 647 3875 146 348
PA/MONTGOMERY COUNTY/2016.05 7 218 1610 1588 3771
PA/MONTGOMERY COUNTY/2016.06 1 10 2 28 1417 166 1659 255 371
PA/MONTGOMERY COUNTY/2016.07 11 25 1 14 798 2242 4898 112 156
PA/MONTGOMERY COUNTY/2016.08 11 30 15 1135 2541 7015 182
06/02/2014Report Date:
AGGREGATE TABLE 2: LOANS PURCHASED, BY LOCATION OF PROPERTY AND TYPE OF LOAN, 2013
MSA/MD: 37964 - PHILADELPHIA, PA
Page 17 of 37
ALL LOANS ON PROPERTY LOCATED IN MSA/MD 3/
CENSUS TRACT OR COUNTY NAME 1/(STATE/COUNTY/TRACT NUMBER)
FHA, FSA/RHS & VA Conventional
Refinancings Home ImprovementLoans
Loans on DwellingsFor 5 or More
Families
Nonoccupant LoansFrom Columns A, B, C
& D
Number Number Number Number Number Number$000's $000's $000's $000's $000's $000's
A B C D E F
Home Purchase Loans
Loans on 1- to 4-Family and Manufactured Home Dwellings
Loans on ManufacturedHome Dwellings FromColumns A,B,C & D
G
Number $000's

PA/MONTGOMERY COUNTY/2017.03 5 25 111 2298 884 3996 161
PA/MONTGOMERY COUNTY/2017.04 7 18 25 932 1385 3424 216
PA/MONTGOMERY COUNTY/2017.05 10 32 1 69 2442 2447 6376 195 762
PA/MONTGOMERY COUNTY/2017.06 13 28 3 17 1722 2749 6390 528 216
PA/MONTGOMERY COUNTY/2018.00 17 17 12 628 5190 4685 378
PA/MONTGOMERY COUNTY/2019.01 13 29 15 1554 3820 7128 180
PA/MONTGOMERY COUNTY/2019.02 7 34 210 1893 1438 7694 329
PA/MONTGOMERY COUNTY/2020.00 2 17 13 513 459 3021 170
PA/MONTGOMERY COUNTY/2021.00 18 33 2 55 1062 3829 6066 382 593
PA/MONTGOMERY COUNTY/2022.01 13 23 320 3737 2455 15983 320
PA/MONTGOMERY COUNTY/2022.02 5 1811 2457 999 3374
PA/MONTGOMERY COUNTY/2023.01 16 23 39 2022 3063 19427 394
PA/MONTGOMERY COUNTY/2023.02 8 15 14 868 1426 14993 82
PA/MONTGOMERY COUNTY/2024.01 1 212
PA/MONTGOMERY COUNTY/2024.02 11 21 110 1557 2526 4563 265
PA/MONTGOMERY COUNTY/2025.00 6 14 211 2477 1674 2811 283
PA/MONTGOMERY COUNTY/2026.02 4 121097 2846
PA/MONTGOMERY COUNTY/2026.03 3 1111 2223 545 2381
PA/MONTGOMERY COUNTY/2026.04 11 15 15 1098 2861 2879 129
PA/MONTGOMERY COUNTY/2030.00 9 211 287 2640 5301
PA/MONTGOMERY COUNTY/2031.03 17 25 15 1369 5034 5492 190
PA/MONTGOMERY COUNTY/2031.04 10 23 13 616 2952 45462 331
PA/MONTGOMERY COUNTY/2031.05 22 47 13 938 6386 11228 152
PA/MONTGOMERY COUNTY/2031.06 6 9 1 12 385 1935 1637 164 176
PA/MONTGOMERY COUNTY/2032.03 7 263 830 1833 32276
PA/MONTGOMERY COUNTY/2032.04 16 50 1 410 2738 5754 13234 417 927
PA/MONTGOMERY COUNTY/2032.05 11 14 24120 3837 418
06/02/2014Report Date:
AGGREGATE TABLE 2: LOANS PURCHASED, BY LOCATION OF PROPERTY AND TYPE OF LOAN, 2013
MSA/MD: 37964 - PHILADELPHIA, PA
Page 18 of 37
ALL LOANS ON PROPERTY LOCATED IN MSA/MD 3/
CENSUS TRACT OR COUNTY NAME 1/(STATE/COUNTY/TRACT NUMBER)
FHA, FSA/RHS & VA Conventional
Refinancings Home ImprovementLoans
Loans on DwellingsFor 5 or More
Families
Nonoccupant LoansFrom Columns A, B, C
& D
Number Number Number Number Number Number$000's $000's $000's $000's $000's $000's
A B C D E F
Home Purchase Loans
Loans on 1- to 4-Family and Manufactured Home Dwellings
Loans on ManufacturedHome Dwellings FromColumns A,B,C & D
G
Number $000's

PA/MONTGOMERY COUNTY/2032.07 3 211 405 1042 6348
PA/MONTGOMERY COUNTY/2032.08 16 28 53 845 3858 6431 897
PA/MONTGOMERY COUNTY/2033.02 22 33 314 2839 4462 6620 434
PA/MONTGOMERY COUNTY/2033.03 14 21 2 37 1423 2943 3938 244 331
PA/MONTGOMERY COUNTY/2033.04 19 2013 2729 3865 3624
PA/MONTGOMERY COUNTY/2034.01 18 41 1 318 3131 2232 115494 153 398
PA/MONTGOMERY COUNTY/2034.02 26 39 115 2986 4775 7591 115
PA/MONTGOMERY COUNTY/2034.03 3 25 33 721 612 3910 412
PA/MONTGOMERY COUNTY/2035.00 3 25 119 2766 315 3520 98
PA/MONTGOMERY COUNTY/2036.01 1 15 546 40 196
PA/MONTGOMERY COUNTY/2036.02 2 20 1 522 3229 142 2499 56 420
PA/MONTGOMERY COUNTY/2037.00 23 389 195
PA/MONTGOMERY COUNTY/2038.01 4 18 413 1421 509 15951 258
PA/MONTGOMERY COUNTY/2038.03 1 14 86 880 71 1497 720
PA/MONTGOMERY COUNTY/2038.04 11 42 169 1015 260
PA/MONTGOMERY COUNTY/2039.02 1 4 33 368 77 300 166
PA/MONTGOMERY COUNTY/2040.02 5 9 21 352 1354 2067 352
PA/MONTGOMERY COUNTY/2040.07 3 14 1 12 639 838 2750 250 175
PA/MONTGOMERY COUNTY/2040.08 9 18 15 979 2207 4855 167
PA/MONTGOMERY COUNTY/2040.09 6 10 11 100 1791 2101 1
PA/MONTGOMERY COUNTY/2040.10 8 173 981 1915 4022
PA/MONTGOMERY COUNTY/2041.01 28 36 3 104 975 6915 6963 402 1846
PA/MONTGOMERY COUNTY/2041.02 21 31 2 147 1822 5598 6129 205 2410
PA/MONTGOMERY COUNTY/2042.00 21 17 45 1431 5954 3928 673
PA/MONTGOMERY COUNTY/2043.00 10 22 13 951 3409 4388 190
PA/MONTGOMERY COUNTY/2044.00 17 27 21 318 6476 8806 360
PA/MONTGOMERY COUNTY/2045.00 20 30 4 32 583 6631 9450 1177 593
06/02/2014Report Date:
AGGREGATE TABLE 2: LOANS PURCHASED, BY LOCATION OF PROPERTY AND TYPE OF LOAN, 2013
MSA/MD: 37964 - PHILADELPHIA, PA
Page 19 of 37
ALL LOANS ON PROPERTY LOCATED IN MSA/MD 3/
CENSUS TRACT OR COUNTY NAME 1/(STATE/COUNTY/TRACT NUMBER)
FHA, FSA/RHS & VA Conventional
Refinancings Home ImprovementLoans
Loans on DwellingsFor 5 or More
Families
Nonoccupant LoansFrom Columns A, B, C
& D
Number Number Number Number Number Number$000's $000's $000's $000's $000's $000's
A B C D E F
Home Purchase Loans
Loans on 1- to 4-Family and Manufactured Home Dwellings
Loans on ManufacturedHome Dwellings FromColumns A,B,C & D
G
Number $000's

PA/MONTGOMERY COUNTY/2046.00 28 43 212340 13701 426
PA/MONTGOMERY COUNTY/2047.01 7 16 41751 46250 42005
PA/MONTGOMERY COUNTY/2047.02 24 29 11 309 7972 8189 113
PA/MONTGOMERY COUNTY/2048.00 20 331 293 11084 15600
PA/MONTGOMERY COUNTY/2049.00 14 27 1 16981 11802 3331 336
PA/MONTGOMERY COUNTY/2050.00 6 4 11796 808 100
PA/MONTGOMERY COUNTY/2051.00 6 4 11 306 1759 1151 417
PA/MONTGOMERY COUNTY/2052.00 21 23 49128 9275 736
PA/MONTGOMERY COUNTY/2053.00 9 7 31 270 2533 1272 498
PA/MONTGOMERY COUNTY/2054.00 22 348791 11443
PA/MONTGOMERY COUNTY/2055.01 21 21 2 45 1078 5441 3670 682 664
PA/MONTGOMERY COUNTY/2055.02 20 36 12 695 6784 11190 398
PA/MONTGOMERY COUNTY/2055.03 19 41 14 1014 5977 11270 144
PA/MONTGOMERY COUNTY/2056.00 27 44 3 63 1021 8229 13463 1060 991
PA/MONTGOMERY COUNTY/2057.00 8 15 513 2125 898 2458 511
PA/MONTGOMERY COUNTY/2058.01 2 2 21 154 206 295 216
PA/MONTGOMERY COUNTY/2058.05 9 22 32 358 1953 3599 346
PA/MONTGOMERY COUNTY/2058.06 6 11 15 929 1090 1755 131
PA/MONTGOMERY COUNTY/2058.07 5 2 23 601 912 314 362
PA/MONTGOMERY COUNTY/2058.08 20 46 2 31 391 5473 10130 550 501
PA/MONTGOMERY COUNTY/2058.09 4 14 1 16 1610 914 2642 80 80
PA/MONTGOMERY COUNTY/2059.03 11 27 23 1396 3322 31647 646
PA/MONTGOMERY COUNTY/2059.04 10 15 13 923 3265 3948 350
PA/MONTGOMERY COUNTY/2059.05 7 13 16 1358 1491 21581 134
PA/MONTGOMERY COUNTY/2059.06 8 17 84 933 1987 17962 1182
PA/MONTGOMERY COUNTY/2060.04 7 30 1 14 611 1766 5749 185 124
PA/MONTGOMERY COUNTY/2060.05 13 30 17 1302 3074 6613 146
06/02/2014Report Date:
AGGREGATE TABLE 2: LOANS PURCHASED, BY LOCATION OF PROPERTY AND TYPE OF LOAN, 2013
MSA/MD: 37964 - PHILADELPHIA, PA
Page 20 of 37
ALL LOANS ON PROPERTY LOCATED IN MSA/MD 3/
CENSUS TRACT OR COUNTY NAME 1/(STATE/COUNTY/TRACT NUMBER)
FHA, FSA/RHS & VA Conventional
Refinancings Home ImprovementLoans
Loans on DwellingsFor 5 or More
Families
Nonoccupant LoansFrom Columns A, B, C
& D
Number Number Number Number Number Number$000's $000's $000's $000's $000's $000's
A B C D E F
Home Purchase Loans
Loans on 1- to 4-Family and Manufactured Home Dwellings
Loans on ManufacturedHome Dwellings FromColumns A,B,C & D
G
Number $000's

PA/MONTGOMERY COUNTY/2060.06 8 174 1126 1718 3553
PA/MONTGOMERY COUNTY/2060.07 12 334 987 2710 8589
PA/MONTGOMERY COUNTY/2061.02 54 61 2 722 4292 16186 12611 618 1264
PA/MONTGOMERY COUNTY/2061.04 25 21 16 1247 6682 4537 160
PA/MONTGOMERY COUNTY/2061.05 44 31 16 1871 12705 9010 240
PA/MONTGOMERY COUNTY/2061.06 16 34 313 2351 3536 6859 298
PA/MONTGOMERY COUNTY/2062.01 7 8 111 1982 1126 1427 159
PA/MONTGOMERY COUNTY/2062.02 4 47 1125 565 712
PA/MONTGOMERY COUNTY/2063.00 8 25 14 979 2143 6218 176
PA/MONTGOMERY COUNTY/2064.00 25 27 211 2660 5971 4775 306
PA/MONTGOMERY COUNTY/2065.01 19 338 1777 4909 6891
PA/MONTGOMERY COUNTY/2065.02 18 39 217 2950 5070 7065 275
PA/MONTGOMERY COUNTY/2066.00 2 5 13 535 407 852 69
PA/MONTGOMERY COUNTY/2067.03 31 197 1563 7113 3761
PA/MONTGOMERY COUNTY/2067.04 44 47 1 310 2287 12236 25274 183 712
PA/MONTGOMERY COUNTY/2068.01 33 45 24 681 9724 11971 310
PA/MONTGOMERY COUNTY/2068.02 7 22 1 14 768 1924 5064 117 196
PA/MONTGOMERY COUNTY/2069.01 12 152 692 3420 2930
PA/MONTGOMERY COUNTY/2069.04 23 23 48 1855 5717 4410 469
PA/MONTGOMERY COUNTY/2069.05 19 50 47 1544 4020 9729 677
PA/MONTGOMERY COUNTY/2069.06 9 20 33 584 1825 4492 288
PA/MONTGOMERY COUNTY/2070.01 23 55 1 25 1306 7061 15650 236 649
PA/MONTGOMERY COUNTY/2070.03 3 19 11 244 699 4796 186
PA/MONTGOMERY COUNTY/2070.04 7 19 2 18 1993 1464 3976 616 218
PA/MONTGOMERY COUNTY/2071.01 11 293 646 2208 6532
PA/MONTGOMERY COUNTY/2071.03 7 21 210 2216 1857 4118 283
PA/MONTGOMERY COUNTY/2071.04 2 83 889 461 2245
06/02/2014Report Date:
AGGREGATE TABLE 2: LOANS PURCHASED, BY LOCATION OF PROPERTY AND TYPE OF LOAN, 2013
MSA/MD: 37964 - PHILADELPHIA, PA
Page 21 of 37
ALL LOANS ON PROPERTY LOCATED IN MSA/MD 3/
CENSUS TRACT OR COUNTY NAME 1/(STATE/COUNTY/TRACT NUMBER)
FHA, FSA/RHS & VA Conventional
Refinancings Home ImprovementLoans
Loans on DwellingsFor 5 or More
Families
Nonoccupant LoansFrom Columns A, B, C
& D
Number Number Number Number Number Number$000's $000's $000's $000's $000's $000's
A B C D E F
Home Purchase Loans
Loans on 1- to 4-Family and Manufactured Home Dwellings
Loans on ManufacturedHome Dwellings FromColumns A,B,C & D
G
Number $000's

PA/MONTGOMERY COUNTY/2072.01 4 7 15 897 883 1220 155
PA/MONTGOMERY COUNTY/2072.02 6 27 117 3412 1165 4765 160
PA/MONTGOMERY COUNTY/2073.00 2 13 1 110 1938 356 2261 222 155
PA/MONTGOMERY COUNTY/2074.00 30 12 116 4363 6975 21541 259
PA/MONTGOMERY COUNTY/2075.00 8 18 1 11 207 2163 4032 100 131
PA/MONTGOMERY COUNTY/2076.00 9 1111 2117 2502 2647
PA/MONTGOMERY COUNTY/2078.00 18 39 1 230 6486 4624 8441 70 340
PA/MONTGOMERY COUNTY/2079.00 3 9 18 1507 380 1528 158
PA/MONTGOMERY COUNTY/2080.00 6 18 115 2699 903 3142 50
PA/MONTGOMERY COUNTY/2081.00 7 17 116 2198 961 2216 71
PA/MONTGOMERY COUNTY/2082.01 5 10 18 1767 1124 1935 299
PA/MONTGOMERY COUNTY/2082.03 17 23 115 3323 3219 95478 206
PA/MONTGOMERY COUNTY/2082.04 8 324 895 2013 6506
PA/MONTGOMERY COUNTY/2083.01 2 12618 2369
PA/MONTGOMERY COUNTY/2083.02 51 73 347 11959 12792 16495 634
PA/MONTGOMERY COUNTY/2084.00 7 21 115 2765 1634 3832 75
PA/MONTGOMERY COUNTY/2085.00 10 3018 3289 2571 5220
PA/MONTGOMERY COUNTY/2086.01 23 48 421 5517 6297 11399 630
PA/MONTGOMERY COUNTY/2086.03 23 55 232 7138 5262 10820 280
PA/MONTGOMERY COUNTY/2086.04 27 35 315 3578 7161 7748 279
PA/MONTGOMERY COUNTY/2087.02 6 2314 2730 1147 4619
PA/MONTGOMERY COUNTY/2087.03 8 22 112 2164 1289 4264 145
PA/MONTGOMERY COUNTY/2087.04 11 27 116 2719 1695 4657 108
PA/MONTGOMERY COUNTY/2088.01 5 1 212 1882 609 115 201
PA/MONTGOMERY COUNTY/2088.02 1 10 312 1343 113 1162 312
PA/MONTGOMERY COUNTY/2089.01 8 23 310 1136 857 2491 329
PA/MONTGOMERY COUNTY/2089.03 2 11 1 47 885 187 1428 191 372
06/02/2014Report Date:
AGGREGATE TABLE 2: LOANS PURCHASED, BY LOCATION OF PROPERTY AND TYPE OF LOAN, 2013
MSA/MD: 37964 - PHILADELPHIA, PA
Page 22 of 37
ALL LOANS ON PROPERTY LOCATED IN MSA/MD 3/
CENSUS TRACT OR COUNTY NAME 1/(STATE/COUNTY/TRACT NUMBER)
FHA, FSA/RHS & VA Conventional
Refinancings Home ImprovementLoans
Loans on DwellingsFor 5 or More
Families
Nonoccupant LoansFrom Columns A, B, C
& D
Number Number Number Number Number Number$000's $000's $000's $000's $000's $000's
A B C D E F
Home Purchase Loans
Loans on 1- to 4-Family and Manufactured Home Dwellings
Loans on ManufacturedHome Dwellings FromColumns A,B,C & D
G
Number $000's

PA/MONTGOMERY COUNTY/2089.04 1 7 13 307 22 734 22
PA/MONTGOMERY COUNTY/2089.05 2 914 1810 164 992
PA/MONTGOMERY COUNTY/2089.06 6 12 910 951 409 43366 696
PA/MONTGOMERY COUNTY/2090.00 2 8 47 681 239 756 377
PA/MONTGOMERY COUNTY/2091.00 14 41 121 4318 2576 20183 71
PA/MONTGOMERY COUNTY/2092.01 2 38 1393 188 438
PA/MONTGOMERY COUNTY/2092.02 7 11 25 690 611 1253 129
PA/MONTGOMERY COUNTY/2101.00 12 27 47 1470 2791 4846 505
PA/MONTGOMERY COUNTY/2102.00 13 21 14 929 2730 4629 224
PA/MONTGOMERY COUNTY/2103.00 14 17 15 1574 4424 3757 198
PA/MONTGOMERY COUNTY/2104.00 17 285 1111 4512 21283
PA/MONTGOMERY COUNTY/2105.00 23 33 2 14 752 7402 8443 625 122
PA/MONTGOMERY COUNTY/2106.00 8 2712 2587 1928 5701
PA/MONTGOMERY COUNTY/2107.00 22 47 2 312 3591 6529 11253 487 867
PA/PHILADELPHIA COUNTY/0001.00 35 37 1211943 10002 2760
PA/PHILADELPHIA COUNTY/0002.00 8 7 41 127 1220 1319 657
PA/PHILADELPHIA COUNTY/0003.00 10 17 2 43170 5122 295 994
PA/PHILADELPHIA COUNTY/0004.01 23 14 87988 3459 1843
PA/PHILADELPHIA COUNTY/0004.02 9 14 73186 3904 1610
PA/PHILADELPHIA COUNTY/0005.00 3 1 1704 200 260
PA/PHILADELPHIA COUNTY/0006.00 2 497
PA/PHILADELPHIA COUNTY/0007.00 29 11 1210650 3404 3769
PA/PHILADELPHIA COUNTY/0008.01 7 8 31985 2397 764
PA/PHILADELPHIA COUNTY/0008.03 13 23 135846 7954 4464
PA/PHILADELPHIA COUNTY/0008.04 15 18 125079 7238 3061
PA/PHILADELPHIA COUNTY/0009.01 4 5 21 338 932 1550 445
PA/PHILADELPHIA COUNTY/0009.02 9 11 12986 4587 393
06/02/2014Report Date:
AGGREGATE TABLE 2: LOANS PURCHASED, BY LOCATION OF PROPERTY AND TYPE OF LOAN, 2013
MSA/MD: 37964 - PHILADELPHIA, PA
Page 23 of 37
ALL LOANS ON PROPERTY LOCATED IN MSA/MD 3/
CENSUS TRACT OR COUNTY NAME 1/(STATE/COUNTY/TRACT NUMBER)
FHA, FSA/RHS & VA Conventional
Refinancings Home ImprovementLoans
Loans on DwellingsFor 5 or More
Families
Nonoccupant LoansFrom Columns A, B, C
& D
Number Number Number Number Number Number$000's $000's $000's $000's $000's $000's
A B C D E F
Home Purchase Loans
Loans on 1- to 4-Family and Manufactured Home Dwellings
Loans on ManufacturedHome Dwellings FromColumns A,B,C & D
G
Number $000's

PA/PHILADELPHIA COUNTY/0010.01 17 28 127087 7437 3038
PA/PHILADELPHIA COUNTY/0010.02 21 36 1 131 501 7571 10929 304 2509
PA/PHILADELPHIA COUNTY/0011.01 15 16 1 1 91 424 4924 4078 384 2582 1904
PA/PHILADELPHIA COUNTY/0011.02 22 20 1 37005 5907 3284 681
PA/PHILADELPHIA COUNTY/0012.01 16 23 62 759 6086 6362 1473
PA/PHILADELPHIA COUNTY/0012.02 28 29 1 101 323 12548 9375 315 2529
PA/PHILADELPHIA COUNTY/0013.00 91 60 2 159 2773 29435 16193 561 3693
PA/PHILADELPHIA COUNTY/0014.00 36 43 103 1047 14619 12151 2813
PA/PHILADELPHIA COUNTY/0015.00 24 23 88437 7416 2031
PA/PHILADELPHIA COUNTY/0016.00 12 22 1 22 619 3977 7128 275 712
PA/PHILADELPHIA COUNTY/0017.00 23 33 72 1006 7681 8334 1788
PA/PHILADELPHIA COUNTY/0018.00 21 21 1 64 1151 7244 6090 400 1664
PA/PHILADELPHIA COUNTY/0019.00 33 33 187 2576 9965 43928 17436
PA/PHILADELPHIA COUNTY/0020.00 6 3 36 1184 1486 11204 583
PA/PHILADELPHIA COUNTY/0021.00 13 11 915 3260 2721 18128 1415
PA/PHILADELPHIA COUNTY/0022.00 17 6 79 2332 3595 796 969
PA/PHILADELPHIA COUNTY/0023.00 16 23 25 1459 4784 78325 323
PA/PHILADELPHIA COUNTY/0024.00 34 41 83 841 9499 27708 1544
PA/PHILADELPHIA COUNTY/0025.00 33 25 49460 6496 684
PA/PHILADELPHIA COUNTY/0027.01 9 96 833 1667 1775
PA/PHILADELPHIA COUNTY/0027.02 18 32 1 1012 2098 4082 53794 143 1762
PA/PHILADELPHIA COUNTY/0028.01 6 18 510 1458 1009 2827 553
PA/PHILADELPHIA COUNTY/0028.02 31 32 3 810 1973 6933 5241 486 1087
PA/PHILADELPHIA COUNTY/0029.00 25 35 1 49 2073 6063 22022 288 645
PA/PHILADELPHIA COUNTY/0030.01 8 6 23 531 876 608 172
PA/PHILADELPHIA COUNTY/0030.02 12 11 710 1634 2204 1367 620
PA/PHILADELPHIA COUNTY/0031.00 8 14 77 1068 916 115590 701
06/02/2014Report Date:
AGGREGATE TABLE 2: LOANS PURCHASED, BY LOCATION OF PROPERTY AND TYPE OF LOAN, 2013
MSA/MD: 37964 - PHILADELPHIA, PA
Page 24 of 37
ALL LOANS ON PROPERTY LOCATED IN MSA/MD 3/
CENSUS TRACT OR COUNTY NAME 1/(STATE/COUNTY/TRACT NUMBER)
FHA, FSA/RHS & VA Conventional
Refinancings Home ImprovementLoans
Loans on DwellingsFor 5 or More
Families
Nonoccupant LoansFrom Columns A, B, C
& D
Number Number Number Number Number Number$000's $000's $000's $000's $000's $000's
A B C D E F
Home Purchase Loans
Loans on 1- to 4-Family and Manufactured Home Dwellings
Loans on ManufacturedHome Dwellings FromColumns A,B,C & D
G
Number $000's

PA/PHILADELPHIA COUNTY/0032.00 1 3 27 722 5 301 128
PA/PHILADELPHIA COUNTY/0033.00 2 9 413 968 98 506 247
PA/PHILADELPHIA COUNTY/0036.00 2 11 412 1195 144 1097 386
PA/PHILADELPHIA COUNTY/0037.01 13 416 1123 1010 241
PA/PHILADELPHIA COUNTY/0037.02 4 12 515 974 264 1302 328
PA/PHILADELPHIA COUNTY/0038.00 8 19 1 212 1836 1547 14387 200 222
PA/PHILADELPHIA COUNTY/0039.01 14 28 716 2433 1713 4210 823
PA/PHILADELPHIA COUNTY/0039.02 6 41 2 121 3756 899 5904 482 130
PA/PHILADELPHIA COUNTY/0040.01 17 19 1 49 1586 2700 2927 196 521
PA/PHILADELPHIA COUNTY/0040.02 12 25 416 2707 1731 3518 275
PA/PHILADELPHIA COUNTY/0041.01 4 9 47 983 559 800 424
PA/PHILADELPHIA COUNTY/0041.02 12 16 1211 1280 973 76852 909
PA/PHILADELPHIA COUNTY/0042.01 6 34 1 212 1958 1071 5317 160 186
PA/PHILADELPHIA COUNTY/0042.02 8 24 714 2222 1007 2857 900
PA/PHILADELPHIA COUNTY/0054.00 21 128 196
PA/PHILADELPHIA COUNTY/0055.00 1 20 1 218 2095 125 2027 86 185
PA/PHILADELPHIA COUNTY/0056.00 11 137 87
PA/PHILADELPHIA COUNTY/0060.00 6 20 231 2644 693 1934 177
PA/PHILADELPHIA COUNTY/0061.00 2 9 214 1299 245 169065 288
PA/PHILADELPHIA COUNTY/0062.00 2 523 1539 207 326
PA/PHILADELPHIA COUNTY/0063.00 3 18 509 197 34955
PA/PHILADELPHIA COUNTY/0064.00 1 12 1 110 666 104 889 111 34
PA/PHILADELPHIA COUNTY/0065.00 2 3 15 380 165 34076 94
PA/PHILADELPHIA COUNTY/0066.00 1 13 136 16 56
PA/PHILADELPHIA COUNTY/0067.00 4 7 231 2130 215 875 506
PA/PHILADELPHIA COUNTY/0069.00 13 47 128
PA/PHILADELPHIA COUNTY/0070.00 23 203 107
06/02/2014Report Date:
AGGREGATE TABLE 2: LOANS PURCHASED, BY LOCATION OF PROPERTY AND TYPE OF LOAN, 2013
MSA/MD: 37964 - PHILADELPHIA, PA
Page 25 of 37
ALL LOANS ON PROPERTY LOCATED IN MSA/MD 3/
CENSUS TRACT OR COUNTY NAME 1/(STATE/COUNTY/TRACT NUMBER)
FHA, FSA/RHS & VA Conventional
Refinancings Home ImprovementLoans
Loans on DwellingsFor 5 or More
Families
Nonoccupant LoansFrom Columns A, B, C
& D
Number Number Number Number Number Number$000's $000's $000's $000's $000's $000's
A B C D E F
Home Purchase Loans
Loans on 1- to 4-Family and Manufactured Home Dwellings
Loans on ManufacturedHome Dwellings FromColumns A,B,C & D
G
Number $000's

PA/PHILADELPHIA COUNTY/0071.01 1 108
PA/PHILADELPHIA COUNTY/0071.02 2 44 251 93 42607
PA/PHILADELPHIA COUNTY/0072.00 29 569 83
PA/PHILADELPHIA COUNTY/0073.00 3 10 34 660 403 163115 147
PA/PHILADELPHIA COUNTY/0074.00 43 209 169960
PA/PHILADELPHIA COUNTY/0077.00 4 11069 262
PA/PHILADELPHIA COUNTY/0078.00 9 14 31 407 2586 2928 897
PA/PHILADELPHIA COUNTY/0079.00 16 24 1 21 424 4022 5875 283 394
PA/PHILADELPHIA COUNTY/0080.00 4 8 16 758 723 945 75
PA/PHILADELPHIA COUNTY/0081.01 1 2 1 12 105 96 88382 68 88290
PA/PHILADELPHIA COUNTY/0081.02 7 26 456 81824 149
PA/PHILADELPHIA COUNTY/0082.00 1 9 1 211 820 94 134879 81 139
PA/PHILADELPHIA COUNTY/0083.01 210 722 200
PA/PHILADELPHIA COUNTY/0083.02 28 523 138
PA/PHILADELPHIA COUNTY/0084.00 45 344 460
PA/PHILADELPHIA COUNTY/0085.00 6 13 1 59 1054 1056 162520 77 859
PA/PHILADELPHIA COUNTY/0086.01 10 8 22031 2077 200
PA/PHILADELPHIA COUNTY/0086.02 4 7 62 351 848 1112 1185
PA/PHILADELPHIA COUNTY/0087.01 6 11 51 260 1583 2922 1227
PA/PHILADELPHIA COUNTY/0087.02 3 3 11 132 1072 1012 314
PA/PHILADELPHIA COUNTY/0090.00 5 31274 650
PA/PHILADELPHIA COUNTY/0091.00 3 1 1 2808 301 66000 468
PA/PHILADELPHIA COUNTY/0092.00 4 3 31 152 979 628 756
PA/PHILADELPHIA COUNTY/0093.00 6 45 293 36856 236
PA/PHILADELPHIA COUNTY/0094.00 4 14 171 40598 41
PA/PHILADELPHIA COUNTY/0095.00 18 615 62
PA/PHILADELPHIA COUNTY/0096.00 1 3 15 390 28 104983 44
06/02/2014Report Date:
AGGREGATE TABLE 2: LOANS PURCHASED, BY LOCATION OF PROPERTY AND TYPE OF LOAN, 2013
MSA/MD: 37964 - PHILADELPHIA, PA
Page 26 of 37
ALL LOANS ON PROPERTY LOCATED IN MSA/MD 3/
CENSUS TRACT OR COUNTY NAME 1/(STATE/COUNTY/TRACT NUMBER)
FHA, FSA/RHS & VA Conventional
Refinancings Home ImprovementLoans
Loans on DwellingsFor 5 or More
Families
Nonoccupant LoansFrom Columns A, B, C
& D
Number Number Number Number Number Number$000's $000's $000's $000's $000's $000's
A B C D E F
Home Purchase Loans
Loans on 1- to 4-Family and Manufactured Home Dwellings
Loans on ManufacturedHome Dwellings FromColumns A,B,C & D
G
Number $000's

PA/PHILADELPHIA COUNTY/0098.01 2 8 114 1547 249 685 45
PA/PHILADELPHIA COUNTY/0098.02 2 27 1 226 2919 203 2878 93 209
PA/PHILADELPHIA COUNTY/0100.00 3 813 933 330 53865
PA/PHILADELPHIA COUNTY/0101.00 7 110 757 127450 66
PA/PHILADELPHIA COUNTY/0102.00 4 16 522 44001 25
PA/PHILADELPHIA COUNTY/0103.00 2 12 122 45277 76
PA/PHILADELPHIA COUNTY/0104.00 2 15 356 35164 25
PA/PHILADELPHIA COUNTY/0105.00 4 13 327 291 73
PA/PHILADELPHIA COUNTY/0106.00 2 156
PA/PHILADELPHIA COUNTY/0107.00 1 3 11 60 68 38194 193
PA/PHILADELPHIA COUNTY/0108.00 1 149 49
PA/PHILADELPHIA COUNTY/0109.00 1 2 21 167 191 271 406
PA/PHILADELPHIA COUNTY/0110.00 1 4 21 74 48 47756 167
PA/PHILADELPHIA COUNTY/0111.00 1 4 12 179 15 33773 52
PA/PHILADELPHIA COUNTY/0112.00 8 1 16 453 77607 116 59
PA/PHILADELPHIA COUNTY/0113.00 33 299 55596
PA/PHILADELPHIA COUNTY/0114.00 18 1 317 1953 1891 120 322
PA/PHILADELPHIA COUNTY/0115.00 2 15 2 217 1576 160 1250 126 85
PA/PHILADELPHIA COUNTY/0117.00 1 3 2172 688 375
PA/PHILADELPHIA COUNTY/0118.00 2 18 115 1818 254 27487 75
PA/PHILADELPHIA COUNTY/0119.00 12 18 781 43340 51
PA/PHILADELPHIA COUNTY/0120.00 1 52 545 160 1079
PA/PHILADELPHIA COUNTY/0121.00 45 1031 111255
PA/PHILADELPHIA COUNTY/0122.04 3 20 69 1476 267 2175 715
PA/PHILADELPHIA COUNTY/0125.00 9 13 33 529 2210 2949 572
PA/PHILADELPHIA COUNTY/0131.00 1 4 3255 495 340
PA/PHILADELPHIA COUNTY/0132.00 4 1982 567
06/02/2014Report Date:
AGGREGATE TABLE 2: LOANS PURCHASED, BY LOCATION OF PROPERTY AND TYPE OF LOAN, 2013
MSA/MD: 37964 - PHILADELPHIA, PA
Page 27 of 37
ALL LOANS ON PROPERTY LOCATED IN MSA/MD 3/
CENSUS TRACT OR COUNTY NAME 1/(STATE/COUNTY/TRACT NUMBER)
FHA, FSA/RHS & VA Conventional
Refinancings Home ImprovementLoans
Loans on DwellingsFor 5 or More
Families
Nonoccupant LoansFrom Columns A, B, C
& D
Number Number Number Number Number Number$000's $000's $000's $000's $000's $000's
A B C D E F
Home Purchase Loans
Loans on 1- to 4-Family and Manufactured Home Dwellings
Loans on ManufacturedHome Dwellings FromColumns A,B,C & D
G
Number $000's
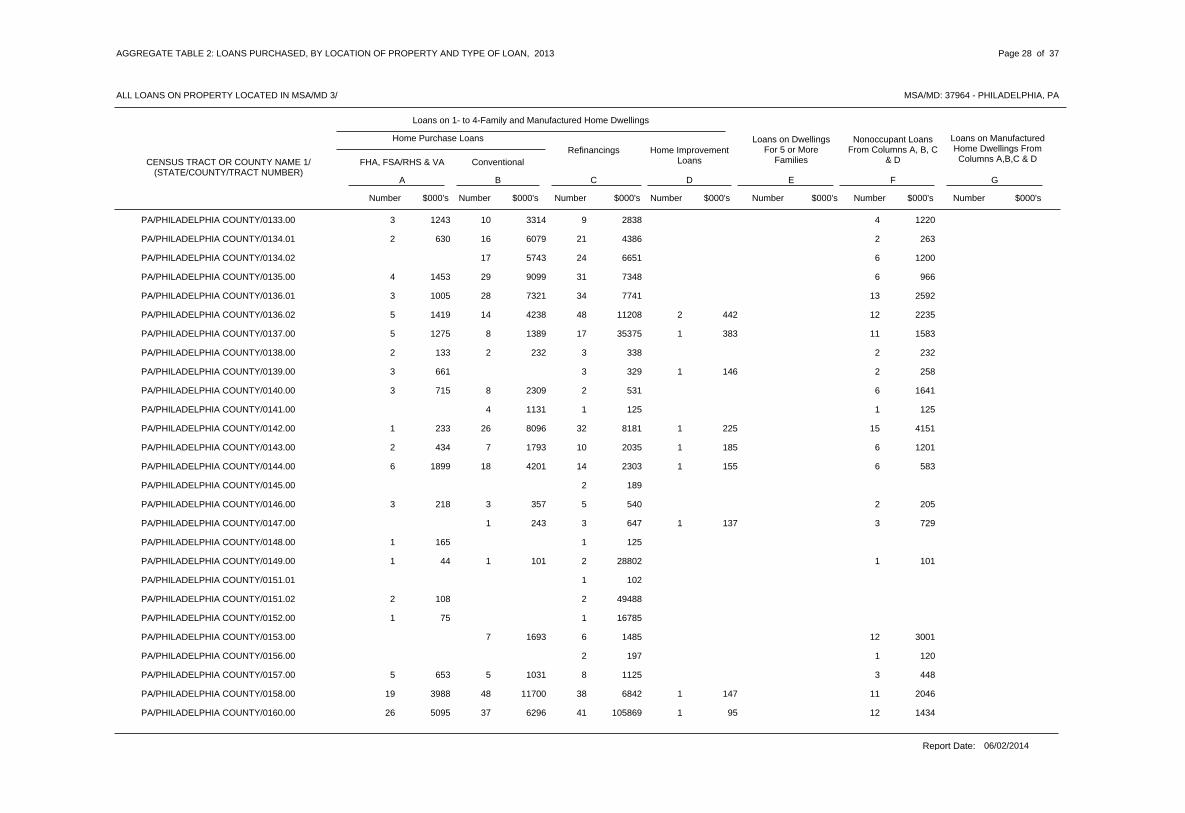
PA/PHILADELPHIA COUNTY/0133.00 10 9 43 1243 3314 2838 1220
PA/PHILADELPHIA COUNTY/0134.01 16 21 22 630 6079 4386 263
PA/PHILADELPHIA COUNTY/0134.02 17 24 65743 6651 1200
PA/PHILADELPHIA COUNTY/0135.00 29 31 64 1453 9099 7348 966
PA/PHILADELPHIA COUNTY/0136.01 28 34 133 1005 7321 7741 2592
PA/PHILADELPHIA COUNTY/0136.02 14 48 2 125 1419 4238 11208 442 2235
PA/PHILADELPHIA COUNTY/0137.00 8 17 1 115 1275 1389 35375 383 1583
PA/PHILADELPHIA COUNTY/0138.00 2 3 22 133 232 338 232
PA/PHILADELPHIA COUNTY/0139.00 3 1 23 661 329 146 258
PA/PHILADELPHIA COUNTY/0140.00 8 2 63 715 2309 531 1641
PA/PHILADELPHIA COUNTY/0141.00 4 1 11131 125 125
PA/PHILADELPHIA COUNTY/0142.00 26 32 1 151 233 8096 8181 225 4151
PA/PHILADELPHIA COUNTY/0143.00 7 10 1 62 434 1793 2035 185 1201
PA/PHILADELPHIA COUNTY/0144.00 18 14 1 66 1899 4201 2303 155 583
PA/PHILADELPHIA COUNTY/0145.00 2 189
PA/PHILADELPHIA COUNTY/0146.00 3 5 23 218 357 540 205
PA/PHILADELPHIA COUNTY/0147.00 1 3 1 3243 647 137 729
PA/PHILADELPHIA COUNTY/0148.00 11 165 125
PA/PHILADELPHIA COUNTY/0149.00 1 2 11 44 101 28802 101
PA/PHILADELPHIA COUNTY/0151.01 1 102
PA/PHILADELPHIA COUNTY/0151.02 22 108 49488
PA/PHILADELPHIA COUNTY/0152.00 11 75 16785
PA/PHILADELPHIA COUNTY/0153.00 7 6 121693 1485 3001
PA/PHILADELPHIA COUNTY/0156.00 2 1197 120
PA/PHILADELPHIA COUNTY/0157.00 5 8 35 653 1031 1125 448
PA/PHILADELPHIA COUNTY/0158.00 48 38 1 1119 3988 11700 6842 147 2046
PA/PHILADELPHIA COUNTY/0160.00 37 41 1 1226 5095 6296 105869 95 1434
06/02/2014Report Date:
AGGREGATE TABLE 2: LOANS PURCHASED, BY LOCATION OF PROPERTY AND TYPE OF LOAN, 2013
MSA/MD: 37964 - PHILADELPHIA, PA
Page 28 of 37
ALL LOANS ON PROPERTY LOCATED IN MSA/MD 3/
CENSUS TRACT OR COUNTY NAME 1/(STATE/COUNTY/TRACT NUMBER)
FHA, FSA/RHS & VA Conventional
Refinancings Home ImprovementLoans
Loans on DwellingsFor 5 or More
Families
Nonoccupant LoansFrom Columns A, B, C
& D
Number Number Number Number Number Number$000's $000's $000's $000's $000's $000's
A B C D E F
Home Purchase Loans
Loans on 1- to 4-Family and Manufactured Home Dwellings
Loans on ManufacturedHome Dwellings FromColumns A,B,C & D
G
Number $000's

PA/PHILADELPHIA COUNTY/0161.00 17 14 1018 3697 2949 24195 1583
PA/PHILADELPHIA COUNTY/0162.00 2 2310 310
PA/PHILADELPHIA COUNTY/0163.00 13 296 44373
PA/PHILADELPHIA COUNTY/0164.00 11 44 48
PA/PHILADELPHIA COUNTY/0165.00 2 11 67 33866 74
PA/PHILADELPHIA COUNTY/0166.00 1 1 21 378 116 166 282
PA/PHILADELPHIA COUNTY/0167.01 1 111 38
PA/PHILADELPHIA COUNTY/0167.02 1 26
PA/PHILADELPHIA COUNTY/0168.00 13 137 55522
PA/PHILADELPHIA COUNTY/0169.01 1 78
PA/PHILADELPHIA COUNTY/0169.02 23 171 46393
PA/PHILADELPHIA COUNTY/0170.00 31 37 210
PA/PHILADELPHIA COUNTY/0171.00 32 103 36884
PA/PHILADELPHIA COUNTY/0172.01 13 203 44701
PA/PHILADELPHIA COUNTY/0172.02 1 11 41 28 28
PA/PHILADELPHIA COUNTY/0173.00 11 4 23355
PA/PHILADELPHIA COUNTY/0175.00 1 13 167 24 29972
PA/PHILADELPHIA COUNTY/0176.01 1 34
PA/PHILADELPHIA COUNTY/0176.02 1 12 77 55 55
PA/PHILADELPHIA COUNTY/0177.01 1 2 1 15 152 16 106 52 47
PA/PHILADELPHIA COUNTY/0178.00 2 4 213 705 83 189 84
PA/PHILADELPHIA COUNTY/0179.00 8 49 470 31752 148
PA/PHILADELPHIA COUNTY/0180.01 7 7 312 1794 846 938 167
PA/PHILADELPHIA COUNTY/0180.02 8 17 1 317 2170 914 2012 148 261
PA/PHILADELPHIA COUNTY/0183.00 5 13 1 317 2036 594 1551 94 274
PA/PHILADELPHIA COUNTY/0184.00 11 313 1931 1176 356
PA/PHILADELPHIA COUNTY/0188.00 3 5 1 216 857 70 357 32 92
06/02/2014Report Date:
AGGREGATE TABLE 2: LOANS PURCHASED, BY LOCATION OF PROPERTY AND TYPE OF LOAN, 2013
MSA/MD: 37964 - PHILADELPHIA, PA
Page 29 of 37
ALL LOANS ON PROPERTY LOCATED IN MSA/MD 3/
CENSUS TRACT OR COUNTY NAME 1/(STATE/COUNTY/TRACT NUMBER)
FHA, FSA/RHS & VA Conventional
Refinancings Home ImprovementLoans
Loans on DwellingsFor 5 or More
Families
Nonoccupant LoansFrom Columns A, B, C
& D
Number Number Number Number Number Number$000's $000's $000's $000's $000's $000's
A B C D E F
Home Purchase Loans
Loans on 1- to 4-Family and Manufactured Home Dwellings
Loans on ManufacturedHome Dwellings FromColumns A,B,C & D
G
Number $000's

PA/PHILADELPHIA COUNTY/0190.00 1 11 1 545 3489 97 866 87 303
PA/PHILADELPHIA COUNTY/0191.00 4 10 2 156 4421 295 694 177 50
PA/PHILADELPHIA COUNTY/0192.00 1 311 514 16 226
PA/PHILADELPHIA COUNTY/0195.01 2 17
PA/PHILADELPHIA COUNTY/0195.02 12 64 62
PA/PHILADELPHIA COUNTY/0197.00 2 319 1037 117 121
PA/PHILADELPHIA COUNTY/0198.00 16 285 63
PA/PHILADELPHIA COUNTY/0199.00 1 32 77 52 163
PA/PHILADELPHIA COUNTY/0201.02 3 1 26 312 38187 47 93
PA/PHILADELPHIA COUNTY/0202.00 5 1 13 192 342 130 49
PA/PHILADELPHIA COUNTY/0203.00 2 1134 47
PA/PHILADELPHIA COUNTY/0204.00 1 1 11 66 40 32636 40
PA/PHILADELPHIA COUNTY/0205.00 12 115 36
PA/PHILADELPHIA COUNTY/0206.00 5 21825 377
PA/PHILADELPHIA COUNTY/0207.00 25 37 712 2487 5293 6653 1160
PA/PHILADELPHIA COUNTY/0208.00 4 7 23 408 896 939 265
PA/PHILADELPHIA COUNTY/0209.00 12 24 75 1046 2496 4331 1145
PA/PHILADELPHIA COUNTY/0210.00 27 46 218 1758 5046 7668 3183
PA/PHILADELPHIA COUNTY/0211.00 10 15 17 1493 1912 2799 146
PA/PHILADELPHIA COUNTY/0212.00 3 9 1 77 1483 503 1470 133 1096
PA/PHILADELPHIA COUNTY/0213.00 20 21 1013 2781 3997 3805 1645
PA/PHILADELPHIA COUNTY/0214.00 13 22 2 146 1307 2702 3576 150 2289
PA/PHILADELPHIA COUNTY/0215.00 20 41 216 1185 4671 103144 3731
PA/PHILADELPHIA COUNTY/0216.00 4 92 471 937 1870
PA/PHILADELPHIA COUNTY/0217.00 21 38 1 920 4259 4357 6659 199 1333
PA/PHILADELPHIA COUNTY/0218.00 4 8 13 844 933 1406 192
PA/PHILADELPHIA COUNTY/0219.00 2 14 21 135 369 2110 224
06/02/2014Report Date:
AGGREGATE TABLE 2: LOANS PURCHASED, BY LOCATION OF PROPERTY AND TYPE OF LOAN, 2013
MSA/MD: 37964 - PHILADELPHIA, PA
Page 30 of 37
ALL LOANS ON PROPERTY LOCATED IN MSA/MD 3/
CENSUS TRACT OR COUNTY NAME 1/(STATE/COUNTY/TRACT NUMBER)
FHA, FSA/RHS & VA Conventional
Refinancings Home ImprovementLoans
Loans on DwellingsFor 5 or More
Families
Nonoccupant LoansFrom Columns A, B, C
& D
Number Number Number Number Number Number$000's $000's $000's $000's $000's $000's
A B C D E F
Home Purchase Loans
Loans on 1- to 4-Family and Manufactured Home Dwellings
Loans on ManufacturedHome Dwellings FromColumns A,B,C & D
G
Number $000's

PA/PHILADELPHIA COUNTY/0220.00 7 15 34 1099 1376 2916 513
PA/PHILADELPHIA COUNTY/0231.00 9 10 13725 3530 179
PA/PHILADELPHIA COUNTY/0235.00 6 83 398 1453 2321
PA/PHILADELPHIA COUNTY/0236.00 13 24 2 22 478 4724 19544 478 603
PA/PHILADELPHIA COUNTY/0237.00 12 23 1 316 2900 2971 5086 239 542
PA/PHILADELPHIA COUNTY/0238.00 9 20 1 315 2479 1887 3601 244 428
PA/PHILADELPHIA COUNTY/0239.00 1 12 349 232 4710
PA/PHILADELPHIA COUNTY/0240.00 2 9 25 681 585 1422 262
PA/PHILADELPHIA COUNTY/0241.00 1 189
PA/PHILADELPHIA COUNTY/0242.00 2 12 28 969 286 1537 131
PA/PHILADELPHIA COUNTY/0243.00 1 16 27 824 72 82144 171
PA/PHILADELPHIA COUNTY/0244.00 7 1 18 881 224834 142 102
PA/PHILADELPHIA COUNTY/0245.00 3 14 406 374 47
PA/PHILADELPHIA COUNTY/0246.00 1 14 356 23 154
PA/PHILADELPHIA COUNTY/0247.00 4 1 311 1377 235 200 128
PA/PHILADELPHIA COUNTY/0248.00 56 817 52078
PA/PHILADELPHIA COUNTY/0249.00 4 15 471 311 48
PA/PHILADELPHIA COUNTY/0252.00 16 1 418 2568 78144 69 429
PA/PHILADELPHIA COUNTY/0253.00 1 14 112 1343 88 120161 258
PA/PHILADELPHIA COUNTY/0254.00 4 20 2 1 213 2015 857 45816 367 2069 236
PA/PHILADELPHIA COUNTY/0255.00 9 15 22 364 2099 32334 287
PA/PHILADELPHIA COUNTY/0256.00 8 222 597 2098 4489
PA/PHILADELPHIA COUNTY/0257.00 13 18 13791 3608 175
PA/PHILADELPHIA COUNTY/0258.00 1 116 962 173 1582
PA/PHILADELPHIA COUNTY/0259.00 1 19 1 317 2272 77 90142 3240 270
PA/PHILADELPHIA COUNTY/0260.00 2 5 18 13201 240 594 1
PA/PHILADELPHIA COUNTY/0261.00 2 13 17 1328 251 30371 154
06/02/2014Report Date:
AGGREGATE TABLE 2: LOANS PURCHASED, BY LOCATION OF PROPERTY AND TYPE OF LOAN, 2013
MSA/MD: 37964 - PHILADELPHIA, PA
Page 31 of 37
ALL LOANS ON PROPERTY LOCATED IN MSA/MD 3/
CENSUS TRACT OR COUNTY NAME 1/(STATE/COUNTY/TRACT NUMBER)
FHA, FSA/RHS & VA Conventional
Refinancings Home ImprovementLoans
Loans on DwellingsFor 5 or More
Families
Nonoccupant LoansFrom Columns A, B, C
& D
Number Number Number Number Number Number$000's $000's $000's $000's $000's $000's
A B C D E F
Home Purchase Loans
Loans on 1- to 4-Family and Manufactured Home Dwellings
Loans on ManufacturedHome Dwellings FromColumns A,B,C & D
G
Number $000's

PA/PHILADELPHIA COUNTY/0262.00 2 17 1 115 2362 273 2244 108 92
PA/PHILADELPHIA COUNTY/0263.01 1 9 116 1904 115 953 116
PA/PHILADELPHIA COUNTY/0263.02 4 21 1 322 2289 442 114820 154 124
PA/PHILADELPHIA COUNTY/0264.00 3 18 123 2970 319 174390 123
PA/PHILADELPHIA COUNTY/0265.00 6 114 1321 541 104
PA/PHILADELPHIA COUNTY/0266.00 3 24 239 4023 280 74618 189
PA/PHILADELPHIA COUNTY/0267.00 1325 2789 66044
PA/PHILADELPHIA COUNTY/0268.00 10 28 1251 1160 219
PA/PHILADELPHIA COUNTY/0269.00 43 439 887
PA/PHILADELPHIA COUNTY/0270.00 3 8 18 1724 355 1149 108
PA/PHILADELPHIA COUNTY/0271.00 58 910 593
PA/PHILADELPHIA COUNTY/0272.00 1 19 1 419 2034 138 2115 120 308
PA/PHILADELPHIA COUNTY/0273.00 1 13 1 221 1447 71 1217 76 131
PA/PHILADELPHIA COUNTY/0274.01 1 5 19 721 50 43397 93
PA/PHILADELPHIA COUNTY/0274.02 11 1 228 1770 53839 108 124
PA/PHILADELPHIA COUNTY/0275.00 2 12 2 1 317 1324 118 1041 161 45 184
PA/PHILADELPHIA COUNTY/0276.00 710 1049 97784
PA/PHILADELPHIA COUNTY/0277.00 3 810 723 269 86708
PA/PHILADELPHIA COUNTY/0278.00 1 2 214 1230 64 131 176
PA/PHILADELPHIA COUNTY/0279.01 1 7 110 947 111 34413 50
PA/PHILADELPHIA COUNTY/0279.02 1 4 22 186 39 147258 110
PA/PHILADELPHIA COUNTY/0280.00 2 12 127 89 26
PA/PHILADELPHIA COUNTY/0281.00 1 3 17 798 52 41189 126
PA/PHILADELPHIA COUNTY/0282.00 2 2 1 18 814 125 137 2149 86
PA/PHILADELPHIA COUNTY/0283.00 1 3 16 456 46 48440 46
PA/PHILADELPHIA COUNTY/0284.00 1 4 26 331 58 167 51
PA/PHILADELPHIA COUNTY/0285.00 1 35 317 28 202
06/02/2014Report Date:
AGGREGATE TABLE 2: LOANS PURCHASED, BY LOCATION OF PROPERTY AND TYPE OF LOAN, 2013
MSA/MD: 37964 - PHILADELPHIA, PA
Page 32 of 37
ALL LOANS ON PROPERTY LOCATED IN MSA/MD 3/
CENSUS TRACT OR COUNTY NAME 1/(STATE/COUNTY/TRACT NUMBER)
FHA, FSA/RHS & VA Conventional
Refinancings Home ImprovementLoans
Loans on DwellingsFor 5 or More
Families
Nonoccupant LoansFrom Columns A, B, C
& D
Number Number Number Number Number Number$000's $000's $000's $000's $000's $000's
A B C D E F
Home Purchase Loans
Loans on 1- to 4-Family and Manufactured Home Dwellings
Loans on ManufacturedHome Dwellings FromColumns A,B,C & D
G
Number $000's

PA/PHILADELPHIA COUNTY/0286.00 7 123 1256 456 44
PA/PHILADELPHIA COUNTY/0287.00 26 322 119
PA/PHILADELPHIA COUNTY/0288.00 1 6 29 661 62 454 133
PA/PHILADELPHIA COUNTY/0289.01 9 1 216 1073 530 70 112
PA/PHILADELPHIA COUNTY/0289.02 1 913 932 29 613
PA/PHILADELPHIA COUNTY/0290.00 16 224 1792 1584 48
PA/PHILADELPHIA COUNTY/0291.00 1 10 39 820 93 797 272
PA/PHILADELPHIA COUNTY/0292.00 2 9 114 1462 307 1122 85
PA/PHILADELPHIA COUNTY/0293.00 1 3 15 330 12 229 84
PA/PHILADELPHIA COUNTY/0294.00 1 1 12 93 32 49 140
PA/PHILADELPHIA COUNTY/0298.00 2 12 817 1333 167 774 514
PA/PHILADELPHIA COUNTY/0299.00 1 1 1 114 869 57 14 46 46
PA/PHILADELPHIA COUNTY/0300.00 5 39 521 372 153
PA/PHILADELPHIA COUNTY/0301.00 2 12 422 2289 164 1358 288
PA/PHILADELPHIA COUNTY/0302.00 2 24 2 737 3580 124 2769 151 663
PA/PHILADELPHIA COUNTY/0305.01 5 8 1 229 2298 331 643 172 111
PA/PHILADELPHIA COUNTY/0305.02 2 16 1 326 2624 258 1579 72 261
PA/PHILADELPHIA COUNTY/0306.00 17 128 3380 1979 89
PA/PHILADELPHIA COUNTY/0307.00 2 4 111 1398 300 325 81
PA/PHILADELPHIA COUNTY/0308.00 2 19 117 2353 125 2780 1
PA/PHILADELPHIA COUNTY/0309.00 8 121 2841 1023 126
PA/PHILADELPHIA COUNTY/0310.00 8 17 126 3700 1164 2362 101
PA/PHILADELPHIA COUNTY/0311.01 2 14 1027 2472 168 1257 812
PA/PHILADELPHIA COUNTY/0311.02 2 13 433 3116 131 1162 349
PA/PHILADELPHIA COUNTY/0312.00 1116 1651 1058
PA/PHILADELPHIA COUNTY/0313.00 2 11 311 1086 162 1119 319
PA/PHILADELPHIA COUNTY/0314.01 2 10 211 1131 230 998 230
06/02/2014Report Date:
AGGREGATE TABLE 2: LOANS PURCHASED, BY LOCATION OF PROPERTY AND TYPE OF LOAN, 2013
MSA/MD: 37964 - PHILADELPHIA, PA
Page 33 of 37
ALL LOANS ON PROPERTY LOCATED IN MSA/MD 3/
CENSUS TRACT OR COUNTY NAME 1/(STATE/COUNTY/TRACT NUMBER)
FHA, FSA/RHS & VA Conventional
Refinancings Home ImprovementLoans
Loans on DwellingsFor 5 or More
Families
Nonoccupant LoansFrom Columns A, B, C
& D
Number Number Number Number Number Number$000's $000's $000's $000's $000's $000's
A B C D E F
Home Purchase Loans
Loans on 1- to 4-Family and Manufactured Home Dwellings
Loans on ManufacturedHome Dwellings FromColumns A,B,C & D
G
Number $000's

PA/PHILADELPHIA COUNTY/0314.02 1 11 33 236 71 1078 214
PA/PHILADELPHIA COUNTY/0315.01 5 22 1 216 2122 492 2718 89 194
PA/PHILADELPHIA COUNTY/0315.02 2 13 1 312 1705 220 1701 56 357
PA/PHILADELPHIA COUNTY/0316.00 2 31 721 2341 204 3242 627
PA/PHILADELPHIA COUNTY/0317.00 3 15 330 3131 254 1604 227
PA/PHILADELPHIA COUNTY/0318.00 1 10 222 1982 125 927 171
PA/PHILADELPHIA COUNTY/0319.00 1 15 532 2779 101 1403 411
PA/PHILADELPHIA COUNTY/0320.00 3 23 1 1 339 3834 209 2067 100 2045 196
PA/PHILADELPHIA COUNTY/0321.00 4 9 29 937 369 701 162
PA/PHILADELPHIA COUNTY/0323.00 2 6 1 319 1969 182 535 63 245
PA/PHILADELPHIA COUNTY/0325.00 1 15 328 2794 65 1548 230
PA/PHILADELPHIA COUNTY/0326.00 4 13 1 839 4183 337 1720 157 674
PA/PHILADELPHIA COUNTY/0329.00 1 15 314 1642 117 1930 255
PA/PHILADELPHIA COUNTY/0330.00 6 13 539 4170 570 1355 402
PA/PHILADELPHIA COUNTY/0331.01 5 10 528 3852 434 1339 439
PA/PHILADELPHIA COUNTY/0331.02 3 14 119 2535 384 1733 43
PA/PHILADELPHIA COUNTY/0332.00 3 6 18 1460 393 852 110
PA/PHILADELPHIA COUNTY/0333.00 5 810 1586 897 1455
PA/PHILADELPHIA COUNTY/0334.00 5 1111 1833 553 1551
PA/PHILADELPHIA COUNTY/0335.00 18 1 614 1964 2296 148 548
PA/PHILADELPHIA COUNTY/0336.00 4 24 415 2440 637 14059 434
PA/PHILADELPHIA COUNTY/0337.01 3 11 27 1049 349 1881 201
PA/PHILADELPHIA COUNTY/0337.02 7 20 1 413 1881 1194 3456 174 614
PA/PHILADELPHIA COUNTY/0338.00 1 41 1 430 4889 176 93355 106 423
PA/PHILADELPHIA COUNTY/0339.00 1 17 212 2223 128 2605 121
PA/PHILADELPHIA COUNTY/0340.00 6 9 1 219 3484 942 1518 22 337
PA/PHILADELPHIA COUNTY/0341.00 8 19 116 2703 1041 3202 134
06/02/2014Report Date:
AGGREGATE TABLE 2: LOANS PURCHASED, BY LOCATION OF PROPERTY AND TYPE OF LOAN, 2013
MSA/MD: 37964 - PHILADELPHIA, PA
Page 34 of 37
ALL LOANS ON PROPERTY LOCATED IN MSA/MD 3/
CENSUS TRACT OR COUNTY NAME 1/(STATE/COUNTY/TRACT NUMBER)
FHA, FSA/RHS & VA Conventional
Refinancings Home ImprovementLoans
Loans on DwellingsFor 5 or More
Families
Nonoccupant LoansFrom Columns A, B, C
& D
Number Number Number Number Number Number$000's $000's $000's $000's $000's $000's
A B C D E F
Home Purchase Loans
Loans on 1- to 4-Family and Manufactured Home Dwellings
Loans on ManufacturedHome Dwellings FromColumns A,B,C & D
G
Number $000's

PA/PHILADELPHIA COUNTY/0342.00 1 175 969 164 3525
PA/PHILADELPHIA COUNTY/0344.00 13 2914 3200 2726 6200
PA/PHILADELPHIA COUNTY/0345.01 4 5 11 13824 637 614 106
PA/PHILADELPHIA COUNTY/0345.02 2 16 33 675 220 17289 15549
PA/PHILADELPHIA COUNTY/0346.00 1 7185 1749
PA/PHILADELPHIA COUNTY/0347.01 3 19 1 120 3408 398 2992 140 141
PA/PHILADELPHIA COUNTY/0347.02 2 178 1478 436 14935
PA/PHILADELPHIA COUNTY/0348.01 1011 1453 1481
PA/PHILADELPHIA COUNTY/0348.02 2 13 1 215 2764 167 1828 146 271
PA/PHILADELPHIA COUNTY/0348.03 3 22 1 115 2642 400 3248 173 121
PA/PHILADELPHIA COUNTY/0349.00 1 21 316 2615 100 2280 318
PA/PHILADELPHIA COUNTY/0351.00 12 15 1 23 476 1234 1414 113 166
PA/PHILADELPHIA COUNTY/0352.00 5 12 14 895 1289 17555 176
PA/PHILADELPHIA COUNTY/0353.01 3 24 121 3250 394 3378 146
PA/PHILADELPHIA COUNTY/0353.02 4 8 421 3767 608 1185 552
PA/PHILADELPHIA COUNTY/0355.00 7 26 1 212 2459 1161 5014 185 206
PA/PHILADELPHIA COUNTY/0356.01 4 8 113 2825 770 1291 289
PA/PHILADELPHIA COUNTY/0356.02 5 173 642 881 17265
PA/PHILADELPHIA COUNTY/0357.01 1 20 1 1 12132 3074 137 204 1642
PA/PHILADELPHIA COUNTY/0357.02 4 12 1 35 1077 541 1890 1 417
PA/PHILADELPHIA COUNTY/0358.00 13 19 1 215 2813 1981 3107 183 200
PA/PHILADELPHIA COUNTY/0359.00 7 20 19 1746 1169 3542 215
PA/PHILADELPHIA COUNTY/0360.00 4 7 16 1281 966 986 175
PA/PHILADELPHIA COUNTY/0361.00 4 17 110 1654 598 2664 131
PA/PHILADELPHIA COUNTY/0362.01 8 22 311 1817 1267 3114 315
PA/PHILADELPHIA COUNTY/0362.02 3 33 1 317 3115 370 5906 151 410
PA/PHILADELPHIA COUNTY/0362.03 6 28 217 3409 960 3895 332
06/02/2014Report Date:
AGGREGATE TABLE 2: LOANS PURCHASED, BY LOCATION OF PROPERTY AND TYPE OF LOAN, 2013
MSA/MD: 37964 - PHILADELPHIA, PA
Page 35 of 37
ALL LOANS ON PROPERTY LOCATED IN MSA/MD 3/
CENSUS TRACT OR COUNTY NAME 1/(STATE/COUNTY/TRACT NUMBER)
FHA, FSA/RHS & VA Conventional
Refinancings Home ImprovementLoans
Loans on DwellingsFor 5 or More
Families
Nonoccupant LoansFrom Columns A, B, C
& D
Number Number Number Number Number Number$000's $000's $000's $000's $000's $000's
A B C D E F
Home Purchase Loans
Loans on 1- to 4-Family and Manufactured Home Dwellings
Loans on ManufacturedHome Dwellings FromColumns A,B,C & D
G
Number $000's
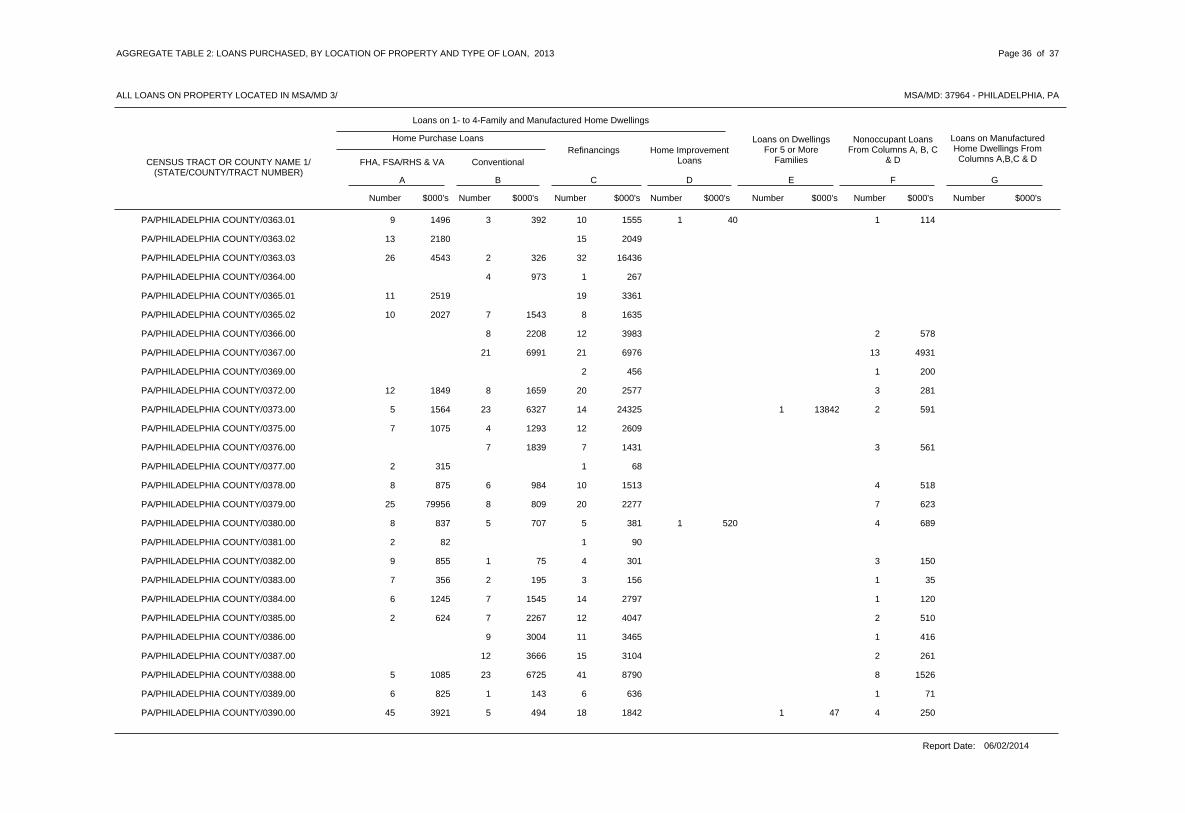
PA/PHILADELPHIA COUNTY/0363.01 3 10 1 19 1496 392 1555 40 114
PA/PHILADELPHIA COUNTY/0363.02 1513 2180 2049
PA/PHILADELPHIA COUNTY/0363.03 2 3226 4543 326 16436
PA/PHILADELPHIA COUNTY/0364.00 4 1973 267
PA/PHILADELPHIA COUNTY/0365.01 1911 2519 3361
PA/PHILADELPHIA COUNTY/0365.02 7 810 2027 1543 1635
PA/PHILADELPHIA COUNTY/0366.00 8 12 22208 3983 578
PA/PHILADELPHIA COUNTY/0367.00 21 21 136991 6976 4931
PA/PHILADELPHIA COUNTY/0369.00 2 1456 200
PA/PHILADELPHIA COUNTY/0372.00 8 20 312 1849 1659 2577 281
PA/PHILADELPHIA COUNTY/0373.00 23 14 1 25 1564 6327 24325 13842 591
PA/PHILADELPHIA COUNTY/0375.00 4 127 1075 1293 2609
PA/PHILADELPHIA COUNTY/0376.00 7 7 31839 1431 561
PA/PHILADELPHIA COUNTY/0377.00 12 315 68
PA/PHILADELPHIA COUNTY/0378.00 6 10 48 875 984 1513 518
PA/PHILADELPHIA COUNTY/0379.00 8 20 725 79956 809 2277 623
PA/PHILADELPHIA COUNTY/0380.00 5 5 1 48 837 707 381 520 689
PA/PHILADELPHIA COUNTY/0381.00 12 82 90
PA/PHILADELPHIA COUNTY/0382.00 1 4 39 855 75 301 150
PA/PHILADELPHIA COUNTY/0383.00 2 3 17 356 195 156 35
PA/PHILADELPHIA COUNTY/0384.00 7 14 16 1245 1545 2797 120
PA/PHILADELPHIA COUNTY/0385.00 7 12 22 624 2267 4047 510
PA/PHILADELPHIA COUNTY/0386.00 9 11 13004 3465 416
PA/PHILADELPHIA COUNTY/0387.00 12 15 23666 3104 261
PA/PHILADELPHIA COUNTY/0388.00 23 41 85 1085 6725 8790 1526
PA/PHILADELPHIA COUNTY/0389.00 1 6 16 825 143 636 71
PA/PHILADELPHIA COUNTY/0390.00 5 18 1 445 3921 494 1842 47 250
06/02/2014Report Date:
AGGREGATE TABLE 2: LOANS PURCHASED, BY LOCATION OF PROPERTY AND TYPE OF LOAN, 2013
MSA/MD: 37964 - PHILADELPHIA, PA
Page 36 of 37
ALL LOANS ON PROPERTY LOCATED IN MSA/MD 3/
CENSUS TRACT OR COUNTY NAME 1/(STATE/COUNTY/TRACT NUMBER)
FHA, FSA/RHS & VA Conventional
Refinancings Home ImprovementLoans
Loans on DwellingsFor 5 or More
Families
Nonoccupant LoansFrom Columns A, B, C
& D
Number Number Number Number Number Number$000's $000's $000's $000's $000's $000's
A B C D E F
Home Purchase Loans
Loans on 1- to 4-Family and Manufactured Home Dwellings
Loans on ManufacturedHome Dwellings FromColumns A,B,C & D
G
Number $000's

PA/PHILADELPHIA COUNTY/9800.00 1 1277 249
PA/PHILADELPHIA COUNTY/9801.00 1 460
PA/PHILADELPHIA COUNTY/9802.00 1 297
PA/PHILADELPHIA COUNTY/9808.00 3 2 1180 254 48
PA/PHILADELPHIA COUNTY/9809.00 1 98
MSA/MD (TOTAL) 8961 18751 392 26 20087977 1504973 2349184 10907250 80506 151686 517092 5 162
INVALID GEOGRAPHIC IDENTIFIERS 2/
06/02/2014Report Date:
AGGREGATE TABLE 2: LOANS PURCHASED, BY LOCATION OF PROPERTY AND TYPE OF LOAN, 2013
MSA/MD: 37964 - PHILADELPHIA, PA
Page 37 of 37
ALL LOANS ON PROPERTY LOCATED IN MSA/MD 3/
CENSUS TRACT OR COUNTY NAME 1/(STATE/COUNTY/TRACT NUMBER)
FHA, FSA/RHS & VA Conventional
Refinancings Home ImprovementLoans
Loans on DwellingsFor 5 or More
Families
Nonoccupant LoansFrom Columns A, B, C
& D
Number Number Number Number Number Number$000's $000's $000's $000's $000's $000's
A B C D E F
Home Purchase Loans
Loans on 1- to 4-Family and Manufactured Home Dwellings
Loans on ManufacturedHome Dwellings FromColumns A,B,C & D
G
Number $000's

BORROWER CHARACTERISTICS
RACE 5/
AMERICAN INDIAN/ALASKA NATIVE 30 26 2247 7937 5628 4553 4483 10 2193 5 625 5 1060
ASIAN 377 1097 15 4802118 481871 74575 253437 6345 124056 219 53283 151 28945 355 88793
BLACK OR AFRICAN AMERICAN 1962 585 17 6281395 201014 281487 86766 5453 97211 405 61647 235 28913 557 79471
NATIVE HAWAIIAN/OTHER PACIFICISLND
31 27 1 2140 8009 6165 5410 240 5203 5 1049 4 572 15 3498
WHITE 9423 14063 4 554 768228621 6269414 1970243 3120392 638 199426 1836733 4028 939216 3325 599763 6589 1594209
2 OR MORE MINORITY RACES 16 9 315 2343 2553 1174 611 4 710 2 486
JOINT (WHITE/MINORITY RACE) 134 206 6 123435 111586 31743 51419 6300 33700 57 17067 52 11007 110 30505
RACE NOT AVAILABLE 6/ 3998 5452 88 7578367 1695731 7878944 1216662 31094 278470 510 108570 1002 365898 542 329189
ETHNICITY 7/
HISPANIC OR LATINO 724 284 2 4 427619 110603 102053 47752 295 2133 61129 120 21586 77 12059 250 40264
NOT HISPANIC OR LATINO 11140 15609 3 574 847631855 6914197 2242286 3436371 583 210868 2022752 4579 1045041 3575 633083 7335 1744016
JOINT (HISPANIC OR LATINO/ NOTHISPANIC OR LATINO)
167 176 7 105324 76450 37797 42282 2733 27744 48 12402 49 9536 76 19522
ETHNICITY NOT AVAILABLE 6/ 3940 5396 95 7088240 1676655 7869202 1213408 32884 268842 487 103996 1077 381755 514 323409
MINORITY STATUS 8/
WHITE NON-HISPANIC 8550 13534 2 531 716227542 6042059 1830137 3005472 343 189872 1748595 3877 908581 3103 559040 6235 1523774
OTHERS, INCLUDING HISPANIC 3366 2364 3 49 17714926 987260 528420 484478 535 22964 346366 847 165487 566 90469 1350 260006
INCOME 9/
LESS THAN 50% OF MSA/MD MEDIAN 1257 1255 1 18 8752466 269949 132230 144896 113 2432 95061 422 48118 449 48937 549 59692
50-79% OF MSA/MD MEDIAN 2863 2790 52 20146153 905733 461311 412406 7861 327728 1033 164317 767 101039 1488 241260
80-99% OF MSA/MD MEDIAN 1586 2192 1 41 11794648 819454 320756 391001 85 8051 232857 668 130131 482 74069 1029 209667
100-119% OF MSA/MD MEDIAN 1208 2256 1 40 10414437 872429 267128 452250 210 8072 232712 536 117648 501 86102 873 202931
120% OR MORE OF MSA/MD MEDIAN 2609 10883 2 516 432121185 5395551 732789 2752104 470 219424 1329063 2246 658297 2505 550482 3742 1126874
INCOME NOT AVAILABLE 6/ 6448 2089 13 2862149 514789 8337124 587156 2778 163046 329 64514 74 175804 494 286787
CENSUS TRACT CHARACTERISTICS 10/
RACIAL/ETHNIC COMPOSITION 11/
LESS THAN 10% MINORITY 3958 6901 1 215 284312599 2872883 1467861 1572906 113 82305 744042 1525 382294 1549 350348 2176 621351
10-19% MINORITY 4628 8140 3 304 336115247 3461618 1957186 1851553 680 120917 959958 1809 444771 1742 362846 2880 773736
20-49% MINORITY 4144 4938 1 139 23549607 1945211 1628402 1102079 85 40924 503040 1268 270418 1049 212433 2102 565394
50-79% MINORITY 1294 892 17 5722002 321653 656989 149130 3910 102973 276 45417 247 95221 520 106257
80-100% MINORITY 1947 594 5 5861583 176540 4540900 64145 562 70454 356 40125 191 15585 497 60473
INCOME 12/ 13/
LOW INCOME 1187 552 9 4771487 197444 2383712 73449 2378 63472 244 30056 155 13395 434 63607
MODERATE INCOME 3328 1545 22 12103559 478230 3388712 215298 3810 253782 689 100696 427 113948 1015 164160
MIDDLE INCOME 6507 6219 3 89 301911884 2174579 2210158 1152501 563 21286 602946 1703 327462 1395 247396 2396 583270
UPPER INCOME 4946 13141 2 560 500624087 5924478 2268090 3297272 315 221144 1459336 2595 724387 2800 661617 4327 1315491
TOTAL 14/ 15971 21465 5 680 971641038 8777905 10251338 4739813 878 248618 2380467 5234 1183025 4778 1036433 8175 2127211
Report Date: 06/02/2014
AGGREGATE TABLE 3-1: LOANS SOLD, BY CHARACTERISTICS OF BORROWER AND OF CENSUS TRACT IN WHICH PROPERTY IS LOCATED AND BY TYPE OFPURCHASER (INCLUDES ORIGINATIONS AND PURCHASED LOANS), 2013
MSA/MD: 37964 - PHILADELPHIA, PA
BORROWER OR CENSUS TRACTCHARACTERISTICS FANNIE MAE GINNIE MAE FREDDIE MAC FARMER MAC
PRIVATESECURITI-
ZATION
COMMERCIALBANK, SAVINGS
BANK, OR SAVINGASSOC
Number Number Number Number Number Number$000's $000's $000's $000's $000's $000's
Page 1 of 1
INSURANCE CO,CREDIT UNION,
MORTGAGE BK, ORFINANCE CO
Number $000's
AFFILIATEINSTITUTION
Number $000's
OTHERPURCHASER
Number $000's

NO REPORTEDPRICING DATA15/
7218 13742 5 668 905028499 1 6 4647 29 4264 1 7671 81
REPORTEDPRICING DATA
630 147 1 289354 1 279 30 55 1 389 2
PERCENTAGE POINTS ABOVE AVERAGE PRIME OFFER RATE: ONLY INCLUDES LOANS WITH APR ABOVE THE THRESHOLD 16/
1.50 - 1.99 439 113 1 238282 NA NA NA NA NA NA 189 NA 43 NA 252 NA
2.00 - 2.49 107 27 4854 NA NA NA NA NA NA 55 NA 8 NA 44 NA
2.50 - 2.99 24 4 213 NA NA NA NA NA NA 11 NA 2 NA 18 NA
3.00 - 3.49 34 3 13 NA NA NA NA NA NA 17 NA NA 27 NA
3.50 - 4.49 262 1 6 18 2 1 48 2
4.50 - 5.49 9
5.50 - 6.49 1 2
6.50 OR MORE 1
MEAN 1.99 1.81 1.66 1.781.82 4.22 1.98 4.50 1.87 3.55 2.16 3.89
MEDIAN 1.79 1.70 1.66 1.721.73 4.22 1.78 4.37 1.70 3.55 1.80 3.89
HOEPALOANS 17/
2 1
Report Date: 06/02/2014
AGGREGATE TABLE 3-2: PRICING INFORMATION FOR FIRST AND JUNIOR LIEN LOANS SOLD BY TYPE OF PURCHASER (INCLUDES ORIGINATIONS ONLY), 2013
MSA/MD: 37964 - PHILADELPHIA, PA
PRICING INFORMATION
FANNIE MAE GINNIE MAE FREDDIE MAC FARMER MAC
PRIVATESECURITI-
ZATION
COMMERCIALBANK, SAVINGS
BANK, OR SAVINGASSOC
FIRSTLIEN #
JUNIORLIEN #
Page 1 of 2
INSURANCE CO,CREDIT UNION,
MORTGAGE BK, ORFINANCE CO
AFFILIATEINSTITUTION
OTHERPURCHASER
FIRSTLIEN #
JUNIORLIEN #
FIRSTLIEN #
FIRSTLIEN #
FIRSTLIEN #
FIRSTLIEN #
FIRSTLIEN #
FIRSTLIEN #
FIRSTLIEN #
JUNIORLIEN #
JUNIORLIEN #
JUNIORLIEN #
JUNIORLIEN #
JUNIORLIEN #
JUNIORLIEN #
JUNIORLIEN #
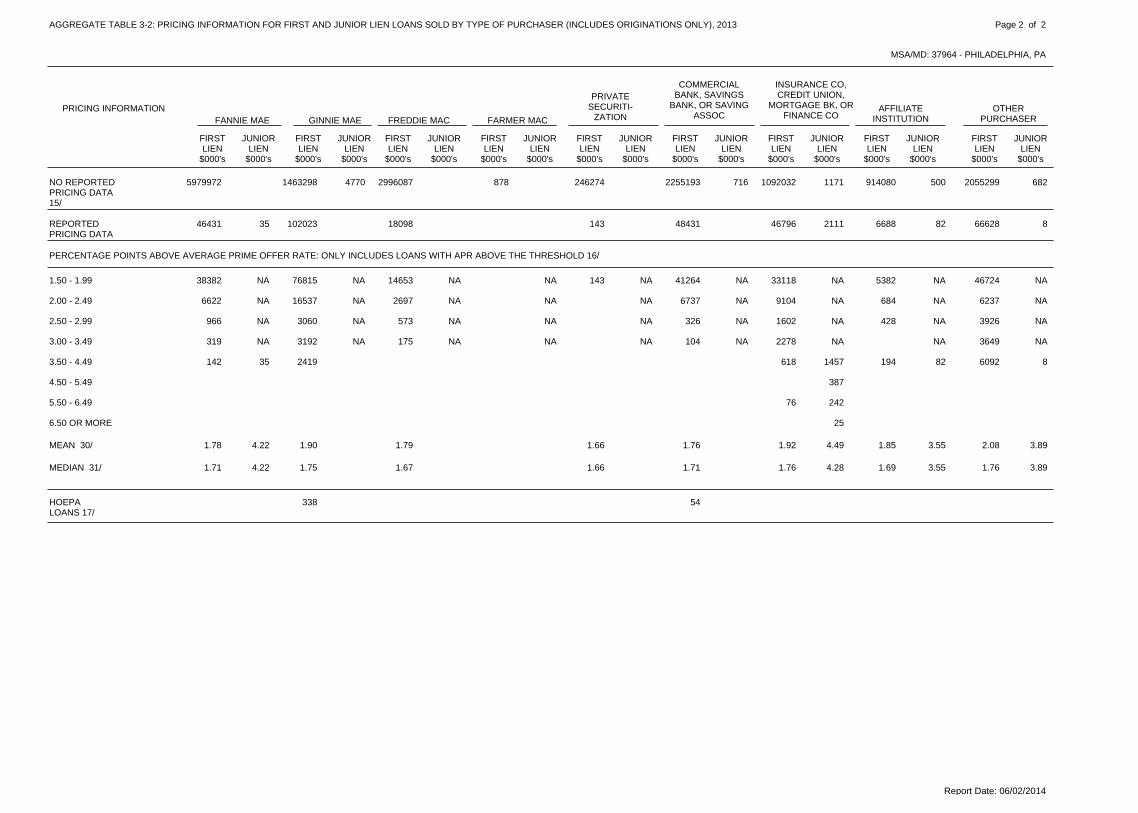
NO REPORTEDPRICING DATA15/
1463298 2996087 878 246274 22551935979972 4770 716 1092032 1171 914080 500 2055299 682
REPORTEDPRICING DATA
102023 18098 143 4843146431 35 46796 2111 6688 82 66628 8
PERCENTAGE POINTS ABOVE AVERAGE PRIME OFFER RATE: ONLY INCLUDES LOANS WITH APR ABOVE THE THRESHOLD 16/
1.50 - 1.99 76815 14653 143 4126438382 NA NA NA NA NA NA 33118 NA 5382 NA 46724 NA
2.00 - 2.49 16537 2697 67376622 NA NA NA NA NA NA 9104 NA 684 NA 6237 NA
2.50 - 2.99 3060 573 326966 NA NA NA NA NA NA 1602 NA 428 NA 3926 NA
3.00 - 3.49 3192 175 104319 NA NA NA NA NA NA 2278 NA NA 3649 NA
3.50 - 4.49 2419142 35 618 1457 194 82 6092 8
4.50 - 5.49 387
5.50 - 6.49 76 242
6.50 OR MORE 25
MEAN 30/ 1.90 1.79 1.66 1.761.78 4.22 1.92 4.49 1.85 3.55 2.08 3.89
MEDIAN 31/ 1.75 1.67 1.66 1.711.71 4.22 1.76 4.28 1.69 3.55 1.76 3.89
HOEPALOANS 17/
338 54
Report Date: 06/02/2014
AGGREGATE TABLE 3-2: PRICING INFORMATION FOR FIRST AND JUNIOR LIEN LOANS SOLD BY TYPE OF PURCHASER (INCLUDES ORIGINATIONS ONLY), 2013
MSA/MD: 37964 - PHILADELPHIA, PA
PRICING INFORMATION
FANNIE MAE GINNIE MAE FREDDIE MAC FARMER MAC
PRIVATESECURITI-
ZATION
COMMERCIALBANK, SAVINGS
BANK, OR SAVINGASSOC
FIRSTLIEN
$000's
JUNIORLIEN
$000's
Page 2 of 2
INSURANCE CO,CREDIT UNION,
MORTGAGE BK, ORFINANCE CO
AFFILIATEINSTITUTION
OTHERPURCHASER
FIRSTLIEN
$000's
JUNIORLIEN
$000's
FIRSTLIEN
$000's
FIRSTLIEN
$000's
FIRSTLIEN
$000's
FIRSTLIEN
$000's
FIRSTLIEN
$000's
FIRSTLIEN
$000's
FIRSTLIEN
$000's
JUNIORLIEN
$000's
JUNIORLIEN
$000's
JUNIORLIEN
$000's
JUNIORLIEN
$000's
JUNIORLIEN
$000's
JUNIORLIEN
$000's
JUNIORLIEN
$000's

AMERICAN INDIAN/ALASKA NATIVE (TOTAL) 15 1 2 1 221 3736 2717 145 415 184 275
MALE 10 1 1 113 2383 1914 145 184 140
FEMALE 4 2 17 1128 578 415 135
JOINT (MALE/FEMALE) 11 225 225
ASIAN (TOTAL) 273 13 86 40 17429 78973 51596 1889 15413 7110 2965
MALE 121 8 41 15 8193 32246 20586 1073 7059 2231 1297
FEMALE 73 5 22 11 6117 19361 12218 816 3600 1615 1112
JOINT (MALE/FEMALE) 78 23 14 3118 27100 18526 4754 3264 556
BLACK OR AFRICAN AMERICAN (TOTAL) 1590 93 514 202 842483 342852 221399 12829 68488 28279 11857
MALE 538 35 196 68 34871 120338 74899 4818 25876 9928 4817
FEMALE 867 46 255 106 431317 166533 110869 5860 31651 12702 5451
JOINT (MALE/FEMALE) 184 12 61 27 7291 55633 35543 2151 10767 5583 1589
NATIVE HAWAIIAN/OTHER PACIFIC ISLND (TOTAL) 25 1 8 5 342 7919 5052 54 1822 716 275
MALE 15 5 4 125 5434 3510 1188 593 143
FEMALE 7 1 19 1019 910 54 55
JOINT (MALE/FEMALE) 3 3 1 18 1466 632 634 123 77
WHITE (TOTAL) 6181 248 844 673 1988144 1642237 1249841 49947 166137 138338 37974
MALE 2356 96 372 282 1013207 613442 451657 18239 69576 55359 18611
FEMALE 1545 64 232 160 392040 347326 259893 11244 39352 30275 6562
JOINT (MALE/FEMALE) 2272 87 239 231 572886 678907 536410 20125 57133 52704 12535
2 OR MORE MINORITY RACES (TOTAL) 5 1 7 2 217 2706 733 177 1146 293 357
MALE 3 1 4 1 211 1835 407 177 719 175 357
FEMALE 2 2 15 734 326 290 118
JOINT (MALE/FEMALE) 11 137 137
JOINT (WHITE/MINORITY RACE) (TOTAL) 97 4 22 8 2133 31473 22718 1245 4862 2331 317
MALE 55 996 996
FEMALE 3 1 15 1033 668 154 211
JOINT (MALE/FEMALE) 89 4 21 7 2123 29444 21054 1245 4708 2120 317
RACE NOT AVAILABLE (TOTAL) 6/ 647 60 252 97 301086 207035 129258 11293 43073 18221 5190
MALE 126 11 50 13 6206 35548 22361 1517 8480 2193 997
FEMALE 105 13 42 20 5185 29420 17795 2135 5912 2901 677
JOINT (MALE/FEMALE) 111 4 37 14 2168 38221 25702 919 7016 3858 726
Report Date: 06/02/2014
AGGREGATE TABLE 4-1: DISPOSITION OF APPLICATIONS FOR FHA, FSA/RHS, AND VA HOME-PURCHASE LOANS, 1- TO 4-FAMILY AND MANUFACTURED HOMEDWELLINGS, BY RACE, ETHNICITY, GENDER AND INCOME OF APPLICANT, 2013
MSA/MD: 37964 - PHILADELPHIA, PA
RACE AND GENDER 5/ 18/ 19/
ApplicationsReceived 20/
LoansOriginated
Apps. Approved ButNot Accepted
ApplicationsDenied
ApplicationsWithdrawn
Files Closed ForIncompleteness
Number Number Number Number Number Number$000's $000's $000's $000's $000's $000's
Page 1 of 2

HISPANIC OR LATINO (TOTAL) 734 25 110 59 24952 124627 96322 3794 13349 8169 2993
MALE 329 11 51 29 9429 57645 44088 1912 6713 3714 1218
FEMALE 302 13 45 16 9385 44481 34877 1767 4571 2204 1062
JOINT (MALE/FEMALE) 103 1 14 14 6138 22501 17357 115 2065 2251 713
NOT HISPANIC OR LATINO (TOTAL) 7381 329 1349 866 27910204 1951038 1437204 59531 237334 166939 50030
MALE 2728 130 565 343 1343900 717839 511212 21964 96254 65047 23362
FEMALE 2211 105 470 263 803129 494160 352905 16371 70202 42593 12089
JOINT (MALE/FEMALE) 2429 93 309 258 633152 734559 570387 20857 70006 59065 14244
JOINT (HISPANIC OR LATINO/ NOT HISPANIC OR LATINO)(TOTAL)
116 4 27 15 3165 39169 27903 1421 5666 3569 610
MALE 5 1 1 18 1345 935 191 123 96
FEMALE 3 1 26 821 418 199 204
JOINT (MALE/FEMALE) 108 4 25 12 2151 37003 26550 1421 5276 3242 514
ETHNICITY NOT AVAILABLE (TOTAL) 6/ 602 63 249 88 321034 202097 121885 12833 45007 16795 5577
MALE 112 11 51 11 9194 35393 20095 2093 9740 1779 1686
FEMALE 90 11 40 18 6165 27092 15057 1971 6402 2821 841
JOINT (MALE/FEMALE) 98 9 37 10 1155 37070 23798 2047 7802 3094 329
MINORITY STATUS 8/ 18/ 19/
WHITE NON-HISPANIC (TOTAL) 5388 222 719 607 1747110 1485770 1133446 44435 145997 127642 34250
MALE 2039 82 323 256 872787 554091 408783 15326 61794 51825 16363
FEMALE 1268 56 185 142 351686 305196 228274 9760 33575 27472 6115
JOINT (MALE/FEMALE) 2076 83 210 209 512629 624785 495372 19010 50552 48345 11506
OTHERS, INCLUDING HISPANIC (TOTAL) 2784 138 753 321 1304126 612579 416011 20981 107954 48797 18836
MALE 1011 56 291 114 561528 218536 145080 8125 40820 16443 8068
FEMALE 1234 62 324 134 551809 230092 157334 8345 40442 16771 7200
JOINT (MALE/FEMALE) 537 20 136 72 19784 163337 113243 4511 26498 15517 3568
INCOME OF APPLICANTS 9/
LESS THAN 50% OF MSA/MD MEDIAN 1614 75 513 189 712462 259351 167206 7517 55831 20790 8007
50-79% OF MSA/MD MEDIAN 2882 150 541 318 1264017 633462 456565 23222 86018 49468 18189
80-99% OF MSA/MD MEDIAN 1404 62 208 154 441872 378473 286022 12050 41552 30181 8668
100-119% OF MSA/MD MEDIAN 1032 38 154 117 331374 309956 233968 8315 34220 25886 7567
120% OR MORE OF MSA/MD MEDIAN 1842 96 278 237 622515 713807 527577 26475 76648 66704 16403
INCOME NOT AVAILABLE 6/ 59 41 13 2115 21882 11976 7087 2443 376
TOTAL 14/ 8833 421 1735 1028 33812355 2316931 1683314 77579 301356 195472 59210
Report Date: 06/02/2014
AGGREGATE TABLE 4-1: DISPOSITION OF APPLICATIONS FOR FHA, FSA/RHS, AND VA HOME-PURCHASE LOANS, 1- TO 4-FAMILY AND MANUFACTURED HOMEDWELLINGS, BY RACE, ETHNICITY, GENDER AND INCOME OF APPLICANT, 2013
MSA/MD: 37964 - PHILADELPHIA, PA
ETHNICITY, GENDER AND INCOME 7/ 18/ 19/
ApplicationsReceived 20/
LoansOriginated
Apps. Approved ButNot Accepted
ApplicationsDenied
ApplicationsWithdrawn
Files Closed ForIncompleteness
Number Number Number Number Number Number$000's $000's $000's $000's $000's $000's
Page 2 of 2
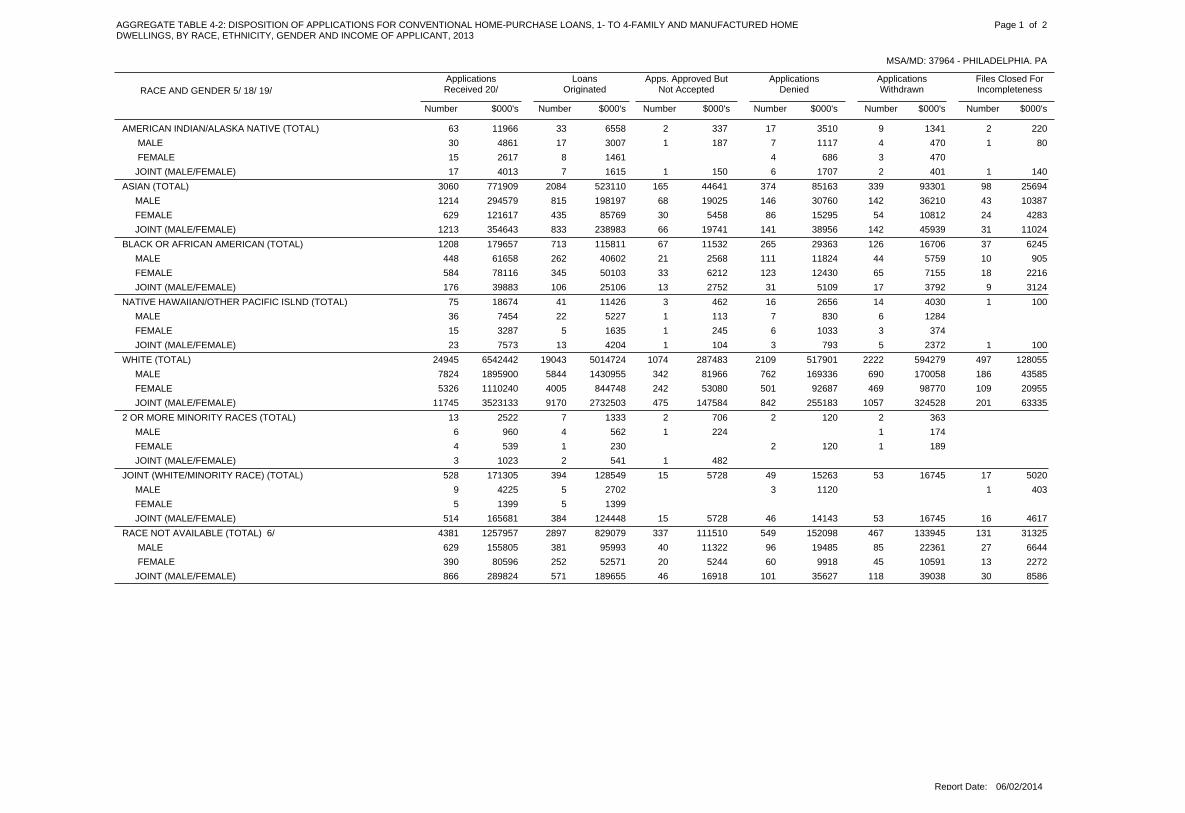
AMERICAN INDIAN/ALASKA NATIVE (TOTAL) 33 2 17 9 263 11966 6558 337 3510 1341 220
MALE 17 1 7 4 130 4861 3007 187 1117 470 80
FEMALE 8 4 315 2617 1461 686 470
JOINT (MALE/FEMALE) 7 1 6 2 117 4013 1615 150 1707 401 140
ASIAN (TOTAL) 2084 165 374 339 983060 771909 523110 44641 85163 93301 25694
MALE 815 68 146 142 431214 294579 198197 19025 30760 36210 10387
FEMALE 435 30 86 54 24629 121617 85769 5458 15295 10812 4283
JOINT (MALE/FEMALE) 833 66 141 142 311213 354643 238983 19741 38956 45939 11024
BLACK OR AFRICAN AMERICAN (TOTAL) 713 67 265 126 371208 179657 115811 11532 29363 16706 6245
MALE 262 21 111 44 10448 61658 40602 2568 11824 5759 905
FEMALE 345 33 123 65 18584 78116 50103 6212 12430 7155 2216
JOINT (MALE/FEMALE) 106 13 31 17 9176 39883 25106 2752 5109 3792 3124
NATIVE HAWAIIAN/OTHER PACIFIC ISLND (TOTAL) 41 3 16 14 175 18674 11426 462 2656 4030 100
MALE 22 1 7 636 7454 5227 113 830 1284
FEMALE 5 1 6 315 3287 1635 245 1033 374
JOINT (MALE/FEMALE) 13 1 3 5 123 7573 4204 104 793 2372 100
WHITE (TOTAL) 19043 1074 2109 2222 49724945 6542442 5014724 287483 517901 594279 128055
MALE 5844 342 762 690 1867824 1895900 1430955 81966 169336 170058 43585
FEMALE 4005 242 501 469 1095326 1110240 844748 53080 92687 98770 20955
JOINT (MALE/FEMALE) 9170 475 842 1057 20111745 3523133 2732503 147584 255183 324528 63335
2 OR MORE MINORITY RACES (TOTAL) 7 2 2 213 2522 1333 706 120 363
MALE 4 1 16 960 562 224 174
FEMALE 1 2 14 539 230 120 189
JOINT (MALE/FEMALE) 2 13 1023 541 482
JOINT (WHITE/MINORITY RACE) (TOTAL) 394 15 49 53 17528 171305 128549 5728 15263 16745 5020
MALE 5 3 19 4225 2702 1120 403
FEMALE 55 1399 1399
JOINT (MALE/FEMALE) 384 15 46 53 16514 165681 124448 5728 14143 16745 4617
RACE NOT AVAILABLE (TOTAL) 6/ 2897 337 549 467 1314381 1257957 829079 111510 152098 133945 31325
MALE 381 40 96 85 27629 155805 95993 11322 19485 22361 6644
FEMALE 252 20 60 45 13390 80596 52571 5244 9918 10591 2272
JOINT (MALE/FEMALE) 571 46 101 118 30866 289824 189655 16918 35627 39038 8586
Report Date: 06/02/2014
AGGREGATE TABLE 4-2: DISPOSITION OF APPLICATIONS FOR CONVENTIONAL HOME-PURCHASE LOANS, 1- TO 4-FAMILY AND MANUFACTURED HOMEDWELLINGS, BY RACE, ETHNICITY, GENDER AND INCOME OF APPLICANT, 2013
MSA/MD: 37964 - PHILADELPHIA, PA
RACE AND GENDER 5/ 18/ 19/
ApplicationsReceived 20/
LoansOriginated
Apps. Approved ButNot Accepted
ApplicationsDenied
ApplicationsWithdrawn
Files Closed ForIncompleteness
Number Number Number Number Number Number$000's $000's $000's $000's $000's $000's
Page 1 of 2
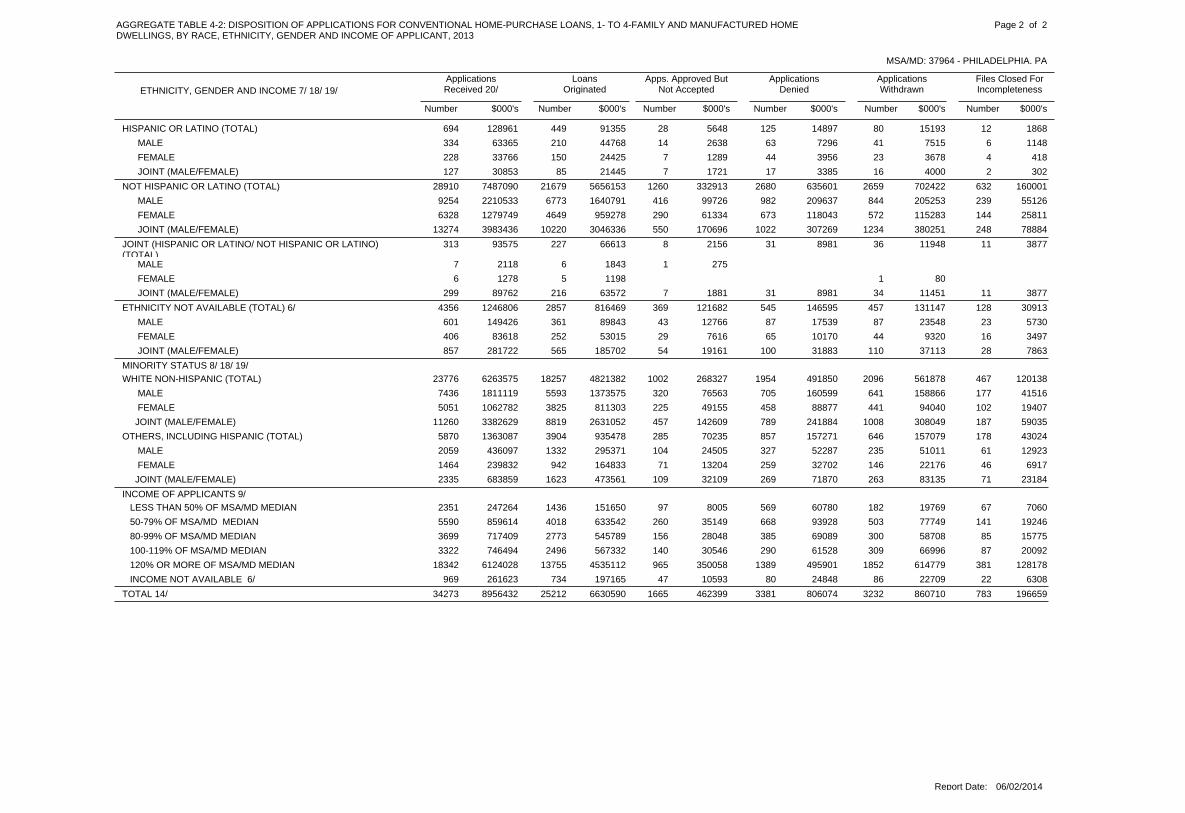
HISPANIC OR LATINO (TOTAL) 449 28 125 80 12694 128961 91355 5648 14897 15193 1868
MALE 210 14 63 41 6334 63365 44768 2638 7296 7515 1148
FEMALE 150 7 44 23 4228 33766 24425 1289 3956 3678 418
JOINT (MALE/FEMALE) 85 7 17 16 2127 30853 21445 1721 3385 4000 302
NOT HISPANIC OR LATINO (TOTAL) 21679 1260 2680 2659 63228910 7487090 5656153 332913 635601 702422 160001
MALE 6773 416 982 844 2399254 2210533 1640791 99726 209637 205253 55126
FEMALE 4649 290 673 572 1446328 1279749 959278 61334 118043 115283 25811
JOINT (MALE/FEMALE) 10220 550 1022 1234 24813274 3983436 3046336 170696 307269 380251 78884
JOINT (HISPANIC OR LATINO/ NOT HISPANIC OR LATINO)(TOTAL)
227 8 31 36 11313 93575 66613 2156 8981 11948 3877
MALE 6 17 2118 1843 275
FEMALE 5 16 1278 1198 80
JOINT (MALE/FEMALE) 216 7 31 34 11299 89762 63572 1881 8981 11451 3877
ETHNICITY NOT AVAILABLE (TOTAL) 6/ 2857 369 545 457 1284356 1246806 816469 121682 146595 131147 30913
MALE 361 43 87 87 23601 149426 89843 12766 17539 23548 5730
FEMALE 252 29 65 44 16406 83618 53015 7616 10170 9320 3497
JOINT (MALE/FEMALE) 565 54 100 110 28857 281722 185702 19161 31883 37113 7863
MINORITY STATUS 8/ 18/ 19/
WHITE NON-HISPANIC (TOTAL) 18257 1002 1954 2096 46723776 6263575 4821382 268327 491850 561878 120138
MALE 5593 320 705 641 1777436 1811119 1373575 76563 160599 158866 41516
FEMALE 3825 225 458 441 1025051 1062782 811303 49155 88877 94040 19407
JOINT (MALE/FEMALE) 8819 457 789 1008 18711260 3382629 2631052 142609 241884 308049 59035
OTHERS, INCLUDING HISPANIC (TOTAL) 3904 285 857 646 1785870 1363087 935478 70235 157271 157079 43024
MALE 1332 104 327 235 612059 436097 295371 24505 52287 51011 12923
FEMALE 942 71 259 146 461464 239832 164833 13204 32702 22176 6917
JOINT (MALE/FEMALE) 1623 109 269 263 712335 683859 473561 32109 71870 83135 23184
INCOME OF APPLICANTS 9/
LESS THAN 50% OF MSA/MD MEDIAN 1436 97 569 182 672351 247264 151650 8005 60780 19769 7060
50-79% OF MSA/MD MEDIAN 4018 260 668 503 1415590 859614 633542 35149 93928 77749 19246
80-99% OF MSA/MD MEDIAN 2773 156 385 300 853699 717409 545789 28048 69089 58708 15775
100-119% OF MSA/MD MEDIAN 2496 140 290 309 873322 746494 567332 30546 61528 66996 20092
120% OR MORE OF MSA/MD MEDIAN 13755 965 1389 1852 38118342 6124028 4535112 350058 495901 614779 128178
INCOME NOT AVAILABLE 6/ 734 47 80 86 22969 261623 197165 10593 24848 22709 6308
TOTAL 14/ 25212 1665 3381 3232 78334273 8956432 6630590 462399 806074 860710 196659
Report Date: 06/02/2014
AGGREGATE TABLE 4-2: DISPOSITION OF APPLICATIONS FOR CONVENTIONAL HOME-PURCHASE LOANS, 1- TO 4-FAMILY AND MANUFACTURED HOMEDWELLINGS, BY RACE, ETHNICITY, GENDER AND INCOME OF APPLICANT, 2013
MSA/MD: 37964 - PHILADELPHIA, PA
ETHNICITY, GENDER AND INCOME 7/ 18/ 19/
ApplicationsReceived 20/
LoansOriginated
Apps. Approved ButNot Accepted
ApplicationsDenied
ApplicationsWithdrawn
Files Closed ForIncompleteness
Number Number Number Number Number Number$000's $000's $000's $000's $000's $000's
Page 2 of 2

AMERICAN INDIAN/ALASKA NATIVE (TOTAL) 116 21 87 31 23278 41103 17747 4110 10943 5540 2763
MALE 56 10 33 17 8124 18346 9371 1880 3948 2475 672
FEMALE 30 7 41 6 1094 9842 3008 834 4239 771 990
JOINT (MALE/FEMALE) 25 3 11 8 451 11031 4448 1196 2361 2294 732
ASIAN (TOTAL) 2878 336 1145 514 3145187 1122590 655813 73607 220919 110267 61984
MALE 1050 125 447 200 1301952 394261 229103 25422 78214 38297 23225
FEMALE 578 87 245 111 691090 197144 110295 16958 36806 21542 11543
JOINT (MALE/FEMALE) 1244 124 446 201 1132128 528036 314941 31227 104822 50131 26915
BLACK OR AFRICAN AMERICAN (TOTAL) 4111 720 3510 1191 75310285 1233642 518753 93914 386361 149000 85614
MALE 1219 260 1179 431 2743363 410142 159466 35395 130863 54643 29775
FEMALE 1973 347 1706 525 3594910 509037 212304 40347 162558 57402 36426
JOINT (MALE/FEMALE) 909 112 612 232 1191984 311159 145718 18077 91637 36447 19280
NATIVE HAWAIIAN/OTHER PACIFIC ISLND (TOTAL) 103 13 74 33 17240 36847 17639 2286 9538 5119 2265
MALE 41 4 35 11 11102 15573 7428 581 4540 1848 1176
FEMALE 39 5 26 10 282 10628 6049 667 2204 1532 176
JOINT (MALE/FEMALE) 22 4 12 12 454 10298 4006 1038 2602 1739 913
WHITE (TOTAL) 51302 5113 14625 7926 408083046 17456874 10786388 1086591 3036426 1702920 844549
MALE 12755 1699 4807 2585 141623262 4793742 2640782 348560 974293 546328 283779
FEMALE 9848 1035 3235 1654 81416586 2779427 1639956 182623 535683 284355 136810
JOINT (MALE/FEMALE) 28577 2366 6538 3666 183842985 9840657 6481535 553221 1517455 867346 421100
2 OR MORE MINORITY RACES (TOTAL) 43 10 35 19 12119 18364 6693 1394 6373 2326 1578
MALE 16 4 6 8 842 7768 2818 532 2477 855 1086
FEMALE 20 5 20 7 254 6464 2431 697 2315 830 191
JOINT (MALE/FEMALE) 7 1 9 4 223 4132 1444 165 1581 641 301
JOINT (WHITE/MINORITY RACE) (TOTAL) 698 68 202 91 601119 258170 169987 13949 41759 20680 11795
MALE 11 1 12 428 5016 1916 66 2191 843
FEMALE 11 1 2 6 121 4331 2336 180 281 1494 40
JOINT (MALE/FEMALE) 675 65 186 80 591065 247391 165435 13631 38473 18097 11755
RACE NOT AVAILABLE (TOTAL) 6/ 8438 986 4442 2329 157517770 3518568 1787117 201406 793689 441785 294571
MALE 984 105 737 342 2942462 418678 178246 21440 110666 58845 49481
FEMALE 902 82 692 288 2102174 292166 124615 12986 85082 42168 27315
JOINT (MALE/FEMALE) 1816 124 705 370 3093324 718482 398672 25281 151924 81151 61454
Report Date: 06/02/2014
AGGREGATE TABLE 4-3: DISPOSITION OF APPLICATIONS TO REFINANCE LOANS ON 1- TO 4-FAMILY AND MANUFACTURED HOME DWELLINGS, BY RACE,ETHNICITY, GENDER AND INCOME OF APPLICANT, 2013
MSA/MD: 37964 - PHILADELPHIA, PA
RACE AND GENDER 5/ 18/ 19/
ApplicationsReceived 20/
LoansOriginated
Apps. Approved ButNot Accepted
ApplicationsDenied
ApplicationsWithdrawn
Files Closed ForIncompleteness
Number Number Number Number Number Number$000's $000's $000's $000's $000's $000's
Page 1 of 2

HISPANIC OR LATINO (TOTAL) 1259 196 913 307 1902865 402716 187221 29653 112896 46636 26310
MALE 525 106 385 132 891237 171736 78475 15468 45760 20289 11744
FEMALE 401 47 316 103 58925 109530 49285 5413 33682 13878 7272
JOINT (MALE/FEMALE) 327 42 205 69 43686 118378 58321 8572 32105 12086 7294
NOT HISPANIC OR LATINO (TOTAL) 57406 6065 18905 9525 508696987 19630223 11843930 1239027 3612061 1947461 987744
MALE 14637 2006 6275 3183 178527886 5507483 2973067 399579 1169631 631557 333649
FEMALE 12156 1461 5067 2268 122622178 3443479 1934076 239380 723882 363304 182837
JOINT (MALE/FEMALE) 30446 2580 7500 4040 205946625 10621008 6904719 596824 1706870 944825 467770
JOINT (HISPANIC OR LATINO/ NOT HISPANIC OR LATINO)(TOTAL)
631 53 191 100 501025 222030 140301 12234 37487 21591 10417
MALE 17 2 3 1 427 5834 3843 560 367 395 669
FEMALE 10 4 216 2534 1497 746 291
JOINT (MALE/FEMALE) 599 50 184 95 45973 211872 133971 11400 36374 20489 9638
ETHNICITY NOT AVAILABLE (TOTAL) 6/ 8393 953 4111 2202 150817167 3431189 1788685 196343 743564 421949 280648
MALE 953 94 593 282 2632185 378473 173745 18269 91434 51893 43132
FEMALE 834 61 580 234 1831892 253496 116136 10499 70858 32621 23382
JOINT (MALE/FEMALE) 1903 127 630 369 3013330 719928 419188 27040 135506 80446 57748
MINORITY STATUS 8/ 18/ 19/
WHITE NON-HISPANIC (TOTAL) 49073 4849 13591 7501 383378847 16702386 10365161 1038563 2872713 1623528 802421
MALE 12153 1592 4460 2448 133021983 4586113 2537738 331700 925212 520708 270755
FEMALE 9425 998 2967 1565 76115716 2662083 1580697 178323 501907 271921 129235
JOINT (MALE/FEMALE) 27407 2253 6138 3474 173341005 9424041 6228733 527404 1440428 827321 400155
OTHERS, INCLUDING HISPANIC (TOTAL) 9654 1396 6014 2242 138520691 3276876 1685984 228180 809962 354371 198379
MALE 2884 505 2048 792 5106739 1012967 485789 78984 263144 118046 67004
FEMALE 3020 491 2310 755 4917067 836988 382713 64155 238677 95967 55476
JOINT (MALE/FEMALE) 3720 396 1625 685 3796805 1413664 812019 84400 303505 138754 74986
INCOME OF APPLICANTS 9/
LESS THAN 50% OF MSA/MD MEDIAN 4528 628 4125 1147 65711085 1180152 467693 69726 449986 125583 67164
50-79% OF MSA/MD MEDIAN 9746 1313 4981 2138 120119379 2629616 1288629 190428 686279 305360 158920
80-99% OF MSA/MD MEDIAN 7226 805 2778 1273 80012882 2074510 1131145 135465 464405 215232 128263
100-119% OF MSA/MD MEDIAN 6956 762 2120 1181 64211661 2078551 1210694 143220 389789 221566 113282
120% OR MORE OF MSA/MD MEDIAN 33838 3108 8075 4908 273452663 13724898 8738000 812760 2164703 1299276 710159
INCOME NOT AVAILABLE 6/ 5395 651 2041 1487 80010374 1998431 1123976 125658 350846 270620 127331
TOTAL 14/ 67689 7267 24120 12134 6834118044 23686158 13960137 1477257 4506008 2437637 1305119
Report Date: 06/02/2014
AGGREGATE TABLE 4-3: DISPOSITION OF APPLICATIONS TO REFINANCE LOANS ON 1- TO 4-FAMILY AND MANUFACTURED HOME DWELLINGS, BY RACE,ETHNICITY, GENDER AND INCOME OF APPLICANT, 2013
MSA/MD: 37964 - PHILADELPHIA, PA
ETHNICITY, GENDER AND INCOME 7/ 18/ 19/
ApplicationsReceived 20/
LoansOriginated
Apps. Approved ButNot Accepted
ApplicationsDenied
ApplicationsWithdrawn
Files Closed ForIncompleteness
Number Number Number Number Number Number$000's $000's $000's $000's $000's $000's
Page 2 of 2

AMERICAN INDIAN/ALASKA NATIVE (TOTAL) 17 1 75 4 198 2614 594 10 1717 243 50
MALE 8 1 34 2 146 981 414 10 477 30 50
FEMALE 6 35 142 1211 105 913 193
JOINT (MALE/FEMALE) 3 6 110 422 75 327 20
ASIAN (TOTAL) 156 24 271 21 15487 32245 13362 2164 13773 2012 934
MALE 63 10 128 9 10220 11091 3963 708 5413 334 673
FEMALE 36 7 86 6 1136 7160 2530 513 3769 243 105
JOINT (MALE/FEMALE) 57 7 54 6 4128 13924 6869 943 4521 1435 156
BLACK OR AFRICAN AMERICAN (TOTAL) 748 63 2709 112 713703 86778 23335 2489 51979 5555 3420
MALE 248 19 994 32 311324 32350 7739 767 20638 1535 1671
FEMALE 380 38 1488 58 311995 38784 9552 1359 24390 2137 1346
JOINT (MALE/FEMALE) 116 6 212 22 9365 15382 5955 363 6778 1883 403
NATIVE HAWAIIAN/OTHER PACIFIC ISLND (TOTAL) 17 2 72 394 2679 675 70 1754 180
MALE 5 2 30 138 748 98 70 510 70
FEMALE 8 3442 1118 357 761
JOINT (MALE/FEMALE) 4 8 214 813 220 483 110
WHITE (TOTAL) 4776 296 3333 489 2369130 679431 427468 23017 146572 51938 30436
MALE 1210 98 1272 155 792814 165555 91636 4820 45370 14619 9110
FEMALE 995 68 1090 131 562340 115784 61400 3170 34012 10093 7109
JOINT (MALE/FEMALE) 2562 128 960 203 1013954 397099 273870 14970 66816 27226 14217
2 OR MORE MINORITY RACES (TOTAL) 6 1 33 141 1733 540 129 1039 25
MALE 2 13 116 656 48 583 25
FEMALE 2 1 1821 575 42 129 404
JOINT (MALE/FEMALE) 2 24 502 450 52
JOINT (WHITE/MINORITY RACE) (TOTAL) 60 7 47 8 3125 10892 5656 1029 2718 979 510
MALE 2 2 15 165 13 17 135
FEMALE 11 162 162
JOINT (MALE/FEMALE) 57 7 44 8 2118 10559 5481 1029 2695 979 375
RACE NOT AVAILABLE (TOTAL) 6/ 1119 67 1332 179 732770 152386 90547 4441 38726 13033 5639
MALE 104 17 193 21 22357 14939 6491 495 4714 1971 1268
FEMALE 97 9 274 19 21420 12448 4053 203 6272 771 1149
JOINT (MALE/FEMALE) 157 7 72 23 12271 18888 12800 671 2649 1950 818
Report Date: 06/02/2014
AGGREGATE TABLE 4-4: DISPOSITION OF APPLICATIONS FOR HOME IMPROVEMENT LOANS, 1- TO 4-FAMILY AND MANUFACTURED HOME DWELLINGS, BYRACE, ETHNICITY, GENDER AND INCOME OF APPLICANT, 2013
MSA/MD: 37964 - PHILADELPHIA, PA
RACE AND GENDER 5/ 18/ 19/
ApplicationsReceived 20/
LoansOriginated
Apps. Approved ButNot Accepted
ApplicationsDenied
ApplicationsWithdrawn
Files Closed ForIncompleteness
Number Number Number Number Number Number$000's $000's $000's $000's $000's $000's
Page 1 of 2

HISPANIC OR LATINO (TOTAL) 194 15 663 24 9905 25279 6813 1064 14689 1938 775
MALE 86 10 273 10 6385 9906 2342 996 5218 775 575
FEMALE 67 5 321 9 2404 8688 1696 68 6491 263 170
JOINT (MALE/FEMALE) 38 67 5 1111 6567 2692 2945 900 30
NOT HISPANIC OR LATINO (TOTAL) 5493 393 5860 597 31412657 777621 456902 27906 200389 58589 33835
MALE 1447 132 2187 181 1154062 198962 101463 5456 65665 15679 10699
FEMALE 1358 113 2462 184 874204 156265 72024 5162 58586 12303 8190
JOINT (MALE/FEMALE) 2681 147 1192 231 1124363 421462 282884 17238 75827 30567 14946
JOINT (HISPANIC OR LATINO/ NOT HISPANIC OR LATINO)(TOTAL)
54 3 39 6 1103 9343 6229 196 2161 677 80
MALE 1 5 17 385 30 100 255
FEMALE 22 16 16
JOINT (MALE/FEMALE) 53 3 32 5 194 8942 6199 196 2045 422 80
ETHNICITY NOT AVAILABLE (TOTAL) 6/ 1158 50 1310 189 762783 156515 92233 4183 41039 12736 6324
MALE 108 5 201 28 24366 17232 6567 418 6739 1850 1658
FEMALE 100 5 240 22 20387 12273 4481 144 5428 871 1349
JOINT (MALE/FEMALE) 186 5 67 24 14296 20618 13945 542 3504 1714 913
MINORITY STATUS 8/ 18/ 19/
WHITE NON-HISPANIC (TOTAL) 4520 281 2862 458 2258346 644599 412831 21869 131203 49432 29264
MALE 1135 88 1083 142 742522 154673 89292 3742 39839 13280 8520
FEMALE 938 65 893 122 542072 108774 59574 3137 29541 9790 6732
JOINT (MALE/FEMALE) 2444 127 884 194 973746 380864 263787 14940 61763 26362 14012
OTHERS, INCLUDING HISPANIC (TOTAL) 1220 115 3769 170 1005374 166528 56049 7076 86750 10909 5744
MALE 403 42 1425 51 491970 54875 14215 2551 32209 2821 3079
FEMALE 490 51 1918 73 342566 56279 14240 2069 35538 2811 1621
JOINT (MALE/FEMALE) 322 22 405 46 17812 54994 27498 2456 18719 5277 1044
INCOME OF APPLICANTS 9/
LESS THAN 50% OF MSA/MD MEDIAN 939 56 3063 127 594244 90884 24005 1263 58199 4648 2769
50-79% OF MSA/MD MEDIAN 1284 84 1739 161 723340 121265 54334 3202 49138 9492 5099
80-99% OF MSA/MD MEDIAN 802 56 671 114 531696 86607 48538 2467 23382 7165 5055
100-119% OF MSA/MD MEDIAN 704 55 441 80 431323 82757 51772 3460 17583 5943 3999
120% OR MORE OF MSA/MD MEDIAN 3001 196 1317 322 1675003 535183 351852 20259 95990 43854 23228
INCOME NOT AVAILABLE 6/ 169 14 641 12 6842 52062 31676 2698 13986 2838 864
TOTAL 14/ 6899 461 7872 816 40016448 968758 562177 33349 258278 73940 41014
Report Date: 06/02/2014
AGGREGATE TABLE 4-4: DISPOSITION OF APPLICATIONS FOR HOME IMPROVEMENT LOANS, 1- TO 4-FAMILY AND MANUFACTURED HOME DWELLINGS, BYRACE, ETHNICITY, GENDER AND INCOME OF APPLICANT, 2013
MSA/MD: 37964 - PHILADELPHIA, PA
ETHNICITY, GENDER AND INCOME 7/ 18/ 19/
ApplicationsReceived 20/
LoansOriginated
Apps. Approved ButNot Accepted
ApplicationsDenied
ApplicationsWithdrawn
Files Closed ForIncompleteness
Number Number Number Number Number Number$000's $000's $000's $000's $000's $000's
Page 2 of 2

AMERICAN INDIAN/ALASKA NATIVE (TOTAL)
MALE
FEMALE
JOINT (MALE/FEMALE)
ASIAN (TOTAL) 13 1 1 116 8049 6869 305 500 375
MALE 2 13 1780 1280 500
FEMALE 11 281 281
JOINT (MALE/FEMALE) 10 1 112 5988 5308 305 375
BLACK OR AFRICAN AMERICAN (TOTAL) 10 5 116 5554 3739 1605 210
MALE 6 28 3754 2842 912
FEMALE 33 693 693
JOINT (MALE/FEMALE) 3 14 1106 896 210
NATIVE HAWAIIAN/OTHER PACIFIC ISLND (TOTAL)
MALE
FEMALE
JOINT (MALE/FEMALE)
WHITE (TOTAL) 50 6 24 787 73030 53691 4693 10923 3723
MALE 27 2 14 548 24313 12215 2775 6430 2893
FEMALE 3 25 2461 1510 951
JOINT (MALE/FEMALE) 20 4 7 233 45356 39966 1918 2642 830
2 OR MORE MINORITY RACES (TOTAL)
MALE
FEMALE
JOINT (MALE/FEMALE)
JOINT (WHITE/MINORITY RACE) (TOTAL) 1 12 584 80 504
MALE 11 504 504
FEMALE
JOINT (MALE/FEMALE) 11 80 80
RACE NOT AVAILABLE (TOTAL) 6/ 438 28 56 56 6584 2754335 1965262 79673 296342 399636 13422
MALE 1 23 919 520 399
FEMALE 22 1000 1000
JOINT (MALE/FEMALE) 22 5800 5800
Report Date: 06/02/2014
AGGREGATE TABLE 4-5: DISPOSITION OF APPLICATIONS FOR LOANS ON DWELLINGS FOR 5 OR MORE FAMILIES, BY RACE, ETHNICITY, GENDER ANDINCOME OF APPLICANT, 2013
MSA/MD: 37964 - PHILADELPHIA, PA
RACE AND GENDER 5/ 18/ 19/
ApplicationsReceived 20/
LoansOriginated
Apps. Approved ButNot Accepted
ApplicationsDenied
ApplicationsWithdrawn
Files Closed ForIncompleteness
Number Number Number Number Number Number$000's $000's $000's $000's $000's $000's
Page 1 of 2

HISPANIC OR LATINO (TOTAL) 11 335 335
MALE 11 335 335
FEMALE
JOINT (MALE/FEMALE)
NOT HISPANIC OR LATINO (TOTAL) 70 7 30 10117 86117 64099 4998 12208 4812
MALE 32 2 17 657 29826 15812 2775 7842 3397
FEMALE 4 59 3435 1791 1644
JOINT (MALE/FEMALE) 32 5 8 449 52315 45955 2223 2722 1415
JOINT (HISPANIC OR LATINO/ NOT HISPANIC OR LATINO)(TOTAL)
11 215 215
MALE
FEMALE
JOINT (MALE/FEMALE) 11 215 215
ETHNICITY NOT AVAILABLE (TOTAL) 6/ 439 28 57 56 6586 2754885 1964912 79673 297242 399636 13422
MALE 3 25 1109 710 399
FEMALE 22 1000 1000
JOINT (MALE/FEMALE) 22 5800 5800
MINORITY STATUS 8/ 18/ 19/
WHITE NON-HISPANIC (TOTAL) 47 6 23 783 71457 53018 4693 10023 3723
MALE 25 2 14 546 23855 11757 2775 6430 2893
FEMALE 3 25 2461 1510 951
JOINT (MALE/FEMALE) 19 4 7 232 45141 39751 1918 2642 830
OTHERS, INCLUDING HISPANIC (TOTAL) 25 1 7 336 14737 11158 305 2185 1089
MALE 9 3 113 6373 4457 1412 504
FEMALE 1 34 974 281 693
JOINT (MALE/FEMALE) 14 1 1 218 7389 6419 305 80 585
INCOME OF APPLICANTS 9/
LESS THAN 50% OF MSA/MD MEDIAN
50-79% OF MSA/MD MEDIAN
80-99% OF MSA/MD MEDIAN
100-119% OF MSA/MD MEDIAN
120% OR MORE OF MSA/MD MEDIAN
INCOME NOT AVAILABLE 6/ 511 35 87 66 6705 2841552 2029561 84671 309450 404448 13422
TOTAL 14/ 511 35 87 66 6705 2841552 2029561 84671 309450 404448 13422
Report Date: 06/02/2014
AGGREGATE TABLE 4-5: DISPOSITION OF APPLICATIONS FOR LOANS ON DWELLINGS FOR 5 OR MORE FAMILIES, BY RACE, ETHNICITY, GENDER ANDINCOME OF APPLICANT, 2013
MSA/MD: 37964 - PHILADELPHIA, PA
ETHNICITY, GENDER AND INCOME 7/ 18/ 19/
ApplicationsReceived 20/
LoansOriginated
Apps. Approved ButNot Accepted
ApplicationsDenied
ApplicationsWithdrawn
Files Closed ForIncompleteness
Number Number Number Number Number Number$000's $000's $000's $000's $000's $000's
Page 2 of 2

AMERICAN INDIAN/ALASKA NATIVE (TOTAL) 22 2 21 4 251 7102 3454 247 2192 917 292
MALE 13 1 12 1 128 3270 1841 162 1077 69 121
FEMALE 2 1 7 111 1009 497 85 413 14
JOINT (MALE/FEMALE) 6 2 2 111 2631 924 702 834 171
ASIAN (TOTAL) 841 92 285 123 761417 227325 137087 14800 40496 21344 13598
MALE 354 35 116 42 32579 83353 53611 5198 13991 5930 4623
FEMALE 174 19 62 29 21305 44972 26201 3224 7295 4730 3522
JOINT (MALE/FEMALE) 312 38 101 52 23526 98293 57180 6378 18598 10684 5453
BLACK OR AFRICAN AMERICAN (TOTAL) 521 91 775 148 681603 124789 51886 8752 44224 13823 6104
MALE 228 41 373 75 32749 55059 22281 3017 20961 6347 2453
FEMALE 189 31 320 50 23613 46612 18470 3382 17063 5471 2226
JOINT (MALE/FEMALE) 104 18 81 23 13239 23022 11135 2258 6199 2005 1425
NATIVE HAWAIIAN/OTHER PACIFIC ISLND (TOTAL) 19 2 26 855 6513 2933 349 2133 1098
MALE 7 12 524 3129 1284 1194 651
FEMALE 2 1 11 216 1334 58 245 629 402
JOINT (MALE/FEMALE) 10 1 3 115 2050 1591 104 310 45
WHITE (TOTAL) 5871 560 1907 872 4099619 1557907 957039 99551 278813 152449 70055
MALE 2434 252 878 399 2164179 648059 384720 43996 119692 64649 35002
FEMALE 957 87 377 146 591626 237063 142562 12163 48425 24562 9351
JOINT (MALE/FEMALE) 2473 219 646 325 1343797 670713 428676 43182 110311 62842 25702
2 OR MORE MINORITY RACES (TOTAL) 8 3 10 2 528 2824 1104 338 464 140 778
MALE 5 1 4 414 1796 813 135 154 694
FEMALE 2 2 5 1 111 602 150 203 122 43 84
JOINT (MALE/FEMALE) 1 1 13 426 141 188 97
JOINT (WHITE/MINORITY RACE) (TOTAL) 72 8 27 8 3118 18454 12854 773 2940 1496 391
MALE 3 1 37 936 533 66 337
FEMALE
JOINT (MALE/FEMALE) 69 7 24 8 3111 17518 12321 707 2603 1496 391
RACE NOT AVAILABLE (TOTAL) 6/ 1953 204 684 309 1493299 674693 453025 42272 106392 49356 23648
MALE 177 23 114 46 26386 50459 26565 2955 10455 6187 4297
FEMALE 86 7 72 30 9204 23313 11981 1317 5433 3417 1165
JOINT (MALE/FEMALE) 167 12 65 34 24302 56785 32442 2532 11947 5884 3980
Report Date: 06/02/2014
AGGREGATE TABLE 4-6: DISPOSITION OF APPLICATIONS FROM NONOCCUPANTS FOR HOME-PURCHASE, HOME IMPROVEMENT, OR REFINANCING LOANS,1- TO 4-FAMILY AND MANUFACTURED HOME DWELLINGS, BY RACE, ETHNICITY, GENDER AND INCOME OF APPLICANT, 2013
MSA/MD: 37964 - PHILADELPHIA, PA
RACE AND GENDER 5/ 18/ 19/
ApplicationsReceived 20/
LoansOriginated
Apps. Approved ButNot Accepted
ApplicationsDenied
ApplicationsWithdrawn
Files Closed ForIncompleteness
Number Number Number Number Number Number$000's $000's $000's $000's $000's $000's
Page 1 of 2

HISPANIC OR LATINO (TOTAL) 212 26 204 37 23502 52804 27078 3756 14073 4724 3173
MALE 111 15 106 18 10260 26278 14362 1716 6874 2195 1131
FEMALE 54 6 66 10 8144 11925 5924 484 3524 1256 737
JOINT (MALE/FEMALE) 46 5 31 8 595 14116 6600 1556 3457 1198 1305
NOT HISPANIC OR LATINO (TOTAL) 7101 733 2856 1136 53612362 1883487 1130842 120196 356509 188018 87922
MALE 2929 325 1306 507 2715338 768595 447633 51722 151404 76007 41829
FEMALE 1271 133 722 224 972447 320611 181365 18503 71540 34739 14464
JOINT (MALE/FEMALE) 2882 272 817 401 1684540 789330 499143 49596 132500 76462 31629
JOINT (HISPANIC OR LATINO/ NOT HISPANIC OR LATINO)(TOTAL)
66 4 21 8 5104 16983 9918 1137 3313 1402 1213
MALE 3 2 27 686 334 73 279
FEMALE 2 2 15 386 218 88 80
JOINT (MALE/FEMALE) 61 4 17 7 392 15911 9366 1137 3152 1322 934
ETHNICITY NOT AVAILABLE (TOTAL) 6/ 1928 199 654 293 1483222 666333 451544 41993 103759 46479 22558
MALE 178 14 98 43 28361 50502 29319 2091 9510 5631 3951
FEMALE 85 9 64 24 8190 21983 12412 1632 4228 2564 1147
JOINT (MALE/FEMALE) 153 14 58 30 22277 52081 29301 2872 11749 4905 3254
MINORITY STATUS 8/ 18/ 19/
WHITE NON-HISPANIC (TOTAL) 5583 528 1743 825 3839062 1480694 913032 94197 261941 145758 65766
MALE 2311 240 796 376 2043927 615141 365074 42416 112474 61565 33612
FEMALE 905 79 340 137 521513 224956 135831 11373 45516 23615 8621
JOINT (MALE/FEMALE) 2361 208 606 310 1273612 638971 411105 40261 103890 60182 23533
OTHERS, INCLUDING HISPANIC (TOTAL) 1728 224 1327 334 1793792 449695 242871 29600 107671 44469 25084
MALE 713 92 614 140 781637 172118 94044 10125 43951 15162 8836
FEMALE 414 59 452 92 531070 104673 50410 7540 28526 11628 6569
JOINT (MALE/FEMALE) 599 72 253 101 481073 171616 98130 11840 34363 17604 9679
INCOME OF APPLICANTS 9/
LESS THAN 50% OF MSA/MD MEDIAN 569 57 644 115 461431 126447 64134 6140 39805 10907 5461
50-79% OF MSA/MD MEDIAN 955 120 629 173 901967 213071 110416 13955 59851 19408 9441
80-99% OF MSA/MD MEDIAN 712 91 342 134 711350 161426 87872 11543 35499 18086 8426
100-119% OF MSA/MD MEDIAN 734 82 278 120 611275 163517 96848 9026 33361 16094 8188
120% OR MORE OF MSA/MD MEDIAN 5048 524 1475 815 3958257 1500800 912211 104080 256064 151792 76653
INCOME NOT AVAILABLE 6/ 1289 88 367 117 491910 454346 347901 22338 53074 24336 6697
TOTAL 14/ 9307 962 3735 1474 71216190 2619607 1619382 167082 477654 240623 114866
Report Date: 06/02/2014
AGGREGATE TABLE 4-6: DISPOSITION OF APPLICATIONS FROM NONOCCUPANTS FOR HOME-PURCHASE, HOME IMPROVEMENT, OR REFINANCING LOANS,1- TO 4-FAMILY AND MANUFACTURED HOME DWELLINGS, BY RACE, ETHNICITY, GENDER AND INCOME OF APPLICANT, 2013
MSA/MD: 37964 - PHILADELPHIA, PA
ETHNICITY, GENDER AND INCOME 7/ 18/ 19/
ApplicationsReceived 20/
LoansOriginated
Apps. Approved ButNot Accepted
ApplicationsDenied
ApplicationsWithdrawn
Files Closed ForIncompleteness
Number Number Number Number Number Number$000's $000's $000's $000's $000's $000's
Page 2 of 2

AMERICAN INDIAN/ALASKA NATIVE (TOTAL) 44 86 86
MALE 44 86 86
FEMALE
JOINT (MALE/FEMALE)
ASIAN (TOTAL) 1 1 8 111 621 125 240 246 10
MALE 3 14 46 36 10
FEMALE 44 41 41
JOINT (MALE/FEMALE) 1 1 13 534 125 240 169
BLACK OR AFRICAN AMERICAN (TOTAL) 6 1 40 1 149 643 141 20 442 25 15
MALE 2 15 118 204 47 142 15
FEMALE 1 1 23 126 331 19 20 267 25
JOINT (MALE/FEMALE) 3 25 108 75 33
NATIVE HAWAIIAN/OTHER PACIFIC ISLND (TOTAL) 11 50 50
MALE
FEMALE 11 50 50
JOINT (MALE/FEMALE)
WHITE (TOTAL) 154 126 210 9 8507 28936 9548 7294 10507 675 912
MALE 59 44 65 4 1173 8542 3222 2252 2683 273 112
FEMALE 38 40 81 2 3164 8257 2173 2264 3477 195 148
JOINT (MALE/FEMALE) 56 42 64 3 4169 12123 4139 2778 4347 207 652
2 OR MORE MINORITY RACES (TOTAL) 11 2 2
MALE
FEMALE 11 2 2
JOINT (MALE/FEMALE)
JOINT (WHITE/MINORITY RACE) (TOTAL) 1 34 256 40 216
MALE
FEMALE
JOINT (MALE/FEMALE) 1 34 256 40 216
RACE NOT AVAILABLE (TOTAL) 6/ 6 10 2541 2667 333 433 1901
MALE 1 2 710 523 41 121 361
FEMALE 2 1 912 304 57 56 191
JOINT (MALE/FEMALE) 2 24 123 51 72
Report Date: 06/02/2014
AGGREGATE TABLE 4-7: DISPOSITION OF APPLICATIONS FOR HOME-PURCHASE, HOME IMPROVEMENT, OR REFINANCING LOANS, MANUFACTURED HOMEDWELLINGS, BY RACE, ETHNICITY, GENDER AND INCOME OF APPLICANT, 2013
MSA/MD: 37964 - PHILADELPHIA, PA
RACE AND GENDER 5/ 18/ 19/
ApplicationsReceived 20/
LoansOriginated
Apps. Approved ButNot Accepted
ApplicationsDenied
ApplicationsWithdrawn
Files Closed ForIncompleteness
Number Number Number Number Number Number$000's $000's $000's $000's $000's $000's
Page 1 of 2

HISPANIC OR LATINO (TOTAL) 5 3 20 230 1231 293 183 593 162
MALE 3 2 813 535 130 127 278
FEMALE 1 1 1012 359 47 56 256
JOINT (MALE/FEMALE) 1 2 25 337 116 59 162
NOT HISPANIC OR LATINO (TOTAL) 152 120 233 9 9523 28056 9367 7155 10059 548 927
MALE 58 41 78 5 2184 8288 3121 2086 2671 283 127
FEMALE 36 39 93 3 3174 7698 2088 2212 3030 220 148
JOINT (MALE/FEMALE) 57 40 62 1 4164 12056 4144 2857 4358 45 652
JOINT (HISPANIC OR LATINO/ NOT HISPANIC OR LATINO)(TOTAL)
2 35 202 63 139
MALE
FEMALE
JOINT (MALE/FEMALE) 2 35 202 63 139
ETHNICITY NOT AVAILABLE (TOTAL) 6/ 9 15 3660 3772 464 649 2659
MALE 1 3 812 578 59 160 359
FEMALE 4 2 1622 928 114 72 742
JOINT (MALE/FEMALE) 1 5 511 549 56 212 281
MINORITY STATUS 8/ 18/ 19/
WHITE NON-HISPANIC (TOTAL) 145 118 179 7 8457 26602 9117 6895 9165 513 912
MALE 56 41 56 4 1158 7851 3074 2086 2306 273 112
FEMALE 35 38 66 2 3144 7525 2069 2192 2921 195 148
JOINT (MALE/FEMALE) 53 39 57 1 4154 11212 3960 2617 3938 45 652
OTHERS, INCLUDING HISPANIC (TOTAL) 15 5 77 4 1102 2995 662 443 1678 197 15
MALE 5 2 29 1 138 827 177 127 498 10 15
FEMALE 2 2 37 142 731 66 76 564 25
JOINT (MALE/FEMALE) 8 1 11 222 1437 419 240 616 162
INCOME OF APPLICANTS 9/
LESS THAN 50% OF MSA/MD MEDIAN 30 28 89 5152 5545 1029 1043 3145 328
50-79% OF MSA/MD MEDIAN 69 68 89 5 7238 14072 3860 4181 5029 337 665
80-99% OF MSA/MD MEDIAN 21 18 18 158 3791 1603 1005 1138 45
100-119% OF MSA/MD MEDIAN 15 9 10 135 2546 1242 607 547 150
120% OR MORE OF MSA/MD MEDIAN 30 15 2772 5544 2052 1151 2341
INCOME NOT AVAILABLE 6/ 3 59 163 1763 401 1250 112
TOTAL 14/ 168 138 292 11 9618 33261 10187 7987 13450 710 927
Report Date: 06/02/2014
AGGREGATE TABLE 4-7: DISPOSITION OF APPLICATIONS FOR HOME-PURCHASE, HOME IMPROVEMENT, OR REFINANCING LOANS, MANUFACTURED HOMEDWELLINGS, BY RACE, ETHNICITY, GENDER AND INCOME OF APPLICANT, 2013
MSA/MD: 37964 - PHILADELPHIA, PA
ETHNICITY, GENDER AND INCOME 7/ 18/ 19/
ApplicationsReceived 20/
LoansOriginated
Apps. Approved ButNot Accepted
ApplicationsDenied
ApplicationsWithdrawn
Files Closed ForIncompleteness
Number Number Number Number Number Number$000's $000's $000's $000's $000's $000's
Page 2 of 2

LESS THAN 50% OF MSA/MD MEDIAN
RACE 5/AMERICAN INDIAN/ALASKA NATIVE 33 219 219
ASIAN 83 4 38 10 6141 15092 8567 389 4292 1129 715
BLACK OR AFRICAN AMERICAN 544 31 211 80 30896 85825 52096 2620 20127 7837 3145
NATIVE HAWAIIAN/OTHER PACIFIC ISLND 6 1 3 1 213 1537 662 54 480 143 198
WHITE 860 32 180 72 271171 130343 93202 3770 21606 8545 3220
2 OR MORE MINORITY RACES 2 24 575 145 430
JOINT (WHITE/MINORITY RACE) 1 2 14 490 150 173 167
RACE NOT AVAILABLE 6/ 115 7 77 25 6230 25270 12165 684 8723 2969 729
ETHNICITY 7/HISPANIC OR LATINO 373 9 54 24 10470 43891 34754 788 4979 2446 924
NOT HISPANIC OR LATINO 1135 58 383 144 551775 190694 121031 5917 41511 15881 6354
JOINT (HISPANIC OR LATINO/ NOT HISPANIC ORLATINO)
8 210 1443 1034 409
ETHNICITY NOT AVAILABLE 6/ 98 8 74 21 6207 23323 10387 812 8932 2463 729
MINORITY STATUS 8/WHITE NON-HISPANIC 507 26 128 50 19730 87684 60131 3134 15842 6157 2420
OTHERS, INCLUDING HISPANIC 1002 42 309 114 461513 146746 95894 3699 30730 11565 4858
50-79% OF MSA/MD MEDIAN
RACE 5/AMERICAN INDIAN/ALASKA NATIVE 5 1 1 18 1210 746 145 184 135
ASIAN 72 5 17 10 7111 18197 12012 694 2934 1423 1134
BLACK OR AFRICAN AMERICAN 613 38 164 66 32913 121554 80790 5367 23089 8225 4083
NATIVE HAWAIIAN/OTHER PACIFIC ISLND 6 2 4 113 1861 869 342 573 77
WHITE 2001 85 274 209 722641 439331 333037 14033 46714 34442 11105
2 OR MORE MINORITY RACES 2 1 3 17 1069 338 177 369 185
JOINT (WHITE/MINORITY RACE) 12 7 1 121 3493 2047 1102 204 140
RACE NOT AVAILABLE 6/ 171 20 74 27 11303 46747 26726 2806 11468 4417 1330
ETHNICITY 7/HISPANIC OR LATINO 226 8 34 18 11297 42104 32729 993 4586 2253 1543
NOT HISPANIC OR LATINO 2475 125 421 272 1013394 539487 395217 19662 67323 42539 14746
JOINT (HISPANIC OR LATINO/ NOT HISPANIC ORLATINO)
21 11 4 238 6606 3548 2158 683 217
ETHNICITY NOT AVAILABLE 6/ 160 17 75 24 12288 45265 25071 2567 11951 3993 1683
MINORITY STATUS 8/WHITE NON-HISPANIC 1764 79 235 192 622332 392827 297465 13171 40451 32108 9632
OTHERS, INCLUDING HISPANIC 937 53 226 100 511367 190686 130493 7376 32874 13118 6825
Report Date: 06/02/2014
AGGREGATE TABLE 5-1: DISPOSITION OF APPLICATIONS FOR FHA, FSA/RHS, AND VA HOME-PURCHASE LOANS, 1- TO 4-FAMILY AND MANUFACTUREDHOME DWELLINGS, BY INCOME, RACE AND ETHNICITY OF APPLICANT, 2013
MSA/MD: 37964 - PHILADELPHIA, PA
INCOME, RACE AND ETHNICITY
ApplicationsReceived 20/
LoansOriginated
Apps. Approved ButNot Accepted
ApplicationsDenied
ApplicationsWithdrawn
Files Closed ForIncompleteness
Number Number Number Number Number Number$000's $000's $000's $000's $000's $000's
Page 1 of 3

80-99% OF MSA/MD MEDIAN
RACE 5/AMERICAN INDIAN/ALASKA NATIVE 22 444 444
ASIAN 43 3 11 6 265 14198 9130 605 2755 1248 460
BLACK OR AFRICAN AMERICAN 175 8 52 26 8269 46473 30954 1277 8474 4460 1308
NATIVE HAWAIIAN/OTHER PACIFIC ISLND 33 662 662
WHITE 1064 41 106 111 281350 281838 222259 8267 22740 22703 5869
2 OR MORE MINORITY RACES 1 1 13 559 250 137 172
JOINT (WHITE/MINORITY RACE) 14 5 120 3532 2437 950 145
RACE NOT AVAILABLE 6/ 102 10 33 10 5160 30767 19886 1901 6496 1625 859
ETHNICITY 7/HISPANIC OR LATINO 60 2 13 4 382 14884 11103 251 2288 716 526
NOT HISPANIC OR LATINO 1230 45 158 136 341603 327722 252846 8696 31910 27422 6848
JOINT (HISPANIC OR LATINO/ NOT HISPANIC ORLATINO)
15 1 4 424 4287 2943 263 568 513
ETHNICITY NOT AVAILABLE 6/ 99 14 33 10 7163 31580 19130 2840 6786 1530 1294
MINORITY STATUS 8/WHITE NON-HISPANIC 992 36 94 104 241250 263089 208801 7145 20544 21527 5072
OTHERS, INCLUDING HISPANIC 306 14 81 38 14453 82402 56533 2396 14274 6733 2466
100-119% OF MSA/MD MEDIAN
RACE 5/AMERICAN INDIAN/ALASKA NATIVE 2 13 525 340 185
ASIAN 22 1 8 435 8730 5662 201 2061 806
BLACK OR AFRICAN AMERICAN 115 9 34 11 7176 34886 23238 1725 6048 2392 1483
NATIVE HAWAIIAN/OTHER PACIFIC ISLND 33 832 832
WHITE 793 22 91 90 231019 234541 182438 5076 21738 20006 5283
2 OR MORE MINORITY RACES 11 210 210
JOINT (WHITE/MINORITY RACE) 22 2 1 126 5812 4916 531 188 177
RACE NOT AVAILABLE 6/ 75 6 17 11 2111 24420 16542 1313 3447 2494 624
ETHNICITY 7/HISPANIC OR LATINO 34 2 2 644 9227 7146 673 260 1148
NOT HISPANIC OR LATINO 921 31 133 101 301216 275123 209479 6451 29961 22682 6550
JOINT (HISPANIC OR LATINO/ NOT HISPANIC ORLATINO)
12 4 1 118 4491 2694 1178 226 393
ETHNICITY NOT AVAILABLE 6/ 65 5 15 9 296 21115 14649 1191 2821 1830 624
MINORITY STATUS 8/WHITE NON-HISPANIC 750 20 83 82 22957 221007 173298 4403 19902 18514 4890
OTHERS, INCLUDING HISPANIC 204 12 52 23 9300 63284 43399 2599 10473 4760 2053
Report Date: 06/02/2014
AGGREGATE TABLE 5-1: DISPOSITION OF APPLICATIONS FOR FHA, FSA/RHS, AND VA HOME-PURCHASE LOANS, 1- TO 4-FAMILY AND MANUFACTUREDHOME DWELLINGS, BY INCOME, RACE AND ETHNICITY OF APPLICANT, 2013
MSA/MD: 37964 - PHILADELPHIA, PA
INCOME, RACE AND ETHNICITY (CONTINUED)
ApplicationsReceived 20/
LoansOriginated
Apps. Approved ButNot Accepted
ApplicationsDenied
ApplicationsWithdrawn
Files Closed ForIncompleteness
Number Number Number Number Number Number$000's $000's $000's $000's $000's $000's
Page 2 of 3

120% OR MORE OF MSA/MD MEDIAN
RACE 5/AMERICAN INDIAN/ALASKA NATIVE 3 1 15 1338 968 230 140
ASIAN 51 10 10 273 22061 15959 2942 2504 656
BLACK OR AFRICAN AMERICAN 135 7 40 17 7206 50712 33603 1840 8510 4921 1838
NATIVE HAWAIIAN/OTHER PACIFIC ISLND 7 310 3027 2027 1000
WHITE 1421 68 177 183 471896 541901 409098 18801 50599 51017 12386
2 OR MORE MINORITY RACES 11 175 175
JOINT (WHITE/MINORITY RACE) 47 4 5 460 17729 13031 1245 1826 1627
RACE NOT AVAILABLE 6/ 178 17 42 22 5264 76864 52891 4589 11541 6460 1383
ETHNICITY 7/HISPANIC OR LATINO 38 4 6 755 13818 10005 1089 1118 1606
NOT HISPANIC OR LATINO 1573 70 223 202 572125 600109 448862 18805 61058 56228 15156
JOINT (HISPANIC OR LATINO/ NOT HISPANIC ORLATINO)
57 3 5 671 21672 17043 1158 1324 2147
ETHNICITY NOT AVAILABLE 6/ 174 19 44 22 5264 78208 51667 5423 13148 6723 1247
MINORITY STATUS 8/WHITE NON-HISPANIC 1336 61 163 171 461777 507745 384809 16582 46518 47711 12125
OTHERS, INCLUDING HISPANIC 321 17 68 43 10459 123935 87706 4911 16625 12059 2634
8833 421 1735 1028 33812355 2316931 1683314 77579 301356 195472 59210TOTAL 14/
Report Date: 06/02/2014
AGGREGATE TABLE 5-1: DISPOSITION OF APPLICATIONS FOR FHA, FSA/RHS, AND VA HOME-PURCHASE LOANS, 1- TO 4-FAMILY AND MANUFACTUREDHOME DWELLINGS, BY INCOME, RACE AND ETHNICITY OF APPLICANT, 2013
MSA/MD: 37964 - PHILADELPHIA, PA
INCOME, RACE AND ETHNICITY (CONTINUED)
ApplicationsReceived 20/
LoansOriginated
Apps. Approved ButNot Accepted
ApplicationsDenied
ApplicationsWithdrawn
Files Closed ForIncompleteness
Number Number Number Number Number Number$000's $000's $000's $000's $000's $000's
Page 3 of 3

LESS THAN 50% OF MSA/MD MEDIAN
RACE 5/AMERICAN INDIAN/ALASKA NATIVE 4 5 3 113 911 359 322 150 80
ASIAN 254 14 89 22 14393 42890 27840 1302 9513 2482 1753
BLACK OR AFRICAN AMERICAN 126 9 90 25 8258 18894 9730 583 6433 1702 446
NATIVE HAWAIIAN/OTHER PACIFIC ISLND 4 2 4 111 1131 358 358 315 100
WHITE 927 67 299 105 331431 158296 101219 5324 35925 12235 3593
2 OR MORE MINORITY RACES 1 23 176 56 120
JOINT (WHITE/MINORITY RACE) 8 210 948 753 195
RACE NOT AVAILABLE 6/ 112 5 80 25 10232 24018 11335 438 8152 3005 1088
ETHNICITY 7/HISPANIC OR LATINO 90 3 60 13 2168 13888 7796 200 4740 1086 66
NOT HISPANIC OR LATINO 1238 87 433 141 571956 210398 133042 7157 48425 15364 6410
JOINT (HISPANIC OR LATINO/ NOT HISPANIC ORLATINO)
3 1 15 521 252 128 141
ETHNICITY NOT AVAILABLE 6/ 105 7 75 27 8222 22457 10560 648 7487 3178 584
MINORITY STATUS 8/WHITE NON-HISPANIC 841 61 249 91 311273 144731 93530 4874 31945 10855 3527
OTHERS, INCLUDING HISPANIC 481 28 239 65 26839 77828 46498 2443 20716 5726 2445
50-79% OF MSA/MD MEDIAN
RACE 5/AMERICAN INDIAN/ALASKA NATIVE 8 1 4 215 1841 981 150 415 295
ASIAN 314 29 70 45 15473 72478 47826 4698 10623 6846 2485
BLACK OR AFRICAN AMERICAN 199 14 73 40 10336 33903 22127 1348 5905 3760 763
NATIVE HAWAIIAN/OTHER PACIFIC ISLND 7 4 314 2044 1132 596 316
WHITE 3172 191 419 352 934227 669267 511631 26207 62158 56505 12766
2 OR MORE MINORITY RACES 1 23 498 135 363
JOINT (WHITE/MINORITY RACE) 15 4 5 125 4059 2465 544 905 145
RACE NOT AVAILABLE 6/ 302 25 94 54 22497 75524 47245 2746 13687 8759 3087
ETHNICITY 7/HISPANIC OR LATINO 118 8 18 24 3171 23154 16864 954 1803 3272 261
NOT HISPANIC OR LATINO 3582 217 551 423 1194892 756242 566744 29872 78109 65235 16282
JOINT (HISPANIC OR LATINO/ NOT HISPANIC ORLATINO)
11 2 4 1 119 3129 1505 450 763 190 221
ETHNICITY NOT AVAILABLE 6/ 307 33 95 55 18508 77089 48429 3873 13253 9052 2482
MINORITY STATUS 8/WHITE NON-HISPANIC 3014 178 394 323 903999 635940 487743 24408 59223 52199 12367
OTHERS, INCLUDING HISPANIC 666 51 175 119 301041 139082 92030 7116 20461 15600 3875
Report Date: 06/02/2014
AGGREGATE TABLE 5-2: DISPOSITION OF APPLICATIONS FOR CONVENTIONAL HOME-PURCHASE LOANS, 1- TO 4-FAMILY AND MANUFACTURED HOMEDWELLINGS, BY INCOME, RACE AND ETHNICITY OF APPLICANT, 2013
MSA/MD: 37964 - PHILADELPHIA, PA
INCOME, RACE AND ETHNICITY
ApplicationsReceived 20/
LoansOriginated
Apps. Approved ButNot Accepted
ApplicationsDenied
ApplicationsWithdrawn
Files Closed ForIncompleteness
Number Number Number Number Number Number$000's $000's $000's $000's $000's $000's
Page 1 of 3
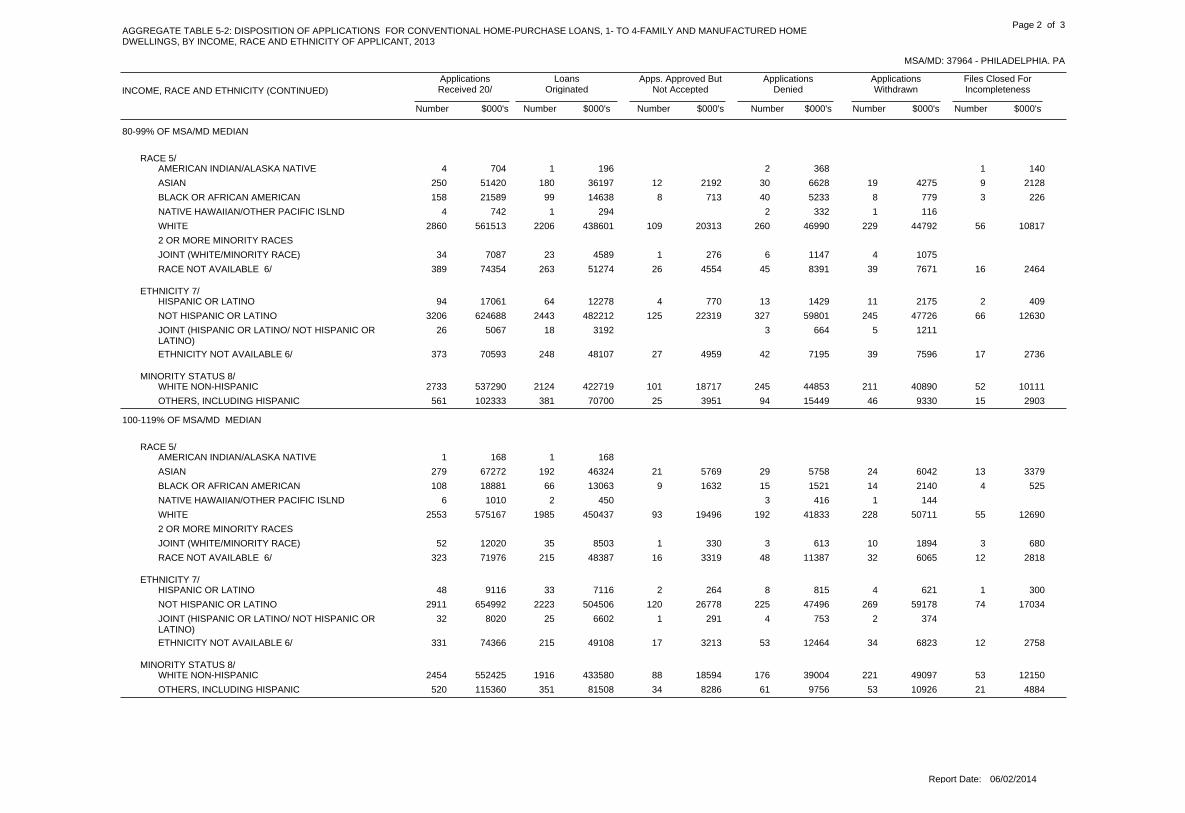
80-99% OF MSA/MD MEDIAN
RACE 5/AMERICAN INDIAN/ALASKA NATIVE 1 2 14 704 196 368 140
ASIAN 180 12 30 19 9250 51420 36197 2192 6628 4275 2128
BLACK OR AFRICAN AMERICAN 99 8 40 8 3158 21589 14638 713 5233 779 226
NATIVE HAWAIIAN/OTHER PACIFIC ISLND 1 2 14 742 294 332 116
WHITE 2206 109 260 229 562860 561513 438601 20313 46990 44792 10817
2 OR MORE MINORITY RACES
JOINT (WHITE/MINORITY RACE) 23 1 6 434 7087 4589 276 1147 1075
RACE NOT AVAILABLE 6/ 263 26 45 39 16389 74354 51274 4554 8391 7671 2464
ETHNICITY 7/HISPANIC OR LATINO 64 4 13 11 294 17061 12278 770 1429 2175 409
NOT HISPANIC OR LATINO 2443 125 327 245 663206 624688 482212 22319 59801 47726 12630
JOINT (HISPANIC OR LATINO/ NOT HISPANIC ORLATINO)
18 3 526 5067 3192 664 1211
ETHNICITY NOT AVAILABLE 6/ 248 27 42 39 17373 70593 48107 4959 7195 7596 2736
MINORITY STATUS 8/WHITE NON-HISPANIC 2124 101 245 211 522733 537290 422719 18717 44853 40890 10111
OTHERS, INCLUDING HISPANIC 381 25 94 46 15561 102333 70700 3951 15449 9330 2903
100-119% OF MSA/MD MEDIAN
RACE 5/AMERICAN INDIAN/ALASKA NATIVE 11 168 168
ASIAN 192 21 29 24 13279 67272 46324 5769 5758 6042 3379
BLACK OR AFRICAN AMERICAN 66 9 15 14 4108 18881 13063 1632 1521 2140 525
NATIVE HAWAIIAN/OTHER PACIFIC ISLND 2 3 16 1010 450 416 144
WHITE 1985 93 192 228 552553 575167 450437 19496 41833 50711 12690
2 OR MORE MINORITY RACES
JOINT (WHITE/MINORITY RACE) 35 1 3 10 352 12020 8503 330 613 1894 680
RACE NOT AVAILABLE 6/ 215 16 48 32 12323 71976 48387 3319 11387 6065 2818
ETHNICITY 7/HISPANIC OR LATINO 33 2 8 4 148 9116 7116 264 815 621 300
NOT HISPANIC OR LATINO 2223 120 225 269 742911 654992 504506 26778 47496 59178 17034
JOINT (HISPANIC OR LATINO/ NOT HISPANIC ORLATINO)
25 1 4 232 8020 6602 291 753 374
ETHNICITY NOT AVAILABLE 6/ 215 17 53 34 12331 74366 49108 3213 12464 6823 2758
MINORITY STATUS 8/WHITE NON-HISPANIC 1916 88 176 221 532454 552425 433580 18594 39004 49097 12150
OTHERS, INCLUDING HISPANIC 351 34 61 53 21520 115360 81508 8286 9756 10926 4884
Report Date: 06/02/2014
AGGREGATE TABLE 5-2: DISPOSITION OF APPLICATIONS FOR CONVENTIONAL HOME-PURCHASE LOANS, 1- TO 4-FAMILY AND MANUFACTURED HOMEDWELLINGS, BY INCOME, RACE AND ETHNICITY OF APPLICANT, 2013
MSA/MD: 37964 - PHILADELPHIA, PA
INCOME, RACE AND ETHNICITY (CONTINUED)
ApplicationsReceived 20/
LoansOriginated
Apps. Approved ButNot Accepted
ApplicationsDenied
ApplicationsWithdrawn
Files Closed ForIncompleteness
Number Number Number Number Number Number$000's $000's $000's $000's $000's $000's
Page 2 of 3

120% OR MORE OF MSA/MD MEDIAN
RACE 5/AMERICAN INDIAN/ALASKA NATIVE 16 1 6 427 7865 4377 187 2405 896
ASIAN 1114 85 151 223 461619 524900 355941 29717 51560 71871 15811
BLACK OR AFRICAN AMERICAN 215 27 46 36 11335 84854 55323 7256 10229 7841 4205
NATIVE HAWAIIAN/OTHER PACIFIC ISLND 25 1 3 837 12601 8609 104 997 2891
WHITE 10552 598 913 1265 25113579 4498913 3459930 211583 324150 418939 84311
2 OR MORE MINORITY RACES 5 27 1848 1142 706
JOINT (WHITE/MINORITY RACE) 311 13 35 32 12403 145803 111676 5122 12853 12676 3476
RACE NOT AVAILABLE 6/ 1517 238 235 284 612335 847244 538114 95383 93707 99665 20375
ETHNICITY 7/HISPANIC OR LATINO 142 11 23 27 4207 63852 46491 3460 5396 7673 832
NOT HISPANIC OR LATINO 11951 691 1112 1529 30415587 5145783 3906109 241264 394181 501007 103222
JOINT (HISPANIC OR LATINO/ NOT HISPANIC ORLATINO)
168 5 19 27 9228 75701 54675 1415 6673 10032 2906
ETHNICITY NOT AVAILABLE 6/ 1494 258 235 269 642320 838692 527837 103919 89651 96067 21218
MINORITY STATUS 8/WHITE NON-HISPANIC 10166 558 868 1209 23313034 4317583 3332166 197174 311111 398277 78855
OTHERS, INCLUDING HISPANIC 1976 143 278 352 822831 907961 632010 47476 88946 112299 27230
25212 1665 3381 3232 78334273 8956432 6630590 462399 806074 860710 196659TOTAL 14/
Report Date: 06/02/2014
AGGREGATE TABLE 5-2: DISPOSITION OF APPLICATIONS FOR CONVENTIONAL HOME-PURCHASE LOANS, 1- TO 4-FAMILY AND MANUFACTURED HOMEDWELLINGS, BY INCOME, RACE AND ETHNICITY OF APPLICANT, 2013
MSA/MD: 37964 - PHILADELPHIA, PA
INCOME, RACE AND ETHNICITY (CONTINUED)
ApplicationsReceived 20/
LoansOriginated
Apps. Approved ButNot Accepted
ApplicationsDenied
ApplicationsWithdrawn
Files Closed ForIncompleteness
Number Number Number Number Number Number$000's $000's $000's $000's $000's $000's
Page 3 of 3

LESS THAN 50% OF MSA/MD MEDIAN
RACE 5/AMERICAN INDIAN/ALASKA NATIVE 18 3 28 3 456 5325 1725 355 2614 264 367
ASIAN 291 37 268 71 44711 82895 34185 4283 31213 7517 5697
BLACK OR AFRICAN AMERICAN 613 133 948 205 1262025 155815 45104 11478 74250 16130 8853
NATIVE HAWAIIAN/OTHER PACIFIC ISLND 11 3 27 6 148 3973 943 266 2184 516 64
WHITE 3017 363 2040 634 3106364 734331 328709 42452 252370 75964 34836
2 OR MORE MINORITY RACES 5 2 11 6 125 2137 413 239 919 484 82
JOINT (WHITE/MINORITY RACE) 13 1 14 5 134 3980 1492 80 1776 515 117
RACE NOT AVAILABLE 6/ 560 86 789 217 1701822 191696 55122 10573 84660 24193 17148
ETHNICITY 7/HISPANIC OR LATINO 220 36 306 46 33641 56346 19281 2681 27652 3799 2933
NOT HISPANIC OR LATINO 3763 511 3134 902 4708780 949944 394558 56872 349840 99984 48690
JOINT (HISPANIC OR LATINO/ NOT HISPANIC ORLATINO)
11 3 12 5 233 3771 1345 370 1045 660 351
ETHNICITY NOT AVAILABLE 6/ 534 78 673 194 1521631 170091 52509 9803 71449 21140 15190
MINORITY STATUS 8/WHITE NON-HISPANIC 2789 328 1795 593 2815786 679545 307405 39583 228725 71853 31979
OTHERS, INCLUDING HISPANIC 1163 215 1571 341 2073497 308050 102700 19496 138287 29441 18126
50-79% OF MSA/MD MEDIAN
RACE 5/AMERICAN INDIAN/ALASKA NATIVE 21 2 23 6 557 6058 2387 300 2098 871 402
ASIAN 369 57 225 87 63801 116456 52209 9102 33027 13834 8284
BLACK OR AFRICAN AMERICAN 941 192 988 275 1832579 251349 91033 21193 93061 28191 17871
NATIVE HAWAIIAN/OTHER PACIFIC ISLND 23 2 15 11 152 7351 3472 327 1860 1525 167
WHITE 7195 873 2800 1356 64512869 1856211 990924 133551 434749 205596 91391
2 OR MORE MINORITY RACES 10 3 9 4 228 2814 748 334 1040 415 277
JOINT (WHITE/MINORITY RACE) 49 1 25 9 1094 12696 6855 128 3116 1480 1117
RACE NOT AVAILABLE 6/ 1138 183 896 390 2922899 376681 141001 25493 117328 53448 39411
ETHNICITY 7/HISPANIC OR LATINO 287 47 219 80 44677 77661 32862 5856 24100 10140 4703
NOT HISPANIC OR LATINO 8342 1091 3918 1690 88515926 2190308 1118464 159287 549354 244973 118230
JOINT (HISPANIC OR LATINO/ NOT HISPANIC ORLATINO)
49 8 29 10 4100 13315 5876 1647 3638 1695 459
ETHNICITY NOT AVAILABLE 6/ 1068 167 815 358 2682676 348332 131427 23638 109187 48552 35528
MINORITY STATUS 8/WHITE NON-HISPANIC 6850 822 2596 1272 60312143 1764084 950125 125975 407333 194342 86309
OTHERS, INCLUDING HISPANIC 1723 310 1495 473 3064307 479358 192340 38678 158419 57054 32867
Report Date: 06/02/2014
AGGREGATE TABLE 5-3: DISPOSITION OF APPLICATIONS TO REFINANCE LOANS ON 1- TO 4-FAMILY AND MANUFACTURED HOME DWELLINGS, BY INCOME,RACE AND ETHNICITY OF APPLICANT, 2013
MSA/MD: 37964 - PHILADELPHIA, PA
INCOME, RACE AND ETHNICITY
ApplicationsReceived 20/
LoansOriginated
Apps. Approved ButNot Accepted
ApplicationsDenied
ApplicationsWithdrawn
Files Closed ForIncompleteness
Number Number Number Number Number Number$000's $000's $000's $000's $000's $000's
Page 1 of 3

80-99% OF MSA/MD MEDIAN
RACE 5/AMERICAN INDIAN/ALASKA NATIVE 19 4 8 2 336 5321 2788 861 1274 248 150
ASIAN 233 42 115 52 35477 87667 43361 8296 20082 10070 5858
BLACK OR AFRICAN AMERICAN 526 93 397 138 951249 142346 59165 11734 44284 16885 10278
NATIVE HAWAIIAN/OTHER PACIFIC ISLND 10 1 12 4 128 4163 1649 132 1531 589 262
WHITE 5561 550 1730 847 4789166 1535926 894888 94943 312135 152320 81640
2 OR MORE MINORITY RACES 6 1 1 210 1363 801 135 251 176
JOINT (WHITE/MINORITY RACE) 49 6 17 4 379 14256 8894 791 3341 826 404
RACE NOT AVAILABLE 6/ 822 108 498 224 1851837 283468 119599 18573 81507 34118 29671
ETHNICITY 7/HISPANIC OR LATINO 146 26 96 35 26329 42728 18620 4421 10703 5268 3716
NOT HISPANIC OR LATINO 6211 673 2203 1026 59310706 1744647 984608 112597 374441 177203 95798
JOINT (HISPANIC OR LATINO/ NOT HISPANIC ORLATINO)
45 4 17 10 480 13218 7202 796 2926 1579 715
ETHNICITY NOT AVAILABLE 6/ 824 102 462 202 1771767 273917 120715 17651 76335 31182 28034
MINORITY STATUS 8/WHITE NON-HISPANIC 5352 525 1617 802 4448740 1472240 864045 90645 296578 144545 76427
OTHERS, INCLUDING HISPANIC 1006 172 649 243 1662236 304404 138960 26175 82763 35233 21273
100-119% OF MSA/MD MEDIAN
RACE 5/AMERICAN INDIAN/ALASKA NATIVE 13 3 7 2 126 4199 1869 490 1224 445 171
ASIAN 293 30 93 44 23483 102010 61304 5531 21344 8702 5129
BLACK OR AFRICAN AMERICAN 369 54 267 108 59857 109492 47252 7377 31901 15700 7262
NATIVE HAWAIIAN/OTHER PACIFIC ISLND 12 214 1888 1545 343
WHITE 5411 571 1372 838 4068598 1569822 957460 109777 266250 162029 74306
2 OR MORE MINORITY RACES 4 2 1 18 967 668 128 97 74
JOINT (WHITE/MINORITY RACE) 63 11 15 4 598 18301 11882 2205 2667 638 909
RACE NOT AVAILABLE 6/ 791 91 364 184 1471577 271872 128714 17497 66275 33955 25431
ETHNICITY 7/HISPANIC OR LATINO 111 18 58 23 10220 33874 17662 2751 8289 3623 1549
NOT HISPANIC OR LATINO 5976 647 1684 964 4819752 1754373 1051595 121991 312961 182195 85631
JOINT (HISPANIC OR LATINO/ NOT HISPANIC ORLATINO)
67 4 21 11 5108 19875 11776 731 4234 2043 1091
ETHNICITY NOT AVAILABLE 6/ 802 93 357 183 1461581 270429 129661 17747 64305 33705 25011
MINORITY STATUS 8/WHITE NON-HISPANIC 5190 543 1282 791 3878193 1502472 920232 105264 251977 154047 70952
OTHERS, INCLUDING HISPANIC 910 121 456 191 1011779 284637 150860 19345 68173 30785 15474
Report Date: 06/02/2014
AGGREGATE TABLE 5-3: DISPOSITION OF APPLICATIONS TO REFINANCE LOANS ON 1- TO 4-FAMILY AND MANUFACTURED HOME DWELLINGS, BY INCOME,RACE AND ETHNICITY OF APPLICANT, 2013
MSA/MD: 37964 - PHILADELPHIA, PA
INCOME, RACE AND ETHNICITY (CONTINUED)
ApplicationsReceived 20/
LoansOriginated
Apps. Approved ButNot Accepted
ApplicationsDenied
ApplicationsWithdrawn
Files Closed ForIncompleteness
Number Number Number Number Number Number$000's $000's $000's $000's $000's $000's
Page 2 of 3

120% OR MORE OF MSA/MD MEDIAN
RACE 5/AMERICAN INDIAN/ALASKA NATIVE 34 6 12 11 568 15679 7293 1853 2758 2792 983
ASIAN 1562 151 390 230 1302463 682950 437610 42148 105572 63680 33940
BLACK OR AFRICAN AMERICAN 857 111 533 213 1101824 348800 166268 24753 98138 39739 19902
NATIVE HAWAIIAN/OTHER PACIFIC ISLND 37 2 13 7 261 14386 8337 700 3153 1673 523
WHITE 26798 2387 5800 3542 182540352 10618822 6936236 631598 1596794 965879 488315
2 OR MORE MINORITY RACES 8 3 10 2 528 8104 2604 628 3689 414 769
JOINT (WHITE/MINORITY RACE) 478 40 119 56 30723 189687 130664 8915 28490 14289 7329
RACE NOT AVAILABLE 6/ 4064 408 1198 847 6277144 1846470 1048988 102165 326109 210810 158398
ETHNICITY 7/HISPANIC OR LATINO 327 39 148 80 29623 139858 73346 9999 31539 17896 7078
NOT HISPANIC OR LATINO 28972 2621 6656 3942 205644247 11585838 7495860 692484 1794281 1060411 542802
JOINT (HISPANIC OR LATINO/ NOT HISPANIC ORLATINO)
409 32 102 56 25624 156746 104343 8070 23928 14183 6222
ETHNICITY NOT AVAILABLE 6/ 4130 416 1169 830 6247169 1842456 1064451 102207 314955 206786 154057
MINORITY STATUS 8/WHITE NON-HISPANIC 25788 2286 5498 3380 174738699 10208351 6682649 606705 1524792 924634 469571
OTHERS, INCLUDING HISPANIC 3642 380 1300 642 3286292 1532076 916142 96207 292702 151860 75165
67689 7267 24120 12134 6834118044 23686158 13960137 1477257 4506008 2437637 1305119TOTAL 14/
Report Date: 06/02/2014
AGGREGATE TABLE 5-3: DISPOSITION OF APPLICATIONS TO REFINANCE LOANS ON 1- TO 4-FAMILY AND MANUFACTURED HOME DWELLINGS, BY INCOME,RACE AND ETHNICITY OF APPLICANT, 2013
MSA/MD: 37964 - PHILADELPHIA, PA
INCOME, RACE AND ETHNICITY (CONTINUED)
ApplicationsReceived 20/
LoansOriginated
Apps. Approved ButNot Accepted
ApplicationsDenied
ApplicationsWithdrawn
Files Closed ForIncompleteness
Number Number Number Number Number Number$000's $000's $000's $000's $000's $000's
Page 3 of 3

LESS THAN 50% OF MSA/MD MEDIAN
RACE 5/AMERICAN INDIAN/ALASKA NATIVE 4 37 142 931 80 831 20
ASIAN 36 3 94 4 1138 5350 1698 38 3462 102 50
BLACK OR AFRICAN AMERICAN 262 19 1408 31 271747 26541 4284 225 19926 1226 880
NATIVE HAWAIIAN/OTHER PACIFIC ISLND 5 2 4350 1142 166 70 906
WHITE 451 23 952 56 211503 45761 15846 764 25189 2647 1315
2 OR MORE MINORITY RACES 2 1012 223 42 181
JOINT (WHITE/MINORITY RACE) 66 380 380
RACE NOT AVAILABLE 6/ 179 9 513 35 10746 10556 1889 166 7324 653 524
ETHNICITY 7/HISPANIC OR LATINO 68 7 382 10 3470 8202 1140 446 6192 289 135
NOT HISPANIC OR LATINO 696 46 2188 77 463053 72180 20963 727 44774 3531 2185
JOINT (HISPANIC OR LATINO/ NOT HISPANIC ORLATINO)
1 56 398 15 383
ETHNICITY NOT AVAILABLE 6/ 174 3 488 40 10715 10104 1887 90 6850 828 449
MINORITY STATUS 8/WHITE NON-HISPANIC 402 18 721 46 201207 40256 15039 349 21297 2286 1285
OTHERS, INCLUDING HISPANIC 367 31 1907 44 312380 41296 7168 779 30692 1592 1065
50-79% OF MSA/MD MEDIAN
RACE 5/AMERICAN INDIAN/ALASKA NATIVE 2 16 1 120 265 19 186 10 50
ASIAN 16 4 62 1 184 4284 860 122 3132 120 50
BLACK OR AFRICAN AMERICAN 221 21 611 34 19906 22350 5410 871 13744 1397 928
NATIVE HAWAIIAN/OTHER PACIFIC ISLND 4 14 119 689 230 389 70
WHITE 803 45 691 89 431671 78319 42560 1841 24113 6343 3462
2 OR MORE MINORITY RACES 2 68 212 48 164
JOINT (WHITE/MINORITY RACE) 4 3 18 436 342 24 70
RACE NOT AVAILABLE 6/ 232 14 336 34 8624 14710 4865 368 7386 1482 609
ETHNICITY 7/HISPANIC OR LATINO 53 4 120 3 3183 5132 1790 88 2967 137 150
NOT HISPANIC OR LATINO 997 69 1279 121 602526 100916 47511 2805 38586 7699 4315
JOINT (HISPANIC OR LATINO/ NOT HISPANIC ORLATINO)
5 510 364 185 179
ETHNICITY NOT AVAILABLE 6/ 229 11 335 37 9621 14853 4848 309 7406 1656 634
MINORITY STATUS 8/WHITE NON-HISPANIC 752 43 598 87 401520 73944 40796 1795 21710 6306 3337
OTHERS, INCLUDING HISPANIC 300 29 815 39 231206 32900 8628 1081 20384 1679 1128
Report Date: 06/02/2014
AGGREGATE TABLE 5-4: DISPOSITION OF APPLICATIONS FOR HOME IMPROVEMENT LOANS, 1- TO 4-FAMILY AND MANUFACTURED HOME DWELLINGS, BYINCOME, RACE AND ETHNICITY OF APPLICANT, 2013
MSA/MD: 37964 - PHILADELPHIA, PA
INCOME, RACE AND ETHNICITY
ApplicationsReceived 20/
LoansOriginated
Apps. Approved ButNot Accepted
ApplicationsDenied
ApplicationsWithdrawn
Files Closed ForIncompleteness
Number Number Number Number Number Number$000's $000's $000's $000's $000's $000's
Page 1 of 3

80-99% OF MSA/MD MEDIAN
RACE 5/AMERICAN INDIAN/ALASKA NATIVE 3 47 481 85 396
ASIAN 13 2 22 2 241 1913 623 75 1015 40 160
BLACK OR AFRICAN AMERICAN 84 6 205 20 9324 10120 3172 202 5138 864 744
NATIVE HAWAIIAN/OTHER PACIFIC ISLND 2 4 17 78 8 60 10
WHITE 584 40 311 69 311035 63519 40374 2025 12838 4829 3453
2 OR MORE MINORITY RACES 55 258 258
JOINT (WHITE/MINORITY RACE) 5 1 7 114 588 275 75 88 150
RACE NOT AVAILABLE 6/ 111 7 113 21 11263 9650 4001 90 3589 1272 698
ETHNICITY 7/HISPANIC OR LATINO 18 48 2 169 2255 691 1243 221 100
NOT HISPANIC OR LATINO 662 49 511 89 401351 74267 43610 2271 18633 5716 4037
JOINT (HISPANIC OR LATINO/ NOT HISPANIC ORLATINO)
2 1 4 18 255 90 75 80 10
ETHNICITY NOT AVAILABLE 6/ 120 6 108 22 12268 9830 4147 121 3426 1218 918
MINORITY STATUS 8/WHITE NON-HISPANIC 559 39 278 66 30972 61358 39477 1975 11831 4722 3353
OTHERS, INCLUDING HISPANIC 126 9 289 27 12463 15551 4904 352 7996 1295 1004
100-119% OF MSA/MD MEDIAN
RACE 5/AMERICAN INDIAN/ALASKA NATIVE 3 1 59 395 295 10 90
ASIAN 18 4 14 1 239 3203 1411 626 958 40 168
BLACK OR AFRICAN AMERICAN 73 6 87 11 6183 6097 2670 181 2612 339 295
NATIVE HAWAIIAN/OTHER PACIFIC ISLND 33 95 95
WHITE 500 35 240 50 23848 62614 41719 2241 11211 4324 3119
2 OR MORE MINORITY RACES 22 163 163
JOINT (WHITE/MINORITY RACE) 4 2 5 112 1170 595 289 209 77
RACE NOT AVAILABLE 6/ 106 7 85 17 12227 9020 5082 113 2245 1163 417
ETHNICITY 7/HISPANIC OR LATINO 18 17 136 1236 739 464 33
NOT HISPANIC OR LATINO 565 54 337 59 311046 72360 46372 3458 14488 4530 3512
JOINT (HISPANIC OR LATINO/ NOT HISPANIC ORLATINO)
6 2 19 514 199 238 77
ETHNICITY NOT AVAILABLE 6/ 115 1 85 19 12232 8647 4462 2 2393 1303 487
MINORITY STATUS 8/WHITE NON-HISPANIC 471 35 222 48 21797 61092 40904 2241 10739 4184 3024
OTHERS, INCLUDING HISPANIC 117 13 129 13 8280 12218 5724 1106 4469 456 463
Report Date: 06/02/2014
AGGREGATE TABLE 5-4: DISPOSITION OF APPLICATIONS FOR HOME IMPROVEMENT LOANS, 1- TO 4-FAMILY AND MANUFACTURED HOME DWELLINGS, BYINCOME, RACE AND ETHNICITY OF APPLICANT, 2013
MSA/MD: 37964 - PHILADELPHIA, PA
INCOME, RACE AND ETHNICITY (CONTINUED)
ApplicationsReceived 20/
LoansOriginated
Apps. Approved ButNot Accepted
ApplicationsDenied
ApplicationsWithdrawn
Files Closed ForIncompleteness
Number Number Number Number Number Number$000's $000's $000's $000's $000's $000's
Page 2 of 3

120% OR MORE OF MSA/MD MEDIAN
RACE 5/AMERICAN INDIAN/ALASKA NATIVE 5 6 213 449 115 121 213
ASIAN 72 11 51 13 9156 16724 8551 1303 4654 1710 506
BLACK OR AFRICAN AMERICAN 102 9 171 16 10308 18766 7332 946 8186 1729 573
NATIVE HAWAIIAN/OTHER PACIFIC ISLND 5 4 110 636 246 290 100
WHITE 2394 150 856 220 1163736 418893 282554 15766 68206 33388 18979
2 OR MORE MINORITY RACES 2 1 5 19 813 450 129 209 25
JOINT (WHITE/MINORITY RACE) 47 4 21 5 279 7922 4444 665 1971 682 160
RACE NOT AVAILABLE 6/ 374 21 203 65 29692 70980 48160 1450 12353 6032 2985
ETHNICITY 7/HISPANIC OR LATINO 35 4 37 8 286 7753 2433 530 3142 1258 390
NOT HISPANIC OR LATINO 2522 170 1042 246 1344114 443716 293235 18201 76246 36706 19328
JOINT (HISPANIC OR LATINO/ NOT HISPANIC ORLATINO)
40 2 23 4 170 7812 5740 121 1281 590 80
ETHNICITY NOT AVAILABLE 6/ 404 20 215 64 30733 75902 50444 1407 15321 5300 3430
MINORITY STATUS 8/WHITE NON-HISPANIC 2294 143 800 206 1123555 398015 272220 15129 60982 31527 18157
OTHERS, INCLUDING HISPANIC 300 31 302 47 25705 59630 28894 3694 19421 5887 1734
6899 461 7872 816 40016448 968758 562177 33349 258278 73940 41014TOTAL 14/
Report Date: 06/02/2014
AGGREGATE TABLE 5-4: DISPOSITION OF APPLICATIONS FOR HOME IMPROVEMENT LOANS, 1- TO 4-FAMILY AND MANUFACTURED HOME DWELLINGS, BYINCOME, RACE AND ETHNICITY OF APPLICANT, 2013
MSA/MD: 37964 - PHILADELPHIA, PA
INCOME, RACE AND ETHNICITY (CONTINUED)
ApplicationsReceived 20/
LoansOriginated
Apps. Approved ButNot Accepted
ApplicationsDenied
ApplicationsWithdrawn
Files Closed ForIncompleteness
Number Number Number Number Number Number$000's $000's $000's $000's $000's $000's
Page 3 of 3

LESS THAN 50% OF MSA/MD MEDIAN
RACE 5/AMERICAN INDIAN/ALASKA NATIVE 5 611 711 544 167
ASIAN 115 10 51 11 15202 24657 14836 1073 4820 1287 2641
BLACK OR AFRICAN AMERICAN 48 7 227 25 8315 13520 4017 687 6881 1530 405
NATIVE HAWAIIAN/OTHER PACIFIC ISLND 1 13 216 1184 245 688 251
WHITE 343 32 241 53 16685 70387 39056 3620 20532 5482 1697
2 OR MORE MINORITY RACES 1 12 154 153 1
JOINT (WHITE/MINORITY RACE) 1 12 185 130 55
RACE NOT AVAILABLE 6/ 57 6 104 24 7198 15649 5551 362 6661 2357 718
ETHNICITY 7/HISPANIC OR LATINO 32 6 73 4 1116 6551 2999 283 2944 255 70
NOT HISPANIC OR LATINO 477 48 482 91 371135 105615 54982 5501 31611 8849 4672
JOINT (HISPANIC OR LATINO/ NOT HISPANIC ORLATINO)
3 25 326 238 88
ETHNICITY NOT AVAILABLE 6/ 57 3 87 20 8175 13955 5915 356 5162 1803 719
MINORITY STATUS 8/WHITE NON-HISPANIC 312 27 201 51 15606 64397 35696 3293 18395 5367 1646
OTHERS, INCLUDING HISPANIC 197 25 356 42 24644 46055 22067 2441 15108 3323 3116
50-79% OF MSA/MD MEDIAN
RACE 5/AMERICAN INDIAN/ALASKA NATIVE 2 1 4 18 630 142 162 205 121
ASIAN 100 13 42 13 13181 21864 11964 2485 4636 1451 1328
BLACK OR AFRICAN AMERICAN 95 22 177 22 12328 22627 7378 1725 11058 1568 898
NATIVE HAWAIIAN/OTHER PACIFIC ISLND 2 5 29 489 58 344 87
WHITE 640 65 287 97 471136 137338 78814 7930 33778 11916 4900
2 OR MORE MINORITY RACES 1 1 13 161 61 50 50
JOINT (WHITE/MINORITY RACE) 3 4 2 110 1024 517 316 156 35
RACE NOT AVAILABLE 6/ 112 18 109 37 16292 28938 11482 1603 9464 4230 2159
ETHNICITY 7/HISPANIC OR LATINO 49 4 39 10 6108 8975 5070 437 2211 843 414
NOT HISPANIC OR LATINO 800 98 485 131 671581 176429 94555 11463 48330 15173 6908
JOINT (HISPANIC OR LATINO/ NOT HISPANIC ORLATINO)
3 2 27 1148 232 640 276
ETHNICITY NOT AVAILABLE 6/ 103 16 103 32 17271 26519 10559 1415 9034 3392 2119
MINORITY STATUS 8/WHITE NON-HISPANIC 595 62 260 89 431049 129035 74057 7244 31749 11249 4736
OTHERS, INCLUDING HISPANIC 251 41 268 48 32640 55653 24881 5165 18857 4075 2675
Report Date: 06/02/2014
AGGREGATE TABLE 5-6: DISPOSITION OF APPLICATIONS FROM NONOCCUPANTS FOR HOME-PURCHASE, HOME IMPROVEMENT, OR REFINANCING LOANS,1- TO 4-FAMILY AND MANUFACTURED HOME DWELLINGS, BY INCOME, RACE AND ETHNICITY OF APPLICANT, 2013
MSA/MD: 37964 - PHILADELPHIA, PA
INCOME, RACE AND ETHNICITY
ApplicationsReceived 20/
LoansOriginated
Apps. Approved ButNot Accepted
ApplicationsDenied
ApplicationsWithdrawn
Files Closed ForIncompleteness
Number Number Number Number Number Number$000's $000's $000's $000's $000's $000's
Page 1 of 3

80-99% OF MSA/MD MEDIAN
RACE 5/AMERICAN INDIAN/ALASKA NATIVE 11 200 200
ASIAN 58 12 25 8 7110 16923 8572 2502 3223 1408 1218
BLACK OR AFRICAN AMERICAN 71 13 89 22 12207 14927 6064 869 5352 1751 891
NATIVE HAWAIIAN/OTHER PACIFIC ISLND 11 250 250
WHITE 484 54 170 71 39818 105871 62792 6569 20956 10973 4581
2 OR MORE MINORITY RACES 1 1 13 193 135 15 43
JOINT (WHITE/MINORITY RACE) 1 12 206 128 78
RACE NOT AVAILABLE 6/ 98 11 54 32 13208 22856 10316 1468 5425 3911 1736
ETHNICITY 7/HISPANIC OR LATINO 25 2 19 3 453 4847 2537 253 1049 518 490
NOT HISPANIC OR LATINO 588 78 273 103 571099 134774 74365 9815 29529 14445 6620
JOINT (HISPANIC OR LATINO/ NOT HISPANIC ORLATINO)
66 577 577
ETHNICITY NOT AVAILABLE 6/ 93 11 50 28 10192 21228 10393 1475 4921 3123 1316
MINORITY STATUS 8/WHITE NON-HISPANIC 450 52 157 68 35762 99732 58709 6388 20006 10538 4091
OTHERS, INCLUDING HISPANIC 158 27 133 34 23375 37672 17685 3624 10044 3720 2599
100-119% OF MSA/MD MEDIAN
RACE 5/AMERICAN INDIAN/ALASKA NATIVE 1 2 14 855 85 599 171
ASIAN 57 8 18 13 298 13055 7806 704 2491 1817 237
BLACK OR AFRICAN AMERICAN 70 10 61 14 10165 14624 7078 802 4749 1164 831
NATIVE HAWAIIAN/OTHER PACIFIC ISLND 11 116 116
WHITE 511 51 153 72 37824 112348 69121 6384 20357 10712 5774
2 OR MORE MINORITY RACES 1 1 13 440 290 53 97
JOINT (WHITE/MINORITY RACE) 3 1 1 27 807 271 180 60 296
RACE NOT AVAILABLE 6/ 91 11 42 18 11173 21272 12166 871 5052 2008 1175
ETHNICITY 7/HISPANIC OR LATINO 22 2 12 4 343 4604 2772 93 1103 469 167
NOT HISPANIC OR LATINO 616 68 221 98 481051 136458 81237 7896 26899 13535 6891
JOINT (HISPANIC OR LATINO/ NOT HISPANIC ORLATINO)
7 2 110 1378 924 377 77
ETHNICITY NOT AVAILABLE 6/ 89 12 43 17 10171 21077 11915 1037 4982 2013 1130
MINORITY STATUS 8/WHITE NON-HISPANIC 485 48 137 65 35770 106170 65761 6221 18790 9746 5652
OTHERS, INCLUDING HISPANIC 155 21 97 34 16323 34933 18471 1781 9432 3843 1406
Report Date: 06/02/2014
AGGREGATE TABLE 5-6: DISPOSITION OF APPLICATIONS FROM NONOCCUPANTS FOR HOME-PURCHASE, HOME IMPROVEMENT, OR REFINANCING LOANS,1- TO 4-FAMILY AND MANUFACTURED HOME DWELLINGS, BY INCOME, RACE AND ETHNICITY OF APPLICANT, 2013
MSA/MD: 37964 - PHILADELPHIA, PA
INCOME, RACE AND ETHNICITY (CONTINUED)
ApplicationsReceived 20/
LoansOriginated
Apps. Approved ButNot Accepted
ApplicationsDenied
ApplicationsWithdrawn
Files Closed ForIncompleteness
Number Number Number Number Number Number$000's $000's $000's $000's $000's $000's
Page 2 of 3

120% OR MORE OF MSA/MD MEDIAN
RACE 5/AMERICAN INDIAN/ALASKA NATIVE 14 5 423 4506 2678 911 917
ASIAN 492 46 130 77 38783 144196 90236 7622 23288 15161 7889
BLACK OR AFRICAN AMERICAN 193 30 140 54 17434 49479 22395 3607 14504 6681 2292
NATIVE HAWAIIAN/OTHER PACIFIC ISLND 14 1 6 324 3986 2397 104 849 636
WHITE 3664 343 946 544 2565753 1067017 666097 72263 170811 106718 51128
2 OR MORE MINORITY RACES 3 3 410 1348 318 336 694
JOINT (WHITE/MINORITY RACE) 62 7 18 4 293 15718 11372 593 2353 1044 356
RACE NOT AVAILABLE 6/ 606 97 227 129 781137 214550 116718 19891 43012 20635 14294
ETHNICITY 7/HISPANIC OR LATINO 75 11 39 15 7147 24859 12452 2583 5802 2273 1749
NOT HISPANIC OR LATINO 4331 415 1192 665 3046907 1249876 776419 81367 204079 128060 59951
JOINT (HISPANIC OR LATINO/ NOT HISPANIC ORLATINO)
46 2 14 7 574 13353 7775 497 2543 1325 1213
ETHNICITY NOT AVAILABLE 6/ 596 96 230 128 791129 212712 115565 19633 43640 20134 13740
MINORITY STATUS 8/WHITE NON-HISPANIC 3523 325 891 518 2435500 1019714 639257 68373 161559 102576 47949
OTHERS, INCLUDING HISPANIC 887 97 344 162 711561 254347 148497 15006 49326 27669 13849
9307 962 3735 1474 71216190 2619607 1619382 167082 477654 240623 114866TOTAL 14/
Report Date: 06/02/2014
AGGREGATE TABLE 5-6: DISPOSITION OF APPLICATIONS FROM NONOCCUPANTS FOR HOME-PURCHASE, HOME IMPROVEMENT, OR REFINANCING LOANS,1- TO 4-FAMILY AND MANUFACTURED HOME DWELLINGS, BY INCOME, RACE AND ETHNICITY OF APPLICANT, 2013
MSA/MD: 37964 - PHILADELPHIA, PA
INCOME, RACE AND ETHNICITY (CONTINUED)
ApplicationsReceived 20/
LoansOriginated
Apps. Approved ButNot Accepted
ApplicationsDenied
ApplicationsWithdrawn
Files Closed ForIncompleteness
Number Number Number Number Number Number$000's $000's $000's $000's $000's $000's
Page 3 of 3

LESS THAN 50% OF MSA/MD MEDIAN
RACE 5/AMERICAN INDIAN/ALASKA NATIVE 11 44 44
ASIAN 2 13 30 20 10
BLACK OR AFRICAN AMERICAN 1 10 112 131 19 87 25
NATIVE HAWAIIAN/OTHER PACIFIC ISLND
WHITE 28 27 68 3126 4946 963 987 2703 293
2 OR MORE MINORITY RACES
JOINT (WHITE/MINORITY RACE)
RACE NOT AVAILABLE 6/ 1 1 810 394 47 56 291
ETHNICITY 7/HISPANIC OR LATINO 1 1 7 110 518 47 56 317 98
NOT HISPANIC OR LATINO 28 25 67 4124 4377 952 915 2280 230
JOINT (HISPANIC OR LATINO/ NOT HISPANIC ORLATINO)
ETHNICITY NOT AVAILABLE 6/ 1 2 1518 650 30 72 548
MINORITY STATUS 8/WHITE NON-HISPANIC 27 25 55 2109 4216 933 915 2173 195
OTHERS, INCLUDING HISPANIC 2 1 19 325 679 66 56 424 133
50-79% OF MSA/MD MEDIAN
RACE 5/AMERICAN INDIAN/ALASKA NATIVE
ASIAN 1 12 150 125 25
BLACK OR AFRICAN AMERICAN 2 2 15 88 58 15 15
NATIVE HAWAIIAN/OTHER PACIFIC ISLND 11 50 50
WHITE 63 60 78 5 6212 12655 3557 3831 4280 337 650
2 OR MORE MINORITY RACES
JOINT (WHITE/MINORITY RACE) 1 12 80 40 40
RACE NOT AVAILABLE 6/ 2 8 616 1049 80 350 619
ETHNICITY 7/HISPANIC OR LATINO 4 2 3 110 591 246 127 154 64
NOT HISPANIC OR LATINO 59 55 76 4 7201 12052 3371 3553 4190 273 665
JOINT (HISPANIC OR LATINO/ NOT HISPANIC ORLATINO)
2 13 123 63 60
ETHNICITY NOT AVAILABLE 6/ 4 11 924 1306 180 501 625
MINORITY STATUS 8/WHITE NON-HISPANIC 56 55 72 4 6193 11643 3204 3553 3963 273 650
OTHERS, INCLUDING HISPANIC 10 2 8 1 122 1032 532 127 294 64 15
Report Date: 06/02/2014
AGGREGATE TABLE 5-7: DISPOSITION OF APPLICATIONS FOR HOME-PURCHASE, HOME IMPROVEMENT, OR REFINANCING LOANS, MANUFACTURED HOMEDWELLINGS, BY INCOME, RACE AND ETHNICITY OF APPLICANT, 2013
MSA/MD: 37964 - PHILADELPHIA, PA
INCOME, RACE AND ETHNICITY
ApplicationsReceived 20/
LoansOriginated
Apps. Approved ButNot Accepted
ApplicationsDenied
ApplicationsWithdrawn
Files Closed ForIncompleteness
Number Number Number Number Number Number$000's $000's $000's $000's $000's $000's
Page 1 of 3

80-99% OF MSA/MD MEDIAN
RACE 5/AMERICAN INDIAN/ALASKA NATIVE
ASIAN 11 9 9
BLACK OR AFRICAN AMERICAN 2 24 119 54 65
NATIVE HAWAIIAN/OTHER PACIFIC ISLND
WHITE 19 17 14 151 3575 1549 978 1003 45
2 OR MORE MINORITY RACES
JOINT (WHITE/MINORITY RACE) 11 61 61
RACE NOT AVAILABLE 6/ 11 27 27
ETHNICITY 7/HISPANIC OR LATINO 33 76 76
NOT HISPANIC OR LATINO 21 17 13 152 3581 1603 978 955 45
JOINT (HISPANIC OR LATINO/ NOT HISPANIC ORLATINO)
ETHNICITY NOT AVAILABLE 6/ 1 23 134 27 107
MINORITY STATUS 8/WHITE NON-HISPANIC 19 17 9 146 3392 1549 978 820 45
OTHERS, INCLUDING HISPANIC 2 79 265 54 211
100-119% OF MSA/MD MEDIAN
RACE 5/AMERICAN INDIAN/ALASKA NATIVE
ASIAN
BLACK OR AFRICAN AMERICAN 11 20 20
NATIVE HAWAIIAN/OTHER PACIFIC ISLND
WHITE 14 8 10 133 2516 1232 587 547 150
2 OR MORE MINORITY RACES
JOINT (WHITE/MINORITY RACE)
RACE NOT AVAILABLE 6/ 11 10 10
ETHNICITY 7/HISPANIC OR LATINO
NOT HISPANIC OR LATINO 14 8 9 132 2362 1232 558 422 150
JOINT (HISPANIC OR LATINO/ NOT HISPANIC ORLATINO)
ETHNICITY NOT AVAILABLE 6/ 1 1 13 184 10 49 125
MINORITY STATUS 8/WHITE NON-HISPANIC 14 7 9 131 2342 1232 538 422 150
OTHERS, INCLUDING HISPANIC 11 20 20
Report Date: 06/02/2014
AGGREGATE TABLE 5-7: DISPOSITION OF APPLICATIONS FOR HOME-PURCHASE, HOME IMPROVEMENT, OR REFINANCING LOANS, MANUFACTURED HOMEDWELLINGS, BY INCOME, RACE AND ETHNICITY OF APPLICANT, 2013
MSA/MD: 37964 - PHILADELPHIA, PA
INCOME, RACE AND ETHNICITY (CONTINUED)
ApplicationsReceived 20/
LoansOriginated
Apps. Approved ButNot Accepted
ApplicationsDenied
ApplicationsWithdrawn
Files Closed ForIncompleteness
Number Number Number Number Number Number$000's $000's $000's $000's $000's $000's
Page 2 of 3
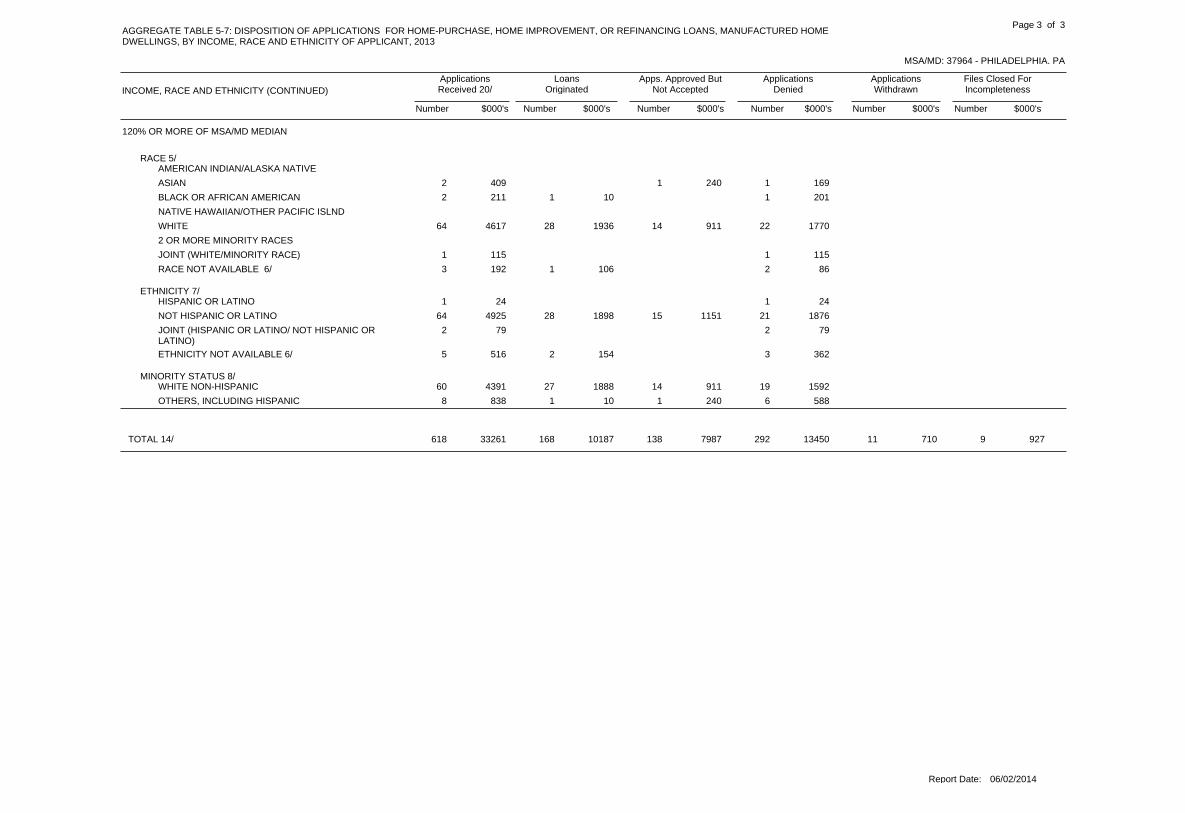
120% OR MORE OF MSA/MD MEDIAN
RACE 5/AMERICAN INDIAN/ALASKA NATIVE
ASIAN 1 12 409 240 169
BLACK OR AFRICAN AMERICAN 1 12 211 10 201
NATIVE HAWAIIAN/OTHER PACIFIC ISLND
WHITE 28 14 2264 4617 1936 911 1770
2 OR MORE MINORITY RACES
JOINT (WHITE/MINORITY RACE) 11 115 115
RACE NOT AVAILABLE 6/ 1 23 192 106 86
ETHNICITY 7/HISPANIC OR LATINO 11 24 24
NOT HISPANIC OR LATINO 28 15 2164 4925 1898 1151 1876
JOINT (HISPANIC OR LATINO/ NOT HISPANIC ORLATINO)
22 79 79
ETHNICITY NOT AVAILABLE 6/ 2 35 516 154 362
MINORITY STATUS 8/WHITE NON-HISPANIC 27 14 1960 4391 1888 911 1592
OTHERS, INCLUDING HISPANIC 1 1 68 838 10 240 588
168 138 292 11 9618 33261 10187 7987 13450 710 927TOTAL 14/
Report Date: 06/02/2014
AGGREGATE TABLE 5-7: DISPOSITION OF APPLICATIONS FOR HOME-PURCHASE, HOME IMPROVEMENT, OR REFINANCING LOANS, MANUFACTURED HOMEDWELLINGS, BY INCOME, RACE AND ETHNICITY OF APPLICANT, 2013
MSA/MD: 37964 - PHILADELPHIA, PA
INCOME, RACE AND ETHNICITY (CONTINUED)
ApplicationsReceived 20/
LoansOriginated
Apps. Approved ButNot Accepted
ApplicationsDenied
ApplicationsWithdrawn
Files Closed ForIncompleteness
Number Number Number Number Number Number$000's $000's $000's $000's $000's $000's
Page 3 of 3

RACIAL/ETHNIC COMPOSITION 11/
LESS THAN 10% MINORITY 2138 99 316 244 632860 656594 497228 22535 68484 55211 13136
10-19% MINORITY 2381 115 384 276 793235 695755 512072 23577 80925 62154 17027
20-49% MINORITY 2257 100 411 237 763081 561600 410084 18140 75957 43098 14321
50-79% MINORITY 812 38 209 97 501206 178671 120001 5328 31303 15349 6690
80-100% MINORITY 1245 69 415 174 701973 224311 143929 7999 44687 19660 8036
INCOME CHARACTERISTICS 12/ 13/
LOW INCOME 814 34 276 113 481285 146873 95526 3580 29863 12967 4937
MODERATE INCOME 2056 91 483 224 792933 394607 279085 12133 62281 30885 10223
MIDDLE INCOME 3499 186 582 378 1374782 906006 668301 33917 105324 73174 25290
UPPER INCOME 2461 110 392 313 743350 868484 639815 27949 103514 78446 18760
INCOME & RACIAL/ETHNIC COMP 11/ 12/ 13/
LOW INCOME
LESS THAN 10% MINORITY
10-19% MINORITY
20-49% MINORITY 36 1 5 244 5773 4853 123 527 270
50-79% MINORITY 212 7 67 24 14324 44111 29475 740 9026 3214 1656
80-100% MINORITY 566 26 204 87 34917 96989 61198 2717 20310 9483 3281
MODERATE INCOME
LESS THAN 10% MINORITY 87 18 4 2111 15979 12142 2827 787 223
10-19% MINORITY 239 7 43 22 10321 51461 38270 1400 6513 3805 1473
20-49% MINORITY 787 33 152 76 201068 152691 113303 4592 21089 11083 2624
50-79% MINORITY 365 17 84 40 18524 69154 47613 2030 11516 5841 2154
80-100% MINORITY 578 34 186 82 29909 105322 67757 4111 20336 9369 3749
MIDDLE INCOME
LESS THAN 10% MINORITY 1002 52 155 111 371357 264404 197900 9864 27641 22108 6891
10-19% MINORITY 1221 66 185 130 401642 315751 236519 12166 33592 25659 7815
20-49% MINORITY 975 47 167 105 401334 250518 183546 8625 30958 19808 7581
50-79% MINORITY 200 12 50 27 13302 53333 35362 2091 9092 4791 1997
80-100% MINORITY 101 9 25 5 7147 22000 14974 1171 4041 808 1006
UPPER INCOME
LESS THAN 10% MINORITY 1048 47 143 129 241391 376113 287088 12671 38016 32316 6022
10-19% MINORITY 921 42 156 124 291272 328543 237283 10011 40820 32690 7739
20-49% MINORITY 458 19 86 54 16633 152063 108112 4800 23098 11937 4116
50-79% MINORITY 34 2 7 6 554 11765 7332 467 1580 1503 883
80-100% MINORITY
SMALL COUNTY
3 25 961 587 374ALL OTHER TRACTS 21/
8833 421 1735 1028 33812355 2316931 1683314 77579 301356 195472 59210TOTAL 14/
Report Date: 06/02/2014
AGGREGATE TABLE 7-1: DISPOSITION OF APPLICATIONS FOR FHA, FSA/RHS, AND VA HOME-PURCHASE LOANS, 1- TO 4-FAMILY AND MANUFACTUREDHOME DWELLINGS, BY CHARACTERISTICS OF CENSUS TRACT IN WHICH PROPERTY IS LOCATED, 2013
MSA/MD: 37964 - PHILADELPHIA, PA
TYPE OF CENSUS TRACT 10/
ApplicationsReceived 20/
LoansOriginated
Apps. Approved ButNot Accepted
ApplicationsDenied
ApplicationsWithdrawn
Files Closed ForIncompleteness
Number Number Number Number Number Number$000's $000's $000's $000's $000's $000's
Page 1 of 1
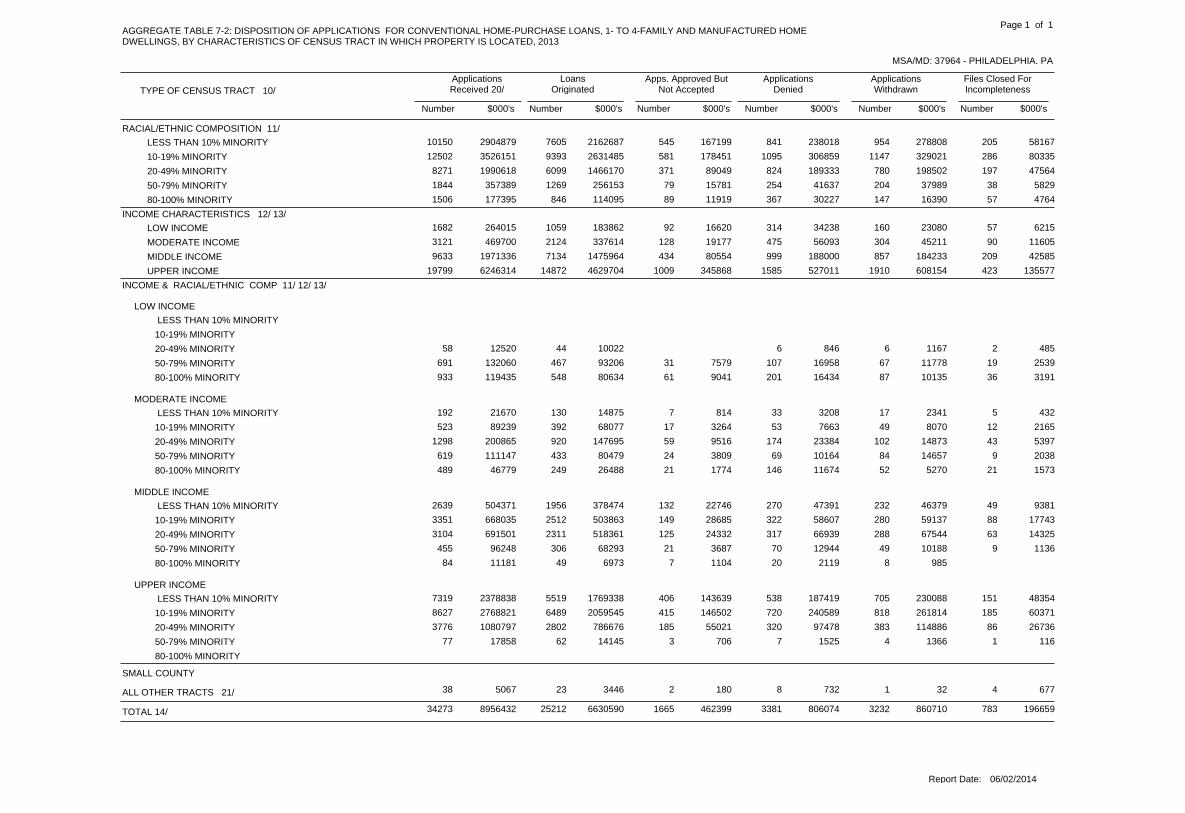
RACIAL/ETHNIC COMPOSITION 11/
LESS THAN 10% MINORITY 7605 545 841 954 20510150 2904879 2162687 167199 238018 278808 58167
10-19% MINORITY 9393 581 1095 1147 28612502 3526151 2631485 178451 306859 329021 80335
20-49% MINORITY 6099 371 824 780 1978271 1990618 1466170 89049 189333 198502 47564
50-79% MINORITY 1269 79 254 204 381844 357389 256153 15781 41637 37989 5829
80-100% MINORITY 846 89 367 147 571506 177395 114095 11919 30227 16390 4764
INCOME CHARACTERISTICS 12/ 13/
LOW INCOME 1059 92 314 160 571682 264015 183862 16620 34238 23080 6215
MODERATE INCOME 2124 128 475 304 903121 469700 337614 19177 56093 45211 11605
MIDDLE INCOME 7134 434 999 857 2099633 1971336 1475964 80554 188000 184233 42585
UPPER INCOME 14872 1009 1585 1910 42319799 6246314 4629704 345868 527011 608154 135577
INCOME & RACIAL/ETHNIC COMP 11/ 12/ 13/
LOW INCOME
LESS THAN 10% MINORITY
10-19% MINORITY
20-49% MINORITY 44 6 6 258 12520 10022 846 1167 485
50-79% MINORITY 467 31 107 67 19691 132060 93206 7579 16958 11778 2539
80-100% MINORITY 548 61 201 87 36933 119435 80634 9041 16434 10135 3191
MODERATE INCOME
LESS THAN 10% MINORITY 130 7 33 17 5192 21670 14875 814 3208 2341 432
10-19% MINORITY 392 17 53 49 12523 89239 68077 3264 7663 8070 2165
20-49% MINORITY 920 59 174 102 431298 200865 147695 9516 23384 14873 5397
50-79% MINORITY 433 24 69 84 9619 111147 80479 3809 10164 14657 2038
80-100% MINORITY 249 21 146 52 21489 46779 26488 1774 11674 5270 1573
MIDDLE INCOME
LESS THAN 10% MINORITY 1956 132 270 232 492639 504371 378474 22746 47391 46379 9381
10-19% MINORITY 2512 149 322 280 883351 668035 503863 28685 58607 59137 17743
20-49% MINORITY 2311 125 317 288 633104 691501 518361 24332 66939 67544 14325
50-79% MINORITY 306 21 70 49 9455 96248 68293 3687 12944 10188 1136
80-100% MINORITY 49 7 20 884 11181 6973 1104 2119 985
UPPER INCOME
LESS THAN 10% MINORITY 5519 406 538 705 1517319 2378838 1769338 143639 187419 230088 48354
10-19% MINORITY 6489 415 720 818 1858627 2768821 2059545 146502 240589 261814 60371
20-49% MINORITY 2802 185 320 383 863776 1080797 786676 55021 97478 114886 26736
50-79% MINORITY 62 3 7 4 177 17858 14145 706 1525 1366 116
80-100% MINORITY
SMALL COUNTY
23 2 8 1 438 5067 3446 180 732 32 677ALL OTHER TRACTS 21/
25212 1665 3381 3232 78334273 8956432 6630590 462399 806074 860710 196659TOTAL 14/
Report Date: 06/02/2014
AGGREGATE TABLE 7-2: DISPOSITION OF APPLICATIONS FOR CONVENTIONAL HOME-PURCHASE LOANS, 1- TO 4-FAMILY AND MANUFACTURED HOMEDWELLINGS, BY CHARACTERISTICS OF CENSUS TRACT IN WHICH PROPERTY IS LOCATED, 2013
MSA/MD: 37964 - PHILADELPHIA, PA
TYPE OF CENSUS TRACT 10/
ApplicationsReceived 20/
LoansOriginated
Apps. Approved ButNot Accepted
ApplicationsDenied
ApplicationsWithdrawn
Files Closed ForIncompleteness
Number Number Number Number Number Number$000's $000's $000's $000's $000's $000's
Page 1 of 1
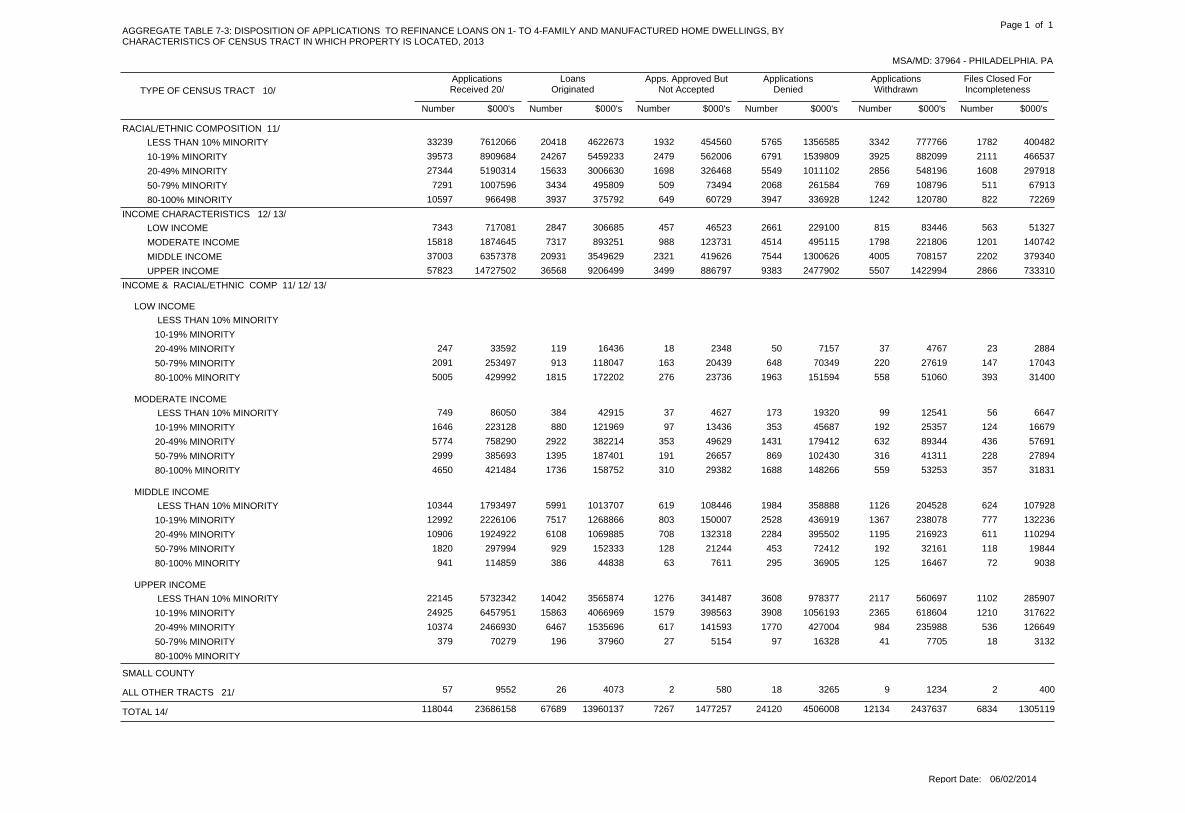
RACIAL/ETHNIC COMPOSITION 11/
LESS THAN 10% MINORITY 20418 1932 5765 3342 178233239 7612066 4622673 454560 1356585 777766 400482
10-19% MINORITY 24267 2479 6791 3925 211139573 8909684 5459233 562006 1539809 882099 466537
20-49% MINORITY 15633 1698 5549 2856 160827344 5190314 3006630 326468 1011102 548196 297918
50-79% MINORITY 3434 509 2068 769 5117291 1007596 495809 73494 261584 108796 67913
80-100% MINORITY 3937 649 3947 1242 82210597 966498 375792 60729 336928 120780 72269
INCOME CHARACTERISTICS 12/ 13/
LOW INCOME 2847 457 2661 815 5637343 717081 306685 46523 229100 83446 51327
MODERATE INCOME 7317 988 4514 1798 120115818 1874645 893251 123731 495115 221806 140742
MIDDLE INCOME 20931 2321 7544 4005 220237003 6357378 3549629 419626 1300626 708157 379340
UPPER INCOME 36568 3499 9383 5507 286657823 14727502 9206499 886797 2477902 1422994 733310
INCOME & RACIAL/ETHNIC COMP 11/ 12/ 13/
LOW INCOME
LESS THAN 10% MINORITY
10-19% MINORITY
20-49% MINORITY 119 18 50 37 23247 33592 16436 2348 7157 4767 2884
50-79% MINORITY 913 163 648 220 1472091 253497 118047 20439 70349 27619 17043
80-100% MINORITY 1815 276 1963 558 3935005 429992 172202 23736 151594 51060 31400
MODERATE INCOME
LESS THAN 10% MINORITY 384 37 173 99 56749 86050 42915 4627 19320 12541 6647
10-19% MINORITY 880 97 353 192 1241646 223128 121969 13436 45687 25357 16679
20-49% MINORITY 2922 353 1431 632 4365774 758290 382214 49629 179412 89344 57691
50-79% MINORITY 1395 191 869 316 2282999 385693 187401 26657 102430 41311 27894
80-100% MINORITY 1736 310 1688 559 3574650 421484 158752 29382 148266 53253 31831
MIDDLE INCOME
LESS THAN 10% MINORITY 5991 619 1984 1126 62410344 1793497 1013707 108446 358888 204528 107928
10-19% MINORITY 7517 803 2528 1367 77712992 2226106 1268866 150007 436919 238078 132236
20-49% MINORITY 6108 708 2284 1195 61110906 1924922 1069885 132318 395502 216923 110294
50-79% MINORITY 929 128 453 192 1181820 297994 152333 21244 72412 32161 19844
80-100% MINORITY 386 63 295 125 72941 114859 44838 7611 36905 16467 9038
UPPER INCOME
LESS THAN 10% MINORITY 14042 1276 3608 2117 110222145 5732342 3565874 341487 978377 560697 285907
10-19% MINORITY 15863 1579 3908 2365 121024925 6457951 4066969 398563 1056193 618604 317622
20-49% MINORITY 6467 617 1770 984 53610374 2466930 1535696 141593 427004 235988 126649
50-79% MINORITY 196 27 97 41 18379 70279 37960 5154 16328 7705 3132
80-100% MINORITY
SMALL COUNTY
26 2 18 9 257 9552 4073 580 3265 1234 400ALL OTHER TRACTS 21/
67689 7267 24120 12134 6834118044 23686158 13960137 1477257 4506008 2437637 1305119TOTAL 14/
Report Date: 06/02/2014
AGGREGATE TABLE 7-3: DISPOSITION OF APPLICATIONS TO REFINANCE LOANS ON 1- TO 4-FAMILY AND MANUFACTURED HOME DWELLINGS, BYCHARACTERISTICS OF CENSUS TRACT IN WHICH PROPERTY IS LOCATED, 2013
MSA/MD: 37964 - PHILADELPHIA, PA
TYPE OF CENSUS TRACT 10/
ApplicationsReceived 20/
LoansOriginated
Apps. Approved ButNot Accepted
ApplicationsDenied
ApplicationsWithdrawn
Files Closed ForIncompleteness
Number Number Number Number Number Number$000's $000's $000's $000's $000's $000's
Page 1 of 1

RACIAL/ETHNIC COMPOSITION 11/
LESS THAN 10% MINORITY 2023 115 1065 210 783491 300832 198484 9767 59714 23221 9646
10-19% MINORITY 2144 137 1387 243 1294040 329407 207515 10769 67751 25451 17921
20-49% MINORITY 1342 101 1317 154 802994 186919 105115 8337 50683 15707 7077
50-79% MINORITY 380 43 774 52 261275 51431 22811 2657 20196 3749 2018
80-100% MINORITY 1010 65 3329 157 874648 100169 28252 1819 59934 5812 4352
INCOME CHARACTERISTICS 12/ 13/
LOW INCOME 707 54 2454 106 613382 79379 25770 2189 43444 4855 3121
MODERATE INCOME 1051 82 2176 155 673531 106386 40756 4182 50223 7645 3580
MIDDLE INCOME 2113 121 1830 223 1194406 229625 131621 7065 64523 17130 9286
UPPER INCOME 3028 204 1410 331 1535126 553278 364030 19913 100053 44255 25027
INCOME & RACIAL/ETHNIC COMP 11/ 12/ 13/
LOW INCOME
LESS THAN 10% MINORITY
10-19% MINORITY
20-49% MINORITY 22 1 32 1 258 2258 1409 226 512 100 11
50-79% MINORITY 134 17 307 20 9487 18118 8432 1264 6575 1282 565
80-100% MINORITY 551 36 2115 85 502837 59003 15929 699 36357 3473 2545
MODERATE INCOME
LESS THAN 10% MINORITY 59 4 78 8 3152 5640 2233 276 2577 425 129
10-19% MINORITY 130 10 157 19 8324 12379 5785 468 4412 985 729
20-49% MINORITY 320 23 532 48 18941 36449 16451 1461 14675 2958 904
50-79% MINORITY 146 18 330 18 7519 16887 5759 955 8547 1166 460
80-100% MINORITY 396 27 1079 62 311595 35031 10528 1022 20012 2111 1358
MIDDLE INCOME
LESS THAN 10% MINORITY 700 38 450 66 231277 70248 42863 2246 17808 5583 1748
10-19% MINORITY 723 40 638 85 501536 79217 44171 2095 22215 7299 3437
20-49% MINORITY 551 36 494 52 321165 62117 36382 2561 17162 3323 2689
50-79% MINORITY 76 5 113 10 8212 11908 6410 65 3773 697 963
80-100% MINORITY 63 2 135 10 6216 6135 1795 98 3565 228 449
UPPER INCOME
LESS THAN 10% MINORITY 1264 73 537 136 522062 224944 153388 7245 39329 17213 7769
10-19% MINORITY 1291 87 592 139 712180 237811 157559 8206 41124 17167 13755
20-49% MINORITY 449 41 259 52 28829 86040 50873 4089 18334 9271 3473
50-79% MINORITY 24 3 22 4 255 4483 2210 373 1266 604 30
80-100% MINORITY
SMALL COUNTY
2 13 90 35 55ALL OTHER TRACTS 21/
6899 461 7872 816 40016448 968758 562177 33349 258278 73940 41014TOTAL 14/
Report Date: 06/02/2014
AGGREGATE TABLE 7-4: DISPOSITION OF APPLICATIONS FOR HOME IMPROVEMENT LOANS, 1- TO 4-FAMILY AND MANUFACTURED HOME DWELLINGS, BYCHARACTERISTICS OF CENSUS TRACT IN WHICH PROPERTY IS LOCATED, 2013
MSA/MD: 37964 - PHILADELPHIA, PA
TYPE OF CENSUS TRACT 10/
ApplicationsReceived 20/
LoansOriginated
Apps. Approved ButNot Accepted
ApplicationsDenied
ApplicationsWithdrawn
Files Closed ForIncompleteness
Number Number Number Number Number Number$000's $000's $000's $000's $000's $000's
Page 1 of 1

RACIAL/ETHNIC COMPOSITION 11/
LESS THAN 10% MINORITY 47 2 13 2 165 240110 200940 8660 28653 675 1182
10-19% MINORITY 124 8 20 14 1167 670015 573269 28446 15219 53051 30
20-49% MINORITY 160 8 22 23 1214 1278956 776430 8915 211708 271903 10000
50-79% MINORITY 91 5 14 6 1117 429567 340221 30228 42978 15740 400
80-100% MINORITY 89 12 18 21 2142 222904 138701 8422 10892 63079 1810
INCOME CHARACTERISTICS 12/ 13/
LOW INCOME 97 11 16 8132 363593 279588 16492 22590 44923
MODERATE INCOME 106 7 15 19 3150 470071 350282 22683 22469 72427 2210
MIDDLE INCOME 148 8 29 21 1207 866734 620765 38178 62090 145671 30
UPPER INCOME 160 9 26 18 2215 1080119 778926 7318 141266 141427 11182
INCOME & RACIAL/ETHNIC COMP 11/ 12/ 13/
LOW INCOME
LESS THAN 10% MINORITY
10-19% MINORITY
20-49% MINORITY 10 212 95396 55896 39500
50-79% MINORITY 24 1 328 160075 136050 8500 15525
80-100% MINORITY 63 10 13 692 108122 87642 7992 7065 5423
MODERATE INCOME
LESS THAN 10% MINORITY 1 23 788 168 620
10-19% MINORITY 8 1 3 113 86550 84107 525 1068 850
20-49% MINORITY 28 2 131 83893 70987 815 12091
50-79% MINORITY 44 4 5 4 158 194720 146511 21728 16551 9530 400
80-100% MINORITY 25 2 3 13 245 104120 48509 430 3415 49956 1810
MIDDLE INCOME
LESS THAN 10% MINORITY 28 2 636 80848 66154 8660 6034
10-19% MINORITY 34 3 5 8 151 271330 195893 25938 2738 46731 30
20-49% MINORITY 64 3 10 986 433072 302458 3580 42004 85030
50-79% MINORITY 21 6 229 70822 53710 10902 6210
80-100% MINORITY 1 2 25 10662 2550 412 7700
UPPER INCOME
LESS THAN 10% MINORITY 18 5 2 126 158474 134618 21999 675 1182
10-19% MINORITY 82 4 12 5103 312135 293269 1983 11413 5470
20-49% MINORITY 58 5 9 11 184 605560 347089 5335 107854 135282 10000
50-79% MINORITY 22 3950 3950
80-100% MINORITY
SMALL COUNTY
11 61035 61035ALL OTHER TRACTS 21/
511 35 87 66 6705 2841552 2029561 84671 309450 404448 13422TOTAL 14/
Report Date: 06/02/2014
AGGREGATE TABLE 7-5: DISPOSITION OF APPLICATIONS FOR LOANS ON DWELLINGS FOR 5 OR MORE FAMILIES, BY CHARACTERISTICS OF CENSUS TRACTIN WHICH PROPERTY IS LOCATED, 2013
MSA/MD: 37964 - PHILADELPHIA, PA
TYPE OF CENSUS TRACT 10/
ApplicationsReceived 20/
LoansOriginated
Apps. Approved ButNot Accepted
ApplicationsDenied
ApplicationsWithdrawn
Files Closed ForIncompleteness
Number Number Number Number Number Number$000's $000's $000's $000's $000's $000's
Page 1 of 1
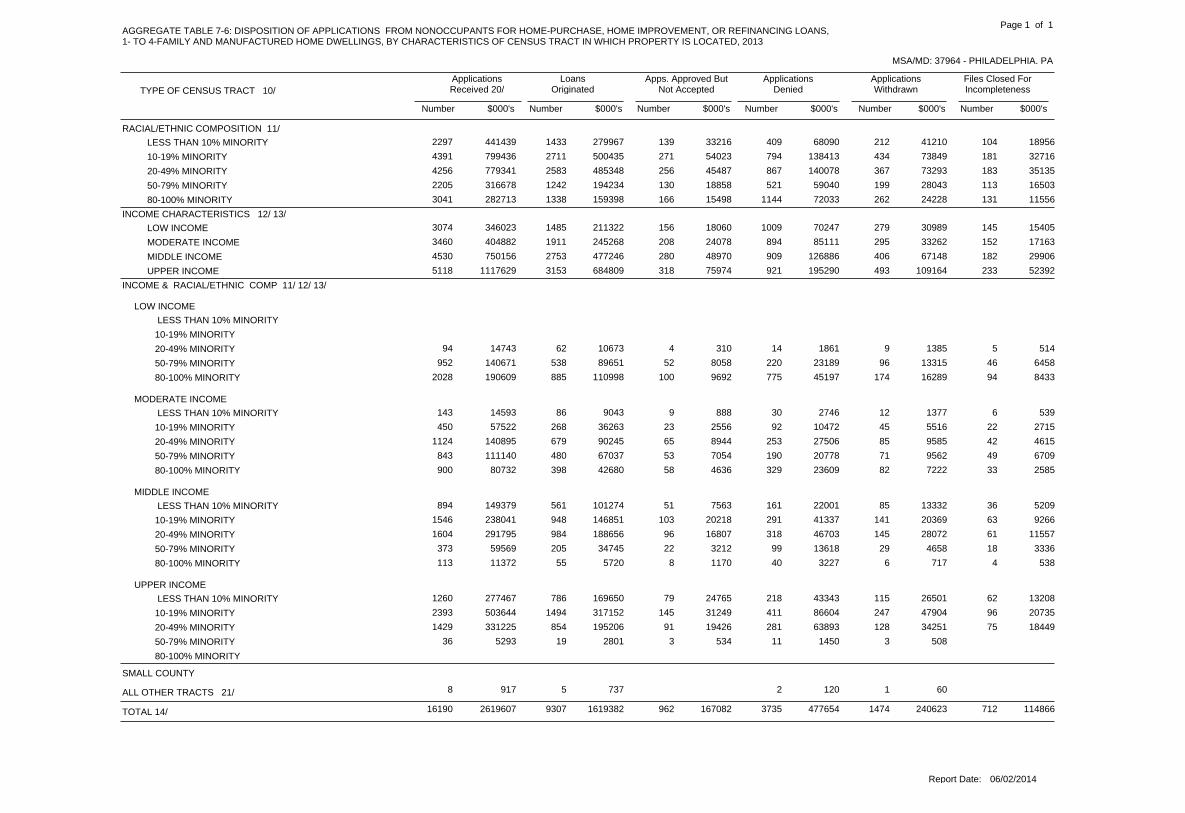
RACIAL/ETHNIC COMPOSITION 11/
LESS THAN 10% MINORITY 1433 139 409 212 1042297 441439 279967 33216 68090 41210 18956
10-19% MINORITY 2711 271 794 434 1814391 799436 500435 54023 138413 73849 32716
20-49% MINORITY 2583 256 867 367 1834256 779341 485348 45487 140078 73293 35135
50-79% MINORITY 1242 130 521 199 1132205 316678 194234 18858 59040 28043 16503
80-100% MINORITY 1338 166 1144 262 1313041 282713 159398 15498 72033 24228 11556
INCOME CHARACTERISTICS 12/ 13/
LOW INCOME 1485 156 1009 279 1453074 346023 211322 18060 70247 30989 15405
MODERATE INCOME 1911 208 894 295 1523460 404882 245268 24078 85111 33262 17163
MIDDLE INCOME 2753 280 909 406 1824530 750156 477246 48970 126886 67148 29906
UPPER INCOME 3153 318 921 493 2335118 1117629 684809 75974 195290 109164 52392
INCOME & RACIAL/ETHNIC COMP 11/ 12/ 13/
LOW INCOME
LESS THAN 10% MINORITY
10-19% MINORITY
20-49% MINORITY 62 4 14 9 594 14743 10673 310 1861 1385 514
50-79% MINORITY 538 52 220 96 46952 140671 89651 8058 23189 13315 6458
80-100% MINORITY 885 100 775 174 942028 190609 110998 9692 45197 16289 8433
MODERATE INCOME
LESS THAN 10% MINORITY 86 9 30 12 6143 14593 9043 888 2746 1377 539
10-19% MINORITY 268 23 92 45 22450 57522 36263 2556 10472 5516 2715
20-49% MINORITY 679 65 253 85 421124 140895 90245 8944 27506 9585 4615
50-79% MINORITY 480 53 190 71 49843 111140 67037 7054 20778 9562 6709
80-100% MINORITY 398 58 329 82 33900 80732 42680 4636 23609 7222 2585
MIDDLE INCOME
LESS THAN 10% MINORITY 561 51 161 85 36894 149379 101274 7563 22001 13332 5209
10-19% MINORITY 948 103 291 141 631546 238041 146851 20218 41337 20369 9266
20-49% MINORITY 984 96 318 145 611604 291795 188656 16807 46703 28072 11557
50-79% MINORITY 205 22 99 29 18373 59569 34745 3212 13618 4658 3336
80-100% MINORITY 55 8 40 6 4113 11372 5720 1170 3227 717 538
UPPER INCOME
LESS THAN 10% MINORITY 786 79 218 115 621260 277467 169650 24765 43343 26501 13208
10-19% MINORITY 1494 145 411 247 962393 503644 317152 31249 86604 47904 20735
20-49% MINORITY 854 91 281 128 751429 331225 195206 19426 63893 34251 18449
50-79% MINORITY 19 3 11 336 5293 2801 534 1450 508
80-100% MINORITY
SMALL COUNTY
5 2 18 917 737 120 60ALL OTHER TRACTS 21/
9307 962 3735 1474 71216190 2619607 1619382 167082 477654 240623 114866TOTAL 14/
Report Date: 06/02/2014
AGGREGATE TABLE 7-6: DISPOSITION OF APPLICATIONS FROM NONOCCUPANTS FOR HOME-PURCHASE, HOME IMPROVEMENT, OR REFINANCING LOANS,1- TO 4-FAMILY AND MANUFACTURED HOME DWELLINGS, BY CHARACTERISTICS OF CENSUS TRACT IN WHICH PROPERTY IS LOCATED, 2013
MSA/MD: 37964 - PHILADELPHIA, PA
TYPE OF CENSUS TRACT 10/
ApplicationsReceived 20/
LoansOriginated
Apps. Approved ButNot Accepted
ApplicationsDenied
ApplicationsWithdrawn
Files Closed ForIncompleteness
Number Number Number Number Number Number$000's $000's $000's $000's $000's $000's
Page 1 of 1
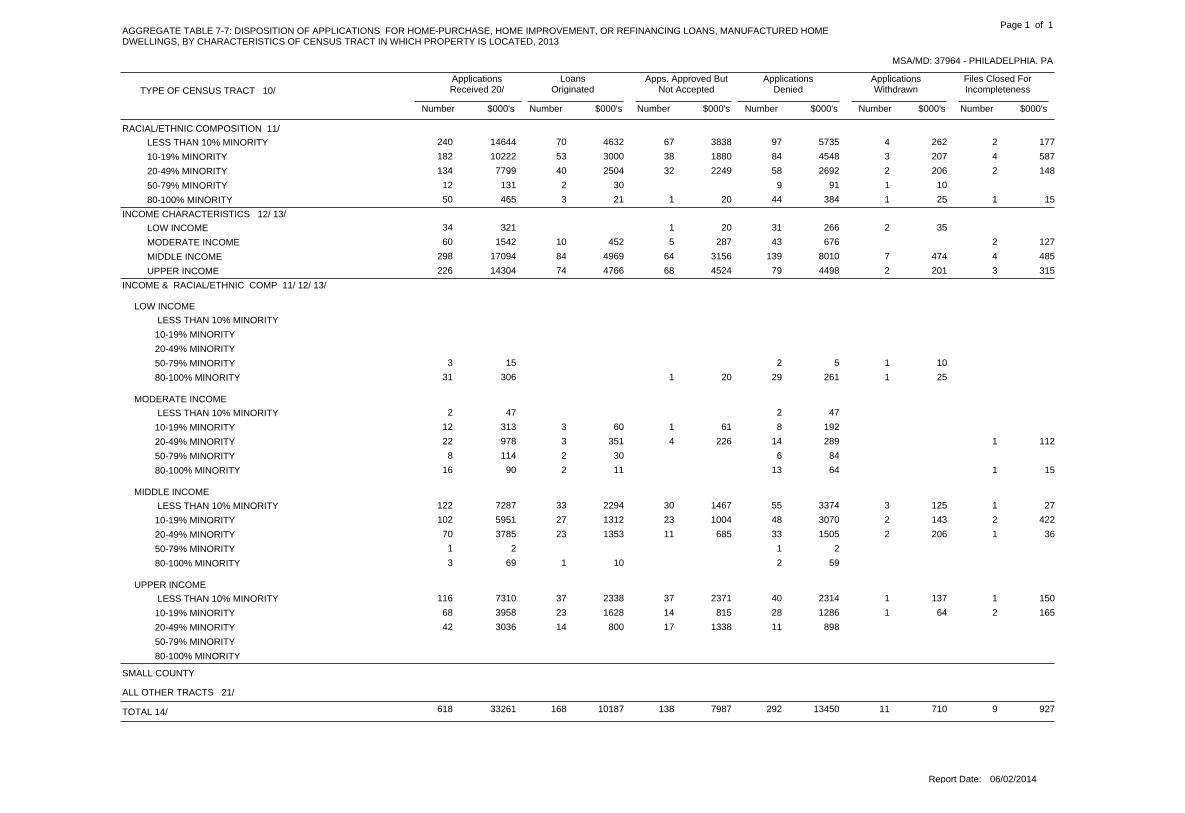
RACIAL/ETHNIC COMPOSITION 11/
LESS THAN 10% MINORITY 70 67 97 4 2240 14644 4632 3838 5735 262 177
10-19% MINORITY 53 38 84 3 4182 10222 3000 1880 4548 207 587
20-49% MINORITY 40 32 58 2 2134 7799 2504 2249 2692 206 148
50-79% MINORITY 2 9 112 131 30 91 10
80-100% MINORITY 3 1 44 1 150 465 21 20 384 25 15
INCOME CHARACTERISTICS 12/ 13/
LOW INCOME 1 31 234 321 20 266 35
MODERATE INCOME 10 5 43 260 1542 452 287 676 127
MIDDLE INCOME 84 64 139 7 4298 17094 4969 3156 8010 474 485
UPPER INCOME 74 68 79 2 3226 14304 4766 4524 4498 201 315
INCOME & RACIAL/ETHNIC COMP 11/ 12/ 13/
LOW INCOME
LESS THAN 10% MINORITY
10-19% MINORITY
20-49% MINORITY
50-79% MINORITY 2 13 15 5 10
80-100% MINORITY 1 29 131 306 20 261 25
MODERATE INCOME
LESS THAN 10% MINORITY 22 47 47
10-19% MINORITY 3 1 812 313 60 61 192
20-49% MINORITY 3 4 14 122 978 351 226 289 112
50-79% MINORITY 2 68 114 30 84
80-100% MINORITY 2 13 116 90 11 64 15
MIDDLE INCOME
LESS THAN 10% MINORITY 33 30 55 3 1122 7287 2294 1467 3374 125 27
10-19% MINORITY 27 23 48 2 2102 5951 1312 1004 3070 143 422
20-49% MINORITY 23 11 33 2 170 3785 1353 685 1505 206 36
50-79% MINORITY 11 2 2
80-100% MINORITY 1 23 69 10 59
UPPER INCOME
LESS THAN 10% MINORITY 37 37 40 1 1116 7310 2338 2371 2314 137 150
10-19% MINORITY 23 14 28 1 268 3958 1628 815 1286 64 165
20-49% MINORITY 14 17 1142 3036 800 1338 898
50-79% MINORITY
80-100% MINORITY
SMALL COUNTY
ALL OTHER TRACTS 21/
168 138 292 11 9618 33261 10187 7987 13450 710 927TOTAL 14/
Report Date: 06/02/2014
AGGREGATE TABLE 7-7: DISPOSITION OF APPLICATIONS FOR HOME-PURCHASE, HOME IMPROVEMENT, OR REFINANCING LOANS, MANUFACTURED HOMEDWELLINGS, BY CHARACTERISTICS OF CENSUS TRACT IN WHICH PROPERTY IS LOCATED, 2013
MSA/MD: 37964 - PHILADELPHIA, PA
TYPE OF CENSUS TRACT 10/
ApplicationsReceived 20/
LoansOriginated
Apps. Approved ButNot Accepted
ApplicationsDenied
ApplicationsWithdrawn
Files Closed ForIncompleteness
Number Number Number Number Number Number$000's $000's $000's $000's $000's $000's
Page 1 of 1

RACE 5/
AMERICAN INDIAN/ALASKA NATIVE 1 100 1 100
ASIAN 6 12 8 8 1036 40 7 13 9 9 11 5 6 5 6 90 100
BLACK OR AFRICAN AMERICAN 16 130 75 32 35113 23 3 27 15 7 7 43 9 3 1 41 8 488 100
NATIVE HAWAIIAN/OTHER PACIFIC ISLND 1 1 1 12 29 14 14 14 14 1 14 7 100
WHITE 20 145 109 38 39181 26 3 21 16 5 6 95 14 3 0 72 10 702 100
2 OR MORE MINORITY RACES 1 1 11 25 25 25 25 4 100
JOINT (WHITE/MINORITY RACE) 5 43 18 29 24 5 29 17 100
RACE NOT AVAILABLE 6/ 10 56 44 19 1350 20 4 23 18 8 5 34 14 19 8 245 100
ETHNICITY 7/
HISPANIC OR LATINO 4 27 11 5 924 24 4 27 11 5 9 8 8 11 11 99 100
NOT HISPANIC OR LATINO 38 247 183 75 80304 26 3 21 16 6 7 136 12 6 1 107 9 1176 100
JOINT (HISPANIC OR LATINO/ NOT HISPANICOR LATINO)
2 10 2 15 19 8 38 8 4 6 23 26 100
ETHNICITY NOT AVAILABLE 6/ 9 66 46 16 1053 21 4 26 18 6 4 34 13 19 8 253 100
MINORITY STATUS 8/
WHITE NON-HISPANIC 16 109 96 31 32150 26 3 19 17 5 6 81 14 3 1 62 11 580 100
OTHERS, INCL. HISPANIC 28 178 99 46 55181 25 4 25 14 6 8 66 9 3 0 56 8 712 100
GENDER 19/
MALE 22 124 97 39 41147 25 4 21 16 7 7 57 10 4 1 57 10 588 100
FEMALE 12 117 64 35 34135 28 2 24 13 7 7 56 11 1 0 34 7 488 100
JOINT (MALE/FEMALE) 16 77 55 13 2179 23 5 22 16 4 6 51 15 1 0 36 10 349 100
GENDER NOT AVAILABLE 6/ 3 32 26 10 325 19 2 25 20 8 2 20 16 10 8 129 100
INCOME 9/
LESS THAN 50% OF MSA/MD MEDIAN 27 103 64 42 27178 35 5 20 12 8 5 44 9 29 6 514 100
50-79% OF MSA/MD MEDIAN 16 106 77 30 28114 24 3 23 16 6 6 51 11 1 0 44 9 467 100
80-99% OF MSA/MD MEDIAN 3 37 40 9 1333 19 2 21 23 5 8 17 10 4 2 17 10 173 100
100-119% OF MSA/MD MEDIAN 2 30 17 8 1316 13 2 24 14 6 10 15 12 1 1 22 18 124 100
120% OR MORE OF MSA/MD MEDIAN 3 59 41 8 1639 16 1 25 17 3 7 48 20 23 10 237 100
INCOME NOT AVAILABLE 6/ 2 15 3 26 15 5 38 8 5 9 23 2 5 39 100
Report Date: 06/02/2014
AGGREGATE TABLE 8-1: REASONS FOR DENIAL OF APPLICATIONS FOR FHA, FSA/RHS, AND VA HOME-PURCHASE LOANS, 1- TO 4-FAMILY AND MANUFACTURED HOME DWELLINGS,BY RACE, ETHNICITY, GENDER AND INCOME OF APPLICANT, 2013
MSA/MD: 37964 - PHILADELPHIA, PA
APPLICANT CHARACTERISTICSDebt-to- Income
RatioEmployment
History Credit History Collateral
InsufficientCash
UnverifiableInformation
Number Number Number Number Number Number% % % % % %
Page 1 of 1
Credit App.Incomplete
Number %
MortgageInsurance
Denied
Number %
Other
Number %
Total /22
Number %

RACE 5/
AMERICAN INDIAN/ALASKA NATIVE 1 9 3 15 19 4 35 12 4 2 8 5 19 26 100
ASIAN 18 41 57 24 3492 25 5 11 15 6 9 48 13 5 1 55 15 374 100
BLACK OR AFRICAN AMERICAN 1 84 39 16 1065 25 0 32 15 6 4 17 6 4 2 29 11 265 100
NATIVE HAWAIIAN/OTHER PACIFIC ISLND 7 5 1 12 11 37 26 5 5 1 5 2 11 19 100
WHITE 52 256 407 111 126458 24 3 14 22 6 7 271 14 15 1 189 10 1885 100
2 OR MORE MINORITY RACES 1 100 1 100
JOINT (WHITE/MINORITY RACE) 2 7 104 10 5 18 25 8 20 9 23 40 100
RACE NOT AVAILABLE 6/ 12 92 94 24 19106 21 2 19 19 5 4 93 19 7 1 47 10 494 100
ETHNICITY 7/
HISPANIC OR LATINO 4 43 23 11 934 24 3 30 16 8 6 7 5 3 2 10 7 144 100
NOT HISPANIC OR LATINO 69 363 490 142 156590 24 3 15 20 6 6 343 14 20 1 277 11 2450 100
JOINT (HISPANIC OR LATINO/ NOT HISPANICOR LATINO)
1 6 7 1 12 8 4 24 28 4 4 5 20 2 8 25 100
ETHNICITY NOT AVAILABLE 6/ 12 85 95 23 24106 22 2 18 20 5 5 85 18 8 2 47 10 485 100
MINORITY STATUS 8/
WHITE NON-HISPANIC 47 220 375 102 112420 24 3 13 22 6 7 255 15 11 1 178 10 1720 100
OTHERS, INCL. HISPANIC 27 189 140 52 55198 23 3 22 16 6 6 87 10 12 1 109 13 869 100
GENDER 19/
MALE 27 167 208 66 65269 25 3 16 20 6 6 125 12 11 1 122 12 1060 100
FEMALE 21 122 126 46 43180 26 3 17 18 7 6 87 12 5 1 70 10 700 100
JOINT (MALE/FEMALE) 30 162 231 54 68227 21 3 15 21 5 6 174 16 11 1 118 11 1075 100
GENDER NOT AVAILABLE 6/ 8 46 50 11 1456 21 3 17 19 4 5 54 20 4 1 26 10 269 100
INCOME 9/
LESS THAN 50% OF MSA/MD MEDIAN 24 132 74 37 24211 36 4 22 13 6 4 32 5 5 1 53 9 592 100
50-79% OF MSA/MD MEDIAN 24 118 86 40 37170 29 4 20 14 7 6 59 10 5 1 56 9 595 100
80-99% OF MSA/MD MEDIAN 7 58 76 20 1980 23 2 17 22 6 5 48 14 3 1 37 11 348 100
100-119% OF MSA/MD MEDIAN 3 29 56 11 1158 23 1 12 22 4 4 49 20 5 2 27 11 249 100
120% OR MORE OF MSA/MD MEDIAN 26 151 315 66 92196 16 2 12 25 5 7 242 19 13 1 150 12 1251 100
INCOME NOT AVAILABLE 6/ 2 9 8 3 717 25 3 13 12 4 10 10 14 13 19 69 100
Report Date: 06/02/2014
AGGREGATE TABLE 8-2: REASONS FOR DENIAL OF APPLICATIONS FOR CONVENTIONAL HOME-PURCHASE LOANS, 1- TO 4-FAMILY AND MANUFACTURED HOME DWELLINGS, BYRACE, ETHNICITY, GENDER AND INCOME OF APPLICANT, 2013
MSA/MD: 37964 - PHILADELPHIA, PA
APPLICANT CHARACTERISTICSDebt-to- Income
RatioEmployment
History Credit History Collateral
InsufficientCash
UnverifiableInformation
Number Number Number Number Number Number% % % % % %
Page 1 of 1
Credit App.Incomplete
Number %
MortgageInsurance
Denied
Number %
Other
Number %
Total /22
Number %
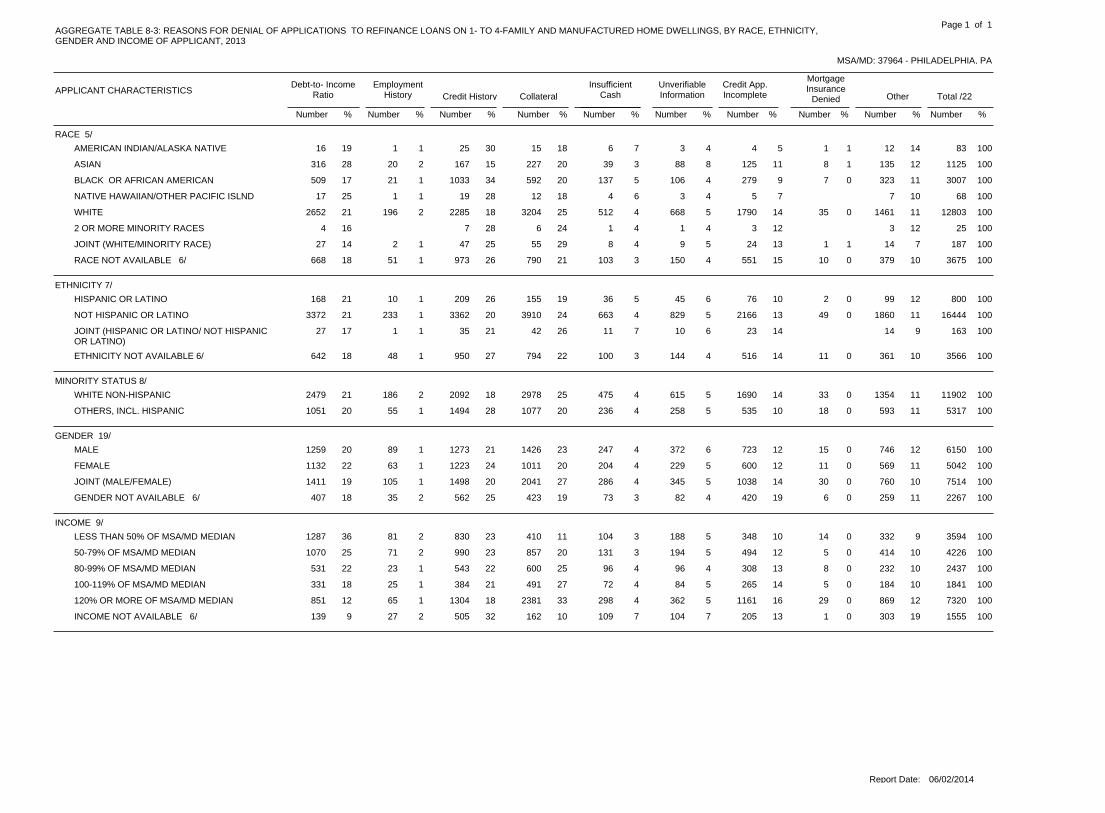
RACE 5/
AMERICAN INDIAN/ALASKA NATIVE 1 25 15 6 316 19 1 30 18 7 4 4 5 1 1 12 14 83 100
ASIAN 20 167 227 39 88316 28 2 15 20 3 8 125 11 8 1 135 12 1125 100
BLACK OR AFRICAN AMERICAN 21 1033 592 137 106509 17 1 34 20 5 4 279 9 7 0 323 11 3007 100
NATIVE HAWAIIAN/OTHER PACIFIC ISLND 1 19 12 4 317 25 1 28 18 6 4 5 7 7 10 68 100
WHITE 196 2285 3204 512 6682652 21 2 18 25 4 5 1790 14 35 0 1461 11 12803 100
2 OR MORE MINORITY RACES 7 6 1 14 16 28 24 4 4 3 12 3 12 25 100
JOINT (WHITE/MINORITY RACE) 2 47 55 8 927 14 1 25 29 4 5 24 13 1 1 14 7 187 100
RACE NOT AVAILABLE 6/ 51 973 790 103 150668 18 1 26 21 3 4 551 15 10 0 379 10 3675 100
ETHNICITY 7/
HISPANIC OR LATINO 10 209 155 36 45168 21 1 26 19 5 6 76 10 2 0 99 12 800 100
NOT HISPANIC OR LATINO 233 3362 3910 663 8293372 21 1 20 24 4 5 2166 13 49 0 1860 11 16444 100
JOINT (HISPANIC OR LATINO/ NOT HISPANICOR LATINO)
1 35 42 11 1027 17 1 21 26 7 6 23 14 14 9 163 100
ETHNICITY NOT AVAILABLE 6/ 48 950 794 100 144642 18 1 27 22 3 4 516 14 11 0 361 10 3566 100
MINORITY STATUS 8/
WHITE NON-HISPANIC 186 2092 2978 475 6152479 21 2 18 25 4 5 1690 14 33 0 1354 11 11902 100
OTHERS, INCL. HISPANIC 55 1494 1077 236 2581051 20 1 28 20 4 5 535 10 18 0 593 11 5317 100
GENDER 19/
MALE 89 1273 1426 247 3721259 20 1 21 23 4 6 723 12 15 0 746 12 6150 100
FEMALE 63 1223 1011 204 2291132 22 1 24 20 4 5 600 12 11 0 569 11 5042 100
JOINT (MALE/FEMALE) 105 1498 2041 286 3451411 19 1 20 27 4 5 1038 14 30 0 760 10 7514 100
GENDER NOT AVAILABLE 6/ 35 562 423 73 82407 18 2 25 19 3 4 420 19 6 0 259 11 2267 100
INCOME 9/
LESS THAN 50% OF MSA/MD MEDIAN 81 830 410 104 1881287 36 2 23 11 3 5 348 10 14 0 332 9 3594 100
50-79% OF MSA/MD MEDIAN 71 990 857 131 1941070 25 2 23 20 3 5 494 12 5 0 414 10 4226 100
80-99% OF MSA/MD MEDIAN 23 543 600 96 96531 22 1 22 25 4 4 308 13 8 0 232 10 2437 100
100-119% OF MSA/MD MEDIAN 25 384 491 72 84331 18 1 21 27 4 5 265 14 5 0 184 10 1841 100
120% OR MORE OF MSA/MD MEDIAN 65 1304 2381 298 362851 12 1 18 33 4 5 1161 16 29 0 869 12 7320 100
INCOME NOT AVAILABLE 6/ 27 505 162 109 104139 9 2 32 10 7 7 205 13 1 0 303 19 1555 100
Report Date: 06/02/2014
AGGREGATE TABLE 8-3: REASONS FOR DENIAL OF APPLICATIONS TO REFINANCE LOANS ON 1- TO 4-FAMILY AND MANUFACTURED HOME DWELLINGS, BY RACE, ETHNICITY,GENDER AND INCOME OF APPLICANT, 2013
MSA/MD: 37964 - PHILADELPHIA, PA
APPLICANT CHARACTERISTICSDebt-to- Income
RatioEmployment
History Credit History Collateral
InsufficientCash
UnverifiableInformation
Number Number Number Number Number Number% % % % % %
Page 1 of 1
Credit App.Incomplete
Number %
MortgageInsurance
Denied
Number %
Other
Number %
Total /22
Number %

RACE 5/
AMERICAN INDIAN/ALASKA NATIVE 52 7 223 26 58 8 2 5 6 89 100
ASIAN 9 144 28 2 8118 34 3 41 8 1 2 8 2 34 10 351 100
BLACK OR AFRICAN AMERICAN 22 2041 157 12 95894 26 1 59 5 0 3 19 1 207 6 3447 100
NATIVE HAWAIIAN/OTHER PACIFIC ISLND 48 3 228 31 54 3 2 8 9 89 100
WHITE 44 1731 483 49 1321113 28 1 44 12 1 3 71 2 343 9 3966 100
2 OR MORE MINORITY RACES 23 5 113 28 49 11 2 1 2 4 9 47 100
JOINT (WHITE/MINORITY RACE) 29 11 16 11 54 20 2 1 2 6 11 54 100
RACE NOT AVAILABLE 6/ 10 897 131 7 22387 23 1 53 8 0 1 15 1 1 0 223 13 1693 100
ETHNICITY 7/
HISPANIC OR LATINO 6 472 51 1 24246 29 1 56 6 0 3 2 0 1 0 45 5 848 100
NOT HISPANIC OR LATINO 68 3607 626 60 2151975 27 1 50 9 1 3 99 1 562 8 7212 100
JOINT (HISPANIC OR LATINO/ NOT HISPANICOR LATINO)
23 9 48 16 46 18 8 6 12 50 100
ETHNICITY NOT AVAILABLE 6/ 11 863 139 9 20353 22 1 53 9 1 1 14 1 217 13 1626 100
MINORITY STATUS 8/
WHITE NON-HISPANIC 39 1429 427 47 113949 28 1 42 13 1 3 71 2 307 9 3382 100
OTHERS, INCL. HISPANIC 37 2727 266 15 1301286 27 1 57 6 0 3 31 1 1 0 300 6 4793 100
GENDER 19/
MALE 32 1741 246 18 99900 27 1 52 7 1 3 40 1 1 0 268 8 3345 100
FEMALE 25 2018 212 22 1141142 30 1 53 6 1 3 30 1 247 6 3810 100
JOINT (MALE/FEMALE) 19 660 299 26 40335 21 1 42 19 2 3 36 2 153 10 1568 100
GENDER NOT AVAILABLE 6/ 9 546 68 4 10205 20 1 54 7 0 1 9 1 162 16 1013 100
INCOME 9/
LESS THAN 50% OF MSA/MD MEDIAN 44 2091 111 11 1211341 34 1 52 3 0 3 17 0 265 7 4001 100
50-79% OF MSA/MD MEDIAN 14 1050 160 7 61646 30 1 48 7 0 3 25 1 1 0 203 9 2167 100
80-99% OF MSA/MD MEDIAN 9 399 103 7 19194 23 1 48 12 1 2 8 1 90 11 829 100
100-119% OF MSA/MD MEDIAN 4 233 103 5 9107 20 1 44 20 1 2 13 2 54 10 528 100
120% OR MORE OF MSA/MD MEDIAN 12 601 341 39 46258 17 1 39 22 3 3 51 3 209 13 1557 100
INCOME NOT AVAILABLE 6/ 2 591 7 1 736 6 0 90 1 0 1 1 0 9 1 654 100
Report Date: 06/02/2014
AGGREGATE TABLE 8-4: REASONS FOR DENIAL OF APPLICATIONS FOR HOME IMPROVEMENT LOANS, 1- TO 4-FAMILY AND MANUFACTURED HOME DWELLINGS, BY RACE, ETHNICITY,GENDER AND INCOME OF APPLICANT, 2013
MSA/MD: 37964 - PHILADELPHIA, PA
APPLICANT CHARACTERISTICSDebt-to- Income
RatioEmployment
History Credit History Collateral
InsufficientCash
UnverifiableInformation
Number Number Number Number Number Number% % % % % %
Page 1 of 1
Credit App.Incomplete
Number %
MortgageInsurance
Denied
Number %
Other
Number %
Total /22
Number %

RACE 5/
AMERICAN INDIAN/ALASKA NATIVE
ASIAN 11 50 50 2 100
BLACK OR AFRICAN AMERICAN 3 12 33 50 17 6 100
NATIVE HAWAIIAN/OTHER PACIFIC ISLND
WHITE 1 3 2 16 38 6 19 13 6 3 19 16 100
2 OR MORE MINORITY RACES
JOINT (WHITE/MINORITY RACE) 1 100 1 100
RACE NOT AVAILABLE 6/ 9 7 316 33 19 15 6 2 4 11 23 48 100
ETHNICITY 7/
HISPANIC OR LATINO
NOT HISPANIC OR LATINO 1 6 3 110 43 4 26 13 4 2 9 23 100
JOINT (HISPANIC OR LATINO/ NOT HISPANICOR LATINO)
ETHNICITY NOT AVAILABLE 6/ 9 7 3 116 32 18 14 6 2 2 4 12 24 50 100
MINORITY STATUS 8/
WHITE NON-HISPANIC 1 3 26 43 7 21 14 2 14 14 100
OTHERS, INCL. HISPANIC 3 1 14 44 33 11 11 9 100
GENDER 19/
MALE 1 4 2 16 38 6 25 13 6 2 13 16 100
FEMALE 23 60 40 5 100
JOINT (MALE/FEMALE) 1 13 60 20 20 5 100
GENDER NOT AVAILABLE 6/ 8 7 3 114 30 17 15 6 2 2 4 12 26 47 100
INCOME 9/
LESS THAN 50% OF MSA/MD MEDIAN
50-79% OF MSA/MD MEDIAN
80-99% OF MSA/MD MEDIAN
100-119% OF MSA/MD MEDIAN
120% OR MORE OF MSA/MD MEDIAN
INCOME NOT AVAILABLE 6/ 1 15 10 3 226 36 1 21 14 4 3 2 3 14 19 73 100
Report Date: 06/02/2014
AGGREGATE TABLE 8-5: REASONS FOR DENIAL OF APPLICATIONS FOR LOANS ON DWELLINGS FOR 5 OR MORE FAMILIES, BY RACE, ETHNICITY, GENDER AND INCOME OFAPPLICANT, 2013
MSA/MD: 37964 - PHILADELPHIA, PA
APPLICANT CHARACTERISTICSDebt-to- Income
RatioEmployment
History Credit History Collateral
InsufficientCash
UnverifiableInformation
Number Number Number Number Number Number% % % % % %
Page 1 of 1
Credit App.Incomplete
Number %
MortgageInsurance
Denied
Number %
Other
Number %
Total /22
Number %
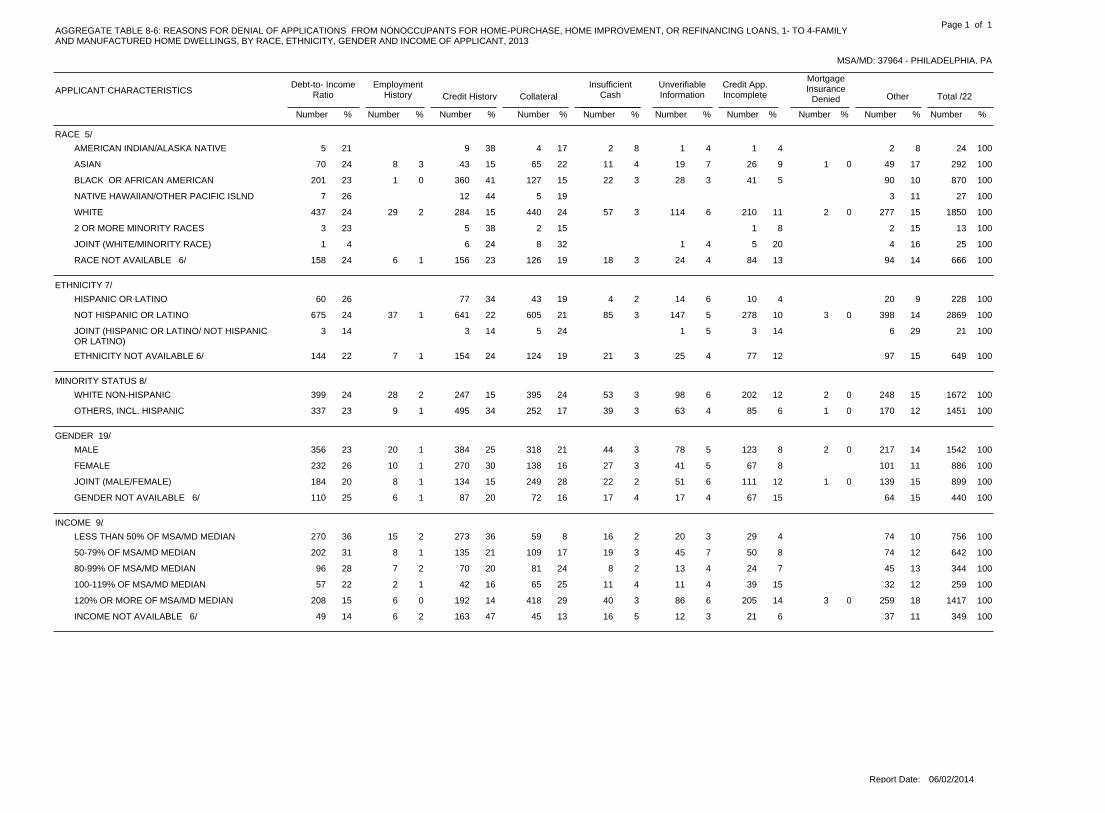
RACE 5/
AMERICAN INDIAN/ALASKA NATIVE 9 4 2 15 21 38 17 8 4 1 4 2 8 24 100
ASIAN 8 43 65 11 1970 24 3 15 22 4 7 26 9 1 0 49 17 292 100
BLACK OR AFRICAN AMERICAN 1 360 127 22 28201 23 0 41 15 3 3 41 5 90 10 870 100
NATIVE HAWAIIAN/OTHER PACIFIC ISLND 12 57 26 44 19 3 11 27 100
WHITE 29 284 440 57 114437 24 2 15 24 3 6 210 11 2 0 277 15 1850 100
2 OR MORE MINORITY RACES 5 23 23 38 15 1 8 2 15 13 100
JOINT (WHITE/MINORITY RACE) 6 8 11 4 24 32 4 5 20 4 16 25 100
RACE NOT AVAILABLE 6/ 6 156 126 18 24158 24 1 23 19 3 4 84 13 94 14 666 100
ETHNICITY 7/
HISPANIC OR LATINO 77 43 4 1460 26 34 19 2 6 10 4 20 9 228 100
NOT HISPANIC OR LATINO 37 641 605 85 147675 24 1 22 21 3 5 278 10 3 0 398 14 2869 100
JOINT (HISPANIC OR LATINO/ NOT HISPANICOR LATINO)
3 5 13 14 14 24 5 3 14 6 29 21 100
ETHNICITY NOT AVAILABLE 6/ 7 154 124 21 25144 22 1 24 19 3 4 77 12 97 15 649 100
MINORITY STATUS 8/
WHITE NON-HISPANIC 28 247 395 53 98399 24 2 15 24 3 6 202 12 2 0 248 15 1672 100
OTHERS, INCL. HISPANIC 9 495 252 39 63337 23 1 34 17 3 4 85 6 1 0 170 12 1451 100
GENDER 19/
MALE 20 384 318 44 78356 23 1 25 21 3 5 123 8 2 0 217 14 1542 100
FEMALE 10 270 138 27 41232 26 1 30 16 3 5 67 8 101 11 886 100
JOINT (MALE/FEMALE) 8 134 249 22 51184 20 1 15 28 2 6 111 12 1 0 139 15 899 100
GENDER NOT AVAILABLE 6/ 6 87 72 17 17110 25 1 20 16 4 4 67 15 64 15 440 100
INCOME 9/
LESS THAN 50% OF MSA/MD MEDIAN 15 273 59 16 20270 36 2 36 8 2 3 29 4 74 10 756 100
50-79% OF MSA/MD MEDIAN 8 135 109 19 45202 31 1 21 17 3 7 50 8 74 12 642 100
80-99% OF MSA/MD MEDIAN 7 70 81 8 1396 28 2 20 24 2 4 24 7 45 13 344 100
100-119% OF MSA/MD MEDIAN 2 42 65 11 1157 22 1 16 25 4 4 39 15 32 12 259 100
120% OR MORE OF MSA/MD MEDIAN 6 192 418 40 86208 15 0 14 29 3 6 205 14 3 0 259 18 1417 100
INCOME NOT AVAILABLE 6/ 6 163 45 16 1249 14 2 47 13 5 3 21 6 37 11 349 100
Report Date: 06/02/2014
AGGREGATE TABLE 8-6: REASONS FOR DENIAL OF APPLICATIONS FROM NONOCCUPANTS FOR HOME-PURCHASE, HOME IMPROVEMENT, OR REFINANCING LOANS, 1- TO 4-FAMILYAND MANUFACTURED HOME DWELLINGS, BY RACE, ETHNICITY, GENDER AND INCOME OF APPLICANT, 2013
MSA/MD: 37964 - PHILADELPHIA, PA
APPLICANT CHARACTERISTICSDebt-to- Income
RatioEmployment
History Credit History Collateral
InsufficientCash
UnverifiableInformation
Number Number Number Number Number Number% % % % % %
Page 1 of 1
Credit App.Incomplete
Number %
MortgageInsurance
Denied
Number %
Other
Number %
Total /22
Number %

RACE 5/
AMERICAN INDIAN/ALASKA NATIVE 41 20 80 5 100
ASIAN 5 14 40 50 10 10 100
BLACK OR AFRICAN AMERICAN 366 14 84 1 2 43 100
NATIVE HAWAIIAN/OTHER PACIFIC ISLND 1 100 1 100
WHITE 3 73 15 3 546 27 2 43 9 2 3 5 3 18 11 168 100
2 OR MORE MINORITY RACES 1 100 1 100
JOINT (WHITE/MINORITY RACE) 1 50 1 50 2 100
RACE NOT AVAILABLE 6/ 12 63 13 52 26 1 4 1 4 23 100
ETHNICITY 7/
HISPANIC OR LATINO 134 24 76 17 100
NOT HISPANIC OR LATINO 3 108 16 3 550 24 1 52 8 1 2 4 2 19 9 208 100
JOINT (HISPANIC OR LATINO/ NOT HISPANICOR LATINO)
1 150 50 2 100
ETHNICITY NOT AVAILABLE 6/ 10 57 27 38 19 2 8 2 8 26 100
MINORITY STATUS 8/
WHITE NON-HISPANIC 3 63 14 3 539 26 2 43 9 2 3 4 3 17 11 148 100
OTHERS, INCL. HISPANIC 59 214 18 77 3 2 3 77 100
GENDER 19/
MALE 1 49 4 1 224 27 1 55 4 1 2 8 9 89 100
FEMALE 1 58 6 1 225 24 1 55 6 1 2 4 4 8 8 105 100
JOINT (MALE/FEMALE) 1 24 8 1 111 22 2 47 16 2 2 1 2 4 8 51 100
GENDER NOT AVAILABLE 6/ 1 41 13 13 50 1 13 1 13 8 100
INCOME 9/
LESS THAN 50% OF MSA/MD MEDIAN 31 2 130 42 43 3 1 1 1 7 10 72 100
50-79% OF MSA/MD MEDIAN 3 26 10 1 318 25 4 36 14 1 4 3 4 9 12 73 100
80-99% OF MSA/MD MEDIAN 6 2 14 24 35 12 6 2 12 2 12 17 100
100-119% OF MSA/MD MEDIAN 42 29 57 1 14 7 100
120% OR MORE OF MSA/MD MEDIAN 11 7 1 15 19 42 27 4 4 1 4 26 100
INCOME NOT AVAILABLE 6/ 54 12 3 93 2 1 2 58 100
Report Date: 06/02/2014
AGGREGATE TABLE 8-7: REASONS FOR DENIAL OF APPLICATIONS FOR HOME-PURCHASE, HOME IMPROVEMENT, OR REFINANCING LOANS, MANUFACTURED HOME DWELLINGS, BYRACE, ETHNICITY, GENDER AND INCOME OF APPLICANT, 2013
MSA/MD: 37964 - PHILADELPHIA, PA
APPLICANT CHARACTERISTICSDebt-to- Income
RatioEmployment
History Credit History Collateral
InsufficientCash
UnverifiableInformation
Number Number Number Number Number Number% % % % % %
Page 1 of 1
Credit App.Incomplete
Number %
MortgageInsurance
Denied
Number %
Other
Number %
Total /22
Number %

2000 - 2010
LOANS ORIGINATED 154 327 13 2 248 2627 50397 95028 1145 34500 7821
APPLICAT'N APPROVED, NOT ACCEPTED 12 28 2 73569 8113 76 1615
APPLICATIONS DENIED 26 85 5 143 677 8997 25144 273 3667
APPLICATIONS WITHDRAWN 25 36 3 1 31 385 8079 9713 477 638 874
FILES CLOSED FOR INCOMPLETENESS 6 16 11848 5251 548
1990-1999
LOANS ORIGINATED 3206 7710 616 7 469581 152810 929170 1806877 54701 72091 89909 298049
APPLICAT'N APPROVED, NOT ACCEPTED 288 722 40 4531 7351 83805 173088 3039 8504 338054
APPLICATIONS DENIED 381 1877 272 1 12097 26816 99057 472658 17503 410 23116 402369
APPLICATIONS WITHDRAWN 385 1089 55 2 7075 19477 111865 274568 4325 71000 13863 2514
FILES CLOSED FOR INCOMPLETENESS 92 548 33 3216 4010 27697 137628 3674 6587 1122
1980-1989
LOANS ORIGINATED 4400 11351 903 15 834901 227354 1289623 2681121 107377 137687 156851 222626
APPLICAT'N APPROVED, NOT ACCEPTED 300 1098 51 2 8553 13366 93897 278695 4779 25305 25132 101717
APPLICATIONS DENIED 433 2887 414 3 217135 33938 134092 712134 23062 20485 39137 150025
APPLICATIONS WITHDRAWN 543 1729 91 1 110125 29589 162882 426550 11646 3450 22023 2293
FILES CLOSED FOR INCOMPLETENESS 128 854 39 4742 9608 38975 216254 6997 8915 1162
1970-1979
LOANS ORIGINATED 4184 11151 1042 42 8331135 268395 1165511 2497352 99278 416892 146188 290056
APPLICAT'N APPROVED, NOT ACCEPTED 299 1070 60 2 8349 10490 86264 237388 5510 1043 17297 261251
APPLICATIONS DENIED 509 3349 589 8 290190 42869 137400 789936 34963 36704 45472 557876
APPLICATIONS WITHDRAWN 534 1795 97 7 139124 27928 153419 415630 13099 127260 28248 1952
FILES CLOSED FOR INCOMPLETENESS 138 939 49 6524 6123 38937 212128 7203 11899 1501
1969 OR EARLIER
LOANS ORIGINATED 13225 37047 4314 445 71306169 1027290 3190394 6868142 299513 1368391 1216611 208137
APPLICAT'N APPROVED, NOT ACCEPTED 764 4335 308 31 741286 46029 194684 778173 19945 58323 114388 97816
APPLICATIONS DENIED 2024 15856 6572 75 30901300 195692 425796 2498470 181975 251851 365942 2349122
APPLICATIONS WITHDRAWN 1744 7453 569 55 1148701 117896 424433 1307543 44338 202100 175256 352
FILES CLOSED FOR INCOMPLETENESS 416 4463 279 6 564255 39324 88581 732278 23140 13422 86667 5494
AGE UNKNOWN
LOANS ORIGINATED 43 103 11 1739 4838 5495 11617 163 2002
APPLICAT'N APPROVED, NOT ACCEPTED 2 14 12 343 180 1800 146
APPLICATIONS DENIED 8 66 20 410 1364 732 7666 502 320
APPLICATIONS WITHDRAWN 1 32 1 42 197 32 3633 55 359
FILES CLOSED FOR INCOMPLETENESS 3 14 31 145 621 1580 250
Report Date: 06/02/2014
AGGREGATE TABLE 9: DISPOSITION OF LOAN APPLICATIONS, BY MEDIAN AGE OF HOMES IN CENSUS TRACT IN WHICH PROPERTY IS LOCATED AND TYPE OFLOAN, 2013
MSA/MD: 37964 - PHILADELPHIA, PA
CENSUS TRACTS BYMEDIAN AGE OF HOMES 23/
FHA, FSA/RHS & VA Conventional
Refinancings Home ImprovementLoans
Loans on DwellingsFor 5 or More
Families
Number Number Number Number Number Number$000's $000's $000's $000's $000's $000's
Page 1 of 1
A B C D E F
Home Purchase Loans
Loans on 1- to 4-Family and Manufactured Home Dwellings
Loans OnManufactured Home
Dwellings FromColumns A,B,C & D
G
$000'sNumber
Nonoccupant Loans
From Columns
A, B, C & D

BORROWER CHARACTERISTICS
RACE 5/AMERICAN INDIAN/ALASKA NATIVE 3 1 1 19 2.10 2.28
ASIAN 38 28 9 1220 1.85 1.76
BLACK OR AFRICAN AMERICAN 330 249 73 4 41098 1.84 1.79
NATIVE HAWAIIAN/OTHER PACIFICISLND
3 318 1.61 1.60
WHITE 810 664 132 10 44116 1.79 1.72
2 OR MORE MINORITY RACES 2 22 1.74 1.74
JOINT (WHITE/MINORITY RACE) 13 11 260 1.75 1.75
RACE NOT AVAILABLE 6/ 67 54 11 2481 1.77 1.66
ETHNICITY 7/HISPANIC OR LATINO 110 84 23 2 1576 1.82 1.71
NOT HISPANIC OR LATINO 1070 858 191 13 84924 1.80 1.74
JOINT (HISPANIC OR LATINO/ NOTHISPANIC OR LATINO)
15 14 170 1.69 1.64
ETHNICITY NOT AVAILABLE 6/ 71 56 13 2434 1.79 1.69
MINORITY STATUS 8/WHITE NON-HISPANIC 697 577 108 9 33511 1.78 1.72
OTHERS, INCLUDING HISPANIC 501 381 108 6 62005 1.83 1.76
INCOME 9/LESS THAN 50% OF MSA/MD MEDIAN 247 178 63 4 21281 1.86 1.79
50-79% OF MSA/MD MEDIAN 458 370 82 5 11949 1.79 1.72
80-99% OF MSA/MD MEDIAN 199 158 35 5 1850 1.80 1.72
100-119% OF MSA/MD MEDIAN 135 116 17 2673 1.76 1.69
120% OR MORE OF MSA/MD MEDIAN 221 188 31 1 11207 1.76 1.71
INCOME NOT AVAILABLE 6/ 6 2 444 2.89 3.34
GENDER 19/MALE 475 376 93 4 22032 1.80 1.75
FEMALE 449 348 86 8 71990 1.82 1.74
JOINT (MALE/FEMALE) 320 270 46 41744 1.78 1.72
GENDER NOT AVAILABLE 6/ 22 18 3 1238 1.78 1.66
CENSUS TRACT CHARACTERISTICS 10/
RACIAL/ETHNIC COMPOSITION 11/LESS THAN 10% MINORITY 258 216 37 4 11274 1.78 1.71
10-19% MINORITY 309 263 41 3 21588 1.77 1.70
20-49% MINORITY 327 268 54 3 21617 1.79 1.73
50-79% MINORITY 134 95 36 2 1604 1.84 1.78
80-100% MINORITY 238 170 60 5 3921 1.87 1.80
INCOME CHARACTERISTICS 12/ 13/LOW INCOME 136 91 40 2 3636 1.87 1.76
MODERATE INCOME 340 258 76 4 21549 1.83 1.77
MIDDLE INCOME 504 413 82 6 32285 1.79 1.72
UPPER INCOME 285 249 30 5 11534 1.76 1.70
Report Date: 06/02/2014
AGGREGATE TABLE 11 - 1: PRICING INFORMATION FOR FHA HOME-PURCHASE LOANS, FIRST LIEN, 1- TO 4-FAMILY OWNER-OCCUPIED DWELLING (EXCLUDES MANUFACTURED HOMES), BYBORROWER OR CENSUS TRACT CHARACTERISTICS, 2013
MSA/MD: 37964 - PHILADELPHIA, PA
BORROWER OR CENSUS TRACTCHARACTERISTICS
15/NO REPORTEDPRICING DATA
REPORTEDPRICING DATA 2.00 - 2.49 2.50 - 2.99 3.00 - 3.99
# # # # # #
Page 1 of 2
4.00 - 4.99
#
5 OR MORE
#
MEAN MEDIAN1.50 - 1.99
PERCENTAGE POINTS ABOVE AVERAGE PRIME OFFER RATE: ONLY INCLUDES LOANS WITH APR ABOVE THE THRESHOLD 16/
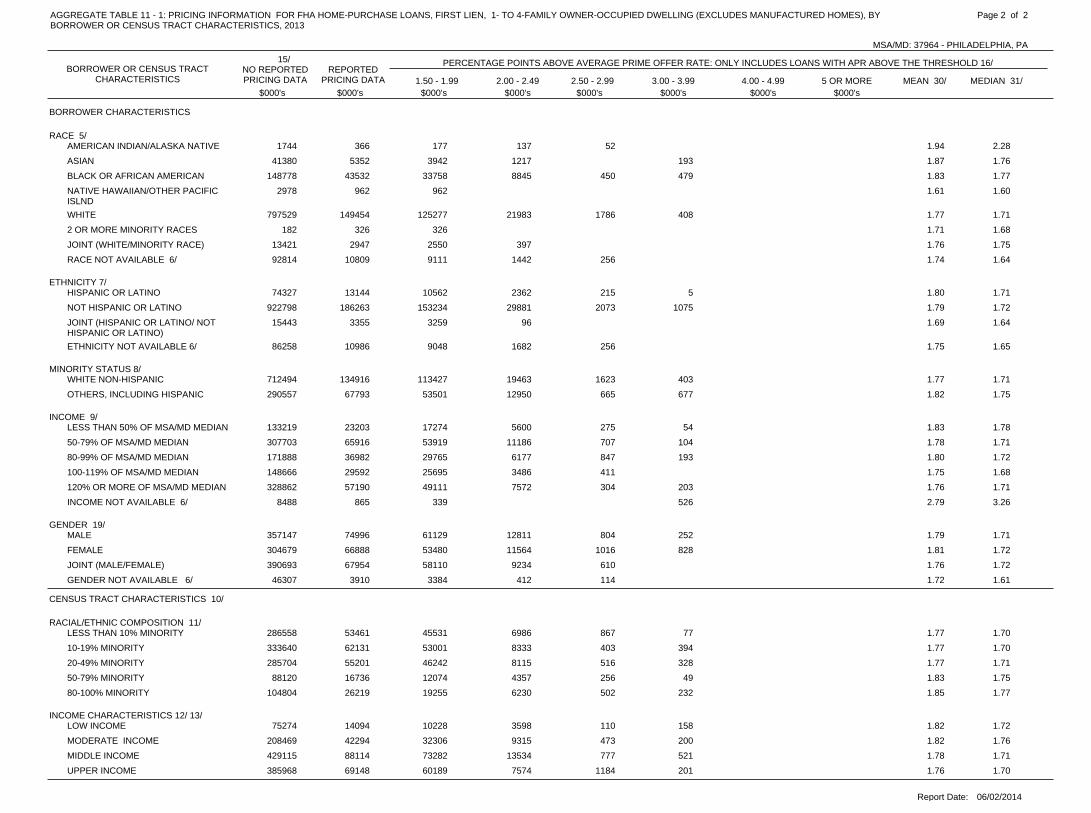
BORROWER CHARACTERISTICS
RACE 5/AMERICAN INDIAN/ALASKA NATIVE 366 177 137 521744 1.94 2.28
ASIAN 5352 3942 1217 19341380 1.87 1.76
BLACK OR AFRICAN AMERICAN 43532 33758 8845 450 479148778 1.83 1.77
NATIVE HAWAIIAN/OTHER PACIFICISLND
962 9622978 1.61 1.60
WHITE 149454 125277 21983 1786 408797529 1.77 1.71
2 OR MORE MINORITY RACES 326 326182 1.71 1.68
JOINT (WHITE/MINORITY RACE) 2947 2550 39713421 1.76 1.75
RACE NOT AVAILABLE 6/ 10809 9111 1442 25692814 1.74 1.64
ETHNICITY 7/HISPANIC OR LATINO 13144 10562 2362 215 574327 1.80 1.71
NOT HISPANIC OR LATINO 186263 153234 29881 2073 1075922798 1.79 1.72
JOINT (HISPANIC OR LATINO/ NOTHISPANIC OR LATINO)
3355 3259 9615443 1.69 1.64
ETHNICITY NOT AVAILABLE 6/ 10986 9048 1682 25686258 1.75 1.65
MINORITY STATUS 8/WHITE NON-HISPANIC 134916 113427 19463 1623 403712494 1.77 1.71
OTHERS, INCLUDING HISPANIC 67793 53501 12950 665 677290557 1.82 1.75
INCOME 9/LESS THAN 50% OF MSA/MD MEDIAN 23203 17274 5600 275 54133219 1.83 1.78
50-79% OF MSA/MD MEDIAN 65916 53919 11186 707 104307703 1.78 1.71
80-99% OF MSA/MD MEDIAN 36982 29765 6177 847 193171888 1.80 1.72
100-119% OF MSA/MD MEDIAN 29592 25695 3486 411148666 1.75 1.68
120% OR MORE OF MSA/MD MEDIAN 57190 49111 7572 304 203328862 1.76 1.71
INCOME NOT AVAILABLE 6/ 865 339 5268488 2.79 3.26
GENDER 19/MALE 74996 61129 12811 804 252357147 1.79 1.71
FEMALE 66888 53480 11564 1016 828304679 1.81 1.72
JOINT (MALE/FEMALE) 67954 58110 9234 610390693 1.76 1.72
GENDER NOT AVAILABLE 6/ 3910 3384 412 11446307 1.72 1.61
CENSUS TRACT CHARACTERISTICS 10/
RACIAL/ETHNIC COMPOSITION 11/LESS THAN 10% MINORITY 53461 45531 6986 867 77286558 1.77 1.70
10-19% MINORITY 62131 53001 8333 403 394333640 1.77 1.70
20-49% MINORITY 55201 46242 8115 516 328285704 1.77 1.71
50-79% MINORITY 16736 12074 4357 256 4988120 1.83 1.75
80-100% MINORITY 26219 19255 6230 502 232104804 1.85 1.77
INCOME CHARACTERISTICS 12/ 13/LOW INCOME 14094 10228 3598 110 15875274 1.82 1.72
MODERATE INCOME 42294 32306 9315 473 200208469 1.82 1.76
MIDDLE INCOME 88114 73282 13534 777 521429115 1.78 1.71
UPPER INCOME 69148 60189 7574 1184 201385968 1.76 1.70
Report Date: 06/02/2014
AGGREGATE TABLE 11 - 1: PRICING INFORMATION FOR FHA HOME-PURCHASE LOANS, FIRST LIEN, 1- TO 4-FAMILY OWNER-OCCUPIED DWELLING (EXCLUDES MANUFACTURED HOMES), BYBORROWER OR CENSUS TRACT CHARACTERISTICS, 2013
MSA/MD: 37964 - PHILADELPHIA, PA
BORROWER OR CENSUS TRACTCHARACTERISTICS
15/NO REPORTEDPRICING DATA
REPORTEDPRICING DATA 2.00 - 2.49 2.50 - 2.99 3.00 - 3.99
$000's $000's $000's $000's $000's $000's
Page 2 of 2
4.00 - 4.99
$000's
5 OR MORE
$000's
MEAN 30/ MEDIAN 31/1.50 - 1.99
PERCENTAGE POINTS ABOVE AVERAGE PRIME OFFER RATE: ONLY INCLUDES LOANS WITH APR ABOVE THE THRESHOLD 16/

BORROWER CHARACTERISTICS
RACE 5/AMERICAN INDIAN/ALASKA NATIVE 2
ASIAN 12
BLACK OR AFRICAN AMERICAN 154
NATIVE HAWAIIAN/OTHER PACIFICISLND
3
WHITE 1 1788 2.06 2.06
2 OR MORE MINORITY RACES 1
JOINT (WHITE/MINORITY RACE) 19
RACE NOT AVAILABLE 6/ 85
ETHNICITY 7/HISPANIC OR LATINO 32
NOT HISPANIC OR LATINO 1 1923 2.06 2.06
JOINT (HISPANIC OR LATINO/ NOTHISPANIC OR LATINO)
25
ETHNICITY NOT AVAILABLE 6/ 84
MINORITY STATUS 8/WHITE NON-HISPANIC 1 1735 2.06 2.06
OTHERS, INCLUDING HISPANIC 239
INCOME 9/LESS THAN 50% OF MSA/MD MEDIAN 63
50-79% OF MSA/MD MEDIAN 275
80-99% OF MSA/MD MEDIAN 193
100-119% OF MSA/MD MEDIAN 133
120% OR MORE OF MSA/MD MEDIAN 1 1394 2.06 2.06
INCOME NOT AVAILABLE 6/ 6
GENDER 19/MALE 502
FEMALE 61
JOINT (MALE/FEMALE) 1 1452 2.06 2.06
GENDER NOT AVAILABLE 6/ 49
CENSUS TRACT CHARACTERISTICS 10/
RACIAL/ETHNIC COMPOSITION 11/LESS THAN 10% MINORITY 1 1333 2.06 2.06
10-19% MINORITY 339
20-49% MINORITY 247
50-79% MINORITY 61
80-100% MINORITY 84
INCOME CHARACTERISTICS 12/ 13/LOW INCOME 40
MODERATE INCOME 145
MIDDLE INCOME 1 1431 2.06 2.06
UPPER INCOME 447
Report Date: 06/02/2014
AGGREGATE TABLE 11 - 2: PRICING INFORMATION FOR VA HOME-PURCHASE LOANS, FIRST LIEN, 1- TO 4-FAMILY OWNER-OCCUPIED DWELLING (EXCLUDES MANUFACTURED HOMES), BYBORROWER OR CENSUS TRACT CHARACTERISTICS, 2013
MSA/MD: 37964 - PHILADELPHIA, PA
BORROWER OR CENSUS TRACTCHARACTERISTICS
15/NO REPORTEDPRICING DATA
REPORTEDPRICING DATA 2.00 - 2.49 2.50 - 2.99 3.00 - 3.99
# # # # # #
Page 1 of 2
4.00 - 4.99
#
5 OR MORE
#
MEAN MEDIAN1.50 - 1.99
PERCENTAGE POINTS ABOVE AVERAGE PRIME OFFER RATE: ONLY INCLUDES LOANS WITH APR ABOVE THE THRESHOLD 16/

BORROWER CHARACTERISTICS
RACE 5/AMERICAN INDIAN/ALASKA NATIVE 388
ASIAN 4324
BLACK OR AFRICAN AMERICAN 27898
NATIVE HAWAIIAN/OTHER PACIFICISLND
934
WHITE 238 238210417 2.06 2.06
2 OR MORE MINORITY RACES 225
JOINT (WHITE/MINORITY RACE) 5278
RACE NOT AVAILABLE 6/ 22653
ETHNICITY 7/HISPANIC OR LATINO 5755
NOT HISPANIC OR LATINO 238 238236511 2.06 2.06
JOINT (HISPANIC OR LATINO/ NOTHISPANIC OR LATINO)
7794
ETHNICITY NOT AVAILABLE 6/ 22057
MINORITY STATUS 8/WHITE NON-HISPANIC 238 238197866 2.06 2.06
OTHERS, INCLUDING HISPANIC 50199
INCOME 9/LESS THAN 50% OF MSA/MD MEDIAN 8072
50-79% OF MSA/MD MEDIAN 47950
80-99% OF MSA/MD MEDIAN 43516
100-119% OF MSA/MD MEDIAN 34784
120% OR MORE OF MSA/MD MEDIAN 238 238135832 2.06 2.06
INCOME NOT AVAILABLE 6/ 1963
GENDER 19/MALE 112266
FEMALE 11820
JOINT (MALE/FEMALE) 238 238133836 2.06 2.06
GENDER NOT AVAILABLE 6/ 14195
CENSUS TRACT CHARACTERISTICS 10/
RACIAL/ETHNIC COMPOSITION 11/LESS THAN 10% MINORITY 238 238100000 2.06 2.06
10-19% MINORITY 89005
20-49% MINORITY 57664
50-79% MINORITY 12634
80-100% MINORITY 12814
INCOME CHARACTERISTICS 12/ 13/LOW INCOME 6046
MODERATE INCOME 24484
MIDDLE INCOME 238 23898734 2.06 2.06
UPPER INCOME 142583
Report Date: 06/02/2014
AGGREGATE TABLE 11 - 2: PRICING INFORMATION FOR VA HOME-PURCHASE LOANS, FIRST LIEN, 1- TO 4-FAMILY OWNER-OCCUPIED DWELLING (EXCLUDES MANUFACTURED HOMES), BYBORROWER OR CENSUS TRACT CHARACTERISTICS, 2013
MSA/MD: 37964 - PHILADELPHIA, PA
BORROWER OR CENSUS TRACTCHARACTERISTICS
15/NO REPORTEDPRICING DATA
REPORTEDPRICING DATA 2.00 - 2.49 2.50 - 2.99 3.00 - 3.99
$000's $000's $000's $000's $000's $000's
Page 2 of 2
4.00 - 4.99
$000's
5 OR MORE
$000's
MEAN 30/ MEDIAN 31/1.50 - 1.99
PERCENTAGE POINTS ABOVE AVERAGE PRIME OFFER RATE: ONLY INCLUDES LOANS WITH APR ABOVE THE THRESHOLD 16/

BORROWER CHARACTERISTICS
RACE 5/AMERICAN INDIAN/ALASKA NATIVE 25
ASIAN 27 23 2 21656 1.76 1.67
BLACK OR AFRICAN AMERICAN 15 12 2 1573 1.83 1.68
NATIVE HAWAIIAN/OTHER PACIFICISLND
1 134 2.35 2.35
WHITE 84 58 16 6 216935 2 1.92 1.74
2 OR MORE MINORITY RACES 5
JOINT (WHITE/MINORITY RACE) 2 2349 1.78 1.78
RACE NOT AVAILABLE 6/ 9 4 4 12126 2.04 2.04
ETHNICITY 7/HISPANIC OR LATINO 7 5 2382 1.84 1.81
NOT HISPANIC OR LATINO 123 88 22 9 219023 2 1.89 1.70
JOINT (HISPANIC OR LATINO/ NOTHISPANIC OR LATINO)
1 1206 1.67 1.67
ETHNICITY NOT AVAILABLE 6/ 7 5 1 12092 1.96 1.89
MINORITY STATUS 8/WHITE NON-HISPANIC 78 53 15 6 216246 2 1.93 1.72
OTHERS, INCLUDING HISPANIC 52 42 7 33193 1.81 1.69
INCOME 9/LESS THAN 50% OF MSA/MD MEDIAN 24 19 2 21239 1 1.90 1.70
50-79% OF MSA/MD MEDIAN 31 21 6 33679 1 1.96 1.70
80-99% OF MSA/MD MEDIAN 22 15 5 22521 1.88 1.76
100-119% OF MSA/MD MEDIAN 15 9 4 1 12278 1.98 1.89
120% OR MORE OF MSA/MD MEDIAN 46 35 8 2 111750 1.81 1.70
INCOME NOT AVAILABLE 6/ 236
GENDER 19/MALE 41 26 11 46281 1.89 1.80
FEMALE 31 21 6 2 14576 1 1.99 1.77
JOINT (MALE/FEMALE) 61 49 7 3 19755 1 1.83 1.68
GENDER NOT AVAILABLE 6/ 5 3 1 11091 2.03 1.89
CENSUS TRACT CHARACTERISTICS 10/
RACIAL/ETHNIC COMPOSITION 11/LESS THAN 10% MINORITY 27 23 2 1 16905 1.76 1.66
10-19% MINORITY 31 17 10 38273 1 2.04 1.81
20-49% MINORITY 47 36 6 3 15121 1 1.89 1.70
50-79% MINORITY 21 14 5 2892 1.87 1.75
80-100% MINORITY 12 9 2 1512 1.83 1.68
INCOME CHARACTERISTICS 12/ 13/LOW INCOME 19 12 5 2619 1.91 1.75
MODERATE INCOME 30 23 5 21557 1.84 1.70
MIDDLE INCOME 54 35 11 6 16048 1 1.96 1.76
UPPER INCOME 35 29 4 113459 1 1.82 1.67
Report Date: 06/02/2014
AGGREGATE TABLE 11 - 3: PRICING INFORMATION FOR CONVENTIONAL HOME-PURCHASE LOANS, FIRST LIEN, 1- TO 4-FAMILY OWNER-OCCUPIED DWELLING (EXCLUDES MANUFACTUREDHOMES), BY BORROWER OR CENSUS TRACT CHARACTERISTICS, 2013
MSA/MD: 37964 - PHILADELPHIA, PA
BORROWER OR CENSUS TRACTCHARACTERISTICS
15/NO REPORTEDPRICING DATA
REPORTEDPRICING DATA 2.00 - 2.49 2.50 - 2.99 3.00 - 3.99
# # # # # #
Page 1 of 2
4.00 - 4.99
#
5 OR MORE
#
MEAN MEDIAN1.50 - 1.99
PERCENTAGE POINTS ABOVE AVERAGE PRIME OFFER RATE: ONLY INCLUDES LOANS WITH APR ABOVE THE THRESHOLD 16/

BORROWER CHARACTERISTICS
RACE 5/AMERICAN INDIAN/ALASKA NATIVE 5251
ASIAN 3507 3127 155 225456489 1.71 1.64
BLACK OR AFRICAN AMERICAN 1655 1349 242 64105556 1.81 1.68
NATIVE HAWAIIAN/OTHER PACIFICISLND
400 40010453 2.35 2.35
WHITE 17790 14181 2201 720 4944701402 194 1.81 1.66
2 OR MORE MINORITY RACES 1061
JOINT (WHITE/MINORITY RACE) 307 307121093 1.74 1.70
RACE NOT AVAILABLE 6/ 1700 678 903 119650108 2.02 2.08
ETHNICITY 7/HISPANIC OR LATINO 861 676 18584068 1.80 1.79
NOT HISPANIC OR LATINO 23192 17929 3566 1009 4945264065 194 1.82 1.67
JOINT (HISPANIC OR LATINO/ NOTHISPANIC OR LATINO)
276 27663750 1.67 1.67
ETHNICITY NOT AVAILABLE 6/ 1030 761 150 119639530 1.92 1.89
MINORITY STATUS 8/WHITE NON-HISPANIC 16843 13348 2087 720 4944520463 194 1.82 1.66
OTHERS, INCLUDING HISPANIC 6909 5638 982 289838996 1.79 1.67
INCOME 9/LESS THAN 50% OF MSA/MD MEDIAN 2075 1790 100 139135245 46 1.81 1.67
50-79% OF MSA/MD MEDIAN 3808 2716 648 296603496 148 1.93 1.68
80-99% OF MSA/MD MEDIAN 3031 2277 524 230517533 1.84 1.75
100-119% OF MSA/MD MEDIAN 2161 1467 423 96 175539020 1.93 1.66
120% OR MORE OF MSA/MD MEDIAN 14284 11392 2206 367 3194187604 1.77 1.63
INCOME NOT AVAILABLE 6/ 68515
GENDER 19/MALE 7934 5975 1653 3061625136 1.79 1.63
FEMALE 4504 2731 1078 330 319977542 46 2.01 1.79
JOINT (MALE/FEMALE) 12045 10329 1020 373 1753102140 148 1.77 1.67
GENDER NOT AVAILABLE 6/ 876 607 150 119346595 1.95 1.89
CENSUS TRACT CHARACTERISTICS 10/
RACIAL/ETHNIC COMPOSITION 11/LESS THAN 10% MINORITY 6256 5534 155 248 3192047959 1.75 1.62
10-19% MINORITY 5537 3851 1273 2652446509 148 1.90 1.67
20-49% MINORITY 9762 7672 1489 380 1751293312 46 1.82 1.70
50-79% MINORITY 2453 1551 731 171192381 1.87 1.75
80-100% MINORITY 1351 1034 253 6471252 1.78 1.67
INCOME CHARACTERISTICS 12/ 13/LOW INCOME 2398 1517 742 139111417 1.86 1.75
MODERATE INCOME 3097 2284 567 246267111 1.85 1.69
MIDDLE INCOME 9721 7447 1310 743 1751312766 46 1.84 1.70
UPPER INCOME 10143 8394 1282 3194356879 148 1.78 1.63
Report Date: 06/02/2014
AGGREGATE TABLE 11 - 3: PRICING INFORMATION FOR CONVENTIONAL HOME-PURCHASE LOANS, FIRST LIEN, 1- TO 4-FAMILY OWNER-OCCUPIED DWELLING (EXCLUDES MANUFACTUREDHOMES), BY BORROWER OR CENSUS TRACT CHARACTERISTICS, 2013
MSA/MD: 37964 - PHILADELPHIA, PA
BORROWER OR CENSUS TRACTCHARACTERISTICS
15/NO REPORTEDPRICING DATA
REPORTEDPRICING DATA 2.00 - 2.49 2.50 - 2.99 3.00 - 3.99
$000's $000's $000's $000's $000's $000's
Page 2 of 2
4.00 - 4.99
$000's
5 OR MORE
$000's
MEAN 30/ MEDIAN 31/1.50 - 1.99
PERCENTAGE POINTS ABOVE AVERAGE PRIME OFFER RATE: ONLY INCLUDES LOANS WITH APR ABOVE THE THRESHOLD 16/
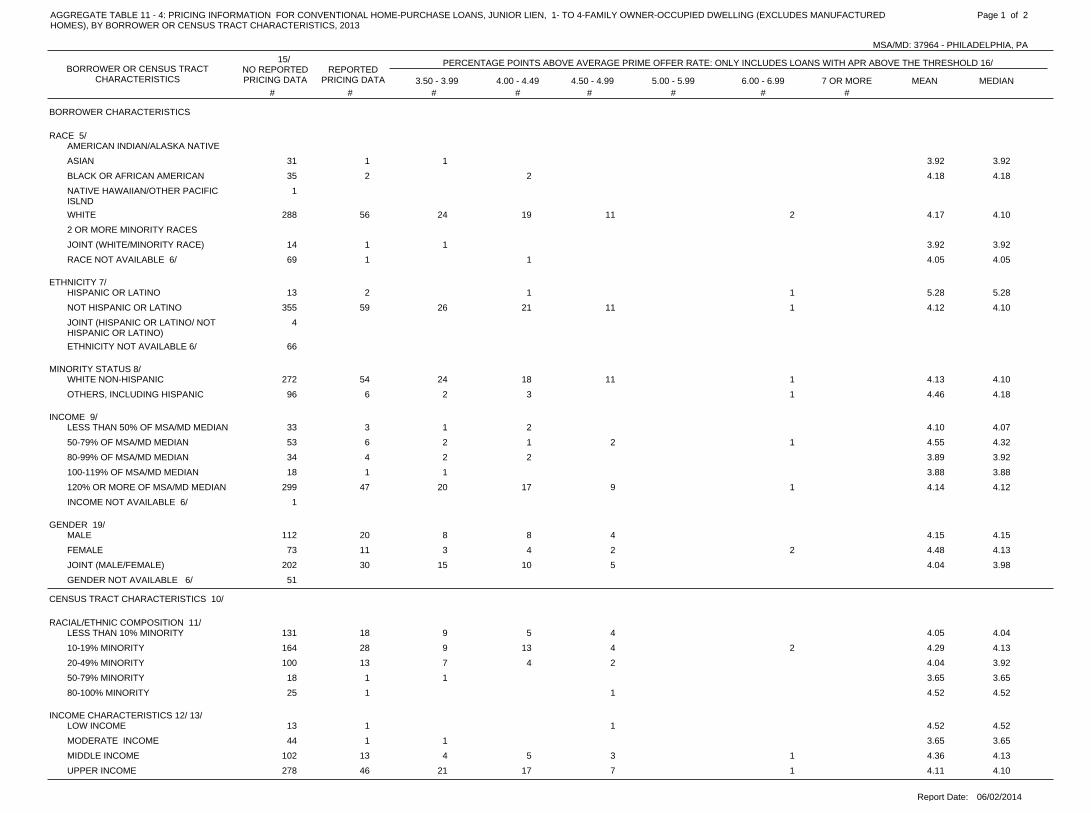
BORROWER CHARACTERISTICS
RACE 5/AMERICAN INDIAN/ALASKA NATIVE
ASIAN 1 131 3.92 3.92
BLACK OR AFRICAN AMERICAN 2 235 4.18 4.18
NATIVE HAWAIIAN/OTHER PACIFICISLND
1
WHITE 56 24 19 11288 2 4.17 4.10
2 OR MORE MINORITY RACES
JOINT (WHITE/MINORITY RACE) 1 114 3.92 3.92
RACE NOT AVAILABLE 6/ 1 169 4.05 4.05
ETHNICITY 7/HISPANIC OR LATINO 2 113 1 5.28 5.28
NOT HISPANIC OR LATINO 59 26 21 11355 1 4.12 4.10
JOINT (HISPANIC OR LATINO/ NOTHISPANIC OR LATINO)
4
ETHNICITY NOT AVAILABLE 6/ 66
MINORITY STATUS 8/WHITE NON-HISPANIC 54 24 18 11272 1 4.13 4.10
OTHERS, INCLUDING HISPANIC 6 2 396 1 4.46 4.18
INCOME 9/LESS THAN 50% OF MSA/MD MEDIAN 3 1 233 4.10 4.07
50-79% OF MSA/MD MEDIAN 6 2 1 253 1 4.55 4.32
80-99% OF MSA/MD MEDIAN 4 2 234 3.89 3.92
100-119% OF MSA/MD MEDIAN 1 118 3.88 3.88
120% OR MORE OF MSA/MD MEDIAN 47 20 17 9299 1 4.14 4.12
INCOME NOT AVAILABLE 6/ 1
GENDER 19/MALE 20 8 8 4112 4.15 4.15
FEMALE 11 3 4 273 2 4.48 4.13
JOINT (MALE/FEMALE) 30 15 10 5202 4.04 3.98
GENDER NOT AVAILABLE 6/ 51
CENSUS TRACT CHARACTERISTICS 10/
RACIAL/ETHNIC COMPOSITION 11/LESS THAN 10% MINORITY 18 9 5 4131 4.05 4.04
10-19% MINORITY 28 9 13 4164 2 4.29 4.13
20-49% MINORITY 13 7 4 2100 4.04 3.92
50-79% MINORITY 1 118 3.65 3.65
80-100% MINORITY 1 125 4.52 4.52
INCOME CHARACTERISTICS 12/ 13/LOW INCOME 1 113 4.52 4.52
MODERATE INCOME 1 144 3.65 3.65
MIDDLE INCOME 13 4 5 3102 1 4.36 4.13
UPPER INCOME 46 21 17 7278 1 4.11 4.10
Report Date: 06/02/2014
AGGREGATE TABLE 11 - 4: PRICING INFORMATION FOR CONVENTIONAL HOME-PURCHASE LOANS, JUNIOR LIEN, 1- TO 4-FAMILY OWNER-OCCUPIED DWELLING (EXCLUDES MANUFACTUREDHOMES), BY BORROWER OR CENSUS TRACT CHARACTERISTICS, 2013
MSA/MD: 37964 - PHILADELPHIA, PA
BORROWER OR CENSUS TRACTCHARACTERISTICS
15/NO REPORTEDPRICING DATA
REPORTEDPRICING DATA 4.00 - 4.49 4.50 - 4.99 5.00 - 5.99
# # # # # #
Page 1 of 2
6.00 - 6.99
#
7 OR MORE
#
MEAN MEDIAN3.50 - 3.99
PERCENTAGE POINTS ABOVE AVERAGE PRIME OFFER RATE: ONLY INCLUDES LOANS WITH APR ABOVE THE THRESHOLD 16/

BORROWER CHARACTERISTICS
RACE 5/AMERICAN INDIAN/ALASKA NATIVE
ASIAN 116 1162528 3.92 3.92
BLACK OR AFRICAN AMERICAN 228 228364 4.18 4.18
NATIVE HAWAIIAN/OTHER PACIFICISLND
65
WHITE 3392 1417 1189 59220294 194 4.21 4.10
2 OR MORE MINORITY RACES
JOINT (WHITE/MINORITY RACE) 35 351305 3.92 3.92
RACE NOT AVAILABLE 6/ 4 48468 4.05 4.05
ETHNICITY 7/HISPANIC OR LATINO 233 105325 128 5.37 6.25
NOT HISPANIC OR LATINO 3542 1568 1316 59224045 66 4.12 4.10
JOINT (HISPANIC OR LATINO/ NOTHISPANIC OR LATINO)
348
ETHNICITY NOT AVAILABLE 6/ 8306
MINORITY STATUS 8/WHITE NON-HISPANIC 3159 1417 1084 59219676 66 4.12 4.10
OTHERS, INCLUDING HISPANIC 612 151 3334790 128 4.57 4.18
INCOME 9/LESS THAN 50% OF MSA/MD MEDIAN 58 18 40270 4.11 4.07
50-79% OF MSA/MD MEDIAN 186 56 4 60905 66 5.04 4.59
80-99% OF MSA/MD MEDIAN 80 23 571973 3.97 4.10
100-119% OF MSA/MD MEDIAN 48 48891 3.88 3.88
120% OR MORE OF MSA/MD MEDIAN 3403 1423 1320 53228655 128 4.16 4.13
INCOME NOT AVAILABLE 6/ 330
GENDER 19/MALE 1346 447 705 1946497 4.16 4.16
FEMALE 524 162 82 862325 194 4.84 4.50
JOINT (MALE/FEMALE) 1905 959 634 31216697 4.04 3.95
GENDER NOT AVAILABLE 6/ 7505
CENSUS TRACT CHARACTERISTICS 10/
RACIAL/ETHNIC COMPOSITION 11/LESS THAN 10% MINORITY 1159 624 301 23411014 4.03 3.95
10-19% MINORITY 1851 615 832 21014780 194 4.35 4.16
20-49% MINORITY 711 311 288 1126434 4.07 4.10
50-79% MINORITY 18 18525 3.65 3.65
80-100% MINORITY 36 36271 4.52 4.52
INCOME CHARACTERISTICS 12/ 13/LOW INCOME 36 36233 4.52 4.52
MODERATE INCOME 18 18645 3.65 3.65
MIDDLE INCOME 390 116 99 1094871 66 4.63 4.32
UPPER INCOME 3331 1434 1322 44727245 128 4.14 4.10
Report Date: 06/02/2014
AGGREGATE TABLE 11 - 4: PRICING INFORMATION FOR CONVENTIONAL HOME-PURCHASE LOANS, JUNIOR LIEN, 1- TO 4-FAMILY OWNER-OCCUPIED DWELLING (EXCLUDES MANUFACTUREDHOMES), BY BORROWER OR CENSUS TRACT CHARACTERISTICS, 2013
MSA/MD: 37964 - PHILADELPHIA, PA
BORROWER OR CENSUS TRACTCHARACTERISTICS
15/NO REPORTEDPRICING DATA
REPORTEDPRICING DATA 4.00 - 4.49 4.50 - 4.99 5.00 - 5.99
$000's $000's $000's $000's $000's $000's
Page 2 of 2
6.00 - 6.99
$000's
7 OR MORE
$000's
MEAN 30/ MEDIAN 31/3.50 - 3.99
PERCENTAGE POINTS ABOVE AVERAGE PRIME OFFER RATE: ONLY INCLUDES LOANS WITH APR ABOVE THE THRESHOLD 16/

BORROWER CHARACTERISTICS
RACE 5/AMERICAN INDIAN/ALASKA NATIVE 16
ASIAN 8 6 2158 2.18 1.64
BLACK OR AFRICAN AMERICAN 123 23 12 13 67771 8 2.99 3.16
NATIVE HAWAIIAN/OTHER PACIFICISLND
11
WHITE 196 80 12 24 753717 4 1 22.61 2.57
2 OR MORE MINORITY RACES 8
JOINT (WHITE/MINORITY RACE) 2 242 3.07 3.07
RACE NOT AVAILABLE 6/ 27 16 2 3 5631 1 2.27 1.84
ETHNICITY 7/HISPANIC OR LATINO 7 5198 2 3.71 3.92
NOT HISPANIC OR LATINO 319 109 25 38 1354511 11 1 12.71 2.89
JOINT (HISPANIC OR LATINO/ NOTHISPANIC OR LATINO)
4 1 365 13.07 3.51
ETHNICITY NOT AVAILABLE 6/ 26 15 1 2 8580 2.37 1.80
MINORITY STATUS 8/WHITE NON-HISPANIC 185 77 12 24 673462 4 1 12.58 2.54
OTHERS, INCLUDING HISPANIC 140 30 12 13 771247 8 12.96 3.15
INCOME 9/LESS THAN 50% OF MSA/MD MEDIAN 44 19 2 4 16211 2 1 2.68 2.71
50-79% OF MSA/MD MEDIAN 38 19 9 1 9555 2.25 1.97
80-99% OF MSA/MD MEDIAN 27 17 3 3 4368 12.05 1.78
100-119% OF MSA/MD MEDIAN 16 15 1277 1.72 1.66
120% OR MORE OF MSA/MD MEDIAN 56 40 6 3 7723 11.98 1.71
INCOME NOT AVAILABLE 6/ 175 15 6 28 1153220 11 3.24 3.36
GENDER 19/MALE 91 40 11 9 281486 3 12.48 2.13
FEMALE 141 38 10 18 671496 7 1 2.88 3.04
JOINT (MALE/FEMALE) 113 37 5 13 552065 3 12.76 3.04
GENDER NOT AVAILABLE 6/ 11 10 1307 1.85 1.71
CENSUS TRACT CHARACTERISTICS 10/
RACIAL/ETHNIC COMPOSITION 11/LESS THAN 10% MINORITY 61 25 4 7 251234 2.57 2.65
10-19% MINORITY 88 41 5 14 271593 1 12.46 2.28
20-49% MINORITY 75 29 6 6 311449 3 12.63 2.75
50-79% MINORITY 33 12 3 2 14441 2 2.65 2.96
80-100% MINORITY 99 18 8 11 54637 7 1 3.09 3.27
INCOME CHARACTERISTICS 12/ 13/LOW INCOME 51 10 4 4 28347 4 1 3.14 3.26
MODERATE INCOME 99 27 8 9 491142 6 12.84 3.09
MIDDLE INCOME 113 52 10 13 352231 3 12.48 2.20
UPPER INCOME 93 36 4 14 391633 2.61 2.78
Report Date: 06/02/2014
AGGREGATE TABLE 11 - 5: PRICING INFORMATION FOR FHA REFINANCING LOANS, FIRST LIEN, 1- TO 4-FAMILY OWNER-OCCUPIED DWELLING (EXCLUDES MANUFACTURED HOMES), BY BORROWER ORCENSUS TRACT CHARACTERISTICS, 2013
MSA/MD: 37964 - PHILADELPHIA, PA
BORROWER OR CENSUS TRACTCHARACTERISTICS
15/NO REPORTEDPRICING DATA
REPORTEDPRICING DATA 2.00 - 2.49 2.50 - 2.99 3.00 - 3.99
# # # # # #
Page 1 of 2
4.00 - 4.99
#
5 OR MORE
#
MEAN MEDIAN1.50 - 1.99
PERCENTAGE POINTS ABOVE AVERAGE PRIME OFFER RATE: ONLY INCLUDES LOANS WITH APR ABOVE THE THRESHOLD 16/HOEPA
LOANS 17/
#

BORROWER CHARACTERISTICS
RACE 5/AMERICAN INDIAN/ALASKA NATIVE 2988
ASIAN 1088 873 21531704 2.07 1.62
BLACK OR AFRICAN AMERICAN 13059 2826 1603 1677 6381106946 572 2.85 3.06
NATIVE HAWAIIAN/OTHER PACIFICISLND
2008
WHITE 35050 17104 2397 4506 10494764465 473 76 3382.43 2.04
2 OR MORE MINORITY RACES 1328
JOINT (WHITE/MINORITY RACE) 233 2339162 3.05 3.04
RACE NOT AVAILABLE 6/ 4490 2854 251 650 640114467 95 2.16 1.79
ETHNICITY 7/HISPANIC OR LATINO 702 63230007 70 3.55 3.35
NOT HISPANIC OR LATINO 48622 20789 4196 6323 16168883184 1070 76 1992.52 2.29
JOINT (HISPANIC OR LATINO/ NOTHISPANIC OR LATINO)
454 139 31513237 1392.93 3.37
ETHNICITY NOT AVAILABLE 6/ 4142 2729 55 510 848106640 2.18 1.72
MINORITY STATUS 8/WHITE NON-HISPANIC 33688 16685 2397 4506 9551720533 473 76 1992.41 2.01
OTHERS, INCLUDING HISPANIC 15311 3838 1603 1677 7621194291 572 1392.82 3.06
INCOME 9/LESS THAN 50% OF MSA/MD MEDIAN 4433 1802 138 681 160126668 135 76 2.66 2.88
50-79% OF MSA/MD MEDIAN 5437 2769 1198 449 102190046 2.21 1.94
80-99% OF MSA/MD MEDIAN 4673 3037 500 605 53172590 1992.01 1.78
100-119% OF MSA/MD MEDIAN 3419 3246 17359043 1.70 1.65
120% OR MORE OF MSA/MD MEDIAN 14697 11064 1789 457 1387189050 1391.91 1.69
INCOME NOT AVAILABLE 6/ 21261 1739 626 4468 13423595671 1005 3.21 3.30
GENDER 19/MALE 13522 6661 1548 1709 3409274849 195 1992.36 2.00
FEMALE 18567 6242 1845 3061 6610247000 733 76 2.67 2.65
JOINT (MALE/FEMALE) 19775 8922 858 2063 7720453713 212 1392.52 2.50
GENDER NOT AVAILABLE 6/ 2056 1832 22457506 1.88 1.71
CENSUS TRACT CHARACTERISTICS 10/
RACIAL/ETHNIC COMPOSITION 11/LESS THAN 10% MINORITY 12731 5782 861 1342 4746276637 2.48 2.04
10-19% MINORITY 17658 9061 1471 3203 3824343185 99 1392.32 1.97
20-49% MINORITY 12089 5813 849 914 4136275571 377 1992.48 2.13
50-79% MINORITY 3682 1513 242 447 131667299 164 2.58 2.89
80-100% MINORITY 7760 1488 828 927 394170376 500 76 3.01 3.23
INCOME CHARACTERISTICS 12/ 13/LOW INCOME 3589 822 289 196 203136654 175 76 3.07 3.26
MODERATE INCOME 9316 3095 763 915 3922156195 621 1392.72 2.94
MIDDLE INCOME 18713 9738 2023 2197 4411433542 344 1992.33 1.94
UPPER INCOME 22302 10002 1176 3525 7599406500 2.48 2.36
Report Date: 06/02/2014
AGGREGATE TABLE 11 - 5: PRICING INFORMATION FOR FHA REFINANCING LOANS, FIRST LIEN, 1- TO 4-FAMILY OWNER-OCCUPIED DWELLING (EXCLUDES MANUFACTURED HOMES), BY BORROWER ORCENSUS TRACT CHARACTERISTICS, 2013
MSA/MD: 37964 - PHILADELPHIA, PA
BORROWER OR CENSUS TRACTCHARACTERISTICS
15/NO REPORTEDPRICING DATA
REPORTEDPRICING DATA 2.00 - 2.49 2.50 - 2.99 3.00 - 3.99
$000's $000's $000's $000's $000's $000's
Page 2 of 2
4.00 - 4.99
$000's
5 OR MORE
$000's
MEAN 30/ MEDIAN 31/1.50 - 1.99
PERCENTAGE POINTS ABOVE AVERAGE PRIME OFFER RATE: ONLY INCLUDES LOANS WITH APR ABOVE THE THRESHOLD 16/HOEPA
LOANS 17/
$000's

BORROWER CHARACTERISTICS
RACE 5/AMERICAN INDIAN/ALASKA NATIVE 4
ASIAN 13
BLACK OR AFRICAN AMERICAN 2 2180 1.63 1.63
NATIVE HAWAIIAN/OTHER PACIFICISLND
2
WHITE 6 6974 1.61 1.63
2 OR MORE MINORITY RACES 1
JOINT (WHITE/MINORITY RACE) 1 123 1.67 1.67
RACE NOT AVAILABLE 6/ 1 1215 1.65 1.65
ETHNICITY 7/HISPANIC OR LATINO 33
NOT HISPANIC OR LATINO 9 91157 1.62 1.63
JOINT (HISPANIC OR LATINO/ NOTHISPANIC OR LATINO)
18
ETHNICITY NOT AVAILABLE 6/ 1 1204 1.65 1.65
MINORITY STATUS 8/WHITE NON-HISPANIC 6 6924 1.61 1.63
OTHERS, INCLUDING HISPANIC 3 3268 1.64 1.67
INCOME 9/LESS THAN 50% OF MSA/MD MEDIAN 39
50-79% OF MSA/MD MEDIAN 4 4142 1.58 1.59
80-99% OF MSA/MD MEDIAN 1 199 1.67 1.67
100-119% OF MSA/MD MEDIAN 1 191 1.75 1.75
120% OR MORE OF MSA/MD MEDIAN 4 4272 1.63 1.64
INCOME NOT AVAILABLE 6/ 769
GENDER 19/MALE 4 4502 1.64 1.65
FEMALE 84
JOINT (MALE/FEMALE) 5 5708 1.61 1.63
GENDER NOT AVAILABLE 6/ 1 1118 1.65 1.65
CENSUS TRACT CHARACTERISTICS 10/
RACIAL/ETHNIC COMPOSITION 11/LESS THAN 10% MINORITY 1 1423 1.67 1.67
10-19% MINORITY 3 3450 1.57 1.55
20-49% MINORITY 4 4364 1.66 1.63
50-79% MINORITY 1 173 1.75 1.75
80-100% MINORITY 1 1102 1.51 1.51
INCOME CHARACTERISTICS 12/ 13/LOW INCOME 1 142 1.51 1.51
MODERATE INCOME 2 2199 1.63 1.63
MIDDLE INCOME 4 4595 1.64 1.63
UPPER INCOME 3 3576 1.65 1.65
Report Date: 06/02/2014
AGGREGATE TABLE 11 - 6: PRICING INFORMATION FOR VA REFINANCING LOANS, FIRST LIEN, 1- TO 4-FAMILY OWNER-OCCUPIED DWELLING (EXCLUDES MANUFACTURED HOMES), BY BORROWER ORCENSUS TRACT CHARACTERISTICS, 2013
MSA/MD: 37964 - PHILADELPHIA, PA
BORROWER OR CENSUS TRACTCHARACTERISTICS
15/NO REPORTEDPRICING DATA
REPORTEDPRICING DATA 2.00 - 2.49 2.50 - 2.99 3.00 - 3.99
# # # # # #
Page 1 of 2
4.00 - 4.99
#
5 OR MORE
#
MEAN MEDIAN1.50 - 1.99
PERCENTAGE POINTS ABOVE AVERAGE PRIME OFFER RATE: ONLY INCLUDES LOANS WITH APR ABOVE THE THRESHOLD 16/HOEPA
LOANS 17/
#

BORROWER CHARACTERISTICS
RACE 5/AMERICAN INDIAN/ALASKA NATIVE 798
ASIAN 3037
BLACK OR AFRICAN AMERICAN 330 33031772 1.67 1.75
NATIVE HAWAIIAN/OTHER PACIFICISLND
277
WHITE 1532 1532235455 1.65 1.63
2 OR MORE MINORITY RACES 141
JOINT (WHITE/MINORITY RACE) 307 3075652 1.67 1.67
RACE NOT AVAILABLE 6/ 257 25749927 1.65 1.65
ETHNICITY 7/HISPANIC OR LATINO 5514
NOT HISPANIC OR LATINO 2169 2169268510 1.65 1.63
JOINT (HISPANIC OR LATINO/ NOTHISPANIC OR LATINO)
4831
ETHNICITY NOT AVAILABLE 6/ 257 25748204 1.65 1.65
MINORITY STATUS 8/WHITE NON-HISPANIC 1532 1532224366 1.65 1.63
OTHERS, INCLUDING HISPANIC 637 63750802 1.67 1.67
INCOME 9/LESS THAN 50% OF MSA/MD MEDIAN 5099
50-79% OF MSA/MD MEDIAN 741 74126019 1.59 1.62
80-99% OF MSA/MD MEDIAN 307 30719915 1.67 1.67
100-119% OF MSA/MD MEDIAN 216 21621059 1.75 1.75
120% OR MORE OF MSA/MD MEDIAN 1162 116280618 1.67 1.65
INCOME NOT AVAILABLE 6/ 174349
GENDER 19/MALE 966 966105315 1.68 1.75
FEMALE 13812
JOINT (MALE/FEMALE) 1203 1203181623 1.63 1.63
GENDER NOT AVAILABLE 6/ 257 25726309 1.65 1.65
CENSUS TRACT CHARACTERISTICS 10/
RACIAL/ETHNIC COMPOSITION 11/LESS THAN 10% MINORITY 307 307113063 1.67 1.67
10-19% MINORITY 548 548109531 1.59 1.55
20-49% MINORITY 1241 124181116 1.67 1.63
50-79% MINORITY 216 21611385 1.75 1.75
80-100% MINORITY 114 11411964 1.51 1.51
INCOME CHARACTERISTICS 12/ 13/LOW INCOME 114 1144487 1.51 1.51
MODERATE INCOME 328 32829209 1.66 1.75
MIDDLE INCOME 1179 1179126058 1.66 1.63
UPPER INCOME 805 805167305 1.65 1.65
Report Date: 06/02/2014
AGGREGATE TABLE 11 - 6: PRICING INFORMATION FOR VA REFINANCING LOANS, FIRST LIEN, 1- TO 4-FAMILY OWNER-OCCUPIED DWELLING (EXCLUDES MANUFACTURED HOMES), BY BORROWER ORCENSUS TRACT CHARACTERISTICS, 2013
MSA/MD: 37964 - PHILADELPHIA, PA
BORROWER OR CENSUS TRACTCHARACTERISTICS
15/NO REPORTEDPRICING DATA
REPORTEDPRICING DATA 2.00 - 2.49 2.50 - 2.99 3.00 - 3.99
$000's $000's $000's $000's $000's $000's
Page 2 of 2
4.00 - 4.99
$000's
5 OR MORE
$000's
MEAN 30/ MEDIAN 31/1.50 - 1.99
PERCENTAGE POINTS ABOVE AVERAGE PRIME OFFER RATE: ONLY INCLUDES LOANS WITH APR ABOVE THE THRESHOLD 16/HOEPA
LOANS 17/
$000's
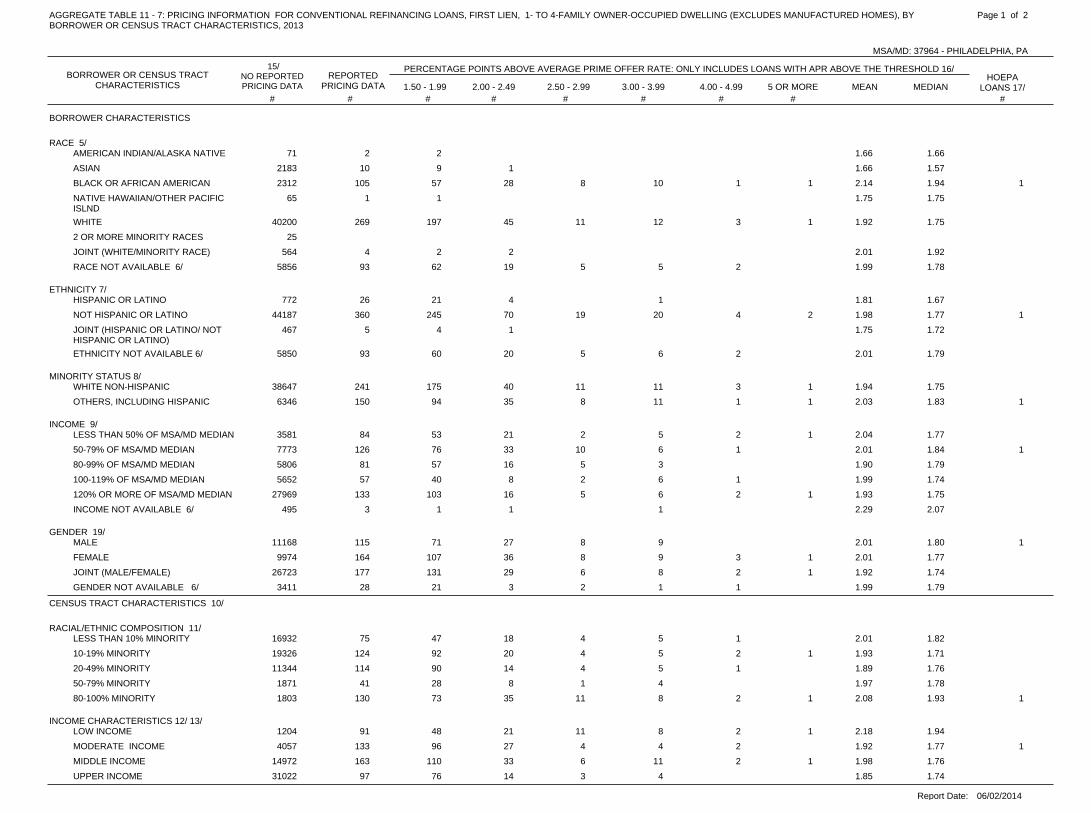
BORROWER CHARACTERISTICS
RACE 5/AMERICAN INDIAN/ALASKA NATIVE 2 271 1.66 1.66
ASIAN 10 9 12183 1.66 1.57
BLACK OR AFRICAN AMERICAN 105 57 28 8 102312 1 1 12.14 1.94
NATIVE HAWAIIAN/OTHER PACIFICISLND
1 165 1.75 1.75
WHITE 269 197 45 11 1240200 3 1 1.92 1.75
2 OR MORE MINORITY RACES 25
JOINT (WHITE/MINORITY RACE) 4 2 2564 2.01 1.92
RACE NOT AVAILABLE 6/ 93 62 19 5 55856 2 1.99 1.78
ETHNICITY 7/HISPANIC OR LATINO 26 21 4 1772 1.81 1.67
NOT HISPANIC OR LATINO 360 245 70 19 2044187 4 2 11.98 1.77
JOINT (HISPANIC OR LATINO/ NOTHISPANIC OR LATINO)
5 4 1467 1.75 1.72
ETHNICITY NOT AVAILABLE 6/ 93 60 20 5 65850 2 2.01 1.79
MINORITY STATUS 8/WHITE NON-HISPANIC 241 175 40 11 1138647 3 1 1.94 1.75
OTHERS, INCLUDING HISPANIC 150 94 35 8 116346 1 1 12.03 1.83
INCOME 9/LESS THAN 50% OF MSA/MD MEDIAN 84 53 21 2 53581 2 1 2.04 1.77
50-79% OF MSA/MD MEDIAN 126 76 33 10 67773 1 12.01 1.84
80-99% OF MSA/MD MEDIAN 81 57 16 5 35806 1.90 1.79
100-119% OF MSA/MD MEDIAN 57 40 8 2 65652 1 1.99 1.74
120% OR MORE OF MSA/MD MEDIAN 133 103 16 5 627969 2 1 1.93 1.75
INCOME NOT AVAILABLE 6/ 3 1 1 1495 2.29 2.07
GENDER 19/MALE 115 71 27 8 911168 12.01 1.80
FEMALE 164 107 36 8 99974 3 1 2.01 1.77
JOINT (MALE/FEMALE) 177 131 29 6 826723 2 1 1.92 1.74
GENDER NOT AVAILABLE 6/ 28 21 3 2 13411 1 1.99 1.79
CENSUS TRACT CHARACTERISTICS 10/
RACIAL/ETHNIC COMPOSITION 11/LESS THAN 10% MINORITY 75 47 18 4 516932 1 2.01 1.82
10-19% MINORITY 124 92 20 4 519326 2 1 1.93 1.71
20-49% MINORITY 114 90 14 4 511344 1 1.89 1.76
50-79% MINORITY 41 28 8 1 41871 1.97 1.78
80-100% MINORITY 130 73 35 11 81803 2 1 12.08 1.93
INCOME CHARACTERISTICS 12/ 13/LOW INCOME 91 48 21 11 81204 2 1 2.18 1.94
MODERATE INCOME 133 96 27 4 44057 2 11.92 1.77
MIDDLE INCOME 163 110 33 6 1114972 2 1 1.98 1.76
UPPER INCOME 97 76 14 3 431022 1.85 1.74
Report Date: 06/02/2014
AGGREGATE TABLE 11 - 7: PRICING INFORMATION FOR CONVENTIONAL REFINANCING LOANS, FIRST LIEN, 1- TO 4-FAMILY OWNER-OCCUPIED DWELLING (EXCLUDES MANUFACTURED HOMES), BYBORROWER OR CENSUS TRACT CHARACTERISTICS, 2013
MSA/MD: 37964 - PHILADELPHIA, PA
BORROWER OR CENSUS TRACTCHARACTERISTICS
15/NO REPORTEDPRICING DATA
REPORTEDPRICING DATA 2.00 - 2.49 2.50 - 2.99 3.00 - 3.99
# # # # # #
Page 1 of 2
4.00 - 4.99
#
5 OR MORE
#
MEAN MEDIAN1.50 - 1.99
PERCENTAGE POINTS ABOVE AVERAGE PRIME OFFER RATE: ONLY INCLUDES LOANS WITH APR ABOVE THE THRESHOLD 16/HOEPA
LOANS 17/
#

BORROWER CHARACTERISTICS
RACE 5/AMERICAN INDIAN/ALASKA NATIVE 240 24011248 1.63 1.53
ASIAN 1975 1879 96537899 1.67 1.58
BLACK OR AFRICAN AMERICAN 7969 4851 2050 383 590307010 55 40 542.05 1.93
NATIVE HAWAIIAN/OTHER PACIFICISLND
60 6012336 1.75 1.75
WHITE 45825 37317 5045 1020 20898908047 289 65 1.85 1.70
2 OR MORE MINORITY RACES 4247
JOINT (WHITE/MINORITY RACE) 568 261 307145470 2.04 2.09
RACE NOT AVAILABLE 6/ 10082 7717 1668 336 2911313988 70 1.86 1.74
ETHNICITY 7/HISPANIC OR LATINO 2443 2045 350 48123886 1.77 1.64
NOT HISPANIC OR LATINO 53372 41931 6955 1403 26349681832 344 105 541.88 1.74
JOINT (HISPANIC OR LATINO/ NOTHISPANIC OR LATINO)
953 810 143111932 1.75 1.72
ETHNICITY NOT AVAILABLE 6/ 9951 7539 1718 336 2881322595 70 1.87 1.74
MINORITY STATUS 8/WHITE NON-HISPANIC 42759 34666 4645 1020 20748587151 289 65 1.86 1.71
OTHERS, INCLUDING HISPANIC 13916 9997 2803 383 6381234203 55 40 541.92 1.75
INCOME 9/LESS THAN 50% OF MSA/MD MEDIAN 5167 3806 980 94 157371318 90 40 1.92 1.73
50-79% OF MSA/MD MEDIAN 11967 8041 3018 474 3451052176 89 541.92 1.78
80-99% OF MSA/MD MEDIAN 9257 7502 1221 261 273944668 1.81 1.71
100-119% OF MSA/MD MEDIAN 7523 5574 964 228 6371032615 120 1.94 1.69
120% OR MORE OF MSA/MD MEDIAN 32346 27207 2887 682 13907713898 115 65 1.84 1.71
INCOME NOT AVAILABLE 6/ 459 195 96 168125570 2.29 2.07
GENDER 19/MALE 15507 12050 2511 419 5272439073 541.85 1.75
FEMALE 15787 11531 2913 506 6181636041 179 40 1.90 1.70
JOINT (MALE/FEMALE) 31799 25806 3362 566 18006377037 200 65 1.87 1.72
GENDER NOT AVAILABLE 6/ 3626 2938 380 248 25788094 35 1.85 1.69
CENSUS TRACT CHARACTERISTICS 10/
RACIAL/ETHNIC COMPOSITION 11/LESS THAN 10% MINORITY 13397 9390 2286 352 13343967170 35 1.96 1.81
10-19% MINORITY 21962 18926 2137 276 3584575289 200 65 1.79 1.68
20-49% MINORITY 18616 15682 1610 510 7252260980 89 1.84 1.70
50-79% MINORITY 4208 3225 798 69 116276754 1.83 1.69
80-100% MINORITY 8536 5102 2335 532 437160052 90 40 542.03 1.92
INCOME CHARACTERISTICS 12/ 13/LOW INCOME 5767 3415 1346 571 305120178 90 40 2.08 1.90
MODERATE INCOME 12613 9709 1956 361 378499344 209 541.91 1.77
MIDDLE INCOME 23015 17723 3473 659 9802569055 115 65 1.86 1.70
UPPER INCOME 25324 21478 2391 148 13078048358 1.81 1.68
Report Date: 06/02/2014
AGGREGATE TABLE 11 - 7: PRICING INFORMATION FOR CONVENTIONAL REFINANCING LOANS, FIRST LIEN, 1- TO 4-FAMILY OWNER-OCCUPIED DWELLING (EXCLUDES MANUFACTURED HOMES), BYBORROWER OR CENSUS TRACT CHARACTERISTICS, 2013
MSA/MD: 37964 - PHILADELPHIA, PA
BORROWER OR CENSUS TRACTCHARACTERISTICS
15/NO REPORTEDPRICING DATA
REPORTEDPRICING DATA 2.00 - 2.49 2.50 - 2.99 3.00 - 3.99
$000's $000's $000's $000's $000's $000's
Page 2 of 2
4.00 - 4.99
$000's
5 OR MORE
$000's
MEAN 30/ MEDIAN 31/1.50 - 1.99
PERCENTAGE POINTS ABOVE AVERAGE PRIME OFFER RATE: ONLY INCLUDES LOANS WITH APR ABOVE THE THRESHOLD 16/HOEPA
LOANS 17/
$000's

BORROWER CHARACTERISTICS
RACE 5/AMERICAN INDIAN/ALASKA NATIVE 1 18 3.52 3.52
ASIAN 33
BLACK OR AFRICAN AMERICAN 18 9 6 2177 1 4.17 3.99
NATIVE HAWAIIAN/OTHER PACIFICISLND
1 110 4.09 4.09
WHITE 106 59 35 5 41602 3 4.04 3.91
2 OR MORE MINORITY RACES 2
JOINT (WHITE/MINORITY RACE) 19
RACE NOT AVAILABLE 6/ 56 19 31 1 2407 2 1 4.25 4.13
ETHNICITY 7/HISPANIC OR LATINO 7 4 249 1 4.19 3.80
NOT HISPANIC OR LATINO 119 67 37 7 41731 3 1 4.06 3.91
JOINT (HISPANIC OR LATINO/ NOTHISPANIC OR LATINO)
1 123 4.20 4.20
ETHNICITY NOT AVAILABLE 6/ 55 17 33 1 2455 1 1 4.23 4.13
MINORITY STATUS 8/WHITE NON-HISPANIC 101 57 32 5 41496 3 4.04 3.91
OTHERS, INCLUDING HISPANIC 26 14 8 2310 1 1 4.15 3.86
INCOME 9/LESS THAN 50% OF MSA/MD MEDIAN 15 6 3 2 3114 1 4.48 4.28
50-79% OF MSA/MD MEDIAN 28 14 10 3334 1 4.10 4.02
80-99% OF MSA/MD MEDIAN 29 14 11 1285 2 1 4.22 4.01
100-119% OF MSA/MD MEDIAN 23 10 12 1289 4.00 4.09
120% OR MORE OF MSA/MD MEDIAN 86 43 37 1 31211 2 4.06 4.00
INCOME NOT AVAILABLE 6/ 1 125 3.81 3.81
GENDER 19/MALE 33 13 15 2 2397 1 4.18 4.11
FEMALE 40 19 14 3 1436 2 1 4.19 4.04
JOINT (MALE/FEMALE) 104 53 43 3 31283 1 1 4.05 3.94
GENDER NOT AVAILABLE 6/ 5 3 1142 1 4.42 3.87
CENSUS TRACT CHARACTERISTICS 10/
RACIAL/ETHNIC COMPOSITION 11/LESS THAN 10% MINORITY 50 26 22 1 1709 3.97 3.94
10-19% MINORITY 56 28 19 3 3820 3 4.17 3.98
20-49% MINORITY 49 22 22 2 1477 1 1 4.14 4.09
50-79% MINORITY 8 6 179 1 4.19 3.78
80-100% MINORITY 19 6 9 2 1173 1 4.26 4.15
INCOME CHARACTERISTICS 12/ 13/LOW INCOME 7 4 285 1 4.28 3.75
MODERATE INCOME 34 16 13 2 1268 1 1 4.14 4.10
MIDDLE INCOME 84 42 32 5 4891 1 4.05 4.00
UPPER INCOME 57 26 26 1 11013 2 1 4.18 4.08
Report Date: 06/02/2014
AGGREGATE TABLE 11 - 8: PRICING INFORMATION FOR CONVENTIONAL REFINANCING LOANS, JUNIOR LIEN, 1- TO 4-FAMILY OWNER-OCCUPIED DWELLING (EXCLUDES MANUFACTURED HOMES), BYBORROWER OR CENSUS TRACT CHARACTERISTICS, 2013
MSA/MD: 37964 - PHILADELPHIA, PA
BORROWER OR CENSUS TRACTCHARACTERISTICS
15/NO REPORTEDPRICING DATA
REPORTEDPRICING DATA 4.00 - 4.49 4.50 - 4.99 5.00 - 5.99
# # # # # #
Page 1 of 2
6.00 - 6.99
#
7 OR MORE
#
MEAN MEDIAN3.50 - 3.99
PERCENTAGE POINTS ABOVE AVERAGE PRIME OFFER RATE: ONLY INCLUDES LOANS WITH APR ABOVE THE THRESHOLD 16/HOEPA
LOANS 17/
#
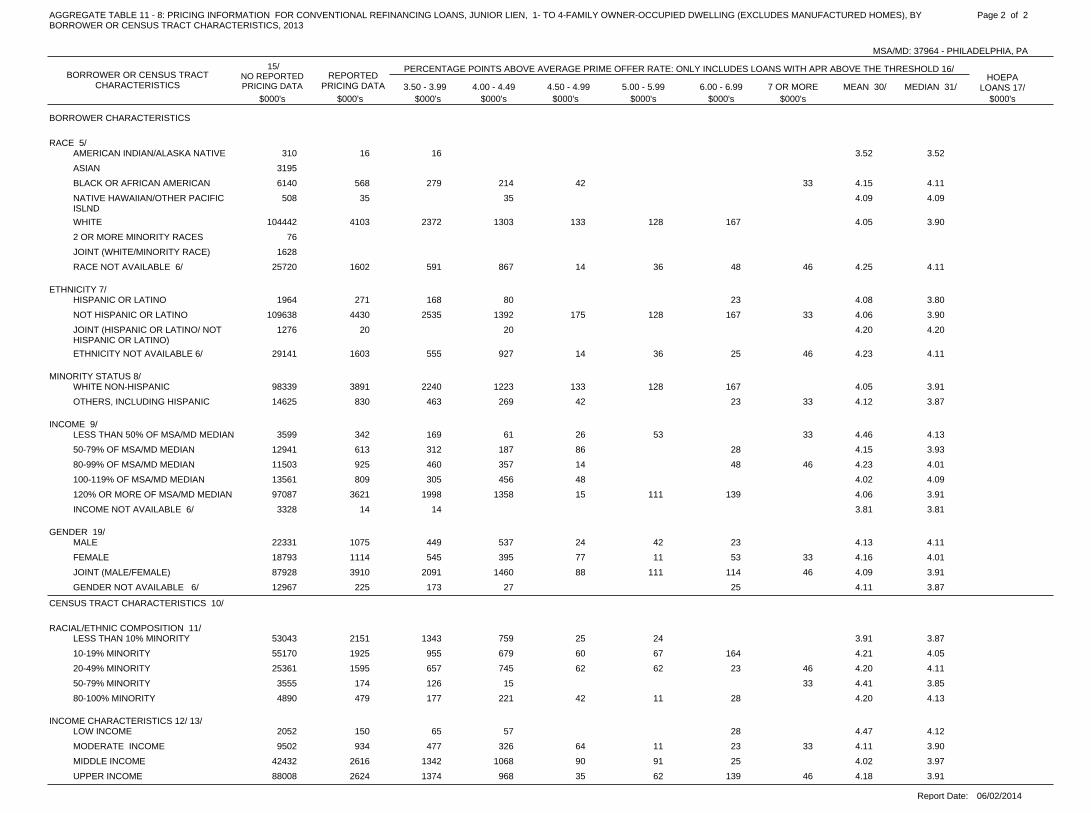
BORROWER CHARACTERISTICS
RACE 5/AMERICAN INDIAN/ALASKA NATIVE 16 16310 3.52 3.52
ASIAN 3195
BLACK OR AFRICAN AMERICAN 568 279 214 426140 33 4.15 4.11
NATIVE HAWAIIAN/OTHER PACIFICISLND
35 35508 4.09 4.09
WHITE 4103 2372 1303 133 128104442 167 4.05 3.90
2 OR MORE MINORITY RACES 76
JOINT (WHITE/MINORITY RACE) 1628
RACE NOT AVAILABLE 6/ 1602 591 867 14 3625720 48 46 4.25 4.11
ETHNICITY 7/HISPANIC OR LATINO 271 168 801964 23 4.08 3.80
NOT HISPANIC OR LATINO 4430 2535 1392 175 128109638 167 33 4.06 3.90
JOINT (HISPANIC OR LATINO/ NOTHISPANIC OR LATINO)
20 201276 4.20 4.20
ETHNICITY NOT AVAILABLE 6/ 1603 555 927 14 3629141 25 46 4.23 4.11
MINORITY STATUS 8/WHITE NON-HISPANIC 3891 2240 1223 133 12898339 167 4.05 3.91
OTHERS, INCLUDING HISPANIC 830 463 269 4214625 23 33 4.12 3.87
INCOME 9/LESS THAN 50% OF MSA/MD MEDIAN 342 169 61 26 533599 33 4.46 4.13
50-79% OF MSA/MD MEDIAN 613 312 187 8612941 28 4.15 3.93
80-99% OF MSA/MD MEDIAN 925 460 357 1411503 48 46 4.23 4.01
100-119% OF MSA/MD MEDIAN 809 305 456 4813561 4.02 4.09
120% OR MORE OF MSA/MD MEDIAN 3621 1998 1358 15 11197087 139 4.06 3.91
INCOME NOT AVAILABLE 6/ 14 143328 3.81 3.81
GENDER 19/MALE 1075 449 537 24 4222331 23 4.13 4.11
FEMALE 1114 545 395 77 1118793 53 33 4.16 4.01
JOINT (MALE/FEMALE) 3910 2091 1460 88 11187928 114 46 4.09 3.91
GENDER NOT AVAILABLE 6/ 225 173 2712967 25 4.11 3.87
CENSUS TRACT CHARACTERISTICS 10/
RACIAL/ETHNIC COMPOSITION 11/LESS THAN 10% MINORITY 2151 1343 759 25 2453043 3.91 3.87
10-19% MINORITY 1925 955 679 60 6755170 164 4.21 4.05
20-49% MINORITY 1595 657 745 62 6225361 23 46 4.20 4.11
50-79% MINORITY 174 126 153555 33 4.41 3.85
80-100% MINORITY 479 177 221 42 114890 28 4.20 4.13
INCOME CHARACTERISTICS 12/ 13/LOW INCOME 150 65 572052 28 4.47 4.12
MODERATE INCOME 934 477 326 64 119502 23 33 4.11 3.90
MIDDLE INCOME 2616 1342 1068 90 9142432 25 4.02 3.97
UPPER INCOME 2624 1374 968 35 6288008 139 46 4.18 3.91
Report Date: 06/02/2014
AGGREGATE TABLE 11 - 8: PRICING INFORMATION FOR CONVENTIONAL REFINANCING LOANS, JUNIOR LIEN, 1- TO 4-FAMILY OWNER-OCCUPIED DWELLING (EXCLUDES MANUFACTURED HOMES), BYBORROWER OR CENSUS TRACT CHARACTERISTICS, 2013
MSA/MD: 37964 - PHILADELPHIA, PA
BORROWER OR CENSUS TRACTCHARACTERISTICS
15/NO REPORTEDPRICING DATA
REPORTEDPRICING DATA 4.00 - 4.49 4.50 - 4.99 5.00 - 5.99
$000's $000's $000's $000's $000's $000's
Page 2 of 2
6.00 - 6.99
$000's
7 OR MORE
$000's
MEAN 30/ MEDIAN 31/3.50 - 3.99
PERCENTAGE POINTS ABOVE AVERAGE PRIME OFFER RATE: ONLY INCLUDES LOANS WITH APR ABOVE THE THRESHOLD 16/HOEPA
LOANS 17/
$000's

BORROWER CHARACTERISTICS
RACE 5/AMERICAN INDIAN/ALASKA NATIVE 3
ASIAN 58
BLACK OR AFRICAN AMERICAN 11 5 2 2167 2 2.76 2.74
NATIVE HAWAIIAN/OTHER PACIFICISLND
2
WHITE 36 21 6 4 42041 1 2.13 1.85
2 OR MORE MINORITY RACES 1 12 1.50 1.50
JOINT (WHITE/MINORITY RACE) 22
RACE NOT AVAILABLE 6/ 13 7 2 1 2237 1 2.28 1.77
ETHNICITY 7/HISPANIC OR LATINO 1 149 1.60 1.60
NOT HISPANIC OR LATINO 49 27 6 6 72215 3 2.29 1.87
JOINT (HISPANIC OR LATINO/ NOTHISPANIC OR LATINO)
23
ETHNICITY NOT AVAILABLE 6/ 11 6 2 1 1245 1 2.23 1.77
MINORITY STATUS 8/WHITE NON-HISPANIC 36 21 6 4 41962 1 2.13 1.85
OTHERS, INCLUDING HISPANIC 13 7 2 2319 2 2.57 1.86
INCOME 9/LESS THAN 50% OF MSA/MD MEDIAN 11 6 2 3295 2.02 1.96
50-79% OF MSA/MD MEDIAN 21 9 2 1 5438 4 2.69 2.25
80-99% OF MSA/MD MEDIAN 9 5 1 1 2325 2.29 1.86
100-119% OF MSA/MD MEDIAN 8 6 2287 1.96 1.73
120% OR MORE OF MSA/MD MEDIAN 12 8 3 11164 1.94 1.78
INCOME NOT AVAILABLE 6/ 23
GENDER 19/MALE 22 12 1 4 3506 2 2.46 1.93
FEMALE 18 11 1 1 3543 2 2.29 1.76
JOINT (MALE/FEMALE) 18 10 5 2 11353 1.98 1.74
GENDER NOT AVAILABLE 6/ 3 1 1 1130 2.43 2.25
CENSUS TRACT CHARACTERISTICS 10/
RACIAL/ETHNIC COMPOSITION 11/LESS THAN 10% MINORITY 16 10 3 2 1854 1.97 1.74
10-19% MINORITY 12 6 3 3875 2.23 1.96
20-49% MINORITY 9 7 2519 1.92 1.69
50-79% MINORITY 5 587 1.72 1.75
80-100% MINORITY 19 6 2 3 4197 4 2.84 2.85
INCOME CHARACTERISTICS 12/ 13/LOW INCOME 16 7 1 2 3154 3 2.69 2.48
MODERATE INCOME 10 4 1 3 1265 1 2.52 2.36
MIDDLE INCOME 21 13 4 1 3792 2.03 1.70
UPPER INCOME 14 10 2 1 11321 1.95 1.76
Report Date: 06/02/2014
AGGREGATE TABLE 11 - 9: PRICING INFORMATION FOR CONVENTIONAL HOME IMPROVEMENT LOANS, FIRST LIEN, 1- TO 4-FAMILY OWNER-OCCUPIED DWELLING (EXCLUDES MANUFACTURED HOMES), BYBORROWER OR CENSUS TRACT CHARACTERISTICS, 2013
MSA/MD: 37964 - PHILADELPHIA, PA
BORROWER OR CENSUS TRACTCHARACTERISTICS
15/NO REPORTEDPRICING DATA
REPORTEDPRICING DATA 2.00 - 2.49 2.50 - 2.99 3.00 - 3.99
# # # # # #
Page 1 of 2
4.00 - 4.99
#
5 OR MORE
#
MEAN MEDIAN1.50 - 1.99
PERCENTAGE POINTS ABOVE AVERAGE PRIME OFFER RATE: ONLY INCLUDES LOANS WITH APR ABOVE THE THRESHOLD 16/HOEPA
LOANS 17/
#

BORROWER CHARACTERISTICS
RACE 5/AMERICAN INDIAN/ALASKA NATIVE 340
ASIAN 9350
BLACK OR AFRICAN AMERICAN 527 245 100 8610378 96 2.74 2.74
NATIVE HAWAIIAN/OTHER PACIFICISLND
86
WHITE 4559 3382 758 189 220313900 10 1.90 1.70
2 OR MORE MINORITY RACES 32 32450 1.50 1.50
JOINT (WHITE/MINORITY RACE) 4282
RACE NOT AVAILABLE 6/ 748 533 43 27 6248092 83 2.15 1.74
ETHNICITY 7/HISPANIC OR LATINO 60 603847 1.60 1.60
NOT HISPANIC OR LATINO 5150 3659 758 289 338329691 106 1.99 1.76
JOINT (HISPANIC OR LATINO/ NOTHISPANIC OR LATINO)
4923
ETHNICITY NOT AVAILABLE 6/ 656 473 43 27 3048417 83 2.13 1.75
MINORITY STATUS 8/WHITE NON-HISPANIC 4559 3382 758 189 220304189 10 1.90 1.70
OTHERS, INCLUDING HISPANIC 619 337 100 8633260 96 2.57 1.86
INCOME 9/LESS THAN 50% OF MSA/MD MEDIAN 371 182 85 10414072 2.07 2.09
50-79% OF MSA/MD MEDIAN 1275 767 40 107 17234691 189 2.44 1.82
80-99% OF MSA/MD MEDIAN 679 523 45 25 8635436 1.97 1.70
100-119% OF MSA/MD MEDIAN 526 446 8038801 1.91 1.76
120% OR MORE OF MSA/MD MEDIAN 3015 2274 631 110259248 1.84 1.58
INCOME NOT AVAILABLE 6/ 4630
GENDER 19/MALE 1734 1330 15 145 14869566 96 2.19 1.87
FEMALE 916 631 75 37 8052956 93 2.12 1.75
JOINT (MALE/FEMALE) 3047 2117 686 134 110231525 1.86 1.58
GENDER NOT AVAILABLE 6/ 169 114 25 3032831 1.99 1.54
CENSUS TRACT CHARACTERISTICS 10/
RACIAL/ETHNIC COMPOSITION 11/LESS THAN 10% MINORITY 1331 932 145 144 110146905 2.02 1.87
10-19% MINORITY 2673 1940 623 110149305 1.85 1.58
20-49% MINORITY 780 733 4771288 1.78 1.79
50-79% MINORITY 286 28610083 1.67 1.60
80-100% MINORITY 796 301 33 125 1489297 189 2.86 2.85
INCOME CHARACTERISTICS 12/ 13/LOW INCOME 690 355 15 72 928239 156 2.66 1.96
MODERATE INCOME 512 218 18 187 5620267 33 2.49 2.63
MIDDLE INCOME 1342 965 180 37 16085731 2.00 1.87
UPPER INCOME 3322 2654 588 20 60272641 1.79 1.58
Report Date: 06/02/2014
AGGREGATE TABLE 11 - 9: PRICING INFORMATION FOR CONVENTIONAL HOME IMPROVEMENT LOANS, FIRST LIEN, 1- TO 4-FAMILY OWNER-OCCUPIED DWELLING (EXCLUDES MANUFACTURED HOMES), BYBORROWER OR CENSUS TRACT CHARACTERISTICS, 2013
MSA/MD: 37964 - PHILADELPHIA, PA
BORROWER OR CENSUS TRACTCHARACTERISTICS
15/NO REPORTEDPRICING DATA
REPORTEDPRICING DATA 2.00 - 2.49 2.50 - 2.99 3.00 - 3.99
$000's $000's $000's $000's $000's $000's
Page 2 of 2
4.00 - 4.99
$000's
5 OR MORE
$000's
MEAN 30/ MEDIAN 31/1.50 - 1.99
PERCENTAGE POINTS ABOVE AVERAGE PRIME OFFER RATE: ONLY INCLUDES LOANS WITH APR ABOVE THE THRESHOLD 16/HOEPA
LOANS 17/
$000's

BORROWER CHARACTERISTICS
RACE 5/AMERICAN INDIAN/ALASKA NATIVE 1 14 4.17 4.17
ASIAN 4 444 3.68 3.65
BLACK OR AFRICAN AMERICAN 11 5 2 2134 1 1 4.59 4.11
NATIVE HAWAIIAN/OTHER PACIFICISLND
4
WHITE 78 35 20 11 61478 3 3 4.39 4.14
2 OR MORE MINORITY RACES
JOINT (WHITE/MINORITY RACE) 1 126 4.13 4.13
RACE NOT AVAILABLE 6/ 21 10 7 1 1255 2 4.32 4.09
ETHNICITY 7/HISPANIC OR LATINO 3 337 3.69 3.62
NOT HISPANIC OR LATINO 92 41 25 12 61600 4 4 4.40 4.13
JOINT (HISPANIC OR LATINO/ NOTHISPANIC OR LATINO)
20
ETHNICITY NOT AVAILABLE 6/ 21 10 6 2 1288 2 4.34 4.09
MINORITY STATUS 8/WHITE NON-HISPANIC 74 32 20 10 61395 3 3 4.42 4.15
OTHERS, INCLUDING HISPANIC 20 12 4 2262 1 1 4.23 3.88
INCOME 9/LESS THAN 50% OF MSA/MD MEDIAN 3 1 1101 1 4.71 4.08
50-79% OF MSA/MD MEDIAN 23 10 3 5 1275 2 2 4.70 4.23
80-99% OF MSA/MD MEDIAN 13 6 4 3225 4.08 4.17
100-119% OF MSA/MD MEDIAN 12 7 4198 1 4.12 3.83
120% OR MORE OF MSA/MD MEDIAN 65 30 19 6 61141 1 3 4.34 4.12
INCOME NOT AVAILABLE 6/ 5
GENDER 19/MALE 27 13 5 4 2381 2 1 4.48 4.10
FEMALE 24 9 10 3380 1 1 4.28 4.10
JOINT (MALE/FEMALE) 57 27 15 6 51081 1 3 4.36 4.12
GENDER NOT AVAILABLE 6/ 8 5 1 1103 1 4.36 3.93
CENSUS TRACT CHARACTERISTICS 10/
RACIAL/ETHNIC COMPOSITION 11/LESS THAN 10% MINORITY 40 16 10 5 4684 3 2 4.52 4.17
10-19% MINORITY 36 14 12 5 3707 2 4.44 4.14
20-49% MINORITY 23 15 5 2374 1 4.03 3.69
50-79% MINORITY 4 2 1 160 4.14 3.98
80-100% MINORITY 13 7 3 1120 1 1 4.40 3.92
INCOME CHARACTERISTICS 12/ 13/LOW INCOME 5 3 1 166 4.00 3.87
MODERATE INCOME 20 7 7 3183 2 1 4.49 4.12
MIDDLE INCOME 44 23 11 4 4631 2 4.22 3.93
UPPER INCOME 47 21 12 6 31065 2 3 4.50 4.12
Report Date: 06/02/2014
AGGREGATE TABLE 11 - 10: PRICING INFORMATION FOR CONVENTIONAL HOME IMPROVEMENT LOANS, JUNIOR LIEN, 1- TO 4-FAMILY OWNER-OCCUPIED DWELLING (EXCLUDES MANUFACTURED HOMES),BY BORROWER OR CENSUS TRACT CHARACTERISTICS, 2013
MSA/MD: 37964 - PHILADELPHIA, PA
BORROWER OR CENSUS TRACTCHARACTERISTICS
15/NO REPORTEDPRICING DATA
REPORTEDPRICING DATA 4.00 - 4.49 4.50 - 4.99 5.00 - 5.99
# # # # # #
Page 1 of 2
6.00 - 6.99
#
7 OR MORE
#
MEAN MEDIAN3.50 - 3.99
PERCENTAGE POINTS ABOVE AVERAGE PRIME OFFER RATE: ONLY INCLUDES LOANS WITH APR ABOVE THE THRESHOLD 16/HOEPA
LOANS 17/
#

BORROWER CHARACTERISTICS
RACE 5/AMERICAN INDIAN/ALASKA NATIVE 25 25100 4.17 4.17
ASIAN 108 1082084 3.66 3.63
BLACK OR AFRICAN AMERICAN 247 128 40 374680 24 18 4.45 3.92
NATIVE HAWAIIAN/OTHER PACIFICISLND
206
WHITE 2885 1416 607 258 42160392 76 107 4.41 4.09
2 OR MORE MINORITY RACES
JOINT (WHITE/MINORITY RACE) 25 251088 4.13 4.13
RACE NOT AVAILABLE 6/ 609 241 255 19 439785 51 4.36 4.12
ETHNICITY 7/HISPANIC OR LATINO 125 1251364 3.76 3.87
NOT HISPANIC OR LATINO 3170 1527 722 275 42165015 100 125 4.41 4.10
JOINT (HISPANIC OR LATINO/ NOTHISPANIC OR LATINO)
818
ETHNICITY NOT AVAILABLE 6/ 604 241 230 39 4311138 51 4.38 4.12
MINORITY STATUS 8/WHITE NON-HISPANIC 2740 1291 607 238 42157034 76 107 4.44 4.14
OTHERS, INCLUDING HISPANIC 530 361 90 3710037 24 18 4.10 3.85
INCOME 9/LESS THAN 50% OF MSA/MD MEDIAN 109 73 122589 24 4.40 3.87
50-79% OF MSA/MD MEDIAN 480 263 61 82 307678 16 28 4.34 3.62
80-99% OF MSA/MD MEDIAN 404 189 124 916606 4.09 4.17
100-119% OF MSA/MD MEDIAN 402 225 956144 82 4.49 3.80
120% OR MORE OF MSA/MD MEDIAN 2504 1143 660 141 43455177 60 66 4.42 4.13
INCOME NOT AVAILABLE 6/ 141
GENDER 19/MALE 820 461 212 75 4614980 16 10 4.17 3.94
FEMALE 630 289 210 8911348 24 18 4.19 4.09
JOINT (MALE/FEMALE) 2243 1012 490 131 41847286 60 132 4.53 4.15
GENDER NOT AVAILABLE 6/ 206 131 40 194721 16 4.22 3.98
CENSUS TRACT CHARACTERISTICS 10/
RACIAL/ETHNIC COMPOSITION 11/LESS THAN 10% MINORITY 1473 589 311 85 36128937 76 51 4.61 4.18
10-19% MINORITY 1092 442 355 167 10331036 25 4.31 4.15
20-49% MINORITY 866 611 148 2513577 82 4.16 3.87
50-79% MINORITY 136 93 25 181869 4.02 3.87
80-100% MINORITY 332 158 113 192916 24 18 4.31 4.11
INCOME CHARACTERISTICS 12/ 13/LOW INCOME 159 115 25 191639 3.96 3.87
MODERATE INCOME 442 156 193 455115 30 18 4.35 4.12
MIDDLE INCOME 1313 779 293 64 12620819 51 4.15 3.87
UPPER INCOME 1985 843 441 186 33850762 70 107 4.58 4.18
Report Date: 06/02/2014
AGGREGATE TABLE 11 - 10: PRICING INFORMATION FOR CONVENTIONAL HOME IMPROVEMENT LOANS, JUNIOR LIEN, 1- TO 4-FAMILY OWNER-OCCUPIED DWELLING (EXCLUDES MANUFACTURED HOMES),BY BORROWER OR CENSUS TRACT CHARACTERISTICS, 2013
MSA/MD: 37964 - PHILADELPHIA, PA
BORROWER OR CENSUS TRACTCHARACTERISTICS
15/NO REPORTEDPRICING DATA
REPORTEDPRICING DATA 4.00 - 4.49 4.50 - 4.99 5.00 - 5.99
$000's $000's $000's $000's $000's $000's
Page 2 of 2
6.00 - 6.99
$000's
7 OR MORE
$000's
MEAN 30/ MEDIAN 31/3.50 - 3.99
PERCENTAGE POINTS ABOVE AVERAGE PRIME OFFER RATE: ONLY INCLUDES LOANS WITH APR ABOVE THE THRESHOLD 16/HOEPA
LOANS 17/
$000's
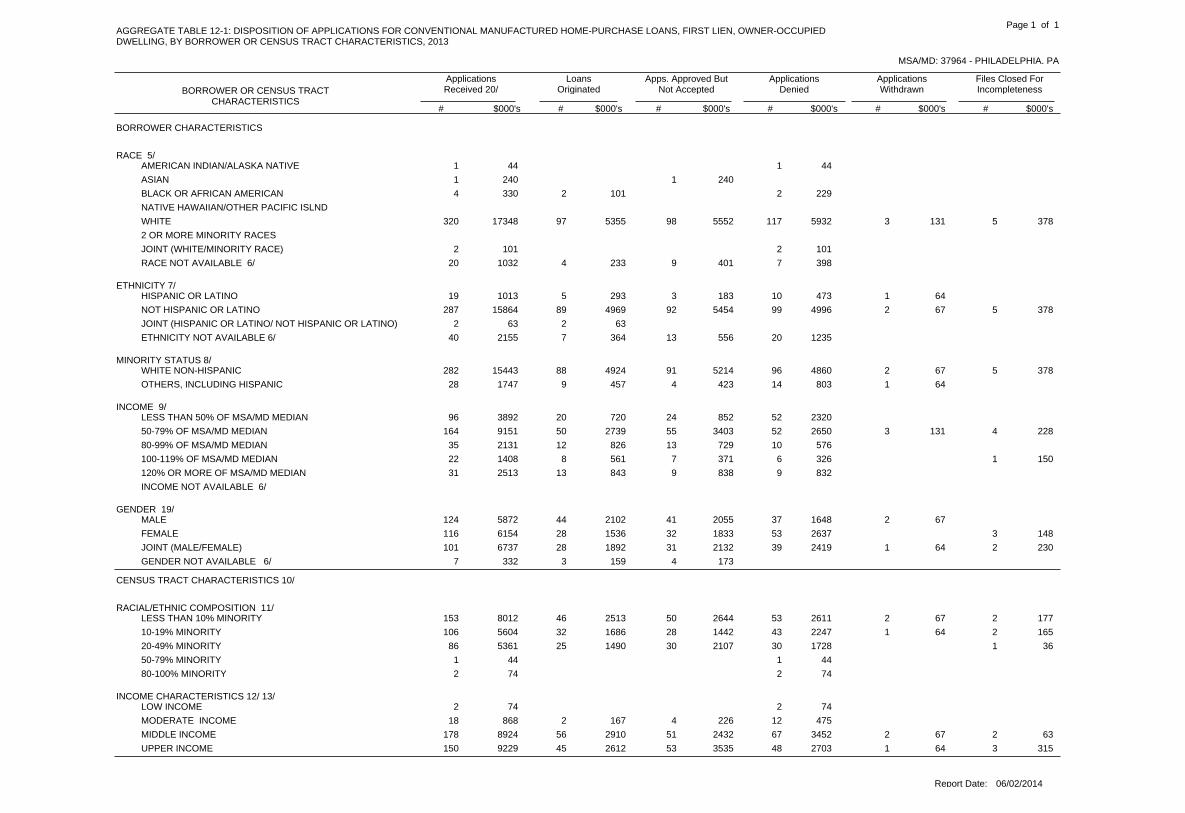
BORROWER CHARACTERISTICS
RACE 5/AMERICAN INDIAN/ALASKA NATIVE 11 44 44
ASIAN 11 240 240
BLACK OR AFRICAN AMERICAN 2 24 330 101 229
NATIVE HAWAIIAN/OTHER PACIFIC ISLND
WHITE 97 98 117 3 5320 17348 5355 5552 5932 131 378
2 OR MORE MINORITY RACES
JOINT (WHITE/MINORITY RACE) 22 101 101
RACE NOT AVAILABLE 6/ 4 9 720 1032 233 401 398
ETHNICITY 7/HISPANIC OR LATINO 5 3 10 119 1013 293 183 473 64
NOT HISPANIC OR LATINO 89 92 99 2 5287 15864 4969 5454 4996 67 378
JOINT (HISPANIC OR LATINO/ NOT HISPANIC OR LATINO) 22 63 63
ETHNICITY NOT AVAILABLE 6/ 7 13 2040 2155 364 556 1235
MINORITY STATUS 8/WHITE NON-HISPANIC 88 91 96 2 5282 15443 4924 5214 4860 67 378
OTHERS, INCLUDING HISPANIC 9 4 14 128 1747 457 423 803 64
INCOME 9/LESS THAN 50% OF MSA/MD MEDIAN 20 24 5296 3892 720 852 2320
50-79% OF MSA/MD MEDIAN 50 55 52 3 4164 9151 2739 3403 2650 131 228
80-99% OF MSA/MD MEDIAN 12 13 1035 2131 826 729 576
100-119% OF MSA/MD MEDIAN 8 7 6 122 1408 561 371 326 150
120% OR MORE OF MSA/MD MEDIAN 13 9 931 2513 843 838 832
INCOME NOT AVAILABLE 6/
GENDER 19/MALE 44 41 37 2124 5872 2102 2055 1648 67
FEMALE 28 32 53 3116 6154 1536 1833 2637 148
JOINT (MALE/FEMALE) 28 31 39 1 2101 6737 1892 2132 2419 64 230
GENDER NOT AVAILABLE 6/ 3 47 332 159 173
CENSUS TRACT CHARACTERISTICS 10/
RACIAL/ETHNIC COMPOSITION 11/LESS THAN 10% MINORITY 46 50 53 2 2153 8012 2513 2644 2611 67 177
10-19% MINORITY 32 28 43 1 2106 5604 1686 1442 2247 64 165
20-49% MINORITY 25 30 30 186 5361 1490 2107 1728 36
50-79% MINORITY 11 44 44
80-100% MINORITY 22 74 74
INCOME CHARACTERISTICS 12/ 13/LOW INCOME 22 74 74
MODERATE INCOME 2 4 1218 868 167 226 475
MIDDLE INCOME 56 51 67 2 2178 8924 2910 2432 3452 67 63
UPPER INCOME 45 53 48 1 3150 9229 2612 3535 2703 64 315
Report Date: 06/02/2014
AGGREGATE TABLE 12-1: DISPOSITION OF APPLICATIONS FOR CONVENTIONAL MANUFACTURED HOME-PURCHASE LOANS, FIRST LIEN, OWNER-OCCUPIEDDWELLING, BY BORROWER OR CENSUS TRACT CHARACTERISTICS, 2013
MSA/MD: 37964 - PHILADELPHIA, PA
BORROWER OR CENSUS TRACTCHARACTERISTICS
ApplicationsReceived 20/
LoansOriginated
Apps. Approved ButNot Accepted
ApplicationsDenied
ApplicationsWithdrawn
Files Closed ForIncompleteness
# # # # # #$000's $000's $000's $000's $000's $000's
Page 1 of 1

BORROWER CHARACTERISTICS
RACE 5/AMERICAN INDIAN/ALASKA NATIVE
ASIAN
BLACK OR AFRICAN AMERICAN 2 1 6.78 6.781
NATIVE HAWAIIAN/OTHER PACIFICISLND
WHITE 88 4 2 6 299 26 8 4.68 4.1213
2 OR MORE MINORITY RACES
JOINT (WHITE/MINORITY RACE)
RACE NOT AVAILABLE 6/ 4 1 1 7.11 7.322
ETHNICITY 7/HISPANIC OR LATINO 4 21 6.81 6.492
NOT HISPANIC OR LATINO 81 3 2 6 258 27 8 4.65 4.1210
JOINT (HISPANIC OR LATINO/ NOTHISPANIC OR LATINO)
2 2 3.55 3.55
ETHNICITY NOT AVAILABLE 6/ 7 1 1 1 6.05 7.354
MINORITY STATUS 8/WHITE NON-HISPANIC 80 3 2 6 258 26 8 4.66 4.1210
OTHERS, INCLUDING HISPANIC 8 41 1 5.99 4.253
INCOME 9/LESS THAN 50% OF MSA/MD MEDIAN 19 1 2 1 51 6 1 4.91 4.033
50-79% OF MSA/MD MEDIAN 45 1 3 175 12 3 4.80 4.169
80-99% OF MSA/MD MEDIAN 11 1 1 41 2 3 3.99 3.60
100-119% OF MSA/MD MEDIAN 6 12 4 1 4.40 4.30
120% OR MORE OF MSA/MD MEDIAN 13 1 2 2 3 1 5.69 4.284
INCOME NOT AVAILABLE 6/
GENDER 19/MALE 42 3 1 1 102 15 6 4.75 4.216
FEMALE 27 1 1 3 101 7 1 4.33 3.924
JOINT (MALE/FEMALE) 22 2 96 5 1 5.22 4.075
GENDER NOT AVAILABLE 6/ 3 1 1 7.53 5.271
CENSUS TRACT CHARACTERISTICS 10/
RACIAL/ETHNIC COMPOSITION 11/LESS THAN 10% MINORITY 42 1 1 4 144 12 5 4.67 4.125
10-19% MINORITY 29 3 1 83 10 3 4.54 4.244
20-49% MINORITY 23 1 2 72 5 1 5.48 4.177
50-79% MINORITY
80-100% MINORITY
INCOME CHARACTERISTICS 12/ 13/LOW INCOME
MODERATE INCOME 11 1 4.32 4.32
MIDDLE INCOME 51 3 1 5 145 12 6 4.64 4.1110
UPPER INCOME 42 1 1 2 153 14 3 5.07 4.156
Report Date: 06/02/2014
AGGREGATE TABLE 12 - 2: PRICING INFORMATION FOR CONVENTIONAL MANUFACTURED HOME-PURCHASE LOANS, FIRST LIEN, OWNER-OCCUPIED DWELLING, BYBORROWER OR CENSUS TRACT CHARACTERISTICS, 2013
MSA/MD: 37964 - PHILADELPHIA, PA
BORROWER OR CENSUS TRACTCHARACTERISTICS
15/NO REPORTEDPRICING DATA
REPORTEDPRICING DATA 2.00 - 2.49 2.50 - 2.99 3.00 - 3.99
# # # # # #
Page 1 of 2
4.00 - 4.99
#
5.00 - 5.99
#
MEAN MEDIAN1.50 - 1.99
PERCENTAGE POINTS ABOVE AVERAGE PRIME OFFER RATE: ONLY INCLUDES LOANS WITH APR ABOVE THE THRESHOLD 16/
6 OR MORE
#

BORROWER CHARACTERISTICS
RACE 5/AMERICAN INDIAN/ALASKA NATIVE
ASIAN
BLACK OR AFRICAN AMERICAN 101 45 7.01 8.9556
NATIVE HAWAIIAN/OTHER PACIFICISLND
WHITE 4615 230 53 455 1632740 1363 321 4.34 3.99561
2 OR MORE MINORITY RACES
JOINT (WHITE/MINORITY RACE)
RACE NOT AVAILABLE 6/ 233 106 39 5.96 5.2788
ETHNICITY 7/HISPANIC OR LATINO 177 89116 6.80 3.6288
NOT HISPANIC OR LATINO 4345 200 53 455 1480624 1408 321 4.28 3.99428
JOINT (HISPANIC OR LATINO/ NOTHISPANIC OR LATINO)
63 63 3.59 3.90
ETHNICITY NOT AVAILABLE 6/ 364 30 106 39 5.69 7.35189
MINORITY STATUS 8/WHITE NON-HISPANIC 4300 200 53 455 1480624 1363 321 4.28 3.99428
OTHERS, INCLUDING HISPANIC 341 152116 45 6.27 4.60144
INCOME 9/LESS THAN 50% OF MSA/MD MEDIAN 692 30 53 95 19928 197 34 4.39 3.6884
50-79% OF MSA/MD MEDIAN 2361 52 161 960378 630 92 4.70 4.09466
80-99% OF MSA/MD MEDIAN 701 88 53 315125 79 166 3.80 3.43
100-119% OF MSA/MD MEDIAN 352 38209 276 38 4.32 4.24
120% OR MORE OF MSA/MD MEDIAN 843 60 252 120 226 30 4.50 3.89155
INCOME NOT AVAILABLE 6/
GENDER 19/MALE 1934 200 35 95 528168 616 225 4.37 4.11235
FEMALE 1508 30 18 269 56928 406 34 4.12 3.67182
JOINT (MALE/FEMALE) 1348 91 535544 386 62 5.00 4.24274
GENDER NOT AVAILABLE 6/ 159 106 39 4.38 2.7114
CENSUS TRACT CHARACTERISTICS 10/
RACIAL/ETHNIC COMPOSITION 11/LESS THAN 10% MINORITY 2177 88 18 343 803336 507 188 4.32 3.75230
10-19% MINORITY 1534 142 43 506152 567 110 4.35 4.11166
20-49% MINORITY 1238 35 175 323252 334 62 4.87 4.17309
50-79% MINORITY
80-100% MINORITY
INCOME CHARACTERISTICS 12/ 13/LOW INCOME
MODERATE INCOME 31136 31 4.32 4.32
MIDDLE INCOME 2539 200 35 309 737371 501 237 4.55 3.99520
UPPER INCOME 2379 30 18 252 895233 876 123 4.38 3.92185
Report Date: 06/02/2014
AGGREGATE TABLE 12 - 2: PRICING INFORMATION FOR CONVENTIONAL MANUFACTURED HOME-PURCHASE LOANS, FIRST LIEN, OWNER-OCCUPIED DWELLING, BYBORROWER OR CENSUS TRACT CHARACTERISTICS, 2013
MSA/MD: 37964 - PHILADELPHIA, PA
BORROWER OR CENSUS TRACTCHARACTERISTICS
15/NO REPORTEDPRICING DATA
REPORTEDPRICING DATA 2.00 - 2.49 2.50 - 2.99 3.00 - 3.99
$000's $000's $000's $000's $000's $000's
Page 2 of 2
4.00 - 4.99
$000's
5.00 - 5.99
$000's
MEAN 30/ MEDIAN 31/1.50 - 1.99
PERCENTAGE POINTS ABOVE AVERAGE PRIME OFFER RATE: ONLY INCLUDES LOANS WITH APR ABOVE THE THRESHOLD 16/
6 OR MORE
$000's

TOTAL APPLICATIONS 28/
CONVENTIONAL 770 97101 4506 5220 454333143 6141
FHA 2 13243 1 134 19210182 33
VA 3059 451481
FSA/RHS 28 1677
LOANS ORIGINATED
CONVENTIONAL 505 57822 2491 2895 210924599 1727
FHA 1 5874 55 697272 5
VA 1458 161065
FSA/RHS 10 1491
APPLICATIONS APPROVED BUT NOT ACCEPTED
CONVENTIONAL 24 5681 127 153 1211531 164
FHA 1167 3 13352 4
VA 26847
FSA/RHS 21
APPLICATIONS DENIED
CONVENTIONAL 138 19052 1248 1622 18513109 4115
FHA 3095 41 881405 19
VA 672 25238
FSA/RHS 1187
APPLICATIONS WITHDRAWN
CONVENTIONAL 88 9486 340 370 2903141 104
FHA 1 1912 1 24 19858 5
VA 387 2103
FSA/RHS 563
FILES CLOSED FOR INCOMPLETENESS
CONVENTIONAL 15 5060 300 180 172763 31
FHA 1195 11 3295
VA 274 228
FSA/RHS 215
Report Date: 06/02/2014
AGGREGATE SUMMARY TABLE A1: DISPOSITION OF APPLICATIONS AND LOAN SALES BY LOAN TYPE, 1- TO 4-FAMILY DWELLINGS (EXCLUDES MANUFACTURED HOMES), 2013
MSA/MD: 37964 - PHILADELPHIA, PA
LOAN TYPE
Page 1 of 2
FIRST LIEN JUNIOR LIEN FIRST LIEN JUNIOR LIEN FIRST LIEN JUNIOR LIEN NO LIEN
HOME PURCHASE REFINANCE HOME IMPROVEMENT

MEMO ITEM: SUBSET OF LOANS ORIGINATED
PREAPPROVALS RESULTING IN ORIGINATIONS
CONVENTIONAL 3 NA NA NA NA896 NA
FHA NA NA NA NA471 NA
VA NA NA NA NA68 NA
FSA/RHS NA NA NA NA5 NA
LOANS SOLD
CONVENTIONAL 94 43562 13 869 2418176 19
FHA 1 5680 53 196649
VA 1379 15995
FSA/RHS 10 1472
Report Date: 06/02/2014
AGGREGATE SUMMARY TABLE A1: DISPOSITION OF APPLICATIONS AND LOAN SALES BY LOAN TYPE, 1- TO 4-FAMILY DWELLINGS (EXCLUDES MANUFACTURED HOMES), 2013
MSA/MD: 37964 - PHILADELPHIA, PA
LOAN TYPE
Page 2 of 2
FIRST LIEN JUNIOR LIEN FIRST LIEN JUNIOR LIEN FIRST LIEN JUNIOR LIEN NO LIEN
HOME PURCHASE REFINANCE HOME IMPROVEMENT

TOTAL APPLICATIONS 28/
CONVENTIONAL 91 9 9 18360 112
FHA 511
VA 11
FSA/RHS 1
LOANS ORIGINATED
CONVENTIONAL 28 4 1 11108 10
FHA 23
VA 1
FSA/RHS
APPLICATIONS APPROVED BUT NOT ACCEPTED
CONVENTIONAL 24110 3
FHA 1
VA
FSA/RHS
APPLICATIONS DENIED
CONVENTIONAL 36 5 7 6134 98
FHA 14
VA
FSA/RHS 1
APPLICATIONS WITHDRAWN
CONVENTIONAL 3 13 1
FHA 3
VA
FSA/RHS
FILES CLOSED FOR INCOMPLETENESS
CONVENTIONAL 15
FHA 2
VA 1
FSA/RHS
Report Date: 06/02/2014
AGGREGATE SUMMARY TABLE A2: DISPOSITION OF APPLICATIONS AND LOAN SALES BY LOAN TYPE, MANUFACTURED HOMES, 2013
MSA/MD: 37964 - PHILADELPHIA, PA
LOAN TYPE
Page 1 of 2
FIRST LIEN JUNIOR LIEN FIRST LIEN JUNIOR LIEN FIRST LIEN JUNIOR LIEN NO LIEN
HOME PURCHASE REFINANCE HOME IMPROVEMENT

MEMO ITEM: SUBSET OF LOANS ORIGINATED
PREAPPROVALS RESULTING IN ORIGINATIONS
CONVENTIONAL NA NA NA NA NA
FHA NA NA NA NA NA
VA NA NA NA NA NA
FSA/RHS NA NA NA NA NA
LOANS SOLD
CONVENTIONAL 42
FHA 22
VA 1
FSA/RHS
Report Date: 06/02/2014
AGGREGATE SUMMARY TABLE A2: DISPOSITION OF APPLICATIONS AND LOAN SALES BY LOAN TYPE, MANUFACTURED HOMES, 2013
MSA/MD: 37964 - PHILADELPHIA, PA
LOAN TYPE
Page 2 of 2
FIRST LIEN JUNIOR LIEN FIRST LIEN JUNIOR LIEN FIRST LIEN JUNIOR LIEN NO LIEN
HOME PURCHASE REFINANCE HOME IMPROVEMENT

TOTAL APPLICATIONS 28/
CONVENTIONAL 5 360 6 85 9227 5
FHA 6 1 1
VA
FSA/RHS
LOANS ORIGINATED
CONVENTIONAL 5 254 5 70 6161 5
FHA 3 1 1
VA
FSA/RHS
APPLICATIONS APPROVED BUT NOT ACCEPTED
CONVENTIONAL 21 410
FHA
VA
FSA/RHS
APPLICATIONS DENIED
CONVENTIONAL 47 8 230
FHA
VA
FSA/RHS
APPLICATIONS WITHDRAWN
CONVENTIONAL 33 1 326
FHA 3
VA
FSA/RHS
FILES CLOSED FOR INCOMPLETENESS
CONVENTIONAL 5 1
FHA
VA
FSA/RHS
MEMO ITEM: SUBSET OF LOANS ORIGINATED
LOANS SOLD
CONVENTIONAL 2311
FHA 2 1 1
VA
FSA/RHS
Report Date: 06/02/2014
AGGREGATE SUMMARY TABLE A3: DISPOSITION OF APPLICATIONS AND LOAN SALES BY LOAN TYPE, MULTIFAMILY HOUSING, 2013
MSA/MD: 37964 - PHILADELPHIA, PA
LOAN TYPE
Page 1 of 1
FIRST LIEN JUNIOR LIEN FIRST LIEN JUNIOR LIEN FIRST LIEN JUNIOR LIEN NO LIEN
HOME PURCHASE REFINANCE HOME IMPROVEMENT

BORROWER CHARACTERISTICS
RACE 5/
AMERICAN INDIAN/ALASKA NATIVE 2 294 NA NA NA NA
ASIAN 51 11140 NA NA NA NA
BLACK OR AFRICAN AMERICAN 52 6832 NA NA NA NA
NATIVE HAWAIIAN/OTHER PACIFICISLND
6 1451 NA NA NA NA
WHITE 631 161869 NA NA NA NA
2 OR MORE MINORITY RACES 2 371 NA NA NA NA
JOINT (WHITE/MINORITY RACE) 11 4250 NA NA NA NA
RACE NOT AVAILABLE 6/ 141 36217 NA NA NA NA
ETHNICITY 7/
HISPANIC OR LATINO 19 3410 NA NA NA NA
NOT HISPANIC OR LATINO 740 183615 NA NA NA NA
JOINT (HISPANIC OR LATINO/ NOTHISPANIC OR LATINO)
10 2771 NA NA NA NA
ETHNICITY NOT AVAILABLE 6/ 127 32628 NA NA NA NA
MINORITY STATUS 8/
WHITE NON-HISPANIC 604 155665 NA NA NA NA
OTHERS, INCLUDING HISPANIC 149 29597 NA NA NA NA
INCOME 9/
LESS THAN 50% OF MSA/MD MEDIAN 82 7345 NA NA NA NA
50-79% OF MSA/MD MEDIAN 175 24615 NA NA NA NA
80-99% OF MSA/MD MEDIAN 103 20360 NA NA NA NA
100-119% OF MSA/MD MEDIAN 76 16329 NA NA NA NA
120% OR MORE OF MSA/MD MEDIAN 441 148055 NA NA NA NA
INCOME NOT AVAILABLE 6/ 19 5720 NA NA NA NA
GENDER 19/
MALE 246 55617 NA NA NA NA
FEMALE 217 42205 NA NA NA NA
JOINT (MALE/FEMALE) 339 101282 NA NA NA NA
GENDER NOT AVAILABLE 6/ 94 23320 NA NA NA NA
CENSUS TRACT CHARACTERISTICS 10/
RACIAL/ETHNIC COMPOSITION 11/
LESS THAN 10% MINORITY 257 72262 NA NA NA NA
10-19% MINORITY 322 89498 NA NA NA NA
20-49% MINORITY 200 44471 NA NA NA NA
50-79% MINORITY 55 9294 NA NA NA NA
80-100% MINORITY 62 6899 NA NA NA NA
INCOME CHARACTERISTICS 12/ 13/
LOW INCOME 60 7104 NA NA NA NA
MODERATE INCOME 116 17658 NA NA NA NA
MIDDLE INCOME 247 48091 NA NA NA NA
UPPER INCOME 470 149113 NA NA NA NA
Report Date: 06/02/2014
AGGREGATE SUMMARY TABLE A4: DISPOSITION OF PREAPPROVALS FOR CONVENTIONAL HOME-PURCHASE LOANS, FIRST LIEN, 1- TO 4-FAMILY DWELLINGS(EXCLUDES MANUFACTURED HOMES), BY BORROWER OR CENSUS TRACT CHARACTERISTICS, 2013
MSA/MD: 37964 - PHILADELPHIA, PA
BORROWER OR CENSUS TRACTCHARACTERISTICS
# $000's # $000's # $000's
Page 1 of 1
PREAPPROVALS RESULTING INORIGINATIONS
PREAPPROVALS APPROVED BUTNOT ACCEPTED 29/
PREAPPROVALSDENIED

1- TO 4-FAMILY OWNER OCCUPIED DWELLINGS (EXCLUDES MANUFACTURED HOMES)
INCIDENCE OF PRICING
NO PRICING REPORTED 15/ 438 51276 2258 2532 194521703 NA
PRICING REPORTED 61 484 182 61 116138 NA
MEAN (POINTS ABOVE AVERAGE PRIME OFFERRATE: ONLY INCLUDES LOANS WITH APR ABOVETHE THRESHOLD 16/)
4.16 1.98 4.12 2.27 4.371.89 NA
MEDIAN (POINTS ABOVE AVERAGE PRIME OFFERRATE: ONLY INCLUDES LOANS WITH APR ABOVETHE THRESHOLD 16/)
4.10 1.77 4.06 1.86 4.111.70 NA
HOEPA STATUS
HOEPA LOAN 17/ NA 1NA NA
NOT HOEPA LOAN NA 51759 2440 2593 2061NA NA
MANUFACTURED HOME OWNER OCCUPIED DWELLINGS
INCIDENCE OF PRICING
NO PRICING REPORTED 15/ 20 4 119 NA
PRICING REPORTED 8 194 NA
MEAN (POINTS ABOVE AVERAGE PRIME OFFERRATE: ONLY INCLUDES LOANS WITH APR ABOVETHE THRESHOLD 16/)
3.71 6.574.83 NA
MEDIAN (POINTS ABOVE AVERAGE PRIME OFFERRATE: ONLY INCLUDES LOANS WITH APR ABOVETHE THRESHOLD 16/)
3.48 6.574.14 NA
HOEPA STATUS
HOEPA LOAN 17/ NA 1NA NA
NOT HOEPA LOAN NA 28 4 11NA NA
Report Date: 06/02/2014
AGGREGATE SUMMARY TABLE B: LOAN PRICING INFORMATION FOR CONVENTIONAL LOANS BY INCIDENCE AND LEVEL, 2013
MSA/MD: 37964 - PHILADELPHIA, PA
PRICING INFORMATION
Page 1 of 1
FIRST LIEN JUNIOR LIEN FIRST LIEN JUNIOR LIEN FIRST LIEN JUNIOR LIEN NO LIEN
HOME PURCHASE REFINANCE HOME IMPROVEMENT
Township of Abington, Pennsylvania
Analysis of Impediments to Fair Housing Choice Page 124 of 125
Appendix C – Maps
The following maps are included: Population Density by Block Group Percentage of White Population by Block Group Percentage of Minority Population by Block Group Percentage of Population Age 65+ by Block Group Total Housing Units by Block Points Percentage of Owner-Occupied Housing Units by Block Group Percentage of Renter-Occupied Housing Units by Block Group Percentage of Vacant Housing Units by Block Group Low/Moderate Income Percentage by Block Group

915
789
1,837
726
1,207
1,231709
798872
945
1,277
1,888841
1,243
835842
1,398
433899
1,203
1,344
1,285
9881,563
1,573
1,818
1,464
1,346
1,752
1,334
1,612
1,127
1,946
769792
1,242
7321,321
1,811
970
1,081
1,117663
1,454
CT 2015CT 2015
CT 2016
CT 2016
CT 2016
CT2016
CT 2016
CT 2016
CT 2017
CT 2017
CT 2017
CT 2017
CT 2018
CT 2019
CT 2019
ESRI Data & Maps, 2014, ArcGIS Online. Created for Urban Design Ventures LLC by 4CGeoWorks, 5/2015
Legend
Population Density by Block Group: Abington Township, Pennsylvania
2013 Population Density (Per Sq Mi)0 - 500501 - 1,0001,001 - 2,000
2,001 - 4,0004,001 - 11,000
Block grouplabels show population 2014.
City BoundaryTracts Boundary
= tract numberCT 9719 N
0 0.25 0.5Miles
1 in = 0.8 miles

CT 2016
CT 2016
CT 2016
CT 2017
CT 2017
CT 2017
CT 2017
CT 2015CT 2015
CT 2016
CT 2016
CT 2018
CT 2019
CT 2019
788
671
1,591
657
1,065
892
452
108169
675
723
1,130592
1,017
634216
1,023
481
1,084
407786
1,107
1,246
1,116
7521,389
1,469
1,546
968
1,266
1,5751,110
930
1,039
1,623
686617
1,142
6791,163
1,664
871
1,199911
576586
837
ESRI Data & Maps, 2014, ArcGIS Online. Created for Urban Design Ventures LLC by 4CGeoWorks, 5/2015
Legend
Percent White Population by Block Group: Abington Township, Pennsylvania
Percent White Population0% - 25%26% - 50%51% - 75%
76% - 85%86% - 100%
Block grouplabels show total whitepopulation 2014.
City BoundaryTracts Boundary
= tract numberCT 9719 N
0 0.25 0.5Miles
1 in = 0.8 miles
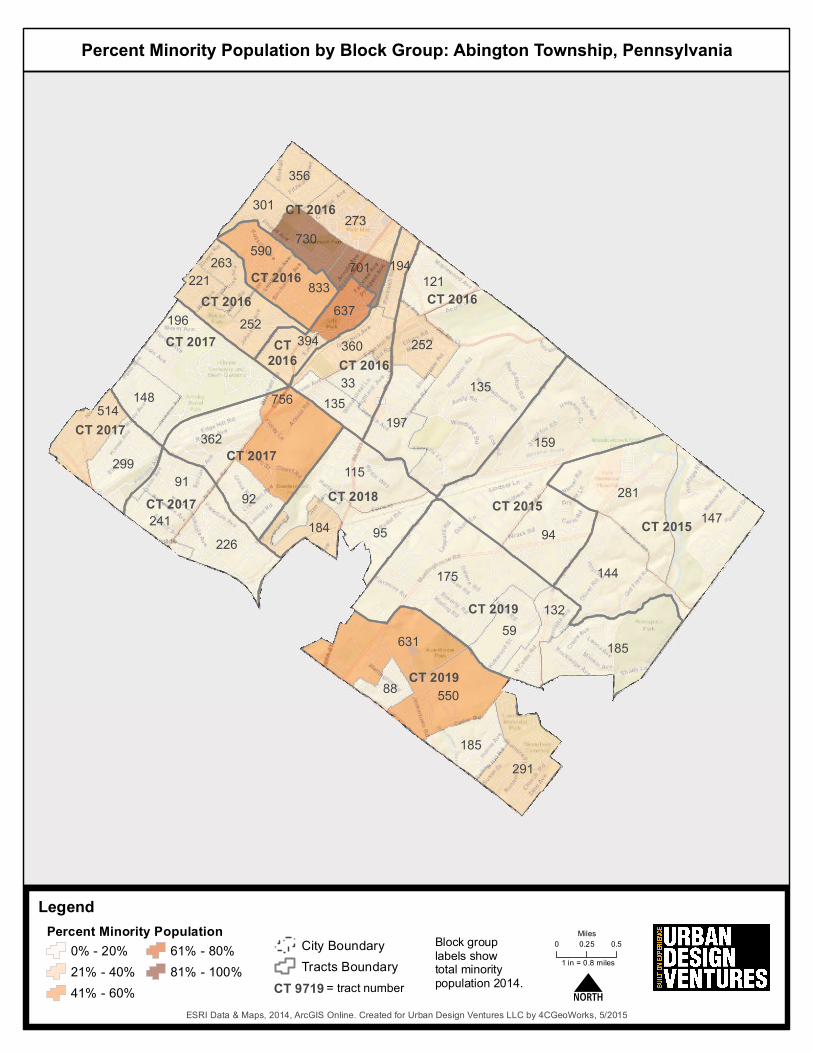
CT 2016
CT 2016CT 2016
CT2016
CT 2017
CT 2017
CT 2017
CT 2017
CT 2015CT 2015
CT 2016
CT 2016
CT 2018
CT 2019
CT 2019
147
144
281
94
159
356
273
701730
301
590
833263
252
221637
394
194
360
33135
121
135
197
252196
148
299
514
91
226241
756
92
362
95184
115
59185
175
132
291185
55088
631
ESRI Data & Maps, 2014, ArcGIS Online. Created for Urban Design Ventures LLC by 4CGeoWorks, 5/2015
Legend
Percent Minority Population by Block Group: Abington Township, Pennsylvania
Percent Minority Population0% - 20%21% - 40%41% - 60%
61% - 80%81% - 100%
Block grouplabels show total minoritypopulation 2014. N
0 0.25 0.5Miles
1 in = 0.8 milesCity BoundaryTracts Boundary
= tract numberCT 9719

CT 2016
CT 2016CT 2016
CT2016
CT 2017
CT 2017
CT 2017
CT 2017
CT 2015CT 2015
CT 2016
CT 2016
CT 2018
CT 2019
CT 2019
176
158
1031
193
243
227
123
140148
141
236
259163
239
127121
137
69
177
75107
150
297
301
186216
193
251
190
194
230191
161
143
244
239156
494
143252
436
202
348328
20697
296
ESRI Data & Maps, 2014, ArcGIS Online. Created for Urban Design Ventures LLC by 4CGeoWorks, 5/2015
Legend
Percent Population Age 65 and Over by Block Group: Abington Township, Pennsylvania
Percent Population Age 65 and Over0% - 10%10.1% - 18%18.1% - 25%
25.1% - 50%50.1% - 100%
Block grouplabels show 2014 population Age 65 and over. N
0 0.25 0.5Miles
1 in = 0.8 milesCity BoundaryTracts Boundary
= tract numberCT 9719

502
434
684
579
341
514
274
623771
1,008
420
504
669 285
1,015
750
299
693
350
283
600
546453
542
668
416
408
606
489314
418516
485
351563
578
361165
322
336
355
281
228
CT 2019
CT 2016
CT 2015
CT 2019
CT 2015CT 2017
CT 2016
CT 2018
CT 2017
CT 2017
CT 2016
CT 2017
CT 2016
CT 2016
CT 2016
ESRI Data & Maps, 2014, ArcGIS Online. Created for Urban Design Ventures LLC by 4CGeoWorks, 5/2015
Legend
Total Housing Units by Block Points: Abington Township, Pennsylvania
Block grouplabels show 2014 total housing units.
Block Point Housing Units401 - 1,3390 - 50
City BoundaryTracts Boundary
= tract numberCT 9719 N
0 0.25 0.5Miles
1 in = 0.8 miles
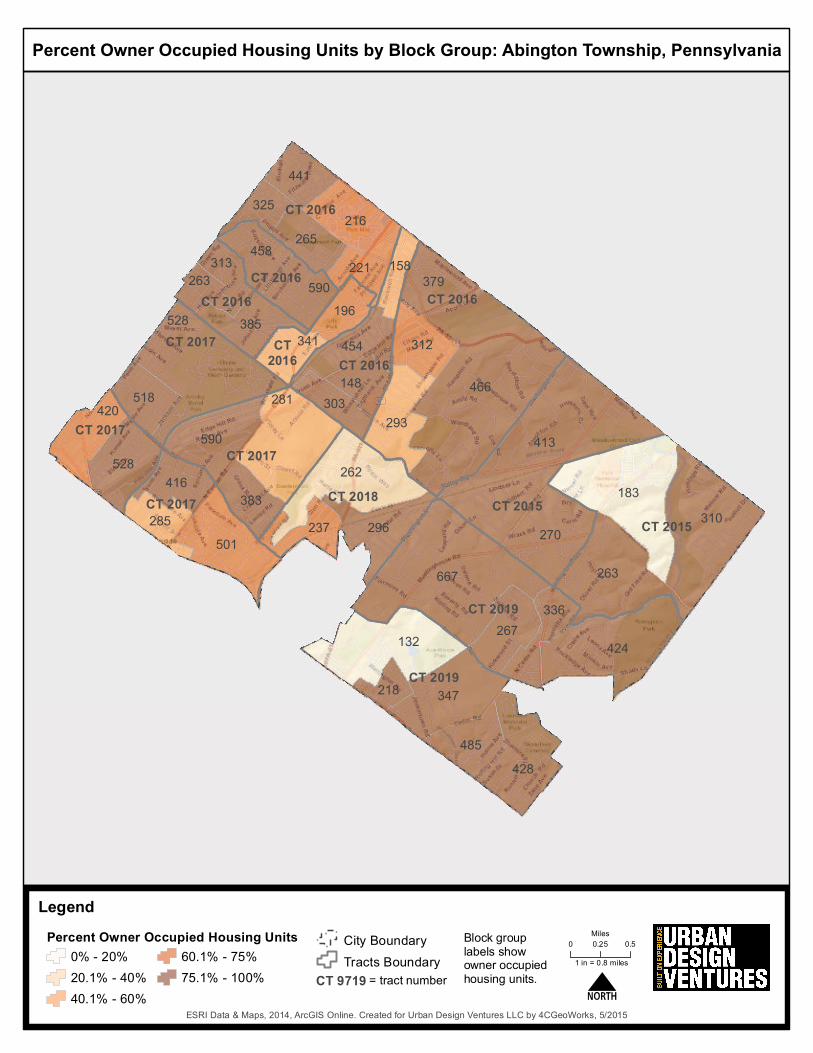
CT 2016
CT 2016CT 2016
CT2016
CT 2017
CT 2017
CT 2017
CT 2017
CT 2015CT 2015
CT 2016
CT 2016
CT 2018
CT 2019
CT 2019
310
263
183
270
413
441
216
221265
325
458
590313
385
263196
341
158
454
148303
379
466
293
312528
518
528
420
416
501285
281
383
590
296237
262
267424
667
336
428485
347218
132
ESRI Data & Maps, 2014, ArcGIS Online. Created for Urban Design Ventures LLC by 4CGeoWorks, 5/2015
Legend
Percent Owner Occupied Housing Units by Block Group: Abington Township, Pennsylvania
Percent Owner Occupied Housing Units0% - 20%20.1% - 40%40.1% - 60%
60.1% - 75%75.1% - 100%
Block grouplabels show owner occupied housing units. N
0 0.25 0.5Miles
1 in = 0.8 miles
City BoundaryTracts Boundary
= tract numberCT 9719

CT 2016
CT 2016CT 2016
CT2016
CT 2017
CT 2017
CT 2017
CT 2017
CT 2015CT 2015
CT 2016
CT 2016
CT 2018
CT 2019
CT 2019
4
6
790
7
9
3271
9137
22
1777
10
44
11
110211
111
684
47
41
22
255
8942
69
121
144
80
134264
317
31
159
3596
404
861
16
52
5336
548620
ESRI Data & Maps, 2014, ArcGIS Online. Created for Urban Design Ventures LLC by 4CGeoWorks, 5/2015
City BoundaryTracts Boundary
Legend
Percent Renter Occupied Housing Units by Block Group: Abington Township, Pennsylvania
Percent Renter Occupied Housing Units0% - 15%15.1% - 30%30.1% - 50%
50.1% - 70%70.1% - 100%
Block grouplabels show renter occupied housing units. = tract numberCT 9719 N
0 0.25 0.5Miles
1 in = 0.8 miles

CT 2016
CT 2016CT 2016
CT2016
CT 2017
CT 2017
CT 2017
CT 2017
CT 2015CT 2015
CT 2016
CT 2016
CT 2018
CT 2019
CT 2019
27
5
35
8
12
1212
2412
8
141
13
24
7
1626
21
24
1311
10
14
40
159
19
4436
20
3414
25
4
1
1918
105
829
1
20
2321
192263
ESRI Data & Maps, 2014, ArcGIS Online. Created for Urban Design Ventures LLC by 4CGeoWorks, 5/2015
Legend
Percent Vacant Housing Units by Block Group: Abington Township, Pennsylvania
Percent Vacant Housing Units0% - 2%2.1% - 6%
6.1% - 20%20.1% - 50%
Block grouplabels show vacanthousing units. N
0 0.25 0.5Miles
1 in = 0.8 milesCity BoundaryTracts Boundary
= tract numberCT 9719

CT 2016
CT 2016
CT 2016
CT 2017
CT 2017
CT 2017
CT 2017
CT 2015CT 2015
CT 2016
CT 2016
CT 2018
CT 2019
CT 2019
18.75%
22.94%
49.8%
18.25%
13.72%
14.98%37.5%
58.29%
20.13%
8.47%
40.36%
18.64%
23.77%
30.13%71.59%
30.17%
19.3%
10.98%
15.38%20.83%
17.84%
17.31%
14.98%
40%18.93%
20.39%
34.73%
2.04%
25.76%
13.97%30.65%
48.47%
26.55%30.59%
13.67%
35.71%
20.87%30.47%
12.57%7.22%
46.22%
30.43%
22.18%
23.03%
37.81%
26.23%
39.22%
ESRI Data & Maps, 2014, ArcGIS Online, Census 2010. Created for Urban Design Ventures LLC by 4CGeoWorks, 5/2015
Legend
Low/Moderate Income Percentage by Block Group: Abington Township, Pennsylvania
Block grouplabels show the low/moderateincome percentage.
* Based on Census 2010
City BoundaryTracts
= tract numberCT 9719 N
0 0.25 0.5Miles
1 in = 0.8 miles
Low/Moderate IncomeLess than 34.72%34.73% or More

Township of Abington, Pennsylvania
Analysis of Impediments to Fair Housing Choice Page 125 of 125
Appendix D – Citizen Participation
Public hearing notices, public hearing sign-in sheets, public hearing minutes, summaries of the public hearings and interviews, and other documents outlining the citizen participation.