2015 ambient air monitoring network report - salt river …€¦ · · 2016-05-232015 ambient air...
TRANSCRIPT

Draft May 2016
Salt River Pima-Maricopa Indian Community (SRPMIC)
2015 Ambient Air Monitoring Network Report
May 2016
Community Development Department (CDD) Environmental Protection & Natural Resources (EPNR)
10005 East Osborn Road Scottsdale, AZ 85256
2
INTRODUCTION
The Salt River Pima-Maricopa Indian Community (SRPMIC) has developed an air monitoring network for measuring ambient concentrations of criteria pollutants and associated meteorological parameters. The operation of these Tribal Monitoring Sites (TMS) follows the United States Environmental Protection Agency (USEPA) State and Local Air Monitoring Sites (SLAMS) guidance recommendations and documents. This Annual Air Monitoring Network Review for 2015 is being submitted by the SRPMIC Community Development Department (CDD) Environmental Protection & Natural Resources (EPNR) Division to the United States Environmental Protection Agency (USEPA) Region 9 as outlined in 40 CFR Part 58.10. In addition, changes made to the network design and special projects conducted during 2015 and a 3-year data summary are included in this document.
AMBIENT MONITORING NETWORK
The purpose of the SRPMIC air-monitoring network is to measure ambient concentrations of the selected criteria pollutants at various locations across the Community. These data are used to assess health and welfare effects and determine pollution source both on and off the Community. The criteria pollutants measured are ozone (O3), PM10 and PM2.5; the meteorological parameters include wind speed, wind direction, ambient temperature, precipitation, delta temperature, solar radiation, and ambient pressure. The collection of these data began in 2002 and continues to date. The three basic monitoring objectives with six types of monitoring sites and five measuring scales were used to develop the monitoring network.
MONITORING OBJECTIVES
1. Provide air pollution data to the general public in timely manner; 2. Support compliance with ambient air quality standards and emission strategy development;
and 3. Support for air pollution research studies.
TYPES OF MONITORING SITE OBJECTIVE
Determine the highest concentrations expected to occur in the area covered by the network;
Determine the representative concentrations in areas of high population density;
Determine general background concentrations levels;
Determine the impact of significant sources or source categories on air quality;
Determine the extent of regional pollutant transport among populated areas, and in support of secondary standards; and
Measure air pollution impacts on visibility, vegetation damage or other welfare-based impacts.
3
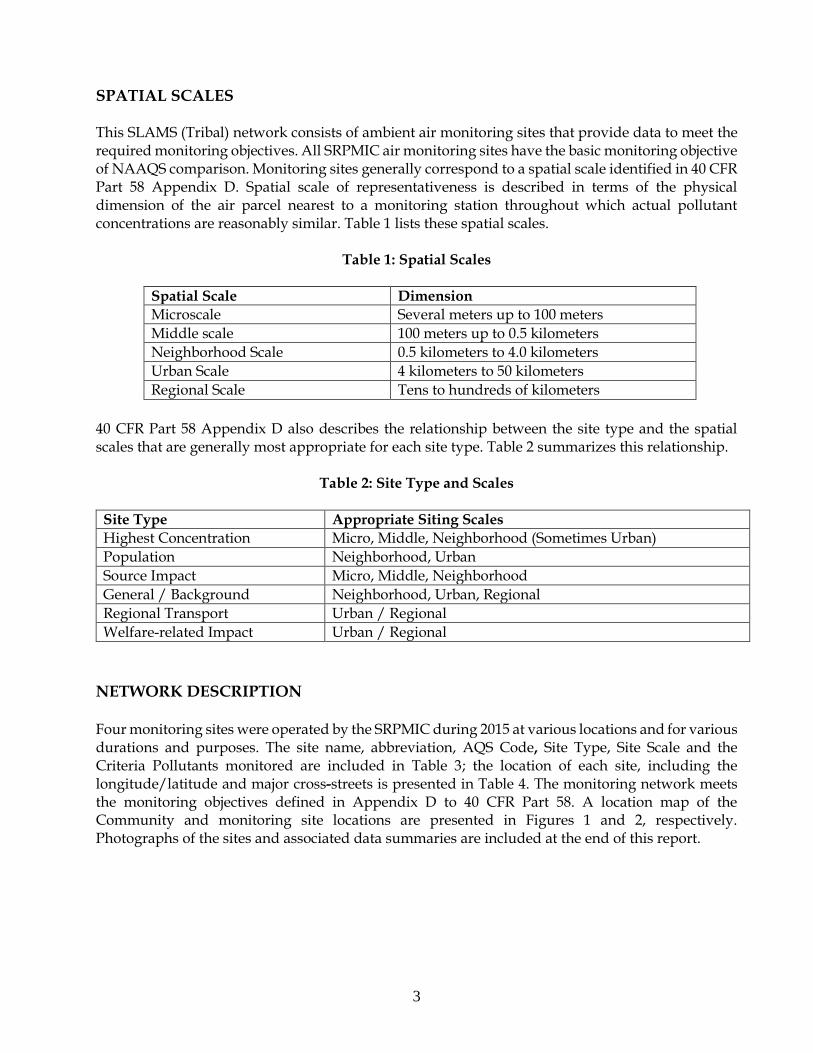
SPATIAL SCALES This SLAMS (Tribal) network consists of ambient air monitoring sites that provide data to meet the required monitoring objectives. All SRPMIC air monitoring sites have the basic monitoring objective of NAAQS comparison. Monitoring sites generally correspond to a spatial scale identified in 40 CFR Part 58 Appendix D. Spatial scale of representativeness is described in terms of the physical dimension of the air parcel nearest to a monitoring station throughout which actual pollutant concentrations are reasonably similar. Table 1 lists these spatial scales.
Table 1: Spatial Scales
Spatial Scale Dimension
Microscale Several meters up to 100 meters
Middle scale 100 meters up to 0.5 kilometers
Neighborhood Scale 0.5 kilometers to 4.0 kilometers
Urban Scale 4 kilometers to 50 kilometers
Regional Scale Tens to hundreds of kilometers
40 CFR Part 58 Appendix D also describes the relationship between the site type and the spatial scales that are generally most appropriate for each site type. Table 2 summarizes this relationship.
Table 2: Site Type and Scales
Site Type Appropriate Siting Scales Highest Concentration Micro, Middle, Neighborhood (Sometimes Urban)
Population Neighborhood, Urban
Source Impact Micro, Middle, Neighborhood
General / Background Neighborhood, Urban, Regional
Regional Transport Urban / Regional
Welfare-related Impact Urban / Regional
NETWORK DESCRIPTION Four monitoring sites were operated by the SRPMIC during 2015 at various locations and for various durations and purposes. The site name, abbreviation, AQS Code, Site Type, Site Scale and the Criteria Pollutants monitored are included in Table 3; the location of each site, including the longitude/latitude and major cross-streets is presented in Table 4. The monitoring network meets the monitoring objectives defined in Appendix D to 40 CFR Part 58. A location map of the Community and monitoring site locations are presented in Figures 1 and 2, respectively. Photographs of the sites and associated data summaries are included at the end of this report.

4
Table 3: SLAMS Summary
Site Name AQS Code Site Type Site Scale Pollutants
Senior Center (SC) 04-013-7020 Population Exposure Neighborhood PM10, PM2.5, O3
Red Mountain (RM) 04-013-7021 Regional Transport, Max Ozone Conc.
Urban O3
Lehi (LE) 04-013-7022 Population Exposure Neighborhood PM10, O3
High School (HS) 04-013-7024 Population Exposure Neighborhood PM10, O3
Table 4: Site Locations
Site Latitude Longitude Location SC 330 29.294’ 1110 51.339’ Osborn/Alma School Roads
RM 330 30.475’ 1110 45.277’ SR87/Arizona Canal
LE 330 28.472’ 1110 48.303’ Oak Street/Stapley Drive
HS 330 30.483’ 1110 50.268’ Chaparral Rd/Country Club Dr
INSTRUMENTATION 40 CFR Parts 50 and 53 define Federal Reference Methods (FRMs) and Federal Equivalent Methods (FEMs), which provide precise methodology for quantifying ambient concentrations of air pollutants. FRMs are monitoring methods that are associated with the NAAQS for the pollutant described in the appendices to 40 CFR 50 and determined by EPA to be FRMs. FEMs are alternative monitoring methods that have been designated by EPA as obtaining equivalent results when compared to the FRM, as determined by 40 CFR 53. An additional option for air monitoring agencies is the Approved Regional Method (ARM). This designation requires the applying agency to conduct specific field testing and evaluation demonstrating that the method meets Class III precision and accuracy requirements listed in Subpart C of 40 CFR Part 53. During 2015, SRPMIC used FRMs to collect filter based PM10 and PM2.5 samples and FEMs for continuous PM10 and ozone; a PM2.5 FEM is expected to be operational in 2016. SRPMIC does not have approval for any ARMs. Two types of PM10 monitors were used throughout the monitoring network: 1) filter based low volume monitors, and 2) Tapered Element Oscillating Microbalance (TEOM) monitors which measure PM10 continuously.
During 2015, the PM2.5 monitors used throughout the monitoring network were filter based low volume monitors equipped with the appropriate size fractioning; a TEOM Filter Dynamics Measurement Systems (FDMS) FEM which measures PM2.5 continuously is planned to be operational in 2016. A listing of the parameters and quantity of site instrumentation is presented in Table 5.

5

6

7
Table 5: Site Instrumentation
Site ID
PM10
PM2.5
O3
Wind System
Temp / RH
Delta Temp
Ambient Pressure
Rain
Solar Rad.
Data Logger
Total
SC 1 2 1 1 1/1 1 1 1 1 1 12
RM 1 1 1/1 1 1 6
LE 2 1* 1 1/1 1 1 8
HS 1 1* 1 3
Total 4 2 4 3 6 1 3 1 1 4 29
* seasonal
DATA SUMMARIES
CRITERIA POLLUTANTS The Federal Clean Air Act of 1970 established National Ambient Air Quality Standards (NAAQS) for six pollutants. These pollutants, referred to as the “Criteria Pollutants”, include carbon monoxide (CO), nitrogen dioxide (NO2), ozone (O3), particulate matter (PM), sulfur dioxide (SO2), and lead (Pb). Two Federal Standards exist for most of the criteria pollutants. The primary standard defines levels deemed “. . . necessary, with an adequate margin of safety, to protect the public health.” The secondary standard defines levels “. . . necessary to protect the public welfare. . .” (40 CFR Part 50). The promulgation of these standards, however, does not prohibit any State or Tribal Community from establishing air quality standards that are more stringent. The Federal Standards are also subject to periodic review and revision as deemed necessary by the Administrator of the Environment Protection Agency (EPA). The following discussion summarizes the SRPMIC network results in relation to the monitoring objectives of the State and Local Air Monitoring Stations (SLAMS).
Ozone (O3) During 2015, four ozone monitors operated at various locations during various intervals. Two locations operated continuously; and two operated seasonally during the year. However, SRPMIC will not seek waivers for ozone seasonal monitoring to the two monitors and will operate year round starting 2016. SRPMIC submitted a letter to EPA Region 9 on December 18, 2015 about this information. Each location and operational period is listed in Table 5.
Table 6: Operational Schedule for Ozone
Site Name Duration Senior Center January 1 – December 31
Red Mountain January 1 – December 31
Lehi April 1 – November 1
High School April 1 – November 1

8
One-hour Average Concentrations One-hour concentrations of ozone during 2015 were moderate; no exceedance of the former one-hour ozone standard was observed. A summary of the one-hour concentrations obtained at the four locations is presented in Table 7; the distribution of the one-hour concentrations is presented in Table 8.
Table 7: 1-Hour Summary
Site
Max. (ppm) Date Time
2nd High (ppm) Date Time
3rd High (ppm) Date Time
4th High (ppm) Date Time
Number Of
Exceedances
Number of Samples
RM 0.094 6/29 1400
0.093 6/22 1500
0.092 6/20 1400
0.089 6/24 1400
0 8713
SC 0.094 6/16 1500
0.094 6/29 1300
0.092 6/29 1400
0.091 6/22 1400
0 8709
LE 0.105 6/29 1400
0.096 6/29 1300
0.094 6/20 1400
0.091 6/22 1500
0 5135
HS 0.094 6/29 1400
0.089 6/29 1300
0.086 6/22 1400
0.085 6/12 1700
0 4986
Table 8: Distributions
Number of 1-Hour Average Values (ppm)
Interval: 0.000 to 0.040
0.041 to 0.080
0.081 to 0.120
0.121 to 0.160
0.161 to 0.200
0.201 to 0.240
0.241 to 0.280
>0.280
Site
RM 5937 2749 26 0 0 0 0 0
SC 6246 2439 20 0 0 0 0 0
LE 3013 2094 28 0 0 0 0 0
HS 3125 1847 14 0 0 0 0 0

9
Eight-hour Average Concentrations Eight-hour average concentrations of ozone were moderate to high. There were four exceedance-days of the eight-hour ozone standard and one violation of the standard. A summary of the eight-hour concentrations is presented in Table 9; the distribution of the concentrations is presented in Table 10.
Table 9: Eight-Hour Summary
Site
Max. (ppm) Date
Time*
2nd High (ppm) Date
Time*
3rd High (ppm) Date
Time*
4th High (ppm) Date
Time*
Number Of
Exceedances
Number of Samples
RM 0.079 6/20 1100
0.078 6/12 1200
0.078 6/20 1000
0.074 8/1 1200
3 8750
SC 0.079 6/12 1200
0.077 6/20 1000
0.077 6/29 1000
0.073 8/15 1100
3 8754
LE 0.082 6/29 1100
0.080 6/12 1200
0.080 6/20 1100
0.076 6/16 1000
4 5160
HS 0.078 6/12 1300
0.076 6/29 1000
0.075 6/20 1100
0.072 8/1 1100
2 5009
*Time – Time is beginning hour (Mountain Standard Time)
Table 10: Distribution
Number of Eight-Hour Average Values (ppm)
Interval: 0.000 to 0.030
0.031 to 0.060
0.061 to 0.075
0.076 to 0.095
0.096 to 0.115
0.116 to 0.135
0.136 to 0.155
>0.155
Site
RM 3439 5000 301 10 0 0 0 0
SC 4432 4052 262 8 0 0 0 0
LE 1713 3112 321 14 0 0 0 0
HS 1914 2875 217 3 0 0 0 0
10
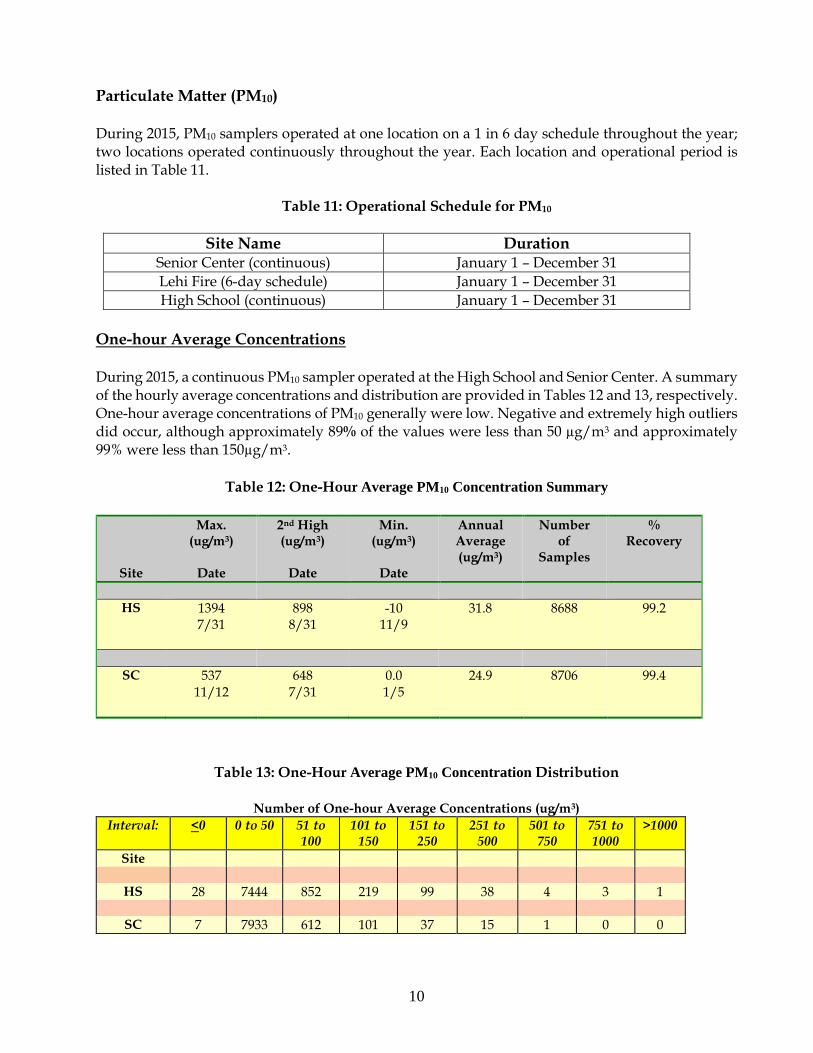
Particulate Matter (PM10) During 2015, PM10 samplers operated at one location on a 1 in 6 day schedule throughout the year; two locations operated continuously throughout the year. Each location and operational period is listed in Table 11.
Table 11: Operational Schedule for PM10
Site Name Duration Senior Center (continuous) January 1 – December 31
Lehi Fire (6-day schedule) January 1 – December 31
High School (continuous) January 1 – December 31
One-hour Average Concentrations During 2015, a continuous PM10 sampler operated at the High School and Senior Center. A summary of the hourly average concentrations and distribution are provided in Tables 12 and 13, respectively. One-hour average concentrations of PM10 generally were low. Negative and extremely high outliers did occur, although approximately 89% of the values were less than 50 µg/m3 and approximately 99% were less than 150µg/m3.
Table 12: One-Hour Average PM10 Concentration Summary
Site
Max. (ug/m3)
Date
2nd High (ug/m3)
Date
Min. (ug/m3)
Date
Annual Average (ug/m3)
Number of
Samples
% Recovery
HS 1394 7/31
898 8/31
-10 11/9
31.8 8688 99.2
SC 537 11/12
648 7/31
0.0 1/5
24.9 8706 99.4
Table 13: One-Hour Average PM10 Concentration Distribution
Number of One-hour Average Concentrations (ug/m3)
Interval: <0 0 to 50 51 to 100
101 to 150
151 to 250
251 to 500
501 to 750
751 to 1000
>1000
Site
HS 28 7444 852 219 99 38 4 3 1
SC 7 7933 612 101 37 15 1 0 0
11
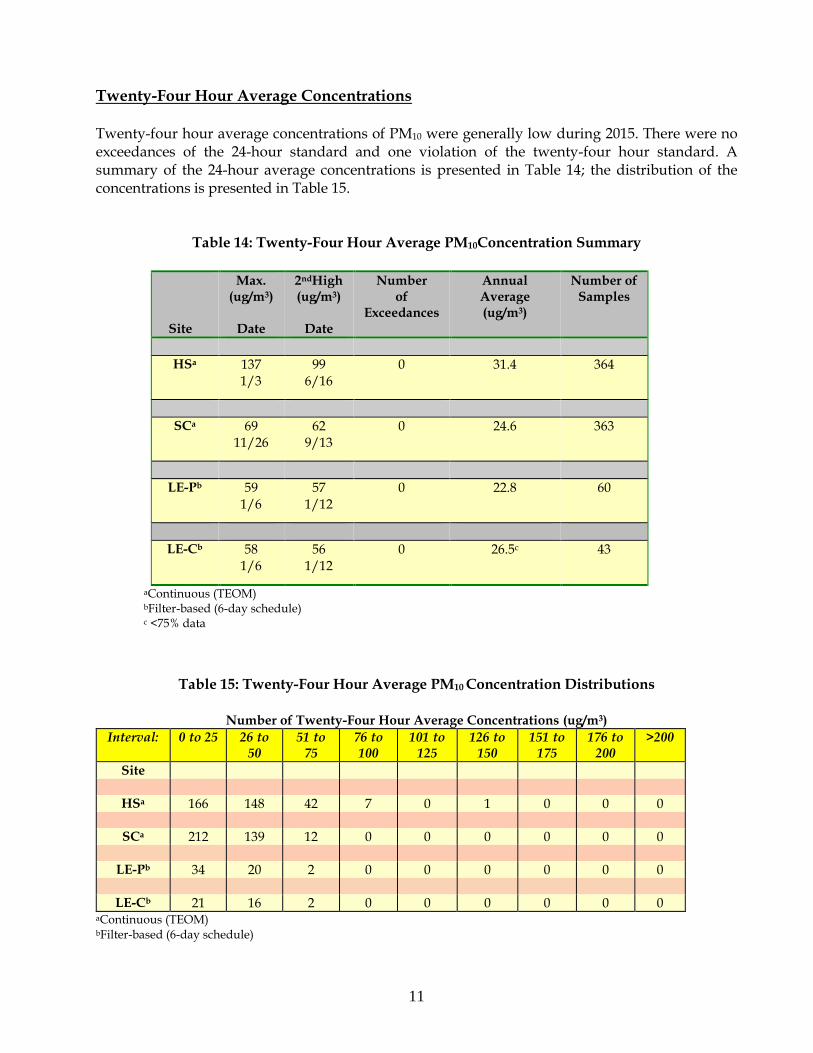
Twenty-Four Hour Average Concentrations Twenty-four hour average concentrations of PM10 were generally low during 2015. There were no exceedances of the 24-hour standard and one violation of the twenty-four hour standard. A summary of the 24-hour average concentrations is presented in Table 14; the distribution of the concentrations is presented in Table 15.
Table 14: Twenty-Four Hour Average PM10Concentration Summary
Site
Max. (ug/m3)
Date
2ndHigh (ug/m3)
Date
Number of
Exceedances
Annual Average (ug/m3)
Number of Samples
HSa 137 1/3
99 6/16
0 31.4 364
SCa 69 11/26
62 9/13
0 24.6 363
LE-Pb 59 1/6
57 1/12
0 22.8 60
LE-Cb 58 1/6
56 1/12
0 26.5c 43
aContinuous (TEOM) bFilter-based (6-day schedule) c <75% data
Table 15: Twenty-Four Hour Average PM10 Concentration Distributions
Number of Twenty-Four Hour Average Concentrations (ug/m3)
Interval: 0 to 25 26 to 50
51 to 75
76 to 100
101 to 125
126 to 150
151 to 175
176 to 200
>200
Site
HSa 166 148 42 7 0 1 0 0 0
SCa 212 139 12 0 0 0 0 0 0
LE-Pb 34 20 2 0 0 0 0 0 0
LE-Cb 21 16 2 0 0 0 0 0 0 aContinuous (TEOM) bFilter-based (6-day schedule)
12
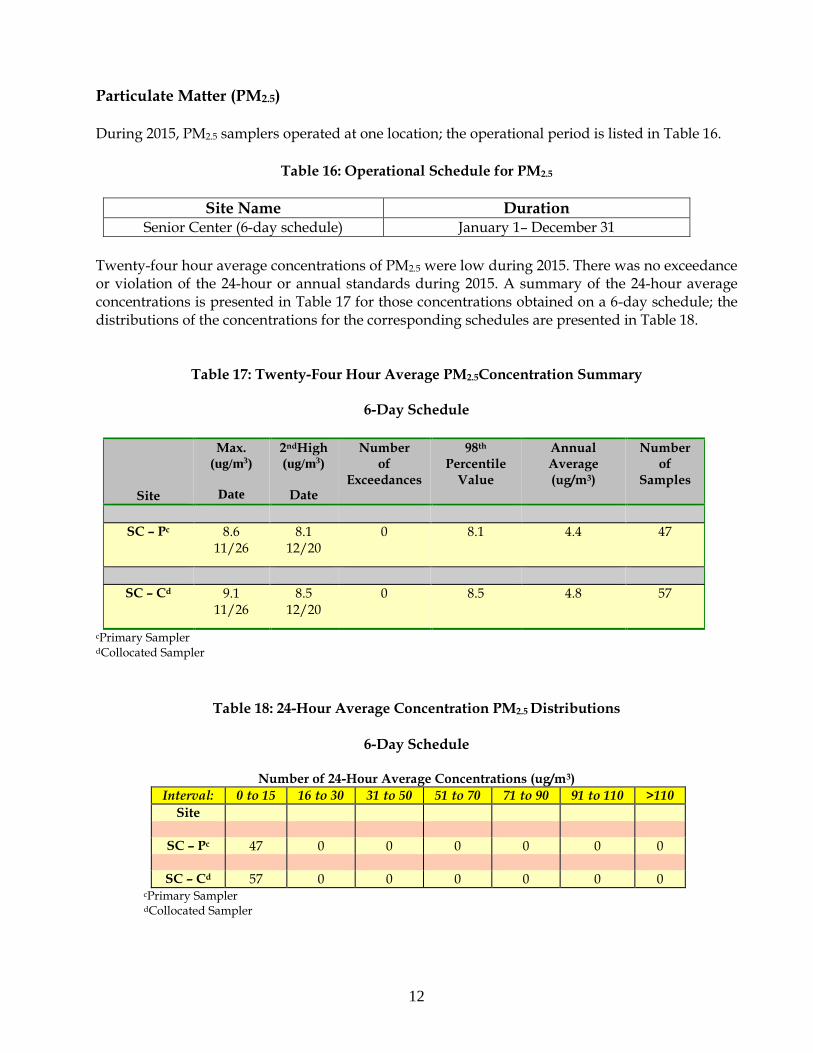
Particulate Matter (PM2.5) During 2015, PM2.5 samplers operated at one location; the operational period is listed in Table 16.
Table 16: Operational Schedule for PM2.5
Site Name Duration Senior Center (6-day schedule) January 1– December 31
Twenty-four hour average concentrations of PM2.5 were low during 2015. There was no exceedance or violation of the 24-hour or annual standards during 2015. A summary of the 24-hour average concentrations is presented in Table 17 for those concentrations obtained on a 6-day schedule; the distributions of the concentrations for the corresponding schedules are presented in Table 18.
Table 17: Twenty-Four Hour Average PM2.5Concentration Summary
6-Day Schedule
Site
Max. (ug/m3)
Date
2ndHigh (ug/m3)
Date
Number of
Exceedances
98th Percentile
Value
Annual Average (ug/m3)
Number of
Samples
SC – Pc
8.6
11/26 8.1
12/20 0 8.1 4.4
47
SC – Cd 9.1 11/26
8.5 12/20
0 8.5 4.8 57
cPrimary Sampler dCollocated Sampler
Table 18: 24-Hour Average Concentration PM2.5 Distributions
6-Day Schedule
Number of 24-Hour Average Concentrations (ug/m3)
Interval: 0 to 15 16 to 30 31 to 50 51 to 70 71 to 90 91 to 110 >110
Site
SC – Pc 47 0 0 0 0 0 0
SC – Cd 57 0 0 0 0 0 0 cPrimary Sampler dCollocated Sampler
13
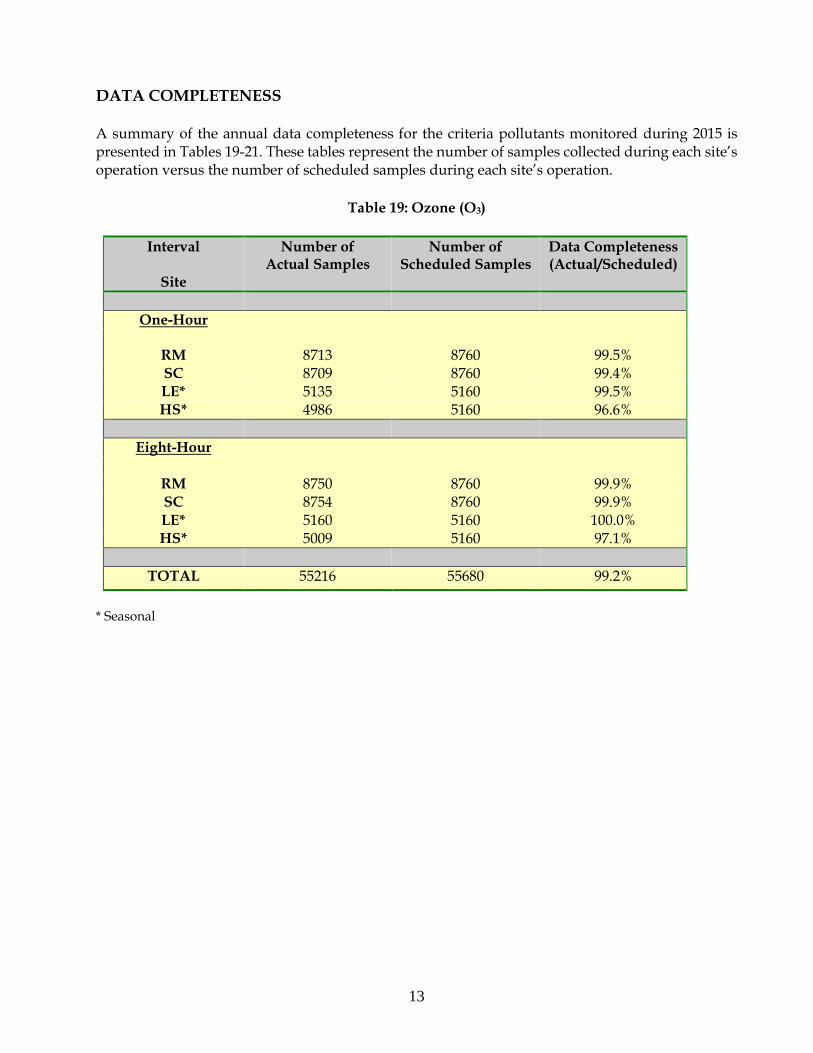
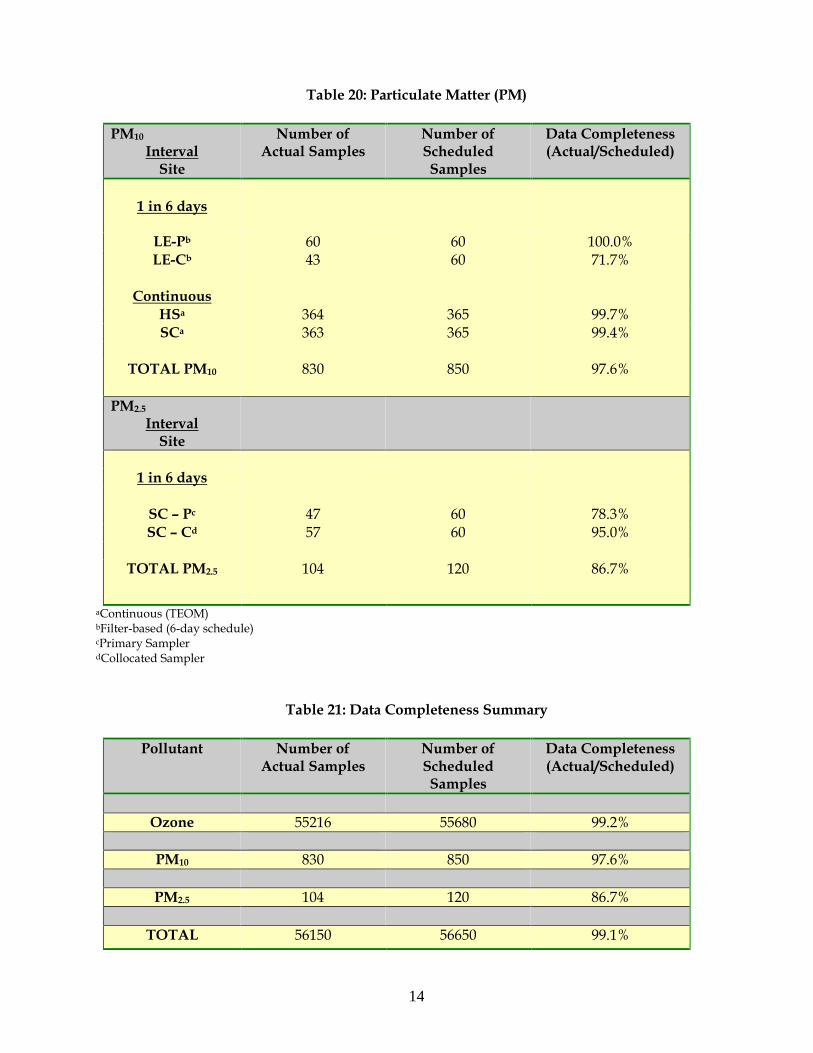
DATA COMPLETENESS A summary of the annual data completeness for the criteria pollutants monitored during 2015 is presented in Tables 19-21. These tables represent the number of samples collected during each site’s operation versus the number of scheduled samples during each site’s operation.
Table 19: Ozone (O3)
Interval
Site
Number of Actual Samples
Number of Scheduled Samples
Data Completeness (Actual/Scheduled)
One-Hour
RM 8713 8760 99.5% SC 8709 8760 99.4% LE* 5135 5160 99.5% HS* 4986 5160 96.6%
Eight-Hour
RM 8750 8760 99.9% SC 8754 8760 99.9% LE* 5160 5160 100.0% HS* 5009 5160 97.1%
TOTAL 55216 55680 99.2%
* Seasonal
14
Table 20: Particulate Matter (PM)
PM10 Interval
Site
Number of Actual Samples
Number of Scheduled Samples
Data Completeness (Actual/Scheduled)
1 in 6 days
LE-Pb 60 60 100.0% LE-Cb 43 60 71.7%
Continuous
HSa 364 365 99.7% SCa 363 365 99.4%
TOTAL PM10 830 850 97.6%
PM2.5 Interval
Site
1 in 6 days
SC – Pc 47 60 78.3% SC – Cd 57 60 95.0%
TOTAL PM2.5 104 120 86.7%
aContinuous (TEOM) bFilter-based (6-day schedule) cPrimary Sampler dCollocated Sampler
Table 21: Data Completeness Summary
Pollutant Number of Actual Samples
Number of Scheduled Samples
Data Completeness (Actual/Scheduled)
Ozone 55216 55680 99.2%
PM10 830 850 97.6%
PM2.5 104 120 86.7%
TOTAL 56150 56650 99.1%

15
EXCEEDANCE OF THE NATIONAL AMBIENT AIR QUALITY STANDARDS (NAAQS) Included in Table 22 is a summary of exceedances of the NAAQS during 2015.
Table 22: 2014 NAAQS Exceedances
Pollutant Interval Site Concentration Date
Ozone 1-Hour None - - 8-Hour RM 0.079 6/20 0.078 6/12 0.078 6/20
SC 0.079 0.077 0.077
6/12 6/20 6/29
LE 0.082 6/29 0.080 6/12 0.080 6/20 0.076 6/16
HS 0.078 6/12 0.076 6/29
PM10 24-Hour SC - - LE - - HS - - Annual None - -
PM2.5 24-Hour None - - Annual None - -

16
VIOLATIONS OF THE NATIONAL AMBIENT AIR QUALITY STANDARDS
Ozone (O3)
Table 23: Violations of the 8-hour Ozone Standard
Site
2013 4th High
(ppm)
2014 4th High
(ppm)
2015 4th High
(ppm)
3-Year Average of 4th High
(ppm)
RM 0.075 0.080 0.074 0.076
SC 0.074 0.073 0.073 0.073
LE 0.075 0.076 0.076 0.075
HS 0.074 0.071 0.072 0.072
Particulates - PM10
Table 24: Violations of the Twenty-Four Hour PM10 Standard
2013 2014 2015
Site
24-Hr Max
(ug/m3)
Expected
Exceedances
24-Hr Max
(ug/m3)
Expected
Exceedances
24-Hr Max
(ug/m3)
Expected
Exceedances
Rate of Expected
Exceedances
HSa 221f 1.0 241g 3.0 137 0 1.3
SC 111b 0 106a 0 69a 0 0.0
LEb 69 0 147 0 59 0 0.0
Table 25: Violations the Annual PM10 Standard
Site
2013 Annual Average (ug/m3)
2014 Annual Average (ug/m3)
2015 Annual Average (ug/m3)
Three-Year Average (ug/m3)
HSa 38.0 39.3 31.4 36.2
SC 34.2b 31.8a 24.6a 30.2
LEb 28.2 29.9 22.8 27.0 aContinuous (TEOM) bFilter-based (6-day schedule) cPrimary Sampler dCollocated Sampler e<75% data fData submitted to AQS as high winds pursuant to Exceptional Event gAgricultural operations

17
Particulates – PM2.5
Table 26: Violations of the Twenty-Four Hour PM2.5 Standard
Site
2013 Annual 98th Percentile
(ug/m3)
2014 Annual 98th Percentile
(ug/m3)
2015 Annual 98th Percentile
(ug/m3)
Three-Year Average
98th Percentile (ug/m3)
SC-Pc 10.1 11.0 8.1 9.7
Table 27: Violations the Annual PM2.5 Standard
Site
2013 Annual Average (ug/m3)
2014 Annual Average (ug/m3)
2015 Annual Average (ug/m3)
Three-Year Average (ug/m3)
SC-Pc 5.3 5.4 4.4 5.0 cPrimary Sampler
NETWORK INFORMATION The following is a list of information on SRPMIC monitoring network activities that occurred during 2015.
Ozone Monitoring: During 2015, four ozone monitors were reported operational. Two site monitors from Lehi and the High School continue to operate April 1 to November 1 as seasonal monitors, while ozone monitors at the Senior Center and Red Mountain sites continue to operate year-round. On December 18, 2015 SRPMIC notified EPA Region 9 in a letter not to pursue waivers to operate ozone seasonal monitors at Lehi and High School but decided to operate both sites year-round beginning January 2016. This regards to recent ozone National Ambient Air Quality Standard (NAAQS) revisions that it was appropriate for SRPMIC to operate year-round as the area is in non-attainment and the network still exceeds the current standard. A prior separate letter was sent to EPA Region 9 on March 31, 2015 informing of SRPMIC to start ozone seasonal monitoring for 2015 but did not mentioned of waivers for the Lehi and High School monitors. There were four exceedance-days of the eight-hour primary standard for ozone and one violation of the eight-hour primary standard NAAQS for the three-year average of the fourth highest concentration. Tables 22 and 23 present the data summaries for the eight-hour ozone report. On October 1, 2015, EPA updated the ozone NAAQS from .075 ppm to .070 ppm that will reduce the ozone pollution and to improve the public health protection. SRPMIC will continue the active efforts to implement the updated standards and reviewing the ozone designations process.

18
PM10 Monitoring: During 2015, three PM10 monitors were reported operational. Two site monitors at the Senior Center and High School sites operated continuously, collecting hourly data while the PM10 samplers at Lehi site was filter-based and operated on a 1 in 6-day schedule. There were no exceedance-days of the 24-hour primary standard for PM10 of 150ug/m3 and one violation of the 24-hour standard of expected number of exceedances. Tables 14 and 24 provide data summaries of PM10 exceedances. The Lehi PM10 collocate monitor commenced operation on March 25, 2015. Lehi is the only collocated site since Senior Center manual PM10 method collocation was removed on May 2014 in replacement of TEOM continuous monitor. The manual collocation sampling at Lehi is on a 1 in 6-day schedule for purposes of precision assessment for the network and both the primary and collocate samplers are FRM filter-based having the same EPA FRM method designation on standard condition collection. On June 29, 2015 Air Quality Program (AQP) started sending the daily air quality PM10 data from High School monitor and meteorological wind speed and wind direction data to Rousseau Farm Company at their request to keep track of their farming activities based from the recorded data. Rousseau Farms in their past agricultural practices had exploited several high PM10 concentrations of dust measured at High School monitor (three exceedances in 2014) that was a concern after noticeable elevated PM10 started to appear and it was addressed by AQP staff at Rousseau and SRPMIC meeting on June 26, 2015. By supporting Rousseau Farms the daily air quality data has enabled them to manage their activities better and have not observed any high concentrations of PM10 measurement.
PM2.5 Monitoring: Two PM2.5 monitors were reported operational in AQS for 2015. Primary and collocate PM2.5 FRM filter-based low volume monitors both operated on 1 in 6-day schedules at the Senior Center site. There was no exceedance or violation of the 24-hour or annual NAAQS during 2015. The primary sampler had issues of down-time in third quarter after loss power from thunderstorm that followed with multiple circuit card/component changes and had affected the stability of filter temperature during the collection period. Several maintenance and calibrations that followed for corrective action. The modification of sampling frequency to PM2.5 FRM network at the Senior Center occurred after SRPMIC requested in a letter to EPA Region 9 on August 21, 2008 to reduce the sampling schedule of the primary monitor to a 1 in 6-day from a 1 in 3-day schedule due to lack of filter support from the laboratory (former laboratory) which created minimal data reports. This was critical to data completeness and AQP staffing issues. EPA Region 9 approved the request to reduce sampling frequency at the Senior Center site from 1 in 3-day schedule to a 1 in 6-day schedule in a written letter on October 2008.

19
Network and Non-Regulatory Information: An independent auditor conducts a quarterly audit on SRPMIC air monitoring network. Criteria pollutants ozone, PM10 and PM2.5 are audited quarterly and all meteorological parameters are done twice annually. On each quarter, SRPMIC submitted the results of all valid measurement quality checks of precision and accuracy data to AQS. The SRPMIC monitoring network meets the minimum data assessment requirements for SLAMS sites of 40 CFR Part 58 Appendix A and 40 CFR Part 58.16 in reporting of all ambient air quality data and associated quality assurance data for criteria pollutant of ozone, PM10 and PM2.5 to the AQS database. The 2014 SRPMIC Data Certification document packet was sent to EPA Region 9 on April 17, 2015, a requirement to 40 CFR Part 58.15. The following is the EPA Audits conducted in 2015:
• EPA Ozone NPAP Through-the-Probe Audit conducted at Senior Center Air Monitoring
Station on May 12, 2015; and • EPA PM2.5 PEP Audits conducted: February 5 & 11, 2015, May 12, 2015, July 29, 2015, August
4, 2015 and November 2, 2015 at Senior Center Air Monitoring Station. The final 2014 SRPMIC Air Monitoring Network Review report document was sent to EPA Region 9 on June 24, 2015. On September 30, 2015 SRPMIC submitted their 5-Year Air Monitoring Assessment report document to the EPA Region 9. AQP conducted air quality equipment audit and equipment calibrations at two locations for the White Mountain Apache Tribe to assist air program remain in compliance with EPA standards on September 8-9, 2015. Meteorological system (All-In-One) was installed in early 2016 at the High School site to monitor parameters wind speed/wind direction, relative humidity, temperature and pressure. The parameters is not in the data collection network as the systems different application is being worked. The AQP continues to submit hourly data (FTP) of ozone and PM10 to AIRNow data center that was first established with ozone reports in 2007. SRPMIC relies on Sonoma Techs AIRNow reporting tools of navigational mapping of hourly data comparisons with local monitors and the site trajectory for source traces. The AQP continues to provide public outreach using a Flag Communication Network in which color flags are changed based upon daily air quality conditions that reflect air quality index (AQI) colors. They are setup at five different locations, including one at Salt River High School. AQP also distributes public outreach information of air quality advisories through the SRPMIC website and digital signage displays that reports of high pollution and health watch advisories.

20
Proposed Changes Within Next 18 Months: AQP installed a continuous PM10 Thermo 1405 monitor at Lehi air monitoring station in October 2015 to monitor side-by-side with the FRM samplers to compare the data results for several months then introduced as a reporting monitor. The 1405 will replace the collocated site, primary and collocated filter-based FRM samplers that eventually will have all SRPMIC PM10 network a continuous monitors. The new PM2.5 Thermo 1405 FDMS continuous FEM monitor was installed and projected to be operational in early 2017 as reporting monitor at Senior Center air monitoring station. The 1405 FDMS need more time for data assessments with current FRM samplers and continuous monitor is not fully functional. The FEM will be designated as primary monitor and shall be collocated with an FRM audit monitor that will be operate on 1 and 12-day schedule. The site is the only location that monitors PM2.5 with a primary and collocated filter-based R&P FRM 2000 that collects in local conditions.

21
TRENDS The air quality in the Phoenix Metropolitan Area is generally improving despite the tremendous growth experienced in the region. Since monitoring began in the 1960s, ambient concentrations for most of the criteria pollutants have been reduced to below the NAAQS. Graphs of the trends seen in those criteria pollutants that are monitored on the SRPMIC are illustrated in Graphs 1 through 7. Ozone (O3) One-Hour Concentrations Maximum 1-hour concentrations of O3 at the SRPMIC monitoring locations have shown a large decline from 2005 to 2009 and a small overall increase occurring from 2009 to 2015. Between 2005 and 2015, maximum concentrations decreased approximately 20%. A graph of the maximum one-hour concentrations is provided in Graph 1.

22
Eight-Hour Concentrations
Eight-hour average concentrations of O3 at the SRPMIC monitoring locations reflect the trend seen in the 1-hour concentrations. The three-year moving averages of the fourth-highest 8-hour concentration at the four locations are illustrated in Graph 2.
23
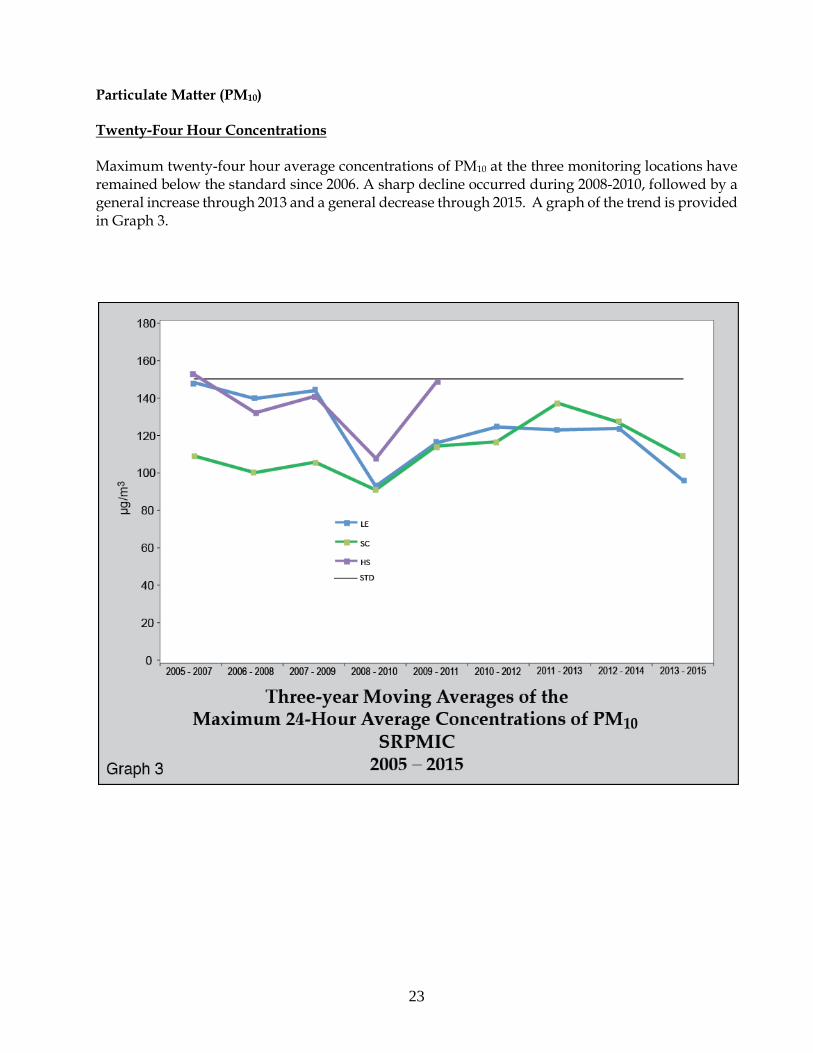
Particulate Matter (PM10)
Twenty-Four Hour Concentrations Maximum twenty-four hour average concentrations of PM10 at the three monitoring locations have remained below the standard since 2006. A sharp decline occurred during 2008-2010, followed by a general increase through 2013 and a general decrease through 2015. A graph of the trend is provided in Graph 3.

24
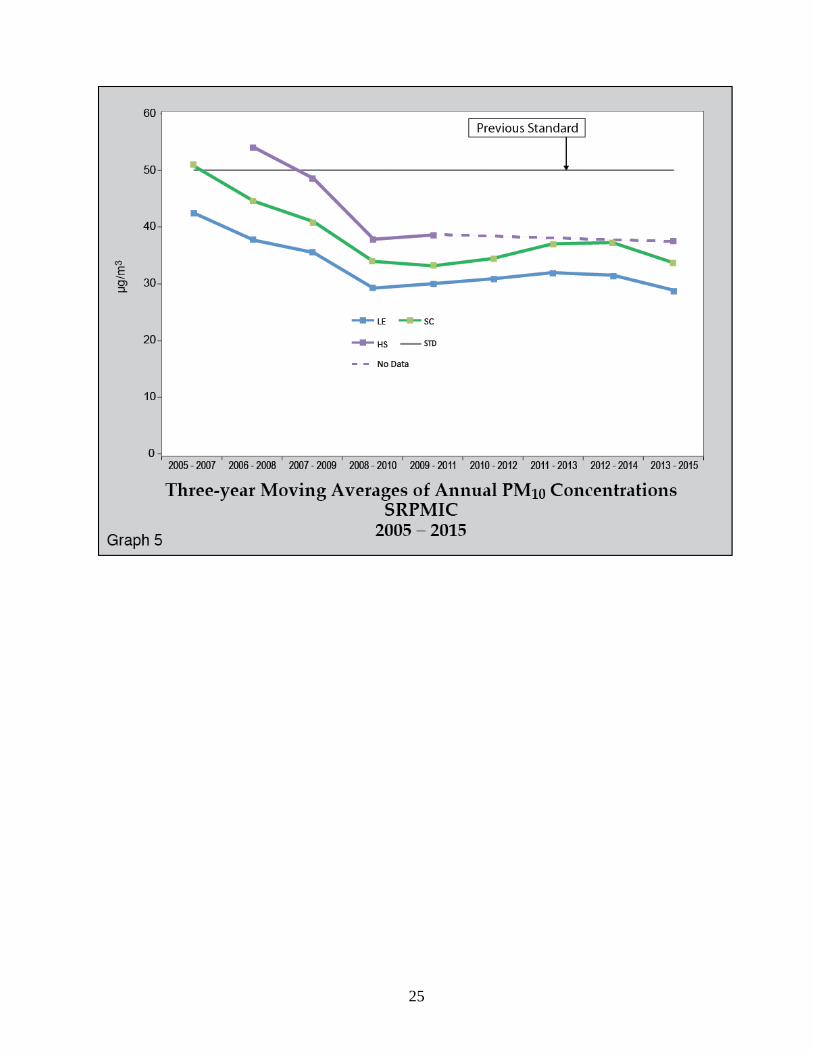
Annual Concentrations Annual average concentrations of PM10 at the SRPMIC locations have shown a general decline between 2005 and 2015. There has been no exceedance of the previous annual standard since 2007; a graph is presented in Graph 4. A graph of the three-year moving averages of the annual PM10 concentrations is provided in Graph 5. Data recovery at the High School (HS) location was less than 75% during 2012, therefore, data for 2012 were not included in Graphs 4 and 5.
25

26
Particulate Matter (PM2.5)
98th Percentiles Concentrations of PM2.5 were well below the standard. A graph of the three-year moving averages of the 98th percentile of the 24-hour average concentrations is provided in Graph 6. Data collected during 2007 was included in the moving averages although data recovery for that year was less than 75%.

27
Annual Concentrations Annual average concentrations of PM2.5 at the SRPMIC locations have shown a general decline since 2005, although a slight increase occurred during 2012-2014. A graph of the three-year moving averages of the annual PM2.5 concentrations is provided in Graph 7. Data collected during 2007 was included in the moving averages although data recovery for that year was less than 75%.

28
SITE DESCRIPTIONS
Senior Center (SC)
Site Name Senior Center
AQS ID 04 013 7020
GPS Coordinates 33°29.294’, 111°51.339’
Address 10844 East Osborn Road, Scottsdale, AZ 85356
County Maricopa
Representative Area CBSA Phoenix-Mesa-Scottsdale
Distance to Roadways (m) Osborn Road (22.3), Alma School Road (156)
Traffic Count (AADT) Rural road with no official traffic count available
Site Description: The Senior Center (SC) site commenced operation in October 2004 after relocated from the Desert Eagle Secondary School Air Station. The site is located just west of the Senior Service Center at the northeast section of Osborn Road and Alma School Road approximately one half mile from the Two Waters Administration Tribal Complex. The site is situated in the midst of neighborhood homes with agricultural fields to the south and sparse open fields to the north. The criteria pollutants of ozone and particulate matter of PM10 and PM2.5 are monitored at this station. The network design for the FRMs PM10 and PM2.5 monitoring is established as primary and collocated sample measurements until 2014 PM10 continuous TEOM was installed as through-the-roof sampling and the PM10 collocated monitor was removed. The meteorological parameter of wind speed, wind direction, atmospheric pressure, relative humidity, precipitation, ambient temperature and the delta temperature measurement are also monitored at this site. The data acquisition network of hourly data reports is in-house along with the ozone calibration monitors.

29
Table 28: Senior Center
Pollutant, POC Ozone, 1 PM10 (continuous), 3 PM2.5, 1 & 2
Parameter code 44201 81102 88101
Monitor make & model
Thermo 49i R&P TEOM 1400ab R&P FRM 2000 (both)
Date started February 10, 2011 January 1, 2014 May 2004 (both)
Basic monitoring objective(s)
NAAQS comparison, Public info
NAAQS comparison, Public info
NAAQS comparison, Public info
Monitor type(s) SLAMS (tribal) SLAMS (tribal) SLAMS (tribal)
Spatial scale Neighborhood Neighborhood Neighborhood
Site type(s) Population exposure, regional transport
Population exposure Population exposure
Primary, Collocated Primary Primary Primary, Collocated
FRM/FEM/ARM FEM FEM FRM/FRM
Method code 047 079 117/117
Collecting Agency SRPMIC SRPMIC SRPMIC
Analytical lab NA NA IML/IML
Reporting Agency SRPMIC SRPMIC SRPMIC
Sampling Frequency Continuous Continuous 1 in 6/1 in 6
Sampling Season Year-round Year-round Year-round (both)
Probe height (m) 4.2 4.3 3.1/3.1
Airflow arch (degrees) 360 360 360/360
Distance from drip line of nearest tree(s) (m)
14.6 16.7 17.7/14.7
Distance between QA collocated monitors (m)
NA
NA
2.9/2.9
Distance to furnace or incinerator (m)
NA NA NA/NA
Distance from supporting structure (m)
1.5 1.9 1.9/1.9
Distance from obstructions on roof–horizontal (m)
NA
NA
NA/NA
Distance from obstructions on roof – vertical height (m)
NA
NA
NA/NA
Distance from obstructions not on roof – horizontal (m)
NA
NA
NA/NA
Distance from obstructions not on roof – vertical height (m)
NA
NA
NA/NA
Probe material Borosilicate glass NA NA/NA

30
Residence time (s) 10 NA NA/NA
Ground cover Gravel Gravel Gravel/Gravel
Will there be changes within next 18 months? (Y/N)
N
N
Y/Y
Is it suitable for comparison against annual PM2.5? (Y/N)
NA
NA
Y
Frequency of flow rate verification
NA Biweekly Biweekly (both)
Frequency of one-point QC check
Biweekly NA NA/NA
Dates of Audit Evaluation
3-26-15, 6-25-15, 9-24-15, 12-17-15
3-26-15, 6-25-15, 9-24-15, 12-17-15
3-26-15, 6-25-15, 9-24-15, 12-17-15 (both)
Meteorological measurements at the Senior Center site include wind speed, wind direction, ambient temperature, relative humidity, barometric pressure, precipitation, differential temperature and solar radiation.

31
Red Mountain (RM)
Site Name Red Mountain
AQS ID 04 013 7021
GPS Coordinates 33°30.475’, 111°45.277’
Address 15115 Beeline Highway, Scottsdale, AZ 85256
County Maricopa
Representative Area CBSA Phoenix-Mesa-Scottsdale
Distance to Roadways (m) Beeline Highway (608)
Traffic Count (AADT) Rural road with no official traffic count
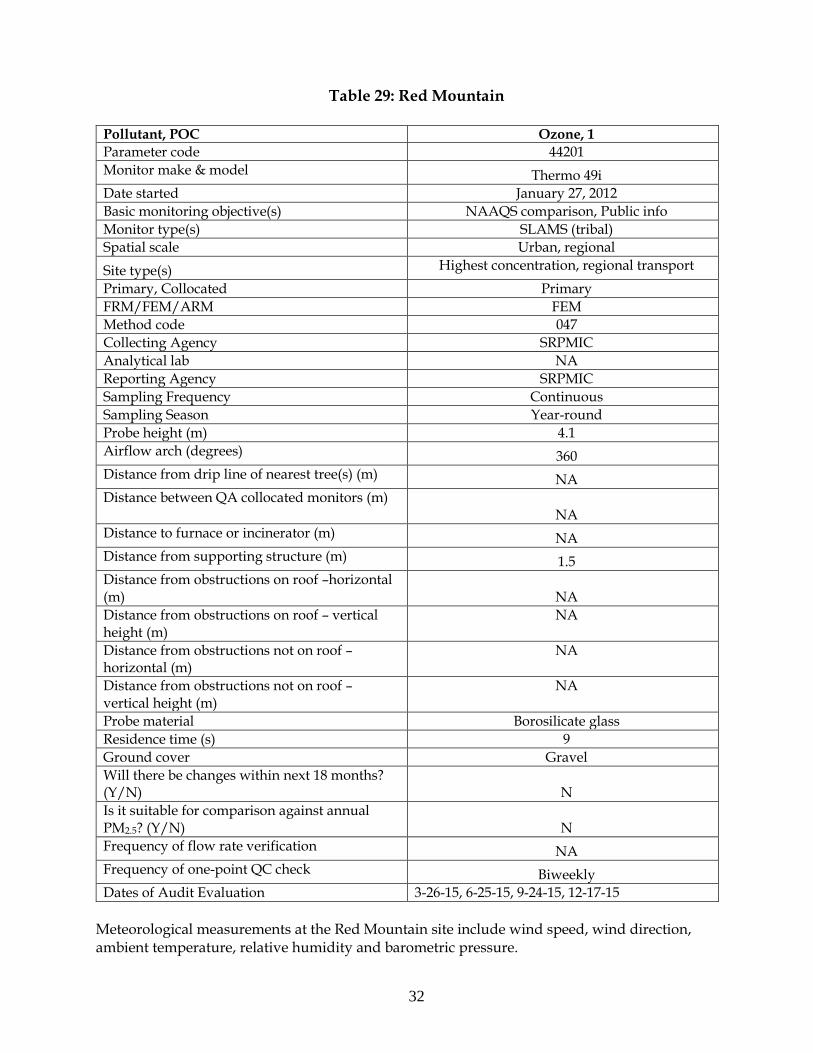
Site Description: The monitoring site is located south of the old Red Mountain Trap & Sheet building. The Trap and Skeet facility was closed and all buildings removed that used to provide RV hookups. A large portion of the area is open-range populated with creosote scrubs and desert plants and is approximately half mile southeast of State Highway 87 Beeline Highway. The monitoring station was established in the summer of 2002 and monitoring immediately followed. In May 2010 the monitoring station was upgraded with a new monitoring shelter, new meteorological tower and the electrical connection was revamped. The criteria pollutant ozone is monitored at this site to represent urban and regional scales. The meteorological system of wind speed, wind direction, atmospheric pressure, ambient temperature and relative humidity are also monitored at this station. The data acquisition instrument of hourly data reports is in-house along with the ozone monitor calibration system.
32
Table 29: Red Mountain
Pollutant, POC Ozone, 1
Parameter code 44201
Monitor make & model Thermo 49i
Date started January 27, 2012
Basic monitoring objective(s) NAAQS comparison, Public info
Monitor type(s) SLAMS (tribal)
Spatial scale Urban, regional
Site type(s) Highest concentration, regional transport
Primary, Collocated Primary
FRM/FEM/ARM FEM
Method code 047
Collecting Agency SRPMIC
Analytical lab NA
Reporting Agency SRPMIC
Sampling Frequency Continuous
Sampling Season Year-round
Probe height (m) 4.1
Airflow arch (degrees) 360
Distance from drip line of nearest tree(s) (m) NA
Distance between QA collocated monitors (m) NA
Distance to furnace or incinerator (m) NA
Distance from supporting structure (m) 1.5
Distance from obstructions on roof –horizontal (m)
NA
Distance from obstructions on roof – vertical height (m)
NA
Distance from obstructions not on roof – horizontal (m)
NA
Distance from obstructions not on roof – vertical height (m)
NA
Probe material Borosilicate glass
Residence time (s) 9
Ground cover Gravel
Will there be changes within next 18 months? (Y/N)
N
Is it suitable for comparison against annual PM2.5? (Y/N)
N
Frequency of flow rate verification NA
Frequency of one-point QC check Biweekly
Dates of Audit Evaluation 3-26-15, 6-25-15, 9-24-15, 12-17-15
Meteorological measurements at the Red Mountain site include wind speed, wind direction, ambient temperature, relative humidity and barometric pressure.
33
Lehi (LE)
Site Name Lehi
AQS ID 04 013 7022
GPS Coordinates 33°28.472’, 111°48.303’
Address 3250 North Stapley Drive, Mesa, AZ 85203
County Maricopa
Representative Area CBSA Phoenix-Mesa-Scottsdale
Distance to Roadways (m) Stapley Drive 18.3), Oak Street (81)
Traffic Count (AADT) Rural road with no official traffic count available - east
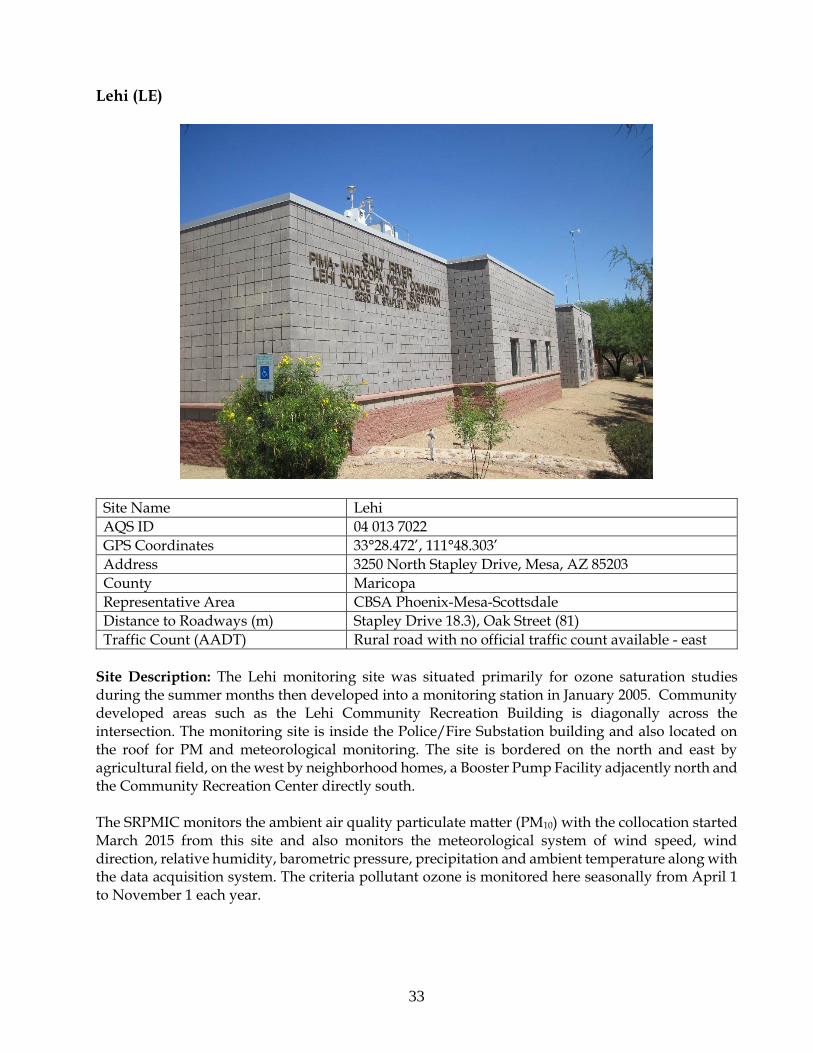
Site Description: The Lehi monitoring site was situated primarily for ozone saturation studies during the summer months then developed into a monitoring station in January 2005. Community developed areas such as the Lehi Community Recreation Building is diagonally across the intersection. The monitoring site is inside the Police/Fire Substation building and also located on the roof for PM and meteorological monitoring. The site is bordered on the north and east by agricultural field, on the west by neighborhood homes, a Booster Pump Facility adjacently north and the Community Recreation Center directly south. The SRPMIC monitors the ambient air quality particulate matter (PM10) with the collocation started March 2015 from this site and also monitors the meteorological system of wind speed, wind direction, relative humidity, barometric pressure, precipitation and ambient temperature along with the data acquisition system. The criteria pollutant ozone is monitored here seasonally from April 1 to November 1 each year.

34
Table 30: Lehi
Pollutant, POC Ozone, 1 PM10, 1 PM10, 2
Parameter code 44201 81102 88101
Monitor make & model
Teledyne T400 R&P FRM 2000 R&P FRM 2000
Date started May 21, 2014 December 2004 March 2015
Basic monitoring objective(s)
NAAQS comparison, Public info
NAAQS comparison, Public info
NAAQS comparison, Public info
Monitor type(s) SLAMS (tribal) SLAMS (tribal) SLAMS (tribal)
Spatial scale Neighborhood Neighborhood Neighborhood
Site type(s) Population exposure, regional transport
Population exposure Population exposure
Primary, Collocated Primary Primary Collocated
FRM/FEM/ARM FEM FRM FRM
Method code 087 098 098
Collecting Agency SRPMIC SRPMIC SRPMIC
Analytical lab NA IML IML
Reporting Agency SRPMIC SRPMIC SRPMIC
Sampling Frequency Continuous 1 in 6 1 in 6
Sampling Season Seasonal Year-round Year-round
Probe height (m) 6.7 6.4 6.4
Airflow arch (degrees) 360 360 360
Distance from drip line of nearest tree(s) (m)
9.1
10
12.6
Distance between QA collocated monitors (m)
NA
2.6
2.6
Distance to furnace or incinerator (m)
Furnace (16.7) Furnace (35.2) Furnace (35.2)
Distance from supporting structure (m)
2.4
2.3
2.3
Distance from obstructions on roof–horizontal (m)
27.5
7
4.4
Distance from obstructions on roof – vertical height (m)
2.3
2.1
2.1
Distance from obstructions not on roof – horizontal (m)
NA
NA
NA
Distance from obstructions not on roof – vertical height (m)
NA
NA
NA
Probe material Borosilicate glass NA NA
35
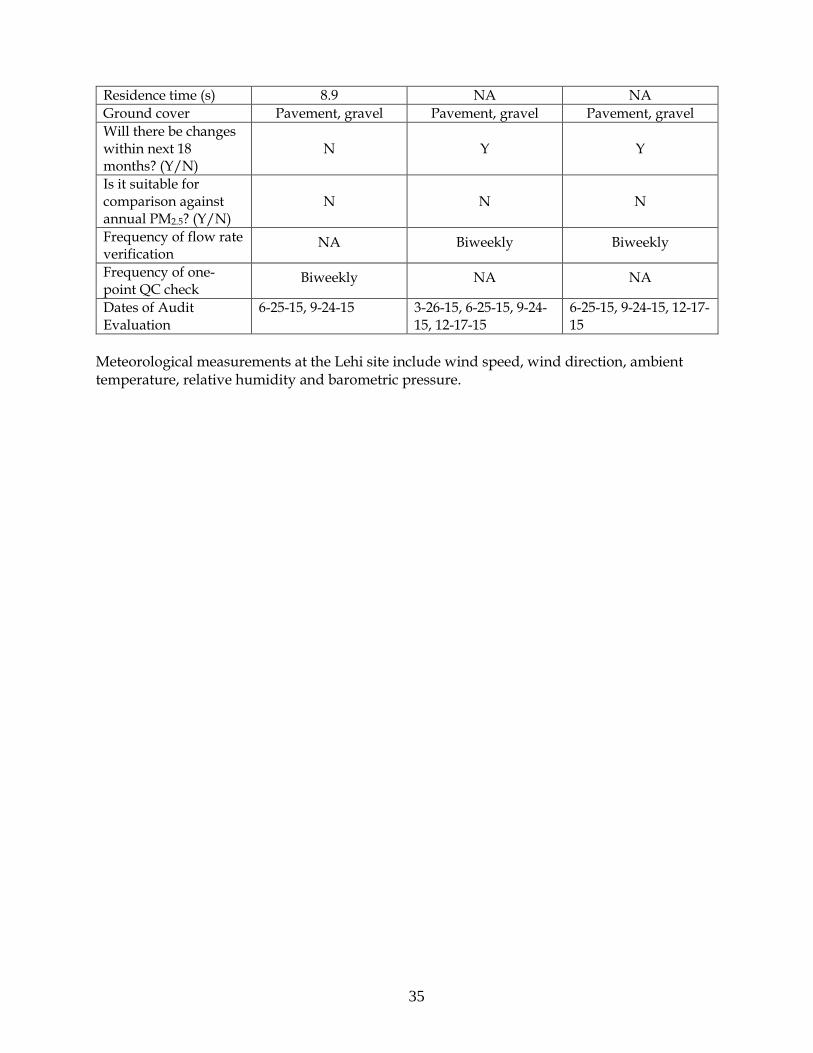
Residence time (s) 8.9 NA NA
Ground cover Pavement, gravel Pavement, gravel Pavement, gravel
Will there be changes within next 18 months? (Y/N)
N
Y
Y
Is it suitable for comparison against annual PM2.5? (Y/N)
N
N
N
Frequency of flow rate verification
NA Biweekly Biweekly
Frequency of one-point QC check
Biweekly NA NA
Dates of Audit Evaluation
6-25-15, 9-24-15 3-26-15, 6-25-15, 9-24-15, 12-17-15
6-25-15, 9-24-15, 12-17-15
Meteorological measurements at the Lehi site include wind speed, wind direction, ambient temperature, relative humidity and barometric pressure.

36
High School (HS)
Site Name High School
AQS ID 04 013 7024
GPS Coordinates 33°30.483’, 111°50.268’
Address 4827 North Country Club Drive, Scottsdale, AZ 85256
County Maricopa
Representative Area CBSA Phoenix-Mesa-Scottsdale
Distance to Roadways (m) North Country Club Drive (141), Chaparral Road (172)
Traffic Count (AADT) Rural road with no official traffic count
Site Description: The High School site was located on the property of Salt River High School in the annex of the Maintenance Electrical Facility room and then moved the monitoring section next door in March 2012 to have better access for student outreach. The site was established in April 2006 after relocating from the Early Childhood Education Center Air Station because the ozone monitoring site did not meet the sitting criteria due to facility expansion to the adjacent building. The site has been operational since July 2002. The area had rapid facility growth that included the new High School that commenced in the fall 2006, an Elementary School to the southeast, residential homes constructed to the east, and several new school ballparks to the east. The Central Arizona Project Aqueduct Canal borders along the north section and surrounding the area are open agricultural fields to the north and south. Particulate matter (PM10) is one of the criteria pollutants monitored at this site. The ozone seasonal monitoring is monitored at this facility from April 1 to November 1 each year.

37
Table 31: High School
Pollutant, POC Ozone, 1 PM10 (continuous), 2
Parameter code 44201 81102
Monitor make & model Thermo 49i Thermo TEOM 1405
Date started April 21, 2014 October 1, 2012
Basic monitoring objective(s) NAAQS comparison, Public info
NAAQS comparison, Public info
Monitor type(s) SLAMS (tribal) SLAMS (tribal)
Spatial scale Neighborhood Neighborhood
Site type(s) Population exposure, regional transport
Population exposure
Primary, Collocated Primary Primary
FRM/FEM/ARM FEM FEM
Method code 047 079
Collecting Agency SRPMIC SRPMIC
Analytical lab NA NA
Reporting Agency SRPMIC SRPMIC
Sampling Frequency Continuous Continuous
Sampling Season Seasonal Year-round
Probe height (m) 7.3 6.7
Airflow arch (degrees) 360 360
Distance from drip line of nearest tree(s) (m)
12.2 16.1
Distance between QA collocated monitors (m)
NA
NA
Distance to furnace or incinerator (m)
Furnace (33.6) Furnace (30.6)
Distance from supporting structure (m)
1.9 1.9
Distance from obstructions on roof – horizontal (m)
15
11.6
Distance from obstructions on roof – vertical height (m)
1.9
1.9
Distance from obstructions not on roof – horizontal (m)
NA NA
Distance from obstructions not on roof – vertical height (m)
NA
NA
Probe material Borosilicate glass NA
Residence time (s) 10 NA
Ground cover Pavement, gravel Pavement, gravel
Will there be changes within next 18 months? (Y/N)
N
N
Is it suitable for comparison against annual PM2.5? (Y/N)
N
N
Frequency of flow rate verification
NA Biweekly

38
Frequency of one-point QC check
Biweekly NA
Dates of Audit Evaluation 6-25-15, 9-24-15 3-26-15, 6-25-15, 9-24-15, 12-17-15
There are no meteorological measurements at High School site.