"2015 aecom and tea theme and museum index report" · credits tea/aecom 2015 theme index...
TRANSCRIPT

Global Attractions Attendance Report
2015 2015

CREDITS
TEA/AECOM 2015 Theme Index and Museum Index: The Global Attractions Attendance Report
Publisher: Themed Entertainment Association (TEA)
Research: Economics practice at AECOM
Editor: Judith Rubin
Publication team: Tsz Yin (Gigi) Au, Beth Chang, Linda Cheu, Bethanie Finney, Kathleen LaClair, Jodie Lock, Sarah Linford, Erik Miller, Jennie Nevin, Margreet Papamichael, Jef Pincus, John Robinett, Judith Rubin, Brian Sands, Will Selby, Matt Timmins, Feliz Ventura, Chris Yoshii©2016 TEA/AECOM. All rights reserved.
CONTACTS
For further information about the contents of this report and about the Economics practice at
AECOM, contact the following:
John RobinettSenior Vice President, [email protected]
T +1 213 593 8785
Chris YoshiiVice President, [email protected]
T +852 3922 9000
Brian Sands, AICPVice President, [email protected]
T +1 202 821 7281
Margreet PapamichaelDirector, EMEA
T +44 20 3009 2283
Linda CheuVice President, [email protected]
T +1 415 955 2928
aecom.com/economics
For information about TEA (Themed Entertainment Association):
Judith Rubin TEA Publications, PR & Social Media
T +1 314 853 5210
Jennie Nevin
TEA Chief Operating [email protected]
T +1 818 843 8497
teaconnect.org
COVER: © Disneyland at Disneyland Resort®, Anaheim, CA, U.S.

3
The deinitive annual attendance study for the themed entertainment and museum industries.
Published by the Themed Entertainment Association (TEA) and the Economics practice at AECOM.
2015 2015
Global Attractions Attendance Report
4
2015 THEME INDEX 22
The Americas 22
Asia-Paciic 42Europe, Middle East and Africa (EMEA) 52
THE BIG PICTURE 6
CONTENTS
© Aquaventure Water Park, Dubai, U.A.E.
5
2015 MUSEUM INDEX 64
The Americas 72
Asia-Paciic 74Europe, Middle East and Africa (EMEA) 76
ABOUT THIS STUDY 78
Methodology and evolution of the TEA/ 78 AECOM Theme Index and Museum Index
Frequently Asked Questions 78
About TEA and AECOM 82

THE BIG PICTURE
5.4%Top 25 amusement/theme parks attendance growth worldwide 2014–15
235.6mTop 25 amusement/theme parks worldwide attendance 2015
7.2%Top 10 theme park groupsworldwide attendancegrowth 2014–15
6

John RobinettSenior Vice President,
Economics, Americas
It is the 10 year anniversary of the TEA/
AECOM Theme Index, and what a year it
has been. The top attraction operators
saw growth of over 7%, with the Top 25
theme parks achieving over 5% growth
— tremendous numbers for a relatively
mature industry. Over our 10 years of
tracking the industry we have seen
steady improvements in business volume,
despite a global recession, introduction of
exciting new technologies, and continued
internationalization of the attractions world.
This year, global theme park attendance
was driven largely by strong performance
of the major Asian and U.S. operators,
including Chimelong, SongCheng, Disney
and Universal. Water parks saw healthy attendance improvements of almost 4% with
most markets doing well. Finally, museums,
while having a few standouts with double
digit growth such as the Hermitage in Russia,
and the Shanghai Science and Technology
Museum, held steady overall.
So what speciic changes have occurred in the business over the last 10 years?
Three areas stand out — Industry volume,
distribution, and ownership.
© The Wizarding World of Harry Potter™, Universal Studios Japan®, Osaka, Japan
7
8
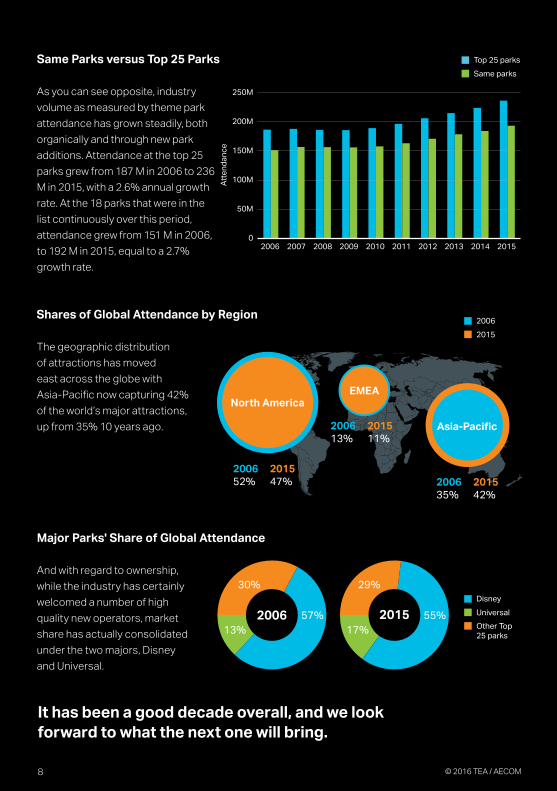
The geographic distribution
of attractions has moved
east across the globe with
Asia-Paciic now capturing 42% of the world’s major attractions,
up from 35% 10 years ago.
And with regard to ownership,
while the industry has certainly
welcomed a number of high
quality new operators, market
share has actually consolidated
under the two majors, Disney
and Universal.
It has been a good decade overall, and we look forward to what the next one will bring.
0
Major Parks' Share of Global Attendance
2006 57%
30%
13%
As you can see opposite, industry
volume as measured by theme park
attendance has grown steadily, both
organically and through new park
additions. Attendance at the top 25
parks grew from 187 M in 2006 to 236
M in 2015, with a 2.6% annual growth
rate. At the 18 parks that were in the
list continuously over this period,
attendance grew from 151 M in 2006,
to 192 M in 2015, equal to a 2.7%
growth rate.
Shares of Global Attendance by Region
Same Parks versus Top 25 Parks
250M
200M
150M
100M
50M
02006 2007 2008 2009 2010 2011 2012 2013 2014 2015
Top 25 parks
Same parks
Att
en
da
nc
e
2006 52%
201547%
2006 13%
201511%
2006 35%
201542%
North America
Asia-Paciic
EMEA
2006
2015
Disney
Universal
Other Top 25 parks
2015 55%
17%
29%
8 © 2016 TEA / AECOM

420.4mTop 10 theme park groupsworldwide attendance 2015
392.0mTop 10 theme park groupsworldwide attendance 2014
7.2%Top 10 theme park groupsworldwide attendancegrowth 2014–15
RA
NK
GR
OU
P
%
CH
AN
GE
AT
TE
ND
AN
CE
2
01
5
AT
TE
ND
AN
CE
2
01
4
1 WALT DISNEY ATTRACTIONS 2.7% 137,902,000 134,330,000
2 MERLIN ENTERTAINMENTS GROUP 0.2% 62,900,000 62,800,000
3 UNIVERSAL PARKS AND RESORTS 11.8% 44,884,000 40,152,000
4 OCT PARKS CHINA 7.8% 30,180,000 27,990,000
5 SIX FLAGS INC. 11.4% 28,557,000 25,638,000
6 CEDAR FAIR ENTERTAINMENT COMPANY 4.9% 24,448,000 23,305,000
7 CHIMELONG GROUP 26.4% 23,587,000 18,659,000
8 FANTAWILD (NEW) 77.4% 23,093,000 13,020,000
9 SEAWORLD PARKS & ENTERTAINMENT 0.3% 22,471,000 22,399,000
10 SONGCHENG WORLDWIDE 53.4% 22,338,000 14,560,000
TOP 10 TOTAL ATTENDANCE 2015 420,360,000 382,853,000
TOP 10 TOTAL ATTENDANCE 2014 7.2% 392,039,000
TOP 10 THEME PARK GROUPS WORLDWIDE
9© 2016 TEA / AECOM
CALIFORNIA, U.S.3 PARKS
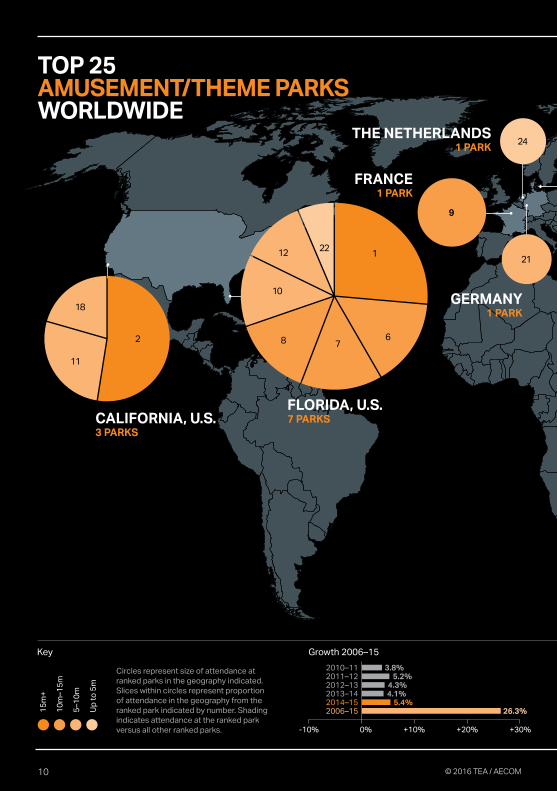
TOP 25 AMUSEMENT/THEME PARKS WORLDWIDE
1
34
5
FLORIDA, U.S.7 PARKS
FRANCE1 PARK
GERMANY1 PARK
THE NETHERLANDS1 PARK
21
9
15
m+
10
m –
15
m
5 –
10
m
Up
to
5m
24
18
11
2
2212
10
8 76
1
2010–112011–122012–132013–142014–152006–15
-10% 0% +10% +20% +30%
3.8%5.2%
26.3%5.4%
4.1%4.3%
Key Growth 2006–15
Circles represent size of attendance at ranked parks in the geography indicated. Slices within circles represent proportion of attendance in the geography from the ranked park indicated by number. Shading indicates attendance at the ranked park versus all other ranked parks.
10 © 2016 TEA / AECOM
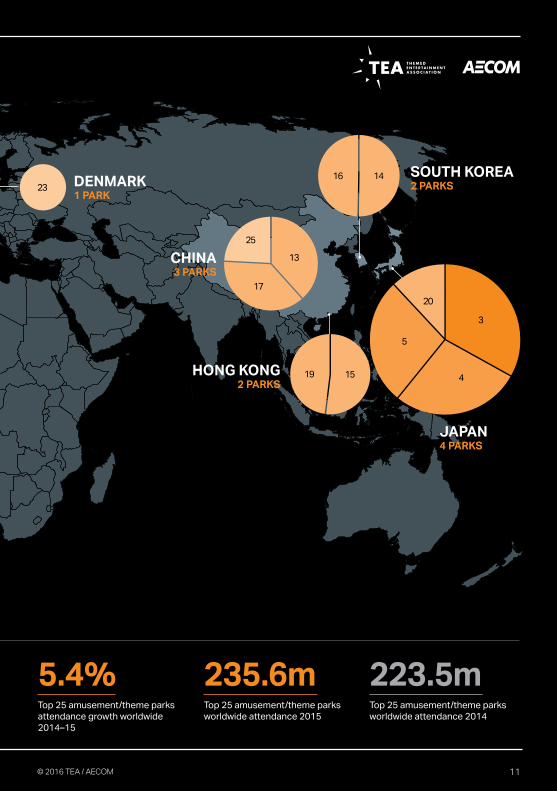
JAPAN4 PARKS
SOUTH KOREA2 PARKS
CHINA3 PARKS
HONG KONG2 PARKS
DENMARK1 PARK
235.6mTop 25 amusement/theme parks worldwide attendance 2015
223.5mTop 25 amusement/theme parks worldwide attendance 2014
5.4%Top 25 amusement/theme parks attendance growth worldwide 2014–15
23
20
5
4
3
16 14
25
17
13
19 15
11© 2016 TEA / AECOM
RA
NK
PAR
KL
oc
ati
on
%
CH
AN
GE
AT
TE
ND
AN
CE
20
15
AT
TE
ND
AN
CE
2
01
4
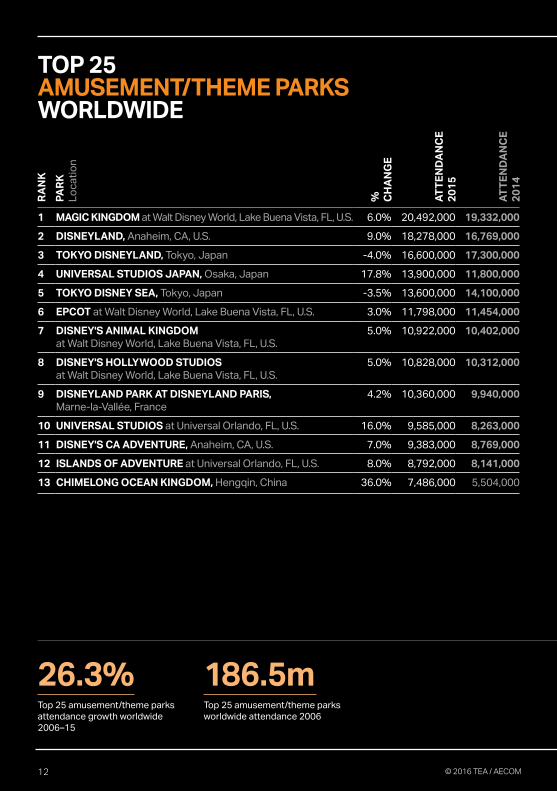
1 MAGIC KINGDOM at Walt Disney World, Lake Buena Vista, FL, U.S. 6.0% 20,492,000 19,332,000
2 DISNEYLAND, Anaheim, CA, U.S. 9.0% 18,278,000 16,769,000
3 TOKYO DISNEYLAND, Tokyo, Japan -4.0% 16,600,000 17,300,000
4 UNIVERSAL STUDIOS JAPAN, Osaka, Japan 17.8% 13,900,000 11,800,000
5 TOKYO DISNEY SEA, Tokyo, Japan -3.5% 13,600,000 14,100,000
6 EPCOT at Walt Disney World, Lake Buena Vista, FL, U.S. 3.0% 11,798,000 11,454,000
7 DISNEY'S ANIMAL KINGDOM at Walt Disney World, Lake Buena Vista, FL, U.S.
5.0% 10,922,000 10,402,000
8 DISNEY'S HOLLYWOOD STUDIOS at Walt Disney World, Lake Buena Vista, FL, U.S.
5.0% 10,828,000 10,312,000
9 DISNEYLAND PARK AT DISNEYLAND PARIS, Marne-la-Vallée, France
4.2% 10,360,000 9,940,000
10 UNIVERSAL STUDIOS at Universal Orlando, FL, U.S. 16.0% 9,585,000 8,263,000
11 DISNEY'S CA ADVENTURE, Anaheim, CA, U.S. 7.0% 9,383,000 8,769,000
12 ISLANDS OF ADVENTURE at Universal Orlando, FL, U.S. 8.0% 8,792,000 8,141,000
13 CHIMELONG OCEAN KINGDOM, Hengqin, China 36.0% 7,486,000 5,504,000
TOP 25 AMUSEMENT/THEME PARKS WORLDWIDE
186.5mTop 25 amusement/theme parks worldwide attendance 2006
26.3%Top 25 amusement/theme parks attendance growth worldwide 2006–15
12 © 2016 TEA / AECOM

235.6mTop 25 amusement/theme parks worldwide attendance 2015
223.5mTop 25 amusement/theme parks worldwide attendance 2014
5.4%Top 25 amusement/theme parks attendance growth worldwide 2014–15
RA
NK
PAR
KL
oc
ati
on
%
CH
AN
GE
AT
TE
ND
AN
CE
20
15
AT
TE
ND
AN
CE
2
01
4
14 EVERLAND, Gyeonggi-Do, South Korea 0.6% 7,423,000 7,381,000
15 OCEAN PARK, Hong Kong SAR -5.2% 7,387,000 7,792,000
16 LOTTE WORLD, Seoul, South Korea -3.9% 7,310,000 7,606,000
17 HANGZHOU SONGCHENG PARK, Hangzhou, China 25.5% 7,289,000 5,810,000
18 UNIVERSAL STUDIOS HOLLYWOOD, Universal City, CA, U.S. 4.0% 7,097,000 6,824,000
19 HONG KONG DISNEYLAND, Hong Kong SAR -9.3% 6,800,000 7,500,000
20 NAGASHIMA SPA LAND, Kuwana, Japan 4.3% 5,870,000 5,630,000
21 EUROPA-PARK, Rust, Germany 10.0% 5,500,000 5,000,000
22 SEAWORLD FL, Orlando, FL, U.S. 2.0% 4,777,000 4,683,000
23 TIVOLI GARDENS, Copenhagen, Denmark 5.7% 4,733,000 4,478,000
24 DE EFTELING, Kaatsheuvel, The Netherlands 6.4% 4,680,000 4,400,000
25 SONGCHENG LIJIANG ROMANCE PARK, Lijiang, China 170.4% 4,678,000 1,730,000
TOP 25 TOTAL ATTENDANCE 2015 235,568,000 220,920,000
TOP 25 TOTAL ATTENDANCE 2014 5.4% 223,450,000
13© 2016 TEA / AECOM

2m
+
1m
–2
m
Up
to
1m
TOP 20 WATER PARKS WORLDWIDE
1
3
FLORIDA, U.S.4 PARKS
GERMANY2 PARKS
BRAZIL3 PARKS
THE BAHAMAS1 PARK
TEXAS, U.S.1 PARK
COLOMBIA1 PARK
4
17
19
12 15
10
63
2
5
19
11
2.8%3.7%
7.1%5.4%
8.2%
Key Growth 2010–15
2010–112011–122012–132013–142014–152010–15 29%
-10% 0% +10% +20% +30%
Circles represent size of attendance at ranked parks in the geography indicated. Slices within circles represent proportion of attendance in the geography from the ranked park indicated by number. Shading indicates attendance at the ranked park versus all other ranked parks.
14 © 2016 TEA / AECOM

CHINA2 PARKS
SOUTH KOREA2 PARKS
U.A.E.1 PARK
CZECH REPUBLIC1 PARK
13
MALAYSIA1 PARK
AUSTRALIA1 PARK
18
9
7 8
1
16
28.7mTop 20 water parks worldwide attendance 2015
27.6mTop 20 water parks worldwide attendance 2014
3.7%Top 20 water parks attendance growth worldwide 2014–15
14
19INDONESIA1 PARK
15© 2016 TEA / AECOM
RA
NK
PAR
KL
oc
ati
on
%
CH
AN
GE
AT
TE
ND
AN
CE
2
01
5
AT
TE
ND
AN
CE
2
01
4
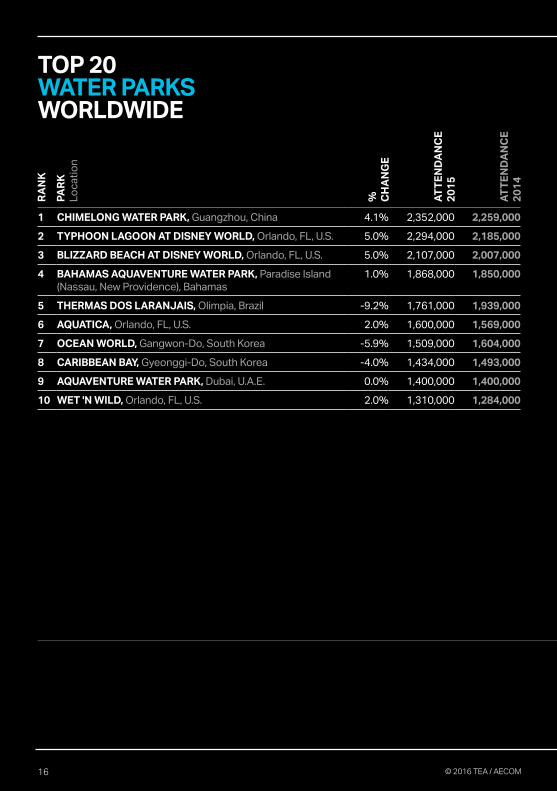
1 CHIMELONG WATER PARK, Guangzhou, China 4.1% 2,352,000 2,259,000
2 TYPHOON LAGOON AT DISNEY WORLD, Orlando, FL, U.S. 5.0% 2,294,000 2,185,000
3 BLIZZARD BEACH AT DISNEY WORLD, Orlando, FL, U.S. 5.0% 2,107,000 2,007,000
4 BAHAMAS AQUAVENTURE WATER PARK, Paradise Island (Nassau, New Providence), Bahamas
1.0% 1,868,000 1,850,000
5 THERMAS DOS LARANJAIS, Olimpia, Brazil -9.2% 1,761,000 1,939,000
6 AQUATICA, Orlando, FL, U.S. 2.0% 1,600,000 1,569,000
7 OCEAN WORLD, Gangwon-Do, South Korea -5.9% 1,509,000 1,604,000
8 CARIBBEAN BAY, Gyeonggi-Do, South Korea -4.0% 1,434,000 1,493,000
9 AQUAVENTURE WATER PARK, Dubai, U.A.E. 0.0% 1,400,000 1,400,000
10 WET 'N WILD, Orlando, FL, U.S. 2.0% 1,310,000 1,284,000
TOP 20 WATER PARKS WORLDWIDE
16 © 2016 TEA / AECOM
RA
NK
PAR
KL
oc
ati
on
%
CH
AN
GE
AT
TE
ND
AN
CE
2
01
5
AT
TE
ND
AN
CE
2
01
4
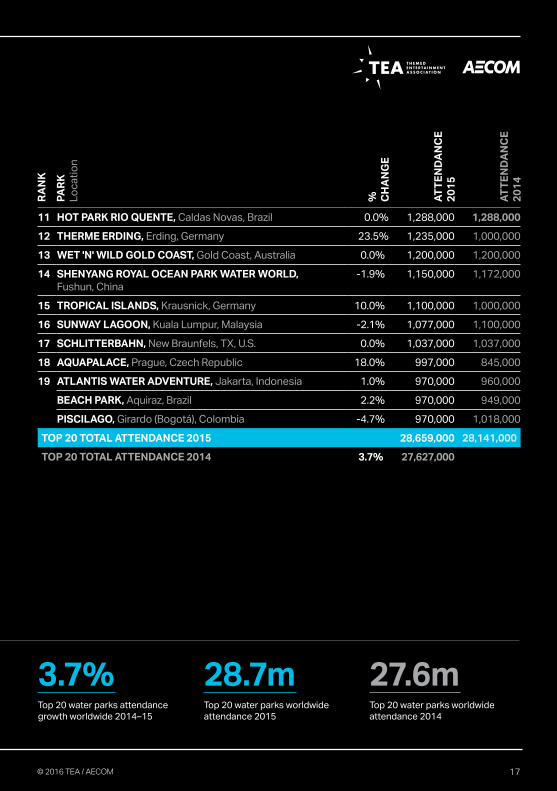
11 HOT PARK RIO QUENTE, Caldas Novas, Brazil 0.0% 1,288,000 1,288,000
12 THERME ERDING, Erding, Germany 23.5% 1,235,000 1,000,000
13 WET 'N' WILD GOLD COAST, Gold Coast, Australia 0.0% 1,200,000 1,200,000
14 SHENYANG ROYAL OCEAN PARK WATER WORLD, Fushun, China
-1.9% 1,150,000 1,172,000
15 TROPICAL ISLANDS, Krausnick, Germany 10.0% 1,100,000 1,000,000
16 SUNWAY LAGOON, Kuala Lumpur, Malaysia -2.1% 1,077,000 1,100,000
17 SCHLITTERBAHN, New Braunfels, TX, U.S. 0.0% 1,037,000 1,037,000
18 AQUAPALACE, Prague, Czech Republic 18.0% 997,000 845,000
19 ATLANTIS WATER ADVENTURE, Jakarta, Indonesia 1.0% 970,000 960,000
BEACH PARK, Aquiraz, Brazil 2.2% 970,000 949,000
PISCILAGO, Girardo (Bogotá), Colombia -4.7% 970,000 1,018,000
TOP 20 TOTAL ATTENDANCE 2015 28,659,000 28,141,000
TOP 20 TOTAL ATTENDANCE 2014 3.7% 27,627,000
28.7mTop 20 water parks worldwide attendance 2015
27.6mTop 20 water parks worldwide attendance 2014
3.7%Top 20 water parks attendance growth worldwide 2014–15
17© 2016 TEA / AECOM

TOP 20 MUSEUMS WORLDWIDE
1
3
7.5
m+
5m
–7
.5m
-
2.5
m–
5m
Up
to
2.5
m
171
LONDON, U.K.6 MUSEUMS
15
14
3
3
12 6PARIS, FRANCE
2 MUSEUMS
WASHINGTON, DC, U.S. 4 MUSEUMS
NEW YORK, NY, U.S. 2 MUSEUMS
2018
1311
9
5
-5% 0% +5% +10% +15%
2014–15-0.7%
2013–14 1.6%
2012–13 7.2%
Key Growth 2012–15
Circles represent size of attendance at ranked parks in the geography indicated. Slices within circles represent proportion of attendance in the geography from the ranked park indicated by number. Shading indicates attendance at the ranked park versus all other ranked parks.
18 © 2016 TEA / AECOM
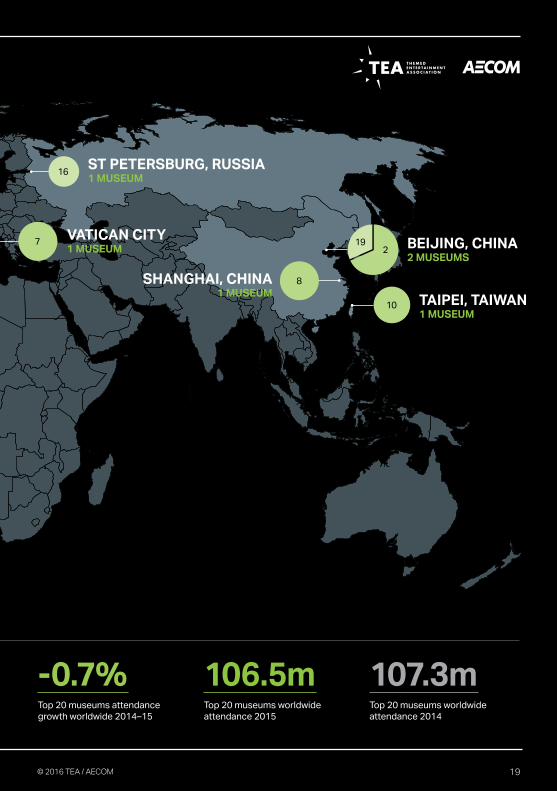
106.5mTop 20 museums worldwide attendance 2015
-0.7%Top 20 museums attendance growth worldwide 2014–15
107.3mTop 20 museums worldwide attendance 2014
16
8
VATICAN CITY1 MUSEUM BEIJING, CHINA
2 MUSEUMS
SHANGHAI, CHINA1 MUSEUM
TAIPEI, TAIWAN1 MUSEUM
ST PETERSBURG, RUSSIA1 MUSEUM
192
10
7
19© 2016 TEA / AECOM

RA
NK
MU
SE
UM
Lo
ca
tio
n
%
CH
AN
GE
AT
TE
ND
AN
CE
2
01
5
AT
TE
ND
AN
CE
2
01
4
FR
EE
/PA
ID
1 LOUVRE, Paris, France -6.5% 8,700,000 9,300,000 Paid
2 NATIONAL MUSEUM OF CHINA, Beijing, China -4.5% 7,290,000 7,630,000 Free
3 NATIONAL MUSEUM OF NATURAL HISTORY, Washington, DC, U.S.
-5.5% 6,900,000 7,300,000 Free
NATIONAL AIR AND SPACE MUSEUM , Washington, DC, U.S.
3.0% 6,900,000 6,700,000 Free
5 BRITISH MUSEUM, London, U.K. 1.9% 6,821,000 6,695,000 Free
6 THE METROPOLITAN MUSEUM OF ART, New York, NY, U.S.
1.6% 6,300,000 6,200,000 Paid
7 VATICAN MUSEUMS, Vatican, Vatican City -2.8% 6,002,000 6,177,000 Paid
8 SHANGHAI SCIENCE & TECHNOLOGY MUSEUM, Shanghai, China
40.9% 5,948,000 4,220,000 Paid
9 NATIONAL GALLERY, London, U.K. -7.9% 5,908,000 6,417,000 Free
10 NATIONAL PALACE MUSEUM (TAIWAN), Taipei, Taiwan -2.1% 5,288,000 5,402,000 Paid
TOP 20 MUSEUMS WORLDWIDE
20 © 2016 TEA / AECOM

RA
NK
MU
SE
UM
Lo
ca
tio
n
%
CH
AN
GE
AT
TE
ND
AN
CE
2
01
5
AT
TE
ND
AN
CE
2
01
4
FR
EE
/PA
ID
11 NATURAL HISTORY MUSEUM, London, U.K. -1.9% 5,284,000 5,388,000 Free
12 AMERICAN MUSEUM OF NATURAL HISTORY, New York, NY, U.S.
0.0% 5,000,000 5,000,000 Paid
13 TATE MODERN, London, U.K. -18.5% 4,713,000 5,785,000 Free
14 NATIONAL GALLERY OF ART, Washington, DC, U.S. 5.4% 4,104,000 3,892,000 Free
15 NATIONAL MUSEUM OF AMERICAN HISTORY, Washington, DC, U.S.
2.5% 4,100,000 4,000,000 Free
16 STATE HERMITAGE, St Petersburg, Russia 12.9% 3,668,000 3,248,000 Paid
17 MUSÉE D'ORSAY, Paris, France -1.2% 3,440,000 3,481,000 Paid
18 VICTORIA & ALBERT MUSEUM, London, U.K. 7.9% 3,432,000 3,180,000 Free
19 CHINA SCIENCE TECHNOLOGY MUSEUM, Beijing, China
4.4% 3,360,000 3,218,000 Paid
20 SCIENCE MUSEUM (SOUTH KENSINGTON), London, U.K.
0.0% 3,356,000 3,356,000 Free
TOP 20 TOTAL ATTENDANCE 2015 106,514,000 106,589,000
TOP 20 TOTAL ATTENDANCE 2014 -0.7% 107,300,000
106.5mTop 20 museums worldwide attendance 2015
107.3mTop 20 museums worldwide attendance 2014
-0.7%Top 20 museums attendance growth worldwide 2014–15
21© 2016 TEA / AECOM

THE AMERICAS
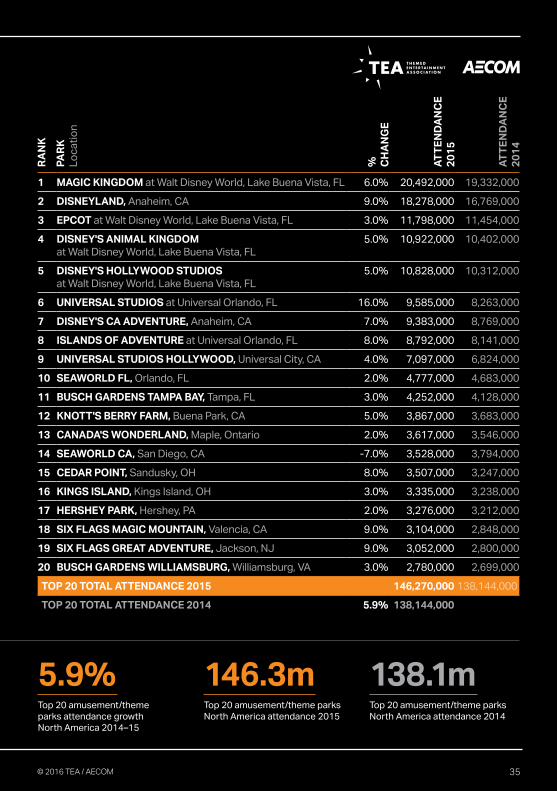
5.9%Top 20 amusement/theme parks attendance growth North America 2014–15
146.3mTop 20 amusement/theme parks North America attendance 2015
1.0%Top 10 amusement/theme parks attendance growth Latin America 2014–15
22

Brian SandsVice President,
Economics, The
Americas
© Bootleggers Run, Splish Splash Water Park, Calverton, NY, U.S.
Remarkable growth in theme parks and water parks
North American theme parks — up 5.9%
Last year we said everything was looking
good in the Americas and poised for
moderate growth — but 2015 blew the roof
of moderate. This market did really well.
In theme parks, not only did the two top
operators, Disney and Universal, both excel,
the North American market as a whole did
well, too. How well? Over the last couple
years, the aggregate increase of the 20 top
performing theme parks in North America
was between 2% and 3.5% — good, steady,
moderate growth. But it positively leapt
beyond that in 2015 to an impressive 5.9%
— almost three times the number for 2014.
Disney was up 6% in attendance and alone
accounted for nearly 40% of the growth
by the top six operators in the U.S. (Disney,
Universal, Sea World, Six Flags, Cedar Fair, and Merlin) — that’s massive. Universal was
up by a little over 9%, accounting for 18%
of the top operators’ attendance growth.
But some of the regional chains also turned
in impressive numbers. Six Flags was up a
remarkable 11% and accounted for 22% of
the top operators’ growth. Cedar Fair was
also up 4.9%, and Merlin was up 15%, albeit
from a relatively low base in North America.
23
24
From the perspective of a decade, the
10-year growth in this market is 22% — from about 120 M visits in pre-recession 2006, to more than 146 M in post-recession 2015, and including the low point of 2009.
North America’s 5.9% stands up well even
in the face of fast growing Asia, where the
top performing parks were up 6.9% in 2015.
IP and the immersion factor
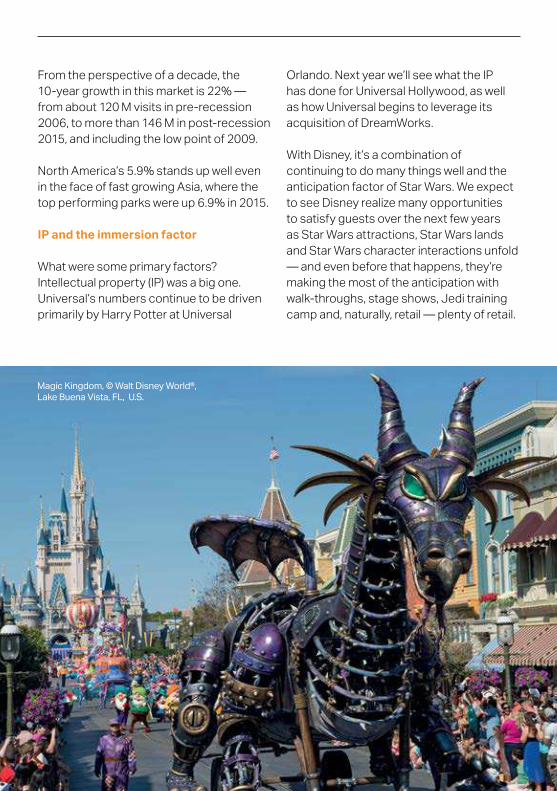
What were some primary factors? Intellectual property (IP) was a big one.
Universal’s numbers continue to be driven
primarily by Harry Potter at Universal
Orlando. Next year we’ll see what the IP
has done for Universal Hollywood, as well
as how Universal begins to leverage its
acquisition of DreamWorks.
With Disney, it’s a combination of continuing to do many things well and the
anticipation factor of Star Wars. We expect to see Disney realize many opportunities
to satisfy guests over the next few years
as Star Wars attractions, Star Wars lands and Star Wars character interactions unfold — and even before that happens, they’re
making the most of the anticipation with
walk-throughs, stage shows, Jedi training camp and, naturally, retail — plenty of retail.
Magic Kingdom, © Walt Disney World®, Lake Buena Vista, FL, U.S.

25
Themed and branded experiences
are becoming ever more immersive,
comprehensive, complete, and intimate
from the guest’s experience, starting online,
extending to their approach to the park, the
park itself obviously, and then again after
the park via online communications. All of
this translates to a better guest experience,
longer stays, more repeat visits and more
per cap spending.
Good rides and smart business
Good rides and good marketing continue
to prove their worth at all parks. The healthy
attendance increase posted by Six Flags
parks owes a lot to both; keeping regional
markets and local fan base happy with new,
high-tech rides such as Justice League, which features DC Comics characters;
with exciting new roller coasters and other
improvements, plus discounts to encourage
purchase of annual passes. Cedar Fair had
similar success via such new attractions as
Iron Reef at Knott’s Berry Farm.
Catering to destination tourism as well as
regional markets pays of. Orlando’s tourism numbers were strong — they didn’t fall of even though Latin America was hurting
economically and more Latin Americans
stayed home in 2015. In fact, visitation
to Orlando has reportedly more than
doubled over the past 20 years, growing
from 32.4 M in 1995 to 66.1 M in 2015, solidifying Orlando's position as the most
Flight of the Hippogrif™, © Universal Studios, Universal Orlando, FL, U.S.
Visitation to Orlando has reportedly more than doubled over the past 20 years, growing from 32.4 M in 1995 to 66.1 M in 2015.
26
visited destination in the nation, thanks
undoubtedly to the large and continued
investments made in its theme parks,
resorts, and related amenities.
Beyond attendance, the parks are simply
doing smarter business, leaving less money
on the table through variable pricing,
better retail oferings that make shopping and dining an extension of the branded
experience, and through embracing the
integrated resort model of operation —
reinforcing immersion. So even when
attendance is lat, per caps revenue can be strong.
At SeaWorld parks, 2015 attendance numbers were basically lat, up 0.3% total, driven by mixed performance across their
portfolio. Since taking the helm about a year
ago, CEO Joel Manby, who has a strong
track record from his years at the head of
Herschend Family Entertainment, has put
together a strong team and begun visibly
addressing the challenges. Integrated
resorts are on the drawing board for
SeaWorld’s future.
The resort model
The integrated resort reinforces the
immersion factor by encouraging guests
to remain in the operator’s territory,
within the experience bubble. Extend the
stay, keep the revenue, serve up a more
uniied experience to the guest — that’s a win-win-win that transforms a theme park or a water park into a multi-day destination, and has a ripple economic efect in the region.
Disney has long been a major resort
operator with tremendous revenue, an
unbeatable lifestyle brand and an expanding
portfolio of leisure oferings. Looking regionally and sub-regionally, some of the smaller operators have also practiced this
for a while to good efect. Examples include Herschend’s oferings in the Pigeon Forge,
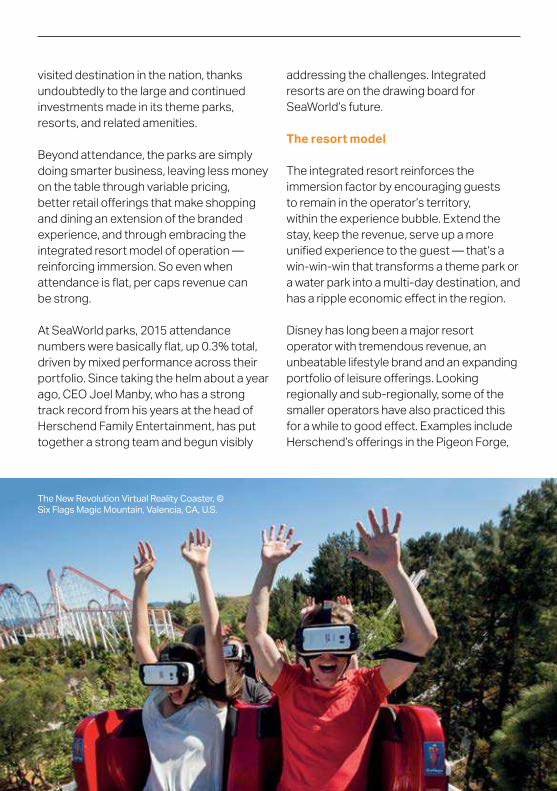
The New Revolution Virtual Reality Coaster, © Six Flags Magic Mountain, Valencia, CA, U.S.
27
TN area around Dollywood, as well as what
Merlin Entertainments has been doing to
leverage the popular LEGO IP, having added
both a LEGOLAND park and a hotel near
Orlando, a second hotel at LEGOLAND
Carlsbad and looking at additional hospitality
elements. Merlin is also considering new
lodging types for its Orlando park.
The challenge is keeping the balance of
elements — lodging, retail, dining and
entertainment. Oversize the lodging
product and the whole project sufers. On the other hand, create a compelling
multi-day experience, single or multi-gated, with well-designed retail, dining and entertainment, and lodging that allows
access to the park as well as separation
from those park guests not staying at the
lodging, and you can achieve the holy grail
of success. We’re seeing Universal move into that space in a big way: in Orlando
having opened Cabana Bay, and opening
Sapphire Falls this year and Volcano Bay next year — getting in on the water park
side. Tourists coming in for a week or more
are looking for a range of experiences.
Helping to diversify the ofering for tourists in Orlando and to grow its presence in
the market, Merlin opened The Orlando
Eye observation experience, a SEA LIFE
Aquarium, and a Madame Tussauds,
thereby anchoring the new I Drive 360
retail-dining-entertainment (RDE) center on International Drive.
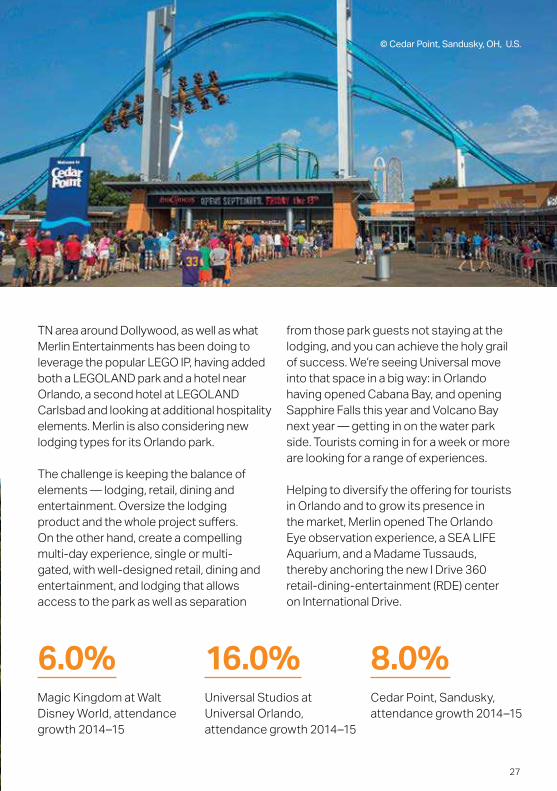
© Cedar Point, Sandusky, OH, U.S.
6.0%Magic Kingdom at Walt Disney World, attendance growth 2014–15
16.0%Universal Studios at
Universal Orlando,
attendance growth 2014–15
8.0%Cedar Point, Sandusky,
attendance growth 2014–15

28
North American water parks — up 4.3%
Overall, water park attendance numbers in
North America were also up signiicantly in 2015 for the Top 20 facilities —
at 4.3%, nearly tripling the growth rate in 2014 numbers — a remarkably strong
showing after the past two years’ lat to negative numbers.
Looking back at attendance over a 10-year period for this market shows growth from
slightly under 12 M to nearly 14 M, an increase of 17% for the decade. (Last year we began tabulating for the Top 20 but that’s
taken into account here.) Although that’s
not quite as much as the 22% growth over
the equivalent period in North America’s top
theme parks, it’s very good.
Driving 2015 growth for North American
water parks were several with particularly
healthy increases, including Typhoon
Lagoon and Blizzard Beach, both up 5%
© Camelbeach, Tannersville, PA, U.S.
(around 100,000 each), beneiting from overall growth of the Orlando market. Also
showing strong growth were Splish Splash,
up 22% and Camelbeach, up 31%. More
than 100k visits were tallied for Camelbeach
which beneited from the opening of the Camelback Lodge and Aquatopia Indoor
Water Park as the resort continues its development as a serious, year round
destination. Splish Splash beneited primarily from a very hot and dry summer
in that part of the world as well as some
minor renovations.
Our charts for 2015 show a new entrant:
Wet’n’Wild splash town near Houston, a park recently acquired and improved by
CNL Properties. The beneits of CNL’s multi-million-dollar reinvestment brought attendance numbers up to about a half
million in 2015, spelling new competition in
a region dominated by Schlitterbahn.
Latin America
Though growth was modest at the Latin
American theme parks in 2015, adding 1.0%
to reach 14.7 M, the top theme parks in Latin America grew 33% over the last 10 years,
which denotes strong growth, though from
a relatively modest base. In Latin America’s
theme park and water park scene, we see
encouraging growth and innovation in
several respects, as well as areas that show
room for future improvement. The region’s
economic and political volatility are apparent
in the varying performance of the parks.
For Latin America’s water parks, 2015 was
a disappointing year for the most part, with
some exceptions. At 9.5 M attendance for the top water parks, performance was
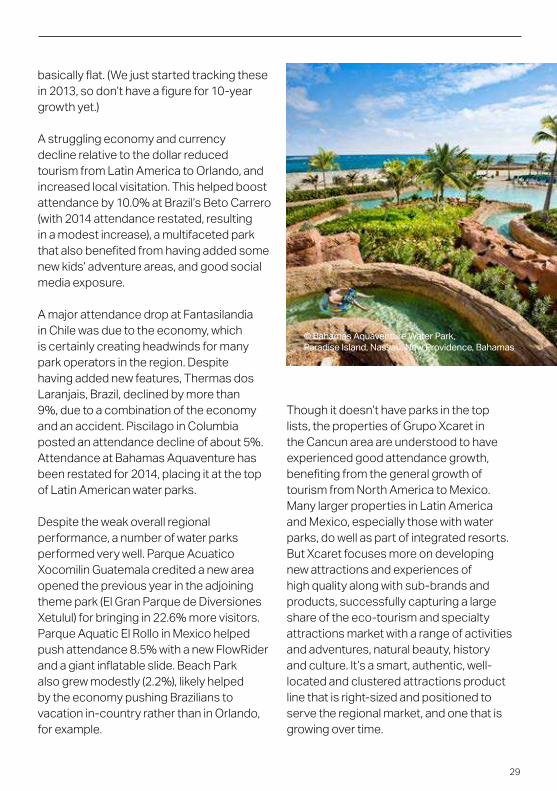
29
basically lat. (We just started tracking these in 2013, so don’t have a igure for 10-year growth yet.)
A struggling economy and currency
decline relative to the dollar reduced
tourism from Latin America to Orlando, and
increased local visitation. This helped boost
attendance by 10.0% at Brazil’s Beto Carrero
(with 2014 attendance restated, resulting
in a modest increase), a multifaceted park
that also beneited from having added some new kids’ adventure areas, and good social
media exposure.
A major attendance drop at Fantasilandia
in Chile was due to the economy, which
is certainly creating headwinds for many
park operators in the region. Despite
having added new features, Thermas dos
Laranjais, Brazil, declined by more than
9%, due to a combination of the economy
and an accident. Piscilago in Columbia
posted an attendance decline of about 5%.
Attendance at Bahamas Aquaventure has
been restated for 2014, placing it at the top
of Latin American water parks.
Despite the weak overall regional
performance, a number of water parks
performed very well. Parque Acuatico
Xocomilin Guatemala credited a new area
opened the previous year in the adjoining
theme park (El Gran Parque de Diversiones
Xetulul) for bringing in 22.6% more visitors.
Parque Aquatic El Rollo in Mexico helped
push attendance 8.5% with a new FlowRider
and a giant inlatable slide. Beach Park also grew modestly (2.2%), likely helped
by the economy pushing Brazilians to
vacation in-country rather than in Orlando, for example.
Though it doesn’t have parks in the top
lists, the properties of Grupo Xcaret in
the Cancun area are understood to have
experienced good attendance growth,
beneiting from the general growth of tourism from North America to Mexico.
Many larger properties in Latin America
and Mexico, especially those with water
parks, do well as part of integrated resorts.
But Xcaret focuses more on developing
new attractions and experiences of
high quality along with sub-brands and products, successfully capturing a large
share of the eco-tourism and specialty attractions market with a range of activities
and adventures, natural beauty, history
and culture. It’s a smart, authentic, well-located and clustered attractions product
line that is right-sized and positioned to serve the regional market, and one that is
growing over time.
© Bahamas Aquaventure Water Park, Paradise Island, Nassau, New Providence, Bahamas
30
PERFORMANCE OF TOP OPERATORS IN NORTH AMERICA
This year we are including this special section reviewing the
topline performance of the major operators in the North
American market. As shown in the graphs below, despite the
maturity of the market, it was generally a good year for the
operators and in some cases it was remarkable.
© Disneyland at Disneyland Resort®, Anaheim, CA, U.S.

31
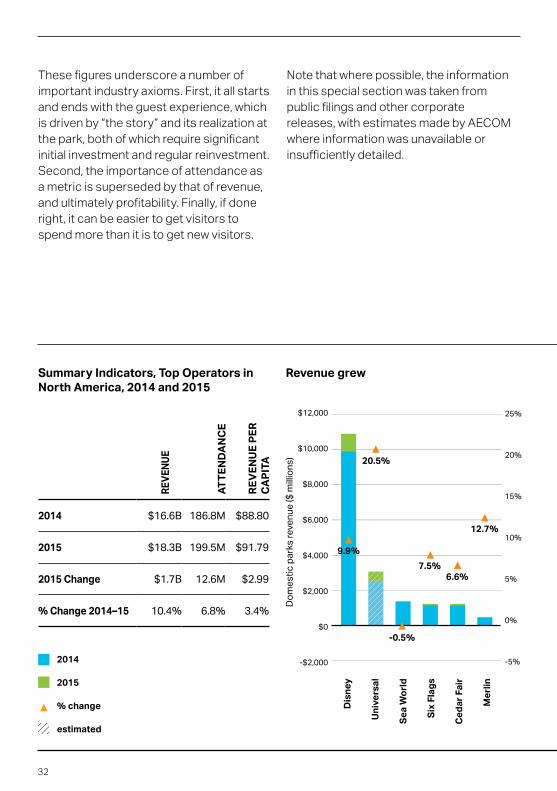
The power of per caps
In total, estimated revenue at the top
operators grew from $16.6 B in 2014 to $18.3 B in 2015, an increase of $1.7 B or 10.4%. Growth of attendance was not quite
as strong, but still very healthy, increasing
from 186.8 M in 2014 to 199.5 M in 2015, an increase of 12.6 M or 6.8%. Combining these igures results in an increase in average revenue per attendee (or per
capita) grew from $88.80 to $91.79, an
increase of $2.99 or 3.4%. While this may appear relatively modest, by comparison
U.S. gross domestic product (GDP) grew
by only 2.4% and the S&P 500 declined
marginally (-0.7%).
Performance at the operator level varied
considerably. Disney reports on a iscal year basis and with the Parks and Resorts
segment combined, with our estimate that
the Parks sub-segment (i.e., excluding Resorts) had revenue of nearly $10.9 B in 2015, an increase of $983 M or 9.9% over the estimate of almost $9.9 B in 2014. Disney remains far and away the largest
operator, and singlehandedly accounted
for 57% of the total revenue growth in 2015.
Attendance at Disney’s domestic parks
was estimated up a remarkable 6.0
percent last year, reaching 86.1 M visitors,
and accounting for 39% percent of the
total increase at the top operators. This
was driven by such factors as the 60th
anniversary of Disneyland, the continued
success of its major ilms with ties-in to its park, and associated investments.
Taken together, we estimate that revenue
at Disney’s parks grew to over $126 per
visitor, an increase of 3.7%.
Universal’s Theme Parks segment also
performed very well, with estimated net
revenue (excluding estimated revenues
associated with its hotels and Universal
Japan) reaching nearly $3.1 B, up by $522 M or 20.5%. Similarly, estimated attendance growth was strong at
9.3%, increasing attendance to 26.8 M, continuing to be primarily driven by its
ongoing Harry Potter-related investments. The combined efect was estimated growth in revenue per attendee to Universal parks
of 10.3%, pushing it over $114 per visitor.
Cedar Fair had revenue growth of 7.5%,
which when combined with its attendance
growth of 4.9%, meant that revenue per
attendee increased modestly by 1.6% to
reach well over $50 per visitor. Six Flags
and Merlin also both grew revenues,
but this was exceeded by attendance
growth, which pushed down revenue per
attendee for both. SeaWorld slightly grew attendance, but also experienced a modest
decline in revenue, which resulted in a small
decline in revenue per visitor.
32
These igures underscore a number of important industry axioms. First, it all starts
and ends with the guest experience, which
is driven by “the story” and its realization at
the park, both of which require signiicant initial investment and regular reinvestment.
Second, the importance of attendance as
a metric is superseded by that of revenue,
and ultimately proitability. Finally, if done right, it can be easier to get visitors to
spend more than it is to get new visitors.
Note that where possible, the information
in this special section was taken from
public ilings and other corporate releases, with estimates made by AECOM
where information was unavailable or
insuiciently detailed.
$12,000
$10,000
$8,000
$6,000
$4,000
$2,000
$0
-$2,000
25%
20%
15%
10%
5%
0%
-5%
Revenue grew
9.9%
20.5%
-0.5%
7.5%6.6%
12.7%
Do
me
sti
c p
ark
s r
ev
en
ue
($ m
illio
ns
)
Dis
ne
y
Un
ive
rsal
Se
a W
orl
d
Six
Fla
gs
Ce
dar
Fai
r
Me
rlin
2014
2015
% change
estimated
Summary Indicators, Top Operators in North America, 2014 and 2015
REV
ENU
E
AT
TE
ND
AN
CE
RE
VE
NU
E P
ER
C
AP
ITA
2014 $16.6B 186.8M $88.80
2015 $18.3B 199.5M $91.79
2015 Change $1.7B 12.6M $2.99
% Change 2014–15 10.4% 6.8% 3.4%

33
Do
me
sti
c p
ark
s a
tte
nd
an
ce
(mill
ion
s)
100
90
80
70
60
50
40
30
20
10
0
16%
14%
12%
10%
8%
6%
4%
2%
0%
Attendance grew
15.0%
11.0%
4.9%
6.0%
9.3%
0.3%
Dis
ne
y
Un
ive
rsal
Se
a W
orl
d
Six
Fla
gs
Ce
dar
Fai
r
Me
rlin
Revenue per attendee was mixed
$140
$120
$100
$80
$60
$40
$20
$0
-$20
12%
10%
8%
6%
4%
2%
0%
-2%
-4%
10.3%
3.7%
-0.8%
-3.2%
-2.0%
1.6%
Do
me
sti
c p
ark
s r
ev
en
ue
pe
r a
tte
nd
ee
Dis
ne
y
Un
ive
rsal
Se
a W
orl
d
Six
Fla
gs
Ce
dar
Fai
r
Me
rlin
© Cedar Point, Sandusky, OH, U.S.

TOP 20 AMUSEMENT/THEME PARKS NORTH AMERICA
15
m+
10
m –
15
m
5 –
10
m
Up
to
5m
FLORIDA, U.S.8 PARKS
81.4m
CALIFORNIA, U.S.6 PARKS45.3m
OHIO, U.S.2 PARKS
6.8m 17
19
20
13
ONTARIO, CANADA 1 PARK
3.6mNEW JERSEY, U.S.1 PARK3.1m
PENNSYLVANIA, U.S.1 PARK3.3m
VIRGINIA, U.S.1 PARK 2.8m
11108
6
5 43
1 1814
12
9
7
2
16 15
-10% 0% +10% +20% +30%
2010–112011–122012–132013–142014–152006–15 22.1%
5.9%2.2%2.7%
3.6%2.9%
Key Growth 2006–15
Circles represent size of attendance at ranked parks in the geography indicated. Slices within circles represent proportion of attendance in the geography from the ranked park indicated by number. Shading indicates attendance at the ranked park versus all other ranked parks.
34 © 2016 TEA / AECOM
RA
NK
PAR
KL
oc
ati
on
%
CH
AN
GE
AT
TE
ND
AN
CE
2
01
5
AT
TE
ND
AN
CE
2
01
4
1 MAGIC KINGDOM at Walt Disney World, Lake Buena Vista, FL 6.0% 20,492,000 19,332,000
2 DISNEYLAND, Anaheim, CA 9.0% 18,278,000 16,769,000
3 EPCOT at Walt Disney World, Lake Buena Vista, FL 3.0% 11,798,000 11,454,000
4 DISNEY'S ANIMAL KINGDOM at Walt Disney World, Lake Buena Vista, FL
5.0% 10,922,000 10,402,000
5 DISNEY'S HOLLYWOOD STUDIOS at Walt Disney World, Lake Buena Vista, FL
5.0% 10,828,000 10,312,000
6 UNIVERSAL STUDIOS at Universal Orlando, FL 16.0% 9,585,000 8,263,000
7 DISNEY'S CA ADVENTURE, Anaheim, CA 7.0% 9,383,000 8,769,000
8 ISLANDS OF ADVENTURE at Universal Orlando, FL 8.0% 8,792,000 8,141,000
9 UNIVERSAL STUDIOS HOLLYWOOD, Universal City, CA 4.0% 7,097,000 6,824,000
10 SEAWORLD FL, Orlando, FL 2.0% 4,777,000 4,683,000
11 BUSCH GARDENS TAMPA BAY, Tampa, FL 3.0% 4,252,000 4,128,000
12 KNOTT'S BERRY FARM, Buena Park, CA 5.0% 3,867,000 3,683,000
13 CANADA'S WONDERLAND, Maple, Ontario 2.0% 3,617,000 3,546,000
14 SEAWORLD CA, San Diego, CA -7.0% 3,528,000 3,794,000
15 CEDAR POINT, Sandusky, OH 8.0% 3,507,000 3,247,000
16 KINGS ISLAND, Kings Island, OH 3.0% 3,335,000 3,238,000
17 HERSHEY PARK, Hershey, PA 2.0% 3,276,000 3,212,000
18 SIX FLAGS MAGIC MOUNTAIN, Valencia, CA 9.0% 3,104,000 2,848,000
19 SIX FLAGS GREAT ADVENTURE, Jackson, NJ 9.0% 3,052,000 2,800,000
20 BUSCH GARDENS WILLIAMSBURG, Williamsburg, VA 3.0% 2,780,000 2,699,000
TOP 20 TOTAL ATTENDANCE 2015 146,270,000 138,144,000
TOP 20 TOTAL ATTENDANCE 2014 5.9% 138,144,000
146.3mTop 20 amusement/theme parks North America attendance 2015
138.1mTop 20 amusement/theme parks North America attendance 2014
5.9%Top 20 amusement/theme parks attendance growth North America 2014–15
35© 2016 TEA / AECOM

TOP 20 WATER PARKS NORTH AMERICA
2m
+
1m
–2
m
Up
to
1m
74
3 2
1
13
98
5
10
11
141819
17 12
6
1615
20 SOUTHEAST U.S. 4 PARKS2.1m
MIDWEST U.S.1 PARK
0.4mNORTHEAST U.S. 3 PARKS1.4m
FLORIDA, U.S. 5 PARKS8.0m
TEXAS, U.S.4 PARKS
2.6m
WEST U.S. 3 PARKS
1.4m
4.3%2014–152013–14 1.6%
2012–132.3%2011–12 2.2%2010–11 0.1%
Key Growth 2010–15
-5% 0% +5% +10% +15%
2010–15 6.0%
Circles represent size of attendance at ranked parks in the geography indicated. Slices within circles represent proportion of attendance in the geography from the ranked park indicated by number. Shading indicates attendance at the ranked park versus all other ranked parks.
36 © 2016 TEA / AECOM
RA
NK
PAR
KL
oc
ati
on
%
CH
AN
GE
AT
TE
ND
AN
CE
2
01
5
AT
TE
ND
AN
CE
2
01
4
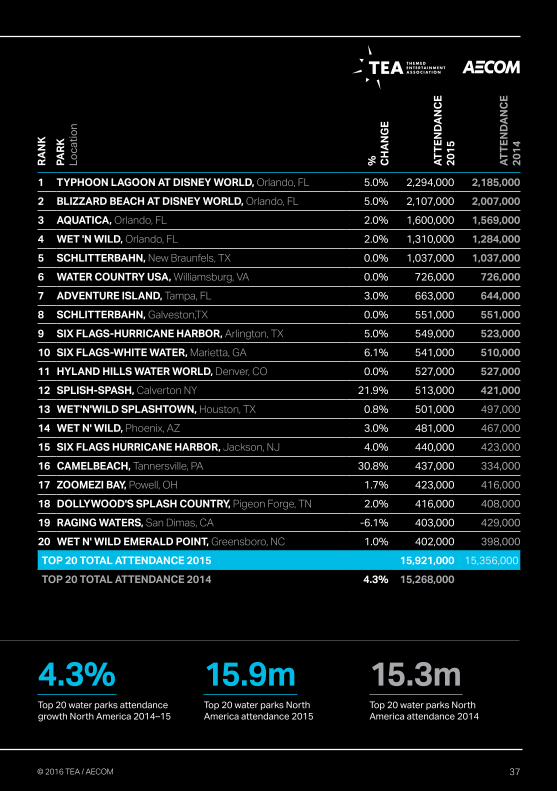
1 TYPHOON LAGOON AT DISNEY WORLD, Orlando, FL 5.0% 2,294,000 2,185,000
2 BLIZZARD BEACH AT DISNEY WORLD, Orlando, FL 5.0% 2,107,000 2,007,000
3 AQUATICA, Orlando, FL 2.0% 1,600,000 1,569,000
4 WET 'N WILD, Orlando, FL 2.0% 1,310,000 1,284,000
5 SCHLITTERBAHN, New Braunfels, TX 0.0% 1,037,000 1,037,000
6 WATER COUNTRY USA, Williamsburg, VA 0.0% 726,000 726,000
7 ADVENTURE ISLAND, Tampa, FL 3.0% 663,000 644,000
8 SCHLITTERBAHN, Galveston,TX 0.0% 551,000 551,000
9 SIX FLAGS-HURRICANE HARBOR, Arlington, TX 5.0% 549,000 523,000
10 SIX FLAGS-WHITE WATER, Marietta, GA 6.1% 541,000 510,000
11 HYLAND HILLS WATER WORLD, Denver, CO 0.0% 527,000 527,000
12 SPLISH-SPASH, Calverton NY 21.9% 513,000 421,000
13 WET'N'WILD SPLASHTOWN, Houston, TX 0.8% 501,000 497,000
14 WET N' WILD, Phoenix, AZ 3.0% 481,000 467,000
15 SIX FLAGS HURRICANE HARBOR, Jackson, NJ 4.0% 440,000 423,000
16 CAMELBEACH, Tannersville, PA 30.8% 437,000 334,000
17 ZOOMEZI BAY, Powell, OH 1.7% 423,000 416,000
18 DOLLYWOOD'S SPLASH COUNTRY, Pigeon Forge, TN 2.0% 416,000 408,000
19 RAGING WATERS, San Dimas, CA -6.1% 403,000 429,000
20 WET N' WILD EMERALD POINT, Greensboro, NC 1.0% 402,000 398,000
TOP 20 TOTAL ATTENDANCE 2015 15,921,000 15,356,000
TOP 20 TOTAL ATTENDANCE 2014 4.3% 15,268,000
15.9mTop 20 water parks North America attendance 2015
15.3mTop 20 water parks North America attendance 2014
4.3%Top 20 water parks attendance growth North America 2014–15
37© 2016 TEA / AECOM
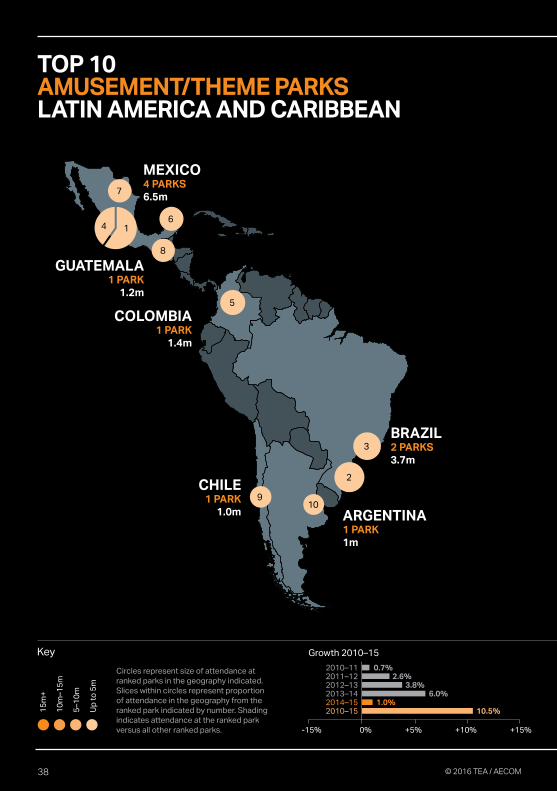
TOP 10 AMUSEMENT/THEME PARKS LATIN AMERICA AND CARIBBEAN
15
m+
10
m –
15
m
5 –
10
m
Up
to
5m
9
5
8
10
Key
2
3
6
7
4 1
MEXICO 4 PARKS6.5m
BRAZIL 2 PARKS3.7m
ARGENTINA 1 PARK1m
GUATEMALA1 PARK
1.2m
COLOMBIA1 PARK
1.4m
CHILE1 PARK
1.0m
-15% 0% +5% +10% +15%
Growth 2010–15
2010–112011–122012–132013–142014–152010–15 10.5%
1.0%6.0%
3.8%2.6%
0.7%Circles represent size of attendance at ranked parks in the geography indicated. Slices within circles represent proportion of attendance in the geography from the ranked park indicated by number. Shading indicates attendance at the ranked park versus all other ranked parks.
38 © 2016 TEA / AECOM
RA
NK
PAR
KL
oc
ati
on
%
CH
AN
GE
AT
TE
ND
AN
CE
2
01
5
AT
TE
ND
AN
CE
2
01
4
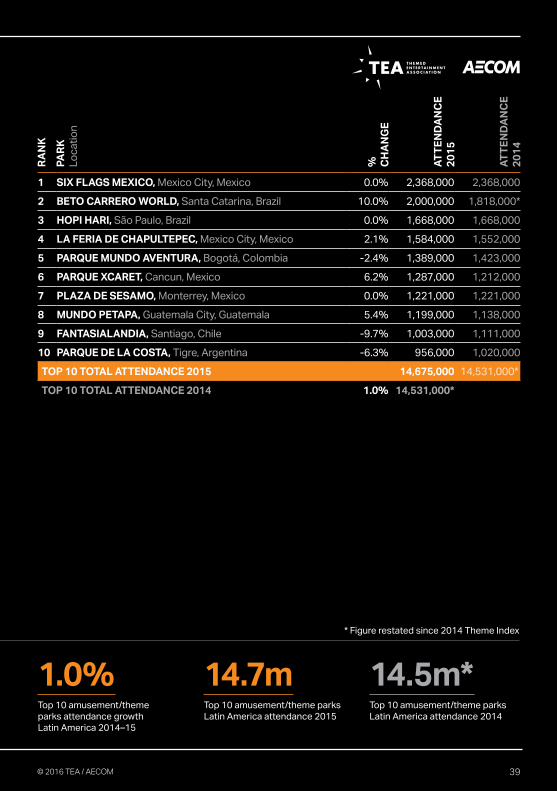
1 SIX FLAGS MEXICO, Mexico City, Mexico 0.0% 2,368,000 2,368,000
2 BETO CARRERO WORLD, Santa Catarina, Brazil 10.0% 2,000,000 1,818,000*
3 HOPI HARI, São Paulo, Brazil 0.0% 1,668,000 1,668,000
4 LA FERIA DE CHAPULTEPEC, Mexico City, Mexico 2.1% 1,584,000 1,552,000
5 PARQUE MUNDO AVENTURA, Bogotá, Colombia -2.4% 1,389,000 1,423,000
6 PARQUE XCARET, Cancun, Mexico 6.2% 1,287,000 1,212,000
7 PLAZA DE SESAMO, Monterrey, Mexico 0.0% 1,221,000 1,221,000
8 MUNDO PETAPA, Guatemala City, Guatemala 5.4% 1,199,000 1,138,000
9 FANTASIALANDIA, Santiago, Chile -9.7% 1,003,000 1,111,000
10 PARQUE DE LA COSTA, Tigre, Argentina -6.3% 956,000 1,020,000
TOP 10 TOTAL ATTENDANCE 2015 14,675,000 14,531,000*
TOP 10 TOTAL ATTENDANCE 2014 1.0% 14,531,000*
14.7mTop 10 amusement/theme parks Latin America attendance 2015
14.5m*Top 10 amusement/theme parks Latin America attendance 2014
1.0%Top 10 amusement/theme parks attendance growth Latin America 2014–15
* Figure restated since 2014 Theme Index
39© 2016 TEA / AECOM
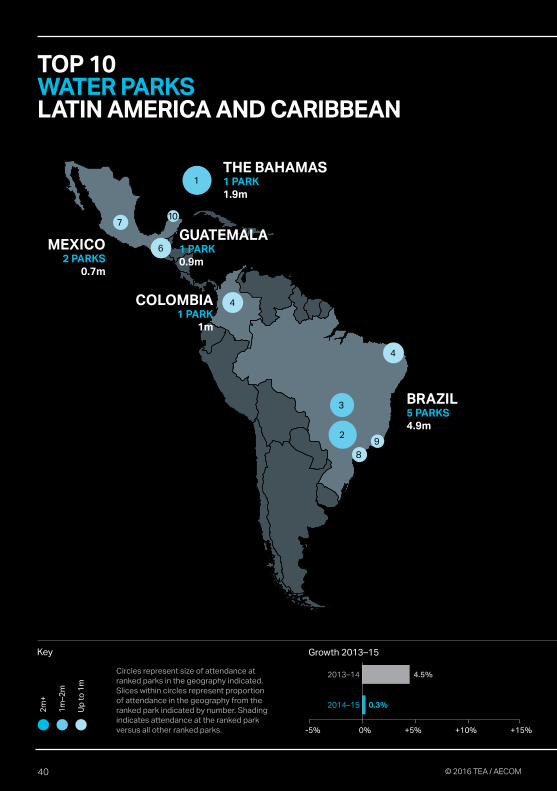
TOP 10 WATER PARKS LATIN AMERICA AND CARIBBEAN
2m
+
1m
–2
m
Up
to
1m
4
1
6
10
2
4
3
8
9
BRAZIL5 PARKS4.9m
THE BAHAMAS1 PARK1.9m
MEXICO2 PARKS
0.7m
7
COLOMBIA 1 PARK
1m
GUATEMALA 1 PARK0.9m
Key
2014–15
2013–14
0.3%
4.5%
Growth 2013–15
-5% 0% +5% +10% +15%
Circles represent size of attendance at ranked parks in the geography indicated. Slices within circles represent proportion of attendance in the geography from the ranked park indicated by number. Shading indicates attendance at the ranked park versus all other ranked parks.
40 © 2016 TEA / AECOM
RA
NK
PAR
KL
oc
ati
on
%
CH
AN
GE
AT
TE
ND
AN
CE
2
01
5
AT
TE
ND
AN
CE
2
01
4
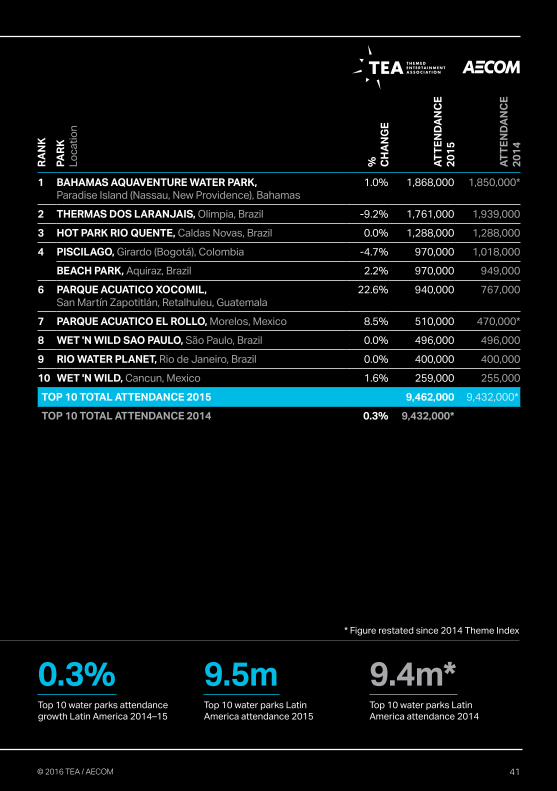
1 BAHAMAS AQUAVENTURE WATER PARK, Paradise Island (Nassau, New Providence), Bahamas
1.0% 1,868,000 1,850,000*
2 THERMAS DOS LARANJAIS, Olimpia, Brazil -9.2% 1,761,000 1,939,000
3 HOT PARK RIO QUENTE, Caldas Novas, Brazil 0.0% 1,288,000 1,288,000
4 PISCILAGO, Girardo (Bogotá), Colombia -4.7% 970,000 1,018,000
BEACH PARK, Aquiraz, Brazil 2.2% 970,000 949,000
6 PARQUE ACUATICO XOCOMIL, San Martín Zapotitlán, Retalhuleu, Guatemala
22.6% 940,000 767,000
7 PARQUE ACUATICO EL ROLLO, Morelos, Mexico 8.5% 510,000 470,000*
8 WET 'N WILD SAO PAULO, São Paulo, Brazil 0.0% 496,000 496,000
9 RIO WATER PLANET, Rio de Janeiro, Brazil 0.0% 400,000 400,000
10 WET 'N WILD, Cancun, Mexico 1.6% 259,000 255,000
TOP 10 TOTAL ATTENDANCE 2015 9,462,000 9,432,000*
TOP 10 TOTAL ATTENDANCE 2014 0.3% 9,432,000*
9.5mTop 10 water parks Latin America attendance 2015
9.4m*Top 10 water parks Latin America attendance 2014
0.3%Top 10 water parks attendance growth Latin America 2014–15
* Figure restated since 2014 Theme Index
41© 2016 TEA / AECOM
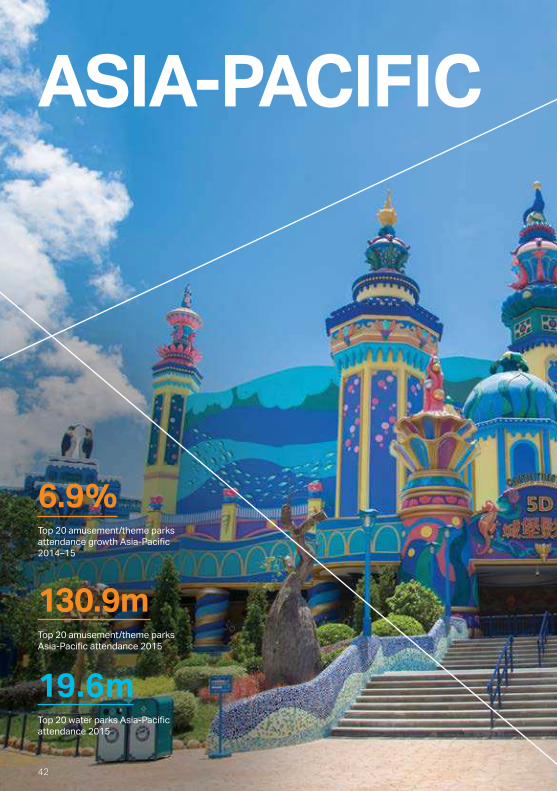
ASIA-PACIFIC
6.9%Top 20 amusement/theme parks attendance growth Asia-Paciic 2014–15
130.9mTop 20 amusement/theme parks Asia-Paciic attendance 2015
19.6mTop 20 water parks Asia-Paciic attendance 2015
42
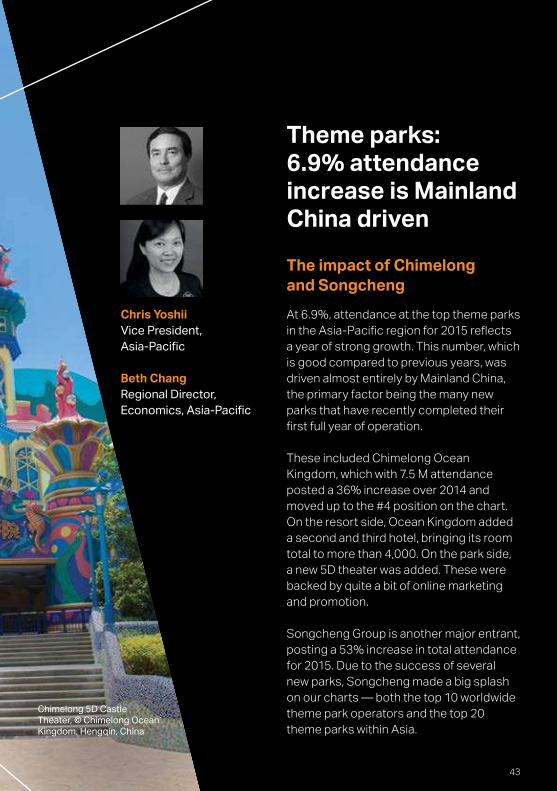
Chris Yoshii Vice President,
Asia-Paciic
Beth Chang Regional Director,
Economics, Asia-Paciic
Chimelong 5D Castle Theater, © Chimelong Ocean Kingdom, Hengqin, China
Theme parks: 6.9% attendance increase is Mainland China drivenThe impact of Chimelong and Songcheng
At 6.9%, attendance at the top theme parks
in the Asia-Paciic region for 2015 relects a year of strong growth. This number, which
is good compared to previous years, was
driven almost entirely by Mainland China,
the primary factor being the many new
parks that have recently completed their
irst full year of operation.
These included Chimelong Ocean
Kingdom, which with 7.5 M attendance
posted a 36% increase over 2014 and
moved up to the #4 position on the chart.
On the resort side, Ocean Kingdom added
a second and third hotel, bringing its room
total to more than 4,000. On the park side,
a new 5D theater was added. These were
backed by quite a bit of online marketing and promotion.
Songcheng Group is another major entrant,
posting a 53% increase in total attendance
for 2015. Due to the success of several
new parks, Songcheng made a big splash
on our charts — both the top 10 worldwide
theme park operators and the top 20
theme parks within Asia.
43
44
The Songcheng parks’ main feature is live,
theatrical shows with a cultural theme.
These shows are quite popular with
tourists and the parks are well located —
in Hangzhou, Lijiang and Sanya — to make the most of tour group business, especially
within the mainland. The combination
of high-traic locations, live shows and culture and a relatively small footprint is a
winner for Songcheng.
There’s been a fair amount of press about
softness in China’s economy, but that
relects a shift from manufacturing to service. If you look at services, tourism
and education, these things are booming.
Entertainment spending is going up very
fast; spending on education is increasing.
This all spells good news for our tourism
and leisure-based industry. Developers are supporting that service industry; projects
are getting approved and inanced, and the amount of themed entertainment product
keeps growing.
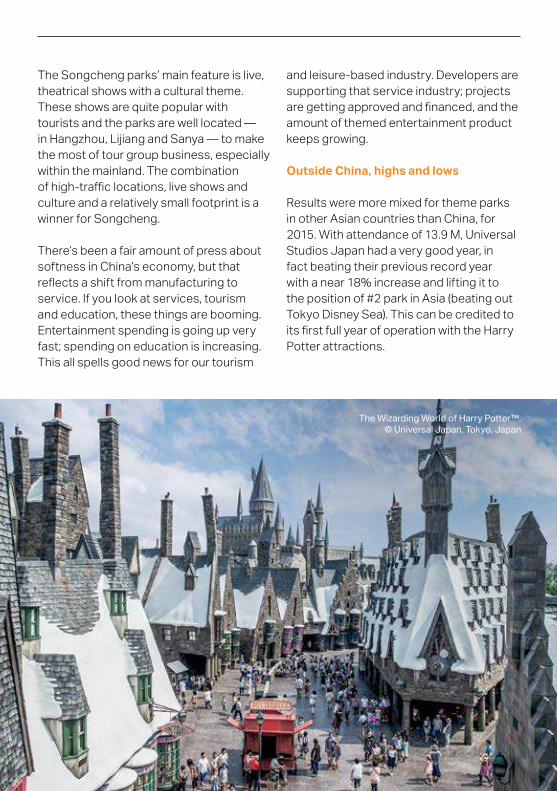
Outside China, highs and lows
Results were more mixed for theme parks
in other Asian countries than China, for
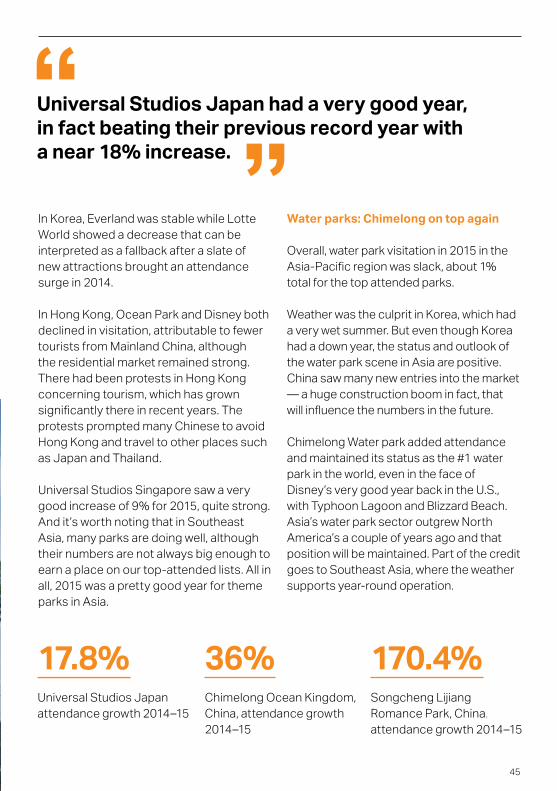
2015. With attendance of 13.9 M, Universal Studios Japan had a very good year, in
fact beating their previous record year
with a near 18% increase and lifting it to
the position of #2 park in Asia (beating out
Tokyo Disney Sea). This can be credited to
its irst full year of operation with the Harry Potter attractions.
The Wizarding World of Harry Potter™, © Universal Japan, Tokyo, Japan
45
In Korea, Everland was stable while Lotte
World showed a decrease that can be interpreted as a fallback after a slate of
new attractions brought an attendance
surge in 2014.
In Hong Kong, Ocean Park and Disney both
declined in visitation, attributable to fewer
tourists from Mainland China, although
the residential market remained strong.
There had been protests in Hong Kong
concerning tourism, which has grown
signiicantly there in recent years. The protests prompted many Chinese to avoid
Hong Kong and travel to other places such
as Japan and Thailand.
Universal Studios Singapore saw a very
good increase of 9% for 2015, quite strong.
And it’s worth noting that in Southeast
Asia, many parks are doing well, although
their numbers are not always big enough to
earn a place on our top-attended lists. All in all, 2015 was a pretty good year for theme
parks in Asia.
Water parks: Chimelong on top again
Overall, water park visitation in 2015 in the
Asia-Paciic region was slack, about 1% total for the top attended parks.
Weather was the culprit in Korea, which had a very wet summer. But even though Korea
had a down year, the status and outlook of
the water park scene in Asia are positive.
China saw many new entries into the market
— a huge construction boom in fact, that
will inluence the numbers in the future.
Chimelong Water park added attendance and maintained its status as the #1 water
park in the world, even in the face of
Disney’s very good year back in the U.S.,
with Typhoon Lagoon and Blizzard Beach.
Asia’s water park sector outgrew North
America’s a couple of years ago and that
position will be maintained. Part of the credit
goes to Southeast Asia, where the weather
supports year-round operation.
17.8%Universal Studios Japan
attendance growth 2014–15
36%Chimelong Ocean Kingdom,
China, attendance growth
2014–15
170.4%Songcheng Lijiang
Romance Park, China,
attendance growth 2014–15
Universal Studios Japan had a very good year, in fact beating their previous record year with a near 18% increase.

46
Water parks are harder to track than theme parks in Asia. They are being built at a faster
pace — there might be as many as ive water parks being built for every new theme
park. Water parks also tend to be smaller and locally based.
A volatile, growing market
Volatility will continue to be a hallmark of the Asia-Paciic market, as it is still growing rapidly and may not stabilize for perhaps
another decade. The sector is still a long
way from saturation and maturity. This will
shake up our charts each year with parks
and operators climbing up and dropping of. As attendance increases at the top parks,
it also raises the minimum attendance a
park needs to achieve in order to stay on
the charts.
Next year’s charts will relect the irst half-year of attendance at Shanghai Disney, opening this season. Once it has
been open a full year, we will have a better
sense of when the Asian parks market
will overtake North America altogether —
whether it will be around 2020 as we’ve
Volatility will continue to be a hallmark of the Asia-Paciic market, as it is still growing rapidly and may not stabilize for perhaps another decade.
OCT Happy Valley, Shenzhen, China

47
previously estimated, or sooner. As things
continue to evolve and mature in Asia, we’ll
see shifting ownership and consolidation
of smaller parks into larger chains as part of
the process.
Global context
Disney Shanghai will be a watershed event.
It is expected to do very well and have a
positive efect on the region. The Asian market really likes the Disney product.
Behind that, Universal Beijing is under
construction, and other international
brand IPs are looking around very actively
in China. Operators, local governments
and the IP companies all show deinite interest in building branded attractions in
a meaningful way, in the largest consumer
market in the world.
That said, the Chinese government is
cautious about having too much Western content, and it will be interesting to see
how Eastern projects blend local media,
local culture and heritage with Western concepts and Western brands — and how much of that might translate back to
attractions in the West. There’s certainly room for something of everything in the
market, including traditional culture-based attractions and Chinese media-based experiences as well as foreign.
We can see it already happening in the movie industry. Cinema box oice revenue in China will pass North American at some
point fairly soon, and studios have already
been moving to a more international
product, or at least a product with
Asian elements.
In Southeast Asia, a growing number of
large, diversiied media companies that are active in TV, broadcasting, gaming and mobile technology are exploring
how to move into theme parks and family
entertainment centers.
And even though they don’t show up in
this report, developers in Asia have a lot of
interest in indoor entertainment — smaller
size facilities of 30,000–50,000 square
feet, usually within retail centers. Oriented
to children, teens and families visiting
for 2–3 hours at a stretch, these facilities
represent opportunities for themed
entertainment professionals. Shopping
malls look to them for diferentiation as Asia is moving very quickly to a saturated
retail environment. Sometimes there’s a
cluster of attractions similar to the Merlin
Entertainments business model.
Disney Shanghai will be a watershed event. It is expected to do very well and have a positive efect on the region.
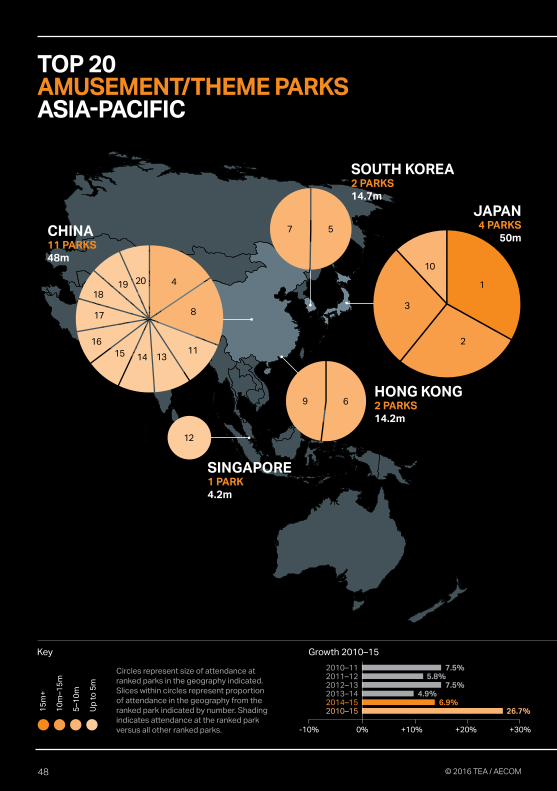
TOP 20 AMUSEMENT/THEME PARKS ASIA-PACIFIC
JAPAN4 PARKS
50m
HONG KONG2 PARKS14.2m
10
3
2
1
12
SOUTH KOREA2 PARKS14.7m
SINGAPORE1 PARK4.2m
CHINA11 PARKS48m
15
m+
10
m –
15
m
5 –
10
m
Up
to
5m
201918
17
16
15 14 1311
8
4
9 6
7 5
-10% 0% +10% +20% +30%
2010–112011–122012–132013–142014–152010–15
2.8
7.5%5.8%
7.5%4.9%
26.7%
Key Growth 2010–15
6.9%
Circles represent size of attendance at ranked parks in the geography indicated. Slices within circles represent proportion of attendance in the geography from the ranked park indicated by number. Shading indicates attendance at the ranked park versus all other ranked parks.
48 © 2016 TEA / AECOM

RA
NK
PAR
KL
oc
ati
on
%
CH
AN
GE
AT
TE
ND
AN
CE
2
01
5
AT
TE
ND
AN
CE
2
01
4
1 TOKYO DISNEYLAND, Tokyo, Japan -4.0% 16,600,000 17,300,000
2 UNIVERSAL STUDIOS JAPAN, Osaka, Japan 17.8% 13,900,000 11,800,000
3 TOKYO DISNEY SEA, Tokyo, Japan -3.5% 13,600,000 14,100,000
4 CHIMELONG OCEAN KINGDOM, Hengqin, China 36.0% 7,486,000 5,504,000
5 EVERLAND, Gyeonggi-Do, South Korea 0.6% 7,423,000 7,381,000
6 OCEAN PARK, Hong Kong SAR -5.2% 7,387,000 7,792,000
7 LOTTE WORLD, Seoul, South Korea -3.9% 7,310,000 7,606,000
8 HANGZHOU SONGCHENG PARK, Hangzhou, China 25.5% 7,289,000 5,810,000
9 HONG KONG DISNEYLAND, Hong Kong SAR -9.3% 6,800,000 7,500,000
10 NAGASHIMA SPA LAND, Kuwana, Japan 4.3% 5,870,000 5,630,000
11 SONGCHENG LIJIANG ROMANCE PARK, Lijiang, China 170.4% 4,678,000 1,730,000
12 UNIVERSAL STUDIOS SINGAPORE, Singapore 9.4% 4,200,000 3,840,000
13 CHANGZHOU DINOSAUR PARK, Changzhou, China 6.8% 3,950,000 3,700,000
14 OCT EAST, Shenzhen, China 4.2% 3,940,000 3,780,000
15 OCT HAPPY VALLEY, Beijing, China 12.0% 3,740,000 3,340,000
16 CHIMELONG PARADISE, Guangzhou, China 8.0% 3,619,000 3,351,000
17 OCT WINDOW OF THE WORLD, Shenzhen, China -4.4% 3,440,000 3,600,000
18 SONGCHENG SANYA ROMANCE PARK, Sanya, China 72.1% 3,322,000 1,930,000
19 OCT HAPPY VALLEY, Shenzhen, China -1.5% 3,250,000 3,300,000
20 JIUZHAI SONGCHENG RESORT, Jiuzhaigou, China 67.0% 3,140,000 1,880,000
TOP 20 TOTAL ATTENDANCE 2015 130,944,000 120,874,000
TOP 20 TOTAL ATTENDANCE 2014 6.9% 122,527,000
130.9mTop 20 amusement/theme parks Asia-Paciic attendance 2015
122.5mTop 20 amusement/theme parks Asia-Paciic attendance 2014
6.9%Top 20 amusement/theme parks attendance growth Asia-Paciic 2014–15
49© 2016 TEA / AECOM

TOP 20 WATER PARKS ASIA-PACIFIC
JAPAN1 PARK0.9m
SOUTH KOREA4 PARKS4.6m
SINGAPORE1 PARK
0.7m
CHINA6 PARKS
6.3m
MALAYSIA3 PARKS2.6m
20
INDONESIA2 PARKS
1.8m
13
AUSTRALIA2 PARKS1.9m
INDIA1 PARK
0.8m
8
2m
+
1m
–2
m
Up
to
1m
12
93
2
16
106
11 7
19 4
1817
15
14 5
1
Key
Circles represent size of attendance at ranked parks in the geography indicated. Slices within circles represent proportion of attendance in the geography from the ranked park indicated by number. Shading indicates attendance at the ranked park versus all other ranked parks.
50 © 2016 TEA / AECOM
RA
NK
PAR
KL
oc
ati
on
%
CH
AN
GE
AT
TE
ND
AN
CE
2
01
5
AT
TE
ND
AN
CE
2
01
4
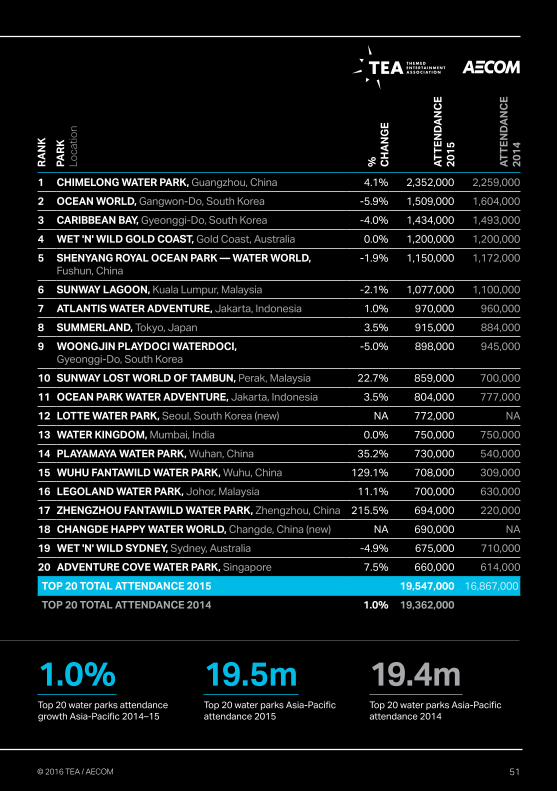
1 CHIMELONG WATER PARK, Guangzhou, China 4.1% 2,352,000 2,259,000
2 OCEAN WORLD, Gangwon-Do, South Korea -5.9% 1,509,000 1,604,000
3 CARIBBEAN BAY, Gyeonggi-Do, South Korea -4.0% 1,434,000 1,493,000
4 WET 'N' WILD GOLD COAST, Gold Coast, Australia 0.0% 1,200,000 1,200,000
5 SHENYANG ROYAL OCEAN PARK — WATER WORLD, Fushun, China
-1.9% 1,150,000 1,172,000
6 SUNWAY LAGOON, Kuala Lumpur, Malaysia -2.1% 1,077,000 1,100,000
7 ATLANTIS WATER ADVENTURE, Jakarta, Indonesia 1.0% 970,000 960,000
8 SUMMERLAND, Tokyo, Japan 3.5% 915,000 884,000
9 WOONGJIN PLAYDOCI WATERDOCI, Gyeonggi-Do, South Korea
-5.0% 898,000 945,000
10 SUNWAY LOST WORLD OF TAMBUN, Perak, Malaysia 22.7% 859,000 700,000
11 OCEAN PARK WATER ADVENTURE, Jakarta, Indonesia 3.5% 804,000 777,000
12 LOTTE WATER PARK, Seoul, South Korea (new) NA 772,000 NA
13 WATER KINGDOM, Mumbai, India 0.0% 750,000 750,000
14 PLAYAMAYA WATER PARK, Wuhan, China 35.2% 730,000 540,000
15 WUHU FANTAWILD WATER PARK, Wuhu, China 129.1% 708,000 309,000
16 LEGOLAND WATER PARK, Johor, Malaysia 11.1% 700,000 630,000
17 ZHENGZHOU FANTAWILD WATER PARK, Zhengzhou, China 215.5% 694,000 220,000
18 CHANGDE HAPPY WATER WORLD, Changde, China (new) NA 690,000 NA
19 WET 'N' WILD SYDNEY, Sydney, Australia -4.9% 675,000 710,000
20 ADVENTURE COVE WATER PARK, Singapore 7.5% 660,000 614,000
TOP 20 TOTAL ATTENDANCE 2015 19,547,000 16,867,000
TOP 20 TOTAL ATTENDANCE 2014 1.0% 19,362,000
19.5mTop 20 water parks Asia-Paciic attendance 2015
19.4mTop 20 water parks Asia-Paciic attendance 2014
1.0%Top 20 water parks attendance growth Asia-Paciic 2014–15
51© 2016 TEA / AECOM

EMEA
2.8%Top 20 amusement/theme parks attendance growth EMEA 2014–15
61.2mTop 20 amusement/theme parks EMEA attendance 2015
9.0mTop 10 water parks EMEAattendance 2015
52

Margreet Papamichael Director, EMEA
© Aquanura, Efteling, The Netherlands
EMEA’s ups and downsNorthern Europe outperforms Southern Europe
Overall the theme park and water park
attendance numbers for 2015 in the EMEA
region (Europe, Middle East and Africa)
show quite a bit of growth, but a somewhat
bumpy ride. In Europe particularly, some of
the top parks did tremendously well while
others just doodled by.
Euro Disney’s numbers have been back
on the upswing for two reasons: France as
a whole is doing better economically, and
Disney has made signiicant investments including new attractions themed on top
IPs Star Wars and Frozen, as well as general improvements in the park.
Europa-Park in Rust, Germany, is consistently in the top 5 for attendance,
as it was for 2015. This family-owned park does really well, going from strength to
strength. In marking its 40th anniversary
in 2015 Europa-Park brought in a 10% increase, which is huge. The park recently
increased its accommodation oferings and beneited from that as well. Over the course of the last 10 years, this park has grown with
a compound annual growth rate of around
3.4%, which shows great consistency.
53

54
Similarly, de Efteling in the Netherlands,
another family-owned park, has shown consistent growth through the cycles with
a very similar compound annual growth
rate of around 3.9%. The park has recently
announced both new attractions and
additional accommodation, which may
well see it increase its growth rate.
Other increases can mostly be credited to
the market picking up and doing well, with
Southern Europe slightly behind Northern
Europe, a pattern we noted in 2014 as well.
10-year review, EMEA’s top parks
PAR
KL
oc
ati
on
% C
HA
NG
E
20
05
–20
15
AT
TE
ND
AN
CE
2
01
5
AT
TE
ND
AN
CE
2
01
0
AT
TE
ND
AN
CE
2
00
5
DISNEYLAND PARK AT DISNEYLAND PARIS, Marne-la-Vallée, France
0.2% 10,360,000 10,500,000 10,200,000
EUROPA-PARK, Rust, Germany 3.4% 5,500,000 4,250,000 3,950,000
TIVOLI GARDENS, Copenhagen, Denmark 1.2% 4,733,000 3,696,000 4,188,000
DE EFTELING, Kaatsheuvel, The Netherlands 3.9% 4,680,000 4,000,000 3,200,000
WALT DISNEY STUDIOS PARK AT DISNEYLAND PARIS, Marne-la-Vallée, France
7.8% 4,440,000 4,500,000 2,100,000
PORT AVENTURA, Salou, Spain 0.7% 3,600,000 3,050,000 3,366,000
LISEBERG, Gothenburg, Sweden -0.2% 3,100,000 2,900,000 3,150,000
GARDALAND, Castelnuovo del Garda, Italy -0.8% 2,850,000 2,800,000 3,100,000
LEGOLAND WINDSOR, Windsor, U.K. 4.9% 2,250,000 1,900,000 1,400,000
ALTON TOWERS, Stafordshire, U.K. -1.3% 1,925,000 2,750,000 2,200,000
LEGOLAND BILLUND, Billund, Denmark 3.2% 2,050,000 1,650,000 1,490,000
PUY DU FOU, Les Epesses, France 8.7% 2,050,000 1,350,000 890,000
THORPE PARK, Chertsey, England 2.8% 1,850,000 1,850,000 1,400,000
PHANTASIALAND, Brϋhl, Germany -0.5% 1,900,000 1,850,000 2,000,000
PARC ASTERIX, Plailly, France 0.3% 1,850,000 1,663,000 1,800,000
FUTUROSCOPE, Jaunay-Clan, France 2.5% 1,800,000 1,825,000 1,400,000
PARQUE WARNER, Madrid, Spain 5.1% 1,641,000 1,193,000 1,000,000
CHESSINGTON WORLD OF ADVENTURES, Chessington, U.K.
4.5% 1,640,000 1,200,000 1,054,000
HEIDE PARK, Soltau, Germany 2.3% 1,525,000 1,350,000 1,220,000
GRONALUND, Stockholm, Sweden 3.9% 1,461,087 1,305,612 1,000,000
TOTAL 2.0% 61,205,087 55,582,612 50,108,000

55
© Efteling, Kaatsheuvel, The Netherlands
The power of live shows and fun — the IP question
Puy du Fou in Les Epesses, France, has
steadily increased growth over the past ive years regardless of external economics,
showing us all what you can do with a park
based on live shows. The park is highly
seasonal, really creative, and it gets people
stirred up emotionally. It depends on
destination tourism as there is not much
population within a 1-hour or even a 2-hour
radius. We were absolutely delighted to see Puy du Fou receive its second Thea Award,
in 2016, from the Themed Entertainment
Association, celebrating the new attraction
Les Amoureux de Verdun. It was well deserved for this very original and creative
attraction, where instead of delivering
a performance on a stage, the guest
walks through the staged, multimedia
environment and experiences it directly.
(Puy du Fou was honored with the Thea
Classic Award in 2012.)
De Efteling in the Netherlands has shown consistent growth through the cycles with a compound annual growth rate of around 3.9%.
56
In Poitiers, France, Futuroscope’s
impressive 8% attendance increase for
2015 outperformed French theme park
numbers as a whole, which is a tribute to
way they’ve been changing the park to ofer a lot more fun, with attractions such as the
Time Machine, an irreverent, whimsical
“Raving Rabbid” experience created in
partnership with Ubisoft and honored last
year with a TEA Thea Award. Futuroscope
is not just delivering the fun, they are also
being vocal about it in their marketing.
The success of Time Machine, not to
mention what’s happening with theme park
development in many parts of the world,
raises the question of IP. Yes, IP providers
are looking at the European market, but
I am cautious when talking to my clients
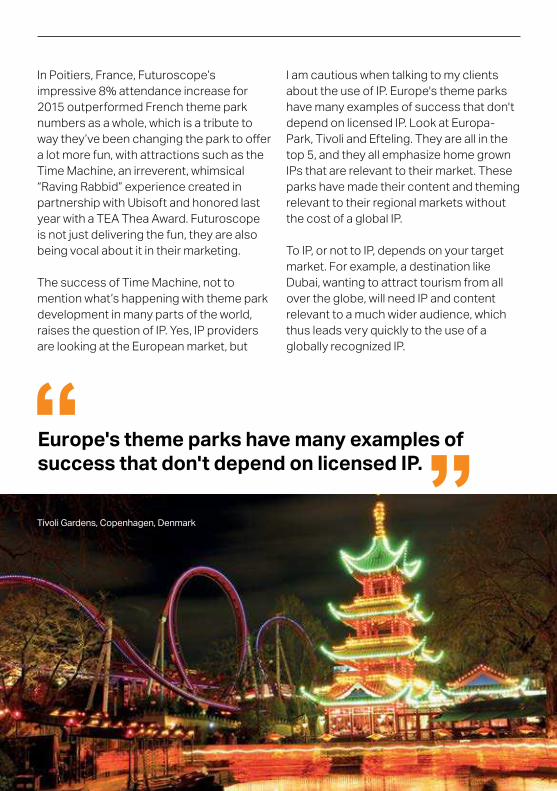
about the use of IP. Europe's theme parks
have many examples of success that don't
depend on licensed IP. Look at Europa-Park, Tivoli and Efteling. They are all in the
top 5, and they all emphasize home grown
IPs that are relevant to their market. These
parks have made their content and theming
relevant to their regional markets without
the cost of a global IP.
To IP, or not to IP, depends on your target
market. For example, a destination like
Dubai, wanting to attract tourism from all
over the globe, will need IP and content
relevant to a much wider audience, which
thus leads very quickly to the use of a
globally recognized IP.
Europe's theme parks have many examples of success that don't depend on licensed IP.
Tivoli Gardens, Copenhagen, Denmark

57
Alternative programming, second gates and facing facts
In the U.K., Alton Towers experienced a
dramatic attendance decline due to a
truly tragic accident at the start of the
season. The park and its parent company
Merlin Entertainments dealt with it in a
straightforward and exemplary fashion:
they immediately closed down the park,
secured everything and reviewed their
procedures — not just at Alton Towers but
in all their parks — to make sure something
like that could never happen again.
Numbers at Thorpe Park, also owned by
Merlin, were also afected.
In Stockholm, Gröna Lund came in at #20
in the top attended EMEA parks of 2015.
Their success story is an interesting lesson
in alternative, soft programming, as they
cite their evening concert program for the
11% growth. These are massive, big-name concerts that are hosted in the park. The
park also reported record sales in annual
passes for the year, and for pass holders,
the concert tickets were included. It’s a
clever use of a park’s available space and
its seasonal opportunities.
In Spain, Parque Warner Madrid posted a very impressive 12% growth igure for 2015, crediting Parque Warner Beach, the water park added in 2014, for boosting the
theme park numbers. Adding a second
gate or a second type of experience in
this way encourages longer stays and
attendance tends to go up. It’s a popular
move for developers and operators. The
property becomes a true destination. Spain
is beginning to emerge from its economic
woes and we are looking forward to seeing
more signs of improvement there. The
increase in tourism to Spain for 2015 may
also be partly attributable to changing
travel patterns due to security concerns
in other parts of the world such as Turkey
and Tunisia.
Adding a second gate or a second type of experience in this way encourages longer stays and attendance tends to go up.
11.4%Gröna Lund, Sweden,
attendance growth 2014–15
12.4%Parque Warner, Spain, attendance growth 2014–15
-25.2%Alton Towers, U.K.,
attendance growth 2014–15

58
Water parks indoor and outdoor
This is the second year that we have
included a Top 10 for water parks of the
EMEA region. We are grateful to those water parks that have provided us with their
insights — and we also note that there may
well be gems of water parks that have yet to
come to our attention.
European water parks come in two basic
forms: indoor facilities that operate
year round and may have some outdoor
components, and outdoor facilities that
are usually seasonal. Northern Europe, for
obvious reasons of climate, tends to have
indoor facilities. Of these, we ind the most successful ones are usually in locations
where there is a strong cultural connection
to water-based health therapies, and the water parks there usually have spa
components as well. This is the case for
Therme Erding, Aquapalace and Nettebad.
Most of the other successful water parks
are outdoors, in locations with conducive
weather: the Middle East and to some
degree Southern Europe. Hospitality is
often part of the overall complex, such
as Aquaventure and Wild Wadi.
The water parks in the Middle East are
showing water rides that are not just slides,
but distinctly ‘theme park’-ish rides. This seems of interest to other operators
within Europe; however, at the moment
they seem still only to occur in the Middle
Eastern market. It would be great to
see some European operators take the
creative plunge.
Middle East — the Dubai efect
While we await the 2016 openings of IMG Worlds of Adventure and Dubai Parks & Resorts, and other new parks and
attractions also set to open their gates
© Aquaventure Water Park, Dubai, U.A.E.
59
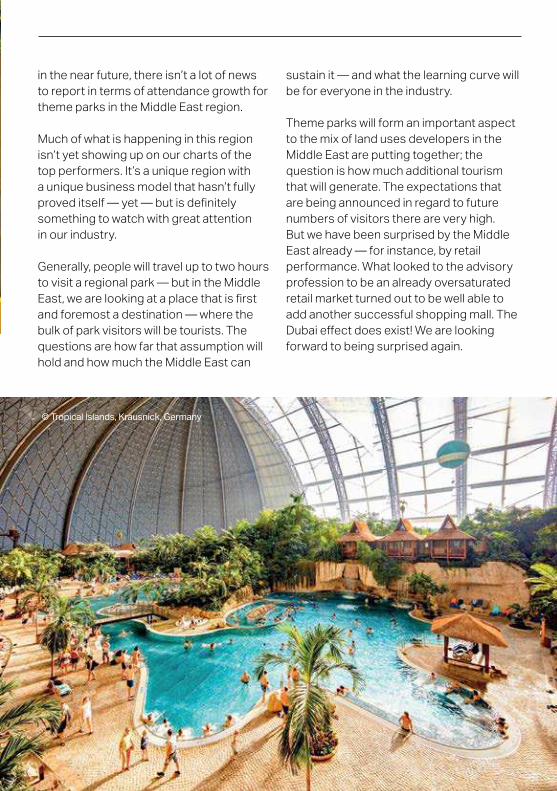
© Tropical Islands, Krausnick, Germany
in the near future, there isn’t a lot of news to report in terms of attendance growth for
theme parks in the Middle East region.
Much of what is happening in this region
isn’t yet showing up on our charts of the
top performers. It’s a unique region with
a unique business model that hasn’t fully
proved itself — yet — but is deinitely something to watch with great attention
in our industry.
Generally, people will travel up to two hours
to visit a regional park — but in the Middle
East, we are looking at a place that is irst and foremost a destination — where the
bulk of park visitors will be tourists. The
questions are how far that assumption will
hold and how much the Middle East can
sustain it — and what the learning curve will
be for everyone in the industry.
Theme parks will form an important aspect
to the mix of land uses developers in the
Middle East are putting together; the
question is how much additional tourism
that will generate. The expectations that
are being announced in regard to future
numbers of visitors there are very high.
But we have been surprised by the Middle
East already — for instance, by retail
performance. What looked to the advisory profession to be an already oversaturated
retail market turned out to be well able to
add another successful shopping mall. The
Dubai efect does exist! We are looking forward to being surprised again.
2010–11
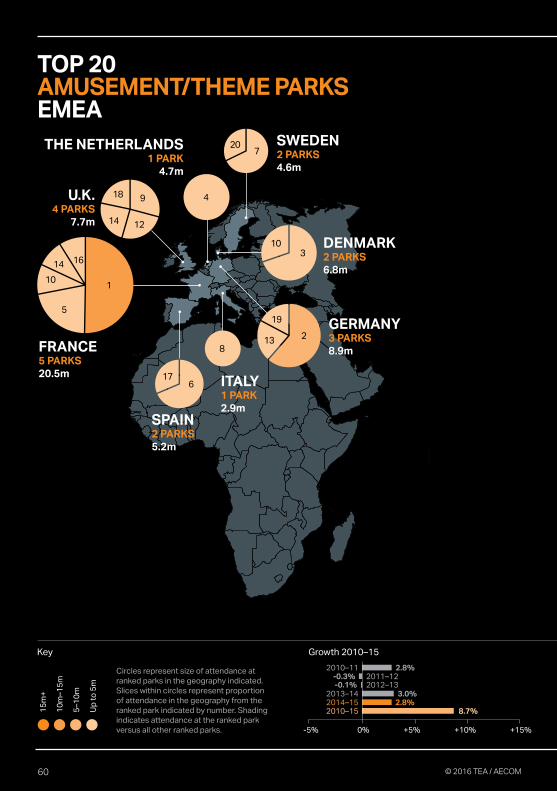
TOP 20 AMUSEMENT/THEME PARKS EMEA
15
m+
10
m –
15
m
5 –
10
m
Up
to
5m
FRANCE5 PARKS20.5m
U.K.4 PARKS
7.7m
GERMANY3 PARKS8.9m
SPAIN2 PARKS5.2m
SWEDEN2 PARKS4.6m
DENMARK2 PARKS6.8m
THE NETHERLANDS1 PARK
4.7m
ITALY1 PARK2.9m
4
1614
10
5
1
18
14 12
9
19
13 2
176
103
207
-5% 0% +5% +10% +15%
2012–132011–12
2013–142014–152010–15
-0.3%-0.1%
2.8%
3.0%2.8%
8.7%
Key Growth 2010–15
8
Circles represent size of attendance at ranked parks in the geography indicated. Slices within circles represent proportion of attendance in the geography from the ranked park indicated by number. Shading indicates attendance at the ranked park versus all other ranked parks.
60 © 2016 TEA / AECOM

RA
NK
PAR
KL
oc
ati
on
%
CH
AN
GE
AT
TE
ND
AN
CE
2
01
5
AT
TE
ND
AN
CE
2
01
4
1 DISNEYLAND PARK AT DISNEYLAND PARIS, Marne-la-Vallée, France
4.2% 10,360,000 9,940,000
2 EUROPA-PARK, Rust, Germany 10.0% 5,500,000 5,000,000
3 TIVOLI GARDENS, Copenhagen, Denmark 5.7% 4,733,000 4,478,000
4 DE EFTELING, Kaatsheuvel, The Netherlands 6.4% 4,680,000 4,400,000
5 WALT DISNEY STUDIOS PARK AT DISNEYLAND PARIS, Marne-la-Vallée, France
4.2% 4,440,000 4,260,000
6 PORT AVENTURA, Salou, Spain 2.9% 3,600,000 3,500,000
7 LISEBERG, Gothenburg, Sweden 0.0% 3,100,000 3,100,000
8 GARDALAND, Castelnuovo del Garda, Italy 3.6% 2,850,000 2,750,000
9 LEGOLAND WINDSOR, Windsor, U.K. 2.3% 2,250,000 2,200,000
10 LEGOLAND BILLUND, Billund, Denmark 6.5% 2,050,000 1,925,000
PUY DU FOU, Les Epesses, France 7.2% 2,050,000 1,912,000
12 ALTON TOWERS, Stafordshire, U.K. -25.2% 1,925,000 2,575,000
13 PHANTASIALAND, Brϋhl, Germany 3.0% 1,900,000 1,845,000
14 PARC ASTERIX, Plailly, France 2.8% 1,850,000 1,800,000
THORPE PARK, Chertsey, U.K. -11.9% 1,850,000 2,100,000
16 FUTUROSCOPE, Jaunay-Clan, France 8.1% 1,800,000 1,665,000
17 PARQUE WARNER, Madrid, Spain 12.4% 1,641,000 1,460,000
18 CHESSINGTON WORLD OF ADVENTURES, Chessington, U.K.
2.5% 1,640,000 1,600,000
19 HEIDE PARK, Soltau, Germany 3.4% 1,525,000 1,475,000
20 GRÖNA LUND, Stockholm, Sweden 11.4% 1,461,000 1,311,000
TOP 20 TOTAL ATTENDANCE 2015 61,205,000 59,296,000
TOP 20 TOTAL ATTENDANCE 2014 2.8% 59,535,000
61.2mTop 20 amusement/theme parks EMEA attendance 2015
59.5mTop 20 amusement/theme parks EMEA attendance 2014
2.8%Top 20 amusement/theme parks attendance growth EMEA 2014-15
61© 2016 TEA / AECOM
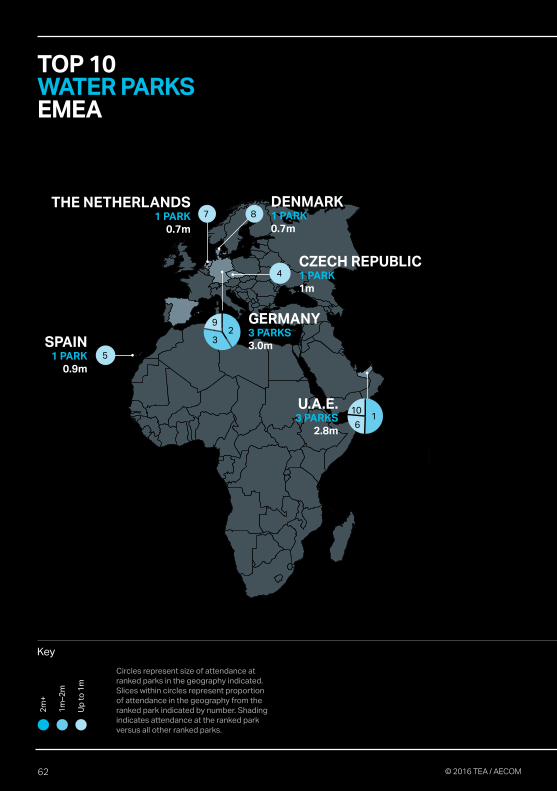
TOP 10 WATER PARKS EMEA
Key
CZECH REPUBLIC1 PARK1m
GERMANY3 PARKS3.0mSPAIN
1 PARK0.9m
DENMARK1 PARK0.7m
U.A.E.3 PARKS
2.8m
THE NETHERLANDS1 PARK
0.7m
2m
+
1m
–2
m
Up
to
1m
7
4
8
5
10
61
9
32
Circles represent size of attendance at ranked parks in the geography indicated. Slices within circles represent proportion of attendance in the geography from the ranked park indicated by number. Shading indicates attendance at the ranked park versus all other ranked parks.
62 © 2016 TEA / AECOM
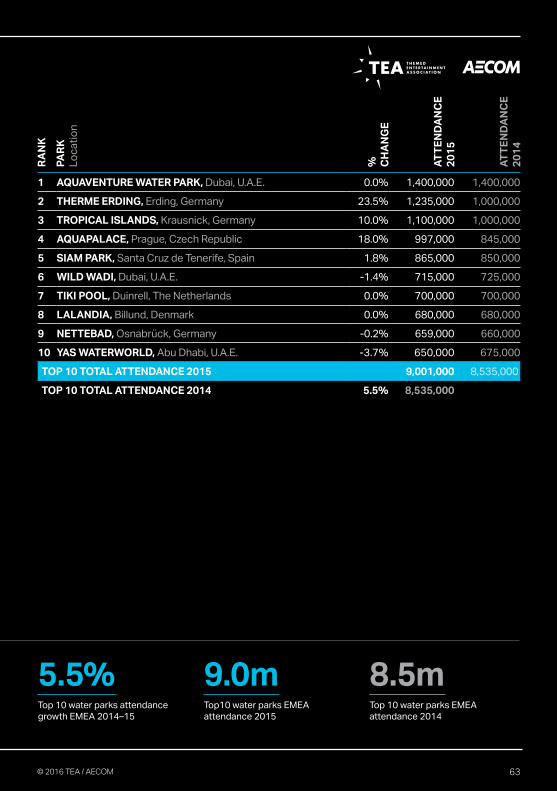
RA
NK
PAR
KL
oc
ati
on
%
CH
AN
GE
AT
TE
ND
AN
CE
2
01
5
AT
TE
ND
AN
CE
2
01
4
1 AQUAVENTURE WATER PARK, Dubai, U.A.E. 0.0% 1,400,000 1,400,000
2 THERME ERDING, Erding, Germany 23.5% 1,235,000 1,000,000
3 TROPICAL ISLANDS, Krausnick, Germany 10.0% 1,100,000 1,000,000
4 AQUAPALACE, Prague, Czech Republic 18.0% 997,000 845,000
5 SIAM PARK, Santa Cruz de Tenerife, Spain 1.8% 865,000 850,000
6 WILD WADI, Dubai, U.A.E. -1.4% 715,000 725,000
7 TIKI POOL, Duinrell, The Netherlands 0.0% 700,000 700,000
8 LALANDIA, Billund, Denmark 0.0% 680,000 680,000
9 NETTEBAD, Osnabrück, Germany -0.2% 659,000 660,000
10 YAS WATERWORLD, Abu Dhabi, U.A.E. -3.7% 650,000 675,000
TOP 10 TOTAL ATTENDANCE 2015 9,001,000 8,535,000
TOP 10 TOTAL ATTENDANCE 2014 5.5% 8,535,000
9.0mTop10 water parks EMEA attendance 2015
8.5mTop 10 water parks EMEA attendance 2014
5.5%Top 10 water parks attendance growth EMEA 2014–15
63© 2016 TEA / AECOM

MUSEUMS
57.5mTop 20 museums North America attendance 2015
57.6mTop 20 museums Asia-Paciic attendance 2015
74.1mTop 20 museums EMEA attendance 2015
64

Linda Cheu
Vice President
with contributions by
Beth Chang, Vice President,
Economics, Asia-Paciic;
and Margreet Papamichael
Director, EMEA
Museums in transitionLooking at the top-attended museums worldwide in 2015, the irst ive on the list are exactly the same as in 2014. Museums on the
rest of the list have reshuled, but there has not been a massive change.
Museums are a decentralized industry in
comparison to theme parks. Unlike theme
parks, museums aren’t dominated by a
relatively small number of top operators and
brands. On the other hand, just as with theme
parks and water parks, the top performers
tend to stay on top and to continue growing.
This is the fourth year we have been tracking
the performance of museums in the Museum
Index, and once we have ive years of data we’ll understand patterns of growth and be
able to identify trends.
Museums are mission-driven organizations and beacons of culture, arts, history, science,
education, and entertainment. But they serve
a changed and changing world. How are they
adapting and continuing to drive attendance
in that world? How do they adapt while
remaining true to their missions?
The democratization of technology has
led to a prevalence of entertainment and
information available in people’s homes.
Having vast amounts of entertainment and
information available electronically at a touch
are things Millennials and today’s children
take for granted. Tate Modern, London, U.K.
65

66
This will continue to challenge the demand
for traditional museums and people’s
expectations for visitor experience.
The guest experience in museums is
continuing to move away from, or to
augment, traditional exhibits and object
based experiences. Museums are also
increasingly acting as community gathering
places, creating social experiences to draw
visitors to their exhibits and programming.
Europe and North America are stable,
mature markets, and luctuations in museum attendance in these markets tend
to be driven by popular temporary exhibits.
Earned revenue is increasingly important to
the U.S. markets, followed by the European
markets, as they cope with declines in
government funding.
Even art and history museums are
embracing technology and learning to
position themselves more as attractions,
competing for people’s discretionary time
and money and inding new ways to explore their collections and bring them to life. For
example, the British Museum found that VR and AR technology were just the thing to
make its Bronze Age exhibit more engaging
than ever, and that younger visitors
embraced it without hesitation.
In Asia, especially China, the museum
sector is volatile and growing rapidly —
similar to the theme park sector in that
part of the world. We can expect the global top 20 to remain fairly stable for the next
ive years or so, but over the longer term, China’s museum building boom may start to
become visible on our charts.
British Museum, London, U.K.State Hermitage, St Petersburg, Russia
Europe and North America are stable, mature markets, and museum attendance there tends to be driven by popular exhibits.

67
Louvre, Paris, France
Focus on Europe
Attendance ups and downs at Europe’s
top museums are almost invariably tied to
the presence or absence of big, popular
exhibitions or major events occurring in
their host markets.
An exception to this is the Auschwitz
Museum in Poland which attracted
record attendance in 2015, because the
year marked the 70th anniversary of the
liberation of the concentration camps in
Europe at the end of World War II.
In Amsterdam, work on the museums
around Museum Square has been very
successful. This year the Van Gogh Museum increased attendance by
18% after reopening following a major
refurbishment, with a new exhibition
and a critically acclaimed new entry
hall. This followed the re-opening of the Rijksmuseum.
The Museo Nacional Centro de Arte
Reina Sofía in Madrid enjoyed a major
21% attendance jump in 2015 due to the
popularity of its exhibition, “White Fire: Collectionism and Modernity”, which drew
540,000 visits.
The Louvre maintained its position as
the top-attended museum in the world, even though visitation there, and to Paris
generally, was negatively afected by the high proile terrorist attack.
In the U.K., the Tate Modern had its
lowest attendance in 10 years. Its sharp
contrast to prior year attendance was in
part due to the all-time high in 2014 for
the exhibition, “Henri Matisse: The Cut
Outs,” and exacerbated by widespread
closures at the Southbank Centre
next door, a multi-purpose performing arts center that people often visit in
combination with the Tate. Meanwhile,
the Victoria & Albert Museum saw a dramatic rise in attendance due to its
most popular exhibition ever, “Savage
Beauty: Alexander McQueen” (which
was honored this year with a TEA
Thea Award).
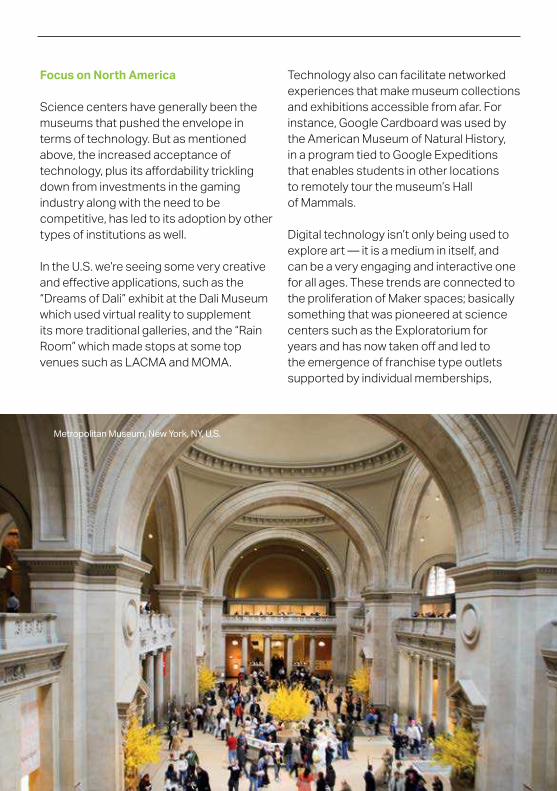
68
Focus on North America
Science centers have generally been the
museums that pushed the envelope in
terms of technology. But as mentioned
above, the increased acceptance of
technology, plus its afordability trickling down from investments in the gaming
industry along with the need to be
competitive, has led to its adoption by other
types of institutions as well.
In the U.S. we’re seeing some very creative
and efective applications, such as the “Dreams of Dali” exhibit at the Dali Museum
which used virtual reality to supplement
its more traditional galleries, and the “Rain
Room” which made stops at some top
venues such as LACMA and MOMA.
Technology also can facilitate networked
experiences that make museum collections
and exhibitions accessible from afar. For
instance, Google Cardboard was used by
the American Museum of Natural History,
in a program tied to Google Expeditions
that enables students in other locations
to remotely tour the museum’s Hall
of Mammals.
Digital technology isn’t only being used to
explore art — it is a medium in itself, and
can be a very engaging and interactive one
for all ages. These trends are connected to
the proliferation of Maker spaces; basically
something that was pioneered at science
centers such as the Exploratorium for
years and has now taken of and led to the emergence of franchise type outlets
supported by individual memberships,
Metropolitan Museum, New York, NY, U,S.

69
corporate sponsorship and partnerships
with universities much in the manner of
museums. The Arizona Science Center,
for example, has a full-scale, 6,500 square foot maker workshop called Create, with
separate admission, annual monthly
membership options, art supplies, 3-D printers and tools.
Adult events are a very signiicant trend that can account for up to 10% to 15%
of total attendance at some museums in
the U.S. In the past these have been seen
as ancillary but now they have become
core programming, an integral part of
attendance and a valuable stream of earned
revenue — expanding the museum’s hours,
the guest experience and the audiences.
These events typically include access
to all the galleries, displays and exhibits
just as in daytime hours, complete with
resident experts and docents to talk to, but
enhanced with entertainment, refreshment,
music, special activities.
Examples include the weekly Nightlife
gatherings at the California Academy
of Sciences in San Francisco; Adult
Sleepovers at AMNH in New York City,
Cheap Date Night at the McDonnell
Planetarium in Saint Louis, Adults
Only Night at TELUS Spark in Calgary,
Canada; Audubon Institute’s Summer of
Sustainability Seafood Dinner Series in
New Orleans.
Bottom line: What it means to visit a museum is changing.
The J. Paul Getty Center, Los Angeles, CA, U.S.

70
Focus on Asia-Paciic
In China, private sector developers are
establishing museums, then handing
them to the government in exchange
for getting prime land. While these may be world-class structures, they tend to be deicient in other areas: collections, content and operating budgets. It remains
to be seen how they will fare over the next
10 to 20 years as the sector is still on a
learning curve in terms of operations skills,
budgeting, staing, marketing, exhibit design and guest experience.
As members of Asia’s expanding upper
middle class travel and visit overseas
museums, their expectations have been
changing. This has put pressure on their
local museums to grow and improve.
Renovations are taking place mostly in
the larger institutions and those that are
privately owned; smaller museums may ind it harder to keep up.
National policy has dictated that education
and research should be the top priority
for museums, where previously emphasis
was placed on the collection. This policy
change should lead to increased demand
for exhibit content, making museums
more visitor-oriented. New government requirements about education and class
time are engendering ield trips. This trend will lead to more of the kind of partnerships
between museums and educators that are
typical in the West.
Asian museums do not receive much
support from private foundations and
donations, but there are signs of change.
In Beijing, the China Women’s Federation, a nonproit organization, opened China’s irst-ever corporate sponsored children’s discovery center. We are seeing more interest in building such centers now, in
a country that traditionally has almost no
children’s museums.
National Museum of China, Beijing, ChinaShanghai Science & Technology Museum, Shanghai, China
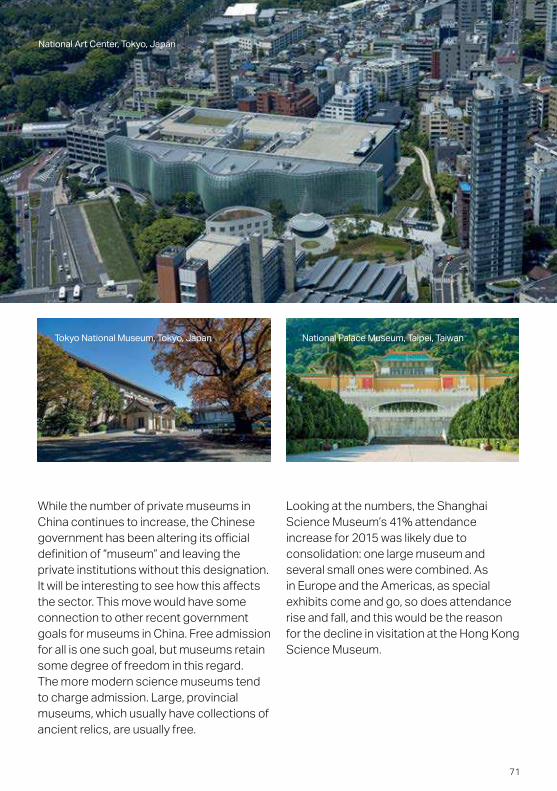
71
While the number of private museums in China continues to increase, the Chinese
government has been altering its oicial deinition of “museum” and leaving the private institutions without this designation.
It will be interesting to see how this afects the sector. This move would have some
connection to other recent government
goals for museums in China. Free admission
for all is one such goal, but museums retain
some degree of freedom in this regard.
The more modern science museums tend
to charge admission. Large, provincial
museums, which usually have collections of
ancient relics, are usually free.
Looking at the numbers, the Shanghai
Science Museum’s 41% attendance
increase for 2015 was likely due to
consolidation: one large museum and
several small ones were combined. As
in Europe and the Americas, as special
exhibits come and go, so does attendance
rise and fall, and this would be the reason
for the decline in visitation at the Hong Kong
Science Museum.
National Palace Museum, Taipei, TaiwanTokyo National Museum, Tokyo, Japan
National Art Center, Tokyo, Japan
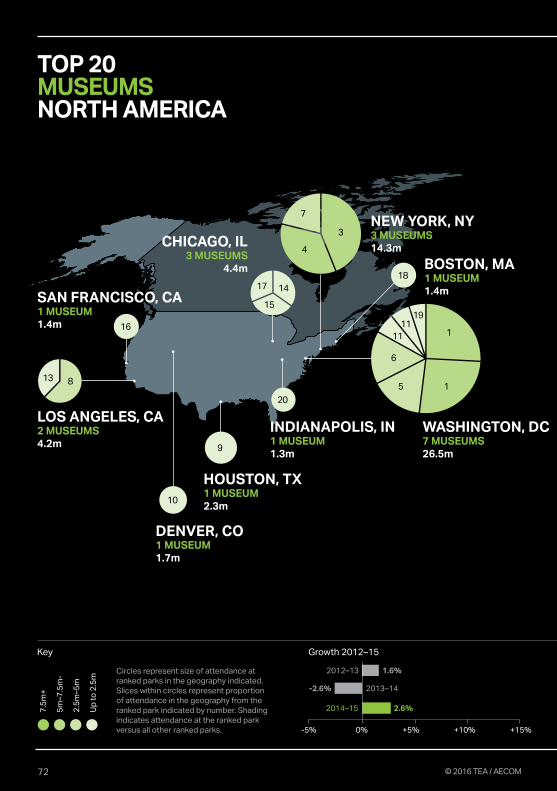
2014–15
2013–14
TOP 20 MUSEUMS NORTH AMERICA
LOS ANGELES, CA2 MUSEUMS 4.2m
BOSTON, MA1 MUSEUM 1.4m
CHICAGO, IL 3 MUSEUMS
4.4m
NEW YORK, NY3 MUSEUMS14.3m
7.5
m+
5m
–7
.5m
-
2.5
m–
5m
Up
to
2.5
m
SAN FRANCISCO, CA1 MUSEUM 1.4m
WASHINGTON, DC7 MUSEUMS26.5m
DENVER, CO1 MUSEUM 1.7m
INDIANAPOLIS, IN1 MUSEUM 1.3m
HOUSTON, TX1 MUSEUM 2.3m
9
10
16
20
1911
11
6
5 1
1
18
7
4
3
17
15
14
13 8
-5% 0% +5% +10% +15%
2012–13
2.6%
1.6%
-2.6%
Key Growth 2012–15
Circles represent size of attendance at ranked parks in the geography indicated. Slices within circles represent proportion of attendance in the geography from the ranked park indicated by number. Shading indicates attendance at the ranked park versus all other ranked parks.
72 © 2016 TEA / AECOM
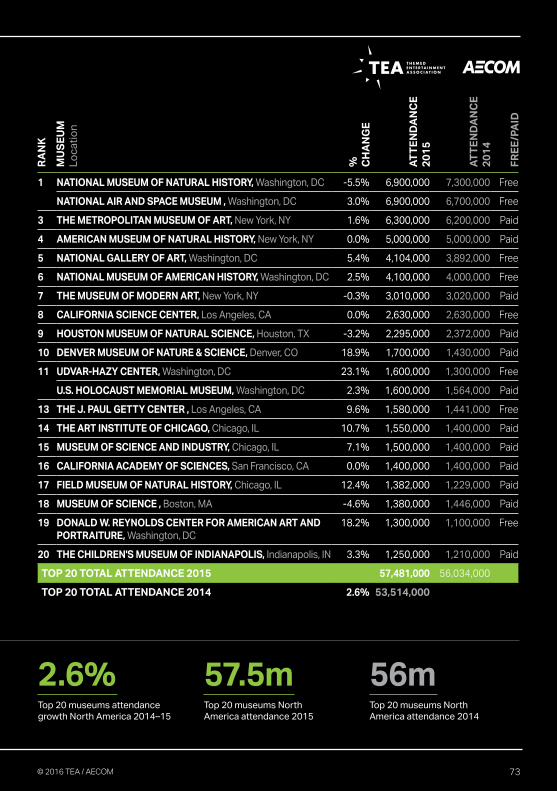
57.5mTop 20 museums North America attendance 2015
56mTop 20 museums North America attendance 2014
2.6%Top 20 museums attendance growth North America 2014–15
RA
NK
MU
SE
UM
Lo
ca
tio
n
%
CH
AN
GE
AT
TE
ND
AN
CE
2
01
5
AT
TE
ND
AN
CE
2
01
4
FR
EE
/PA
ID
1 NATIONAL MUSEUM OF NATURAL HISTORY, Washington, DC -5.5% 6,900,000 7,300,000 Free
NATIONAL AIR AND SPACE MUSEUM , Washington, DC 3.0% 6,900,000 6,700,000 Free
3 THE METROPOLITAN MUSEUM OF ART, New York, NY 1.6% 6,300,000 6,200,000 Paid
4 AMERICAN MUSEUM OF NATURAL HISTORY, New York, NY 0.0% 5,000,000 5,000,000 Paid
5 NATIONAL GALLERY OF ART, Washington, DC 5.4% 4,104,000 3,892,000 Free
6 NATIONAL MUSEUM OF AMERICAN HISTORY, Washington, DC 2.5% 4,100,000 4,000,000 Free
7 THE MUSEUM OF MODERN ART, New York, NY -0.3% 3,010,000 3,020,000 Paid
8 CALIFORNIA SCIENCE CENTER, Los Angeles, CA 0.0% 2,630,000 2,630,000 Free
9 HOUSTON MUSEUM OF NATURAL SCIENCE, Houston, TX -3.2% 2,295,000 2,372,000 Paid
10 DENVER MUSEUM OF NATURE & SCIENCE, Denver, CO 18.9% 1,700,000 1,430,000 Paid
11 UDVAR-HAZY CENTER, Washington, DC 23.1% 1,600,000 1,300,000 Free
U.S. HOLOCAUST MEMORIAL MUSEUM, Washington, DC 2.3% 1,600,000 1,564,000 Paid
13 THE J. PAUL GETTY CENTER , Los Angeles, CA 9.6% 1,580,000 1,441,000 Free
14 THE ART INSTITUTE OF CHICAGO, Chicago, IL 10.7% 1,550,000 1,400,000 Paid
15 MUSEUM OF SCIENCE AND INDUSTRY, Chicago, IL 7.1% 1,500,000 1,400,000 Paid
16 CALIFORNIA ACADEMY OF SCIENCES, San Francisco, CA 0.0% 1,400,000 1,400,000 Paid
17 FIELD MUSEUM OF NATURAL HISTORY, Chicago, IL 12.4% 1,382,000 1,229,000 Paid
18 MUSEUM OF SCIENCE , Boston, MA -4.6% 1,380,000 1,446,000 Paid
19 DONALD W. REYNOLDS CENTER FOR AMERICAN ART AND PORTRAITURE, Washington, DC
18.2% 1,300,000 1,100,000 Free
20 THE CHILDREN'S MUSEUM OF INDIANAPOLIS, Indianapolis, IN 3.3% 1,250,000 1,210,000 Paid
TOP 20 TOTAL ATTENDANCE 2015 57,481,000 56,034,000
TOP 20 TOTAL ATTENDANCE 2014 2.6% 53,514,000
ON, DC
73© 2016 TEA / AECOM

2014–15
TOP 20 MUSEUMS ASIA-PACIFIC
7.5
m+
5m
–7
.5m
-
2.5
m–
5m
Up
to
2.5
m
20
KOLKATA, INDIA1 MUSEUM
1.4m
11
MELBOURNE, AUSTRALIA1 MUSEUM
2.4m
TOKYO, JAPAN3 MUSEUMS 6.5m
16
12
10
TAIWAN4 MUSEUMS 11.8m
8 6
SEOUL, SOUTH KOREA2 MUSEUMS 5.75m
EAST CHINA5 MUSEUMS 15.5m
BEIJING, CHINA2 MUSEUMS
10.7m
41
1715
95
2
13
CHONGQING, CHINA1 MUSEUM
2.1m
19
GUANGZHOU, CHINA1 MUSEUM
1.5m
1814
7
3
2013–14
-10% 0% +10% +20% +30%
2012–13
-0.4%
9.1%
27.6%
Key Growth 2012–15
Circles represent size of attendance at ranked parks in the geography indicated. Slices within circles represent proportion of attendance in the geography from the ranked park indicated by number. Shading indicates attendance at the ranked park versus all other ranked parks.
74 © 2016 TEA / AECOM

57.6mTop 20 museums Asia-Paciic attendance 2015
57.8mTop 20 museums Asia-Paciic attendance 2014
-0.4%Top 20 museums attendance growth Asia-Paciic 2014–15
RA
NK
MU
SE
UM
Lo
ca
tio
n
%
CH
AN
GE
AT
TE
ND
AN
CE
2
01
5
AT
TE
ND
AN
CE
2
01
4
FR
EE
/PA
ID
1 NATIONAL MUSEUM OF CHINA, Beijing, China -4.5% 7,290,000 7,630,000 Free
2 SHANGHAI SCIENCE & TECHNOLOGY MUSEUM, Shanghai, China
40.9% 5,948,000 4,220,000 Paid
3 NATIONAL PALACE MUSEUM (TAIWAN), Taipei, Taiwan -2.1% 5,288,000 5,402,000 Paid
4 CHINA SCIENCE TECHNOLOGY MUSEUM, Beijing, China 4.4% 3,360,000 3,218,000 Paid
5 ZHEJIANG MUSEUM, Hangzhou, China 10.4% 3,338,000 3,023,000 Free
6 NATIONAL MUSEUM OF KOREA, Seoul, South Korea -11.5% 3,130,000 3,537,000 Free
7 NATIONAL MUSEUM OF NATURAL SCIENCE, Taichung, Taiwan 5.1% 3,075,000 2,927,000 Paid
8 NATIONAL FOLK MUSEUM OF KOREA, Seoul, South Korea -19.9% 2,620,000 3,271,000 Free
9 NANJING MUSEUM, Nanjing, China 9.4% 2,582,000 2,360,000 Free
10 NATIONAL ART CENTER, Tokyo, Japan 3.4% 2,466,000 2,384,000 Paid
11 NATIONAL GALLERY OF VICTORIA, Melbourne, Australia 18.5% 2,411,000 2,035,000 Free
12 NATIONAL MUSEUM OF NATURE AND SCIENCE, Tokyo, Japan 18.2% 2,100,000 1,777,000 Paid
13 CHINA THREE GORGES MUSEUM (CHONGQING MUSEUM), Chongqing, China
22.4% 2,081,000 1,700,000 Free
14 NATIONAL SCIENCE & TECHNOLOGY MUSEUM, Kaohsiung, Taiwan
1.2% 1,958,000 1,934,000 Paid
15 SHANGHAI MUSEUM, Shanghai, China -3.8% 1,924,000 2,001,000 Free
16 TOKYO NATIONAL MUSEUM, Tokyo, Japan 0.0% 1,915,000 1,915,000 Paid
17 SUZHOU MUSEUM, Suzhou, China 14.1% 1,690,000 1,481,000 Free
18 NATIONAL TAIWAN MUSEUM OF FINE ARTS, Taipei, Taiwan 20.9% 1,509,000 1,248,000 Free
19 GUANGDONG PROVINCE MUSEUM, Guangzhou, China 9.6% 1,489,000 1,358,000 Free
20 SCIENCE CITY, Kolkata, India -0.7% 1,441,000 1,451,000 Paid
TOP 20 TOTAL ATTENDANCE 2015 57,615,000 54,872,000
TOP 20 TOTAL ATTENDANCE 2014 -0.4% 57,832,000
75© 2016 TEA / AECOM

2014–15
TOP 20 MUSEUMS EMEA
7.5
m+
5m
–7
.5m
-
2.5
m–
5m
Up
to
2.5
m
PARIS, FRANCE4 MUSEUMS 17.3m
LONDON, U.K.8 MUSEUMS
33.3m
AMSTERDAM, THE NETHERLANDS2 MUSEUMS 4.2m
MADRID, SPAIN2 MUSEUMS 5.9m
ST PETERSBURG, RUSSIA1 MUSEUM 3.7m
VATICAN CITY1 MUSEUM 6.0m
FLORENCE, ITALY1 MUSEUM 2.0m
OŚWIĘCIM, POLAND1 MUSEUM 1.7m
16
12
8
119
3
2015
10
9
6 5
4
2
7
18 14
17
13 11
2012–13
-5% 0% +5% +10% +15%
2013–14
-1.7%
0.8%
4.6%
Key Growth 2012–15
Circles represent size of attendance at ranked parks in the geography indicated. Slices within circles represent proportion of attendance in the geography from the ranked park indicated by number. Shading indicates attendance at the ranked park versus all other ranked parks.
76 © 2016 TEA / AECOM

74.1mTop 20 museums EMEA attendance 2015
75.4mTop 20 museums EMEA attendance 2014
-1.7%Top 20 museums attendance growth EMEA 2014–15
RA
NK
MU
SE
UM
L
oc
ati
on
%
CH
AN
GE
AT
TE
ND
AN
CE
2
01
5
AT
TE
ND
AN
CE
2
01
4
FR
EE
/PA
ID
1 LOUVRE, Paris, France -6.5% 8,700,000 9,300,000 Paid
2 BRITISH MUSEUM, London, U.K. 1.9% 6,821,000 6,695,000 Free
3 VATICAN MUSEUMS, Vatican, Vatican City -2.8% 6,002,000 6,177,000 Paid
4 NATIONAL GALLERY, London, U.K. -7.9% 5,908,000 6,417,000 Free
5 NATURAL HISTORY MUSEUM, London, U.K. -1.9% 5,284,000 5,388,000 Free
6 TATE MODERN, London, U.K. -18.5% 4,713,000 5,785,000 Free
7 STATE HERMITAGE, St Petersburg, Russia 12.9% 3,668,000 3,248,000 Paid
8 MUSÉE D'ORSAY, Paris, France -1.2% 3,440,000 3,481,000 Paid
9 VICTORIA & ALBERT MUSEUM, London, U.K. 7.9% 3,432,000 3,180,000 Free
10 SCIENCE MUSEUM (SOUTH KENSINGTON), London, U.K. 0.0% 3,356,000 3,356,000 Free
11 REINA SOFÍA, Madrid, Spain 21.5% 3,250,000 2,674,000 Paid
12 CENTRE POMPIDOU, Paris, France -10.0% 3,105,000 3,450,000 Paid
13 MUSEO NACIONAL DEL PRADO, Madrid, Spain 6.3% 2,697,000 2,537,000 Paid
14 RIJKSMUSEUM, Amsterdam, The Netherlands -4.1% 2,350,000 2,450,000 Paid
15 NATIONAL PORTRAIT GALLERY, London, U.K. 4.0% 2,145,000 2,063,000 Free
16 CITE DES SCIENCES ET DE L'INDUSTRIE, Paris, France -24.7% 2,013,000 2,674,000 Paid
17 GALLERIA DEGLI UFFIZI, Florence, Italy 1.8% 1,972,000 1,936,000 Paid
18 VAN GOGH MUSEUM, Amsterdam, The Netherlands 18.0% 1,888,000 1,600,000 Paid
19 AUSCHWITZ-BIRKENAU MUSEUM, Oświęcim, Poland 12.4% 1,720,000 1,530,000 Paid
20 NATIONAL MARITIME MUSEUM, London, U.K. 10.6% 1,676,000 1,516,000 Free
TOP 20 TOTAL ATTENDANCE 2015 74,140,000 75,457,000
TOP 20 TOTAL ATTENDANCE 2014 -1.7% 75,410,900
ANDS
77© 2016 TEA / AECOM

78
Methodology and evolution of the TEA/AECOM Theme Index and Museum Index This is the tenth annual Theme Index and
Museum Index collaboration between the
Themed Entertainment Association (TEA)
and AECOM, although the study itself has
been in existence for much longer. The
report has evolved over the years, starting
as just a report on major U.S. theme parks,
with additional regions (EMEA, Asia, Latin
America) and attraction types (water parks,
museums) added over time. It is of course
a signiicant efort to prepare now, with 190 attractions included in the report, and many
more tracked annually.
Inclusion in the annual Theme Index and
Museum Index is now seen as a benchmark
of success among operators, parks, and
museums. Every year AECOM hears from
parks and museums desiring to share their
attendance increases and earn a place on
the list. Those who believe their properties
should be included in the report are
encouraged to contact the AECOM oice in their region, after studying the criteria
for consideration given below. The more
feedback and information we receive, the
more accurate this report will become.
AECOM obtains the igures used to create the TEA/AECOM Theme Index and
Museum Index through a variety of sources,
including statistics furnished directly
by the operators, historical numbers,
inancial reports, the investment banking community, local tourism organizations, and
professional estimates where necessary.
The global market is studied as a whole,
and each of its main regions is also studied
separately: the Americas, EMEA, and Asia.
For a theme park or water park to be
included in the report, at a minimum the
property must be gated (entry ticket
required) and the park generally must
be focused on the visitor experience.
To be included on the top chains list, a
chain operator must have theme parks in
its portfolio.
Frequently Asked Questions
Why should parks share their numbers? When operators share their information it is good for the industry. It ties directly
into re-investing wisely in ways that bring in more attendance and more repeat
visitation, driving revenue and proits. Tracking diferences and luctuations in attendance helps the industry recognize
what drives changes in attendance.
Knowing what works, what doesn’t work
— and where and why — allows operators
to make wise investment decisions and to
know what results can be expected. That’s
the heart of market and feasibility analysis.
Do some operators exaggerate in order to look more successful? What can you do about that?Our role is to share what the industry
operators say oicially or, if that information is not provided, to share our best estimate
based on information that we do know as
well as our professional experience. It’s
ABOUT THIS STUDY

79
possible that some are over-reporting their numbers. We can’t control that. However, all of the major operators are publicly
owned and therefore obliged to report total
attendance and inancial performance information at the corporate level, even if
they don’t break it down to the park level.
Over-reporting may get an operator temporarily higher on the list than its
competitors, but it will cause problems,
some in the near term and others down the
road. In the near term, if attendance is up
but revenues or proitability are not, it raises questions. In the longer term, eventually,
they’ll hit a point where the numbers are
too far of to be believable. Misrepresenting also complicates the picture if the company
eventually goes public, or is acquired or
wants to sell of an individual property. Operators know this.
Misreporting also raises false expectations.
If you’re trying to make an investment
decision and forecast future performance,
you need accurate information. If a property
is not investing in regular improvements, yet
reports that numbers are stable or growing,
the numbers are suspect. Moreover, it’s
not the kind of secret that can be kept
for long. People move from one operator
to another and they take that knowledge
with them. Consultants are called upon to
help interested parties evaluate ongoing
operations as well as potential new
investments and activities.
In other words, over-reporting will eventually come to a point of correction. Our advice is
to trust the process.
How do you estimate igures for individual parks and museums that don’t report them?Fortunately, with more than 50-years experience working in the attractions
industry, AECOM’s Economics practice
has a strong understanding of what
drives performance at the park level and
a robust process to estimate attendance
where necessary.
The following outlines our general process:
– We start by reviewing publicly available information about the performance of the
multi-park/attraction operators and also the individual parks/museums. We also review information that we have collected
as part of the previous year’s report and
throughout the year.
– Where park/museum-level information is missing, we then ask the multi-park operators and the individual parks/
museums to provide us with their
attendance igures, and many of them do so directly.
– Where we do not receive speciic park/museum-level igures from the operator, we use a detailed methodology
that considers the following: historic
attendance trends at the park/museum;

80
generally available information on the park/
museum and/or operator; park/museum
changes, such as new rides, areas, shows,
exhibits, ticket prices, intellectual property
connections, etc.; general economy of
the nation and the speciic metropolitan area; tourism trends nationally and in the
metropolitan area; for parks, weather
trends in the area, particularly during
peak periods; the performance of nearby
parks/museums and other attractions;
media coverage about the operator/park/
museum; and select factors as relevant.
– Park/museum operators are also given
the opportunity to review and comment
on AECOM’s estimate before the Theme
Index and Museum Index are inalized and published. Of those that don’t provide
oicial igures at the park/museum level, we generally receive some form
of feedback regarding the individual
parks/museums. Leadership at TEA (the
Themed Entertainment Association,
which publishes and helps edit the
report) plays an important role here,
encouraging responses.
– As the leading provider of business
planning studies worldwide for attractions,
our group also works frequently with all of
the major operators, parks, and museums,
providing us with the opportunity to
periodically compare our estimates with
actual exact igures. We use this to adjust our methodology where necessary.
– As part of our active work in these
markets and our awareness of what drives
performance and the macroeconomics of
diferent countries, we visit the parks and museums, watching for new development
and trends. We help to bring professional processes to the industry so that a
higher level of quality can be transmitted
from more developed markets into
emerging markets. We frequently work for operators who are looking to enter
the attractions business, or to grow or
improve their existing operations. We also team with attraction master planners and
designers to help correctly position and
right-size parks and museums to match their market potential and optimize their
inancial performance.
What causes wide swings in performance at parks and museums?As can be seen from the process outlined
above, there are a lot of factors afecting the performance of a park or museum,
including past performance, new oferings, the economy, tourism, weather, media
coverage, management, and more.
Typically, large changes in attendance, up or
down, are driven by major changes in one or
more of these factors, with the relationship
between the two frequently clear when
examined in detail.
How is a water park deined for the purposes of the Theme Index?A water park must have a minimum of three
water slides / lumes, a wave pool, retail and food areas, and at least two of the following
other elements: tube rides; free-form pool; lazy river; and kids water play area. In Asia
and America, the water parks are deined as outdoor facilities.

81
Why aren’t other attraction types included, such as zoos and aquariums, observation experiences, and sports and performance venues?The report has evolved over the years,
starting as just a report on major U.S. theme
parks, with additional regions (EMEA, Asia,
Latin America) and attraction types (water
parks, museums) added over time. That
said, we are indeed considering additional
attraction types and will include these as
interest is shown and resources allow.
Is the Asian market on a path to saturation? So many projects are being announced.China still has quite a way to grow as do
South East and South Asia. Demand from
the market, population and tourism are all in
a growth cycle. Smarter players understand
the potential and the market is moving up
to a better quality product. This is a boom
time and likely to continue for another ive years — and within it there will be great
successes and failures. There will always
be projects that don’t succeed for one
reason or another, such as poor concept,
poor location, or under funding. There will
be failures in the market when projects are
done for the wrong reasons.
How can so much growth (in Asia) be sustained?In China alone, there are about 200 cities
with a population of one million or higher.
That’s not even considering Beijing or
Shanghai. In the U.S., virtually every city with
the equivalent population has a theme park
or water park or similar kind of attraction.
By this gauge, it is not surprising that China
alone can support signiicant numbers of new parks.
How does Asia’s growth compare to the way the theme park industry developed in the U.S.?The diference is the scale and rapidity of growth, which is currently fueled by rapidly
increasing income levels and a growing
middle class. The development is also
driven by government, which sees tourism,
culture and theme parks as a good industry
bet compared to smokestack industries.
Growing the service economy, domestic
tourism and domestic consumption
are seen as employment generators.
Government on all levels are encouraging
the development of the themed
entertainment industry in China and Asia.
At what point will the Asian market overtake The Americas? We’ve forecast that will happen by 2020. It may be a little earlier than that; once we
see Disney Shanghai and Universal Beijing
open, we may revise the forecast.
82
aecom.com/themeindex aecom.com/museumindex
teaconnect.orgaecom.com 1.3
Both AECOM and TEA express thanks to the numerous park and museum operators who graciously and generously furnished attendance information and imagery, enabling this report to be as complete, accurate, and informative as possible.
About AECOMAECOM is built to deliver a better world. We design, build, inance and operate infrastructure assets for governments, businesses and organizations in more than 150 countries. As a fully integrated irm, we connect knowledge and experience across our global network of experts to help clients solve their most complex challenges. From high-performance buildings and infrastructure, to resilient communities and environments, to stable and secure nations, our work is transformative, diferentiated and vital. A Fortune 500 irm, AECOM had revenue of approximately $18 billion during iscal year 2015. See how we deliver what others can only imagine at aecom.com and @AECOM.About TEAThe TEA (Themed Entertainment Association) is an international, nonproit membership association, founded in 1991 and based in Burbank, California USA. TEA represents some 10,000 creative specialists, from architects to designers, technical specialists to master planners, scenic fabricators to artists, and builders to feasibility analysts working in more than 1,250 irms in 40 diferent countries. TEA presents the annual Thea Awards and TEA Summit and hosts the annual SATE conference on Experience Design. TEA also produces a variety of print and electronic publications, and is pleased to collaborate with AECOM for the 10th consecutive year on the TEA/AECOM Theme Index and Museum Index. www.teaconnect.org, @TEA_Connect