2015-2016 - sgwater.com.au · plc programmable logic controller: ... 3.8.9 other organic chemicals...
TRANSCRIPT

CAMERON LAIDLAW 1
ANNUAL DRINKING WATER QUALITY REPORT
2015-2016

2
Glossary of Terms
ADWG 2011 Australian Drinking Water Guidelines 2011; published by the National Health and Medical
Research Council and the National Resource Management Ministerial Council
Chlorine An element commonly used as a disinfectant in water treatment
Chloramine A compound of chlorine and ammonia commonly used for disinfection in water treatment
Coliforms A general term for certain types of rod-shaped bacteria that share identifying
characteristics.
Cyanobacteria Photosynthetic aquatic bacteria commonly referred to as 'blue-green algae' (though not
actually algae).
DELWP Department of Environment, Land, Water and Planning, Victoria
DWMS Drinking Water Management System
'the Department' Department of Health and Human Services, Victoria. (Formerly the Department of Health)
E. coli Escherichia coli: thermotolerant bacteria used as an indicator of faecal contamination
HACCP Hazard Analysis and Critical Control Point
< 'Less than' (mathematical term)
> 'Greater than' (mathematical term)
L Litre: a unit of volume (equal to 1000 cubic centimetres)
mg/L Milligrams per litre: a unit of concentration (one milligram is equal to 0.001 grams)
ML Megalitres: a unit of volume (one megalitre is equal to one million litres)
NATA National Association of Testing Authorities
N/A Not applicable
Ng/L Nanograms per Litre: a unit of concentration (one ng is equal to 0.000000001 grams)
NHMRC National Health and Medical Research Council
Orgs/100mL Organisms/per 100 millilitre of water: a unit of measurement used in microbiology
Pathogen Disease-causing microorganism
PAC Powdered activated carbon
PLC Programmable logic controller: a digital computer used for automation of
electromechanical processes
RMP Risk Management Plan
'the Act' Safe Drinking Water Act 2003
'the Regulations' Safe Drinking Water Regulations 2005 or Safe Drinking Water Regulations 2015
depending on context.
SGW South Gippsland Water (South Gippsland Region Water Corporation, ‘the Corporation’)
WIMS Water Information Management Solutions

3
TABLE OF CONTENTS
Glossary of Terms__________________________________________________________________________2 Managing Directors Message_________________________________________________________________4 1. Introduction_______________________________________________________________________ 5 1.1 Characterisation of the System_________________________________________________________6 2. Water treatment and quality management system________________________________________8 2.1 Water Treatment ___________________________________________________________________ 8 2.2 Water Treatment Issues_____________________________________________________________ 11 2.3 Quality Management systems and continual improvement_________________________________ 11 3. Quality of drinking water for 2005-201613______________________________________________13 3.1 Water Quality Monitoring____________________________________________________________13 3.2 Escherichia coli (E.coli): Results and Actions______________________________________________16 3.3 Chlorine-based disinfection by products_________________________________________________16 3.4 Ozone-based disinfection byproduct chemicals___________________________________________23 3.5 Aluminium: Results and Actions_______________________________________________________ 23 3.6 Turbidity__________________________________________________________________________25 3.7 Fluoride__________________________________________________________________________ 26 3.8 Other Algae, pathogen, chemical or substance that may pose a risk to human health_____________28 3.8.1 Arsenic___________________________________________________________________________ 28 3.8.2 Copper___________________________________________________________________________ 29 3.8.3 Cyanogen chloride__________________________________________________________________ 30 3.8.4 Lead_____________________________________________________________________________ 31 3.8.5 Manganese_______________________________________________________________________ 32 3.8.6 Nitrate and Nitrite__________________________________________________________________ 33 3.8.7 N-Nitrosodimethylamine (NDMA) _____________________________________________________ 34 3.8.8 Other inorganic chemicals____________________________________________________________35 3.8.9 Other organic chemicals_____________________________________________________________ 36 3.8.10 Raw water monitoring_______________________________________________________________37 3.8.11 Radiological parameters_____________________________________________________________ 38 3.9 Aesthetics_________________________________________________________________________39 3.9.1 Alkalinity__________________________________________________________________________39 3.9.2 Colour____________________________________________________________________________41 3.9.3 Hardness__________________________________________________________________________42 3.9.4 Iron______________________________________________________________________________43 3.9.5 pH_______________________________________________________________________________44 3.10 Analysis of results__________________________________________________________________ 45 3.10.1 Three-year comparison of results for parameter in Schedule 2 of the Safe Drinking Water Regulations
2005_____________________________________________________________________________45 3.10.2 Three-year comparison of results for water quality parameters______________________________48 4. Emergency incident management_____________________________________________________49 4.1 Incidents reported under section 22 of the Act___________________________________________49 4.2 Other reported events: Section 18 events and Blue-green algae blooms reported to DELWP_______52 5. Complaints relating to water quality 2015-2016__________________________________________53 5.1 Complaints for 2015-2016____________________________________________________________53 5.2 Management of complaints___________________________________________________________53 5.2.1 Discoloured water__________________________________________________________________ 54 5.2.2 Taste and odour____________________________________________________________________54 5.2.3 Air in water________________________________________________________________________55 5.2.4 Other complaints___________________________________________________________________ 55 6. Findings of most recent risk management audit__________________________________________56 7. Undertakings under Section 30 of the Safe Drinking Water Act 2003_________________________ 57 8. Further Information________________________________________________________________ 57 Appendix A. South Gippsland Water Drinking Water Policy_______________________________________ 58 Appendix B. Risk Management Plan Regulatory Audit Certificate and opportunities for improvement____ 59

4
Managing Director’s Message
I am pleased to present the South Gippsland Water - Water Quality Report for 2015-16. South Gippsland Water operates ten
separate water supply systems within
open catchment areas that total
approximately 1,234 square kilometres.
Through the South Gippsland Water -
Water Quality program the Corporation continues to deliver safe, reliable water services across the
region in what has, at times, been a challenging year.
During the 2015-16 reporting period the water quality program was subject to two sets of Safe
Drinking Water regulations. The Safe Drinking Water Act 2005 applied from the 1st July 2015 until its
expiry on the 17th July 2015, followed by the Safe Drinking Water Regulations 2015 that applied from
the 18th July 2015 to the 30th June 2016.
Dry conditions throughout the 2015-16 spring, summer and autumn periods saw staged restrictions
placed on three of the Corporations water systems – Little Bass Water Supply System (Poowong,
Loch and Nyora), Coalition Creek Water Supply System (Korumburra) and Battery Creek Water
Supply System (Fish Creek). Close monitoring of not only quantity but the quality of the water was
paramount in these circumstances. A key aim of the Corporation is to manage each system in an environmentally sustainable and cost effective way. South Gippsland Water achieved 100% water quality compliance for the reporting period, highlights include:
100% water quality compliance
26,854 contracted water quality samples collected and analysed from across the South Gippsland Region, of these:
9,658 samples obtained from the point of supply to customers
1,144 tested for microbiological contamination
100% Compliance with all prescribed standards of the Safe Drinking Water Regulations.
An additional achievement was the successful completion of the biennial Drinking Water Risk Management Plan Audit. A detailed process that provides confirmation of South Gippsland Water meeting key obligations under the Safe Drinking Water Act. I would like to thank all South Gippsland Water staff for their continued dedication and professionalism. The provision of safe, reliable water services to our customers is a priority for the Corporation now and into the future. Philippe du Plessis Managing Director

5
1 INTRODUCTION
At South Gippsland Water we are committed to the management of our water supply systems for the provision of safe, high-quality drinking water to all customers.
Welcome to South Gippsland Water’s annual water quality report for the period 1st July 2015 to 30th June 2016. In accordance with requirements of the Safe Drinking Water Act 2003 (the Act), this report summarises our performance against water quality standards, provides an overview of our management practices, and describes how we respond to water quality challenges as they arise.
As part of South Gippsland Water's commitment to quality, we maintain a drinking water management system based on Hazard Analysis and Critical Control Point (HACCP) principles and the Australian Drinking Water Guidelines1. The system incorporates a catchment-to-tap monitoring program to ensure drinking water consistently meets legislative requirements of the Act and associated Safe Drinking Water Regulations (the Regulations). More information on water treatment, quality management systems and operational improvements for 2015-16 can be found in part 2 of this report.
For the 2015-16 financial year, we are pleased to advise that drinking water supplied in South Gippsland Water’s 19 localities complied with the prescribed standards of the Safe Drinking Water Regulations 2005 for the period 1st July 2015 to 17th of July 2015 for Escherichia coli (E. coli), chloroacetic acids, aluminium and turbidity. Additionally, the drinking water supplied from 18th July 2015 through to 30th June 2016 under the Safe Drinking Water Regulations 2015 also complied with the prescribed standards for Escherichia coli and turbidity. Part 3 of this report provides a summary of results from our comprehensive monitoring program, while part 4 outlines corrective actions taken to resolve water quality issues.
Customers are integral to us at South Gippsland Water and we strive to meet expectations in terms of supplying water that is not only safe to drink but also aesthetically-pleasing. We aim to provide a prompt and helpful service in response to water quality concerns. For details on the number of customer calls received in relation to water quality in 2015-16, as well as general information on how complaints are addressed, please refer to part 5.
In relation to overall efficiency optimisation, 2015 – 2016 has been a progressive year for the continued implementation of the Water Information Management Solutions (WIMS) across all of South Gippsland Water’s 10 water treatment facilities. The WIMS system is a software package designed for drinking water systems which combines water system data sources to a central, secure database, optimising water operations and providing the tools needed for electronic and paper reporting, analysis and monitoring.
We hope that you find this report informative and invite you to contact our customer service department by telephoning 03 5662 0444 or emailing [email protected] if you require additional information on anything presented within.
1 National Health and Medical Research Council and National Resource Management Ministerial Council Australian Drinking Water Guidelines 2011

6
1.1 Characterisation of the System
The service area of South Gippsland Water (SGW) covers approximately 4,000 square kilometres of the South Gippsland region, from Wonthaggi in the west to Yarram in the east. Drinking water is supplied to 22 rural centres via ten separate supply systems; refer to Figure 1 (map).
The total water supply operation for 2015-16 comprised:
1,234 square kilometres of total catchment area
13 reservoirs and 4 raw water storage basins or tanks
10 water treatment plants
25 treated water distribution storages
15 water pump stations
699 kilometres of water mains
4,642 megalitres (million litres) of metered water supplied to customers
Separate water sampling localities in South Gippsland Water have been formally gazetted by the Department of Human Services in a notice in the Victoria Government Gazette Special Edition No. S193 on 3rd August 2006. Information on localities and water supply systems is provided in Table 1. There have been no major changes in arrangements with respect to water supply since the previous reporting period.
Table 1: SGW water sampling localities and supply sources
2 Population estimates based on Australian bureau of Statistics (ABS) 2011 census updated with Department of Environment, Land, Water and Planning (DELWP) local government area growth factors for period 2011-16 of 2.1% for Bass Coast Shire, 0.4% for South Gippsland Shire, and 0.2% for Wellington Shire. Where no specific ABS data available for serviced locality, population has been estimated from number of connected properties and ABS statistics for average number of people per household.
Water treatment plant
Localities supplied
Population serviced2
Principal raw water supply sources
Supplementary raw water supply sources
Raw water storage
Devon North Alberton Yarram
510 2,240
Tarra River Gippsland Basin groundwater aquifer (via bore, Devon North)
Devon North Raw Water Basin
Dumbalk Dumbalk 260 Tarwin River (east branch) Dumbalk Raw Water Tank
Fish Creek Fish Creek 510 Battery Creek Battery Creek Reservoir
Foster Foster 1,110 Deep Creek Deep Creek Reservoir; Foster Dam; Foster Raw Water Basin.
Korumburra Korumburra 3,410 Coalition Creek; Bellview Creek; Ness Creek.
Tarwin River (west branch)
Coalition Creek Reservoir; Bellview Reservoir; Ness Gully Reservoir.
Lance Creek
Cape Paterson Inverloch Lance Creek Wonthaggi
760 4,620
120 7,560
Lance Creek Lance Creek Reservoir
Leongatha Koonwarra Leongatha
190 4,990
Ruby Creek
No. 1 Reservoir; No. 2 Reservoir; Hyland Reservoir (No. 3); Western Reservoir (No. 4).
Meeniyan Meeniyan 460 Tarwin River Meeniyan Raw Water Basin
Poowong Loch Nyora Poowong
280 710 320
Little Bass River Little Bass Reservoir
Toora Port Franklin Port Welshpool Toora
450
630 450
Agnes River Cooks Dam

7
Figure 1: South Gippsland Water supply area and systems

8
2. WATER TREATMENT AND QUALITY MANAGEMENT SYSTEMS
2.1 Water Treatment
Conventional water treatment is a process whereby water is purified to a level suitable for human consumption prior to being disinfected. In general, raw water is either collected in a reservoir or pumped from a river to a settling basin, where natural sedimentation of large particulate matter occurs. As smaller particles and dissolved substances will not settle out of the water within a practical timeframe, chemical agents must be added to precipitate and coagulate them into larger insoluble masses known as floc. The water can then be clarified by gravity settling or flotation of the floc, followed by filtration through a granular medium. Chemical disinfectants are added to the treated water product to destroy any microorganisms that may remain.
A summary of the processes by which the drinking water supplied by South Gippsland Water (SGW) is treated and disinfected is provided in Table 2. There have been no major changes in water treatment processes since the 2014-15 reporting period.
Table 2: List of processes and chemicals used to treat and disinfect water supplied by SGW
Water Treatment Plant
Localities supplied
Treatment process Treatment frequency
Added substances
Devon North Alberton Yarram
Pre-treatment pH correction Manganese oxidation Coagulation and flocculation Dissolved air flotation clarification Filtration by granular medium Chloramine disinfection Dewatering of waste water
As required As required Regular Regular Regular Regular Regular
Sodium carbonate Potassium permanganate Aluminium sulphate - - Sodium hypochlorite and ammonia -
Dumbalk Dumbalk
Pre-treatment pH correction Manganese oxidation Coagulation and flocculation Sedimentation clarification Filtration by granular medium Ultraviolet (UV) disinfection Primary chlorination disinfection Secondary chlorination disinfection Removal of volatile organics by aeration Dewatering of waste water
Regular As required As required Regular Regular Regular Regular Regular Regular Regular
Sodium carbonate Potassium permanganate Polyaluminium chloride - - - Sodium hypochlorite Sodium hypochlorite - Anionic polyacrylamide
Fish Creek
Fish Creek
Pre-treatment pH correction Manganese oxidation Coagulation and flocculation Sedimentation clarification Filtration by granular medium Post-treatment pH correction Primary chlorination disinfection Removal of volatile organics by aeration Secondary chlorination disinfection Dewatering of waste water
Regular As required Regular Regular Regular Regular Regular Regular Regular Regular
Sodium carbonate Potassium permanganate Aluminium sulphate - Anionic polyacrylamide* Sodium carbonate Sodium hypochlorite - Sodium hypochlorite -

9
Water Treatment Plant
Localities supplied
Treatment process Treatment frequency
Added substances
Foster Foster
Taste and odour control Pre-treatment pH correction Manganese oxidation Coagulation and flocculation Sedimentation clarification Filtration by granular medium Post-treatment pH correction Primary chlorination disinfection Secondary chlorination disinfection Dewatering of waste water
As required Regular As required Regular Regular Regular Regular Regular Regular Regular
Powdered activated carbon Sodium carbonate Potassium permanganate Aluminium sulphate - - Sodium carbonate Chlorine (gas) Sodium hypochlorite -
Korumburra
Korumburra
Taste and odour control Pre-treatment pH correction Manganese oxidation Coagulation and flocculation Sedimentation clarification Filtration by granular medium Manganese sequestration Primary chlorination disinfection Secondary chlorination disinfection Dewatering of waste water
As required Regular As required Regular Regular Regular As required Regular Regular Regular
Powdered activated carbon Sodium carbonate Potassium permanganate Aluminium chlorohydrate Cationic polyacrylamide* - Sodium hexametaphosphate Chlorine (gas) Chlorine (gas) -
Lance Creek
Cape Paterson Inverloch Lance Creek Wonthaggi
Taste and odour control Pre-treatment pH correction Manganese oxidation Coagulation and flocculation Dissolved air flotation clarification Filtration by granular medium Post-treatment pH correction Chloramination disinfection Fluoridation Dewatering of waste water
As required As required As required Regular Regular Regular Regular Regular Regular Regular
Powdered activated carbon Sodium hydroxide / hydrochloric acid Potassium permanganate Aluminium sulphate - - Sodium hydroxide Chlorine (gas) and ammonia Hexafluorosilicic acid Anionic polyacrylamide
Leongatha Koonwarra Leongatha
Taste and odour control Pre-treatment pH correction Manganese oxidation Coagulation and flocculation Sedimentation clarification Filtration by granular medium Post-treatment pH correction Primary chlorination disinfection Secondary chlorination disinfection Dewatering of waste water
As required Regular As required Regular Regular Regular Regular Regular Regular Regular
Powdered activated carbon Sodium hydroxide Potassium permanganate Aluminium sulphate - - Sodium hydroxide Chlorine (gas) Chlorine (gas) Anionic polyacrylamide
Meeniyan Meeniyan
Manganese oxidation Coagulation and flocculation Sedimentation clarification Filtration by granular medium Chlorination disinfection Ultraviolet (UV) disinfection Removal of volatile organics by aeration Dewatering of waste water
As required Regular Regular Regular Regular Regular Regular Regular
Sodium hypochlorite Aluminium chlorohydrate Anionic polyacrylamide* - Sodium hypochlorite - - Anionic polyacrylamide
Poowong Loch Nyora Poowong
Taste and odour control Pre-treatment pH correction Manganese oxidation Coagulation and flocculation Sedimentation clarification Filtration by granular medium Post treatment pH correction Chloramination disinfection Dewatering of waste water
As required As required As required Regular Regular Regular Regular Regular Regular
Powdered activated carbon Sodium carbonate Potassium permanganate Aluminium sulphate Anionic polyacrylamide* - Sodium hypochlorite Sodium hypochlorite and ammonia -
Table 2: List of processes and chemicals used to treat and disinfect water supplied by SGW continued…

10
Water Treatment Plant
Localities supplied
Treatment process Treatment frequency
Added substances
Toora Port Franklin Port Welshpool Toora
Taste and odour control Pre-treatment pH correction Manganese oxidation Coagulation and flocculation Sedimentation clarification Filtration by granular medium Post treatment pH correction Chlorination disinfection Dewatering of waste water
As required As required As required Regular Regular Regular Regular Regular Regular
Powdered activated carbon Sodium carbonate Potassium permanganate Aluminium sulphate - - Sodium hypochlorite Chlorine (gas) -
*Polyacrylamide used as a floc aid, filter aid or sludge-thickening agent when required.
Table 2: List of processes and chemicals used to treat and disinfect water supplied by SGW continued…

11
2.2 Water Treatment Issues
Occasionally issues arise out of the application of water treatment processes and corrective actions must be taken. The use of aluminium salts as coagulating agents may lead to aluminium being present in supplied drinking water at higher than acceptable levels. Process monitoring and 'jar tests' that simulate plant conditions in the laboratory are used to ensure correct dosage of chemicals and enable optimisation of treatment processes in response to changes in raw water quality and other factors. There were no Aluminium exceedances to report under the Safe Drinking Water Regulations 2005 for the period July 1, 2015 to July 17, 2015. An exceedance of the Australian Drinking Water Aesthetic Guidelines guideline occurred for the locality of Meeniyan in June 2016. This was caused by optimisation difficulties at the water treatment plant. Refer to Section 3.5.3 and 3.5.4 of this report for further information.
2.3 Quality management systems and continual improvement
The risk management approach adopted by South Gippsland Water for the provision of safe drinking water is based on the twelve elements of the 'Framework for Management of Drinking Water Quality', as described in the Australian Drinking Water Guidelines 2011. Incorporated into the risk management system are a number of on-going programs and practices designed to ensure treatment plants are operating optimally at all times, and treated water within distribution systems is both protected from external contamination and remains aesthetically pleasing to customers; examples are as follows:
Filter management program
Backflow prevention program
Regular site security checks of all water treatment facilities and distribution system water storages
Procedures in relation to hygienic mains break repair and replacement
Proactive mains flushing and air-scouring programs
Hydrant replacement program
The risk management system also includes a commitment to continual improvement, with the aim of achieving best practice in the delivery of drinking water to customers. Training, attendance at seminars, and membership of peak industry bodies (including the Australian Water Association, the Water Industry Operators Association, and the Water Services Association of Australia) ensure all employees involved in water treatment and quality assurance are kept abreast of drinking water related research, and advances in technologies and practices.
Suggestions for improvement are documented in the Drinking Water Management System (DWMS) improvement plan register. The register is reviewed at regular DWMS committee meetings with items being prioritised, actioned, and included in capital works plans where appropriate. Major improvements achieved in 2015-16 are outlined below.
2.3.1 Continued implementation of the WIMS Water Information Management System The 2015-16 year has seen the continued implementation of an advanced water information management system for South Gippsland Water. The software package allows for efficient collection and secure storage of water quality and operational data. It includes a large array of features and tools to facilitate treatment plant control, analysis of information, and preparation of reports. Once fully implemented, improvements in terms of efficiencies and whole water system management will be the result.

12
2.3.2 Drone Technology Investigations An unmanned aerial vehicle (UAV) or drone is a remotely controlled flying aircraft. In order to utilise this new technology, staff at SGW are currently investigating the potential benefits of using drones in several key water quality and operational maintenance areas. Areas at South Gippsland Water (SGW) where drone technology could be of benefit include:
Accurately creating an up to date visual imagery in our Geographic Information System (GIS)
Creating a visual record of asset condition or status with repeatable high resolution image collection
Tower/asset inspections, eliminate OHS risk by avoiding the hazard e.g. working at height
Catchment monitoring and surveillance
Dam surveillance and algae monitoring. Incorporating drone use with current methods of algae monitoring will allow SGW to collect real time data, accurately detect and locate algae quickly and allow for more effective spot treatment of blooms. The development of a NDVI (Normalized Difference Vegetation Index) is being investigated also and may allow for the location of algal blooms to be accurately detected before they become visually detectable. The images below provide examples of drone generated images in relation to water quality infrastructure.
Image 1: SGW Water Tower Roof Inspection
Image 2: Ness Gully Reservoir – Leongatha Supply

13
3. QUALITY OF DRINKING WATER FOR 2015-16
3.1 Water Quality Monitoring
During the 2015-16 reporting period, South Gippsland Water implemented water quality monitoring programs consistent with requirements of the Safe Drinking Water Act 2003 (the Act). As specified in the Safe Drinking Water Regulations 2005, samples must be collected from the drinking water supply at relevant frequencies and analysed for performance against water quality standards as shown in Table 3. Table 4 illustrates the water quality standards applicable to the Safe Drinking Water Regulations 2015, which came into effect on July 18, 2015.
Table 3: Drinking water quality standards and required sampling frequencies (Safe Drinking Water Regulations 2005)
Parameter Relevant sampling frequency for each water sampling locality
Quality standard for each water sampling locality
Microbiological organisms:
Escherichia coli One sample per week At least 98% of all samples of drinking water collected in any 12-month period contain no Escherichia coli per 100 millilitres of drinking water
Chlorine-based chemicals: Chloroacetic acid One sample per month 0.15 milligrams per litre of drinking water
Dichloroacetic acid One sample per month 0.1 milligrams per litre of drinking water
Trichloracetic acid One sample per month 0.1 milligrams per litre of drinking water
Trihalomethanes (total) One sample per month 0.25 milligrams per litre of drinking water
Chemicals derived from treatment with ozone:
Bromate* One sample per month 0.02 milligrams per litre of drinking water
Formaldehyde* One sample per month 0.5 milligrams per litre of drinking water
Aluminium-based chemicals: Aluminium (acid-soluble) One sample per month 0.2 milligrams per litre of drinking water
Other parameters:
Turbidity One sample per week 95% upper confidence limit of the mean of samples of drinking water collected in any 12 month period must be less than or equal to 5.0 Nephelometric Turbidity Units
*As South Gippsland Water does not use ozone for treatment or disinfection, analysis for the ozone-derived chemicals of bromate and
formaldehyde is not required and has not been conducted in the 2015-16 reporting period.

14
Table 4: Drinking water quality standards and required sampling frequencies as defined in Schedule 2 of the (Safe Drinking Water Regulations 2015)
Parameter Relevant sampling frequency for each water sampling locality
Quality standard for each water sampling locality
Microbiological organisms:
Escherichia coli One sample per week All samples of drinking water collected are found to contain no Escherichia coli per 100 millilitres of drinking water, with the exception of any false positive sample. Please refer to Schedule 2 Regulation 12 of the Safe Drinking Water Regulations 2015.
Chlorine-based chemicals: Trihalomethanes (total) One sample per month 0.25 milligrams per litre of drinking water
Other parameters:
Turbidity One sample per week The 95th percentile of results for samples in any 12 month period must be less than or equal to 5.) Nephelometric Turbidity Units.
The Safe Drinking Water Regulations 2015 also states that if the drinking water contains an algal toxin, or any other pathogen, or any substance or chemical not specified in the table above, that the water does not contain that toxin, pathogen, substance or chemical, whether alone or in combination with another toxin, pathogen, substance or chemical, in such amounts that may pose a risk to human health.
3.1.1 Disinfection by-product sampling frequency ch anges
In accordance with regulation 11 of the Safe Drinking Water Regulations 2005, a water supplier may apply to vary the frequency at which samples of drinking water are collected within a water sampling locality for a specified parameter as listed in Table 3 (above).
Based on long-term (ten years) recorded low levels from monthly monitoring, and risk review of the water treatment and supply systems, South Gippsland Water determined that future non-compliance with the regulatory standards for chloroacetic acid, dichloroacetic acid and trichloroacetic acid for any of its supply systems is extremely unlikely. Similarly, historical data and risk assessment indicated that the probability of non-compliance with the standard for the chlorine-based trihalomethanes is also very low in water supply systems where chloramine (rather than chlorine) is used as the disinfectant in water treatment.
With a view to reducing analysis costs so that savings could ultimately be passed on to customers by way of water rate reductions, in 2014 South Gippsland Water applied to the Secretary to the Department of Health and Human Services for variations to sampling frequencies as follows:
Reduction in monitoring for chloroacetic acid, dichloroacetic acid and trichloroacetic acid from monthly to quarterly (every three months) for all South Gippsland Water localities
Reduction in monitoring of trihalomethanes (total) from monthly to quarterly for all chloraminated supply systems; namely: Alberton, Cape Paterson, Inverloch, Lance Creek, Loch, Nyora, Poowong, Wonthaggi and Yarram
The applications were assessed and approved by the Secretary, and variation notices were published in the Victoria Government Gazettes S 260 (dated 1st Aug, 2014) and S 266 (dated 8th Aug, 2014).

15
3.1.2 E. coli and turbidity sampling changes
Additionally, prior to September 2014, South Gippsland Water collected samples for E. coli and turbidity monitoring in excess of the one per week per locality as specified in the Regulations (refer to table 3) for the localities of Inverloch, Korumburra, Leongatha, Port Franklin, Toora and Wonthaggi. This monitoring was part of a pro-active risk management strategy based on population size and water supply distribution system characteristics. Following risk review and long-term overall compliance with the relevant water quality standards for Korumburra, Leongatha, Port Franklin, Toora and Wonthaggi, it was determined that monitoring in addition to the amount specified in the standard for these localities could be reduced. Refer to Tables 4 and 10 on following pages for details of sampling frequency changes.
3.1.3 Other Monitoring
In addition to regulatory compliance monitoring, South Gippsland Water also conducted water quality monitoring for specific parameters based on the health and aesthetic considerations detailed in the Australian Drinking Water Guidelines 2011. All water samples collected as part of South Gippsland Water's monitoring programs were independently analysed by a National Association of Testing Authorities (NATA) certified laboratory.
3.1.4 Analysis Results
Results of analysis for 2015-16 are summarised in Tables 4 to 28 on the following pages.
Section 23 of the Act requires that a water supplier make available for inspection by the public the results of any water quality monitoring program that is conducted on any drinking water it supplies. Customers and members of the public may access drinking water quality data by telephoning South Gippsland Water Customer Service on (03) 5662 0444, or by emailing [email protected]

16
3.2 Escherichia coli
Escherichia coli (E. coli) is used as a specific indicator of faecal contamination to determine the safety of water for drinking. The Safe Drinking Water Regulations 2005, which applied for the period 1st July 2015 to 17th July 2015, specify that at least 98% of all samples of drinking water collected in a 12-month period contain no E. coli per 100 mL of drinking water.
For the period 18th July 2015 to 30th June 2016, the Safe Drinking Water Regulations 2015 applied to E. coli monitoring. For the quality standard for each water sampling locality to be met with respect to E. coli, then all samples of drinking water collected must have been found to contain no E. coli per 100 millilitres of drinking water, with the exception of any false positive sample. For the purposes of this quality standard, a false positive sample means a sample that is found, after an analysis conducted in accordance with regulation 14, to contain E. coli per 100 millilitres of drinking water, if—
a. following the analysis, the water supplier has conducted an investigation, which has been conducted in accordance with any guidelines issued by the Secretary in relation to such investigations, including any timeframes for commencement and completion of the investigations, to ascertain whether the results for the analysis are representative of water in the relevant sampling locality; and
b. the water supplier has reported the results of the investigation to the Secretary in relation to such reports, including any timeframes for provision of the report; and
c. the investigation has concluded that the results of the analysis conducted in accordance with regulation 14 were not representative of the water in the relevant water sampling locality because the investigation established that—
(i) all factors that would indicate the presence of E. coli in that water are not present in the water in the water sapling locality at the time of the investigation; and
(ii) the drinking water treatment process applied, or other specified actions taken by the water supplier, are such as would be reasonably expected to have eliminated the presence of E. coli in the water sampling locality at the relevant time; and
(iii) all plant and infrastructure associated with the water treatment process were operating to specification at all relevant times; and
(iv) there were no issues arising from degradation of plant or infrastructure in or around the relevant water sampling locality that could reasonably be suspected to have contributed to the presence of E. coli in the drinking water in that water sampling locality.
A sample analysed in accordance with regulation 14 that is found, on that analysis, to contain E. coli per 100 millilitres of drinking water is not a false positive sample unless all of the circumstances in paragraphs (a), (b) and (c) apply.
3.2.1 Results: Escherichia coli
Monitoring for E. coli for the entire 2015-16 reporting period was conducted in accordance with South Gippsland Water’s risk-based monitoring program. The program specifies which sites are to be sampled and at what frequencies. Samples for E. coli analysis are collected weekly from dedicated customer tap sites in all localities as required by safe drinking water regulations. Other sites in distribution systems, such as at the outlets or inlets of clear water storage tanks, are also sampled on a weekly or less-frequent basis.
Compliance with the water quality standard for E. coli in the period 1st July to 17th July 2015 is based on customer tap sampling as specified in the Safe Drinking Water Regulations 2005. Results are presented in Table 4a.

17
Table 4a: Escherichia coli results for period 1st – 17th July 2015
Locality Sampling frequency
(samples per time period)
Total No. of samples
No. of samples
containing E. coli
Maximum result
(Orgs/100mL)
Percentage of samples
with no E. coli
Complying with SDWR
2005 (Yes/No)
Alberton 1/week 2 0 0 100% Yes
Cape Paterson 1/week 2 0 0 100% Yes
Dumbalk 1/week 2 0 0 100% Yes
Fish Creek 1/week 2 0 0 100% Yes Foster 1/week 2 0 0 100% Yes
Inverloch 2/week 4 0 0 100% Yes
Koonwarra 1/week 2 0 0 100% Yes
Korumburra 1/week 2 0 0 100% Yes
Lance Creek 1/week 2 0 0 100% Yes
Leongatha 2/week 4 0 0 100% Yes
Loch 1/week 2 0 0 100% Yes Meeniyan 1/week 2 0 0 100% Yes
Nyora 1/week 2 0 0 100% Yes
Poowong 1/week 2 0 0 100% Yes
Port Franklin 1/week 2 0 0 100% Yes
Port Welshpool 1/week 2 0 0 100% Yes
Toora 1/week 2 0 0 100% Yes
Wonthaggi 2/week 4 0 0 100% Yes Yarram 1/week 2 0 0 100% Yes
Compliance with the water quality standard for E. coli in the period 18th July 2015 to 30th June 2016 is based on all drinking water samples collected for a locality, i.e., clear water storage sites and customer tap sites, as required by the Safe Drinking Water Regulations 2015. A summary of results is presented in Table 4b.
Table 4b: Escherichia coli results for period 18th July 2015 to 30th June 2016
Locality Customer Tap
samples collected per week
Other drinking
water sites
collected per week
Total No. of samples
collected in compliance
period
Maximum result (Orgs/100mL
)
No. of E. coli detection
investigations conducted
No. of confirmed
false positives
No. of investigations where standard not met
Locality compliant
with SDWR 2015
(Yes/No)
Alberton 1 0 52 0 0 N/A N/A Yes Cape Paterson 1 1 104 2 1 1 0 Yes
Dumbalk 1 1 104 0 0 N/A N/A Yes
Fish Creek 1 1 104 0 0 N/A N/A Yes
Foster 1 1 104 0 0 N/A N/A Yes
Inverloch 2 1 156 0 0 N/A N/A Yes
Koonwarra 1 0 52 0 0 N/A N/A Yes
Korumburra 1 2 156 0 0 N/A N/A Yes Lance Creek 1 1 104 0 0 N/A N/A Yes
Leongatha 2 1 156 0 0 N/A N/A Yes
Loch 1 1 104 1 1 1 0 Yes
Meeniyan 1 1 104 0 0 N/A N/A Yes
Nyora 1 0 52 0 0 N/A N/A Yes
Poowong 1 2 156 0 0 N/A N/A Yes
Port Franklin 1 0 52 0 0 N/A N/A Yes Port Welshpool 1 0 52 0 0 N/A N/A Yes
Toora 1 1 104 0 0 N/A N/A Yes
Wonthaggi 2 2 208 0 0 N/A N/A Yes
Yarram 1 2 156 3 1 1 0 Yes

18
3.2.2 Actions undertaken in relation to non-compliance for E. coli
Drinking water supplied in all localities complied with the relevant water quality standards for E. coli. Following investigations, separate incidences of E. coli detection in the Yarram, Loch and Cape Paterson localities were determined to be false positives in accordance with the Safe Drinking Water Regulations 2015 standard for E.coli. The investigations are discussed in section 4.1 of this report.
3.3 Chlorine-based disinfection byproduct chemicals
Chlorine-based disinfection byproduct chemicals may be present in drinking water as a result of reactions between chlorine and naturally-occurring organic materials, such as humic and fulvic acids.
3.3.1 Results: Chlorine-based disinfection by-products
Monitoring for compliance with the water quality standards for chlorine-based disinfection byproduct chemicals was conducted in accordance with the Safe Drinking Water Regulations 2005, for the period July 01 2015 to July 17, 2015. With the introduction of the Safe Drinking Water Regulations 2015, SGW conducted a risk review for chlorine-based disinfection by-products. In 2014-2015 monitoring for chloroacetic acids took place on a quarterly basis. Following the review quarterly sampling was continued until March 2016 with annual monitoring then being introduced.
For the 2015-2016 reporting period samples were collected in September and December 2015 and March 2016. Therefore no further samples were collected in June 2016.
A summary of results for the chlorine disinfection by-products of chloroacetic acid, dichloroacetic acid, trichloroacetic acid and trihalomethanes (total) are provided in table 5, 6, 7 and 8 respectively.

19
3.3.1.1 Chloroacetic acid
The Safe Drinking Water Regulations 2005 specify that chloroacetic acid in drinking water should not exceed 0.15 mg/L.
Table 5: Chloroacetic acid results for 2015-16 financial year
Locality
Sampling frequency 1/7/15 to 30/6/16 (samples per time
period)
Total No. of samples
No. of non-complying samples
Minimum result mg/L
Maximum result mg/L
Complying with
regulation (Yes/No)
Alberton Sept/Dec/Mar 3 0 <0.005 <0.005 Yes
Cape Paterson 1/quarter 3 0 <0.005 <0.005 Yes
Dumbalk 1/quarter 3 0 <0.005 <0.005 Yes
Fish Creek 1/quarter 3 0 <0.005 <0.005 Yes
Foster 1/quarter 3 0 <0.005 <0.005 Yes
Inverloch 1/quarter 3 0 <0.005 <0.005 Yes
Koonwarra 1/quarter 3 0 <0.005 <0.005 Yes
Korumburra 1/quarter 3 0 <0.005 <0.005 Yes
Lance Creek 1/quarter 3 0 <0.005 <0.005 Yes
Leongatha 1/quarter 3 0 <0.005 <0.005 Yes
Loch 1/quarter 3 0 <0.005 <0.005 Yes
Meeniyan 1/quarter 3 0 <0.005 <0.005 Yes
Nyora 1/quarter 3 0 <0.005 <0.005 Yes
Poowong 1/quarter 3 0 <0.005 <0.005 Yes
Port Franklin 1/quarter 3 0 <0.005 <0.005 Yes
Port Welshpool 1/quarter 3 0 <0.005 <0.005 Yes
Toora 1/quarter 3 0 <0.005 <0.005 Yes
Wonthaggi 1/quarter 3 0 <0.005 <0.005 Yes Yarram 1/quarter 3 0 <0.005 <0.005 Yes

20
3.3.1.2 Dichloroacetic acid
The Safe Drinking Water Regulations 2005 specify that dichloroacetic acid in drinking water should not exceed 0.1 mg/L.
Table 6: Dichloroacetic acid results for 2015-16 financial year
Locality Sampling frequency 1/7/15 to 30/6/16 (samples per time
period)
Total No. of
samples
No. of non-complying samples
Minimum result mg/L
Maximum result mg/L
Complying with
regulation (Yes/No)
Alberton 1/quarter 3 0 <0.005 0.008 Yes
Cape Paterson 1/quarter 3 0 <0.005 0.005 Yes
Dumbalk 1/quarter 3 0 <0.005 0.013 Yes
Fish Creek 1/quarter 3 0 <0.005 0.009 Yes
Foster 1/quarter 3 0 <0.005 0.011 Yes
Inverloch 1/quarter 3 0 0.006 0.011 Yes
Koonwarra 1/quarter 3 0 <0.005 0.007 Yes
Korumburra 1/quarter 3 0 0.005 0.025 Yes
Lance Creek 1/quarter 3 0 0.005 0.008 Yes
Leongatha 1/quarter 3 0 0.012 0.016 Yes
Loch 1/quarter 3 0 0.015 0.018 Yes
Meeniyan 1/quarter 3 0 0.020 0.011 Yes
Nyora 1/quarter 3 0 0.014 0.015 Yes
Poowong 1/quarter 3 0 0.012 0.013 Yes
Port Franklin 1/quarter 3 0 0.011 0.022 Yes
Port Welshpool 1/quarter 3 0 0.011 0.017 Yes
Toora 1/quarter 3 0 0.013 0.020 Yes
Wonthaggi 1/quarter 3 0 0.007 0.013 Yes
Yarram 1/quarter 3 0 <0.005 0.006 Yes
21
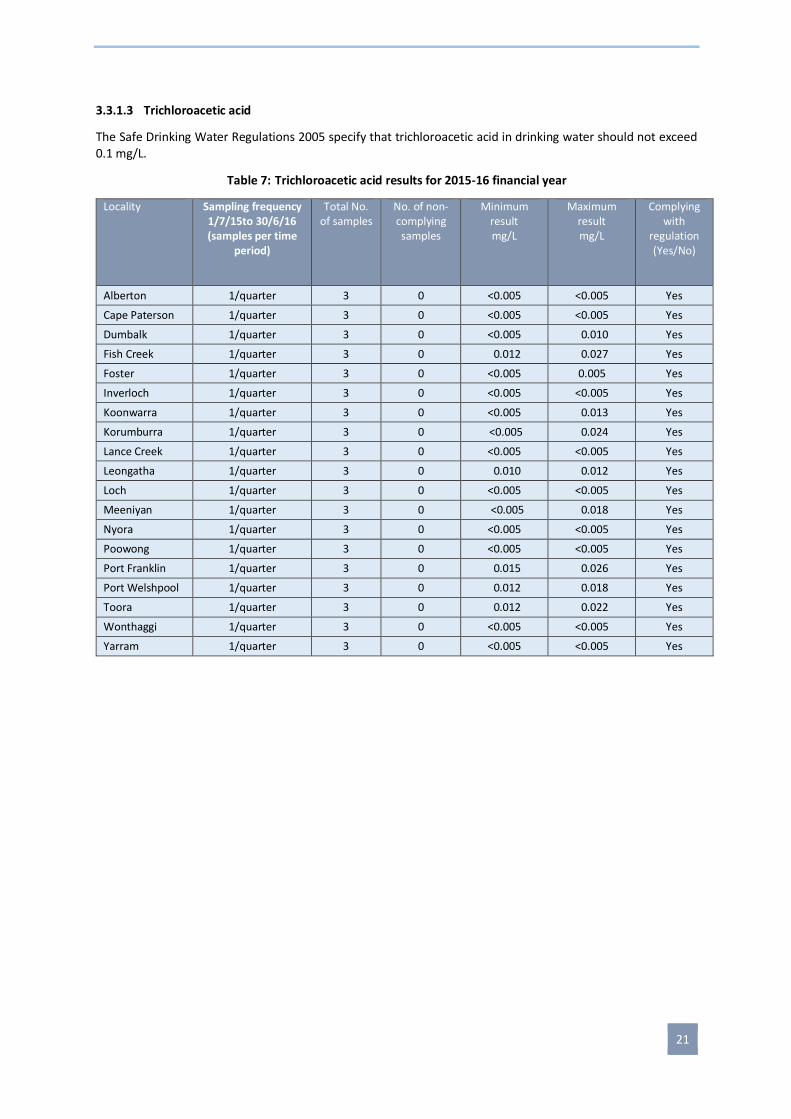
3.3.1.3 Trichloroacetic acid
The Safe Drinking Water Regulations 2005 specify that trichloroacetic acid in drinking water should not exceed 0.1 mg/L.
Table 7: Trichloroacetic acid results for 2015-16 financial year
Locality Sampling frequency 1/7/15to 30/6/16 (samples per time
period)
Total No. of samples
No. of non-complying samples
Minimum result mg/L
Maximum result mg/L
Complying with
regulation (Yes/No)
Alberton 1/quarter 3 0 <0.005 <0.005 Yes
Cape Paterson 1/quarter 3 0 <0.005 <0.005 Yes
Dumbalk 1/quarter 3 0 <0.005 0.010 Yes
Fish Creek 1/quarter 3 0 0.012 0.027 Yes
Foster 1/quarter 3 0 <0.005 0.005 Yes
Inverloch 1/quarter 3 0 <0.005 <0.005 Yes
Koonwarra 1/quarter 3 0 <0.005 0.013 Yes
Korumburra 1/quarter 3 0 <0.005 0.024 Yes
Lance Creek 1/quarter 3 0 <0.005 <0.005 Yes
Leongatha 1/quarter 3 0 0.010 0.012 Yes
Loch 1/quarter 3 0 <0.005 <0.005 Yes
Meeniyan 1/quarter 3 0 <0.005 0.018 Yes
Nyora 1/quarter 3 0 <0.005 <0.005 Yes
Poowong 1/quarter 3 0 <0.005 <0.005 Yes
Port Franklin 1/quarter 3 0 0.015 0.026 Yes
Port Welshpool 1/quarter 3 0 0.012 0.018 Yes
Toora 1/quarter 3 0 0.012 0.022 Yes
Wonthaggi 1/quarter 3 0 <0.005 <0.005 Yes
Yarram 1/quarter 3 0 <0.005 <0.005 Yes

22
3.3.1.4 Trihalomethanes (total)
The Safe Drinking Water Regulations 2005 specify that trihalomethanes in drinking water should not exceed 0.25 mg/L.
Table 8: Trihalomethanes (total) results for 2015-16
Locality Sampling frequency 1/7/15 to 30/6/16
(samples per time period)
Total No. of samples
No. of non-complying samples
Minimum result mg/L
Maximum result mg/L
Complying with regulation (Yes/No)
Alberton 1/quarter 4 0 <0.001 0.012 Yes
Cape Paterson 1/quarter 4 0 0.010 0.026 Yes
Dumbalk 1/quarter 12 0 0.074 0.220 Yes
Fish Creek 1/quarter 12 0 0.079 0.170 Yes
Foster 1/quarter 12 0 0.064 0.120 Yes
Inverloch 1/quarter 4 0 0.014 0.028 Yes
Koonwarra 1/month 12 0 0.110 0.160 Yes
Korumburra 1/month 12 0 0.088 0.150 Yes
Lance Creek 1/quarter 4 0 0.009 0.026 Yes
Leongatha 1/month 12 0 0.073 0.140 Yes
Loch 1/quarter 4 0 0.002 0.017 Yes
Meeniyan 1/month 12 0 0.067 0.140 Yes
Nyora 1/quarter 4 0 0.003 0.014 Yes
Poowong 1/quarter 4 0 0.003 0.015 Yes
Port Franklin 1/month 12 0 0.073 0.160 Yes
Port Welshpool 1/month 12 0 0.047 0.140 Yes
Toora 1/month 12 0 0.052 0.160 Yes
Wonthaggi 1/quarter 4 0 0.012 0.028 Yes
Yarram 1/quarter 4 0 <0.001 0.012 Yes
3.3.2 Actions undertaken in relation to non-compliance for chlorine-based disinfection byproduct chemicals
Drinking water supplied in all localities complied with the water quality standard for trihalomethanes and no actions were required in relation to non-compliance.

23
3.4 Ozone-based disinfection by-product chemicals
Water supplied by South Gippsland Water is not treated with ozone and therefore by-products derived from ozone are not a significant risk to drinking water supplied and are not required to be measured.
3.5 Aluminium
Aluminium may be present in drinking water where aluminium salts are used as coagulants in water treatment processes to destabilise particles in water.
3.5.1 Results: Aluminium in period the 1st to 17th July 2015
Monitoring for compliance with the water quality standard for acid-soluble aluminium was conducted in accordance with the Safe Drinking Water Regulations 2005 for the period 1st July 2015 and the sunset of the Regulations on the 17th July 2015. Aluminium results recorded for this period are provided in Table 9.
Table 9: Acid-soluble aluminium results for July 01 to July 17, 2015 (Safe Drinking Water Regulations 2005)
Locality Sampling frequency (No. of samples per time period)
Total No. of
samples
No. of non-complying samples
Result mg/L
Complying with regulation (Yes/No)
Alberton 1/month 1 0 0.01 Yes
Cape Paterson 1/month 1 0 0.01 Yes
Dumbalk 1/month 1 0 0.06 Yes
Fish Creek 1/month 1 0 0.01 Yes
Foster 1/month 1 0 0.01 Yes
Inverloch 1/month 1 0 0.02 Yes
Koonwarra 1/month 1 0 0.01 Yes
Korumburra 1/month 1 0 <0.01 Yes
Lance Creek 1/month 1 0 0.01 Yes
Leongatha 1/month 1 0 0.01 Yes
Loch 1/month 1 0 0.02 Yes
Meeniyan 1/month 1 0 0.07 Yes
Nyora 1/month 1 0 0.01 Yes
Poowong 1/month 1 0 0.02 Yes
Port Franklin 1/month 1 0 0.01 Yes
Port Welshpool 1/month 1 0 0.01 Yes
Toora 1/month 1 0 0.01 Yes
Wonthaggi 1/month 1 0 0.02 Yes
Yarram 1/month 1 0 0.01 Yes

24
3.5.2 Actions undertaken in relation to non-compliance for aluminium
Drinking water supplied in all localities complied with the water quality standard for aluminium and no actions were required in relation to non-compliance.
3.5.3 Results: Aluminium in period 18th July 2015 to June 30th 2016
The Safe Drinking Water Regulations 2015, which came into effect on the 18th July 2015, have no specific regulation with regards to aluminium. Monthly monitoring was continued for the remainder of the 2015-16 financial year, with water quality performance with respect to aluminium being measured against the Australian Drinking Water Guidelines aesthetic guideline value of 0.2 mg/L. As stated in the Australian Drinking Water Guidelines, there is "no health-based guideline is set for aluminium at this time but this issue be kept under review."
Table 10: Acid-soluble aluminium results for July 18, 2015 to June 30, 2016 (Safe Drinking Water Regulations 2015)
Locality Sampling frequency
(No. of samples per time period)
Total No. of
samples
No. of non-complying samples
Minimum result mg/L
Maximum result mg/L
Exceeded Aesthetic
ADWG (Yes/No)
Alberton 1/month 11 0 <0.01 0.02 No
Cape Paterson 1/month 11 0 0.01 0.03 No
Dumbalk 1/month 11 0 <0.01 0.05 No
Fish Creek 1/month 11 0 0.01 0.04 No
Foster 1/month 11 0 <0.01 0.01 No
Inverloch 1/month 11 0 0.01 0.03 No
Koonwarra 1/month 11 0 0.01 0.05 No
Korumburra 1/month 11 0 <0.01 0.06 No
Lance Creek 1/month 11 0 0.01 0.04 No
Leongatha 1/month 11 0 <0.01 0.02 No
Loch 1/month 11 0 0.01 0.05 No
Meeniyan 1/month 11 0 <0.02 0.72 Yes
Nyora 1/month 11 0 0.01 0.04 No
Poowong 1/month 11 0 <0.01 0.04 No
Port Franklin 1/month 11 0 <0.01 0.03 No
Port Welshpool 1/month 11 0 <0.01 0.02 No
Toora 1/month 11 0 0.01 0.04 No
Wonthaggi 1/month 11 0 0.01 0.04 No
Yarram 1/month 11 0 <0.01 0.03 No
25
3.5.4 Actions undertaken in relation to non-compliance for aluminium
Following an exceedance of the acid-soluble aluminium levels in locality of Meeniyan, dosing optimisation at the water treatment plant and flushing in the distribution system were effectively undertaken to restore the acid-soluble aluminium levels to within ADWG aesthetic guidelines.
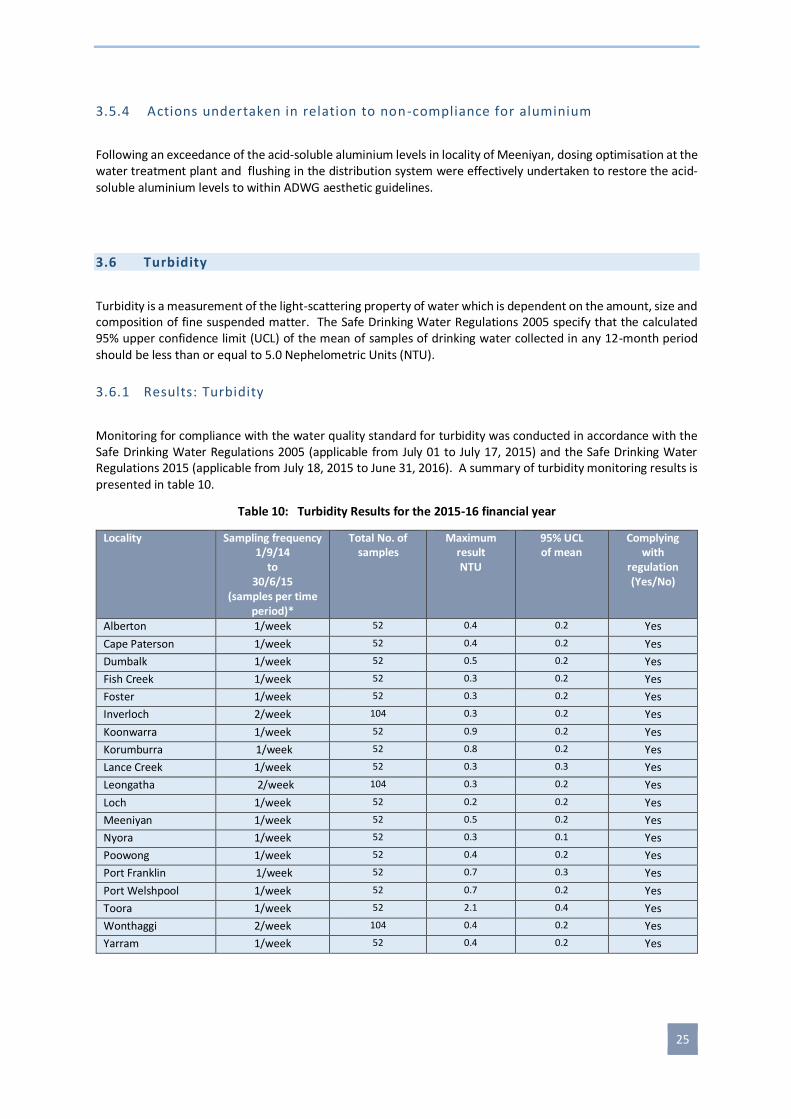
3.6 Turbidity
Turbidity is a measurement of the light-scattering property of water which is dependent on the amount, size and composition of fine suspended matter. The Safe Drinking Water Regulations 2005 specify that the calculated 95% upper confidence limit (UCL) of the mean of samples of drinking water collected in any 12-month period should be less than or equal to 5.0 Nephelometric Units (NTU).
3.6.1 Results: Turbidity
Monitoring for compliance with the water quality standard for turbidity was conducted in accordance with the Safe Drinking Water Regulations 2005 (applicable from July 01 to July 17, 2015) and the Safe Drinking Water Regulations 2015 (applicable from July 18, 2015 to June 31, 2016). A summary of turbidity monitoring results is presented in table 10.
Table 10: Turbidity Results for the 2015-16 financial year
Locality Sampling frequency 1/9/14
to 30/6/15
(samples per time period)*
Total No. of samples
Maximum result NTU
95% UCL of mean
Complying with
regulation (Yes/No)
Alberton 1/week 52 0.4 0.2 Yes
Cape Paterson 1/week 52 0.4 0.2 Yes
Dumbalk 1/week 52 0.5 0.2 Yes
Fish Creek 1/week 52 0.3 0.2 Yes
Foster 1/week 52 0.3 0.2 Yes
Inverloch 2/week 104 0.3 0.2 Yes
Koonwarra 1/week 52 0.9 0.2 Yes
Korumburra 1/week 52 0.8 0.2 Yes
Lance Creek 1/week 52 0.3 0.3 Yes
Leongatha 2/week 104 0.3 0.2 Yes
Loch 1/week 52 0.2 0.2 Yes
Meeniyan 1/week 52 0.5 0.2 Yes
Nyora 1/week 52 0.3 0.1 Yes
Poowong 1/week 52 0.4 0.2 Yes
Port Franklin 1/week 52 0.7 0.3 Yes
Port Welshpool 1/week 52 0.7 0.2 Yes
Toora 1/week 52 2.1 0.4 Yes
Wonthaggi 2/week 104 0.4 0.2 Yes
Yarram 1/week 52 0.4 0.2 Yes

26
3.6.2 Actions undertaken in relation to non-compliance for turbidity
Based on the calculated 95% upper confidence level (UCL) of the mean, drinking water supplied in all localities complied with the water quality standard for turbidity and no actions were required in relation to non-compliance.
3.7 Fluoride
Naturally-occurring fluoride concentrations in drinking water are largely dependent on the type of soil and rock through which source water drains. Fluoride may also be added to drinking water supplies as a public health measure for the prevention of dental decay. The Australian Drinking Water Guidelines 2011 (ADWG) specify that the maximum concentration of fluoride in drinking water should not exceed 1.5 mg/L. The Code of practice for fluoridation of drinking water supplies (2009) states that the annual average concentration for fluoride in drinking water must not exceed a level of 1 mg/L.
Under the Health (fluoridation) Act, an obligation is imposed on suppliers of fluoridated water to achieve a dose rate that confers a dental health benefit on consumers. Based on annual average maximum daily air temperature (which has been shown to correlate closely with water consumption), and as specified in the Code of practice for fluoridation of drinking water supplies, the optimal fluoride concentration for drinking water supplied in the South Gippsland region is 0.9 mg/L. While fluoridated water suppliers must aim for this optimal concentration in operating a fluoride dosing facility, an annual average fluoride concentration of greater than or equal to 0.6 mg/L (which is the minimum concentration that confers a dental health benefit) is deemed as meeting the obligation.
3.7.1 Results: fluoride in non-fluoridated supplies
Monitoring of non-fluoridated drinking water is conducted annually to verify continued low levels of naturally-occurring fluoride, as have been recorded historically. Results of fluoride monitoring for non-fluoridated supplies are provided in Table 11.
Table 11: Fluoride results for non-fluoridated supplies in the 2015-16 financial year
Water Treatment Plant
Localities Supplied Sampling Frequency
(Samples per time period)
Total No. of Samples
Result mg/L
Complying with
regulation Yes/No
Devon North Alberton Yarram
1/year 1 0.05 Yes
Dumbalk Dumbalk 1/year 1 0.14 Yes
Fish Creek Fish Creek 1/year 1 <0.05 Yes
Foster Foster 1/year 1 0.06 Yes
Korumburra Korumburra 1/year 1 0.10 Yes
Leongatha Leongatha Koonwarra
1/year 1 0.08 Yes
Meeniyan Meeniyan 1/year 1 0.08 Yes
Poowong Loch Nyora Poowong
1/year 1 0.13 Yes
Toora Port Franklin Port Welshpool Toora
1/year 1 0.07 Yes

27
3.7.2 Actions undertaken in relation to non-compliance in non-fluoridated supplies
Drinking water monitored at distribution entry point sites at all water treatment plants for non-fluoridated supplies complied with the ADWG guideline value for fluoride, and there were no actions required in relation to non-compliance.
3.7.3 Results: fluoride in fluoridated supply
For the fluoridated supply of Lance Creek, monitoring is conducted in accordance with the Code of practice for fluoridation of drinking water supplies (2009); refer to Table 12 for results.
Table 12: Fluoride results for fluoridated (Lance Creek) supply system in the 2015-16 financial year
Locality Sampling frequency (Samples per time period)
Total No. of
samples
Operating target range mg/L
Min. result mg/L
Max. result mg/L
Average result mg/L
Complying with
regulation (Yes/No)
Meeting obligation (Yes/No)
Cape Paterson 1/week 52 0.9±0.1 0.46 0.95 0.77 Yes Yes
Inverloch 1/week 52 0.9±0.1 0.31 0.94 0.77 Yes Yes
Lance Creek 1/week 52 0.9±0.1 0.10 0.96 0.74 Yes Yes
Wonthaggi 1/week 52 0.9±0.1 0.08 0.97 0.75 Yes Yes
3.7.4 Actions undertaken in relation to non-compliance for fluoride in fluoridated supplies
No actions were required in relation to non-compliance; drinking water in all fluoridated localities complied with both the Health (fluoridation) Act 1973 and the ADWG guideline for maximum allowable fluoride concentration. Based on the requirement that the annual average fluoride concentration be greater than or equal to 0.6 mg/L, the obligation imposed by the Health (fluoridation) Act with regard to conferring a dental health benefit was also fulfilled.

28
3.8 Other algae, pathogen, chemical or substance that may pose a risk to human health
As part of South Gippsland Water's drinking water quality management system, specific water quality parameters that have the potential to affect human health are monitored. These parameters are measured against standard values defined in the Australian Drinking Water Guidelines 2011 (ADWG). As many of these parameters do not change significantly over time or through water supply systems, frequent monitoring is not required.
3.8.1 Arsenic
Arsenic is a naturally-occurring element which can be introduced to water through the dissolution of minerals and ores, or from industrial effluent, atmospheric deposition, drainage from old gold mines or the use of some types of sheep dip. The ADWG specify that, from a health perspective, the concentration of arsenic should not exceed 0.01 mg/L. Water supplied by South Gippsland Water complied with the ADWG guideline value for arsenic, with all results indicating levels were below detection limits; refer to Table 13.
Table 13: Arsenic results for 2015-16 financial year
Water Treatment Plant
Localities supplied Sampling frequency
(samples per time period)
Total No. of samples
Result mg/L
Complying with ADWG
guideline value
Yes/No
Devon North Alberton Yarram
1/year 1 <0.001 Yes
Dumbalk Dumbalk 1/year 1 <0.001 Yes
Fish Creek Fish Creek 1/year 1 <0.001 Yes
Foster Foster 1/year 1 <0.001 Yes
Korumburra Korumburra 1/year 1 <0.001 Yes
Lance Creek
Cape Paterson Inverloch Lance Creek Wonthaggi
1/year 1 <0.001 Yes
Leongatha Leongatha Koonwarra
1/year 1 <0.001 Yes
Meeniyan Meeniyan 1/year 1 <0.001 Yes
Poowong Loch Nyora Poowong
1/year 1 <0.001 Yes
Toora Port Franklin Port Welshpool Toora
1/year 1 <0.001 Yes

29
3.8.2 Copper
Copper is naturally distributed in rocks and soils. It may also be present in drinking water where aggressive waters of low pH and hardness induce corrosion of copper pipes. The ADWG specify that the concentration of copper should not exceed 1 mg/L based on aesthetic considerations, and 2 mg/L based on health considerations. Water supplied by South Gippsland Water complied with both the aesthetic-based and health-based guideline values for copper; refer to Table 14.
Table 14: Copper results for 2015-16 financial year
Locality Sampling Frequency
(samples per time period)
Total No. of samples
Minimum result mg/L
Maximum result mg/L
Complying with ADWG
guideline value (Yes/No)
Alberton 1/quarter 4 0.001 0.002 Yes
Cape Paterson 1/quarter 4 0.009 0.018 Yes
Dumbalk 1/quarter 4 0.007 0.017 Yes
Fish Creek 1/quarter 4 0.003 0.006 Yes
Foster 1/quarter 4 0.004 0.008 Yes
Inverloch 1/quarter 4 0.007 0.016 Yes
Koonwarra 1/quarter 4 0.007 0.015 Yes
Korumburra 1/quarter 4 0.004 0.019 Yes
Lance Creek 1/quarter 4 0.005 0.054 Yes
Leongatha 1/quarter 4 0.006 0.029 Yes
Loch 1/quarter 4 0.004 0.010 Yes
Meeniyan 1/quarter 4 0.007 0.012 Yes
Nyora 1/quarter 4 0.003 0.012 Yes
Poowong 1/quarter 4 0.003 0.012 Yes
Port Franklin 1/quarter 4 0.001 0.003 Yes
Port Welshpool 1/quarter 4 0.002 0.009 Yes
Toora 1/quarter 4 0.003 0.009 Yes
Wonthaggi 1/quarter 4 0.007 0.016 Yes
Yarram 1/quarter 4 0.001 0.004 Yes
Note: Samples are taken for analysis from the reticulation system. Copper levels may be higher at customers' internal taps if copper plumbing is used in the domestic system. Customers experiencing blue copper staining of fixtures or discolouration of water are advised to call South Gippsland Water Customer Service on 03 5682 0444.
30
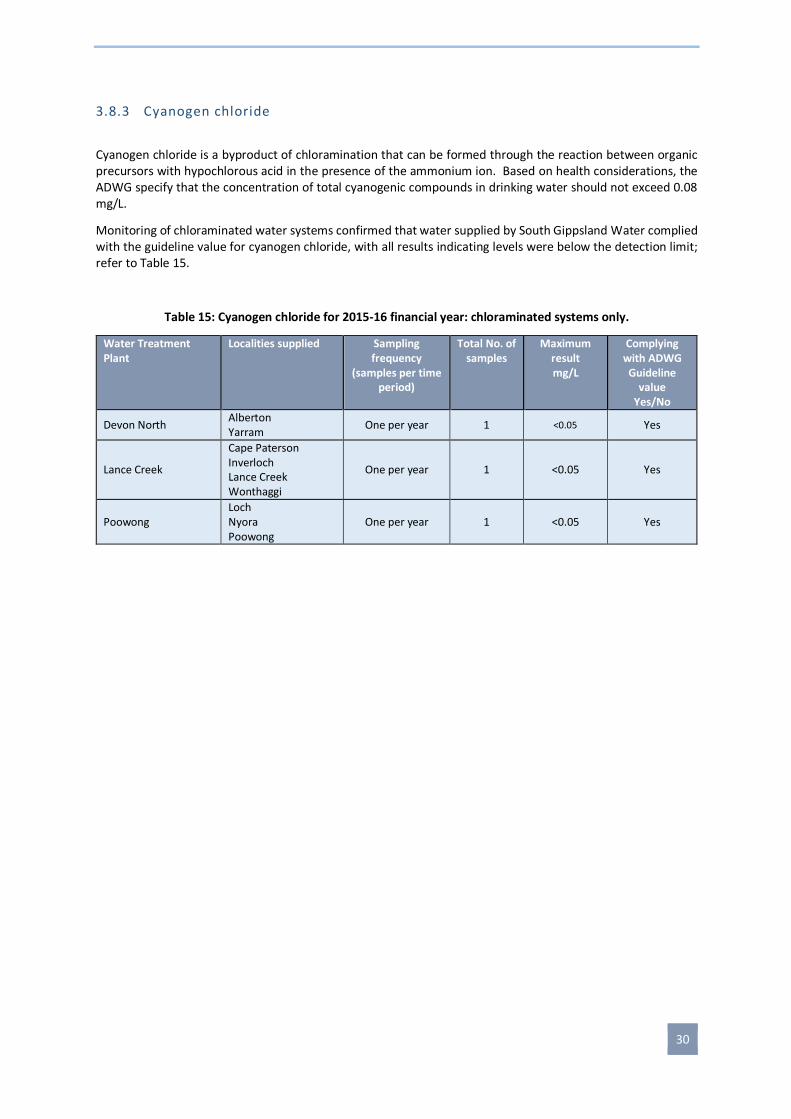
3.8.3 Cyanogen chloride
Cyanogen chloride is a byproduct of chloramination that can be formed through the reaction between organic precursors with hypochlorous acid in the presence of the ammonium ion. Based on health considerations, the ADWG specify that the concentration of total cyanogenic compounds in drinking water should not exceed 0.08 mg/L.
Monitoring of chloraminated water systems confirmed that water supplied by South Gippsland Water complied with the guideline value for cyanogen chloride, with all results indicating levels were below the detection limit; refer to Table 15.
Table 15: Cyanogen chloride for 2015-16 financial year: chloraminated systems only.
Water Treatment Plant
Localities supplied Sampling frequency
(samples per time period)
Total No. of samples
Maximum result mg/L
Complying with ADWG Guideline
value Yes/No
Devon North Alberton Yarram
One per year 1 <0.05 Yes
Lance Creek
Cape Paterson Inverloch Lance Creek Wonthaggi
One per year 1 <0.05 Yes
Poowong Loch Nyora Poowong
One per year 1 <0.05 Yes

31
3.8.4 Lead
Lead may be detected in drinking water as a result of dissolution from natural sources or from household plumbing systems containing lead. The ADWG specify that, from a health perspective, the concentration of lead should not exceed 0.01 mg/L. Water supplied by South Gippsland Water complied with the ADWG guideline value; refer to Table 16.
Table 16: Lead results for 2015-16 financial year
Locality Sampling frequency
(samples per time period)
Total No. of samples
Minimum result mg/L
Maximum result mg/L
Complying with ADWG
guideline value (Yes/No)
Alberton 1/quarter 4 <0.001 <0.001 Yes
Cape Paterson 1/quarter 4 <0.001 <0.001 Yes
Dumbalk 1/quarter 4 <0.001 <0.001 Yes
Fish Creek 1/quarter 4 <0.001 <0.001 Yes
Foster 1/quarter 4 <0.001 <0.001 Yes
Inverloch 1/quarter 4 <0.001 <0.001 Yes
Koonwarra 1/quarter 4 <0.001 <0.001 Yes
Korumburra 1/quarter 4 <0.001 <0.001 Yes
Lance Creek 1/quarter 4 <0.001 <0.001 Yes
Leongatha 1/quarter 4 <0.001 <0.001 Yes
Loch 1/quarter 4 <0.001 <0.001 Yes
Meeniyan 1/quarter 4 <0.001 <0.001 Yes
Nyora 1/quarter 4 <0.001 <0.001 Yes
Poowong 1/quarter 4 <0.001 <0.001 Yes
Port Franklin 1/quarter 4 <0.001 <0.001 Yes
Port Welshpool 1/quarter 4 <0.001 <0.001 Yes
Toora 1/quarter 4 <0.001 <0.001 Yes
Wonthaggi 1/quarter 4 <0.001 <0.001 Yes
Yarram 1/quarter 4 <0.001 <0.001 Yes

32
3.8.5 Manganese
Manganese may be present in source waters as a result of dissolution form natural sources. Concentrations may be reduced in drinking water by converting soluble forms of the element to insoluble precipitates followed by physical removal using filtration. The ADWG specify that the concentration of manganese should not exceed 0.1 mg/L based on aesthetic considerations, and 0.5 mg/L based on health considerations. Drinking water supplied by South Gippsland Water complied with both the aesthetic-based and health-based guideline values for manganese; refer to Table 17.
Table 17: Manganese result for 2015-16 financial year
Locality Sampling frequency
(samples per time period)
Total No. of samples
Minimum result mg/L
Maximum result mg/L
Complying with ADWG
guideline value (Yes/No)
Alberton 1/month 12 0.001 0.027 Yes
Cape Paterson 1/month 12 0.003 0.022 Yes
Dumbalk 1/month 12 <0.001 0.035 Yes
Fish Creek 1/month 12 0.001 0.020 Yes
Foster 1/month 12 0.005 0.026 Yes
Inverloch 1/month 12 0.008 0.037 Yes
Koonwarra 1/month 12 0.002 0.072 Yes
Korumburra 1/month 12 <0.001 0.009 Yes
Lance Creek 1/month 12 0.008 0.042 Yes
Leongatha 1/month 12 0.002 0.006 Yes
Loch 1/month 12 0.002 0.006 Yes
Meeniyan 1/month 12 <0.001 0.005 Yes
Nyora 1/month 12 0.002 0.006 Yes
Poowong 1/month 12 0.003 0.017 Yes
Port Franklin 1/month 12 0.002 0.027 Yes
Port Welshpool 1/month 12 0.002 0.012 Yes
Toora 1/month 12 0.003 0.019 Yes
Wonthaggi 1/month 12 0.008 0.028 Yes
Yarram 1/month 12 <0.001 0.027 Yes

33
3.8.6 Nitrate and Nitrite
Nitrates and nitrites are naturally occurring oxides of nitrogen. Nitrite is rapidly oxidised to nitrate and is seldom present in well-oxygenated or chlorinated supplies. Chloramination disinfection can lead to nitrate and nitrite formation in the distribution system due to the action of nitrifying bacteria. The ADWG specify that, from a health perspective, the concentrations of nitrate and nitrite should not exceed 50 mg/L and 3 mg/L respectively. Monitoring was conducted in all chloraminated South Gippsland Water localities in 2015-16. All localities complied with the guideline values for nitrate and nitrite; refer to Tables 18 and 19.
Table 18: Nitrate results for 2015-16 financial year: chloraminated systems
Locality Sampling frequency Winter &
Spring (samples per time
period)
Sampling frequency Summer &
Autumn (samples per time
period
Total No. of samples
Minimum result mg/L
Maximum result mg/L
Complying with ADWG
guideline value
(Yes/No)
Alberton 1/month 2/month 18 0.120 0.800 Yes
Cape Paterson 1/month 2/month 18 0.260 0.700 Yes
Inverloch 1/month 2/month 18 0.180 0.330 Yes
Lance Creek 1/month 2/month 18 0.100 0.500 Yes
Loch 1/month 2/month 18 0.120 1.700 Yes
Nyora 1/month 2/month 18 0.110 1.700 Yes
Poowong 1/month 2/month 19 0.100 1.700 Yes
Wonthaggi 1/month 2/month 18 0.140 0.450 Yes
Yarram 1/month 2/month 18 1.120 0.810 Yes
Table 19: Nitrite results for 2015-16 financial year: chloraminated systems
Locality Sampling frequency Winter &
Spring (samples per time
period)
Sampling frequency Summer &
Autumn (samples per time
period
Total No. of samples
Minimum result mg/L
Maximum result mg/L
Complying with ADWG
guideline value
(Yes/No)
Alberton 1/month 2/month 18 0.005 0.300 Yes
Cape Paterson 1/month 2/month 18 0.091 0.700 Yes
Inverloch 1/month 2/month 18 0.011 0.700 Yes
Lance Creek 1/month 2/month 18 0.004 0.012 Yes
Loch 1/month 2/month 18 0.002 0.450 Yes
Nyora 1/month 2/month 18 0.007 0.018 Yes
Poowong 1/month 2/month 19 0.003 0.009 Yes
Wonthaggi 1/month 2/month 18 0.007 0.015 Yes
Yarram 1/month 2/month 18 0.002 0.032 Yes

34
3.8.7 N-Nitrosodimethylamine (NDMA)
N-Nitrosodimethylamine (NDMA) is produced as a byproduct of chloramination of drinking water due to the oxidation of natural organic matter by chlorine in the presence of ammonia. The ADWG specify that, based on health considerations, the concentration of NDMA in drinking water should not exceed 0.0001 mg/L (100 ng/L).
Monitoring of chloraminated systems for NDMA was conducted quarterly, with results indicating water supplied by South Gippsland Water complied with the guideline value for NDMA; refer to Table 20.
Table 20: NDMA for 2015-16 financial year: chloraminated systems
Water Treatment Plant
Localities Supplied Sampling frequency
(samples per time period)
Total No. of Samples
Maximum result mg/L
Complying with ADWG
guideline value
Yes/No
Devon North Alberton Yarram
1/year 1 >0.00003 Yes
Lance Creek
Cape Paterson Inverloch Lance Creek Wonthaggi
1/year 1 >0.00003 Yes
Poowong Loch Nyora Poowong
2/year 1 >0.00003 Yes
35
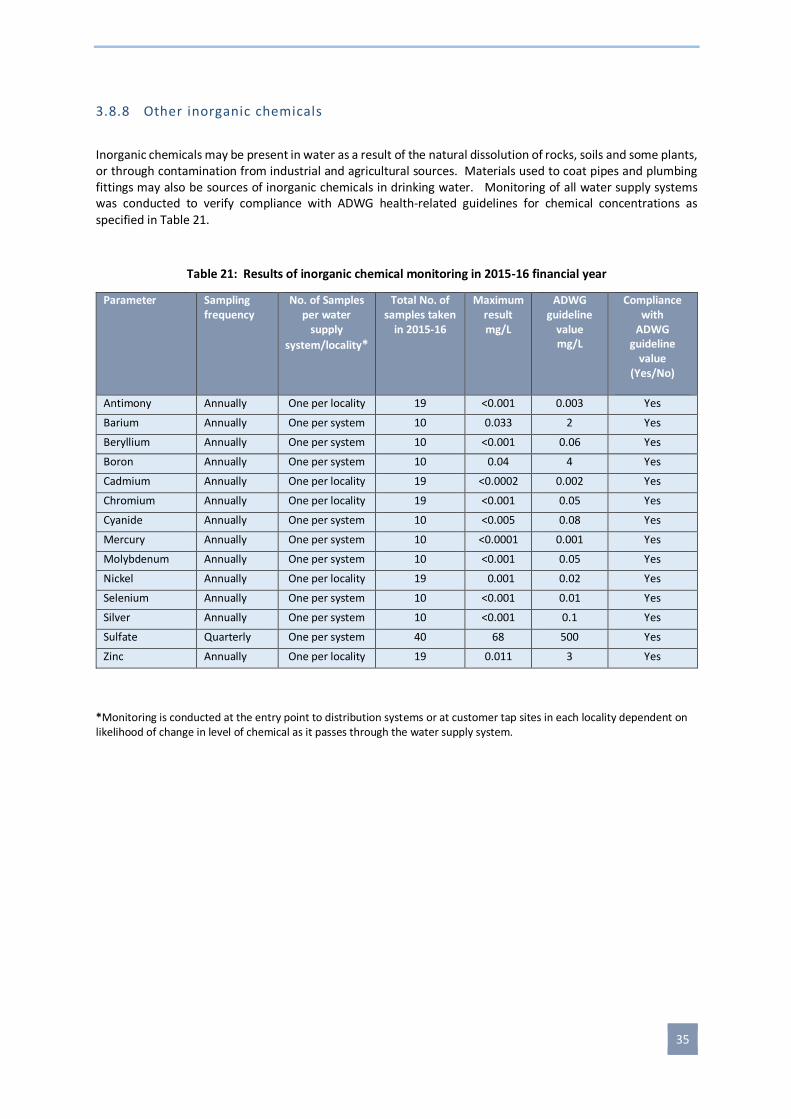
3.8.8 Other inorganic chemicals
Inorganic chemicals may be present in water as a result of the natural dissolution of rocks, soils and some plants, or through contamination from industrial and agricultural sources. Materials used to coat pipes and plumbing fittings may also be sources of inorganic chemicals in drinking water. Monitoring of all water supply systems was conducted to verify compliance with ADWG health-related guidelines for chemical concentrations as specified in Table 21.
Table 21: Results of inorganic chemical monitoring in 2015-16 financial year
Parameter Sampling frequency
No. of Samples per water
supply
system/locality*
Total No. of samples taken
in 2015-16
Maximum result mg/L
ADWG guideline
value mg/L
Compliance with
ADWG guideline
value (Yes/No)
Antimony Annually One per locality 19 <0.001 0.003 Yes
Barium Annually One per system 10 0.033 2 Yes
Beryllium Annually One per system 10 <0.001 0.06 Yes
Boron Annually One per system 10 0.04 4 Yes
Cadmium Annually One per locality 19 <0.0002 0.002 Yes
Chromium Annually One per locality 19 <0.001 0.05 Yes
Cyanide Annually One per system 10 <0.005 0.08 Yes
Mercury Annually One per system 10 <0.0001 0.001 Yes
Molybdenum Annually One per system 10 <0.001 0.05 Yes
Nickel Annually One per locality 19 0.001 0.02 Yes
Selenium Annually One per system 10 <0.001 0.01 Yes
Silver Annually One per system 10 <0.001 0.1 Yes
Sulfate Quarterly One per system 40 68 500 Yes
Zinc Annually One per locality 19 0.011 3 Yes
*Monitoring is conducted at the entry point to distribution systems or at customer tap sites in each locality dependent on likelihood of change in level of chemical as it passes through the water supply system.

36
3.8.9 Other organic chemicals
Potential sources of contamination of the drinking water supply with organic chemicals are industrial effluent, run-off from agricultural land, and the use of pesticides and herbicides. Consistent with historical data, monitoring of raw water intake or distribution entry point water at all South Gippsland Water treatment plants found that levels of industrial and agricultural chemicals were compliant with the ADWG health-related guidelines for the 2015-16 period; refer to Table 22.
Table 22: Results of organic chemical monitoring in 2015-16 financial year
Parameter Sampling Frequency
No. of Samples per water supply
system3
Total No. of samples taken in 2014-15
Maximum result mg/L
ADWG guideline
value mg/L
Compliance with
ADWG guideline
value Yes/no
1,1-dichloroethane Annually One per system 10 <0.001 a -
1,2-dichloroethane Annually One per system 10 <0.001 0.003 Yes
2,4,5-T Biannually Two per system 20 <0.00001 0.1 Yes
2,4,5-TP Biannually Two per system 20 <0.00001 b -
2,4,6-T Biannually Two per system 20 0.0001 b -
2,4,6-trichlorphenol Annually One per system 10 <0.001 0.02 Yes
2,4-D Biannually Two per system 20 0.00006 0.03 Yes
2,4-DB Biannually Two per system 20 <0.00001 b -
2,4-DP Biannually Two per system 20 <0.00001 b -
2,6-D Biannually Two per system 20 <0.0001 b -
4-Chlorophenoxyacetic Acid
Biannually Two per system 20 <0.00001 b -
Atrazine Biannually Two per system 20 <0.002 0.02 Yes
Benzene Annually One per system 10 <0.001 0.001 Yes
Benzo(a)pyrene Annually One per system4 4 <0.000002 0.00001 Yes
Carbon tetrachloride Annually One per system 10 <0.001 0.003 Yes
Clopyralid Biannually Two per system 20 <0.00005 2 Yes
Dicamba Biannually Two per system 20 <0.00001 0.1 Yes
Fluoroxypyr Biannually Two per system 20 <0.00005 b -
Glyphosate Biannually Two per system 20 <0.03 1 Yes
MCPA Biannually Two per system 20 <0.00001 0.04 Yes
MCPB Biannually Two per system 20 <0.00001 b -
Mecoprop Biannually Two per system 20 <0.00001 b -
Metsulfuron methyl Annually One per system 10 <0.0001 0.04 Yes
Pentachlorphenol Annually One per system 10 <0.001 0.01 Yes
Picloram Biannually Two per system 20 0.00005 0.3 Yes
Prometryn Biannually Two per system 20 <0.002 b - Simazine Biannually Two per system 20 <0.002 0.02 Yes
Tetrachloroethene Annually One per system 10 <0.001 0.05 Yes
Trichloroethylene Annually One per system 10 <0.001 a -
Triclopyr Biannually Two per system 20 0.00058 0.02 Yes
a Insufficient data to set an ADWG guideline value based on health considerations b No ADWG information available
3 Monitoring is conducted at raw water inlets to treatment plants or at clear water storage outlets to distribution systems 4 Monitoring conducted at Devon North, Korumburra, Lance Creek and Leongatha water treatment plants only

37
3.8.10 Raw water monitoring
For the purposes of risk management, the parameters listed in Table 23 were monitored in raw water at the specified (minimum) frequencies by external laboratory analysis in raw water at all South Gippsland Water treatment plants for the 2015-16 reporting period.
Table 23: Raw water monitoring
Parameter Sampling frequency
Escherichia coli Weekly
Total Coliforms Weekly
Cryptosporidium Event-based
Giardia Event-based
Cyanobacteria (Blue-green algae) Weekly (external/internal) Algae byproducts (MIB/Geosmin/Saxitoxin) Event-based
Alkalinity Monthly
Aluminium Quarterly
Calcium Quarterly
Copper Quarterly
Dissolved Organic Carbon Quarterly
Manganese Quarterly Nitrogen Quarterly
Orthophosphorous Quarterly
Phosphorous Quarterly
Total Organic Carbon Quarterly
Turbidity Weekly
Pesticides Annually/Biannually/Event-based
Radionuclides Every 7 years: Sampling conducted in 2009

38
3.8.11 Radiological Parameters
Several radionuclides emitting alpha and beta particles may occasionally be detected in Australian ground and surface waters. While there are no specific guidelines, the Australian Drinking water Guidelines advise that radionuclides should be identified and determined if gross alpha or beta activities exceed 0.5 Bq/L
Table 24: Radiological parameters
Water Treatment Plant
Localities supplied Sampling frequency
(samples per time period)
Total No. of
samples
Gross Alpha
Activity Bq/L
Gross Beta Activity
Bq/L
Complying with ADWG
guideline value
Yes/No
Devon North Alberton Yarram
1/seven years 1 <0.08* <0.15* Yes
Dumbalk Dumbalk 1/seven years 1 <0.05 <0.1 Yes
Fish Creek Fish Creek 1/seven years 1 <0.05 <0.1 Yes
Foster Foster 1/seven years 1 <0.05 <0.1 Yes
Korumburra Korumburra 1/seven years 1 <0.05 <0.1 Yes
Lance Creek
Cape Paterson Inverloch Lance Creek Wonthaggi
1/seven years 1 <0.06* <0.13* Yes
Leongatha Leongatha Koonwarra
1/seven years 1 <0.05 <0.1 Yes
Meeniyan Meeniyan 1/seven years 1 <0.05 <0.1 Yes
Poowong Loch Nyora Poowong
1/seven years 1 <0.05 <0.1 Yes
Toora Port Franklin Port Welshpool Toora
1/seven years 1 <0.05 <0.1 Yes
*Detection limit raised when sample diluted to mitigate interference during analysis
Data obtained from all water quality monitoring programs conducted by South Gippsland Water is available on request by telephoning Customer Service on 03 5662 0444 or emailing [email protected]
3.9 Aesthetics
South Gippsland water aims to provide aesthetically-pleasing drinking water for all customers. Actions taken to manage aesthetic characteristics include:
Monitoring and management of algae blooms in raw water reservoirs;
Optimisation of treatment processes to minimise levels of iron, manganese and organic compounds in supplied water;
pH adjustment of treated water;
Regular flushing and air-scouring to remove sediment accumulation in mains;
Frequent sampling and analysis for aesthetic parameters; and,

39
Monitoring when required for compounds that may impart unpleasant tastes and odours to drinking water.
Results of monitoring for aesthetic characteristics are provided in Tables 24, 25, 26 and 27. For manganese results, refer to Table 17.
3.9.1 Alkalinity
Alkalinity is defined as the quantitative capacity of an aqueous solution to neutralise an acid. In simpler terms, it is a measure of how easily the pH of water can be changed. Alkalinity is mainly determined by the levels of carbonate, bicarbonate and hydroxyl anions (negatively-charged ions) present, and it has a strong influence on water stability; that is, the tendency of water to be either corrosive, stable, or scale-forming with regard to the surfaces it comes in to contact with.
While water stability is complex and influenced by a number of factors, soft water of low pH and low alkalinity will generally tend to corrode surfaces. Highly corrosive (aggressive) water is not desirable in that it can lead to the leaching of copper and other metals from pipes and plumbing fittings.
In contrast, hard water of high pH and high alkalinity will generally tend to deposit calcium carbonate (form scale) on pipes, plumbing fittings and hot water systems. While encrustation of pipes and fittings is not desirable, a thin layer of calcium carbonate on surfaces can be beneficial in that it provides protection against corrosion.
There are no specific standards for alkalinity in drinking water but as this property provides resistance against changes in pH that can lead to either corrosion or excessive encrustation, a reasonable level should be maintained in drinking water supplies. What is reasonable for a particular type of water will depend mainly upon its other characteristics of pH and hardness, but a value in the range of 50 to 200 mg/L CaCO3 is generally considered to be optimal. Results of alkalinity monitoring are provided in Table 24.

40
Table 24: Total Alkalinity measured in calcium carbonate (CaCO3) equivalents5 for the 2015-16 financial year
Water treatment plant
Localities supplied Sampling frequency
(samples per time period)
Total No. of samples
Minimum result
mg/L as CaCO3
Maximum Result
mg/L as CaCO3
Devon North Alberton Yarram
One per quarter 4 26 62
Dumbalk Dumbalk One per quarter 4 52 150
Fish Creek Fish Creek One per quarter 4 37 54
Foster Foster One per quarter 4 42 52
Korumburra Korumburra One per quarter 4 49 88
Lance Creek
Cape Paterson Inverloch Lance Creek Wonthaggi
One per quarter 4 54 76
Leongatha Leongatha Koonwarra
One per quarter 4 39 43
Meeniyan Meeniyan One per quarter 4 38 59
Poowong Loch Nyora Poowong
One per quarter 4 79 110
Toora Port Franklin Port Welshpool Toora
One per quarter 4 41 61
5 Calcium carbonate equivalent (unit) is used as a convenient method of comparison in chemistry. It is the value obtained when taking
into account the different characteristics in relation to reactivity (ability to combine) of various salts, such that the overall effect is the same as that produced by the expressed concentration of calcium carbonate. As both alkalinity and hardness are aggregate properties created by the combined effects of different salts, the calcium carbonate equivalent unit is used in each case. This does not, however, mean that alkalinity and hardness are the same. Alkalinity is chemically defined as the sum of all titratable bases in a solution, whereas hardness is the sum of all polyvalent cation (ions having more than one positive charge) concentrations in a solution. With respect to a solution made purely from the compound calcium carbonate, therefore, the property of alkalinity is due to the component carbonate anion (a base), while the property of hardness is due to the component calcium cation.
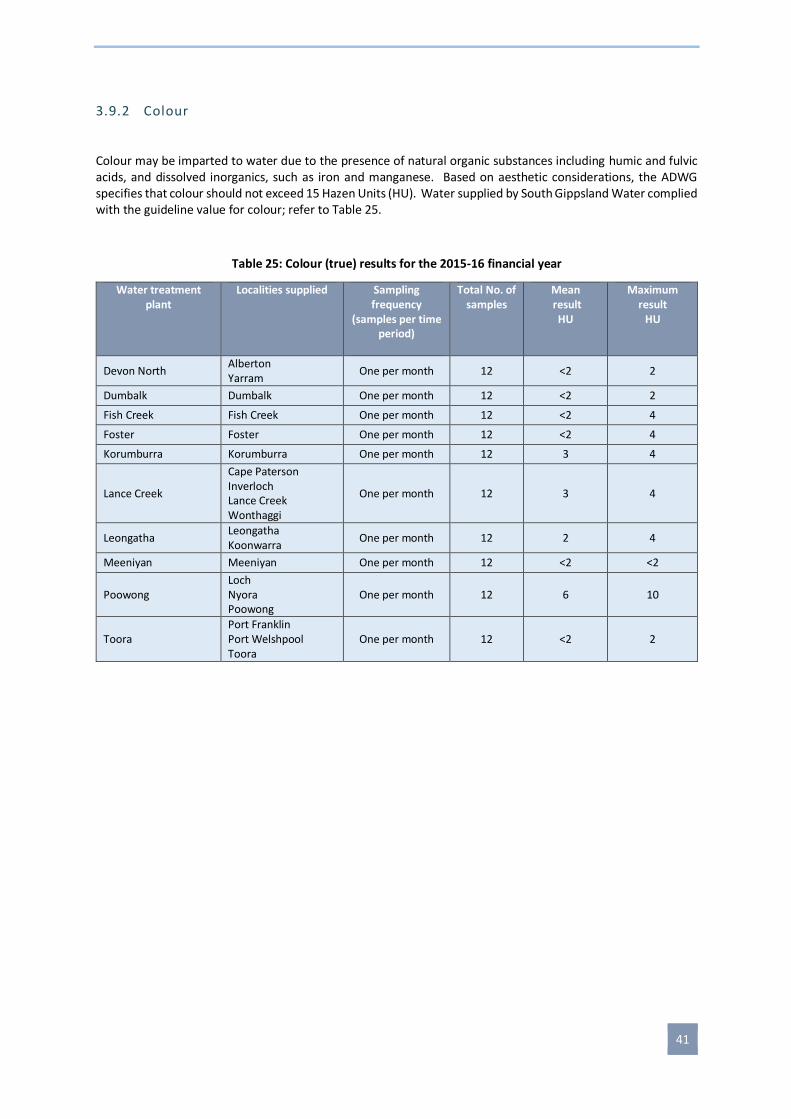
41
3.9.2 Colour
Colour may be imparted to water due to the presence of natural organic substances including humic and fulvic acids, and dissolved inorganics, such as iron and manganese. Based on aesthetic considerations, the ADWG specifies that colour should not exceed 15 Hazen Units (HU). Water supplied by South Gippsland Water complied with the guideline value for colour; refer to Table 25.
Table 25: Colour (true) results for the 2015-16 financial year
Water treatment plant
Localities supplied Sampling frequency
(samples per time period)
Total No. of samples
Mean result
HU
Maximum result
HU
Devon North Alberton Yarram
One per month 12 <2 2
Dumbalk Dumbalk One per month 12 <2 2
Fish Creek Fish Creek One per month 12 <2 4
Foster Foster One per month 12 <2 4
Korumburra Korumburra One per month 12 3 4
Lance Creek
Cape Paterson Inverloch Lance Creek Wonthaggi
One per month 12 3 4
Leongatha Leongatha Koonwarra
One per month 12 2 4
Meeniyan Meeniyan One per month 12 <2 <2
Poowong Loch Nyora Poowong
One per month 12 6 10
Toora Port Franklin Port Welshpool Toora
One per month 12 <2 2

42
3.9.3 Hardness
Hardness is a measure of the concentration of calcium and magnesium ions in water. To minimise undesirable build-up of scale in hot water systems, the ADWG specifies that total hardness (as calcium carbonate) in drinking water should not exceed 200 mg/L. Water supplied by South Gippsland Water complied with the guideline value for hardness; refer to Table 26.
Table 26: Total Hardness in calcium carbonate (CaCO3) equivalents6 for the 2015-16 financial year
Water treatment plant
Localities supplied Sampling frequency
(samples per quarter)
Total No. of
samples
Mean result
mg/L as CaCO3
Maximum Result
mg/L as CaCO3
Complying with ADWG
guideline value
Yes/No
Devon North Alberton Yarram
One per quarter 4 32 37 Yes
Dumbalk Dumbalk One per quarter 4 139 190 Yes
Fish Creek Fish Creek One per quarter 4 58 88 Yes
Foster Foster One per quarter 4 41 47 Yes
Korumburra Korumburra One per quarter 4 61 70 Yes
Lance Creek
Cape Paterson Inverloch Lance Creek Wonthaggi
One per quarter 4 85 90 Yes
Leongatha Leongatha Koonwarra
One per quarter 4 72 78 Yes
Meeniyan Meeniyan One per quarter 4 95 120 Yes
Poowong Loch Nyora Poowong
One per quarter 4 75 88 Yes
Toora Port Franklin Port Welshpool Toora
One per quarter 4 44 50 Yes
6 Calcium carbonate equivalent (unit) is used as a convenient method of comparison in chemistry. It is the value obtained when taking into
account the different characteristics in relation to reactivity (ability to combine) of various salts such that the overall effect is the same as that produced by the expressed concentration of calcium carbonate. As both alkalinity and hardness are aggregate properties created by the combined effects of different salts, the calcium carbonate equivalent unit is used in each case. This does not, however, mean that alkalinity and hardness are the same. Alkalinity is chemically defined as the sum of all titratable bases in a solution, whereas hardness is the sum of all polyvalent cation (ions having more than one positive charge) concentrations in a solution. With respect to a solution made purely from the compound calcium carbonate, therefore, the property of alkalinity is due to the component carbonate anion (a base), while the property of hardness is due to the component calcium cation.

43
3.9.4 Iron
Iron is present in source waters due to dissolution of soil and rock. High iron concentrations in drinking water can occur through rusting of iron pipes and fittings. Based on aesthetic considerations, the ADWG specify that the concentration of iron should not exceed 0.3 mg/L. Water supplied by South Gippsland Water complied with the guideline value for iron; refer to Table 27.
Table 27: Iron results for the 2015-16 financial year
Locality Sampling Frequency
(samples per time period
Total No. of samples
Minimum result mg/L
Maximum result mg/L
Complying with ADWG
guideline value (Yes/No)
Alberton 1/quarter 4 <0.01 0.02 Yes
Cape Paterson 1/quarter 4 <0.01 0.02 Yes
Dumbalk 1/quarter 4 <0.01 0.02 Yes
Fish Creek 1/quarter 4 <0.01 0.02 Yes
Foster 1/quarter 4 <0.01 <0.01 Yes
Inverloch 1/quarter 4 <0.01 <0.01 Yes
Koonwarra 1/quarter 4 <0.01 0.03 Yes
Korumburra 1/quarter 4 <0.01 <0.01 Yes
Lance Creek 1/quarter 4 <0.01 <0.01 Yes
Leongatha 1/quarter 4 <0.01 0.02 Yes
Loch 1/quarter 4 <0.01 <0.01 Yes
Meeniyan 1/quarter 4 <0.01 0.04 Yes
Nyora 1/quarter 4 <0.01 <0.01 Yes
Poowong 1/quarter 4 <0.01 0.01 Yes
Port Franklin 1/quarter 4 <0.01 0.01 Yes
Port Welshpool 1/quarter 4 <0.01 0.02 Yes
Toora 1/quarter 4 <0.01 <0.01 Yes
Wonthaggi 1/quarter 4 <0.01 0.01 Yes
Yarram 1/quarter 4 <0.01 0.07 Yes

44
3.9.5 pH pH is a measure of the hydrogen ion concentration of water. It is measured on a logarithmic scale from 0 to 14. A pH of 7 is neutral, a pH greater than 7 is alkaline, and a pH less than 7 is acidic.
To reduce corrosion and encrustation in pipes and fittings, the ADWG specifies that the pH of drinking water should be between 6.5 and 8.5. The ADWG also states that new concrete tanks and cement-mortar lined pipes can significantly increase pH and a value up to 9.2 may be tolerated, provided monitoring indicates no deterioration in microbiological quality.
The reference to microbiological quality is made in the ADWG since the disinfecting power of chlorine in chlorinated systems is greatest at lower pH and gradually declines as pH increases. Significant impairment of chlorine disinfection occurs above pH 8.0. Based on mean pH values, drinking water supplied by South Gippsland Water in chlorinated systems complied with the guideline range for pH; refer to Table 28.
The chemistry of disinfection (and the effects of pH) where chloramine is used instead of chlorine is different. A higher pH is actually beneficial in chloraminated systems as this slows the natural decay of monochloramine and prevents the formation of dichloramine and trichloramine, which can cause unpleasant taste and odours. A consequence of maintaining a higher pH is that occasional exceedance of the ADWG guideline can occur. Such instances are addressed with watermain flushing to remove aged water from the system. Based on mean pH values, pH in chloraminated systems complied with the ADWG guideline range; refer to Table 29.
Table 28: pH results for chlorinated system in 2015-16 financial year
Locality Sampling frequency (samples per time period)
Total No. of samples
Minimum result
pH
Maximum result
pH
Mean result pH
Complying with ADWG
guideline (Yes/No)
Dumbalk One per week 52 7.3 8.2 7.9 Yes
Fish Creek One per week 52 7.1 8.6 7.9 Yes
Foster One per week 52 6.9 7.8 7.6 Yes
Koonwarra One per week 52 7.1 8.2 7.7 Yes
Korumburra One per week 52 7.0 7.9 7.5 Yes
Leongatha Two per week 104 7.1 7.9 7.5 Yes
Meeniyan One per week 52 7.0 8.1 7.6 Yes
Port Franklin One per week 52 7.4 8.6 8.0 Yes
Port Welshpool One per week 52 7.2 8.1 7.6 Yes
Toora One per week 52 7.9 7.0 7.5 Yes
Table 29: pH result for chloraminated systems in 2015-16 financial year
Locality Sampling frequency (samples per time period)
Total No. of samples
Minimum result
pH
Maximum result
pH
Mean result pH
Complying with ADWG
guideline (Yes/No)
Alberton One per week 52 8.2 9.4 8.4 Yes
Cape Paterson One per week 52 7.1 8.1 7.6 Yes
Inverloch Two per week 104 7.2 8.4 7.9 Yes
Lance Creek One per week 52 7.5 8.9 8.2 Yes
Loch One per week 52 7.8 8.8 8.3 Yes
Nyora One per week 52 7.6 8.8 8.3 Yes
Poowong One per week 52 7.5 8.8 8.2 Yes
Wonthaggi Two per week 104 7.3 8.4 8.0 Yes
Yarram One per week 52 6.7 9.1 8.1 Yes

45
3.10 Analysis of water sample information
3.10.1 Three-year comparison of results for parameters listed in Schedule 2 of the Safe Drinking Water Regulations 2005
A comparison of analysis results over the past three financial years is presented in Table 30. Compliance is measured with the water quality standards listed in Schedule 2 of the Safe Drinking Water Regulations 2005 to the sunset of Regulations to the 17th July 2015. As the standards for chloroacetic acid, dichloroacetic acid, trichloroacetic acid, and aluminium are not defined in the table in Schedule 2 of the Safe Drinking Water Regulations 2015, percentage compliance for these parameters in the 2015-16 year column of Table 30 represents that in the period 1st July to 17th July 2015 only.
A comparison of analysis results over the past three financial years (refer to Table 30, and Figures 3 and 4) demonstrates consistent compliance with the water quality standards listed in Schedule 2 of the Safe Drinking Water Regulations 2005 for E. coli , the chloroacetic acids, and turbidity. E. coli and turbidity remained compliant with Safe Drinking Water Regulations 2015 in the 2015-16 period.
A decline in compliance with the trihalomethane water quality standard can be observed for the 2014-15 period. This is due to one exceedance of the compliance limit for Fish Creek that occurred as a result of an aeration pump failure at the water treatment plant; refer to part 4 of the 2014-15 report (available on South Gippsland Water’s website for details). A return to 100 percent compliance with the (unchanged) trihalomethane standard for both the Safe Drinking Water Regulations 2005 and the Safe Drinking Water Regulations 2015 can be observed for the 2015-16 period.
Compliance with the aluminium standard of the Safe Drinking Water Regulations 2005 also declined in the 2014-15 year due to treatment plant optimisation challenges, but a return to 100 percent compliance can be observed for the regulated period in 2015-16.

46
Table 30a: Comparison of percentage compliance with water quality standards over three years
WATER QUALITY PARAMETER
COMPLIANCE WITH WATER QUALITY STANDARDS
PERCENTAGE OF LOCALITIES PERCENTAGE OF CUSTOMERS
20
13-1
4
20
14-1
5
20
15-1
6
20
13-1
4
20
14-1
5
20
15-1
6
Escherichia coli 100 100 100 100 100 100
Chloroacetic Acid 100 100 100* 100 100 100*
Dichloroacetic Acid 100 100 100* 100 100 100*
Trichloroacetic Acid 100 100 100* 100 100 100*
Trihalomethane 100 94.7 100 100 98.3 100
Aluminium 94.7 100 100* 98.4 100 100*
Turbidity 100 100 100 100 100 100
*Percentage compliance for chloroacetic acid, dichloroacetic acid, trichloroacetic acid, and aluminium is based on compliance with Safe
Drinking Water Regulations 2005 in the period 1st July to 17th July 2015.
Figure 3: Percentage of water sampling localities where the drinking water complied with the water quality standards
100 100 100 100 10094.7
100100 100 100 10094.7
100 100100 100 100 100 100 100 100
Percentage compliant localities 2013-14 Percentage compliant localities 2014-15
Percentage compliant localities 2015-16

47
Figure 4: Percentage of customers supplied with drinking water that complied with the water quality standards
100 100 100 100 100 98.3 100100 100 100 100 98.3 100 100100 100 100 100 100 100 100
Percentage of customers receiving compliant water 2013-14
Percentage of customers receiving compliant water 2014-15
Percentage of customers receiving compliant water 2015-16

48
3.10.2 Three-year comparison of results for other water quality parameters
A three-year comparison of results for water quality parameters other than those listed in Schedule 2 of the Safe Drinking Water Regulations 2015 is presented in Table 30b. The comparison is based on percentage compliance with the health-related guideline values of the Australian Drinking Water Guidelines 2011
Table 30b: Percentage of samples compliant with health-related guidelines from the ADWG
Water Quality Parameter
Percentage of samples compliant with health-related guidelines from the Australian Drinking Water Guidelines 2011
Year: 2013-14 2014-15 2015-16
Arsenic 100 % 100 % 100 % Copper 100 % 100 % 100 %
Cyanogen chloride 100 % 100 % 100 %
Iron 100 % 100 % 100 %
Lead 100 % 100 % 100 %
Manganese 100 % 100 % 100 %
Nitrate 100 % 100 % 100 %
Nitrite 100 % 100 % 100 % NDMA 100 % 100 % 100 %
Antimony 100 % 100 % 100 %
Barium 100 % 100 % 100 %
Beryllium 100 % 100 % 100 %
Boron 100 % 100 % 100 %
Cadmium 100 % 100 % 100 %
Chromium 100 % 100 % 100 % Cyanide 100 % 100 % 100 %
Mercury 100 % 100 % 100 %
Molybdenum 100 % 100 % 100 %
Nickel 100 % 100 % 100 %
Selenium 100 % 100 % 100 %
Silver 100 % 100 % 100 %
Sulphate 100 % 100 % 100 % Zinc 100 % 100 % 100 %
1,2-dichloroethane 100 % 100 % 100 %
2,4,5-T 100 % 100 % 100 %
2,4,6-trichlorphenol 100 % 100 % 100 %
2,4-D 100 % 100 % 100 %
Atrazine 100 % 100 % 100 %
Benzene 100 % 100 % 100 %
Benzo(a)pyrene 100 % 100 % 100 % Carbon tetrachloride 100 % 100 % 100 %
Clopyralid 100 % 100 % 100 %
Dicamba 100 % 100 % 100 %
Glyphosate 100 % 100 % 100 %
MCPA 100 % 100 % 100 %
Metsulfuron methyl 100 % 100 % 100 %
Pentachlorphenol 100 % 100 % 100 % Picloram 100 % 100 % 100 %
Simazine 100 % 100 % 100 %
Tetrachloroethene 100 % 100 % 100 %
Triclopyr 100 % 100 % 100 %
Gross Alpha * Not monitored Not monitored 100
Gross Beta * Not monitored Not monitored 100
*Radiological parameters monitored once every seven years as per risk-based monitoring program

49
4. EMERGENCY AND INCIDENT MANAGMENT 4.1 Incidents reported under section 22 of the Act
Section 22 of the Safe Drinking Water Act 2003 (the Act) requires water suppliers to immediately notify the Department of Health and Human Services (the Department) of any circumstances where it is believed that drinking water supplied to the public may be the cause of an illness, pose a risk to human health or cause widespread public complaint. Based on this requirement, the incidents described in this section have been reported to the Department in the 2015-16 reporting period. Table 31 provides a summary of events reported under section 22 of the Act.
Table 31: Summary of events reported to the Department under Section 22 of the Act in 2015-16
4.1.1 Escherichia coli detections Escherichia coli (E. coli) is a species of bacteria that inhabits the intestinal tracts of humans, other mammals and some birds. E. coli can also be carried by reptiles and amphibians. While most strains of E. coli are not harmful, their presence in water indicates possible contamination with faecal material; hence E. coli are used as an indicator in quality monitoring for other potentially pathogenic (and more difficult to detect) microorganisms that may be associated with faeces. Other types of bacteria with similar characteristics as E. coli (collectively known as 'coliforms') but not necessarily associated with faecal contamination are also routinely monitored to provide a general gauge on the cleanliness of the water supply system.
Routine weekly microbiological monitoring is performed at water sampling locations as per requirements of the Safe Drinking Water Regulations 2005 (for the period July 1 to 17, 2015) and the Safe Drinking Water Regulations 2015 (which came into effect on July 18, 2015). For the 2015-16 reporting period, there were three instances of E. coli detection. One of these was for a customer tap sample collected from the locality of Yarram. In addition, there were two instances of E. coli detection for samples collected from the Loch water tower and the Cape Paterson water tower.
The incident response for microbiological detections as documented in South Gippsland Water’s Drinking Water Management System involves the following actions being implemented within 24 hours of positive E. coli results being received from the contracted laboratory:
Notification and reporting to the Department of Health and Human Services in accordance with section 22 of the Act;
Review of treatment plant and disinfection system operations to assess possibility of malfunction or disinfection failure.
Water sampling locality affected
Date of Incident Location of
Incident Nature of Incident
Nature of known or suspected
contamination/cause of incident
Ref.
Yarram 29/09/15 to 30/09/15 Nicol St Yarram customer tap site
Microbiological non-conformance
E. coli : 3 orgs/100mL
4.1.1.1
Loch 01/02/16 to 02/09/16 Loch Water Tower Outlet Microbiological non-conformance
E. coli : 1 orgs/100mL 4.1.1.2
Cape Paterson 15/03/16 to 17/03/16 Cape Paterson Water Tower (sample site at gate to paddock)
Microbiological non-conformance
E. coli : 2 orgs/100mL 4.1.1.3

50
Review of distribution systems work (such as mains break repair) and investigation of any other potential sources of contamination;
Security checks and monitoring of distribution water storages;
Confirmation of flushing programs conducted prior to the notification;
Flushing of the water mains at potentially affected locations;
Retesting of chlorine residuals, pH and turbidity;
Adjustment of chlorine dosing rates to obtain minimum residual of 0.2 mg/L or an approved level required at a particular sample location; and,
Follow-up sampling and analysis for the non-conforming sample site and other sites across the relevant sampling locality.
All E. coli detections are treated seriously and acted on promptly. For most instances of E. coli detection, obvious sources of contamination cannot be found and a positive result for a drinking water sample may be speculatively attributed to one or more of the following:
Human error, involving contamination of the sample during the sampling or testing processes;
Insufficient residual chlorine or chloramine to prevent re-growth of bacteria within the mains and protect treated water throughout the distribution system;
Release of bacteria from biofilm material that coats the internal walls of pipes and storage tanks. (The slimy biofilm layer can protect organisms from the disinfecting action of chlorine or chloramine; if bacteria become liberated from the film in regions of the distribution system where the concentration of disinfectant is low, then these organisms may survive long enough to be detected in a sample);
Ingress of groundwater through small undetectable cracks in pipes during transitory low pressure events within the mains. (Again, if chlorine or chloramine is at a level insufficient for rapid disinfection within the mains, then bacteria may survive and be detected in a sample).
For the three detection events in the 2015-16 reporting period, low E. coli numbers were recorded. The events are described below.
4.1.1.1 E. coli detection for Nicol St Yarram customer tap site (September 2015)
A notification under section 22 of the Act was sent to the Department on the 29th of September 2015 in relation to a low level E. coli detection at a customer tap site in Nicol St Yarram. An E.coli result of 3 orgs/100mL was reported. A total chlorine residual of 1.53 mg/L was recorded at the time of sampling. There were no microbial detections for routine samples taken from the Devon North clear water storage (CWS) outlet, the Yarram water tower, or the customer tap site in Port Albert. In response to the detection, flushing was carried out at the Nicol St main on the 30th September. Follow-up samples were collect pre- and post- flushing and collected from both the non-conforming site and an additional nine potable water sampling sites across the system (including the CWS outlet and the Yarram elevated storage). Following mains flushing the Nicol St site was again resampled, as were seven additional sampling sites in the Yarram locality. No E. coli was detected in pre-flushing follow-up samples at Nicol St, however coliforms were present at a level of 39 orgs/100mL. Total Chlorine was recorded at 1.61 mg/L. Post-flushing follow-up sample results indicated there were 0 orgs/100mL for E. coli, 2 orgs/100mL for total coliforms, and 1.62 mg/L for total chlorine. There were no E. coli or other coliforms detected for any of the samples taken pre and post- flushing of the Nicol Street main, and total chlorine was found to again be within normal range across the system. In accordance with requirements of the new Safe Drinking Water Regulations 2015, a detailed investigation report was prepared and forwarded to the Department of Health and Human Services (DHHS). This report stated that the investigation found no treatment failures or potential sites of distribution system contamination that

51
could have contributed to the detection. It was discovered, however, that the house at Nicol St had been unoccupied for at least six months. It is likely that water in the supplying service pipe had stagnated and allowed the accumulation of biofilms. Despite this line being flushed for five minutes prior to sampling, the E. coli detection may be attributed to dislodgement of the biofilm. The conclusion of the investigation was that the initial E. coli detection was a false positive as per the definition in the Safe Drinking Water Regulations 2015 on the basis that it did not represent the water being supplied to the Yarram system generally.
4.1.1.2 E. coli detection for the Loch Water Tower (February 2016)
A notification in accordance with section 22 of the Safe Drinking Water Act was forwarded to the Department following a low-level E. coli detection of 1 org/100mL for the Loch water tower outlet site on February 1st, 2016. The total chlorine level of 2.1 mg/L recorded at the time of sampling was within the required chlorine range and there were no microbial detections for routine samples taken from the Poowong water treatment plant clear water storage outlet or customer tap sites in Loch, Poowong and Nyora.
In response to the detection a thorough investigation was carried out consisting of the following:
Collection of follow-up samples on the 2nd February from the Poowong clear water storage outlet, the
Loch water tower outlet, and all six customer tap sites in Loch.
Inspection of the Loch tower for site security breaches
Review of filtration and disinfection processes at the water treatment plant for the week prior to the
E. coli detection
Review of any works carried out in the Poowong-Loch-Nyora distribution system.
The investigation concluded that there was no evidence of any treatment failure, or likely sites for entry of contaminants into the water tower or distribution system. Additionally, there were no microbial detections or other abnormal results (turbidity, pH, total chlorine) for any of the follow-up samples.
In accordance with requirements of the new Safe Drinking Water Regulations 2015, a detailed investigation report was forwarded to the Department. Upon review, the Department accepted the conclusion of the report that the E. coli detection was a false positive and not representative of the overall water quality being supplied to the Loch water sampling locality. As a result the Loch water sampling locality remains compliant with the water quality standard for E.coli.
4.1.1.3 E.coli detection for the Cape Paterson Water Tower (March 2016 )
A notification in accordance with section 22 of the Safe Drinking Water Act was forwarded to the Department following a low-level E. coli detection of 2 org/100mL from the Cape Paterson water tower outlet on March 15th, 2016. The total chlorine level of 1.23 mg/L recorded at the time of sampling was within the required chlorine range and there were no microbial detections for routine samples taken from the supplying Lance Creek and Wonthaggi clear water storages, or any customer tap sites in the Wonthaggi and Cape Paterson water sampling localities. In response to the detection a thorough investigation was carried out consisting of the following:

52
Collection of follow-up samples on the 16th March from the Lance Creek clear water storage outlet, the Wonthaggi low-level basin outlet, Cape Paterson water tower inlet and outlet, and all nine customer tap sites in Cape Paterson water sampling locality
Inspection of the Cape Paterson water tower for site security breaches
Review of filtration and disinfection processes at the Lance Creek water treatment plant for the week
prior to the E. coli detection
Review of any works carried out in the Lance Creek distribution system
The investigation concluded that there was no evidence of any treatment failures, or likely sites for entry of contaminants into the water tower or distribution system. Additionally, there were no microbial detections or other abnormal results (turbidity, pH, total chlorine, electrical conductivity) for any of the follow-up samples.
In accordance with requirements of the new Safe Drinking Water Regulations 2015, a detailed investigation report was forwarded to the Department. Upon review, the Department accepted the conclusion of the report that the E. coli detection was a false positive and not representative of the overall water quality being supplied to the Cape Paterson water sampling locality. As a result the Cape Paterson water sampling locality remains compliant with the water quality standard for E.coli.
4.2 Other reported events
4.2.1 Section 18 reported events
Section 18 of the Safe Drinking Water Act 2003 (the Act) requires a water supplier to notify the Department of Health and Human Services where it becomes aware that supplied drinking water does not comply, or is not likely to comply, with any relevant water quality standard. The purpose of section 18 is to ensure the Department is alerted to potential water quality issues that may require further investigation or actions.
For the 2015-2016 Drinking Water Quality reporting period there were no Section 18 submission by South Gippsland Water to the Department.
4.2.2 Blue-green algae (cyanobacteria) blooms reported to DELWP Notification of an algal bloom to the Department of Health and Human Services is only required if drinking water supplied from the water source affected by the bloom has the potential to pose a threat to human health or may result in widespread public complaint, as stipulated in section 22 of the Safe Drinking Water Act. For the purposes of regional monitoring and management, however, the Department of Environment, Land, Water and Planning (DELWP) is advised when local algal blooms occur and cell volumes exceed specified limits.
Algal blooms are managed according to the potential toxicity of the identified species, cell numbers and densities, and efficacy of existing treatment processes in removing algae and algae-related compounds from raw water. As part of South Gippsland Water's incident response procedures, which are documented in its drinking water management system, the following actions may be implemented in response to algal detections:
Increased monitoring for algae and algae-related toxins (when potentially toxic species are identified) and other compounds that may cause taste and odour issues;
Initiation of powdered activated carbon (PAC) dosing to remove algae-related toxins and other compounds;
Isolation and containment of the affected reservoir where applicable;
Selective use of offtakes (where available) at reservoirs to minimise volume of algae cells entering the treatment plant;
Destratification of reservoir;

53
Application of algicide where appropriate; and,
Notification to major customers advising of potential for taste and odour issues.
With respect to the algae events reported in Table 32, implementation of appropriate incident response procedures resulted in controlled events that had no real potential to affect public health.
Table 32: Blue-green algae (cyanobacteria) blooms reported to DELWP in 2015-16
Location Date of bloom Nature of bloom
Leongatha Raw Water Reservoir No. 4 16/11/15 to 11/4/16 Total cyanobacterial biovolume >0.2 mm3/L
Lance Creek Raw Water Reservoir 20/11/15 to 10/02/16 Total cyanobacterial biovolume >0.2 mm3/L
Korumburra Raw Water Reservoir No. 1 21/12/15 to 06/06/16 Total cyanobacterial biovolume >0.2 mm3/L
Korumburra Raw Water Reservoir No. 3 09/02/16 to 16/02/16 Total cyanobacterial biovolume >0.2 mm3/L
Poowong Raw Water Reservoir 25/02/16 to 02/03/16 Total cyanobacterial biovolume >0.2 mm3/L
Leongatha Raw Water Reservoir No. 3 21/03/16 to 11/01/16 Total cyanobacterial biovolume >0.2 mm3/L
5. COMPLAINTS RELATING TO WATER QUALITY
5.1 Complaints for 2015-16
South Gippsland Water records and attends to all complaints relating to drinking water quality to ensure the highest level of customer satisfaction. Determination of the number of complaints per 100 customers supplied is based on the number of complaints compared with the total number of connected properties. Table 33 below illustrates the four complaint types and the number of complaints received for each over the 2015-2016 year.
Table 33: Customer complaints summary for 2015-16
Type of complaint Number of complaints Number of complaints per 100 customers (connected properties)
supplied
Discoloured Water 99 0.48
Taste/Odour 22 0.11
Air in Water 5 0.02 Other 2 0.01
5.2 Management of complaints
Customer complaints relating to water quality are managed in accordance with procedures documented in South Gippsland Water’s quality document system. Upon receipt of a complaint, a customer service officer classifies the information and records it in a computer database. An activity sheet is then created for investigation of the
54
complaint within a specified time period. The objective of the investigation is to determine the cause of the complaint and the actions required to rectify the problem. All investigative and corrective actions are recorded in the computer database once complete. The causes of the different types of complaints received and the relevant preventive and corrective actions are described below.
5.2.1 Discoloured water
Discoloured water complaints primarily result from:
High manganese levels in source waters. The soil in the South Gippsland region is naturally high in manganese, and run-off into reservoirs and rivers is unavoidable. Not all manganese can be removed during the water treatment process so accumulation in the distribution system can occur;
Accumulation of sediment within water mains over time; and/or
Unintended scouring of water mains following high flows or recharging of the system.
Corrective actions to address discoloured water include:
Use of aeration and potassium permanganate dosing systems at water treatment plants to oxidise manganese and maximise physical removal through filtration;
Implementation of scheduled air-scouring and flushing programs within all water sampling localities to remove manganese and other accumulated sediments;
Additional flushing when required in response to individual complaints, and increased frequency flushing regimes for ‘problem-spot’ areas.
Provision of a commercial cleaning product which removes discolouration marks from laundry items in response to individual customer complaints.
There were 99 complaints received in relation to discoloured water in the 2015-16 financial year.
5.2.2 Taste and odour
Taste and odour complaints result primarily from:
Algae-related compounds in the water;
Manganese and/or iron sediment in the water;
Chlorine in water.
Corrective actions to address taste and odour include:
Routine monitoring of supplied water for taste and odour, manganese, iron, turbidity, pH and chlorine;
Specific analysis for taste and odour related parameters (as above) when required in response to individual complaints;
Use of powdered activated carbon (PAC) at treatment plants to remove algae-related and other taste and odour compounds from water;
Use of aeration and potassium permanganate dosing systems at water treatment plants to oxidise manganese and maximise removal from source waters.
There were 22 calls relating to taste and odour issues received from customers in 2015-16.
55
5.2.3 Air in water
Air in water complaints are generally received following the implementation of air-scour cleaning programs. While notification is given to residents prior to air-scouring, customers may become concerned at the ‘milky’ appearance of water. Customers are advised that the white colour of the water is due to the presence of tiny air-bubbles and that flushing through a tap for a few minutes will correct the problem. There were five complaints involving air in water from South Gippsland Water customers in the 2015-16 reporting period.
5.2.4 Other complaints
Other complaints generally relate to concerns that are beyond the control and responsibility of South Gippsland Water, such as death of aquarium fish or garden plants, and problems with domestic plumbing or appliances. Results of monitoring programs that may be relevant are reviewed, and additional investigation may be carried out where appropriate. Customers are informed of the likelihood of supplied water being the cause of the problem and given advice on where to seek additional assistance if required. There were a total of two complaints/enquiries in this category for 2015-16.
Complaints in this category may also include general queries from customers experiencing illness or dermatological conditions. Customers expressing concern that a health issue relates to tap water are encouraged to consult a medical professional for diagnosis and treatment. Additional monitoring to verify quality of supplied drinking water to the customer's residence is carried out. Details of the complaint and results of both monitoring and diagnostic testing (if provided) are recorded. Generally, customers are seeking reassurance with regards to water quality rather than alleging that drinking water is the cause of their health problem. In the unlikely event that investigation of reported illness did produce evidence that water quality might be a factor, the Department of Health and Human Services would be immediately notified. Further actions, which might include issuing of a boil water advisory, would be implemented as a matter of the highest priority.

56
6. FINDING OF THE MOST RECENT RISK MANAGEMENT PLAN AUDIT Under section 7 of the Safe Drinking Water Act 2003 (the Act), a water supplier is required to prepare, implement and review a risk management plan for the supply of drinking water to the public. The most recent risk management plan audit carried out by a Department of Health and Human Services approved auditor occurred in June 2016. South Gippsland Water was found to be compliant in all auditable elements for the period 27th May 2014 to 7th June 2016. Refer to the Risk Management Plan Audit Certificate on page 54. While no non-compliances were recorded, the auditor made a number of observations and identified some specific opportunities for improvement illustrated in Table 33.
Table 33: Safe Drinking Water Act – 2016 Drinking Water Risk Management Plan Audit – Opportunities for
Improvement
Suggested Opportunity for improvement (OFI) SGW Actions
Status
Implementation of increased use of ultra-violet (UV) disinfection and more advanced filter methodology should continue.
UV installed at Meeniyan, Dumbalk and Toora. Optimisation of system continues at Toora. Currently investigating implementation of UV at Leongatha WTP and other plants based on risk.
On-going
Continue to divert the initial water away whenever filter operations are commenced.
Filter-to-waste systems now installed at all water treatment plants. Optimisation of systems continue.
In progress
When planning capital works of any size, the focus should be to continue to target and improve water quality, reliability and simplicity while supporting these works with more advanced software systems integrated with performance verification monitoring.
Water Plan IV discussions are underway; focus is on all mentioned in OFI. Advanced software systems (e.g. WIMS) continue to be developed and refined.
On-going
Maintain the increased focus on calibrations of chemical probes which allows better standardisation, integration and reliability.
In-house calibration program has been implemented for critical control point (CCP) monitoring and other equipment. Program continues to be developed and refined.
In progress
Further use of drones, for example, to photograph the condition of water storage tanks. This approach allows better recording of possible and completed jobs which can be integrated into the advanced software tracking system.
RPA (drone) use for surveying cyanobacterial growth in reservoirs has been incorporated into blue-green algae monitoring & management procedures. Drone use is currently being investigated/trialled for potential use in reservoir surveillance (fencing and stock management), monitoring reservoir water levels, distribution network leak detection, and clear water storage (CWS) tank site security inspections.
In progress
Consideration of an increased focus on flushing and scouring of system pipes. Previously flushing was reduced during the drought periods in order to conserve water supplies.
Flushing and scouring program in place. Resources being managed with priority given to systems with greater manganese issues, customer complaints, disinfection residual persistence problems.
On-going

57
Consideration of restarting the ‘River Health Award’ as well as continuing to quantify the considerable benefits of such integrations.
Discussions are underway with regard to resurrecting River Heath Award.
Started
With regards to septic tanks, that discussions with council on possible long-term opportunities for an integrated approach be continued.
Meetings/discussions with council continue. SGW currently working in collaboration with South Gippsland Shire Council on development of Domestic Waste Management Plan (DWMP)
In progress
7. UNDERTAKINGS UNDER SECTION 30 OF THE ACT
Section 30 of the Safe Drinking Water Act 2003 allows for the Secretary to the Department of Health and Human Services to accept a written undertaking from a water supplier that certain actions will be performed. Water suppliers can apply to the Secretary for an undertaking in the event that they are, or are likely to be, in contravention of the Act or its associated regulations.
There were no undertakings for South Gippsland Water in the 2015-16 reporting period.
8. FURTHER INFORMATION
Customers and members of the public may obtain further information on the results of water quality monitoring programs or any matters related to this report by contacting South Gippsland Water’s Customer Service Department on 03 5682 0444 or by emailing [email protected]
Table 33: Safe Drinking Water Act – 2016 Drinking Water Risk Management Plan Audit – Opportunities for Improvement continued

58
Appendix A. South Gippsland Water Drinking Water Policy
SOUTH GIPPSLAND WATER
DRINKING WATER QUALITY POLICY
“Committed to high quality drinking water”
South Gippsland Water is committed to the management of its water supply systems to ensure the provision of safe, high-quality drinking water that consistently meets the NHMRC/NRMMC Australian Drinking Water Guidelines, relevant regulatory requirements and customer expectations. In order to achieve this objective, in partnership with
stakeholders and relevant agencies, the Corporation will:
Implement and maintain a Drinking Water Quality Management System to minimise risks to drinking water quality at all points from catchment to consumer. Develop and implement an appropriate drinking water quality monitoring program and reporting system to provide relevant and timely information, and ensure confidence in the water supply and its management;
Implement appropriate contingency and incident response systems to effectively manage incidents that may adversely affect drinking water quality;
Annually review and assess the performance of the Drinking Water Quality Management System with respect to this policy to ensure continual improvement and best practice management;
Integrate into planning the needs and expectations of its consumers, stakeholders, regulators and employees to ensure both effective and economical solutions for managing safe drinking water supplies;
Ensure compliance with all regulations, guidelines and standards relevant to drinking water quality.
This policy requires all managers and employees at South Gippsland Water involved in the supply of drinking water to be responsible for understanding, implementing, maintaining and
continually improving the drinking water quality management system.
This Water Quality Policy is proudly displayed at South Gippsland Water facilities and is communicated to all persons working for or on our behalf during induction or contract proceedings. The Policy is available to the public upon request or via the South Gippsland Water website. Our contact details are –
South Gippsland Water
14-18 Pioneer Street
PO Box 102 or: www.sgwater.com.au
Foster, Victoria 3960
(03) 5682 0444

59
Appendix B. Risk Management Plan Regulatory Audit Certificate and opportunities for improvement

60
Appendix B. Risk Management Plan Regulatory Audit Certificate and opportunities for improvement (cont’d)
_____________________________________________________________________________
South Gippsland Water – Water Supply Risk Management Plan Audit 2016 – Notes 23
8. Opportunities for Improvement
During the audit it was very encouraging to note the high level and integration of operations. In particular:
• In terms of the legislation The Safe Drinking Water 2015 Regulations requires a more advanced water sampling monitoring methodology; the plans being implemented to increase the use of UV and more advanced filter methodology. This further reduces risk and also allows for a greater and more effective ability to focus monitoring and interpretation of relevant data thus providing more meaningful results.
• The filter upgrades that enable the initial filter water to be diverted away from mains supply which further improve quality and reliability.
• The careful planning of small works and larger capital works to target and continue to improve water quality, reliability and simplicity which are supported by more advanced software systems integrated with performance verification monitoring.
• The increased focus on calibrations of chemical probes which allows better standardisation, integration and reliability.
• The use of a drone to identify possible algae reservoir issues.
• The work undertaken with regards to Catchment Management Health Based Targets (HBT) and integration with other agencies, organisations and farmers in regards to long-term environment and better securing the quality of water supplies.
Some suggestions to consider for possible opportunities for improvement are as follows:
• Implementation of increased use of UV and more advanced filter methodology should continue.
• Continue to divert the initial filter water away whenever filter operations are commenced
• When planning capital works of any size the focus should be to continue to target and improve water quality, reliability and simplicity while supporting these works with more advanced software systems integrated with performance verification monitoring.
• Maintain the increased focus on calibrations of chemical probes which allows better standardisation, integration and reliability.
• Further use of drones, for example, to photograph the condition of water storage tanks. This approach allows better recording of possible and completed jobs which can be integrated into the advanced software tracking systems.
• Consideration of an increased focus on flushing and scouring of system pipes. Previously flushing was reduced during the drought periods in order to conserve water supplies.
• Consideration of restarting the ‘River Health Award’ as well as continuing to quantify the considerable benefits of such integrations.
• With regards to septic tanks, that discussions with council on possible long-term opportunities for an integrated approach are continued.

61
____________________________________________________________________________
General Inquiries: 1300 851 636 8.30am to 5.00pm, Mon-Fri Faults & Emergencies: 1300 851 636 or 03 5682 0444 24 hours a day, 7 days a week Translating & Interpreting Service: Customers requiring this service, please call: 131 450 TTY: Customers with TTY facility, Please call: 1800 555 677 Mail: PO Box 102 Foster VIC 3960 Email: [email protected] Head Office: 14-18 Pioneer Street, Foster VIC 3960 ____________________________________________________________________________