2015 1st author impact of urban water supply on energy use in china a provincial and national...
TRANSCRIPT

1 23
Mitigation and Adaptation Strategiesfor Global ChangeAn International Journal Devoted toScientific, Engineering, Socio-Economicand Policy Responses to EnvironmentalChange ISSN 1381-2386 Mitig Adapt Strateg Glob ChangeDOI 10.1007/s11027-015-9648-x
Impact of urban water supply on energyuse in China: a provincial and nationalcomparison
Kate Smith, Shuming Liu, Yi Liu,Dragan Savic, Gustaf Olsson, TianChang & Xue Wu

1 23
Your article is protected by copyright and all
rights are held exclusively by Springer Science
+Business Media Dordrecht. This e-offprint
is for personal use only and shall not be self-
archived in electronic repositories. If you wish
to self-archive your article, please use the
accepted manuscript version for posting on
your own website. You may further deposit
the accepted manuscript version in any
repository, provided it is only made publicly
available 12 months after official publication
or later and provided acknowledgement is
given to the original source of publication
and a link is inserted to the published article
on Springer's website. The link must be
accompanied by the following text: "The final
publication is available at link.springer.com”.

ORIGINAL ARTICLE
Impact of urban water supply on energy use in China:a provincial and national comparison
Kate Smith1 & Shuming Liu1,2 & Yi Liu1 & Dragan Savic3 &
Gustaf Olsson4 & Tian Chang1 & Xue Wu1
Received: 28 December 2014 /Accepted: 9 March 2015# Springer Science+Business Media Dordrecht 2015
Abstract To reduce greenhouse gas (GHG) emissions and help mitigate climate change, urbanwater systems need to be adapted so that electrical energy use is minimised. In this study, energydata from 2011 was used to quantify energy use in China’s urban water supply sector. Theobjective was to calculate the energy co-benefits of urban water conservation policies andcompare energy use between China and other countries. The study investigated influencingfactors with the aim of informing the development of energy efficient urban water infrastruc-ture. The average energy use per cubic metre and per capita for urban water supply in China in2011 was 0.29 kWh/m3 and 33.2 kWh/cap year, respectively. Total GHG emissions associatedwith energy use in the urban water supply sector were 7.63 MtCO2e, or carbon dioxideequivalent. Calculations using these indicators showed significant energy savings could resultfrom water conservation measures. A comparison between provinces of China showed a directcorrelation between energy intensity of urban water supply and the population served per unitlength of pipe. This may imply energy and emission intensity can be reduced if more denselypopulated areas are supplied by a corresponding pipe density, rather than by a low-densitynetwork operating at higher flow rates. This study also found that while the percentage ofelectrical energy used for urban water supply tended to increase with the percentage ofpopulation served, this increase was slower where water supply was more energy efficientand where a larger percentage of population was already supplied.
Mitig Adapt Strateg Glob ChangeDOI 10.1007/s11027-015-9648-x
* Shuming [email protected]
1 School of Environment, Tsinghua University, Beijing 100084, China2 Tsinghua-Veolia Environnement Joint Research Center for Advanced Environmental Technology,
Tsinghua University, Haidian District, Beijing 100084, China3 Centre for Water Systems, University of Exeter, Exeter EX4 4QF, UK4 IEA, Lund University, Paradisgatan 2, Lund, Sweden
Author's personal copy

Keywords China . Climate change . Electrical energy use . Greenhouse gas emissions .
Sustainability . Water-energy nexus . Water infrastructure . Water supply
1 Introduction
Water and energy resources are inherently linked. Energy is needed to abstract, pump,treat, distribute, heat, cool and recycle water (Klein et al. 2005), and water is acritical component in the production of electricity and the extraction of oil, gas, coaland uranium. This link between the two resources has been termed the water-energynexus. It is only by taking this nexus into account that the contribution of the watersector to climate change can be reduced.
Coal-generated electricity is the main contributor to the overall environmentalburden and global warming potential of potable water production (Friedrich 2002;Friedrich et al. 2009). This is of particular consequence in China where coal is usedto produce over 80 % of all electricity (CEPP 2012). Lessons learned from a study ofenergy use and efficiency in China’s water supply sector would be particularlyvaluable for climate change mitigation in China and any country where electricitygeneration is emissions intensive.
Both energy and water are crucial to China’s economic growth. China’s 12th Five-YearPlan (2011–2015) prioritises energy conservation and includes targets to significantly cutenergy and water intensity, while also reducing carbon dioxide (CO2) emissions. The reasonis twofold. Conserving energy is necessary not only to lessen the environmental impact offuture development but also to reduce reliance on nonrenewable energy sources. Chinais now a net coal importer, a situation which compromises energy security andexposes the nation to rises in international coal prices (Green and Stern 2014;Wang et al. 2013). It is therefore imperative that potential for conserving energy inall sectors of the economy be identified.
The water sector in any country consumes a considerable amount of energy andthus contributes to climate change. Despite this, a thorough review of availableliterature by Rothausen and Conway (2011) found a general lack of research intoand understanding of energy use and greenhouse gas (GHG) emissions in the watersector. Taking the United States (US) as an example, more focus has been given tothe water for energy side of the water-energy nexus (Chavez-Rodriguez and Nebra2010; Gregory et al. 2011; Murray 2013). A topic generating particular attention isthe impact of hydraulic fracturing (fracking) on water supplies, with interest stemmingfrom the rise in popularity of this method for oil and gas extraction, and the largevolumes of water it uses in comparison to conventional extraction techniques(Gregory et al. 2011; Kargbo et al. 2010; Murray 2013; Schnoor 2011). The emphasison water use for energy production is also significant in China (Li et al. 2012; Liangand Zhang 2011; Pan et al. 2012; Schneider 2011; Yang et al. 2009), possibly due tothe extremely high demand for water in the energy sector. For example, water neededfor mining, processing and consuming coal accounts for about a fifth of China’s waterconsumption (Schneider 2011). A clear challenge in both the US and China is that ofsimultaneously reducing the CO2 emissions and water use associated with electricityproduction, and this requires full consideration of the interactions between water andenergy (Webster et al. 2013).
Mitig Adapt Strateg Glob Change
Author's personal copy

Since the 2011 review by Rothausen and Conway, a number of promising studies targetingenergy use and climate change mitigation in the water sector have been published. Recentstudies from the United Kingdom (UK) and Republic of Korea have investigated drinkingwater treatment plants (DWTPs) and wastewater treatment plants to determine whether GHG,or specifically CO2, emissions can be reduced without compromising effluent quality (Kyunget al. 2013; Sweetapple et al. 2014). Vieira et al. (2014) reviewed studies from Australia,Brazil, Taiwan, Spain and the UK on the energy intensity of rainwater harvesting systems andfound that these systems were not entirely environmentally friendly as they tended to be threetimes more energy intensive than centralised water supply systems. Moving water can be usedto produce energy and the potential for this within water distribution systems in Ireland and theUK was investigated by Corcoran et al. (2013). The first analysis of energy use and GHGemissions for water and wastewater sectors in India was published in 2013. It revealed thatenergy use for drinking water supply was twice that for wastewater treatment, and this wasattributed to the poor source water quality in India (Miller et al. 2013).
Certain characteristics of the water situation in China have the potential to create high demandfor energy in the water sector. Water scarcity and poor water quality have increased conveyanceand treatment requirements, and energy embodied in water infrastructure has grown as Chinacontinues to embark on ambitious hydraulic projects (Kahrl and Roland-Holst 2008).
As a result, energy use in the water sector in China has come under increased scrutiny inrecent years. The sector has been identified as one where there is opportunity for GHGemission reductions and climate change mitigation (Zhou et al. 2013). Among the first tofocus on this area, Kahrl and Roland-Holst (2008) used China’s input-output table structure todraw conclusions on the energy implications of water production and supply. Since then,water-related energy use has been estimated for the entire urban water cycle of bothChangzhou city (Zhou et al. 2013) and Beijing city (Hu et al. 2013). Energy consumptionfor the urban water system (including all water end uses) accounted for approximately 10 % ofChangzhou’s total energy consumption, with 70 % occurring in the industrial sector (Zhouet al. 2013). A detailed study by Chen et al. (2013) on urban household water end use inBeijing calculated the total associated energy input to be 4.88×10⁹ kWh or 0.9 % of Beijing’stotal energy consumption (Chen et al. 2013). Wang et al. (2012) derived the first estimate ofenergy intensity associated with groundwater extraction for 31 provinces, including crucialnorthern provinces where 70 % of irrigated area is groundwater fed. Zou et al. (2013) scaled upto include agricultural irrigation using both surface water and groundwater, which releasedbetween 39.04 and 57.03 million tonnes of carbon dioxide equivalent (MtCO2e).
Gaps still remain in existing knowledge on energy for urban water supply in China. Theterm ‘urban water supply’ is used in this study to refer to the processes of obtaining, producingand distributing water for urban areas. To the authors’ knowledge, this study is the first toquantify energy use for urban water supply at provincial level in China and analyse itsrelationship with population density and gross domestic product (GDP) related variables(e.g. per capita GDP). The potential of these variables to influence energy use deservesattention because the possible connection between energy use for water distribution andpopulation density has been referenced in the literature (Filion 2008), and water consumptionhas previously been modelled as a function of per capita GDP (Alcamo et al. 2003).Comparison of national level energy use for urban water supply for China with values in theliterature will reveal the differences or similarities between energy use for water supply indeveloped and developing countries. This may assist in identifying opportunities for climatechange mitigation. Countries, regions and cities that have been the subject of studies similar to
Mitig Adapt Strateg Glob Change
Author's personal copy

this one include the Middle East and North Africa, the USA, Australia, Oslo (Norway),Toronto (Canada), Sweden and California (US) (EPRI 2002; Kenway et al. 2008; Kleinet al. 2005; Lingsten et al. 2008; Racoviceanu et al. 2007; Siddiqi and Anadon 2011;Venkatesh and Brattebø 2011).
By filling these gaps, this study aims to address the topic of how urban water supplymanagement policy can be formulated to mitigate climate change. Mitigation is the reductionof GHG emissions to prevent or slow future global change. We approach this in two ways.Firstly, electricity use associated with urban water supply is quantified. This showspolicymakers in China how water conservation policies applied to urban areas can also beused as a strategy to reduce GHG emissions. Electricity use for urban water supply in China isnot the same as in other countries, but China’s energy indicators can be used as a guide outsideof China and the concept of reducing emissions by saving water can be incorporated into watermanagement policy in any country. Secondly, the study aims to determine what factorscorrelate with an increase in electricity use for urban water supply. Designing the water supplyprocess to control for these factors and decrease electricity use is a strategy that will alsoreduce GHG emissions. The analysis uses data from China, but the results are not specific toChina and are generally applicable to water supply in urban areas. Therefore, results from thissection of the study can be used by policymakers in other countries to design urban watersupply in a way that reduces emissions and mitigates climate change.
2 Materials and methods
This paper is an analysis of 2011 data on electrical energy use for urban water supply for themajority of provinces in China. The main data source is the Urban Water Supply Yearbook 2012(CUWA 2012). The other sources are the China Electric Power Yearbook (CEPP 2012), whichsupplied data on total electrical energy consumption for each province, and theNational Bureau ofStatistics, which supplied data on GDP and provincial population (NBS 2013a, 2013b). The studymethod can be summarised as follows: (1) Energy indicators and other variables were calculatedfrom provincial level data using Eqs. 1, 2, 3, 4, 5, 6, 7 and 8. (2) The Pearson correlationcoefficient, two-tailed significance and R2 were obtained for all variable combinations usingStatistical Package for the Social Sciences (SPSS) software. (3) Variable pairs were graphed usingscatter plots. (4) Correlations were identified. (5) Three energy indicators were calculated fromnational level data and compared to data taken from literature on other regions.
Descriptions of all variables mentioned in the following sections are displayed in Table 1alongside data sources and scope. Section 2.1 describes the main data source and scope.Sections 2.2 and 2.3 explain the process of calculating all variables and provide detailedexplanations of data used. Section 2.4 discusses correlation analysis. Section 2.5 brieflydescribes how data on China was compared to data from the literature.
2.1 Description and scope of main data source
The China Urban Water Association publishes the Urban Water Supply Yearbook with thesupport of provincial water associations. The 2012 Yearbook included data from 618 watercompanies in cities throughout China that was collected and reported by companies to theseassociations. It is assumed that companies provided accurate data to the best of their knowl-edge. Data is compiled by the Yearbook into six categories: water supply and sale (e.g. volume
Mitig Adapt Strateg Glob Change
Author's personal copy

supplied), pipes (e.g. pipe length), service (e.g. pressure standard compliance), production andmanagement (e.g. electricity used), finance (e.g. profit) and water price.
The Yearbook does not cover all urbanised areas. In China, cities, districts and counties can allpotentially be considered urbanised areas. Only data on cities (shì) is included in the Yearbook.This means that places ending in ‘shì’ for city are included but those ending in ‘xiàn’ for countyare not included. For example, Ningxia has data for LíngwǔShì, but not Yǒngníng Xiàn.
The only energy source included in the Yearbook and considered in this study is electricitypurchased from the grid, otherwise known as electrical energy. It is important to incorporatenatural gas, biogas and diesel into energy calculations for water end use, wastewater treatmentand agricultural irrigation, respectively (Kenway et al. 2008; Klein et al. 2005; Rothausen andConway 2011; Wang et al. 2012), but it can be assumed that water supply is primarily poweredby purchased electricity (Kenway et al. 2008; Klein et al. 2005; Miller et al. 2013; Venkateshand Brattebø 2011). Energy embodied in water infrastructure and chemicals or consumed inthe construction and demolition phases is also not included. This energy is generally much lessthan that consumed during the operational phase of a water system (Buckley et al. 2011; Filion2008; Friedrich 2002; Racoviceanu et al. 2007). This study does not include energy use forwater heating and other water end use.
2.2 Electrical energy consumption for urban water supply
2.2.1 Energy use for urban water supply as a percentage of total electrical energy use
Data on total electrical energy consumption for urban water supply (kWh) for cities in 29provinces was taken from the Urban Water Supply Yearbook 2012. A total of 26 provinces had
Table 1 Datasets and variables used in the study. Table entries provide the symbol and description of eachdataset, as well as the dataset scope and source and the variables calculated using this dataset
Data Unit Scope Variables calculated
Ewater Electrical energy use for urbanwater supplya
kWh Urban (used by urban watersupply companies (UWSC))
E%, Eper unit, Eper cap
Etot Total electrical energy use forall purposesb
kWh Entire province E%
V Urban water supply volumea m3 Urban (supplied by UWSC) Eper unitPopurb Population served by urban water
supplyapeople Urban (served by UWSC) Eper cap, Pop%,
Popper pipePoptot Total provincial populationc people Entire province Pop%, GDPper capLpipe Total length of pipelines for water
distributionakm Urban (water distribution
system (WDS)Popper pipe
A Total area serveda km2 Urban (WDS) Popper areaGDPtot Total provincial gross domestic
product (GDP) across all industriescyuan Entire province GDPper cap, GDP%i
GDPi GDP from primary (i=1), secondary(i=2) or tertiary (i=3) industriesc
yuan Entire province GDP%i
Data sources:a Urban Water Supply Yearbookb China Electric Power Yearbookc National Bureau of Statistics website
Mitig Adapt Strateg Glob Change
Author's personal copy

sufficient energy consumption data for provincial level comparison. A further three provinces,Gansu, Tibet and Qinghai, are included in overall national data. No data was available forChongqing, Yunnan or the Special Administrative Regions.
In this study, the companies who supply water to urban areas are called urban water supplycompanies. Electrical energy consumption for urban water supply for a given province (Ewater)refers to all electricity used by the province’s urban water supply companies for watertreatment and pumping within DWTPs and urban water distribution systems. It also includeselectricity used for abstraction and conveyance of source water to DWTPs as long as this is theresponsibility of these companies (see Fig. 1). Water must be delivered with enough pressureto reach the sixth floor of a building (PRC 1999). Ewater does not include electricity used fordaily management of urban water supply companies (e.g. lights, computers).
China has a number of water diversion projects (e.g. South-North Water Transfer Project),which transfer source water from one province to another. These trans-boundary projects aregenerally administered by China’s Ministry of Water Resources (MWR), which is responsiblefor abstracting source water and conveying it to a reservoir within the receiving province, atwhich point part of the water is sold on to urban water supply companies. In these cases, dataprovided in the Urban Water Supply Yearbook for a particular province only includes electricalenergy consumption from the point within the province where water comes under the controlof urban water supply companies. It does not include electrical energy used by the MWRduring abstraction and conveyance, which is considered to be outside the administrativeboundary of the urban water supply companies in that province. This data was not availablefor use in this study.
Data on total electrical energy consumption for each province (kWh) was taken from theChina Electric Power Yearbook 2012 (CEPP 2012). Total electrical energy consumption (Etot)includes all electrical energy used for any purpose (industry, agriculture, household, etc.)within the entire province. Equation 1 was used to calculate electrical energy consumption for
Abstraction outside boundary
DWTPs: Treatment
and pumping
WDS:Treatment
and pumpingUrban end use
Administrative boundary of urban water supply companies for a given province
Conveyance outside boundary
Abstraction inside boundary
Conveyance inside boundary
Water source
Water source
Fig. 1 Study boundary. For a given province, electrical energy consumption for urban water supply (Ewater) isrestricted to electricity required by the province’s urban water supply companies for treatment and pumpingwithin drinking water treatment plants (DWTPs) and the water distribution system (WDS), as well as electricityused for abstraction and conveyance of source water to drinking water treatment plants as long as this is theresponsibility of these companies (as shown by the four blue boxes). Electrical energy use for daily managementof water companies and inter-provincial water transfer by China’s Ministry of Water Resources is not included.The latter is considered to be outside the administrative boundary of the province’s urban water supply companies(as shown by the dashed line)
Mitig Adapt Strateg Glob Change
Author's personal copy

urban water supply for each province as a proportion of total province-wide electrical energyconsumption.
E% ¼ Ewater
Etot� 100 ð1Þ
where E%=percentage of total province-wide electrical energy use that is for urban watersupply; Ewater=total electrical energy used for urban water supply (kWh); and Etot=totalelectrical energy used for all purposes across the entire province (kWh).
2.2.2 Per capita energy use and energy intensity for urban water supply
Data on total urban water supply volume (m3) and population served by urban watersupply was taken from the Urban Water Supply Yearbook. The total volume of water thatis produced by urban water supply companies and leaves the DWTP is called urban watersupply volume (V). This includes any water that is later lost during the distributionprocess. All people who consume water provided by urban water supply companies areconsidered part of the population served by urban water supply (Popurb), regardless ofwhether they are using the water for residential, agricultural, commercial, industrial ormilitary purposes. According to the Yearbook, the population served by urban watersupply is 23 % of China’s total population and represents for over 93 % of the combinedurban population of cities (shì) included in the Yearbook (CUWA 2012). This is muchsmaller than the urbanisation figure provided by China’s National Bureau of Statistics,which was around 54 % for 2013 (NBS 2014). Equation 2 gives the electrical energyintensity for urban water supply, otherwise known as energy consumption per unit ofwater. Per capita electrical energy use for urban water supply can be calculated byreplacing V with Popurb as shown in Eq. 3.
Eper unit ¼ Ewater
Vð2Þ
Eper cap ¼ Ewater
Popurbð3Þ
where Eper unit=energy use per cubic metre of water (kWh/m3); Ewater=total electricalenergy used for urban water supply (kWh); V=total urban water supply volume (m3);Eper cap=electrical energy required for urban water supply per person served (kilowatthours per capita per year (kWh/cap year)); and Popurb=population served by urbanwater supply.
2.3 Potential influencing factors
Many factors can influence energy consumption for urban water supply. It is difficult to sourceand compare data at a provincial or national level for some of these factors (e.g. water source,raw water quality). The authors selected population density and GDP-related variables basedpartly on data availability and also on the hypothesis that these variables might influenceenergy consumption for urban water supply.
Mitig Adapt Strateg Glob Change
Author's personal copy

2.3.1 Population variables
Population statistics available on China’s National Bureau of Statistics website provided 2011data on total provincial population (including rural population) (NBS 2013a). The populationserved by urban water supply as a proportion of the total provincial population is given byEq. 4.
Pop% ¼ PopurbPoptot
� 100 ð4Þ
where Pop%=percentage of the total provincial population that is served water by urban watersupply companies; Popurb=population served by urban water supply; and Poptot=total popu-lation of province (including urban and rural).
Population density was calculated as a function of both pipe length for water distri-bution (km) and total area served (km2) using data on both these variables taken from theUrban Water Supply Yearbook. Total area served (A) is defined as the total area coveredby the looped water distribution system. It also includes the area within 100 m on eachside of every branch pipe. Pipe length for water distribution (Lpipe) is the total length ofall pipelines used to distribute water from the water distribution pump at the outlet of theDWTP to the consumer’s water meter. If more than one pipe is laid in the same street,the length of each individual pipe contributes to Lpipe. Newly installed pipes yet to beused do not contribute. Pipes used to carry raw water from the water source to theDWTP are not included. Inclusion of these pipes would have little meaning as urbanpopulation is concentrated over pipes used for treated water distribution. Populationserved per unit area is given by Eq. 5. Population served per unit length of pipe canbe calculated by replacing A with Lpipe as shown in Eq. 6.
Popper area ¼Popurb
Að5Þ
Popper pipe ¼PopurbLpipe
ð6Þ
where Popper area=population served per square kilometre of area served (people/km2);Popurb=population served by urban water supply; A=total area served (km2); Popper pipe=population served per kilometre pipe for water distribution (people/km); and Lpipe=total lengthof pipes used for water distribution (km).
2.3.2 Gross domestic product variables
GDP data for primary, secondary and tertiary industries was taken from the National Bureau ofStatistics (NBS 2013b). This data is for the entire province because it is difficult to access andaggregate city level GDP data that matches the population served by urban water supply usedin this study. The National Bureau of Statistics describes primary industry as referring toagriculture, forestry, animal husbandry and fishery. Secondary industry refers to mining,manufacturing, electricity, gas and water production and supply, and construction. Tertiaryindustry includes any industry not covered by primary or secondary industries (e.g. education,hospitality). Province-wide per capita GDP was calculated using Equation 7. GDP from
Mitig Adapt Strateg Glob Change
Author's personal copy

primary, secondary and tertiary industries was calculated as a percentage of total provincialGDP according to Eq. 8.
GDPper cap ¼ GDPtot
Poptotð7Þ
GDP%i ¼ GDPi
GDPtot� 100 ð8Þ
where GDPper cap=province-wide per capita GDP (not restricted to urban areas) (yuan/cap);GDPtot=total provincial GDP across all industries (yuan); Poptot=total population of province(including urban and rural);GDP%i=percentage of total provincial GDP originating from industryi; and GDPi=GDP from primary (i=1), secondary (i=2) or tertiary (i=3) industries (yuan).
2.4 Provincial level: determining correlations between variables
The following method was used to determine the relationship between variables mentioned inSections 2.2 and 2.3. The aim of this analysis was to identify connections between energy usevariables and ‘potential influencing factors’. Data was entered into SPSS software. The SPSScorrelation and regression functions were used to calculate the Pearson correlation coefficient(r), two-tailed significance (p value), degrees of freedom (df) and R2 (=r·r) for any two pairs ofvariables (e.g. Eper unit and Pop%). A correlation between two variables is considered weakwhen the absolute value of r is between 0.1 and 0.3, moderate when it is between 0.3 and 0.5and strong when it is between 0.5 and 1.0. A positive Pearson correlation coefficient indicatesa direct relationship, and a negative coefficient indicates an inverse relationship. The correla-tion between two variables can be deemed ‘significant’ if the p value is less than 0.05 and‘highly significant’ if this value is less than 0.01. The R2 value provides a further indication ofwhat type of relationship exists, with R2=1 being the strongest relationship and R2=0indicating no relationship. The degrees of freedom for the correlation are the number of datapoints (N) used for the correlation minus 2 (N−2). This value is given in brackets after thePearson correlation coefficient (e.g. r(22)=0.75). Scatter graphs of variable pairs were alsoplotted to identify whether nonlinear trends existed. Error ranges were not provided with theoriginal data so it was not possible to provide uncertainty estimates for individual provincevalues or correlation coefficients. When provincial values were grouped and summed to giveaverage values, sample-based standard deviations were calculated using Microsoft Excel as away of quantifying uncertainty in these averages.
2.5 National level: comparing China with other regions
The variables E%, Eper unit and Eper cap were calculated according to Eqs. 1, 2 and 3,respectively, for China as a whole using national level data from the sources specifiedpreviously. As national values for E%, Eper unit and Eper cap are not the result of averagingprovincial level values for these variables, no standard deviation could be calculated.
To make comparisons between China and other countries, regions or cities, data onE%, Eper unit and Eper cap was taken from the literature. Given the predominance ofelectricity as the overwhelming source of energy in water supply, it is assumed that all energy
Mitig Adapt Strateg Glob Change
Author's personal copy

values found in the literature can be taken as referring to electrical energy. Some studiesexplicitly state that only electricity was considered (e.g. EPRI 2002); others consider one ortwo other energy sources but recognise their contribution is small to the point of beingnegligible (Venkatesh and Brattebø 2011). Values for any one variable were converted to thesame units.
3 Results and discussion
3.1 Analysis of provincial level data
This section discusses the results of provincial level analysis using methods discussed inSections 2.2–2.4. Figure 2 shows the highly significant, strong, direct correlation (r(22)=0.75;p=0.00) between electrical energy intensity for urban water supply (Eper unit) and populationserved per unit length of pipe (Popper pipe). In this case, two outliers (Liaoning and Shaanxi)were removed before analysis. There was no significant correlation between Eper unit andpopulation served per square kilometre of area served (Popper area) (r(24)=0.05; p=0.80; R
2=0.00). The correlation between Eper unit and Popper pipe shows that these variables tend toincrease together. While this correlation cannot demonstrate with certainty that greater popu-lation density along a pipeline leads to increased energy intensity for water supply, it showsthat this may be possible.
One potential explanation for this correlation is that an increase in the number of peopleconcentrated along a given pipeline pushes up demand (i.e. flow) at each node, which in turnincreases frictional losses within the pipe and leads to a rise in pumping energy input per cubicmetre of water supplied. Energy or head loss (hloss) due to friction in a pipe is directlyproportional to the square of the volumetric flow rate (Q) according to the Darcy-Weisbachformula (hlossαQ
2). This means when the original flow doubles within a pipe, energy lossquadruples. If instead two pipes are used to carry twice the original flow, energy loss due to
Fig. 2 Electrical energy intensity for urban water supply (Eper unit) vs population served per unit length of pipe(Popper pipe) for 24 provinces (outliers Liaoning and Shaanxi have been removed). r(22)=0.75; p<0.01)
Mitig Adapt Strateg Glob Change
Author's personal copy
friction only doubles. Based on the direct correlation between Eper unit and Popper pipe, it couldbe that, if more densely populated areas are supplied by a relatively dense (rather than sparse)network of pipes, energy input per cubic metre of water supplied can be reduced. If the numberof people serviced by the network increases, adding pipes to the existing network rather thanrelying on the current available length of pipe may reduce the likelihood of an increase inelectricity intensity for water supply, thereby adapting the network to minimise emissions. Theresult is likely not limited to networks in China but could be applicable to networks in othercountries. The cost, energy use and GHG emissions associated with adding a pipeline and thelikelihood of offsetting these with energy savings would certainly need to be considered if thisstep was taken.
It is interesting to note that this analysis revealed little correlation between provincial levelper capita GDP (GDPper cap) and electrical energy consumption for urban water supply as apercentage of total electrical energy consumption (E%) (r(24)=0.13; p=0.51; R
2=0.02). Therelationship between per capita GDP and electrical energy intensity (Eper unit) was also notsignificant (p=0.12). The first result (the absence of correlation between GDPper cap and E%)could be linked to the fact that there is also no correlation between the percentages of GDPoriginating from primary (GDP%1) or tertiary (GDP%3) industries and E% (r(24)=0.04; p=0.87 R2=0.00 for variables GDP%1 and E%; r(24)=0.30; p=0.14; R
2=0.09 for variablesGDP%3 and E%). Provinces that rely more on primary industries tend to have lower per capitaGDP than provinces where tertiary industries dominate. Given this, if neither GDP%1 norGDP%3 correlate with E%, it does not seem unexpected that there should also be no clear trendthat links higher or lower per capita GDP with E%. The second result (the lack of correlationbetween GDPper cap and Eper unit) may be due to the fact that electricity required for watersupply is more related to factors like water regulations, pumping requirements and populationserved per pipe length (as previously discussed) that are not dependent on whether a provincehas high GDP per head of population or not. The implication of these results is that the impacton energy supplies in China of providing potable water to urban populations in provinces withhigh per capita GDP may be similar to that for urban populations in provinces with low percapita GDP, assuming all other factors are the same. In this case, the associated GHGemissions would also be similar.
Coefficients for the relationship between E% and the percentage of a province’s GDPoriginating from secondary industry (GDP%2) are r(24)=−0.37, p=0.07 and R2=0.14. The pvalue is slightly greater than 0.05, but the Pearson coefficient indicates there could be amoderate, inverse correlation between these two variables. In other words, the percentage ofenergy consumed for urban water supply may tend downwards as the percentage of GDPoriginating from secondary industry increases. Secondary industry includes highly energy-intensive industries like mining and manufacturing which could serve to diminish the percent-age contribution of water supply to overall electrical energy use. It could also be that industrieslike the electricity industry, which consume large amounts of water, reduce the availability ofwater for other uses. As stated previously, water used in secondary industry is included in totalurban water supply volume if it is supplied by urban water supply companies. This is unlikelyto be the case for an industry like mining as mines are generally located far away from citiesand tend to take water directly from the water source. On the other hand, many manufacturingindustries are located within city boundaries and may well be supplied with water by urbanwater supply companies.
There is a moderate (r(24)=0.41; R2=0.17) correlation between the percentage ofpopulation served by urban water supply (Pop%) and the electrical energy
Mitig Adapt Strateg Glob Change
Author's personal copy

consumption for urban water supply as a percentage of total electrical energy con-sumption (E%). The p value is 0.04, so this relationship can be considered significant.The data appears to follow two trends, which are shown using separate circles andtrend lines in Fig. 3. The line with the smaller gradient corresponds to a group (groupB) of 11 provinces that includes highly urbanised areas like Beijing, Shanghai andTianjin, along with two inland provinces, Ningxia and Inner Mongolia (r(9)=0.87; p=0.00; R2=0.76). The line with the steeper slope corresponds to a group (group A)containing the remaining 15 and 2 overlapping provinces (r(15)=0.91; p=0.00; R2=0.83).
For both of these groups, there is a strong, highly significant, direct correlation betweenPop% and E%. It seems sensible that as the percentage of population served by urban watersupply increases, so should the amount of electricity required for urban water supply as apercentage of total electricity consumed in the province. This would imply GHG emissions forurban water supply as a percentage of total GHG emissions for all electricity use within theprovince would also increase. Comparing the two groups, it appears that the same increase inPop% causes a smaller increase in E% for group B than for group A. The difference betweenthe rates of increase (i.e. slope) for the two groups may reveal a difference in the efficiency ofwater supply (as defined by Eper cap and Eper unit) between the provinces.
Table 2 displays information regarding Eper cap, Eper unit, Pop% and GDPper cap for theindividual provinces in groups A and B, as well as averages and standard deviations of thesevariables for each group. The averages reveal significant differences between the two groups.In group B, a much larger percentage of each province’s population is served by urban watersupply (35±standard deviation of 19 % for group B as opposed to 20±8 % for group A).When compared to group A, provinces in group B also tend to use 30 % less energy per cubicmetre of water (0.27±0.09 kWh/m3 for group B and 0.35±0.10 kWh/m3 for group A) and32 % less energy per capita (26.5±4.7 kWh/cap year for group B and 35.0±12.0 kWh/cap yearfor group A). They also produce fewer GHG emissions, which are directly proportional to
Fig. 3 Electrical energy consumption for urban water supply as a percentage of total electrical energyconsumption (E%) vs population served by urban water supply as a percentage of total provincial population(Pop%) for 26 provinces. For group A, r(15)=0.91; p<0.01. For group B, r(9)=0.87; p<0.01
Mitig Adapt Strateg Glob Change
Author's personal copy

Tab
le2
GDPpercapita,electricalenergyusepercubicmetreandpercapitaforurbanwatersupply,and
percentage
oftotalpopulationserved
byurbanwatersupplyforprovincesin
groups
AandB
Group
AEper
unit(kWh/m
3)
Epercap
(kWh/capyear)
Pop
%(%
)GDPpercap
(yuan/cap)
Group
BEper
unit
(kWh/m
3)
Epercap
(kWh/capyear)
Pop
%(%
)GDPpercap
(yuan/cap)
Shanxi
0.58
42.7
1931,467
Beijin
g0.35
27.3
6982,866
Liaoning
0.51
69.8
3350,808
Tianjin
0.17
18.7
4887,391
Jilin
0.48
38.6
3138,498
InnerMongolia
0.36
23.2
2658,122
Heilongjiang
0.32
29.1
2632,839
Anhui
0.28
30.1
1925,715
Shanghai
0.17
29.4
5683,390
Jiangxi
0.26
31.6
1826,258
Jiangsu
0.27
35.5
4262,433
Henan
0.33
22.8
1828,641
Zhejiang
0.19
24.5
4659,380
Hubei
0.30
40.3
2334,300
Fujian
0.23
30.6
2347,596
Hunan
0.25
35.1
929,938
Shandong
0.29
23.1
2147,354
Guangdong
0.27
53.4
2951,007
Ningxia
0.46
31.0
3733,361
Guangxi
0.32
42.4
1825,467
Xinjiang
0.20
24.8
630,299
Hainan
0.24
28.8
3229,091
Hebei
0.32
23.6
1434,119
Sichuan
0.31
30.2
1626,147
Guizhou
0.40
32.6
1516,409
Shaanxi
0.34
26.7
1933,520
Xinjiang
0.20
24.8
630,299
Hebei
0.32
23.6
1434,119
Average
0.35
35.5
2032,031
Average
0.27
26.5
3556,937
Standard
Deviatio
n0.10
12.0
88623
Standard
deviation
0.09
4.7
1920,742
Mitig Adapt Strateg Glob Change
Author's personal copy

electrical energy use in this study. This comparison provides useful information. It reveals that,while energy use for urban water supply as a percentage of total energy use may tend toincrease as the percentage of population served by urban water supply increases, this increasecould be slower for areas where water supply is more energy efficient (i.e. have loweremissions) and where a larger percentage of population is already served by urban watersupply. This could be because areas that already have an urban water supply system with lowerenergy input requirements (per capita and per cubic metre) and a larger consumer base needless energy as a percentage of total electrical energy to integrate the same percentage of newconsumers into the existing system. Such a system would be better adapted to minimisingGHG emissions even as customers increase.
3.2 Analysis of national level data
This section discusses the results of national level analysis using methods discussed inSections 2.2 and 2.5. Data on energy use for urban water supply is shown for a number ofregions in Table 3. Apart from the entry for China from the current study, all values were takenfrom the literature.
Before comparing different regions of the world, the following points should be addressed.Firstly, this study on China does not include the energy required to heat tap water to adrinkable standard. Some might argue that results obtained are then not comparable to regionswhere tap water is safe to drink, but a rough calculation would suggest otherwise. AssumingChinese households use an average of 1.2 kWh/m3 to boil water for drinking and drink anaverage of 1.4 L per person per day (Chen et al. 2013), 1.9×10⁸ kWh of electricity would berequired per year to boil drinking water for the 3.1×10⁸ people served by urban water supplyand covered by this study. This increases China’s Eper cap from 33.2 to 33.8 kWh/cap year,which is negligible, particularly given the similar tendency of people in countries like the US,the UK and Australia to cool water or boil it for making tea or coffee.
Secondly, a number of studies available on energy use in the water sector do not considerwastewater treatment and water supply separately. This is most problematic when comparingelectrical energy use for urban water supply as a percentage of total electrical energy use.Studies on Australia, the US and the UK all give the combined energy use for wastewateroperations and water supply as a percentage of total energy use. It is not possible to separatethese values into percentages for water and wastewater, which makes comparison betweenregions using this indicator difficult because wastewater treatment and transport can be thedominant energy user in some areas (e.g. Melbourne) (Kenway et al. 2008). Nevertheless,most energy values provided in Table 3 are only for water supply; those that include water andwastewater are indicated in the footnotes.
Thirdly, the population scale considered varies across different studies. Few full country levelstudies are available in the literature so similar studies at city (e.g. Oslo), state (e.g.California,US), country (e.g. Australia) and regional (e.g. Middle East and North Africa) levelhave been included in this comparison. The population served by urban water supply as apercentage of total population also differs considerably between studies. For example, in thecurrent study on China, the population considered as having access to urban water supply andincluded in data from the 2012 Urban Water Supply Yearbook was 23 % of China’s totalpopulation for the same year (CUWA2012; NBS 2013a). On the other hand, a comparable studyon Australia conducted by Kenway et al. (2008) included six cities, the combined population ofwhich was just under 60 % of Australia’s total population, almost three times the percentage of
Mitig Adapt Strateg Glob Change
Author's personal copy

Table 3 Energy indicators for urban water supply for regions represented in the literature. Indicators areelectrical energy use per cubic metre and per capita and electrical energy use for urban water supply as apercentage of total electrical energy consumption
Region, author and date Eper unit (kWh/m3) Eper capita(kWh/cap year)
E% (%)
WorldOlsson 2012a
2–3ab
Arabian GulfSiddiqi and Anadon 2011
4–12c
Saudi ArabiaSiddiqi and Anadon 2011
9d
ChinaCurrent study 2014
0.29 (2011) 33.2 (2011) 0.22 (2011)
ChinaKahrl and Roland-Holst2008
0.0931 (2004)0.0794 (2002/’97)
0.3 (2004)0.4 (2002/’97)
IndiaMiller et al. 2013
0.3 18
AustraliaKenway et al. 2008
0.79e 164a 0.2a
USAEPRI 2002
0.482 (gw)0.371–0.392 (sw)
4ab
USAHutson 2004; EPRI 2002
0.512f 127f
UKOlsson 2012a; Rothausenand Conway 2011
0.59 3ab
GermanyMeda et al. 2012
0.15–1.71 (overall)0.12–1.13 (convey)0.03–0.58 (distrib.)
22 (overall)5–50 (convey.)1–26 (distrib.)
NetherlandsOlsson 2012b
0.47
SwedenOlsson 2012b
0.46 (overall)g
0.24 (convey.)0.12 (treat.)0.10 (distrib.)
10.4 (distrib. only)
CaliforniaStokes and Horvath 2009
4.9h
Californiai
Meda et al. 2012;Klein et al. 2005
0.21–5.61 (overall)0–1.06 (convey.)0.03–4.23 (treat.)0.18–0.32 (distrib.)
0–106 (convey.)3–423 (treat.)18–32 (distrib.)
3j
Oslo, NorwayVenkatesh andBrattebø 2011
0.40 72k
Toronto, CanadaRacoviceanu et al. 2007
0.68 136
Mitig Adapt Strateg Glob Change
Author's personal copy
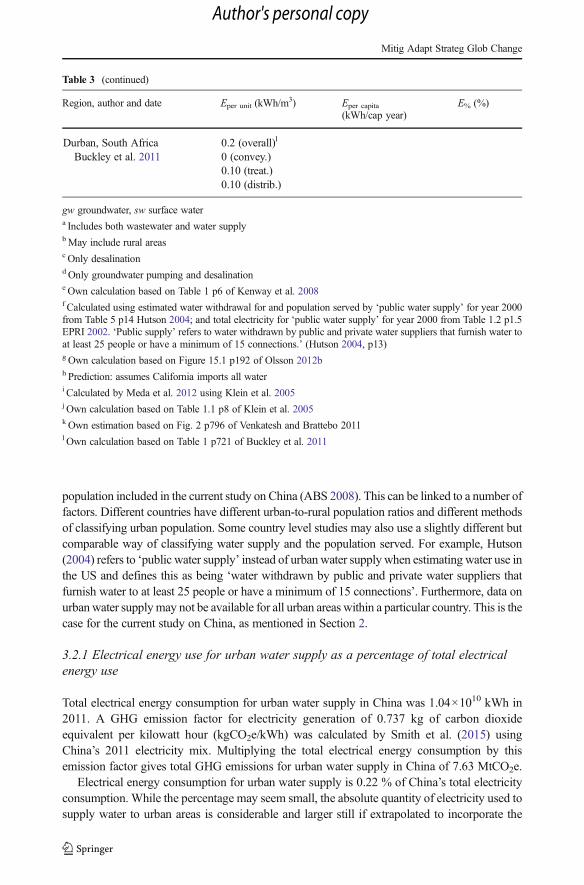
population included in the current study on China (ABS 2008). This can be linked to a number offactors. Different countries have different urban-to-rural population ratios and different methodsof classifying urban population. Some country level studies may also use a slightly different butcomparable way of classifying water supply and the population served. For example, Hutson(2004) refers to ‘public water supply’ instead of urbanwater supply when estimating water use inthe US and defines this as being ‘water withdrawn by public and private water suppliers thatfurnish water to at least 25 people or have a minimum of 15 connections’. Furthermore, data onurbanwater supplymay not be available for all urban areas within a particular country. This is thecase for the current study on China, as mentioned in Section 2.
3.2.1 Electrical energy use for urban water supply as a percentage of total electricalenergy use
Total electrical energy consumption for urban water supply in China was 1.04×10¹⁰ kWh in2011. A GHG emission factor for electricity generation of 0.737 kg of carbon dioxideequivalent per kilowatt hour (kgCO2e/kWh) was calculated by Smith et al. (2015) usingChina’s 2011 electricity mix. Multiplying the total electrical energy consumption by thisemission factor gives total GHG emissions for urban water supply in China of 7.63 MtCO2e.
Electrical energy consumption for urban water supply is 0.22 % of China’s total electricityconsumption. While the percentage may seem small, the absolute quantity of electricity used tosupply water to urban areas is considerable and larger still if extrapolated to incorporate the
Table 3 (continued)
Region, author and date Eper unit (kWh/m3) Eper capita(kWh/cap year)
E% (%)
Durban, South AfricaBuckley et al. 2011
0.2 (overall)l
0 (convey.)0.10 (treat.)0.10 (distrib.)
gw groundwater, sw surface watera Includes both wastewater and water supplybMay include rural areasc Only desalinationd Only groundwater pumping and desalinatione Own calculation based on Table 1 p6 of Kenway et al. 2008f Calculated using estimated water withdrawal for and population served by ‘public water supply’ for year 2000from Table 5 p14 Hutson 2004; and total electricity for ‘public water supply’ for year 2000 from Table 1.2 p1.5EPRI 2002. ‘Public supply’ refers to water withdrawn by public and private water suppliers that furnish water toat least 25 people or have a minimum of 15 connections.’ (Hutson 2004, p13)g Own calculation based on Figure 15.1 p192 of Olsson 2012bh Prediction: assumes California imports all wateri Calculated by Meda et al. 2012 using Klein et al. 2005j Own calculation based on Table 1.1 p8 of Klein et al. 2005k Own estimation based on Fig. 2 p796 of Venkatesh and Brattebo 2011l Own calculation based on Table 1 p721 of Buckley et al. 2011
Mitig Adapt Strateg Glob Change
Author's personal copy

urban population as estimated by China’s National Bureau of Statistics (approximately 2.4×10¹⁰ kWh for 54 % urban population) (NBS 2014). This indicates urban water supply is asector where credible energy savings and GHG emissions reductions can be made.
The percentage (0.22 %) calculated in this study is similar to values (0.3 % in 2004)provided for China by Kahrl and Roland-Holst (2008) and approximately the same as thecombined percentage for water and wastewater in Australia (0.2 %) (Kenway et al. 2008).When compared with the US (4 %) and the UK (3 %), the percentage for China seems quitelow, which is likely due to the inclusion of wastewater and larger population percentages in theformer two studies (EPRI 2002; Rothausen and Conway 2011). The unusually high value forCalifornia (3 % just for water supply) is not surprising given the topography of California andthe considerable amount of energy that goes into pumping water from northern to southernCalifornia over the Tehachapi Mountains (Cohen et al. 2004; Olsson 2012b). Percentages forSaudi Arabia and the rest of the Arabian Gulf are only for desalination and/or groundwaterpumping (see Table 3) but are still extremely high. These values are evidence of an unusuallyheavy reliance on very energy-intensive water sources (Siddiqi and Anadon 2011). Highpercentages for California and the Arabian Gulf indicate that heavier reliance on water transferprojects and desalination in China in the future would significantly increase energy use forurban water supply if included in calculations. Thus, while such projects may offer relief fromwater shortages, they would compromise China’s ability to reduce emissions and mitigateclimate change.
3.2.2 Energy intensity and per capita energy consumption for urban water supply
In China, supplying a cubic metre of water required 0.29 kWh of electrical energy in 2011.This value can be used to calculate the energy co-benefit of water conservation measures. Forexample, if 12 billion tonnes of water can be conserved through measures such as waterefficiency, industry restructuring or leakage control, this will save approximately 3.5 billionkilowatt hours of energy that would otherwise have been consumed during the water supplyprocess. This is the electricity produced annually by a typical 500-MW coal power plant.Using the emission factor of 0.737 kgCO2e/kWh, this is equivalent to 2.6 MtCO2e or the CO2
emissions associated with the consumption of 6 million barrels of oil (USEPA 2014). Thus, itis clear that water savings made to meet the 30 % reduction in water intensity (water consumedper unit of value-added industrial output) stipulated in China’s 12th Five-Year Plan (PRC2011) can also lead to significant energy savings and emissions reductions if the waterconserved is part of the urban water supply system. Similar calculations would reveal evengreater savings for many of the other regions listed in Table 3.
The value calculated in this study (0.29 kWh/m3) is different from the values calculated byKahrl and Roland-Holst (2008), which range from 0.0794 kWh/m3 in 1997 to 0.0931 kWh/m3
in 2004, but compares well with values found in the literature for other regions (see Table 3).The energy intensity for urban water supply in China is comparable to the lower bound ofenergy intensities associated with groundwater extraction in China, which range from 0.21 to0.66 kWh/m3 (Wang et al. 2012), but is much lower than the energy input for water end use,which requires an average of 7.86 kWh/m3 in Beijing (Chen et al. 2013). Studies by Griffiths-Sattenspiel and Wilson (2009) and Cohen et al. (2004) have both found that energy for waterend use tends to be much higher than energy for water supply.
The electrical energy intensity for China calculated in this study is comparable to that ofIndia (0.3 kWh/m3) (Miller et al. 2013). Rough calculations based on values available in
Mitig Adapt Strateg Glob Change
Author's personal copy

Table 3 reveal that European countries appear to have an average energy intensity for watersupply of around 0.5 kWh/m3, about 0.2 kWh/m3 higher than China. Energy intensity of urbanwater supply in China is more than 2.5 times less than Australia where intensity is 0.79 kWh/m3, influenced partly by high energy demands for pumping in very dry cities like Adelaide anddesalination in Perth (Kenway et al. 2008). Average energy intensity for urban water supply inthe US starts at 0.371 kWh/m3 when surface water is used as the source, over 25 % higher thanChina (EPRI 2002). Values available for Toronto (0.68 kWh/m3) and California (0.21–5.61 kWh/m3) are also generally higher on average than China (Meda et al. 2012;Racoviceanu et al. 2007). If California were to rely entirely on imported water, the energyintensity could be around 4.9 kWh/m3, making the difference between California and Chinamore extreme (Stokes and Horvath 2009).
As for per capita energy consumption, China also has a relatively low value (33.2 kWh/cap year), which is more comparable to that of India (18 kWh/cap year) than those of Australia(164 kWh/cap year) and the USA (127 kWh/cap year) (EPRI 2002; Hutson 2004; Kenwayet al. 2008; Miller et al. 2013). Per capita energy consumption is also less for China than forboth Oslo, Norway(72 kWh/cap year) and Toronto (136 kWh/cap year) (Racoviceanu et al.2007; Venkatesh and Brattebø 2011). It would appear that China and India use less electricalenergy per cubic metre and per person to supply water to urban areas than the developedcountries listed in Table 3. An initial interpretation might be that higher density living (largerpopulation per square kilometre) in India and China reduces energy consumption due topumping and contributes to this difference. In this case, water supply systems in denser citieswould be more likely to help mitigate climate change. During provincial level comparison forChina, correlation analysis involving electrical energy intensity for urban water supply andpopulation served per unit area was inconclusive.
3.3 Future studies
The difference in per capita and per unit electrical energy consumption for urban water supplybetween developing and developed countries revealed in this study would benefit from a morespecific investigation. It could be that a smaller scale study involving a selection of cities inboth developed and developing countries may reveal a correlation between electrical energyintensity and population served by urban water supply per square kilometre. The current studycould be extended in the future to include energy consumption for wastewater disposal inChina. It would also be interesting to directly calculate the effect of the South-North WaterTransfer Project on the energy intensity of water supply to northern provinces, rather than relyon energy intensity values for the California State Water Project as has been done in the past.
4 Conclusions
This study used 2011 data to quantify energy use for urban water supply in China anddetermine how urban water supply can be managed in a way that mitigates climate change.Mitigation involves reducing GHG emissions, and electrical energy use is a key indicator ofthe contribution of the water supply sector to GHG emissions.
Total electrical energy consumption for urban water supply in China was 1.04×10¹⁰ kWhin 2011, and the associated GHG emissions were 7.63 MtCO2e. The average electrical energyintensity and per capita electrical energy consumption for urban water supply were 0.29 kWh/
Mitig Adapt Strateg Glob Change
Author's personal copy

m3 and 33.2 kWh/cap year, respectively. These energy indicators were similar to those of Indiaand low compared to developed countries represented in the literature. This could be due tohigher density living (people/km2) in India and China, which may reduce energy and emis-sions associated with pumping water over long distances. Nevertheless, simple calculationsusing the energy indicators for China revealed that significant energy savings and emissionreductions could result from urban water conservation measures stemming from China’s 12thFive-Year Plan. For example, the CO2 emissions saved through conservation of 12 milliontonnes of water would be equivalent to those associated with the consumption of 6 millionbarrels of oil. Reducing emissions by saving water is a mitigation strategy that can beincorporated into water management policy in any country. The energy indicators for Chinacan be used as a guide for countries, particularly developing ones, where a similar study is yetto be conducted.
The second part of the study aimed to determine what factors correlated with an increase inelectricity use for urban water supply. Designing the water supply process to decreaseelectricity use is an effective mitigation strategy, so these findings have implications forclimate- and energy-conscious water management policy in China and globally. The directcorrelation between electrical energy intensity and population served per unit length of pipe(R2=0.56) may imply that if more densely populated areas are supplied by denser pipenetworks, the energy input per cubic metre of water supplied will be lower. While energyuse for urban water supply as a percentage of total energy use may tend to rise as thepercentage of population served by urban water supply increases, this increase could be slowerfor areas where water supply is more energy efficient (as defined by lower energy use per cubicmetre and per capita) and where a larger percentage of population is already served by urbanwater supply.
These results are not specific to China. Instead, they are also useful to decision-makersformulating water management policy in other countries. Designing the water distributionsystem with sufficient total pipe length and, if possible, incorporating new customers intoenergy efficient supply systems in areas where a large percentage of the population is alreadyserved are two strategies that can be generally applied to water supply in urban areas to reduceGHG emissions and mitigate climate change.
Acknowledgments This work was supported by the Tsinghua-Veolia Environnement Joint Research Center forAdvanced Environmental Technology (Project Number: CITY2) and the Tsinghua Independent Research Grant.
References
ABS (Australian Bureau of Statistics) (2008) 3239.0.55.001 - Population, Australian states and territories, Dec2007. Available from: http://www.abs.gov.au/ausstats/[email protected]/mf/3239.0.55.001. Cited 25 December 2013
Alcamo J, Doll P, Henrichs T, Kaspar F, Lehner B, Rosch T et al (2003) Development and testing of theWaterGAP 2 global model of water use and availability. Hydrolog Sci J 48:317–37
Buckley C, Friedrich E, von Blottnitz H (2011) Life-cycle assessments in the South African water sector: areview and future challenges. Water SA 37:719–26
CEPP (China Electric Power Press) (2012) China electric power yearbook. China Electric Power Press, BeijingChavez-Rodriguez MF, Nebra SA (2010) Assessing GHG emissions, ecological footprint, and water linkage for
different fuels. Environ Sci Technol 44:9252–7Chen Y, Li L, Jiang L, Grady C, Li X (2013) The impact of urban water use on energy consumption and climate
change: a case study of household water use in Beijing. In: Younos T, Grady CA (eds) Climate change andwater resources. Hdb Env Chem, Springer-Verlag, Berlin, pp 169–98
Mitig Adapt Strateg Glob Change
Author's personal copy

Cohen R, Nelson B, Wolff G (2004) Energy down the drain: the hidden costs of California’s water supply.Natural Resources Defence Council and Pacific Institute, Oakland
Corcoran L, Coughlan P, McNabola A (2013) Energy recovery potential using micro hydropower in water supplynetworks in the UK and Ireland. Water Sci Tech-W Sup 13:552–60
CUWA DChina UrbanWater Association] D2012] Urban water supply yearbook. China UrbanWater Association,Beijing Din Chinese]
EPRI (Electric Power Research Institute) (2002) Water and sustainability (volume 4): U.S. electricity consump-tion for water supply and treatment: the next half century. Electric Power Research Institute, Palo Alto
Filion YR (2008) Impact of urban form on energy use in water distribution systems. J Infrastruct Syst 14:337–46Friedrich E (2002) Life-cycle assessment as an environmental management tool in the production of potable
water. Water Sci Technol 46:29–36Friedrich E, Pillay S, Buckley CA (2009) Environmental life cycle assessments for water treatment processes—a
South African case study of an urban water cycle. Water SA 35:73–84Green F, Stern N (2014) An innovative and sustainable growth plan for China: A critical decade. Centre for
Climate Change Economics and Policy/Grantham Research Institute on Climate Change and theEnvironment
Gregory KB, Vidic RD, Dzombak DA (2011) Water management challenges associated with the production ofshale gas by hydraulic fracturing. Elements 7:181–6
Griffiths-Sattenspiel B, Wilson W (2009) The carbon footprint of water. River Network, PortlandHu GP, Ou XM, Zhang Q, Karplus VJ (2013) Analysis on energy-water nexus by Sankey diagram: the case of
Beijing. Desalin Water Treat 51:4183–93Hutson SS (2004) Estimated use of water in the United States in 2000. U.S. Geological Survey, RestonKahrl F, Roland-Holst D (2008) China’s water-energy nexus. Water Policy 10:51–65Kargbo DM, Wilhelm RG, Campbell DJ (2010) Natural gas plays in the Marcellus Shale: challenges and
potential opportunities. Environ Sci Technol 44:5679–84Kenway SJ, Priestley A, Cook S, Seo S, Inman M, Gregory A et al (2008) Energy use in the provision and
consumption of urban water in Australia and New Zealand. Commonwealth Scientific and IndustrialResearch Organisation, Melbourne
Klein G, Krebs M, Hall V, O’Brien T, Blevins BB (2005) California’s water-energy relationship. CaliforniaEnergy Commission, Sacramento
Kyung D, Kim D, Park N, Lee W (2013) Estimation of CO2 emission from water treatment plant—modeldevelopment and application. J Environ Manage 131:74–81
Li X, Feng KS, Siu YL, Hubacek K (2012) Energy-water nexus of wind power in China: the balancing actbetween CO2 emissions and water consumption. Energ Policy 45:440–8
Liang S, Zhang TZ (2011) Interactions of energy technology development and new energy exploitation withwater technology development in China. Energy 36:6960–6
Lingsten A, Lundkvist M, Hellstrom D, Balmer P (2008) Description of the current energy use in water andwaterwater systems in Sweden. The Swedish Water & Wastewater Association (SWWA), Stockholm
Meda A, Lensch D, Schaum C, Cornel P (2012) Energy and water: relations and recovery potential. In: LazarovaV, Choo KH, Cornel P (eds) Water-energy interactions of water reuse. IWA Publishing, London, pp 21–35
Miller LA, Ramaswami A, Ranjan R (2013) Contribution of water and wastewater infrastructures to urbanenergy metabolism and greenhouse gas emissions in cities in India. J Environ Eng-Asce 139:738–45
Murray KE (2013) State-scale perspective on water use and production associated with oil and gas operations,Oklahoma, U.S. Environ Sci Technol 47:4918–25
NBS (National Bureau of Statistics) (2013a) China population statistics 2011. Available from: http://www.stats.gov.cn/. Cited 17 November 2013
NBS (National Bureau of Statistics) (2013b) China GDP statistics 2011. Available from: http://www.stats.gov.cn/. Cited 17 November 2013
NBS (National Bureau of Statistics) (2014) 2013 National economic and social development statistics bulletin.Available from: http://www.stats.gov.cn/tjsj/zxfb/201402/t20140224_514970.html. Cited 15 June 2014
Olsson G (2012a) Water and energy: conflicts and connections. Water 21(14):12–6Olsson G (2012b) Water and energy: threats and opportunities. IWA Publishing, LondonPan LY, Liu P, Ma LW, Li Z (2012) A supply chain based assessment of water issues in the coal industry in
China. Energ Policy 48:93–102PRC (People’s Republic of China) (2011) 12th Five-Year Plan. http://cbi.typepad.com/china_direct/2011/05/
chinas-twelfth-five-new-plan-the-full-english-version.html. Cited 29 May 2014PRC (People’s Republic of China) (1999) Code for Urban Water Supply Engineering Planning GB 50282–98,
People’s Republic of China National StandardsRacoviceanu AI, Karney BW, Kennedy CA, Colombo AF (2007) Life-cycle energy use and greenhouse gas
emissions inventory for water treatment systems. J Infrastruct Syst 13:261–70
Mitig Adapt Strateg Glob Change
Author's personal copy

Rothausen SGSA, Conway D (2011) Greenhouse-gas emissions from energy use in the water sector. Nat ClimChang 1:210–9
Schneider K (2011) Water needs curtail coal gasification for fuel. Water Front Magazine, Stockholm, pp 12–3Schnoor JL (2011) Water-energy nexus. Environ Sci Technol 45:5065Siddiqi A, Anadon LD (2011) The water-energy nexus in Middle East and North Africa. Energ Policy 39:4529–
40Smith K, Liu S, Chang T (2015) Contribution of urban water supply to greenhouse gas emissions in China. J Ind
Ecol. doi:10.1111/jiec.12290Stokes JR, Horvath A (2009) Energy and air emission effects of water supply. Environ Sci Technol 43:2680–7Sweetapple C, Fu GT, Butler D (2014) Multi-objective optimisation of wastewater treatment plant control to
reduce greenhouse gas emissions. Water Res 55:52–62USEPA (United States Environmental Protection Agency) (2014) Greenhouse gas equivalencies calculator.
Available from: http://www.epa.gov/cleanenergy/energy-resources/calculator.html#results. Cited 25December 2014
Venkatesh G, Brattebø H (2011) Energy consumption, costs and environmental impacts for urban water cycleservices: case study of Oslo (Norway). Energy 36:792–800
Vieira AS, Beal CD, Ghisi E, Stewart RA (2014) Energy intensity of rainwater harvesting systems: a review.Renew Sust Energ Rev 34:225–42
Wang JX, Rothausen SGSA, Conway D, Zhang LJ, Xiong W, Holman IP et al (2012) China’s water-energynexus: greenhouse-gas emissions from groundwater use for agriculture. Environ Res Lett 7:1–10
Wang JL, Feng LY, Tverberg GE (2013) An analysis of China’s coal supply and its impact on China’s futureeconomic growth. Energ Policy 57:542–51
Webster M, Donohoo P, Palmintier B (2013) Water-CO2 trade-offs in electricity generation planning. Nat ClimChang 3:1029–32
Yang H, Zhou Y, Liu JG (2009) Land and water requirements of biofuel and implications for food supply and theenvironment in China. Energ Policy 37:1876–85
Zhou YC, Zhang B, Wang HK, Bi J (2013) Drops of energy: conserving urban water to reduce greenhouse gasemissions. Environ Sci Technol 47:10753–61
Zou X, Li Y, Li K, Cremades R, Gao Q, Wan Y, Qin X (2013) Greenhouse gas emissions from agriculturalirrigation in China. Mitig Adapt Strateg Glob Chang. doi:10.1007/s11027-013-9492-9
Mitig Adapt Strateg Glob Change
Author's personal copy