2015-06-17 feko based isar analysis for 3d object reconstruction
TRANSCRIPT

MUMMA RADAR LABMUMMA RADAR LAB
FEKO Based ISAR Analysis for 3D Object Reconstruction
Dr. Ali Nassib
University of Dayton
ECE Department
Dayton Ohio
IEEE National Aerospace and Electronics Conference (NAECON)
1

MUMMA RADAR LABMUMMA RADAR LAB
I. INTRODUCTION
II. ISAR IMAGING
III. INVERSE SCATTERING TECHNIQUE
IV. SIMULATION SET UP
V. SIMULATION RESULTS
2
OUTLINE

MUMMA RADAR LABMUMMA RADAR LAB
o Inverse synthetic aperture radar (ISAR) imaging is a radar technique to generate two
dimensional high resolution image of a target by using the information in both the down range
direction and cross range directions.
o Range resolution is obtained either using short pulses or pulse compression where the cross-
range resolution is obtained via Doppler history of different target scattering centers.
Where B is the system bandwidth and is the change in aspect angle.
0
2*
cDownrange
B
2*Crossrange
Eq. (1)
Eq. (2)
6
INTRODUCTION

MUMMA RADAR LABMUMMA RADAR LAB
o ISAR technology utilizes the movement of the target rather than the sensor. For small angles,
an ISAR image is the two dimensional Fourier transform of the received signal as a function
of frequency and target aspect angles.
Fig 1. Inverse SAR attempts to reconstruct an image of the moving target
7
INTRODUCTION

MUMMA RADAR LABMUMMA RADAR LAB
ISAR IMAGING
o According to the geometric theory of diffraction (GTD), if the wavelength is small relative to the
target size, then the backscattered field from the target consists of contributions from electrically
isolated scattering centers
o Similarly, ISAR imaging algorithms rely upon an assumption that the area under observation
consists of a collection of infinitesimally small isotropic scatterers (i.e., the point scatterer model) as
shown below.
5
Fig 2. Superposition of point sources

MUMMA RADAR LABMUMMA RADAR LAB
ISAR IMAGING
o This approximation is based upon the application of a scalar contrast function which ignores directional
dependency, since point scatterers radiate isotropically in all directions.
o 3D image reconstruction is obtained through retrieval of the scalar contrast function from simulated
data, which provides information regarding the target under investigation.
o Scalar contrast function is defined as
and are the dielectric permittivity and conductivity of the object while and the are the
dielectric permittivity and conductivity of the background medium.
0
( )( ) ( ) b
bV r i
rr
( ) r ( ) rb b
Eq. (3)
5

MUMMA RADAR LABMUMMA RADAR LAB
ISAR IMAGING
o From a purely electromagnetic perspective, the scattering from a target is described using the
electric field integral equation (EFIE) and the magnetic field integral equation (MFIE), both derived
from Maxwell’s equations as shown in equation
5
02G ( , ) ( )
4V
iJ
k
E r I r r r rd
1
iH r E r = -
Eq. (4)
Eq. (5)
MUMMA RADAR LABMUMMA RADAR LAB
ISAR IMAGING
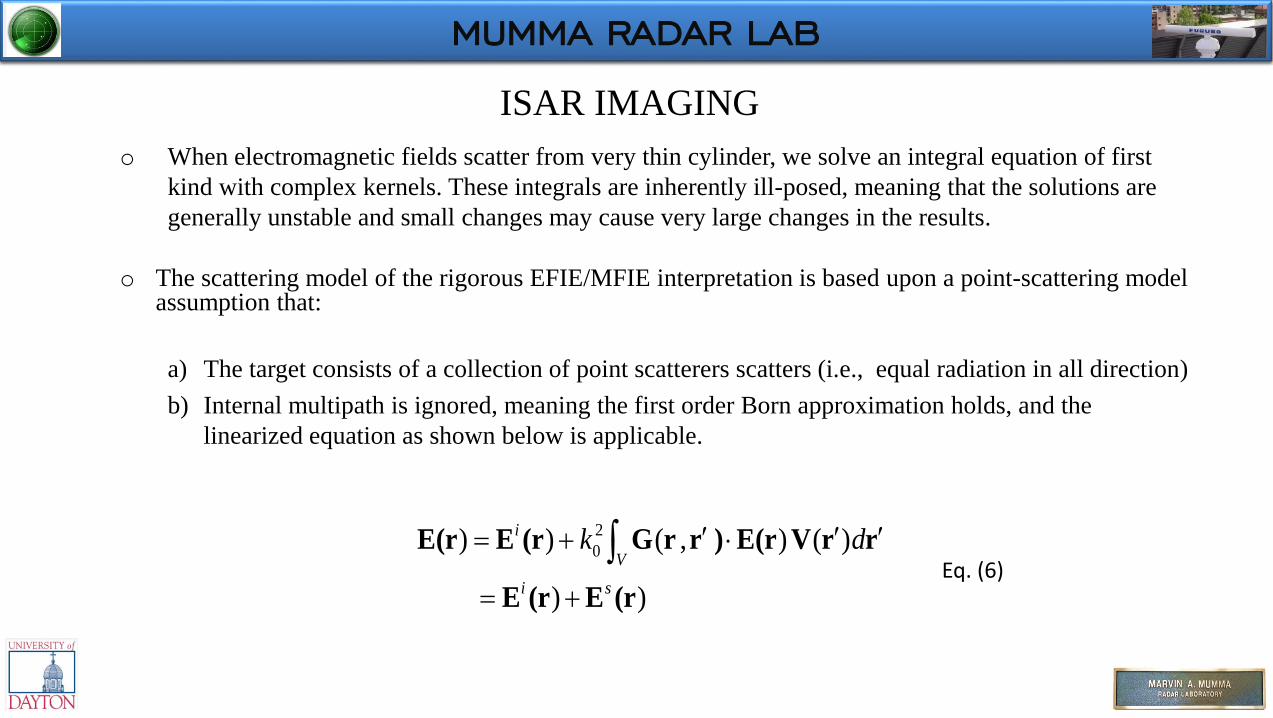
o When electromagnetic fields scatter from very thin cylinder, we solve an integral equation of first
kind with complex kernels. These integrals are inherently ill-posed, meaning that the solutions are
generally unstable and small changes may cause very large changes in the results.
o The scattering model of the rigorous EFIE/MFIE interpretation is based upon a point-scattering model assumption that:
a) The target consists of a collection of point scatterers scatters (i.e., equal radiation in all direction)
b) Internal multipath is ignored, meaning the first order Born approximation holds, and the
linearized equation as shown below is applicable.
5
2
0) ) ( , ) ( )
) )
i
V
i s
k d
E(r E (r G r r ) E(r V r r
E (r E (rEq. (6)

MUMMA RADAR LABMUMMA RADAR LAB
INVERSE SCATTERING TECHNIQUE
o Mathematically, finding the reflectivity function profile is determined by computing the inverse linear operator using
o Where D is the volume of interest, is the location of the nth pixel, P is the total number of pixels, and K and Q are some constants that are irrelevant for the purpose of imaging
5
1
, ,
, ,
,4
tn
Ts r r t t
D
PT
r r t t
n n n
n
jk r r
t
n
K d
Q
e
r
E a G r r V r G r r a r
a G r r V r G r r a
G r r
Eq. (7)
nr
MUMMA RADAR LABMUMMA RADAR LAB
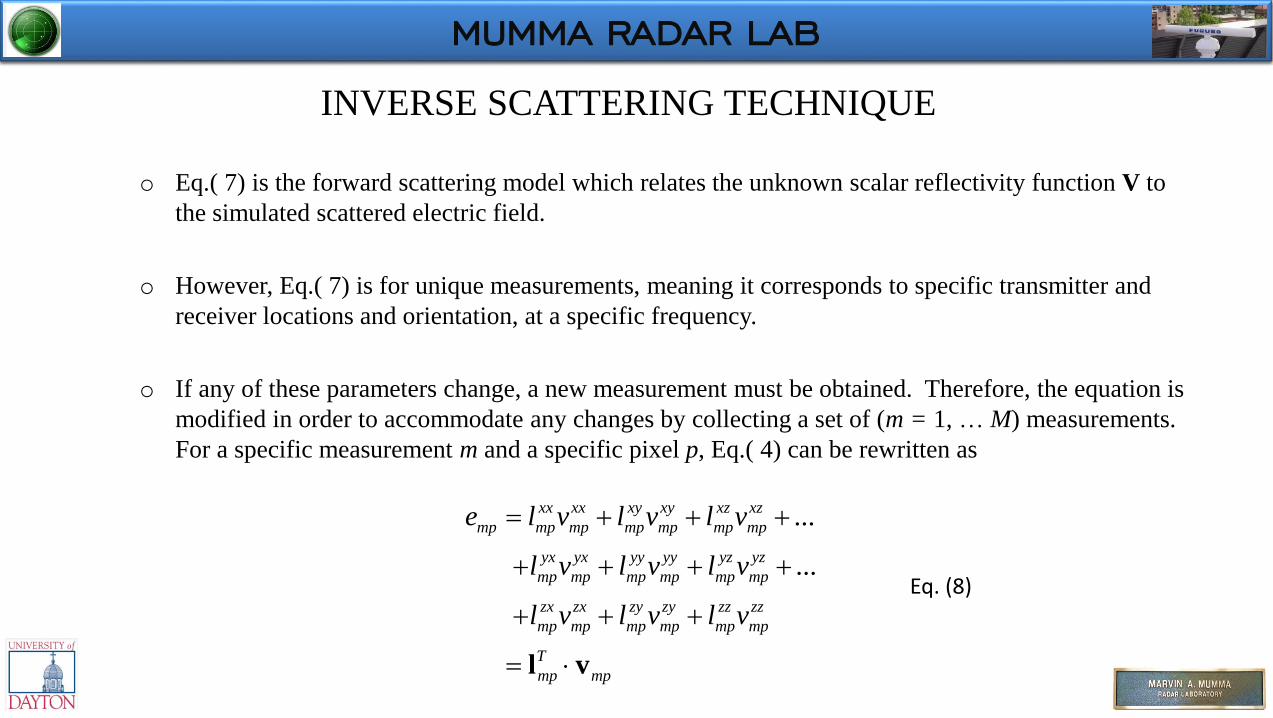
o Eq.( 7) is the forward scattering model which relates the unknown scalar reflectivity function V to
the simulated scattered electric field.
o However, Eq.( 7) is for unique measurements, meaning it corresponds to specific transmitter and
receiver locations and orientation, at a specific frequency.
o If any of these parameters change, a new measurement must be obtained. Therefore, the equation is
modified in order to accommodate any changes by collecting a set of (m = 1, … M) measurements.
For a specific measurement m and a specific pixel p, Eq.( 4) can be rewritten as
5
...
...
xx xx xy xy xz xz
mp mp mp mp mp mp mp
yx yx yy yy yz yz
mp mp mp mp mp mp
zx zx zy zy zz zz
mp mp mp mp mp mp
T
mp mp
e l v l v l v
l v l v l v
l v l v l v
l v
Eq. (8)
INVERSE SCATTERING TECHNIQUE

MUMMA RADAR LABMUMMA RADAR LAB
INVERSE SCATTERING TECHNIQUE
o Where each value of l can be determined by properly re-arranging and recasting the terms of the
result in Eq.(7) .
o By extending the above equation to all pixels in the region D and all possible measurement
configurations M, one obtains:
5
1 11 1 11
1
s
T T
P
T T
M M MP MP
s
e
e
L VE
l l v
l l v
E L V
Eq. (9)

MUMMA RADAR LABMUMMA RADAR LAB
INVERSE SCATTERING TECHNIQUE
o is the known vector containing the scattered field collected at different positions and directions
with a single frequency
o L is a large matrix whose value is computed theoretically from Eq.(7) , and is the vector
representing the reflectivity function of the target, which is zero outside the investigation domain.
o The reflectivity function can be easily recovered from Eq.(9) by using the inversion technique as
follows
5
sE
V L EH s Eq. (10)
V

MUMMA RADAR LABMUMMA RADAR LAB
o The reflectivity function was found by using FEKO, an accurate EM simulation software tool.
o In this simulation, we performed two cases: 0.5λ, and λ separation between two thin cylinders, in
order to see how the separation between them influences the construction of the image.
o In the first case, the first cylinder is placed at (2.5, 2.5,0 cm) and the second one is at (-2.5,-2.5,0
cm), in the second case, the first cylinder is place at (5,5,0 cm) and the second one is at (-5,-5,0 cm)
o In both cases, the two thin cylinders are oriented vertically.
5
SIMULATION SET UP

MUMMA RADAR LABMUMMA RADAR LAB
o The transmitting and receiving antennas are located in the x-y plane.
o In the simulation we used 30 transmitters and 180 receivers, both of which transmit and receive
vertically polarized waves in the z direction only.
o The transmitting antennas are placed along a radius of 4λ , and the receiving antennas are placed at
2λ with respect to the target.
5
SIMULATION SET UP

MUMMA RADAR LABMUMMA RADAR LAB
o The operating frequency is 3 GHz and the total measurement collected from this is
o Nt and Nr are number of transmitters and number of receivers and the one is one of the nine pixels of
reflectivity function and this case it’s the .
o The area of investigation is 0.25 m by 0.25 m, which was divided into pixels of size with a total of
unknowns.
5
( 10 )cm
( 1 30*180 5400)t rN N
zzV
( 1 30*180 5400)t rN N
SIMULATION SET UP
MUMMA RADAR LABMUMMA RADAR LAB
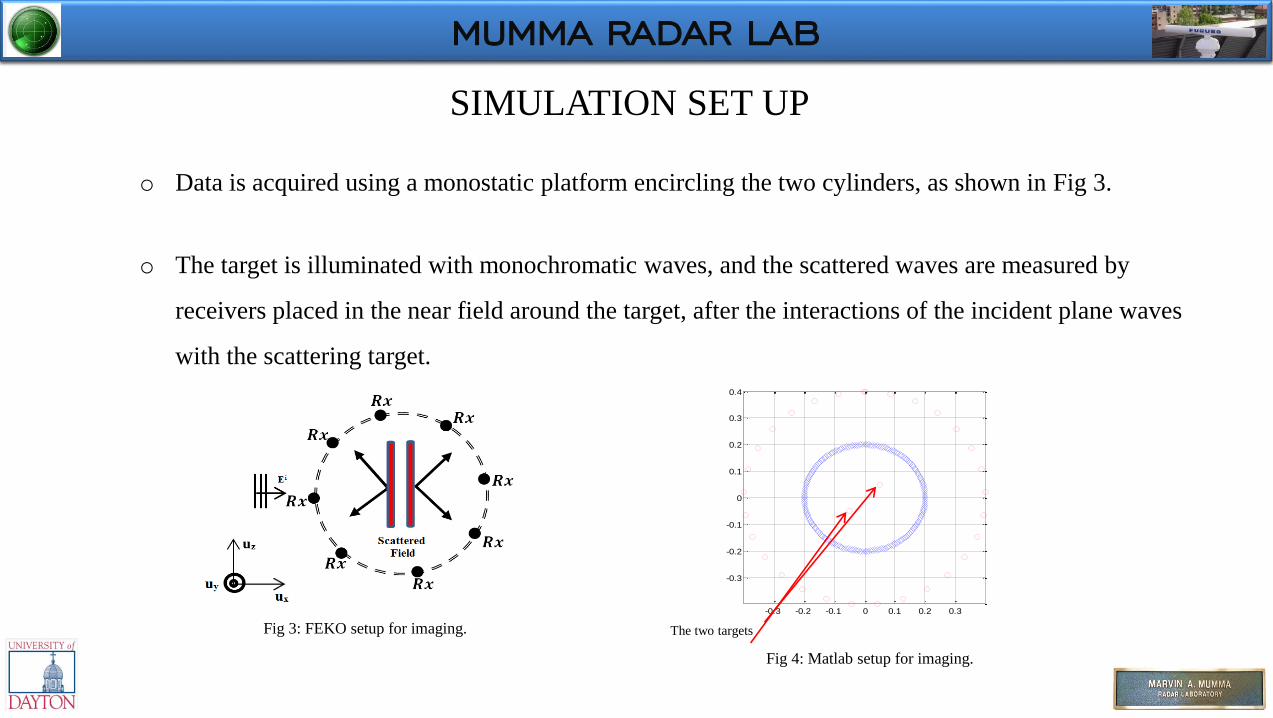
o Data is acquired using a monostatic platform encircling the two cylinders, as shown in Fig 3.
o The target is illuminated with monochromatic waves, and the scattered waves are measured by
receivers placed in the near field around the target, after the interactions of the incident plane waves
with the scattering target.
5
Fig 3: FEKO setup for imaging.
-0.3 -0.2 -0.1 0 0.1 0.2 0.3
-0.3
-0.2
-0.1
0
0.1
0.2
0.3
0.4
The two targets
Fig 4: Matlab setup for imaging.
SIMULATION SET UP

MUMMA RADAR LABMUMMA RADAR LAB
SIMULATION RESULTS
o FEKO model, near field radiation and pattern
5
Fig 5: FEKO setup .
Fig 6: NR field radiation pattern.

MUMMA RADAR LABMUMMA RADAR LAB
SIMULATION RESULTS
o The objective is to: 1) determine the location, and 2) reconstruct the 3D image of the scalar contrast
function V of the two cylinders.
5
Figure 7: Two thin cylinders vertically oriented and
separated by half of wavelength. The cylinders are
not clearly resolved due to the mutual coupling
caused by the small separation.
Figure 8: Two thin cylinders vertically oriented. The two
cylinders are resolved as the separation between the them
is increased to one wavelength.

MUMMA RADAR LABMUMMA RADAR LAB
o Is to reconstruct the 3D of Dyadic contrast function including all nine elements as shown below
o Perform experiments
o Verify resultsV V V
V V V
V V V
xx xy xz
yx yy yz
zx zy zz
↔
V(r )
30 cm
30 cm
33Fig 9: Vector dyadic contrast function.
FUTURE WORK
Eq. (11)

MUMMA RADAR LABMUMMA RADAR LAB
5
THANK YOU FOR LISTENING
ANY QUESTIONS?