2015 05-16 - building infographics by adriansameli @uxcampch
TRANSCRIPT


● head of web solutions @ IWF AG
● web-enthusiast since 15 years
● interested in web, data, design
● SAE creative media diploma
Adrian Sameli

● ICT fullservice
● websites
● applications
● multimedia
IWF Web Solutions

infographics?the reasons

aim: attention
attract an audiencephoto by Ian Muttoo / CC BY

aim: context
explain the big picturephoto by The International Astronomical Union / CC BY

aim: content
transport some messagesphoto by Ian Settergren / CC BY

aim: desire
arouse deeper interestphoto by Mdf / CC BY

aim: share
spread an ideaphoto by Mike Baird / CC BY

cause
define your topic

gathering datathe preparation

starting point
digging in the darkphoto by i ♥ happy!! / CC BY

research
find relevant dataphoto by Image Editor / CC BY

collection
assemble, arrange, adjustphoto by wisekris / CC BY

clusters
try combinations and anglesphoto by theilr / CC BY

iterations
take a step back, then improvephoto by raneko / CC BY
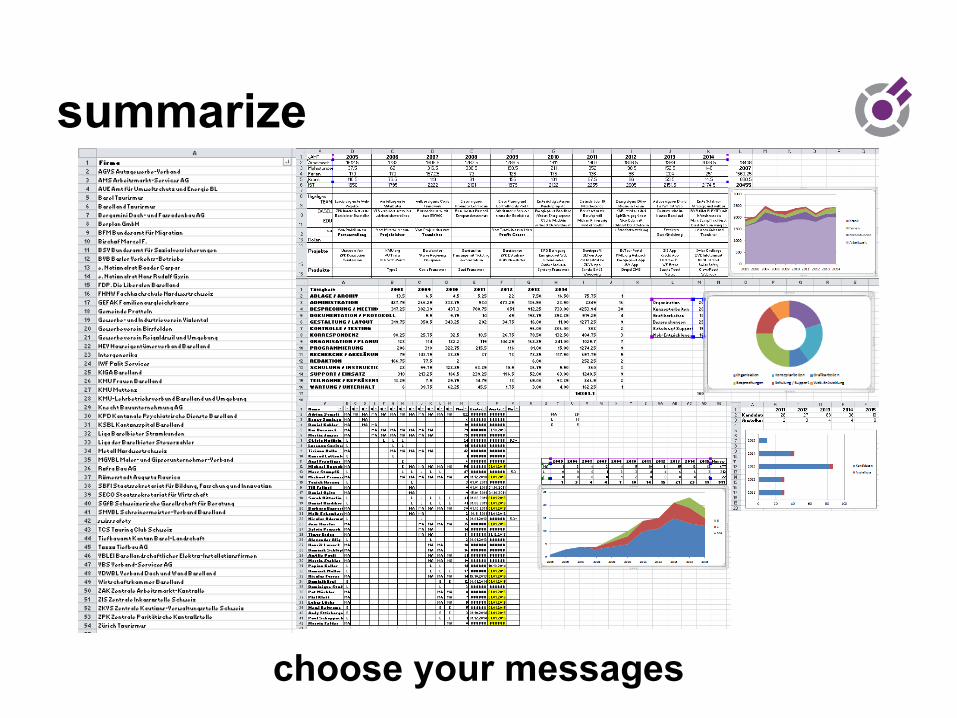
summarize
choose your messages

telling a storythe conception

be interesting
consider your audiencepainting “Der Grossvater erzählt eine Geschichte” by Albert Anker

no lies
keep it real & authenticphoto by Scott Nazelrod

be consistent
follow a red linemap by George Johnson (1836-1911)

no distraction
stick to your messagesphoto “Sistine Chapel” by Beyond Forgetting / CC BY

be simple
KISS (keep it stupid simple)painting “quadrato rosso” by Kazimir malevich

no repetition
reduce duplicate contentAndy Warhol: Campbell's Soup Cans (1962) photo by Tomás Fano / CC BY

storyboard
create your outline

making it prettythe visualisation

colors & fonts
use harmony and contrastphoto by J. Albert Bowden II / CC BY

icons & images
trigger associations and emotionsimage by novelemoji

charts & graphs
set an anchor and contextphoto by Tim Gould / CC BY

texts & labels
use simple language onlyphoto by Juhan Sonin / CC BY

styleguide
build your elements

bringing all togetherthe infographic

effort
do all the magicphoto by Scouten / CC BY

enjoy
for the user experiencephoto by kilgarron / CC BY


thank you@AdrianSameli

great resourcesstock & tools
https://www.iconfinder.com/
http://selection.datavisualization.ch/
inspiration
https://www.behance.net/
http://www.infographicjournal.com/
http://www.informationisbeautiful.net/
articles
https://blog.dashburst.com/what-makes-a-good-infographic/
http://blog.slideshare.net/2013/12/16/5-steps-to-creating-a-powerful-infographic/