201409 nedbank group 2014 interim results … aug 14 nedbank gdp growth ... 93 95 96 98 00 02 04 06...
TRANSCRIPT

NEDBANK GROUP LIMITED
INTERIM RESULTSINVESTOR PRESENTATION
for the six months ended 30 June 2014

2
-2
0
2
4
6
00 02 04 06 08 10 12 14
1,8%
3,22,6
1,8
0
2
4
6
Aug13
Feb14
Aug14
Nedbank GDP growth forecast
SA macro environment deteriorated further over the past 6 months
GDP growth slowing (% annual)
Forward rate agreements point to flatter rate cycle
2014 GDP expectations revised downward
Prime increases later than expected
Global & local economy remains volatile, uncertain, complex & ambiguous
Source: Nedbank Group Economic Unit
8
9
10
11
12 13 14 15 16 17
H1 2014 resultsFYE 2013 results
Prime rate forecast (%)
4
8
12
16
00 02 04 06 08 10 12 14
Actual 3-month JIBARImplied market forecast - currentImplied market forecastsImplied market forecast (31 Jan 2014)
2,5%1,2%
- historic

3
Wholesale credit growth improves while consumers remain under pressure Credit growth: corporates vs households
Source: Nedbank Group Economic Unit
Consumers remain under pressure
…but, insolvencies & liquidations still muted
-6
-2
2
6
10
00 02 04 06 08 10 12 14Consumer spending: q-o-q % changeHousehold disposable income: q-o-q% change
100
200
300
400
0
200
400
600
00 02 04 06 08 10 12 14Insolvencies Liquidations
Insolvencies (12-m mov avg) Liquidations (12-m mov avg)
-10
-5
0
5
10
15
20
25
30
35
40
00 02 04 06 08 10 12 14
Households
Corporates
Credit growth (%)

4
0
200
400
600
800
93 95 96 98 00 02 04 06 08 10 12 14
Private sectorPublic sector
Medium-to-long term opportunities from the National Development Plan (SA) & Rest of Africa
Source: Nedbank Group Economic Unit
GDP growth forecasts from IMF, robust for RoA(%)
Trade flows SA to Africa (Rbn), Africa as % of SA exports
Nedbank large SA capital project schedule (R billion - constant 2014 prices)
R3 trillion potential by
2030
The 2014 figure (*) is value of projects announced in the first half of the year – annualisedNote: R3 trillion potential announced projects sourced from 2013 Budget Review document
-2
0
2
4
6
8
10
00 02 04 06 08 10 12 14 16 18
Sub-Saharan AfricaSouth Africa
10
12
14
16
18
20
0
40
80
120
160
00 02 04 06 08 10 12
SA exports to Rest of Africa (LHS - Rbn)Rest of Africa contribution (RHS - %)
Debt ratingsNedbank local & foreign currency & SA Sovereign
Nedbank Moody’s, Fitch, S&P
SA SovereignMoody’s, Fitch, S&P
Ratingsgrade
A1, A+, A+ A1, A+, A+Upper medium
gradeA2, A, A A2, A, AA3, A-, A- A3, A-, A-
Baa1 (↓), BBB+, BBB+ Baa1 (↓), BBB+, BBB+Lower medium
gradeBaa2, BBB (↓), BBB Baa2, BBB (↓), BBBBaa3, BBB-, BBB- Baa3, BBB-, BBB-
Ba1, BB+, BB+ Ba1, BB+, BB+ Non-investment grade
↓ indicates negative ratings agency outlook, all others stable
*

5
9 39
7
10 1
28
11 1
43
12 1
80
13 5
96
2010 2011 2012 2013 2014
Nedbank Group: consistent focus on drivers of value creation
212 26
5 340 39
0 460
2010 2011 2012 2013 2014
12,2
13,7
15,8 16,1 16,5
14,2
13,0 13,1 13,0 13,5
2010 2011 2012 2013 2014
ROE (excl GW) Cost of equity
NAV per share(cents)
ROE & Cost of Equity (%)
Interim dividend per share(cents)
NAV ROE > COE
11,6%
EP
Dividends
17,9%
Underpinned by strong CET1, surplus liquidity & high coverage
H1 H1 H1
6
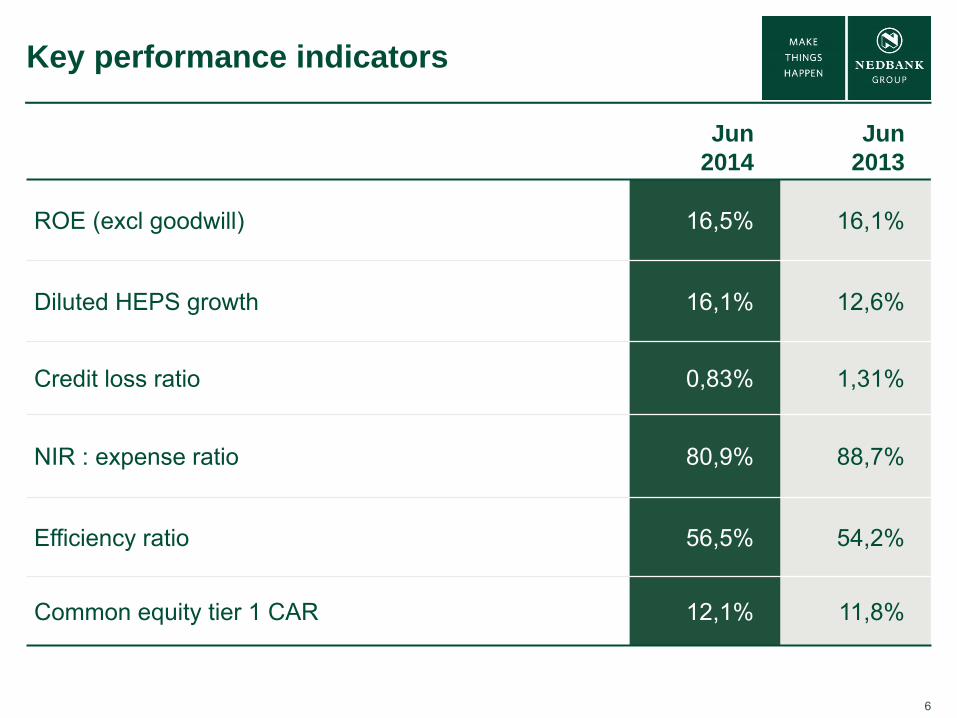
Key performance indicators
Jun2014
Jun2013
ROE (excl goodwill) 16,5% 16,1%
Diluted HEPS growth 16,1% 12,6%
Credit loss ratio 0,83% 1,31%
NIR : expense ratio 80,9% 88,7%
Efficiency ratio 56,5% 54,2%
Common equity tier 1 CAR 12,1% 11,8%

7
3 914 4 599
954
992
55
962 244
H12013
NII Impairments NIR Expenses Direct tax &other
H12014
9,3% 29,8% (0,6%) 8,9%
Headline earnings growth drivers
Headline earnings (Rm)
17,5%

8Graph excludes the impact of H1 2013 base effects & slowdown in client transactional activity in the challenging macro-economic environment
NIR growth reflects impact of strategic choices
9 4419 515
9 843
126
H1 2013excl. FV
H1 2014excl. FV
PLs slowdown& credit life
Maintainfees at
2013 level
H1 2014 excl. FV &adj. for strategic
actions
0,8%
2,1%1,3%
Credit lifepricing & benefits
PL volumedecrease
4,2%
…NIR-to-expense ratio at 80,9% (MLT target >85%)
202
NIR (Rm)
9
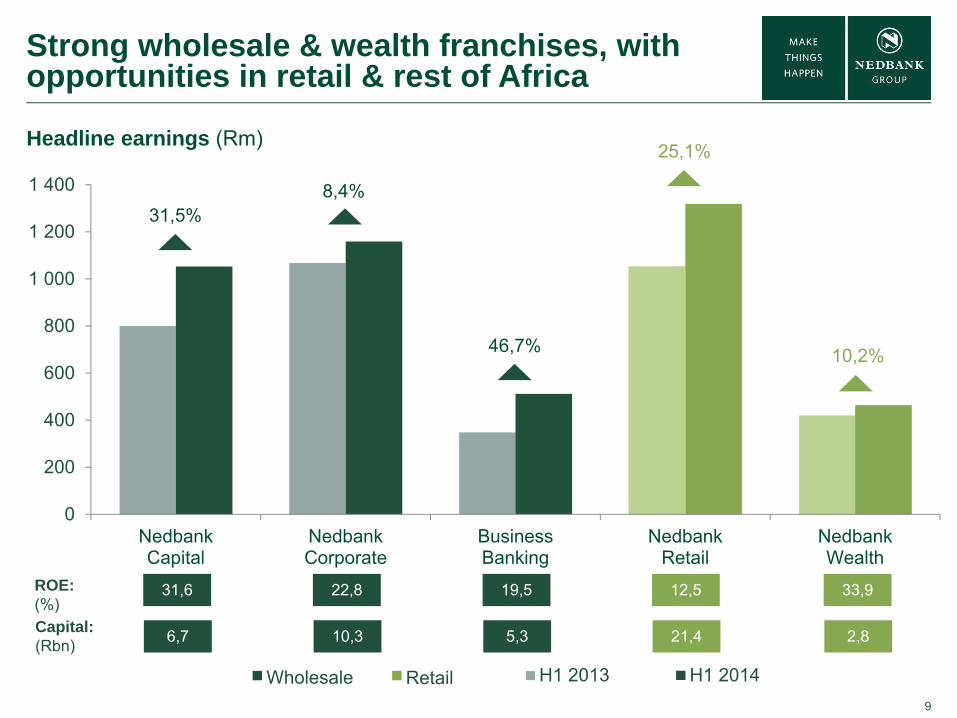
Strong wholesale & wealth franchises, with opportunities in retail & rest of Africa
0
200
400
600
800
1 000
1 200
1 400
NedbankCapital
NedbankCorporate
BusinessBanking
NedbankRetail
NedbankWealth
H1 2013 H1 2014
Headline earnings (Rm)
Wholesale Retail
31,5%8,4%
46,7%
25,1%
10,2%
ROE:(%)
31,6 22,8 19,5 12,5 33,9
Capital:(Rbn) 6,7 10,3 5,3 21,4 2,8
10
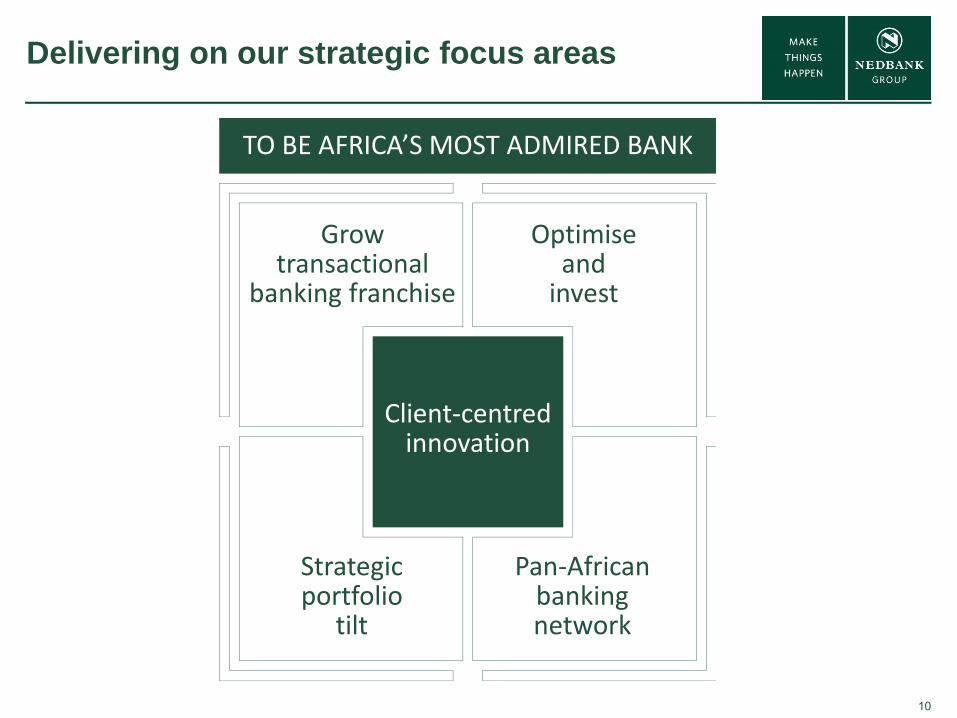
Delivering on our strategic focus areas
TO BE AFRICA’S MOST ADMIRED BANK
Client‐centred innovation
Grow transactional
banking franchise
Optimiseandinvest
Strategic portfolio
tilt
Pan‐African banking network

11
Client-centred innovation
Aug12
Dec12
Apr13
Aug13
Dec13
Apr14
Aug12
Dec12
Apr13
Aug13
Dec13
Apr14
App suite downloads‘000
Secure Approve-it transactions# million
Digitally enabled clients‘000
Award for Innovation in
Banking2014
Corporate payment system revenuesMonthly average
Netbank Business volumesMonthly average
10 11 12 13 H114
10 11 12 13 H114
H110
H111
H112
H113
H114

12
4,45,0
5,86,4
6,9
2010 2011 2012 2013 2014
Total clients(m)
Grow transactional banking franchise
Continued client growth across all clusters
Source: 1. Client groups with GOI greater than R500pm, 2. Brand Finance (calculated in Rand), 3. Millward Brown, Nielsen Adex
H1
Investment in footprint expansion since 2009 ATMs up 83% Staffed outlets up 41% Intelligent Depositor devices up 100%
Investment in integrated channels & mobile
Benefits from ‘Branch of the Future’
Kept transactional fees at 2013 levels
Progress in ELB & youth clients migrating to middle market
Focus on cross-sell & collaboration
Increased marketing spend & effectiveness
Brand value2 R12,5bn up 15% from 2013 & advertising share of voice3 increased to 24% (H1 2013: 20%)
1,92,2 2,3
2010 2013 2014
Retail main banked clients (m)
H1
Business Bankingclient groups1 (‘000)
21,723,8 24,8
2010 2013 2014
Initiatives to unlock future growth
H1

13
Grow transactional banking franchise
(#000) (Rm)
Card
Trans-actional
Secured
PersonalLoans
306 335 380
1 247 1 405 1 519
1 726 1 851
1 907
522 612 456
2012 2013 2014
4 203 4 262
418 402
332
2012 2013 2014
6 6556 164
+8,0%
+10,2%
5 5933 801
PersonalLoans1
Total retail client base NIR
Retail exclPersonalLoans1
H1 H1
+11,3%+10,0%
6 3235 762
5 175
1 single product clients2 total growth excluding personal loans
Total
Total
+1,4%+10,6%
+6,0%2
+9,5%2
Retail client & NIR growth influenced by risk appetite & pricing choices
14
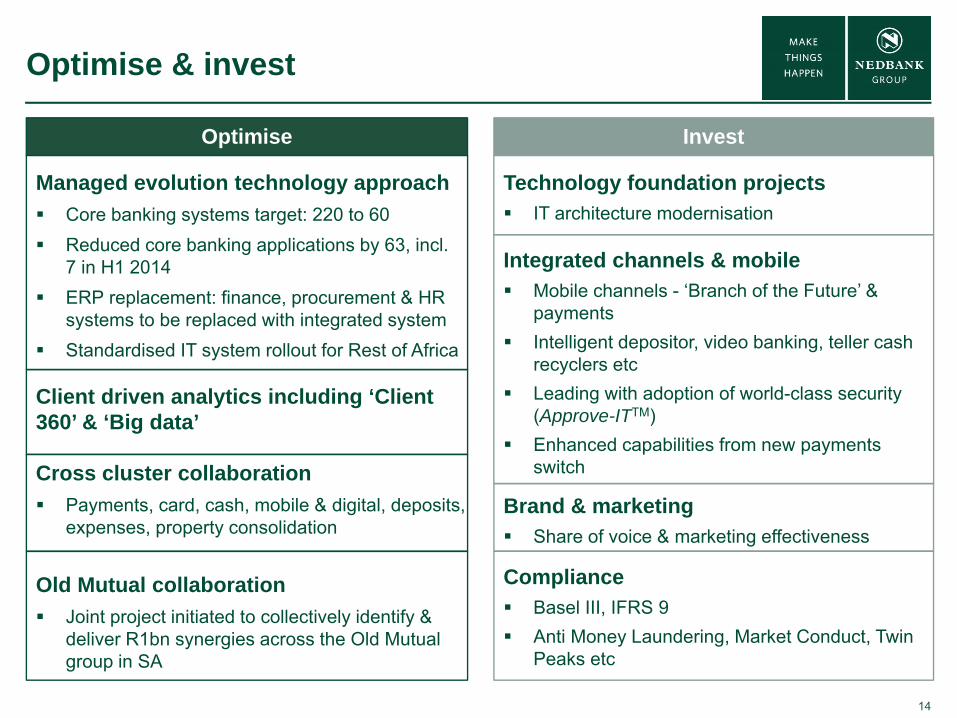
Managed evolution technology approach Core banking systems target: 220 to 60 Reduced core banking applications by 63, incl.
7 in H1 2014 ERP replacement: finance, procurement & HR
systems to be replaced with integrated system Standardised IT system rollout for Rest of Africa
Client driven analytics including ‘Client 360’ & ‘Big data’
Cross cluster collaboration Payments, card, cash, mobile & digital, deposits,
expenses, property consolidation
Old Mutual collaboration Joint project initiated to collectively identify &
deliver R1bn synergies across the Old Mutual group in SA
Optimise & invest
Optimise Invest
Technology foundation projects IT architecture modernisation
Integrated channels & mobile Mobile channels - ‘Branch of the Future’ &
payments Intelligent depositor, video banking, teller cash
recyclers etc Leading with adoption of world-class security
(Approve-ITTM) Enhanced capabilities from new payments
switch
Brand & marketing Share of voice & marketing effectiveness
Compliance Basel III, IFRS 9 Anti Money Laundering, Market Conduct, Twin
Peaks etc

15
Strategic portfolio tilt
Wholesale1 advances growth ahead of retail(% growth2)
Faster advances growth in attractive EP areas(% growth2)
Greater capital deployed to Rest of AfricaEconomic capital (Rbn), % of Group
Slower advances growth to protect against downside risk (% growth2)
-10
-5
0
5
10
10 11 12 13 14
Retail advancesWholesale advances
Notes: 1. Wholesale includes Nedbank Corporate & Nedbank Capital2. Growth reflects 6 monthly growth
-10
0
10
20
30
10 11 12 13 14
Home loans
Personal loans
0
5
10
15
10 11 12 13 14
Commercial propertyCredit cardVehicle finance
0,9 0,91,8 2,1
2,92,2 2,0
3,6 3,74,6
-1
1
3
5
7
10 11 12 13 14
Economic capital
% of Group OSE
H1

16
Strategic portfolio tilt
CLR (%)
0,620,42
0,46
0,56
0,40 0,37
0,060,07
H12013
H22013
H12014
Personal loans methodology changes
First Strut
Personal loans
Rest of the group
1,31
0,82 0,83
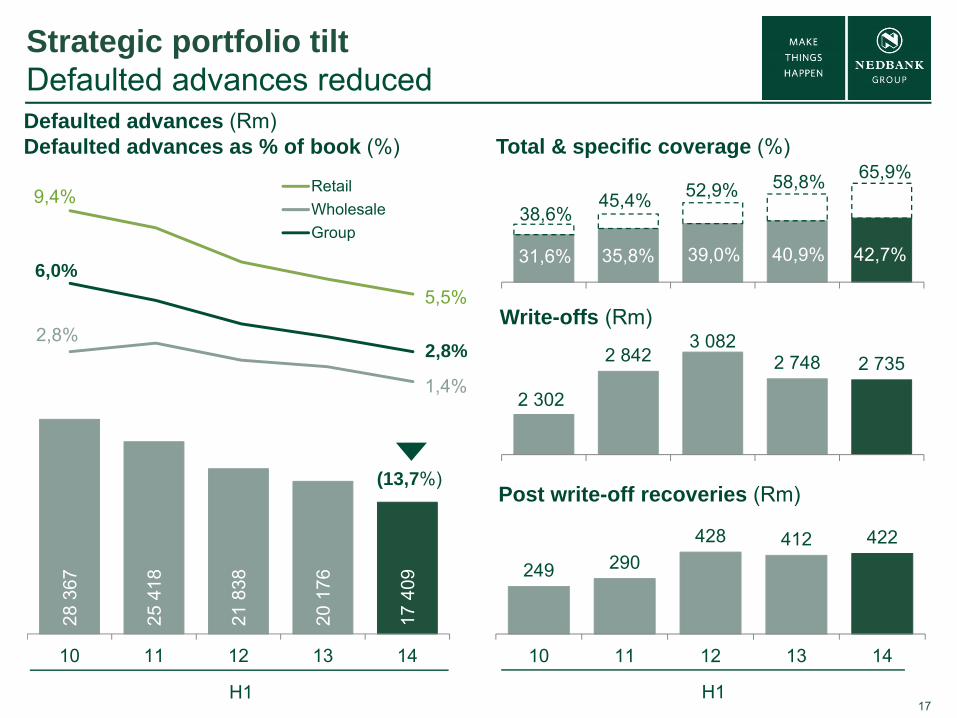
Credit loss ratio improved off a high base to the lower end of the CLR range
17
9,4%
5,5%
2,8%
1,4%
6,0%
2,8%
RetailWholesaleGroup
28 3
67
25 4
18
21 8
38
20 1
76
17 4
09
10 11 12 13 14
Strategic portfolio tilt Defaulted advances reducedDefaulted advances (Rm)Defaulted advances as % of book (%)
31,6% 35,8% 39,0% 40,9% 42,7%
2 302
2 8423 082
2 748 2 735
249 290428 412 422
10 11 12 13 14
Total & specific coverage (%)
Write-offs (Rm)
Post write-off recoveries (Rm)
58,8%52,9%45,4%38,6%
65,9%
H1H1
(13,7%)
181 Client premium relative to prime with home loans excluding staff & re-advances2 H1 2013 restated to correct error in personal loans payouts
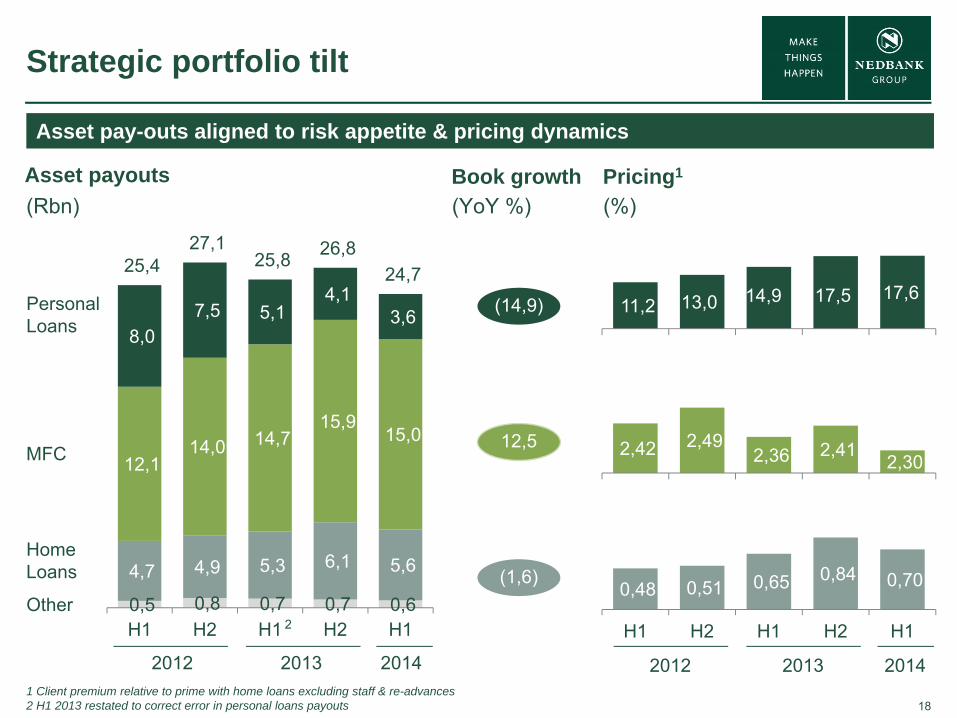
Strategic portfolio tilt
12,5
(1,6)
(14,9)
(YoY %)(Rbn) (%)
2,42 2,49 2,36 2,41 2,30
0,48 0,51 0,65 0,84 0,70
H1 H2 H1 H2 H1
MFC
Home Loans
Personal Loans
Other
2012 2013
0,5 0,8 0,7 0,7 0,6
4,7 4,9 5,3 6,1 5,6
12,1 14,0 14,7
15,9 15,0
8,0 7,5 5,1
4,1 3,6
25,4 27,1
25,8 26,8 24,7
H1 H2 H1 H2 H1
20142012 2013 2014
11,2 13,0 14,9 17,5 17,6
Asset payouts Book growth Pricing1
2
Asset pay-outs aligned to risk appetite & pricing dynamics

19
5
10
15
20
25
H1 H2 H1 H2 H1 H2 H1 H2 H1 H2 H1
Strategic portfolio tiltPersonal loans operating within strategic intent & lowered risk profile
1 Asset growth reflects the 6 months on the preceding 6 months growth annualised2 GOI margin is the total gross operating income (Net Interest Income & Non Interest Revenue) divided by average advances, before Wealth related income3 PD is the probability of loan going into default based on early warning risk indicators4 H1 includes actuals for Jan - Jun
Early, comprehensive actions to mitigate risk as industry concerns escalate
Warning signs observed late 2011
Actual risk of vintages worse than expected
Outcome achieved: Book R3,2bn lower than Jun ‘13 Better quality risk, within desired risk
appetite at higher pricing Defaults peaked in May ’13, now
back in line with expectations Methodology changes raised from H1
2012 to address risk of higher write-offs than forecast by models
PL asset growth1
Nedbank growth (%)Rest of market (%)
R1,7bn reduction YTD
-20
0
20
40
Expected PD model calibration 3 (%)Actual / Predicted PD 3 (%)
Avg GOI margin2(%)
GOI margin & risk over time
20142009 2010 2011 2012 2013 4
Headline Earnings
Rm
161239 219
66
280
2010 2011 2012 2013 2014
H1
20
14
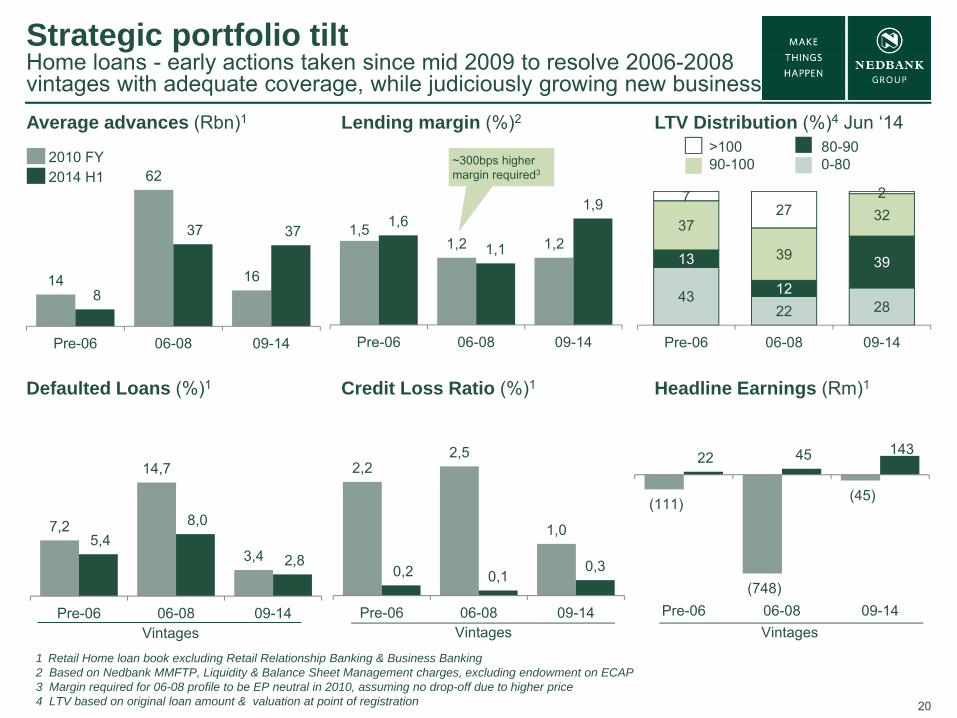
62
168
37 37
Pre-06 06-08 09-14
2010 FY2014 H1
Strategic portfolio tiltHome loans - early actions taken since mid 2009 to resolve 2006-2008 vintages with adequate coverage, while judiciously growing new businessAverage advances (Rbn)1
Headline Earnings (Rm)1Defaulted Loans (%)1 Credit Loss Ratio (%)1
Vintages Vintages Vintages
1 Retail Home loan book excluding Retail Relationship Banking & Business Banking2 Based on Nedbank MMFTP, Liquidity & Balance Sheet Management charges, excluding endowment on ECAP3 Margin required for 06-08 profile to be EP neutral in 2010, assuming no drop-off due to higher price4 LTV based on original loan amount & valuation at point of registration
>10090-100
LTV Distribution (%)4 Jun ‘14Lending margin (%)2
~300bps higher margin required3
80-900-80
7,2
14,7
3,45,4
8,0
2,8
Pre-06 06-08 09-14
2,22,5
1,0
0,2 0,10,3
Pre-06 06-08 09-14
1,51,2 1,2
1,6
1,1
1,9
Pre-06 06-08 09-14
(111)
(748)
(45)
22 45 143
Pre-06 06-08 09-14
4322 28
13
12
39
37
39
327
272
Pre-06 06-08 09-14
21
A
B
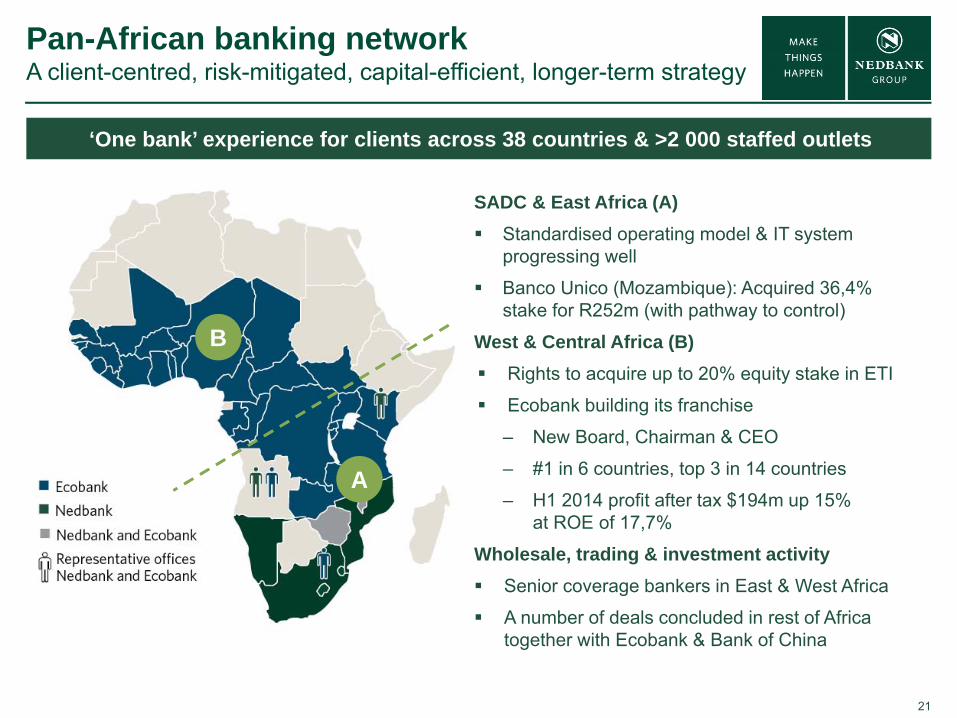
Pan-African banking networkA client-centred, risk-mitigated, capital-efficient, longer-term strategy
‘One bank’ experience for clients across 38 countries & >2 000 staffed outlets
SADC & East Africa (A) Standardised operating model & IT system
progressing well
Banco Unico (Mozambique): Acquired 36,4% stake for R252m (with pathway to control)
West & Central Africa (B) Rights to acquire up to 20% equity stake in ETI
Ecobank building its franchise
‒ New Board, Chairman & CEO
‒ #1 in 6 countries, top 3 in 14 countries
‒ H1 2014 profit after tax $194m up 15% at ROE of 17,7%
Wholesale, trading & investment activity Senior coverage bankers in East & West Africa
A number of deals concluded in rest of Africa together with Ecobank & Bank of China
22
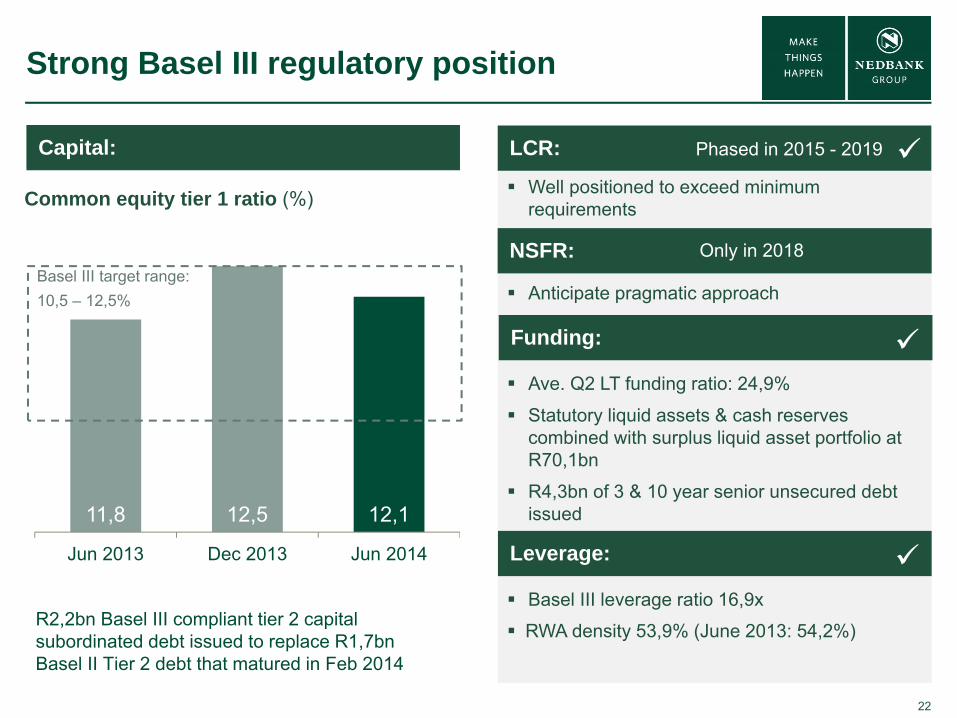
11,8 12,5 12,1
Jun 2013 Dec 2013 Jun 2014
Capital: Only 2015
Well positioned to exceed minimum requirements
Anticipate pragmatic approach
Ave. Q2 LT funding ratio: 24,9%
Statutory liquid assets & cash reserves combined with surplus liquid asset portfolio at R70,1bn
R4,3bn of 3 & 10 year senior unsecured debt issued
Basel III leverage ratio 16,9x
RWA density 53,9% (June 2013: 54,2%)
Strong Basel III regulatory position
Common equity tier 1 ratio (%)
NSFR: Only in 2018
LCR: Phased in 2015 - 2019
Funding:
R2,2bn Basel III compliant tier 2 capital subordinated debt issued to replace R1,7bn Basel II Tier 2 debt that matured in Feb 2014
Leverage:
Basel III target range: 10,5 – 12,5%
23
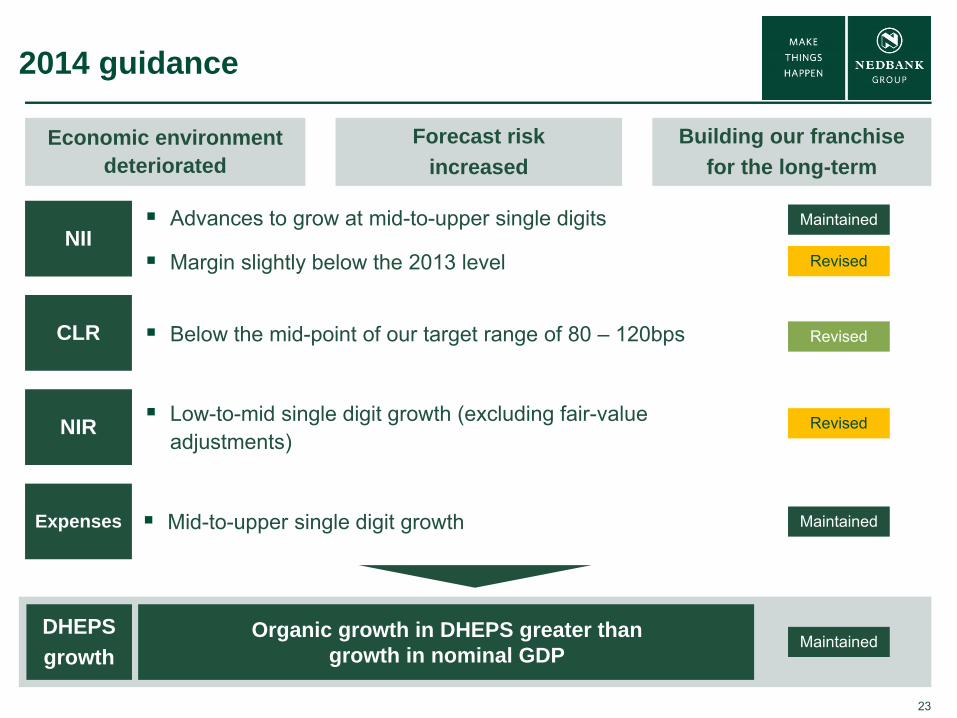
2014 guidance
Advances to grow at mid-to-upper single digits
Margin slightly below the 2013 levelNII
Below the mid-point of our target range of 80 – 120bps
Low-to-mid single digit growth (excluding fair-value adjustments)
Mid-to-upper single digit growth
CLR
NIR
Expenses
Economic environment deteriorated
Forecast risk increased
Building our franchise for the long-term
Revised
Revised
Revised
Maintained
Maintained
Organic growth in DHEPS greater than growth in nominal GDP
DHEPSgrowth
Maintained
24
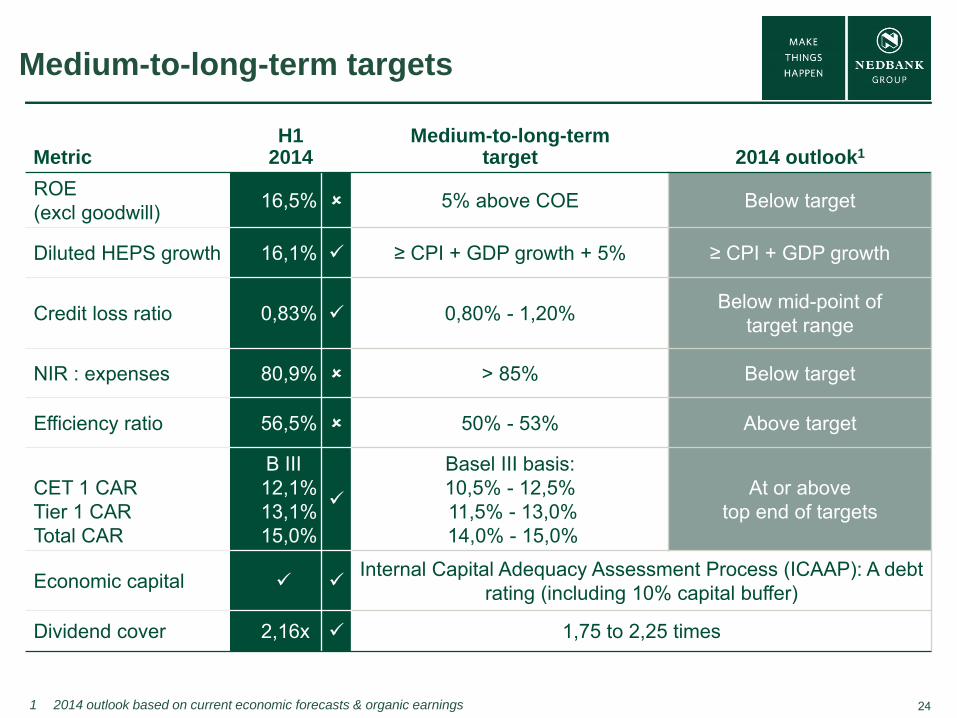
Medium-to-long-term targets
MetricH1
2014Medium-to-long-term
target 2014 outlook1
ROE (excl goodwill) 16,5% 5% above COE Below target
Diluted HEPS growth 16,1% ≥ CPI + GDP growth + 5% ≥ CPI + GDP growth
Credit loss ratio 0,83% 0,80% - 1,20% Below mid-point of target range
NIR : expenses 80,9% > 85% Below target
Efficiency ratio 56,5% 50% - 53% Above target
CET 1 CARTier 1 CARTotal CAR
B III12,1%13,1%15,0%
Basel III basis:10,5% - 12,5%11,5% - 13,0%14,0% - 15,0%
At or above top end of targets
Economic capital Internal Capital Adequacy Assessment Process (ICAAP): A debt
rating (including 10% capital buffer)
Dividend cover 2,16x 1,75 to 2,25 times
1 2014 outlook based on current economic forecasts & organic earnings
25
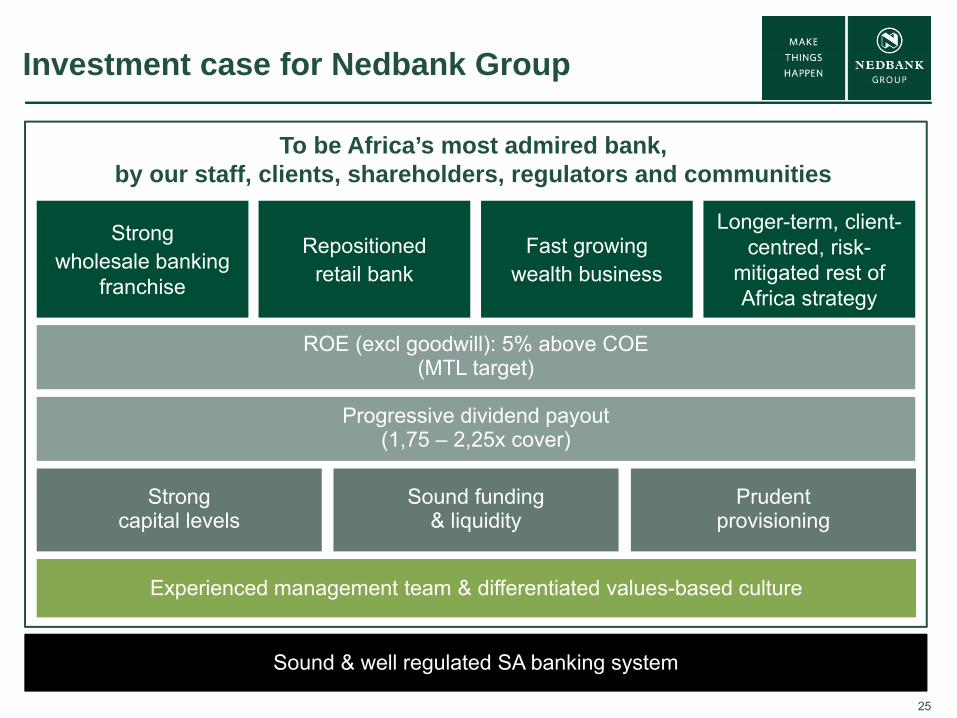
Investment case for Nedbank Group
Strong capital levels
Sound funding & liquidity
Prudent provisioning
Experienced management team & differentiated values-based culture
Sound & well regulated SA banking system
Strong wholesale banking
franchise
Repositioned retail bank
Fast growing wealth business
Longer-term, client-centred, risk-
mitigated rest of Africa strategy
To be Africa’s most admired bank, by our staff, clients, shareholders, regulators and communities
Progressive dividend payout(1,75 – 2,25x cover)
ROE (excl goodwill): 5% above COE(MTL target)
26
0
50
100
150
200
250
Aug‐09 Aug‐10 Aug‐11 Aug‐12 Aug‐13 Aug‐140
40
80
120
160
200
Aug‐11 Feb‐12 Aug‐12 Feb‐13 Aug‐13 Feb‐14 Aug‐14
0
40
80
120
160
Aug‐13 Oct‐13 Dec‐13 Feb‐14 Apr‐14 Jun‐14 Aug‐14
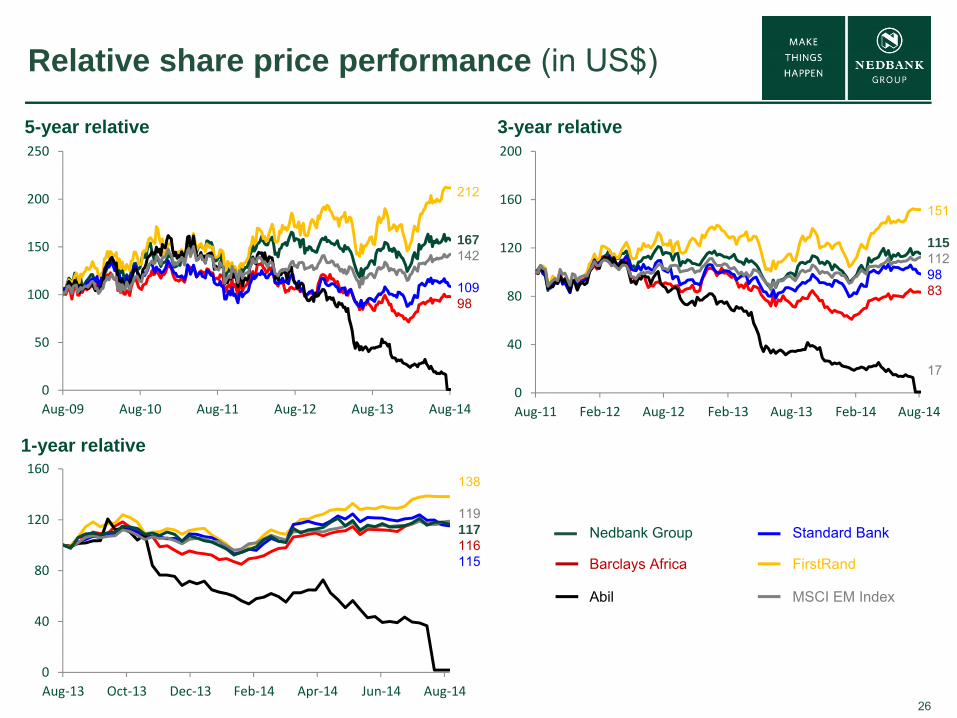
Relative share price performance (in US$)
5-year relative 3-year relative
1-year relative
Nedbank Group
Barclays Africa
Standard Bank
FirstRand
Abil MSCI EM Index
212
167142
10998
138
119117116115
151
1151129883
17

27
Nedbank Group segmental overview
Nedbank Capital
Nedbank Corporate
Nedbank Business Banking
Nedbank Retail
Nedbank Wealth
Investment banking, global markets & treasury solutions to institutional and corporate clients.
Offices: SA & LondonRep offices: Angola, Toronto
Lending, deposit taking, transactional banking for SA corporates with t/over >R700m p.a. & commercial property finance.
Commercial banking solutions to small- to medium-sized businesses with turnover of R10m – R700m p.a.
Holistic offering for the business, business owners / households & employees
A bank for all financial needs of individuals & small businesses <R10m turnover p.a. Transactional, card, lending, deposit taking, risk management and investment products / services, as well as card-acquiring services for business
Insurance, asset management & wealth management solutions
Offices in SA, London, Isle of Man, Jersey, Guernsey & Middle East.
AUM:R210bn
Clients among top 200 SA corporates & parastatals
Top 3 mergers & acquisitions player
Industry expertise in: Infrastructure Mining & resources Oil and gas Telecoms Energy
Top 2 SA corporate bank > 600 large corporate clients Strong market share in public
sector loans Continued market leadership in
commercial property finance
25 000 client groups and strong primary client gains
A leader in Corporate Saver deposits & debtor management
Excellent client-centred risk management & worldclasscustomer management capabilities
Distinctive client value propositions & accountable empowered decentralised business service model
6,7m clients
762 branches and alternate outlets, 279 Personal Loan kiosks and 3 445 ATMs
Strong positioning in household motor finance (25% share), and household deposits (20%)
Compelling, innovative CVPs for all segments
Life embedded value: R2,2bn Assets under management:
R209,5bn >10 000 high-net-worth clients
Nedgroup Investments: Raging Bull awards: Top 3
management company in SA for the 5th consecutive year;
Plexus Survey: 3rd amongst domestic managers;
2nd in international categoryNedbank Private Wealth:
Four of our top funds ranked top in their categories over 10 years.
Strong Investment Banking (IB) pipeline with more cross-sell across businesses.
Strategic growth in Africa and leverage Ecobank & Bank ofChina.
Leverage industry expertise. Leverage trading systems. Participating strongly in SA’s
infrastructure build programme & leverage leadership in renewable energy.
Strong client relationships. Continued product and NIR
growth through enhanced capabilities & primary-client growth.
Increased Pan-African focus. Strong risk management.
A choice of distinctive client-centred banking experiences.
A rigorous approach to capturing virtuous circle & interdependencies between client segments.
Integrated-channels strategy leveraging mobile innovation, digital channels & social media; selected micro markets for growth/optimisation; area collaboration.
Robust risk management supporting strong product niches.
Liabilities innovation sustaining historical strength.
Collaborative, people-centred culture.
Explore broader complimentaryfinancial services opportunities.
Continued enhancements to value propositions & offerings.
Unlocking new value & efficiencies through business transformation.
Leverage advantage of group collaboration.
Des
crip
tion
Ope
ratio
nal
over
view
Fina
ncia
lm
etric
sK
ey s
trate
gic
driv
ers
Assets Headline earnings Assets
Headline earnings Assets
Headline earnings Assets
Headline earnings
Headline earnings
ROE: 29,4% ROE: 26,4% ROE: 19,4% ROE: 11,6% ROE: 36,2%
24% 23% 26% 25% 13% 11% 26% 29% 10%

28
Contact us
Nedbank Groupwww.nedbankgroup.co.zaNedbank Group LimitedTel: +27 (0) 11 294 4444Physical address 135 Rivonia RoadSandown 2196 South Africa
Download the Nedbank Investor Centre App from the Nedbank App Suite:
Nedbank Investor RelationsHead of Investor Relations Alfred Visagie Direct tel: +27 (0) 11 295 6249 Cell: +27 (0) 82 855 4692 Email: [email protected]
Investor Relations Consultant Penny Him Lok Direct tel: +27 (0)11 295 6549 Email: [email protected]
Investor Relations AnalystCaron Askew Direct tel: +27 (0) 11 294 0752Email: [email protected]
DisclaimerNedbank Group has acted in good faith and has made every reasonable effort to ensure the accuracy and completeness of the information contained in this document,including all information that may be defined as 'forward-looking statements' within the meaning of United States securities legislation.Forward-looking statements may be identified by words such as ‘believe’, 'anticipate', 'expect', 'plan', 'estimate', 'intend', 'project', 'target', 'predict' and 'hope'.Forward-looking statements are not statements of fact, but statements by the management of Nedbank Group based on its current estimates, projections, expectations,beliefs and assumptions regarding the group's future performance.No assurance can be given that forward-looking statements will prove to be correct and undue reliance should not be placed on such statements.The risks and uncertainties inherent in the forward-looking statements contained in this document include, but are not limited to: changes to IFRS and the interpretations,applications and practices subject thereto as they apply to past, present and future periods; domestic and international business and market conditions such as exchangerate and interest rate movements; changes in the domestic and international regulatory and legislative environments; changes to domestic and international operational,social, economic and political risks; and the effects of both current and future litigation.Nedbank Group does not undertake to update any forward-looking statements contained in this document and does not assume responsibility for any loss or damagewhatsoever and howsoever arising as a result of the reliance by any party thereon, including, but n limited to, loss of earnings, profits, or consequential loss or damage.†