2014 uil injury report
DESCRIPTION
2014 UIL Injury ReportTRANSCRIPT
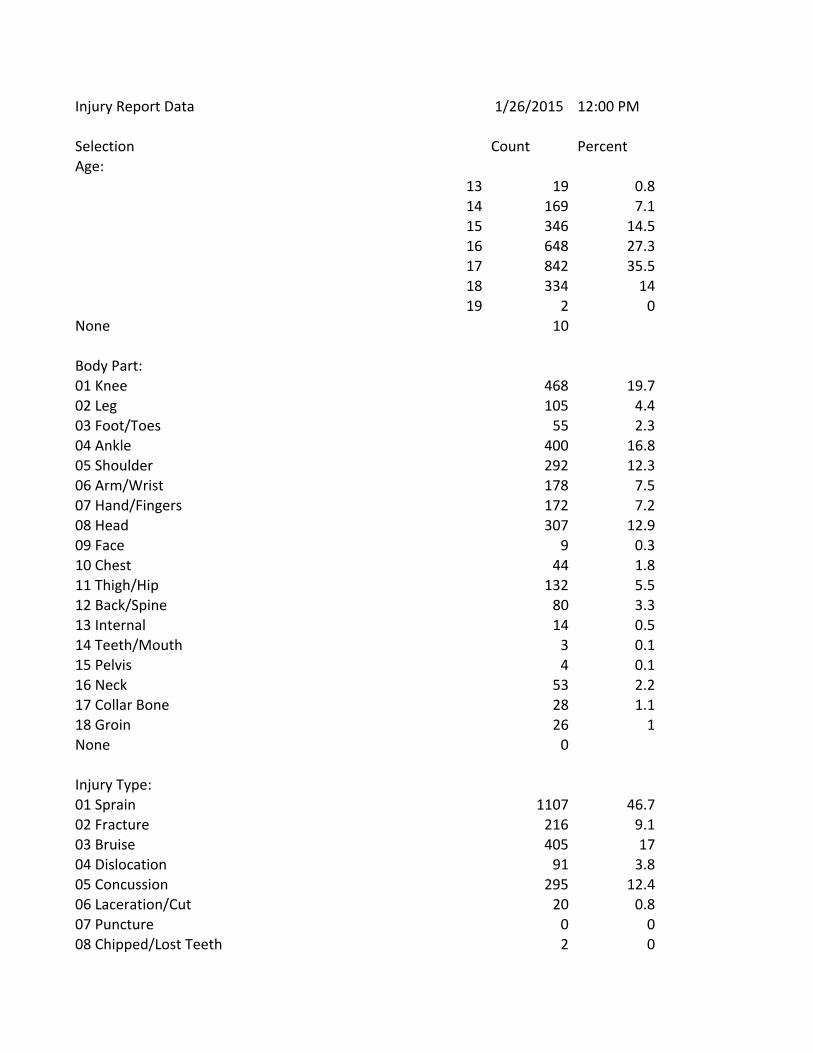
Injury Report Data 1/26/2015 12:00 PM Selection Count Percent Age:
13 19 0.814 169 7.115 346 14.516 648 27.317 842 35.518 334 1419 2 0
None 10 Body Part: 01 Knee 468 19.702 Leg 105 4.403 Foot/Toes 55 2.304 Ankle 400 16.805 Shoulder 292 12.306 Arm/Wrist 178 7.507 Hand/Fingers 172 7.208 Head 307 12.909 Face 9 0.310 Chest 44 1.811 Thigh/Hip 132 5.512 Back/Spine 80 3.313 Internal 14 0.514 Teeth/Mouth 3 0.115 Pelvis 4 0.116 Neck 53 2.217 Collar Bone 28 1.118 Groin 26 1None 0 Injury Type: 01 Sprain 1107 46.702 Fracture 216 9.103 Bruise 405 1704 Dislocation 91 3.805 Concussion 295 12.406 Laceration/Cut 20 0.807 Puncture 0 008 Chipped/Lost Teeth 2 0
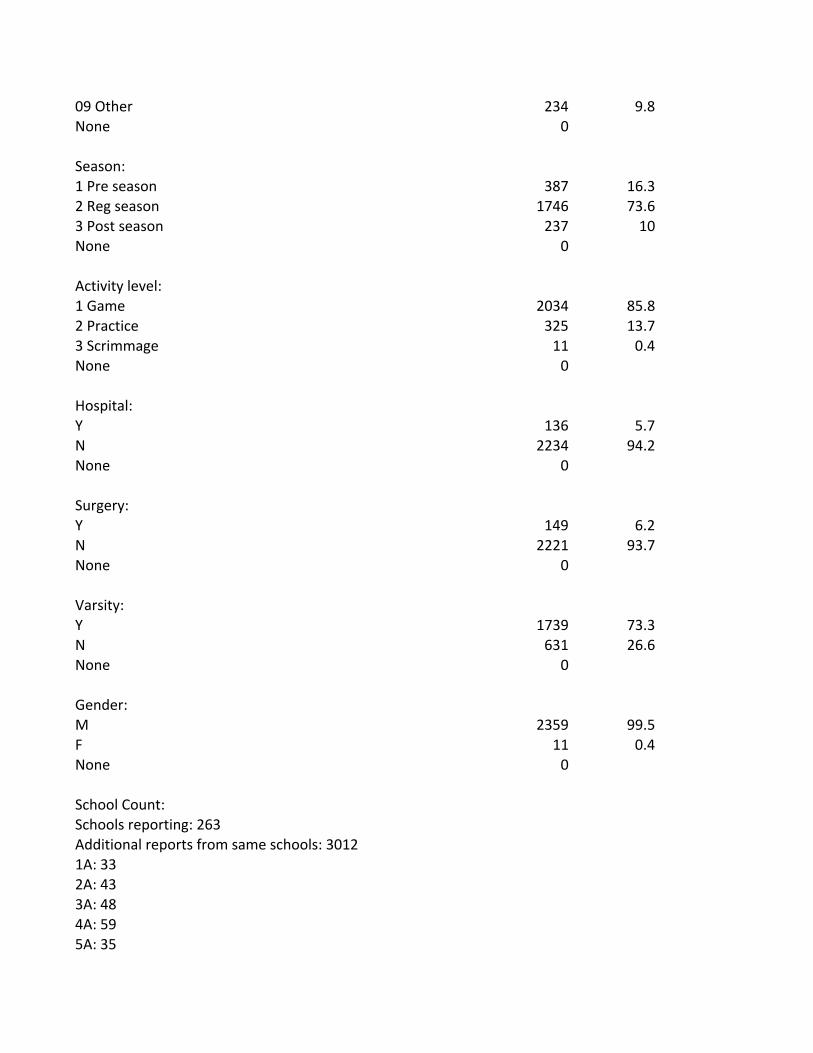
09 Other 234 9.8None 0 Season: 1 Pre season 387 16.32 Reg season 1746 73.63 Post season 237 10None 0 Activity level: 1 Game 2034 85.82 Practice 325 13.73 Scrimmage 11 0.4None 0 Hospital: Y 136 5.7N 2234 94.2None 0 Surgery: Y 149 6.2N 2221 93.7None 0 Varsity: Y 1739 73.3N 631 26.6None 0 Gender: M 2359 99.5F 11 0.4None 0 School Count: Schools reporting: 263 Additional reports from same schools: 3012 1A: 33 2A: 43 3A: 48 4A: 59 5A: 35

Invalid conf: 45 No injury: 905 Injuries reported: 2370 Total injury reports: 3275

12:00 PM
Percent