2014 traffic counting report for cape cod …€¦ · 2014 traffic counting report for cape cod...
TRANSCRIPT
2014 Traffic Counting Report for Cape Cod Massachusetts Prepared in cooperation with: MASSACHUSETTS DEPARTMENT OF TRANSPORTATION UNITED STATES DEPARTMENT OF TRANSPORTATION FEDERAL HIGHWAY ADMINISTRATION APRIL 2014

2014 Traffic Counting Report

2014 Traffic Counting Report Page iii
Executive Summary
The Cape Cod Commission (formerly the Cape Cod Planning and Economic Development Commission) has completed 31 summer seasons in the ongoing Traffic Counting Program. The Cape Cod Commission adds new locations and updates existing ones each year. Over 1219 different locations on Cape Cod have been counted at least once, and over 6,170 counts have been performed since the program began. The result of the Traffic Counting Program is a useful database of traffic volume information for transportation planning.
In 2014, the Commission’s Traffic Counting Program included 214 weekday automatic traffic recorder (ATR) counts, listed in Appendix A. Over a 10-year period (2004-2014), summer traffic Cape-wide has decreased an average 0.33% per year. The past year (2013-2014) has seen a slight change in summer traffic volumes with an overall increase in Cape-wide summer traffic of 2.04%. Data obtained from the Massachusetts Department of Transportation’s permanent counting stations and are included in tables separate from the counts done by the Commission’s program. This year, the Commission’s staff also collected seven weekend counts, which are included in Appendix C.
In addition to ATR counts, in total, the Traffic Counting Program has completed over 932 turning movement counts (TMCs), over 363 park-and-ride lot observations, over 1412 travel time studies, and 43 bicycle and pedestrian studies. Year-round monthly data from the Commission’s three remote counting stations (two in Harwich, one in Barnstable) provide a view of the seasonal traffic changes in the Mid- and Lower Cape subregions. Results of these efforts are presented in the Appendices D through H.
Local, state, and federal officials, engineers, transportation planners, and many other organizations and individuals use the traffic counting data. The information is used to perform traffic impact studies for new developments, analyze existing traffic demands on Cape Cod's roads, and identify ways to improve traffic flow and safety. The Commission expects to continue to expand and update this important database for transportation planning.
Page iv 2014 Traffic Counting Report
Acknowledgments
The Cape Cod Commission’s transportation staff would like to thank the Federal Highway Administration, the Massachusetts Department of Transportation, and the County of Barnstable for providing the funding and support for this important transportation planning activity. The following individuals and organizations were instrumental in conducting this work:
Massachusetts Department of Transportation (MassDOT) Stephanie Pollack, Secretary of Transportation and CEO Richard A. Davey, Secretary of Transportation and CEO David Mohler, Executive Director, Office of Transportation Planning
Bryan Pounds, Cape Cod Liaison Massachusetts Department of Transportation (MassDOT), Highway Division Thomas Tinlin, Acting Administrator of Highway Division
Frank DePaola, Administrator of Highway Division Mary-Joe Perry, District 5 Highway Director Steven O’Neill Stephen Greene Federal Highway Administration Leah Sirmin Cape Cod Commission Cape Cod Metropolitan Planning Organization Cape Cod Joint Transportation Committee
The Cape Cod Commission’s transportation staff would like to thank Brian Meuse and Jacob Wright, the Cape Cod Commission’s traffic counting technicians for summer 2014.
Prepared by the Cape Cod Commission Transportation Staff Paul Niedzwiecki, Executive Director Patty Daley, Deputy Director Glenn D. Cannon, P.E., Director of Technical Services Lev A. Malakhoff, Senior Transportation Engineer Steven M. Tupper, Technical Services Planner Patrick Tierney, Technical Services Planner
2014 Traffic Counting Report Page v
Table of Contents
Executive Summary ..................................................................................... iii
Acknowledgments ........................................................................................ iv
Table of Contents ........................................................................................... v
List of Tables ........................................................................................... vii
List of Figures ........................................................................................ viii
1. Introduction ............................................................................................... 1
2. Using the Traffic Counting Data .............................................................. 3
2.1. Town ................................................................................................... 3
2.2. Route/Location Information ............................................................. 3
2.3. Date of Study: (Yr), (Begin Date), (End Date) .................................. 4
2.4. Weather Conditions: (Weather) ......................................................... 5
2.5. Direction of Travel: (Direction) .......................................................... 5
2.5. Speed mph: (85th percentile Traffic speed) ........................................ 5
2.6. Axle Adjusted Average Daily Traffic: (Axle Adj. ADT) ..................... 6
2.7. Peak Hour Data: (Date&Day), (Hour), (Vol) .................................... 6
2.8. 4:00–5:00 p.m. Traffic: (Four~Five) ................................................ 7
2.9. Annual Average Daily Traffic: (AADT) .............................................. 7
3. Weekend Traffic Counts ........................................................................... 8
3.1. Axle Adjusted Average Daily Traffic: ([Sat.], [Sun.], and [Holiday]) 8
3.2. Peak Hour Data: ([Sat.], [Sun.], and [Holiday] Volume & Time of Day) ........................................................................................................... 9
4. Axle Correction ........................................................................................ 10
Page vi 2014 Traffic Counting Report
5. MassDOT Data and Seasonal Adjustment Factors ................................ 12
5.1. Permanent Traffic Counting Stations ............................................... 12
5.2. Seasonal Adjustment Factors ........................................................... 15
6. Cape Cod Commission Remote Counting Stations ................................ 17
7. Results and Analysis ................................................................................ 18
7.1. Permanent Counting Stations and Bridge Crossings ....................... 18
7.2. Cape-Wide Traffic ............................................................................. 25
7.3. Speed Data ....................................................................................... 28
Appendices .................................................................................................. 33
Appendix A: 2013 Traffic Counts
Appendix B: Weekday Traffic Counts 2004-2014
Appendix C: Weekend Traffic Counts 2004-2014
Appendix D: Turning Movement Counts 2004-2014
Appendix E: Bicycle/Pedestrian Counts 2007-2014
Appendix F: Park and Ride Lot Counts 1995-2014
Appendix G: Travel Time Records 1995-2013
Appendix H: Remote Counting Locations 2011-2014

2014 Traffic Counting Report Page vii
LIST OF TABLES
Table 1: CCC Traffic Counting Program Activity ......................................... 2
Table 2: Axle Adjustment Factors for Cape Cod ........................................ 11
Table 3: Canal Bridges Permanent Traffic Counting Stations ................... 13
Table 4: Other Cape Cod Permanent Traffic Counting Stations ................ 14
Table 5: Monthly Adjustment Factors for Cape Cod .................................. 16
Table 6 – Average Daily Traffic at Remote Data Collection Sites .............. 17
Table 7: Growth Rates - Permanent Counting Stations and Bridge Crossings ...................................................................................................... 18
Table 8: Cape Cod Summer Traffic Growth by Subregion ........................ 26
Table 9: Barnstable County Population Estimate ...................................... 27
Page viii 2014 Traffic Counting Report
LIST OF FIGURES
Figure 1 – Combined Average Daily Traffic over Bourne and Sagamore Bridges ......................................................................................................... 19
Figure 2 - Historic Monthly ADT Changes at the Bourne and Sagamore Bridges ........................................................................................................ 20
Figure 3: Weekend vs. Weekday Trips across the Cape Cod Canal Bridges ...................................................................................................................... 21
Figure 4: Monthly Directional Average Daily Traffic at the Cape Cod Canal Bridges ......................................................................................................... 22
Figure 5: Hourly Summer Data at MassDOT Permanent Counting Stations on Route 28 ................................................................................... 23
Figure 6: Monthly Traffic Volumes Recorded at Cape Cod Commission Permanent Counting Stations ..................................................................... 24
Figure 7: Percentage Change for 10-Year Periods ...................................... 25
Figure 8: Subregion 10-year Average Annual Growth Rate (%) ................ 27
Figure 9: Speed Data Graph Showing Locations Non-Compliant Speeds 29
Figure 12: Cape Cod Road Network ........................................................... 30
Figure 13: Cape Cod Road Network Functional Class ............................... 31
2014 Traffic Counting Report Page 1
1. Introduction
This report summarizes traffic counts conducted between 2004 and 2014 by the Cape Cod Commission (previously the Cape Cod Planning and Economic Development Commission). Traffic count locations are selected based on recommendations from the Massachusetts Department of Transportation (MassDOT), town officials, members of the Cape Cod Joint Transportation Committee, and the Cape Cod Commission transportation staff.
Since 1989, the Commission staff has used automatic traffic recorders (ATRs) to conduct traffic counts. Earlier counts used “paper-punch” traffic counting equipment. ATR technology has advanced over the past decade to allow many different types of studies. All of the counters in the Commission’s ATR fleet now have the ability to do speed and classification studies, as well as volume counts. Simple collection of traffic volumes is still the most frequent type of study conducted by the Commission, but vehicle speed and vehicle classification studies are conducted upon request from MassDOT or local officials.
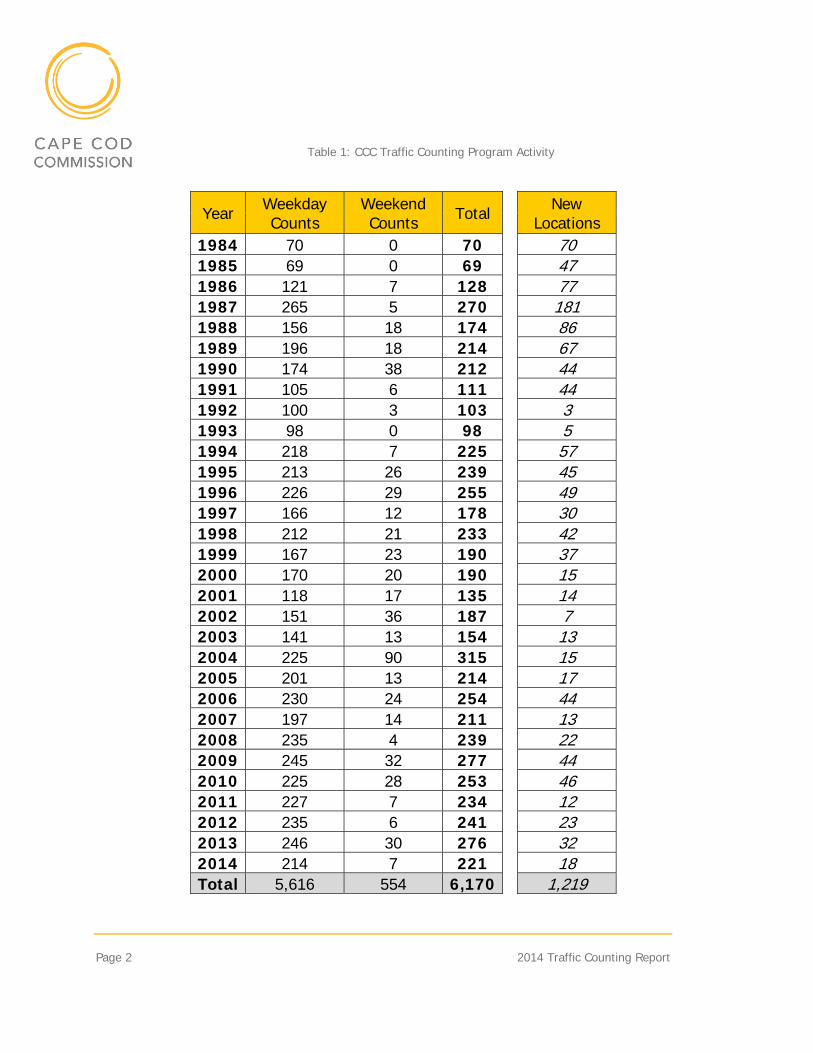
Cape Cod’s Traffic Counting Program began in 1984. Since the first count, the Commission staff has obtained 5,616 weekday counts and 554 weekend counts at over 1,219 different locations. In 2014, Commission staff collected 214 weekday counts and seven weekend counts. Directional traffic volume counts were conducted at most of the locations where possible. Directional information is important when performing traffic studies because direction of travel can vary significantly by time of day. The Commission staff also fulfilled special requests such as vehicle speed and classification studies during the summer. The following table summarizes the activities of the Traffic Counting Program for the past 31 traffic counting seasons. Appendix A includes a summary of all ATR counts obtained in 2014.
Page 2 2014 Traffic Counting Report
Table 1: CCC Traffic Counting Program Activity
Year Weekday Counts
Weekend Counts Total New
Locations 1984 70 0 70 70 1985 69 0 69 47 1986 121 7 128 77 1987 265 5 270 181 1988 156 18 174 86 1989 196 18 214 67 1990 174 38 212 44 1991 105 6 111 44 1992 100 3 103 3 1993 98 0 98 5 1994 218 7 225 57 1995 213 26 239 45 1996 226 29 255 49 1997 166 12 178 30 1998 212 21 233 42 1999 167 23 190 37 2000 170 20 190 15 2001 118 17 135 14 2002 151 36 187 7 2003 141 13 154 13 2004 225 90 315 15 2005 201 13 214 17 2006 230 24 254 44 2007 197 14 211 13 2008 235 4 239 22 2009 245 32 277 44 2010 225 28 253 46 2011 227 7 234 12 2012 235 6 241 23 2013 246 30 276 32 2014 214 7 221 18 Total 5,616 554 6,170 1,219

2014 Traffic Counting Report Page 3
2. Using the Traffic Counting Data
Appendix B contains all weekday traffic counts performed between 2004 and 2014. The traffic counts for each town are contained in individual data sets. At locations with directional volumes, the information is first provided for the total of both directions, with the directional volumes following below. Counts performed on numbered routes are listed first in numerical order. Subsequently, named streets are listed in alphabetical order. If a roadway has more than one name it may be necessary to look under both names for the desired information, such as Central Road and Great Neck Road North in the Town of Mashpee. Traffic count data followed by an asterisk (*) represents counts performed by MassDOT or another agency (e.g., the Town of Barnstable’s engineering department). These counts are primarily located on Route 6 and roads of local interest. Each column of data is explained in the sections that follow.
2.1. TOWN
Traffic counts are grouped by the town in which the count took place. The towns are ordered geographically, beginning with Bourne in the Upper Cape region and ending with Provincetown in the Outer Cape. A map of the town order is included in Appendix B to help navigate through the count data.
2.2. ROUTE/LOCATION INFORMATION
The roadway where the traffic count was taken is listed first for each count location. As part of the description, the orientation of the location with respect to the nearest cross street or notable geographic detail is also listed. For example, “Rt 3A S of Bour/Plym TL” is shorthand for “Route 3A, south of the Bourne/Plymouth town line.” Note that the counts performed on a town line are listed twice in the report. For each count location taken at a town line, the count location is given under both town names. This allows the data to be analyzed more effectively. For a
Page 4 2014 Traffic Counting Report
complete listing of abbreviated terms please refer to the Glossary of Abbreviations following the text of this report.
2.3. DATE OF STUDY: (YR), (BEGIN DATE), (END DATE)
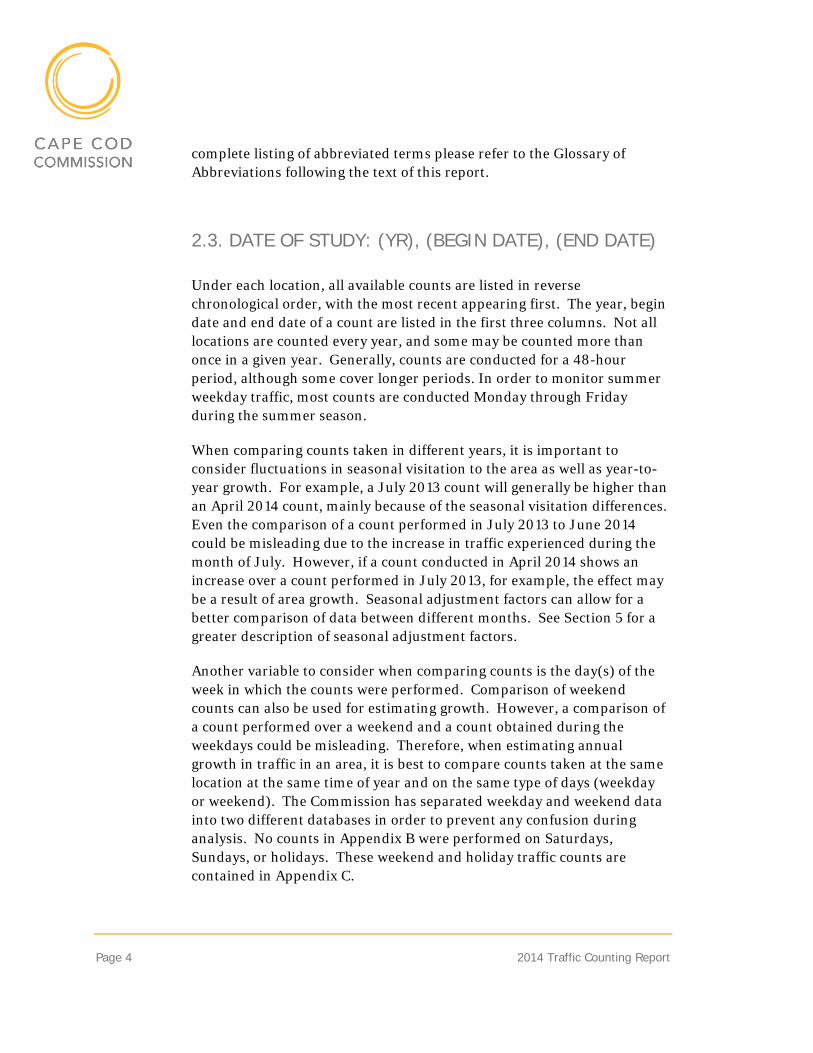
Under each location, all available counts are listed in reverse chronological order, with the most recent appearing first. The year, begin date and end date of a count are listed in the first three columns. Not all locations are counted every year, and some may be counted more than once in a given year. Generally, counts are conducted for a 48-hour period, although some cover longer periods. In order to monitor summer weekday traffic, most counts are conducted Monday through Friday during the summer season.
When comparing counts taken in different years, it is important to consider fluctuations in seasonal visitation to the area as well as year-to-year growth. For example, a July 2013 count will generally be higher than an April 2014 count, mainly because of the seasonal visitation differences. Even the comparison of a count performed in July 2013 to June 2014 could be misleading due to the increase in traffic experienced during the month of July. However, if a count conducted in April 2014 shows an increase over a count performed in July 2013, for example, the effect may be a result of area growth. Seasonal adjustment factors can allow for a better comparison of data between different months. See Section 5 for a greater description of seasonal adjustment factors.
Another variable to consider when comparing counts is the day(s) of the week in which the counts were performed. Comparison of weekend counts can also be used for estimating growth. However, a comparison of a count performed over a weekend and a count obtained during the weekdays could be misleading. Therefore, when estimating annual growth in traffic in an area, it is best to compare counts taken at the same location at the same time of year and on the same type of days (weekday or weekend). The Commission has separated weekday and weekend data into two different databases in order to prevent any confusion during analysis. No counts in Appendix B were performed on Saturdays, Sundays, or holidays. These weekend and holiday traffic counts are contained in Appendix C.

2014 Traffic Counting Report Page 5
2.4. WEATHER CONDITIONS: (WEATHER)
Weather conditions may influence traffic volumes on Cape Cod. Cloudy days often contribute to increased traffic congestion except on beach access roads. On rainy or cloudy days, people engage in sightseeing or shopping rather than spending time at home or a favorite sunny-day location. In the data tables, brief descriptions of weather conditions during the count period are given. This information should be regarded with caution, as weather conditions may change considerably throughout a single day on Cape Cod. The Commission staff records the weather conditions of a count when setting down and picking up the traffic counting equipment. Of all the data provided in the tables, this category is the most subjective.
2.5. DIRECTION OF TRAVEL: (DIRECTION)
Direction identifies the direction of travel for the traffic on a roadway. Each traffic count is divided into three rows. The first row, “Total,” lists the data for the sum of the two directions. The next two rows list the directional data, with the direction of travel for the row indicated by the Direction column. If the count was done on a one-way road, only data for the one direction are listed and are identical to the information listed in the Total column. If the traffic counter did not separate the counts into the directional movements, only the data for the summation of both directions are listed.
2.5. SPEED MPH: (85TH PERCENTILE TRAFFIC SPEED)
Speed limits are typically based on the 85th percentile traffic speed (the maximum speed at which 85% of the vehicles are traveling). The measured 85th percentile speed can be different than the existing speed limit because of factors such as changes in geometric roadway geometry and driver behavior. All new ATR devices can determine the speed of vehicle traffic. The Cape Cod Commission has begun to record this figure at the request of town, staff or MassDOT officials. The data are presented for each direction of traffic. Practical uses of the data could include

Page 6 2014 Traffic Counting Report
evaluating the speed limit and safety of the roadway. 85th percentile speed can be found in appendices A & B.
2.6. AXLE ADJUSTED AVERAGE DAILY TRAFFIC: (AXLE ADJ. ADT)
Axle Adjusted Average Daily Traffic (AxADT) is an estimate of the average number of vehicles over a 24-hour period. Many of the older counters recorded pairs of “axle hits,” not vehicles. This meant that multiple-axle vehicles were counted as more than one vehicle (i.e., two 5-axle trucks were recorded as 5 vehicles). This method produced an estimated number of vehicles that was higher than the actual number. Axle correction factors are used to adjust, as necessary, the ATR data. See Section 4 for a more detailed description of axle correction factors.
2.7. PEAK HOUR DATA: (DATE&DAY), (HOUR), (VOL)
The Peak Hour is the highest one-hour traffic volume observed during the period counted. Three columns offer data on the Peak Hour of a count. The date and day of the week (Date&Day) in which the peak occurred is listed first. The hour of the day (Hour) representing the Peak Hour is listed in the second column using 24-hour time (e.g., “16” means that the Peak Hour occurred beginning at 4:00 p.m. and ending at 5:00 p.m.). The Peak Hour Volume (Vol) is listed in the third and right-most column. Please be aware that the two-way Peak Hour volume may not be equal to the sum of the two directional Peak Hour volumes. Instead, it may represent the hour within the period counted when the sum of traffic in both directions was greatest. Starting in 2011, peak hour volumes for each direction of travel correspond to the peak hour combined travel. This is to conform to MassDOT reporting requirements. Axle correction factors were used as necessary. Please see Section 4 for more information on axle correction factors.
Peak Hour information is significant for transportation planning. First, it indicates the highest traffic demands on a roadway. Second, it can show how close a roadway’s use is to its capacity. For example, if counts taken in different years or during different months of the same year indicate a
2014 Traffic Counting Report Page 7
change in average daily traffic without a corresponding change in Peak Hour traffic, the roadway may be experiencing capacity constraints during peak times.
2.8. 4:00–5:00 P.M. TRAFFIC: (FOUR~FIVE)
The “Four~Five” column indicates the average traffic volume recorded between 4:00-5:00 p.m. during the count period. As with the other categories of data, the 4:00-5:00 p.m. volume is given for the total of both directions first, and then for each corresponding direction. The two-way 4:00-5:00 p.m. average volume is equal to the sum of the two directional 4:00-5:00 p.m. average volumes. Axle correction factors were used as necessary. Please see Section 4 for more information on axle correction factors.
The 4:00-5:00 p.m. volume has been included as an aid to transportation planners and engineers. In addition to these purposes, the 4:00-5:00 p.m. volume also provides useful information when compared to the Peak Hour volume for a particular location. For example, during the years 2004-2014, Cape-wide, the Peak Hour for the entire day generally fell between the hours of 4:00-5:00 p.m. (Rush Hour). The entire dataset supports this finding. It is still the case that the 4:00-5:00 p.m. volume is often the Peak Hour for the location.
2.9. ANNUAL AVERAGE DAILY TRAFFIC: (AADT)
The Annual Average Daily Traffic (AADT) is calculated by multiplying the AxADT by a seasonal adjustment factor for the month of the count. MassDOT supplies these factors based on six permanent traffic-counting stations on Cape Cod. Note that this year-round AADT is only an estimate, based on seasonal changes in traffic volumes at these six locations. A description of the techniques used by MassDOT to develop the seasonal adjustment factors can be found in Section 5.
Page 8 2014 Traffic Counting Report
3. Weekend Traffic Counts
A feature added to this report in 1999 is a listing of traffic counts taken during weekends and holidays. Since then, the database has been expanded to include weekend counts performed in both earlier and later years. In 2014, seven weekend counts were added for a total of 554 weekend counts recorded since the Traffic Counting Program began in 1984. This weekend database continues to grow each year and is included in Appendix C. Many of the headings are similar to those of the weekday database discussed in Section 2. The counts presented are representative of specific days and dates (Saturdays, Sundays, and holidays) and therefore have not been averaged or seasonally adjusted.
Counts are listed in geographical order, starting with Bourne and ending with Provincetown. Within each town’s listing, counts are listed by route name. Counts performed on numbered routes are listed first in numerical order. Subsequently, named streets are listed in alphabetical order. If a roadway has more than one name it may be necessary to look under both names for the desired information, such as Central Road and Great Neck Road North in the Town of Mashpee.
3.1. AXLE ADJUSTED AVERAGE DAILY TRAFFIC: ([SAT.], [SUN.], AND [HOLIDAY])
As with the Weekday Counts (see Section 2.6), Axle Adjusted Average Daily Traffic (AxADT) is an estimate of the average number of vehicles over a 24-hour period. Many of the older counters recorded pairs of “axle hits,” not vehicles. This meant that multiple-axle vehicles were counted as more than one vehicle (i.e., two 5-axle trucks were recorded as 5 vehicles). This method produced an estimated number of vehicles that was higher than the actual number. Axle correction factors are used to adjust the ATR data, as necessary. See Section 4 for a more detailed description of axle correction factors.
Three columns list AxADT volumes. The first represents counts recorded on Saturdays. The second represents counts recorded on Sundays. The
2014 Traffic Counting Report Page 9
final column represents counts recorded during holidays, such as Independence Day or Labor Day. Many counts do not contain information from all three categories. For each traffic count period, all available data are listed. None of the AxADT volumes have been seasonally adjusted, since counts performed on weekends and holidays are representative of specific days and not of annual data. For more information on seasonal adjustment factors, see Section 5.
3.2. PEAK HOUR DATA: ([SAT.], [SUN.], AND [HOLIDAY] VOLUME & TIME OF DAY)
As with the Weekday Counts (see Section 2.7), the Peak Hour is the highest one-hour traffic volume observed during the period counted. Peak Hour volumes and time of day are given for counts recorded on Saturdays, Sundays, and holidays. Using 24-hour time (e.g., “16” means that the Peak Hour occurred beginning at 4:00 p.m. and ending at 5:00 p.m.), the time of day representing the Peak Hour is listed in the right column of each day’s two-column set. The Peak Hour Volume is listed in the left column of each day’s two-column set. Please be aware that the two-way Peak Hour volume is not equal to the sum of the two directional Peak Hour volumes. Instead, it represents the hour within the period counted when the sum of traffic in both directions was greatest. Axle correction factors were used as necessary. Please see Section 4 for more information on axle correction factors.
Peak Hour information is significant for transportation planning. First, it indicates the highest traffic demands on a roadway. Second, it can show how close a roadway’s use is to its capacity. For example, if counts taken in different years or during different months of the same year indicate a change in average daily traffic without a corresponding change in Peak Hour traffic, the roadway may be experiencing capacity constraints during peak times.
Page 10 2014 Traffic Counting Report
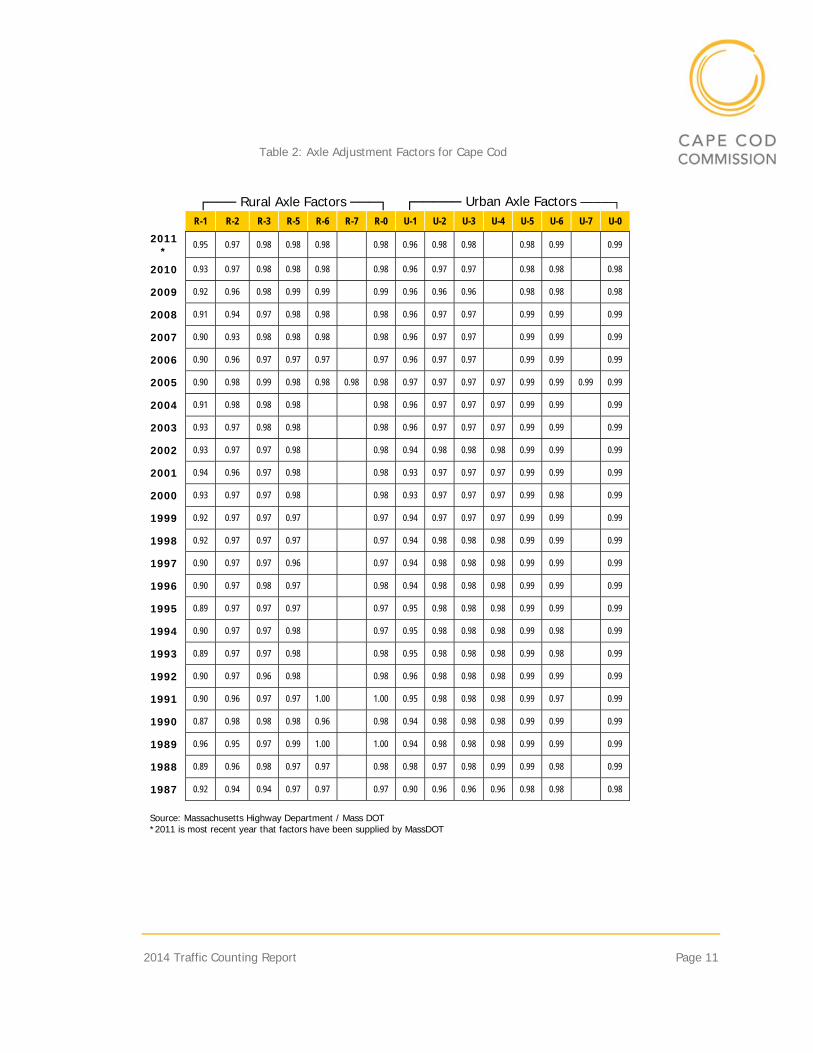
4. Axle Correction
Standard volume counts by the Automatic Traffic Recorders (ATRs) record pairs of axle hits. The ATRs then divide the number of axles by two in order to estimate the volume of the road. This is called the “divide-by-two” method. However, not all vehicles have only two axles. Trucks, for example, can have from three to seven or more axles. A truck with three axles would be counted as 1.5 cars under the divide-by-two method. In order to obtain more accurate estimates, the data must be corrected to account for vehicles with multiple axles. Each year up to 2011 MassDOT has published a series of “axle correction factors.” The appropriate factor for each count must be determined based on the year of the count, the road classification of the count location, and whether the count location is within an urban area.
Classification and speed studies as well as volume counts performed by certain ATR models do not need to be axle corrected because they do not use the divide-by-two method. Instead, they record the actual number of vehicles traveling on a roadway. As a result, the counts included in the Appendices requiring axle correction have had the appropriate axle correction factor applied, while those counts not needing axle correction are unchanged.
2014 Traffic Counting Report Page 11
Table 2: Axle Adjustment Factors for Cape Cod
┌─── Rural Axle Factors ───┐ ┌───── Urban Axle Factors ─────┐ R-1 R-2 R-3 R-5 R-6 R-7 R-0 U-1 U-2 U-3 U-4 U-5 U-6 U-7 U-0
2011*
0.95 0.97 0.98 0.98 0.98 0.98 0.96 0.98 0.98 0.98 0.99 0.99
2010 0.93 0.97 0.98 0.98 0.98 0.98 0.96 0.97 0.97 0.98 0.98 0.98
2009 0.92 0.96 0.98 0.99 0.99 0.99 0.96 0.96 0.96 0.98 0.98 0.98
2008 0.91 0.94 0.97 0.98 0.98 0.98 0.96 0.97 0.97 0.99 0.99 0.99
2007 0.90 0.93 0.98 0.98 0.98 0.98 0.96 0.97 0.97 0.99 0.99 0.99
2006 0.90 0.96 0.97 0.97 0.97 0.97 0.96 0.97 0.97 0.99 0.99 0.99
2005 0.90 0.98 0.99 0.98 0.98 0.98 0.98 0.97 0.97 0.97 0.97 0.99 0.99 0.99 0.99
2004 0.91 0.98 0.98 0.98 0.98 0.96 0.97 0.97 0.97 0.99 0.99 0.99
2003 0.93 0.97 0.98 0.98 0.98 0.96 0.97 0.97 0.97 0.99 0.99 0.99
2002 0.93 0.97 0.97 0.98 0.98 0.94 0.98 0.98 0.98 0.99 0.99 0.99
2001 0.94 0.96 0.97 0.98 0.98 0.93 0.97 0.97 0.97 0.99 0.99 0.99
2000 0.93 0.97 0.97 0.98 0.98 0.93 0.97 0.97 0.97 0.99 0.98 0.99
1999 0.92 0.97 0.97 0.97 0.97 0.94 0.97 0.97 0.97 0.99 0.99 0.99
1998 0.92 0.97 0.97 0.97 0.97 0.94 0.98 0.98 0.98 0.99 0.99 0.99
1997 0.90 0.97 0.97 0.96 0.97 0.94 0.98 0.98 0.98 0.99 0.99 0.99
1996 0.90 0.97 0.98 0.97 0.98 0.94 0.98 0.98 0.98 0.99 0.99 0.99
1995 0.89 0.97 0.97 0.97 0.97 0.95 0.98 0.98 0.98 0.99 0.99 0.99
1994 0.90 0.97 0.97 0.98 0.97 0.95 0.98 0.98 0.98 0.99 0.98 0.99
1993 0.89 0.97 0.97 0.98 0.98 0.95 0.98 0.98 0.98 0.99 0.98 0.99
1992 0.90 0.97 0.96 0.98 0.98 0.96 0.98 0.98 0.98 0.99 0.99 0.99
1991 0.90 0.96 0.97 0.97 1.00 1.00 0.95 0.98 0.98 0.98 0.99 0.97 0.99
1990 0.87 0.98 0.98 0.98 0.96 0.98 0.94 0.98 0.98 0.98 0.99 0.99 0.99
1989 0.96 0.95 0.97 0.99 1.00 1.00 0.94 0.98 0.98 0.98 0.99 0.99 0.99
1988 0.89 0.96 0.98 0.97 0.97 0.98 0.98 0.97 0.98 0.99 0.99 0.98 0.99
1987 0.92 0.94 0.94 0.97 0.97 0.97 0.90 0.96 0.96 0.96 0.98 0.98 0.98
Source: Massachusetts Highway Department / Mass DOT *2011 is most recent year that factors have been supplied by MassDOT
Page 12 2014 Traffic Counting Report
5. MassDOT Data and Seasonal Adjustment Factors
Observed traffic volumes at a given location can often vary from month to month. This is especially true on Cape Cod, where summer traffic volumes are higher due to seasonal tourism. In order to compare traffic volume data collected in different months, seasonal adjustment factors must be applied.
5.1. PERMANENT TRAFFIC COUNTING STATIONS
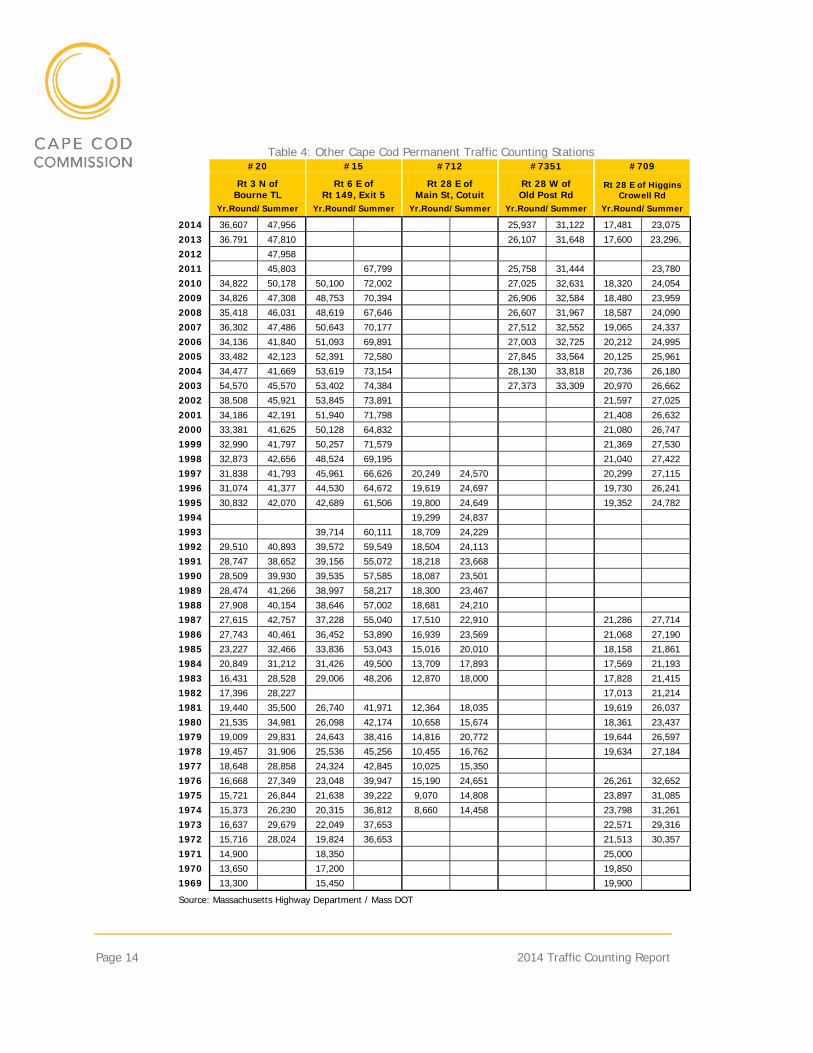
MassDOT currently collects year-round traffic volumes from the following permanent traffic counting stations:
Route 3 north of the Bourne/Plymouth town line Route 6 east of Route 149 (Exit 5) Route 6 at the Sagamore Bridge Route 28 at the Bourne Bridge Route 28 in Yarmouth, east of Higgins Crowell Road Route 28 in Barnstable, west of Old Post Road (Cotuit)
Also included in this report is a count station that discontinued in 1997:
Route 28 in Barnstable, east of Main St (Cotuit)
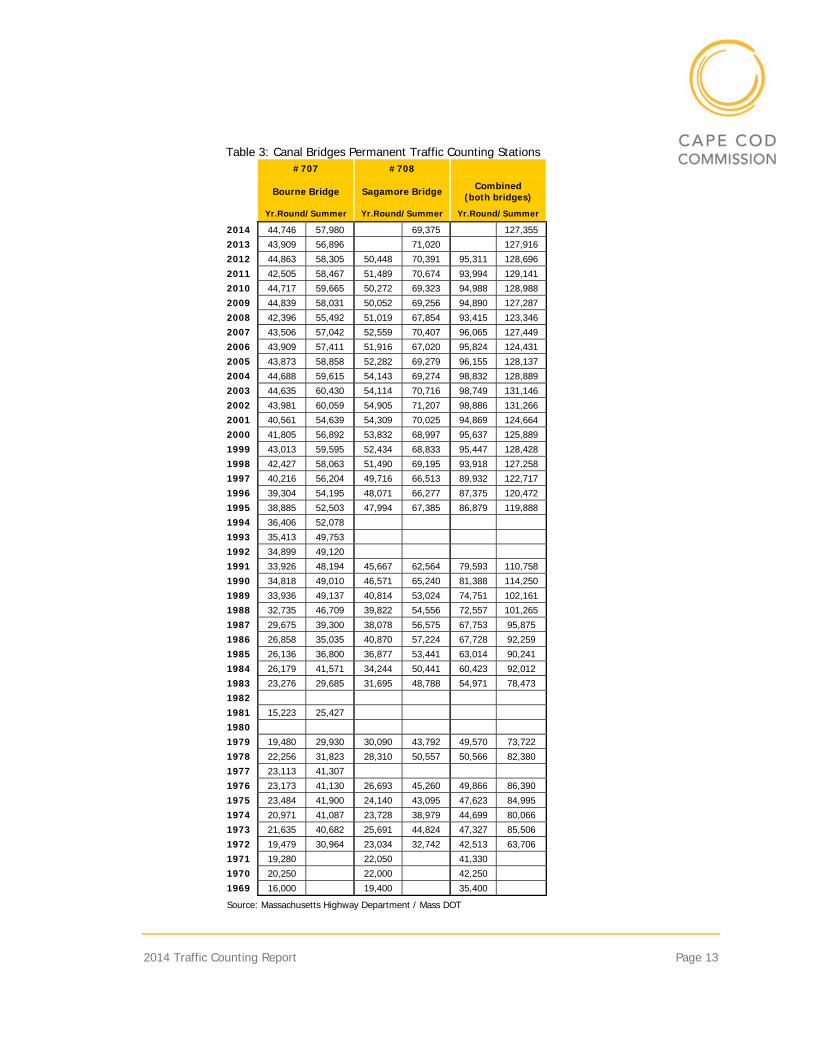
Table 3, found on the following page, presents the Annual Average Daily Traffic (AADT) and summer Average Daily Traffic (ADT) for the Bourne and Sagamore Bridges. The table 4 presents the AADT and summer ADT for the other permanent traffic counting stations. The summer ADT for a particular year represents the July ADT of that year. If no traffic volumes for July were available, then the August ADT was used instead. Please note that data are not available for all years.
2014 Traffic Counting Report Page 13
Table 3: Canal Bridges Permanent Traffic Counting Stations #707 #708
Bourne Bridge Sagamore Bridge Combined (both bridges)
Yr.Round/Summer Yr.Round/Summer Yr.Round/Summer
2014 44,746 57,980 69,375 127,355
2013 43,909 56,896 71,020 127,916
2012 44,863 58,305 50,448 70,391 95,311 128,696
2011 42,505 58,467 51,489 70,674 93,994 129,141
2010 44,717 59,665 50,272 69,323 94,988 128,988
2009 44,839 58,031 50,052 69,256 94,890 127,287
2008 42,396 55,492 51,019 67,854 93,415 123,346
2007 43,506 57,042 52,559 70,407 96,065 127,449
2006 43,909 57,411 51,916 67,020 95,824 124,431
2005 43,873 58,858 52,282 69,279 96,155 128,137
2004 44,688 59,615 54,143 69,274 98,832 128,889
2003 44,635 60,430 54,114 70,716 98,749 131,146
2002 43,981 60,059 54,905 71,207 98,886 131,266
2001 40,561 54,639 54,309 70,025 94,869 124,664
2000 41,805 56,892 53,832 68,997 95,637 125,889
1999 43,013 59,595 52,434 68,833 95,447 128,428
1998 42,427 58,063 51,490 69,195 93,918 127,258
1997 40,216 56,204 49,716 66,513 89,932 122,717
1996 39,304 54,195 48,071 66,277 87,375 120,472
1995 38,885 52,503 47,994 67,385 86,879 119,888
1994 36,406 52,078
1993 35,413 49,753
1992 34,899 49,120
1991 33,926 48,194 45,667 62,564 79,593 110,758
1990 34,818 49,010 46,571 65,240 81,388 114,250
1989 33,936 49,137 40,814 53,024 74,751 102,161
1988 32,735 46,709 39,822 54,556 72,557 101,265
1987 29,675 39,300 38,078 56,575 67,753 95,875
1986 26,858 35,035 40,870 57,224 67,728 92,259
1985 26,136 36,800 36,877 53,441 63,014 90,241
1984 26,179 41,571 34,244 50,441 60,423 92,012
1983 23,276 29,685 31,695 48,788 54,971 78,473
1982
1981 15,223 25,427
1980
1979 19,480 29,930 30,090 43,792 49,570 73,722
1978 22,256 31,823 28,310 50,557 50,566 82,380
1977 23,113 41,307
1976 23,173 41,130 26,693 45,260 49,866 86,390
1975 23,484 41,900 24,140 43,095 47,623 84,995
1974 20,971 41,087 23,728 38,979 44,699 80,066
1973 21,635 40,682 25,691 44,824 47,327 85,506
1972 19,479 30,964 23,034 32,742 42,513 63,706
1971 19,280 22,050 41,330
1970 20,250 22,000 42,250
1969 16,000 19,400 35,400
Source: Massachusetts Highway Department / Mass DOT
Page 14 2014 Traffic Counting Report
Table 4: Other Cape Cod Permanent Traffic Counting Stations #20 #15 #712 #7351 #709
Rt 3 N of
Bourne TL Rt 6 E of
Rt 149, Exit 5 Rt 28 E of
Main St, Cotuit Rt 28 W of Old Post Rd
Rt 28 E of HigginsCrowell Rd
Yr.Round/Summer Yr.Round/Summer Yr.Round/Summer Yr.Round/Summer Yr.Round/Summer
2014 36,607 47,956 25,937 31,122 17,481 23,075
2013 36.791 47,810 26,107 31,648 17,600 23,296,
2012 47,958
2011 45,803 67,799 25,758 31,444 23,780
2010 34,822 50,178 50,100 72,002 27,025 32,631 18,320 24,054
2009 34,826 47,308 48,753 70,394 26,906 32,584 18,480 23,959
2008 35,418 46,031 48,619 67,646 26,607 31,967 18,587 24,090
2007 36,302 47,486 50,643 70,177 27,512 32,552 19,065 24,337
2006 34,136 41,840 51,093 69,891 27,003 32,725 20,212 24,995
2005 33,482 42,123 52,391 72,580 27,845 33,564 20,125 25,961
2004 34,477 41,669 53,619 73,154 28,130 33,818 20,736 26,180
2003 54,570 45,570 53,402 74,384 27,373 33,309 20,970 26,662
2002 38,508 45,921 53,845 73,891 21,597 27,025
2001 34,186 42,191 51,940 71,798 21,408 26,632
2000 33,381 41,625 50,128 64,832 21,080 26,747
1999 32,990 41,797 50,257 71,579 21,369 27,530
1998 32,873 42,656 48,524 69,195 21,040 27,422
1997 31,838 41,793 45,961 66,626 20,249 24,570 20,299 27,115
1996 31,074 41,377 44,530 64,672 19,619 24,697 19,730 26,241
1995 30,832 42,070 42,689 61,506 19,800 24,649 19,352 24,782
1994 19,299 24,837
1993 39,714 60,111 18,709 24,229
1992 29,510 40,893 39,572 59,549 18,504 24,113
1991 28,747 38,652 39,156 55,072 18,218 23,668
1990 28,509 39,930 39,535 57,585 18,087 23,501
1989 28,474 41,266 38,997 58,217 18,300 23,467
1988 27,908 40,154 38,646 57,002 18,681 24,210
1987 27,615 42,757 37,228 55,040 17,510 22,910 21,286 27,714
1986 27,743 40,461 36,452 53,890 16,939 23,569 21,068 27,190
1985 23,227 32,466 33,836 53,043 15,016 20,010 18,158 21,861
1984 20,849 31,212 31,426 49,500 13,709 17,893 17,569 21,193
1983 16,431 28,528 29,006 48,206 12,870 18,000 17,828 21,415
1982 17,396 28,227 17,013 21,214
1981 19,440 35,500 26,740 41,971 12,364 18,035 19,619 26,037
1980 21,535 34,981 26,098 42,174 10,658 15,674 18,361 23,437
1979 19,009 29,831 24,643 38,416 14,816 20,772 19,644 26,597
1978 19,457 31,906 25,536 45,256 10,455 16,762 19,634 27,184
1977 18,648 28,858 24,324 42,845 10,025 15,350
1976 16,668 27,349 23,048 39,947 15,190 24,651 26,261 32,652
1975 15,721 26,844 21,638 39,222 9,070 14,808 23,897 31,085
1974 15,373 26,230 20,315 36,812 8,660 14,458 23,798 31,261
1973 16,637 29,679 22,049 37,653 22,571 29,316
1972 15,716 28,024 19,824 36,653 21,513 30,357
1971 14,900 18,350 25,000
1970 13,650 17,200 19,850
1969 13,300 15,450 19,900
Source: Massachusetts Highway Department / Mass DOT
2014 Traffic Counting Report Page 15
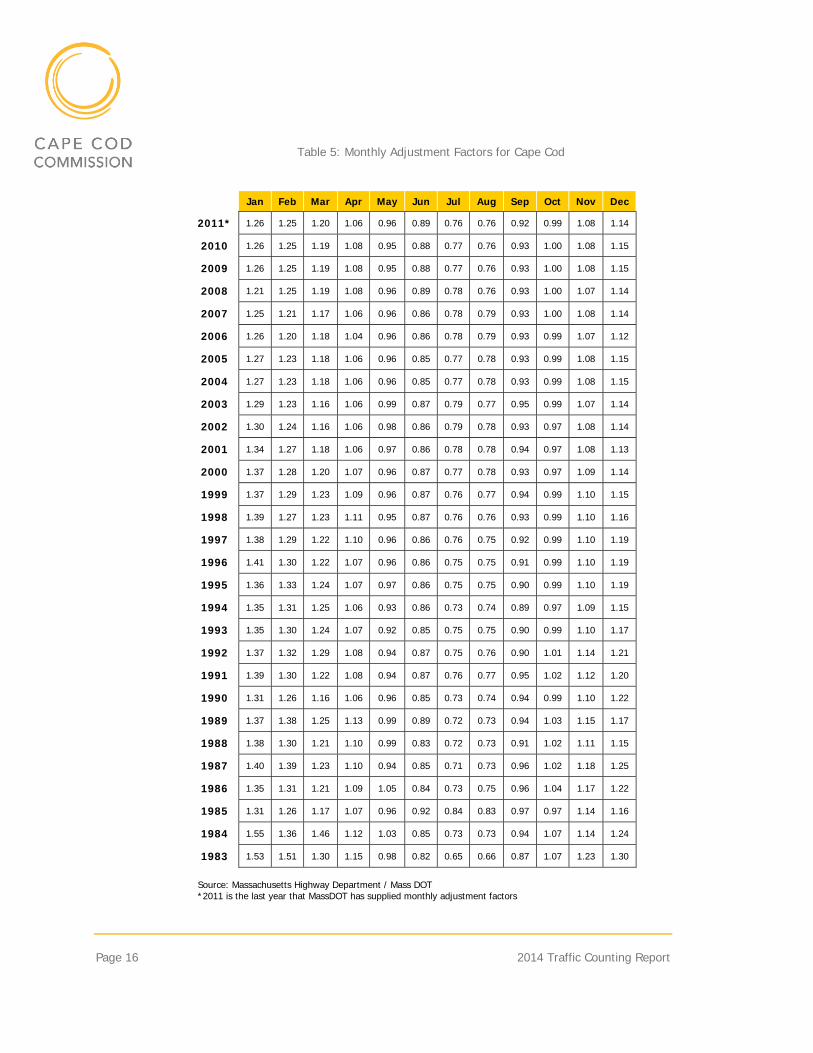
5.2. SEASONAL ADJUSTMENT FACTORS
Using the data collected from the permanent traffic counting stations, MassDOT determines the seasonal adjustment factors for the next year. These factors indicate relative traffic volumes throughout the year. For example, weekday traffic in January is approximately half the weekday traffic in July. By multiplying by the Average Daily Traffic (ADT) of a traffic count by a seasonal adjustment factor, an estimate of annual ADT can be produced for that location. ADT volumes from all months can in this way be converted into annual ADT volumes and properly compared.
The seasonal adjustment factors only produce an estimate of annual ADT for several reasons. First, the adjustment factors for 2012 and subsequent years are based on 2010 data, since MassDOT has not supplied monthly adjustment factors since 2011. Moreover, the permanent stations are located on state highways. Seasonal traffic fluctuations may be different on local roadways and streets. Also, none of the permanent stations are located east of Yarmouth. This is significant because seasonal traffic fluctuations are generally greater in areas with higher seasonal population changes, such as the Outer Cape.
For a complete listing of all seasonal adjustment factors from 1983-2011, please see the table on the following page.
Page 16 2014 Traffic Counting Report
Table 5: Monthly Adjustment Factors for Cape Cod
Jan Feb Mar Apr May Jun Jul Aug Sep Oct Nov Dec
2011* 1.26 1.25 1.20 1.06 0.96 0.89 0.76 0.76 0.92 0.99 1.08 1.14
2010 1.26 1.25 1.19 1.08 0.95 0.88 0.77 0.76 0.93 1.00 1.08 1.15
2009 1.26 1.25 1.19 1.08 0.95 0.88 0.77 0.76 0.93 1.00 1.08 1.15
2008 1.21 1.25 1.19 1.08 0.96 0.89 0.78 0.76 0.93 1.00 1.07 1.14
2007 1.25 1.21 1.17 1.06 0.96 0.86 0.78 0.79 0.93 1.00 1.08 1.14
2006 1.26 1.20 1.18 1.04 0.96 0.86 0.78 0.79 0.93 0.99 1.07 1.12
2005 1.27 1.23 1.18 1.06 0.96 0.85 0.77 0.78 0.93 0.99 1.08 1.15
2004 1.27 1.23 1.18 1.06 0.96 0.85 0.77 0.78 0.93 0.99 1.08 1.15
2003 1.29 1.23 1.16 1.06 0.99 0.87 0.79 0.77 0.95 0.99 1.07 1.14
2002 1.30 1.24 1.16 1.06 0.98 0.86 0.79 0.78 0.93 0.97 1.08 1.14
2001 1.34 1.27 1.18 1.06 0.97 0.86 0.78 0.78 0.94 0.97 1.08 1.13
2000 1.37 1.28 1.20 1.07 0.96 0.87 0.77 0.78 0.93 0.97 1.09 1.14
1999 1.37 1.29 1.23 1.09 0.96 0.87 0.76 0.77 0.94 0.99 1.10 1.15
1998 1.39 1.27 1.23 1.11 0.95 0.87 0.76 0.76 0.93 0.99 1.10 1.16
1997 1.38 1.29 1.22 1.10 0.96 0.86 0.76 0.75 0.92 0.99 1.10 1.19
1996 1.41 1.30 1.22 1.07 0.96 0.86 0.75 0.75 0.91 0.99 1.10 1.19
1995 1.36 1.33 1.24 1.07 0.97 0.86 0.75 0.75 0.90 0.99 1.10 1.19
1994 1.35 1.31 1.25 1.06 0.93 0.86 0.73 0.74 0.89 0.97 1.09 1.15
1993 1.35 1.30 1.24 1.07 0.92 0.85 0.75 0.75 0.90 0.99 1.10 1.17
1992 1.37 1.32 1.29 1.08 0.94 0.87 0.75 0.76 0.90 1.01 1.14 1.21
1991 1.39 1.30 1.22 1.08 0.94 0.87 0.76 0.77 0.95 1.02 1.12 1.20
1990 1.31 1.26 1.16 1.06 0.96 0.85 0.73 0.74 0.94 0.99 1.10 1.22
1989 1.37 1.38 1.25 1.13 0.99 0.89 0.72 0.73 0.94 1.03 1.15 1.17
1988 1.38 1.30 1.21 1.10 0.99 0.83 0.72 0.73 0.91 1.02 1.11 1.15
1987 1.40 1.39 1.23 1.10 0.94 0.85 0.71 0.73 0.96 1.02 1.18 1.25
1986 1.35 1.31 1.21 1.09 1.05 0.84 0.73 0.75 0.96 1.04 1.17 1.22
1985 1.31 1.26 1.17 1.07 0.96 0.92 0.84 0.83 0.97 0.97 1.14 1.16
1984 1.55 1.36 1.46 1.12 1.03 0.85 0.73 0.73 0.94 1.07 1.14 1.24
1983 1.53 1.51 1.30 1.15 0.98 0.82 0.65 0.66 0.87 1.07 1.23 1.30
Source: Massachusetts Highway Department / Mass DOT *2011 is the last year that MassDOT has supplied monthly adjustment factors
2014 Traffic Counting Report Page 17
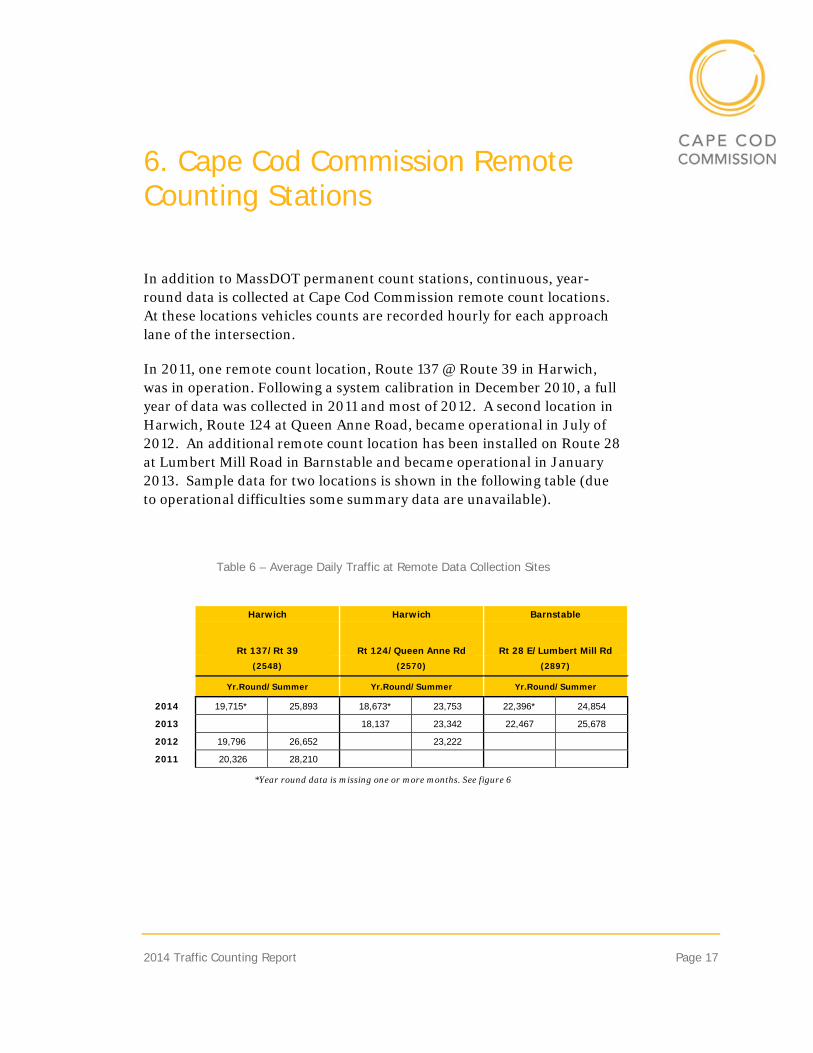
6. Cape Cod Commission Remote Counting Stations
In addition to MassDOT permanent count stations, continuous, year-round data is collected at Cape Cod Commission remote count locations. At these locations vehicles counts are recorded hourly for each approach lane of the intersection.
In 2011, one remote count location, Route 137 @ Route 39 in Harwich, was in operation. Following a system calibration in December 2010, a full year of data was collected in 2011 and most of 2012. A second location in Harwich, Route 124 at Queen Anne Road, became operational in July of 2012. An additional remote count location has been installed on Route 28 at Lumbert Mill Road in Barnstable and became operational in January 2013. Sample data for two locations is shown in the following table (due to operational difficulties some summary data are unavailable).
Table 6 – Average Daily Traffic at Remote Data Collection Sites
Harwich Harwich Barnstable
Rt 137/Rt 39 Rt 124/Queen Anne Rd Rt 28 E/Lumbert Mill Rd
(2548) (2570) (2897)
Yr.Round/Summer Yr.Round/Summer Yr.Round/Summer
2014 19,715* 25,893 18,673* 23,753 22,396* 24,854
2013 18,137 23,342 22,467 25,678
2012 19,796 26,652 23,222
2011 20,326 28,210
*Year round data is missing one or more months. See figure 6

Page 18 2014 Traffic Counting Report
7. Results and Analysis
After seeing sustained growth for the second half of 20th century, traffic patterns on Cape Cod have been less consistent early in the 21st century. Over the last ten years (2004-2014), there has been an overall 3.20% decrease in Cape-wide traffic.
7.1. PERMANENT COUNTING STATIONS AND BRIDGE CROSSINGS
Permanent Counting Stations can be used to show a trend in road usage over time. As can be seen in the following table, traffic volumes on Route 6 and Route 28 have decreased over the last ten years. Route 3 north of the Bourne/Plymouth town line has seen over 16.0% growth since 2004. When considered together, both bridges have remained fairly level since 2004 (traffic increasing on the Sagamore Bridge with a greater decline on the Bourne Bridge). The stations at the Sagamore Bridge, Route 28 East of Higgins Crowell Road and Route 28 West of Post Road showed negative growth rates between 2013 and 2014. Due to equipment problems, not all stations were available for analysis.
Table 7: Growth Rates - Permanent Counting Stations and Bridge Crossings
Permanent Traffic Counting Station
10 Year Total
Growth
10 Year Average Annual Growth
Rate
One Year Growth Rate 2013-2014
#15: Rt 6 E of Rt 149 (Ex. 5) -6.76% -0.70% n/a #20: Rt 3 N of Bourne TL 16.0% 1.49% 0.30% #707: Bourne Bridge -0.97 -0.10% 1.90% #708: Sagamore Bridge 1.8% 0.17% -2.32% #709: Rt 28 E of Higgins Crowell -11.2% -1.19 -0.95 #7351: Rt 28 W of Old Post Rd -7.03% -0.73% -1.67
2014 Traffic Counting Report Page 19
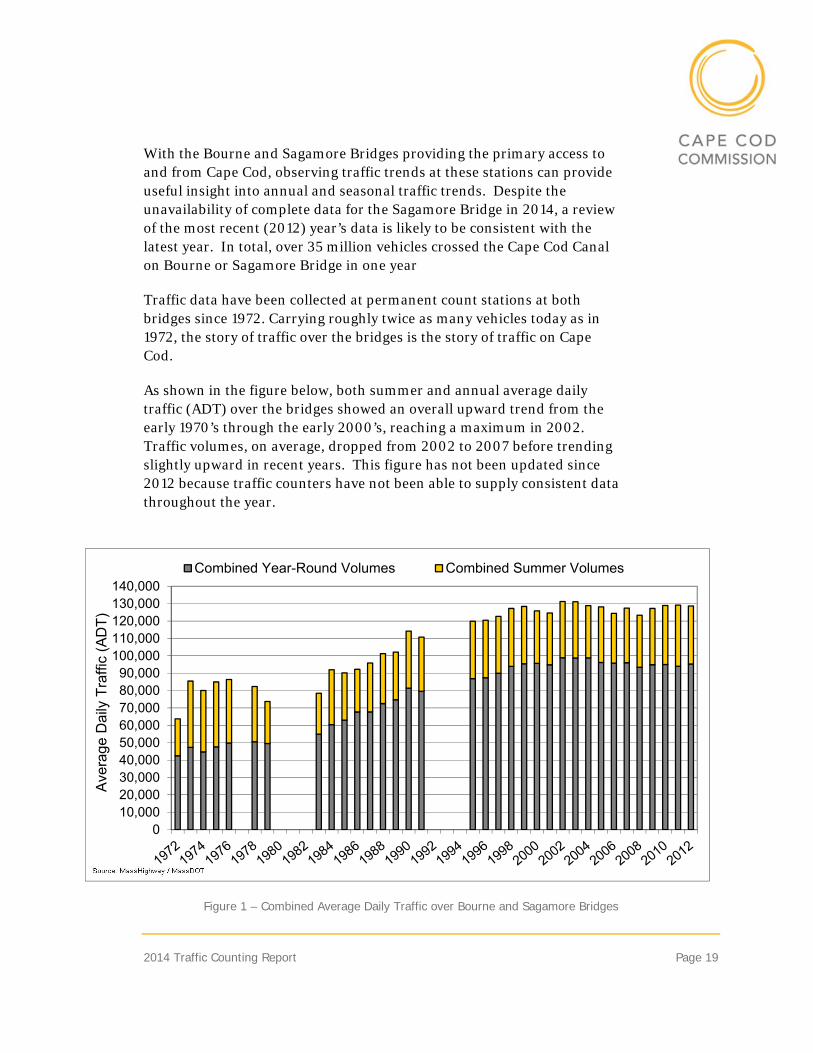
With the Bourne and Sagamore Bridges providing the primary access to and from Cape Cod, observing traffic trends at these stations can provide useful insight into annual and seasonal traffic trends. Despite the unavailability of complete data for the Sagamore Bridge in 2014, a review of the most recent (2012) year’s data is likely to be consistent with the latest year. In total, over 35 million vehicles crossed the Cape Cod Canal on Bourne or Sagamore Bridge in one year
Traffic data have been collected at permanent count stations at both bridges since 1972. Carrying roughly twice as many vehicles today as in 1972, the story of traffic over the bridges is the story of traffic on Cape Cod.
As shown in the figure below, both summer and annual average daily traffic (ADT) over the bridges showed an overall upward trend from the early 1970’s through the early 2000’s, reaching a maximum in 2002. Traffic volumes, on average, dropped from 2002 to 2007 before trending slightly upward in recent years. This figure has not been updated since 2012 because traffic counters have not been able to supply consistent data throughout the year.
Figure 1 – Combined Average Daily Traffic over Bourne and Sagamore Bridges
010,00020,00030,00040,00050,00060,00070,00080,00090,000
100,000110,000120,000130,000140,000
Ave
rage
Dai
ly T
raffi
c (A
DT
)
Combined Year-Round Volumes Combined Summer Volumes
Page 20 2014 Traffic Counting Report
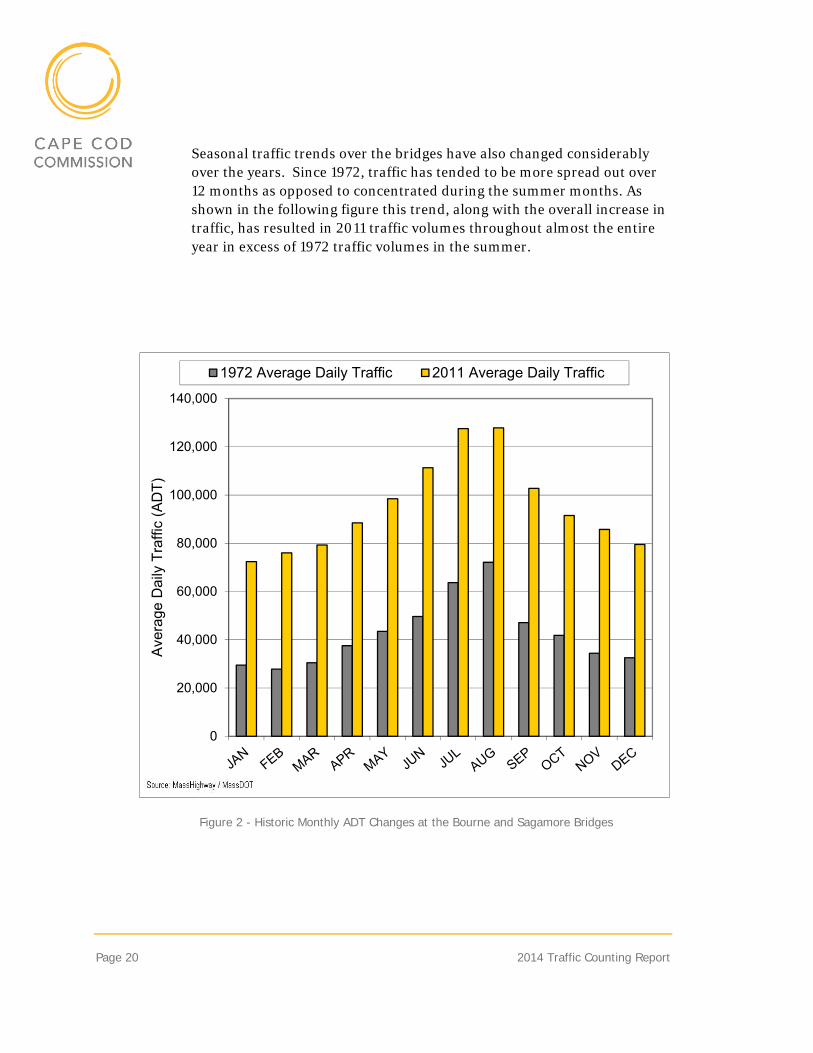
Seasonal traffic trends over the bridges have also changed considerably over the years. Since 1972, traffic has tended to be more spread out over 12 months as opposed to concentrated during the summer months. As shown in the following figure this trend, along with the overall increase in traffic, has resulted in 2011 traffic volumes throughout almost the entire year in excess of 1972 traffic volumes in the summer.
Figure 2 - Historic Monthly ADT Changes at the Bourne and Sagamore Bridges
0
20,000
40,000
60,000
80,000
100,000
120,000
140,000
Ave
rage
Dai
ly T
raffi
c (A
DT
)
1972 Average Daily Traffic 2011 Average Daily Traffic
2014 Traffic Counting Report Page 21
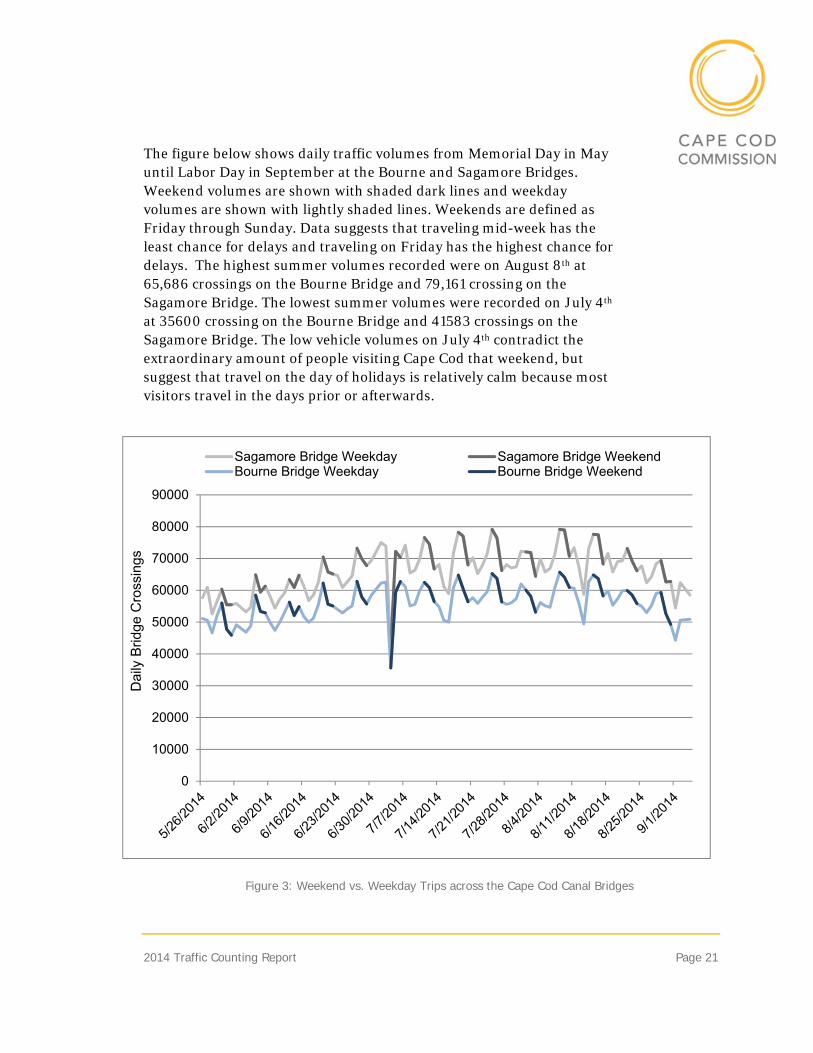
The figure below shows daily traffic volumes from Memorial Day in May until Labor Day in September at the Bourne and Sagamore Bridges. Weekend volumes are shown with shaded dark lines and weekday volumes are shown with lightly shaded lines. Weekends are defined as Friday through Sunday. Data suggests that traveling mid-week has the least chance for delays and traveling on Friday has the highest chance for delays. The highest summer volumes recorded were on August 8th at 65,686 crossings on the Bourne Bridge and 79,161 crossing on the Sagamore Bridge. The lowest summer volumes were recorded on July 4th at 35600 crossing on the Bourne Bridge and 41583 crossings on the Sagamore Bridge. The low vehicle volumes on July 4th contradict the extraordinary amount of people visiting Cape Cod that weekend, but suggest that travel on the day of holidays is relatively calm because most visitors travel in the days prior or afterwards.
0
10000
20000
30000
40000
50000
60000
70000
80000
90000
Dai
ly B
ridge
Cro
ssin
gs
Sagamore Bridge Weekday Sagamore Bridge WeekendBourne Bridge Weekday Bourne Bridge Weekend
Figure 3: Weekend vs. Weekday Trips across the Cape Cod Canal Bridges
Page 22 2014 Traffic Counting Report
0
5000
10000
15000
20000
25000
30000
35000
40000
Jan Feb Mar Apr May Jun Jul Aug Sep Oct Nov Dec
Mon
thly
Dire
ctio
nal A
vera
ge D
aily
Tra
ffic
Bourne Bridge Southbound Bourne Bridge Northbound
Sagamore Bridge Southbound Sagamore Bridge Northbound
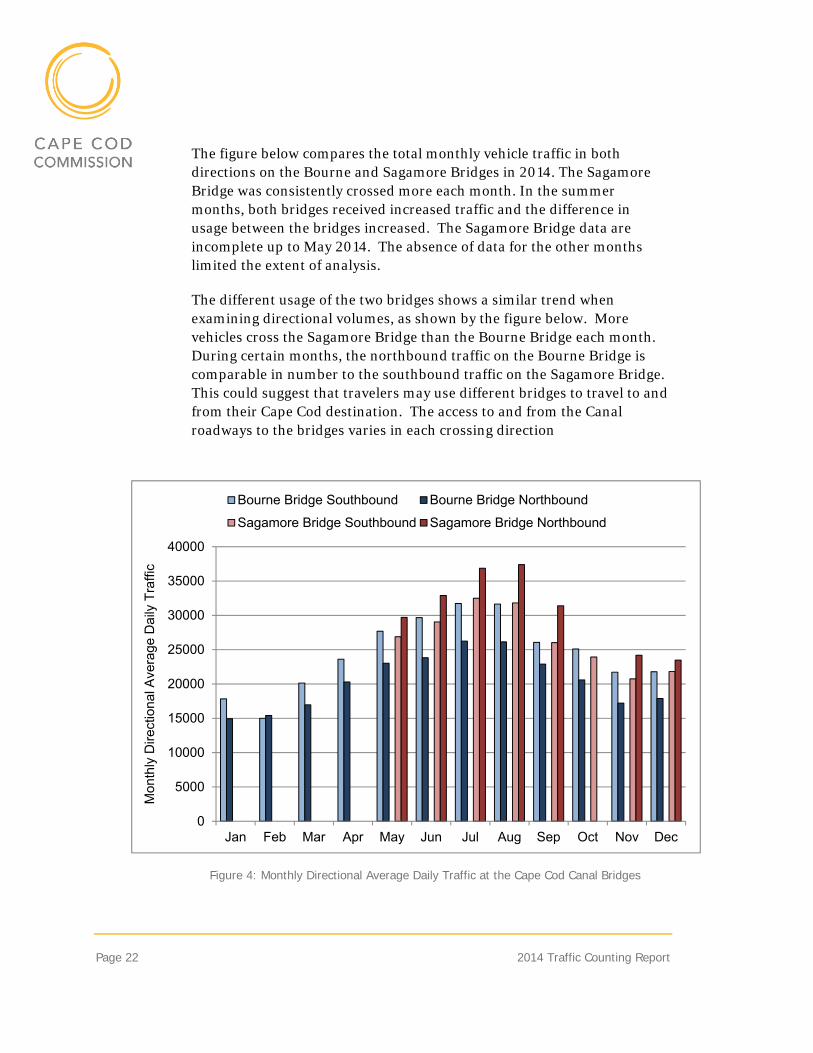
The figure below compares the total monthly vehicle traffic in both directions on the Bourne and Sagamore Bridges in 2014. The Sagamore Bridge was consistently crossed more each month. In the summer months, both bridges received increased traffic and the difference in usage between the bridges increased. The Sagamore Bridge data are incomplete up to May 2014. The absence of data for the other months limited the extent of analysis.
The different usage of the two bridges shows a similar trend when examining directional volumes, as shown by the figure below. More vehicles cross the Sagamore Bridge than the Bourne Bridge each month. During certain months, the northbound traffic on the Bourne Bridge is comparable in number to the southbound traffic on the Sagamore Bridge. This could suggest that travelers may use different bridges to travel to and from their Cape Cod destination. The access to and from the Canal roadways to the bridges varies in each crossing direction
Figure 4: Monthly Directional Average Daily Traffic at the Cape Cod Canal Bridges
2014 Traffic Counting Report Page 23
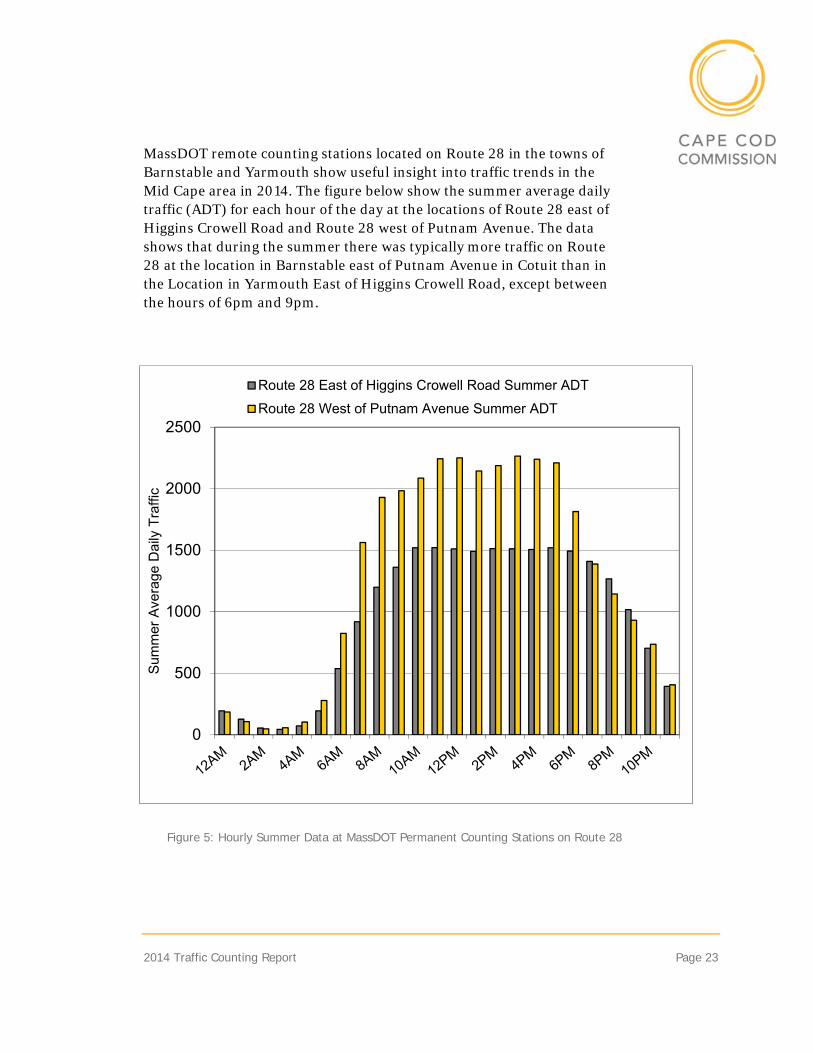
MassDOT remote counting stations located on Route 28 in the towns of Barnstable and Yarmouth show useful insight into traffic trends in the Mid Cape area in 2014. The figure below show the summer average daily traffic (ADT) for each hour of the day at the locations of Route 28 east of Higgins Crowell Road and Route 28 west of Putnam Avenue. The data shows that during the summer there was typically more traffic on Route 28 at the location in Barnstable east of Putnam Avenue in Cotuit than in the Location in Yarmouth East of Higgins Crowell Road, except between the hours of 6pm and 9pm.
Figure 5: Hourly Summer Data at MassDOT Permanent Counting Stations on Route 28
0
500
1000
1500
2000
2500
Sum
mer
Ave
rage
Dai
ly T
raffi
c
Route 28 East of Higgins Crowell Road Summer ADT
Route 28 West of Putnam Avenue Summer ADT
Page 24 2014 Traffic Counting Report
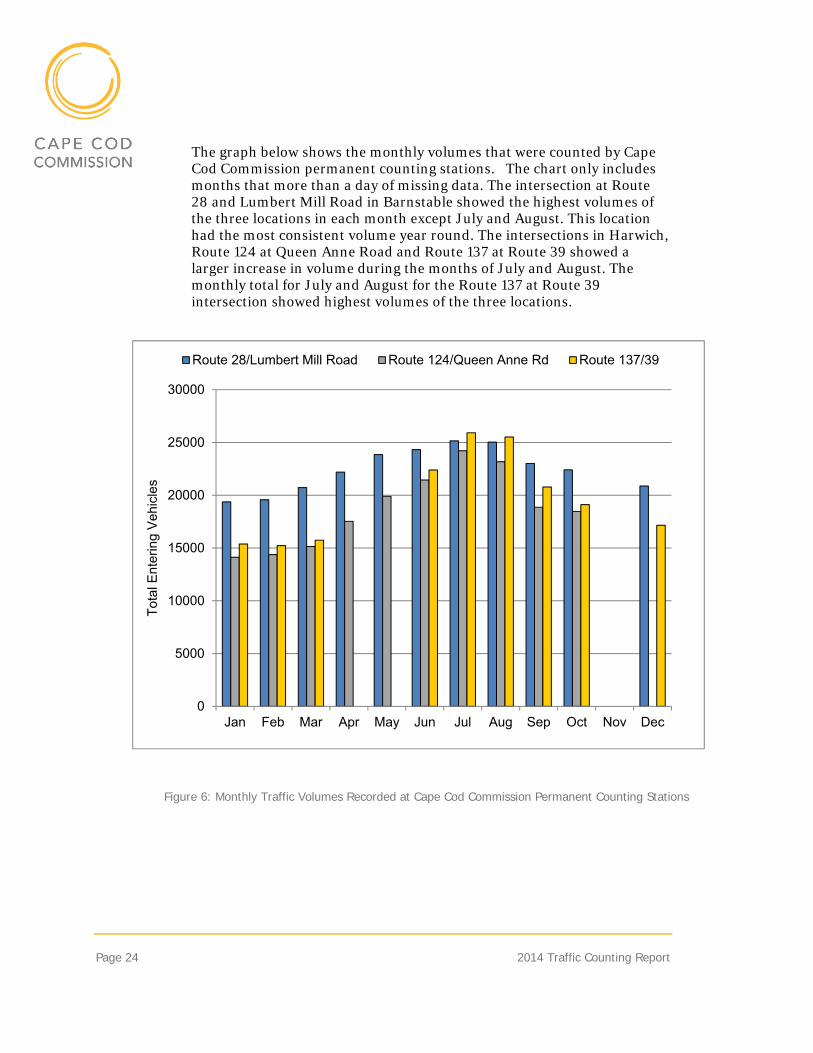
The graph below shows the monthly volumes that were counted by Cape Cod Commission permanent counting stations. The chart only includes months that more than a day of missing data. The intersection at Route 28 and Lumbert Mill Road in Barnstable showed the highest volumes of the three locations in each month except July and August. This location had the most consistent volume year round. The intersections in Harwich, Route 124 at Queen Anne Road and Route 137 at Route 39 showed a larger increase in volume during the months of July and August. The monthly total for July and August for the Route 137 at Route 39 intersection showed highest volumes of the three locations.
0
5000
10000
15000
20000
25000
30000
Jan Feb Mar Apr May Jun Jul Aug Sep Oct Nov Dec
Tot
al E
nter
ing
Veh
icle
s
Route 28/Lumbert Mill Road Route 124/Queen Anne Rd Route 137/39
Figure 6: Monthly Traffic Volumes Recorded at Cape Cod Commission Permanent Counting Stations
2014 Traffic Counting Report Page 25
-15
-10
-5
0
5
10
15
20
1984
-199
4
1985
-199
5
1986
-199
6
1987
-199
7
1988
-199
8
1989
-199
9
1990
-200
0
1991
-200
1
1992
-200
2
1993
-200
3
1994
-200
4
1995
-200
5
1996
-200
6
1997
-200
7
1998
-200
8
1999
-200
9
2000
-201
0
2001
-201
1
2002
-201
2
2003
-201
3
2004
-201
4
Per
cent
Cha
nge
7.2. CAPE-WIDE TRAFFIC
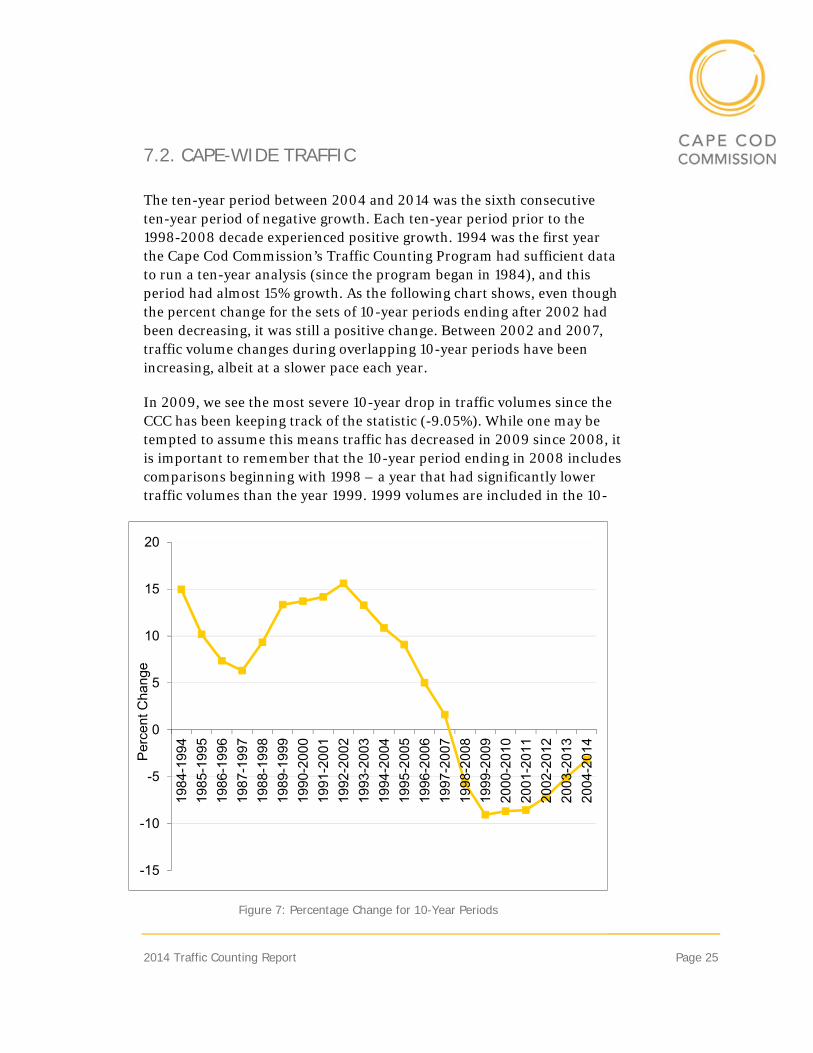
The ten-year period between 2004 and 2014 was the sixth consecutive ten-year period of negative growth. Each ten-year period prior to the 1998-2008 decade experienced positive growth. 1994 was the first year the Cape Cod Commission’s Traffic Counting Program had sufficient data to run a ten-year analysis (since the program began in 1984), and this period had almost 15% growth. As the following chart shows, even though the percent change for the sets of 10-year periods ending after 2002 had been decreasing, it was still a positive change. Between 2002 and 2007, traffic volume changes during overlapping 10-year periods have been increasing, albeit at a slower pace each year.
In 2009, we see the most severe 10-year drop in traffic volumes since the CCC has been keeping track of the statistic (-9.05%). While one may be tempted to assume this means traffic has decreased in 2009 since 2008, it is important to remember that the 10-year period ending in 2008 includes comparisons beginning with 1998 – a year that had significantly lower traffic volumes than the year 1999. 1999 volumes are included in the 10-
Figure 7: Percentage Change for 10-Year Periods

Page 26 2014 Traffic Counting Report
year analysis for 1999-2009, and contribute to the 10-year decline for the period. Cape-wide traffic actually increased from 2008 to 2009 by 4.51%.
This same pattern continues in 2014, where the ten-year period from 2004-2014 shows 3.2% decline.
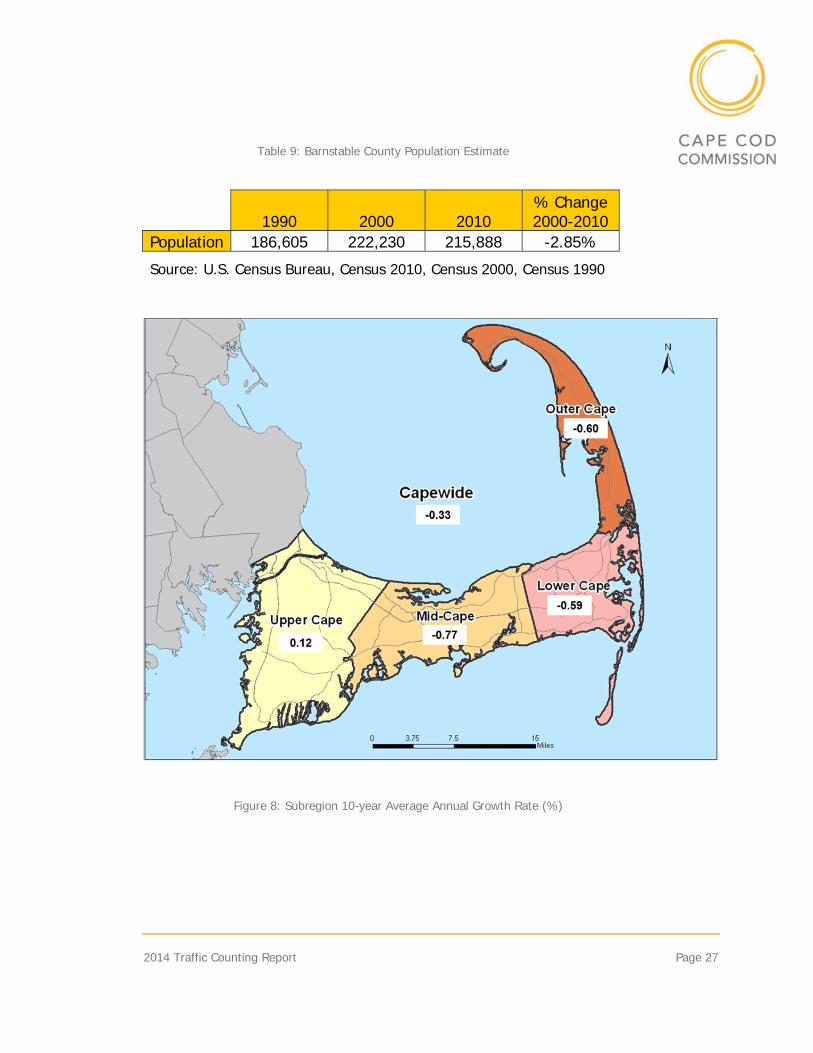
The following table shows the growth rates for various sub-regions and roads of Cape Cod over a 10-year period. The average annual growth rate between 2004 and 2014 is -0.33% for all of Cape Cod. From 2004 to 2014 all regions except for the Upper Cape experienced traffic declines with the greatest declines observed in the Mid-Cape, followed by the Outer- and Lower Cape. The 2013-2014 comparison however suggest that this trend may be reversing with positive traffic growth observed in all regions except for the Lower Cape
Table 8: Cape Cod Summer Traffic Growth by Subregion
Region* Number of
Comparisons**10-Year Total
Growth 10-Year Annual
Average Growth Rate One-Year Growth Rate 2013-2014
Upper Cape 115 1.23% 0.12% 2.56% Mid-Cape 113 -7.37% -0.77% 2.27% Lower Cape 74 -5.66% -0.59% -2.75% Outer Cape 68 -5.77% -0.60% 5.87% All Roads 370 -3.20% -0.33% 2.04%
*Upper = Bourne, Sandwich, Falmouth, Mashpee | Mid = Barnstable, Yarmouth, Dennis Lower = Harwich, Chatham, Brewster, Orleans | Outer = Eastham, Wellfleet, Truro, Provincetown
** Corresponds to ten-year analysis only
In regards to the traffic volume change from 2004 to 2014, it is unclear what is responsible for the notable decrease. The Cape-wide population has shown a moderate decline during a portion this time period (see following table), and conventional trip generators (commercial establishments, residences, etc.) have not been reduced.
2014 Traffic Counting Report Page 27
Table 9: Barnstable County Population Estimate
1990 2000 2010 % Change 2000-2010
Population 186,605 222,230 215,888 -2.85%
Source: U.S. Census Bureau, Census 2010, Census 2000, Census 1990
Figure 8: Subregion 10-year Average Annual Growth Rate (%)
Page 28 2014 Traffic Counting Report
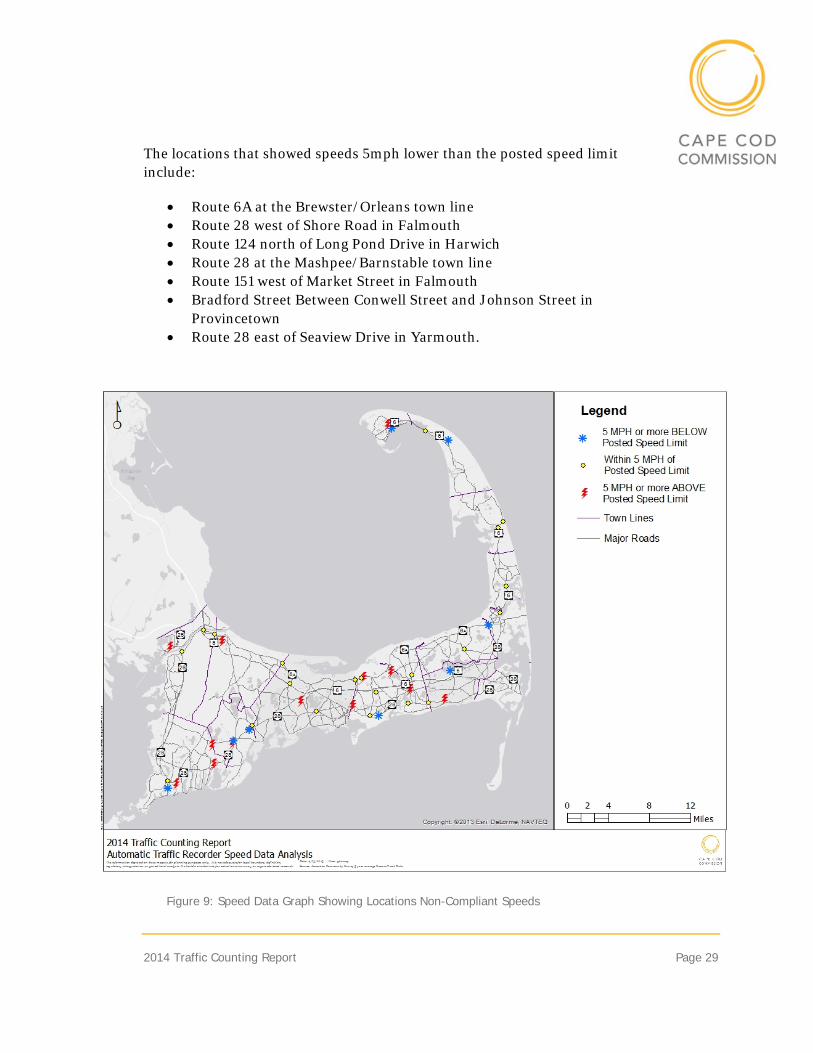
7.3. SPEED DATA
The map on the following page shows data that were collected at various locations by Automatic Traffic Recorders (ATR) from 2012 to 2014. In addition to collecting volume at a point on a road segment, ATRs can be programed to collect the classification and the 85th percentile speed of vehicles. The 85th percentile speed is the industry standard for setting speed limits. This is the speed at which 85 percent of the vehicles are not exceeding. These data were used to show locations that could have issues with speeding, congestion or slow drivers.
A red star on the map shows a location where an ATR measured speeds are 5 MPH or more below the posted speed limit. A yellow circle indicates a location where ATR speeds were measured to be within 5 MPH of the posted speed limit. A green lightning bolt indicates a location where speeds were measured to be 5 MPH or greater than the posted speed limit.
Posted speed limits were obtained from the MassDOT roadway inventory database. Locations were chosen based on available ATR data and posted speed limit data.
The locations that showed speeds 5 MPH or more higher than the posted speed limit include:
Old Stage Road north of Skunknett Road in Barnstable Route 6 Bypass Road west of the Belmont Circle in Bourne Highbank Road west of Main Street in Dennis Spring Bars Road east of Worcester Court Avenue in Falmouth Barrows Road north of Route 28 in Falmouth, Old Barnstable
Road at the Mashpee/Falmouth town line Route 28 East of Sisson Road (Route 39) in Harwich Jobs Fishing Road north of Route 28 in Mashpee Race Point Road north of Route 6 in Provincetown Route 130 West of Pine Street in Sandwich Strawberry Lane south of Route 6A in Yarmouth Setucket Road west of North Dennis Road in Yarmouth Camp Street north of Buck Island Road in Yarmouth.
2014 Traffic Counting Report Page 29
The locations that showed speeds 5mph lower than the posted speed limit include:
Route 6A at the Brewster/Orleans town line Route 28 west of Shore Road in Falmouth Route 124 north of Long Pond Drive in Harwich Route 28 at the Mashpee/Barnstable town line Route 151 west of Market Street in Falmouth Bradford Street Between Conwell Street and Johnson Street in
Provincetown Route 28 east of Seaview Drive in Yarmouth.
Figure 9: Speed Data Graph Showing Locations Non-Compliant Speeds
Page 30 2014 Traffic Counting Report
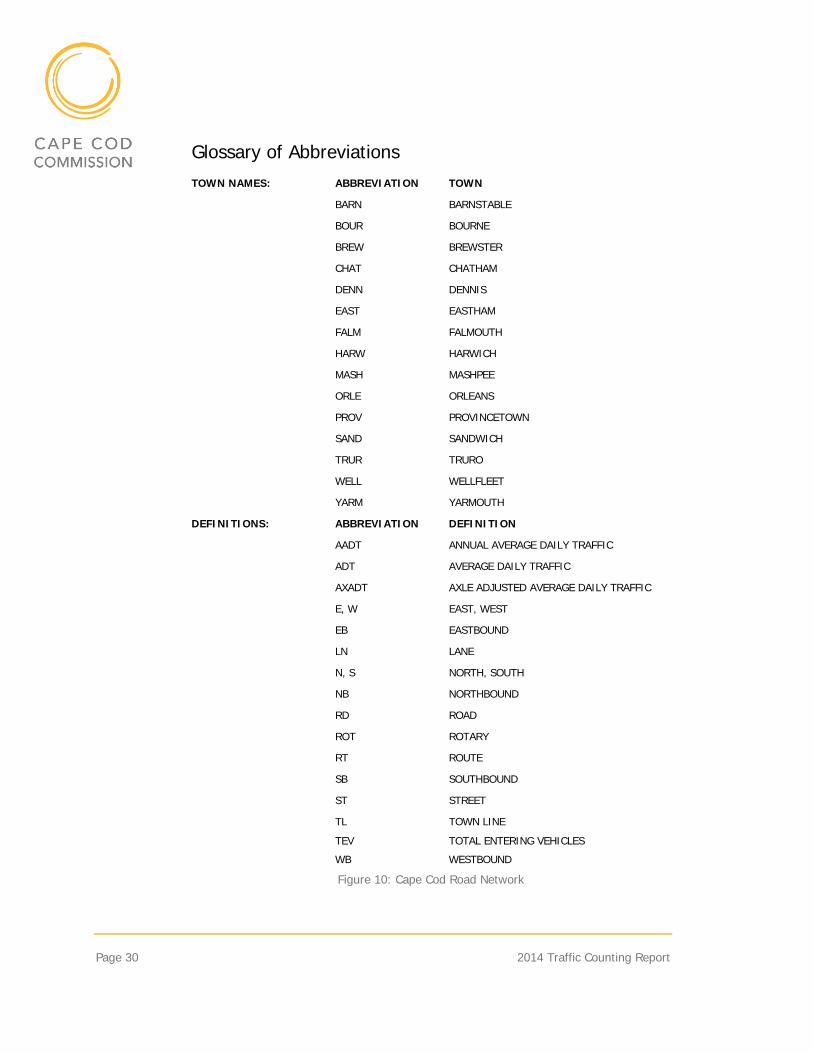
Glossary of Abbreviations TOWN NAMES: ABBREVIATION TOWN
BARN BARNSTABLE
BOUR BOURNE
BREW BREWSTER
CHAT CHATHAM
DENN DENNIS
EAST EASTHAM
FALM FALMOUTH
HARW HARWICH
MASH MASHPEE
ORLE ORLEANS
PROV PROVINCETOWN
SAND SANDWICH
TRUR TRURO
WELL WELLFLEET
YARM YARMOUTH
DEFINITIONS: ABBREVIATION DEFINITION
AADT ANNUAL AVERAGE DAILY TRAFFIC
ADT AVERAGE DAILY TRAFFIC
AXADT AXLE ADJUSTED AVERAGE DAILY TRAFFIC
E, W EAST, WEST
EB EASTBOUND
LN LANE
N, S NORTH, SOUTH
NB NORTHBOUND
RD ROAD
ROT ROTARY
RT ROUTE
SB SOUTHBOUND
ST STREET
TL TOWN LINE
TEV TOTAL ENTERING VEHICLES
WB WESTBOUND
Figure 10: Cape Cod Road Network
2014 Traffic Counting Report Page 31
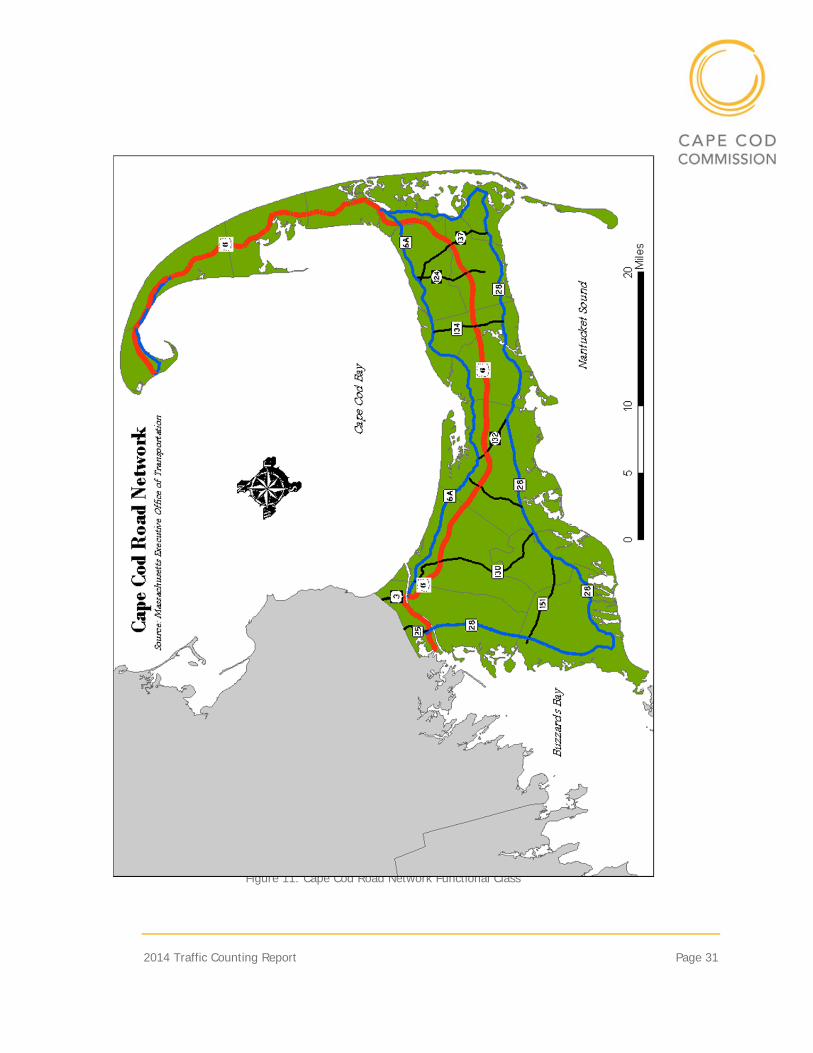
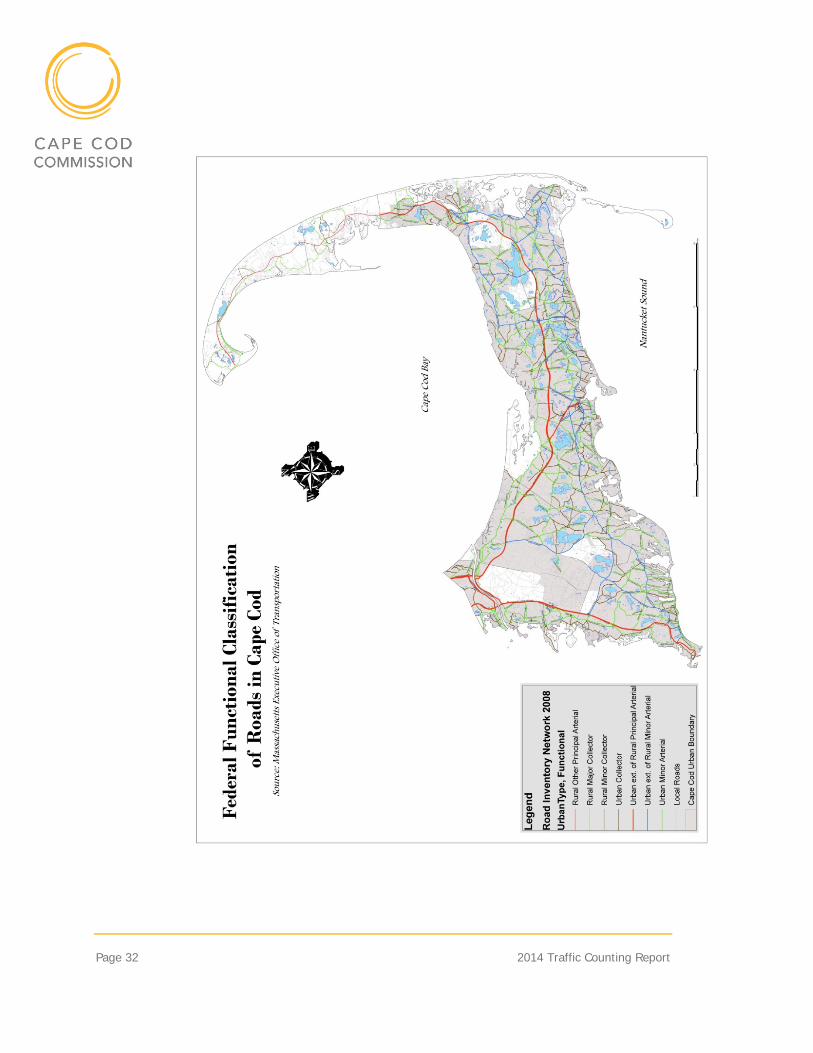
Figure 11: Cape Cod Road Network Functional Class
Page 32 2014 Traffic Counting Report
2014 Traffic Counting Report Page 33
Appendices
The appendices contain traffic count data collected since 2004. Appendix A includes a summary of all ATR counts obtained in 2014. Appendix B makes up the body of the Traffic Counting Report. It includes all Automatic Traffic Recorder counts obtained from 2004 to 2014, arranged geographically by town (starting in the Upper Cape area at Bourne and ending in the Outer Cape area at Provincetown). Appendix C includes a listing of counts taken on weekends arranged by town and then by route name. Appendix D is a collection of turning movement counts performed at Cape Cod intersections from 2004 to 2014. Appendix E summarizes bicycle pedestrian counts. Appendix F is a summary of park and ride lot capacity counts. Appendix G details travel time studies on Cape Cod. Appendix H details data collected at the Cape Cod Commission remote monitoring locations since 2011.

Page 34 2014 Traffic Counting Report