2014 - tla worldwidetlaworldwide.com/wp-content/uploads/2015/09/tla-annual-report-2014.pdf · front...
TRANSCRIPT
2014AnnualReport&FinancialStatements

Front cover: USA Eagles vs New Zealand All Blacks – 1 November 2014
Annual Report and financial statements
year ended 31 December 2014
©TLA Worldwide Plc | www.tlaww-plc.com
2014AnnualReport&FinancialStatements

©TLA Worldwide Plc 2015
Head Office:
New York
25th floor
1500 Broadway
New York
NY 10036
www.tlaww-plc.com
CONTENTS
Financial highlights 4-7
Operational highlights 8-10
Strategic report 12-21
Chairman's statement 12-14
Chief Executive's review 15-16
Chief Financial Officer's review 18-21
Spotlight: All Blacks 22-23
Board of Directors 24-25
Directors' report 26-27
Directors' remuneration report 30-33
Corporate governance report 34-37
Directors' responsibilities statement 38
Independent auditor's report 39-40
Consolidated financial statements 41-45
Principal accounting policies 46
Notes to the consolidated financial statements 52-69
Company balance sheet 70
Notes to the parent company financial statements 71-74
Shareholder information 75
5Annual Report 2014
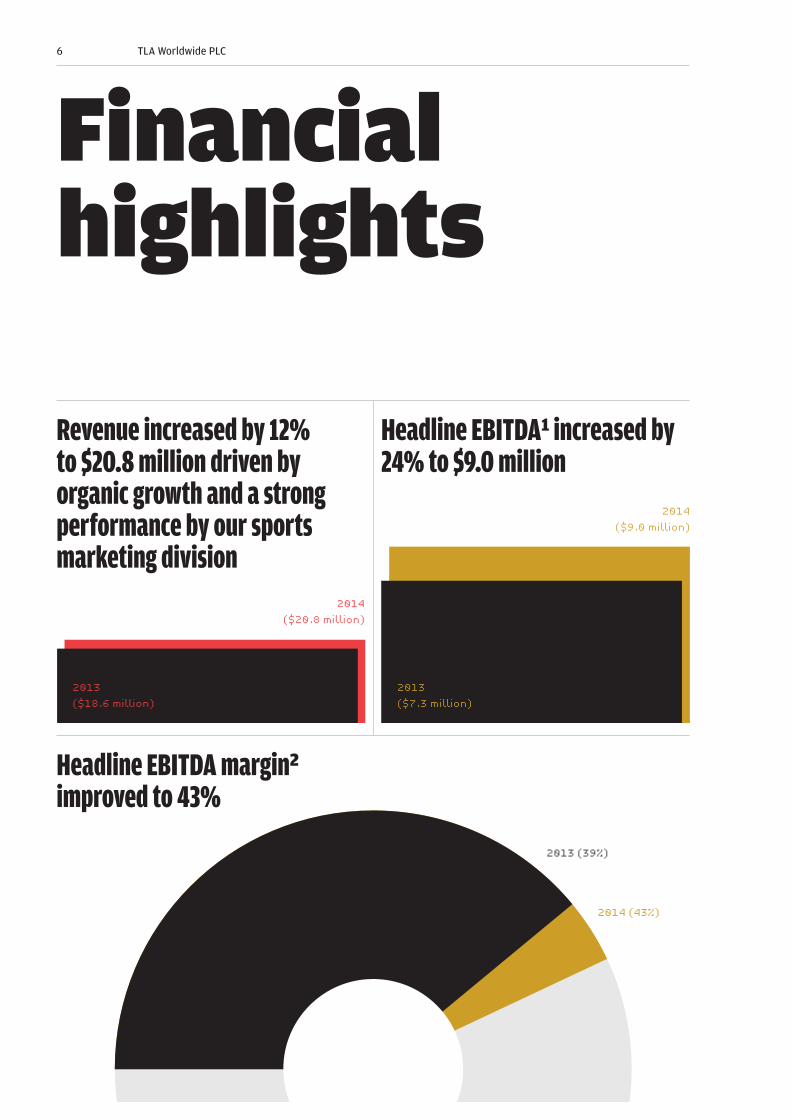
Revenue increased by 12% to $20.8 million driven by organic growth and a strong performance by our sports marketing division
Headline EBITDA1 increased by 24% to $9.0 million
Financial highlights
2014 (43%)
2014
($20.8 million)
2014
($9.0 million)
Headline EBITDA margin2 improved to 43%
2013 (39%)
2013
($7.3 million)
2013
($18.6 million)
6 TLA Worldwide PLC
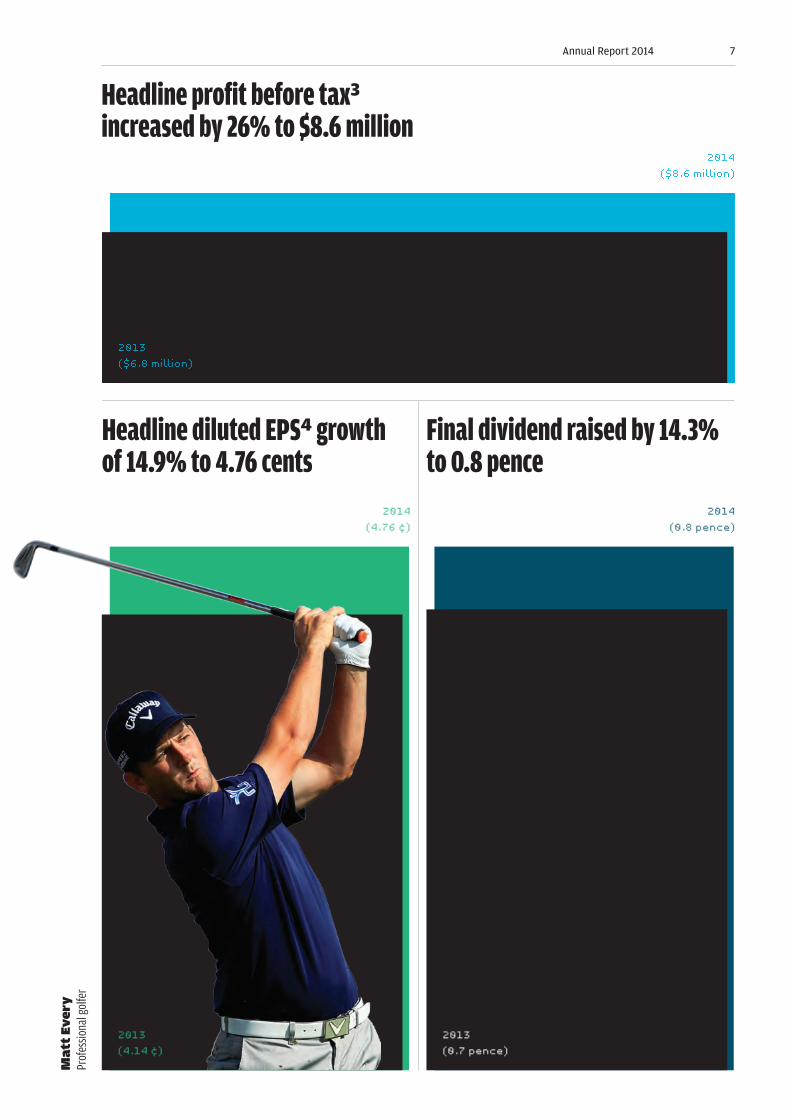
Headline profit before tax3 increased by 26% to $8.6 million
Headline diluted EPS4 growth of 14.9% to 4.76 cents
Final dividend raised by 14.3% to 0.8 pence
2014
($8.6 million)
2014
(4.76 ¢)
2014
(0.8 pence)
2013
($6.8 million)
2013
(4.14 ¢)
2013
(0.7 pence)
Ma
tt E
ve
ryPr
ofes
siona
l gol
fer
7Annual Report 2014

Statutory operating profit of $1.7 million
Statutory profit before tax of $0.4 million
$194 million of off-season contracts negotiated in 2014, a 29% increase
2014
($194 million)
2014
($1.7 million)2014
($0.4 million)
2013
($150 million)
2013
($1.4 million)
2013
($0.1 million)
8 TLA Worldwide PLC

Statutory EPS of $0.01 cents
Net debt was $6.6 million as at 31 December 2014
1. Headline EBITDA is defined as statutory
operating profit adjusted to add back
depreciation, amortisation of acquired
intangible assets and any acquisition related
charges, share-based payment charges and
exceptional items
2. Headline EBITDA divided by revenue
3. Headline EBITDA after bank interest and
depreciation
4. Headline earnings per share is defined as
headline profit for the year divided by the
weighted average number of ordinary shares
in issue during the year. Headline profit for
the year is defined as profit for the year
adjusted to add back amortisation of acquired
intangible assets and any other acquisition
related charges, share based payment charges,
fair value movement on financial derivatives,
unwinding of discount on deferred consideration
and exceptional items.
2014
(1 ¢)
2014
($6.6 million)2013
(77 ¢)
2013
($5.8 million)
Jose ReyesShortstop, Toronto Blue Jays
9Annual Report 2014
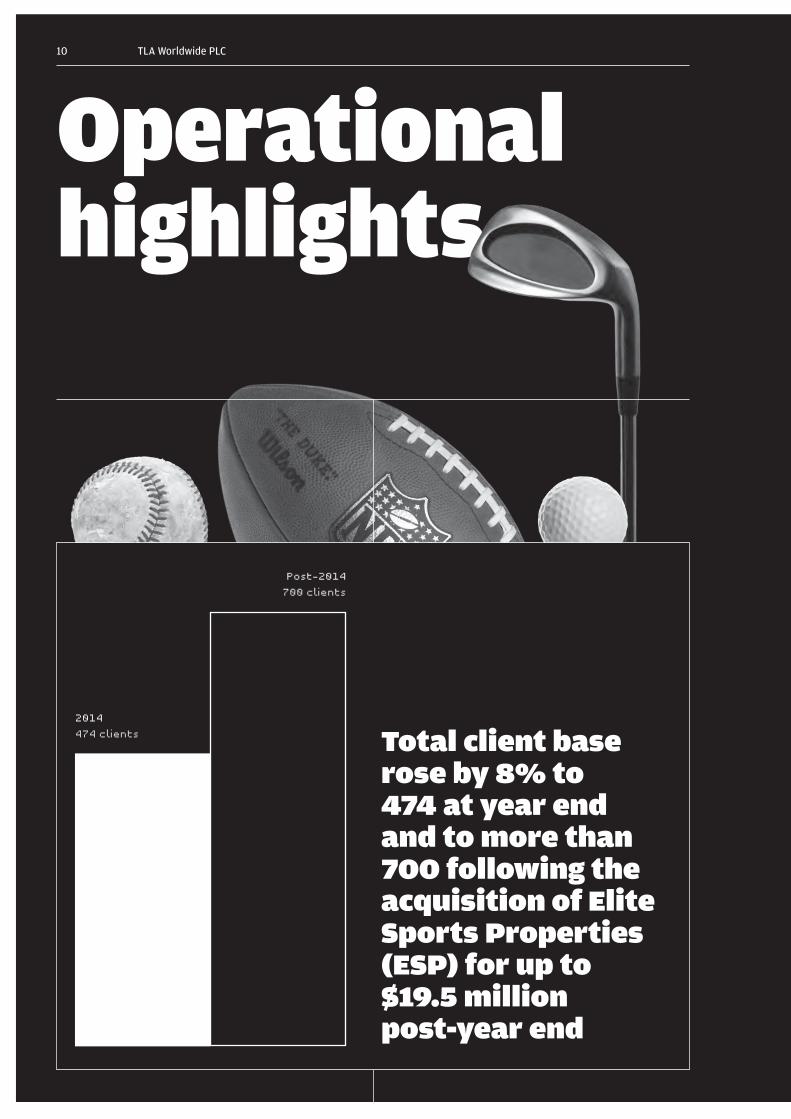
Operational highlights
Total client base rose by 8% to 474 at year end and to more than 700 following the acquisition of Elite Sports Properties (ESP) for up to $19.5 million post-year end
2014
474 clients
Post-2014
700 clients
10 TLA Worldwide PLC

Delivered the first USA Rugby vs New Zealand All Blacks rugby game in the USA for 35 years with a sell-out attendance
Baseball representation Headline EBITDA rose by 17% to $7.4 million
Sports marketing Headline EBITDA increased organically by 80% to $4.6 million, reflecting our continued investment in the business
11Annual Report 2014

George SpringerOutfielder, Houston Astros
Secured four-year deal to co-promote the International Champions Cup in Australia from July 2015, with the first tournament featuring clubs Manchester City, Real Madrid and AS Roma
In March 2015, acquired ESP, an Australian and UK sports marketing agency, adding 250 clients and many sports stars including Sir Chris Hoy and Becky Adlington, as well as the Cricket World Cup 2015 and the Rugby World Cup 2015
Major League Baseball (MLB) clients now 83 (2013: 64), an increase of 30%
12 TLA Worldwide PLC

Ryan TannehillQuarterback, Miami Dolphins
13Annual Report 2014
Overview and principal activityOur strategy to invest in the organic ex-
pansion of the business and in people has
enabled the Group to deliver an excellent
financial and operational performance in
2014. Revenues increased by 12% while
headline profit before tax rose by 26% year
on year. This growth was entirely organic
and driven mainly by a stellar performance
from the sports marketing segment last
year.
Putting these results in a longer his-
torical context, since joining AIM in 2011
TLA has grown its revenues and Headline
EBITDA by a compound average growth rate
of 17.4% and 16.8% respectively.
Group Headline EBITDA margin im-
proved by four percentage points to 43%
as the baseball representation business
increased its profit contribution, despite
a modest increase in revenues. The sports
marketing business saw strong across-the-
board growth, in particular benefitting
from our events division, which successfully
delivered the USA Eagles vs New Zealand
All Blacks rugby game in November with a
sell-out attendance at the Soldier Field sta-
dium in Chicago. Statutory operating profit
improved by 19% to $1.7m.
The Group continues to enjoy excellent
forward visibility with $194 million of off-
season contracts negotiated in 2014.
Major corporate expansionSince the year end, we have acquired
the business and assets of Elite Sports
Properties Pty Ltd (“ESP”), an Australian
and UK-focused business, for up to $19.5
million. The deal is part of the Group’s
strategy to enhance its organic growth
prospects with selected acquisitions that
complement TLA’s activities and are accre-
tive to earnings.
Prior to the deal, we had already
started to develop a foothold in Australia
by bringing the world-class International
Champions Cup tournament, which features
some of the world’s top football teams, to
Melbourne. We have secured the rights to
benefit from the annual tournament, being
launched for the first time in Australia, for
a total of four years. It will be broadcast
live to a global audience by our partner
Nine Live, part of a major Australian media
group, and in a further 155 countries.
ESP will allow us to further strengthen
our position within the Australian sports
market with its ongoing relationships with
talent, right holders and sponsors. It will
also give us a presence in the UK from
which to build.
STRATEGIC REPORT
CHAIRMAN’S STATEMENT
Bart Campbell, Chairman13 April 2015
HIGHLIGHTS
12%increased revenues
26%increased year-on-year
headline profit
$194 millionoff-season contracts
negotiated in 2014
14 TLA Worldwide PLC

John SendenProfessional golfer
PeoplePeople are at the core of our business as
it continues to grow successfully and we
will continue to add and develop this key
resource. This investment is fundamental to
our business and is no different from invest-
ment in manufacturing capacity to increase
an industrial business’s ability to produce
more goods.
It was with sadness that I had to report
the passing of Andy Wilson on 15 May 2014.
Andy had been a member of the board since
19 March 2012 and his engaging contribu-
tion will be missed by all of us.
We appointed Ian Robinson to our board
on 25 May 2014. Ian is currently non-execu-
tive chairman of Jaywing Plc, an AIM-listed
digital marketing and consulting business,
and a non-executive director of Gusbourne
Plc, an AIM-listed English sparkling-wine
business. Previously he was chief financial
officer of Carlisle Group’s UK staffing and
facilities services operations. He has held
other senior financial appointments both
in the UK and overseas. He is a Fellow of
the Institute of Chartered Accountants in
England & Wales, having trained with Peat,
Marwick, Mitchell & Co (now KPMG) in
London. We welcome Ian to our board and
his addition will be invaluable as we move
forward.
OutlookThe Group delivered strong growth in 2014,
all organic. Taking into account our previ-
ous year’s results, it means that we have
grown our revenues and Headline EBITDA at
a compound average growth rate of 17.4%
and 16.8% respectively since joining AIM
in 2011.
Trading in the current year is in line with
management expectations and we continue
to experience good business momentum.
In addition, the sports marketing industry
continues to experience excellent long-term
fundamentals as global spending on sports
increases at above GDP growth rates, with
media rights seeing significant growth, of
which our clients are direct beneficiaries.
As a result, we expect to deliver another
year of double-digit growth in 2015, under-
pinned by the following factors: — Good long-term revenue visibility with
$194 million of off-season contracts ne-
gotiated in 2014
— First-time revenues from the launch of
the annual ICC football tournament in
Australia from July this year
— Maiden contribution from the acquisi-
tion of ESP, which has been success-
fully integrated into the Group and is
expected to be earnings enhancing from
this year
Given our bright prospects, the Board looks
to the future with confidence.
We expect to deliver another year of double-digit growth in 2015
15Annual Report 2014

16 TLA Worldwide PLC
STRATEGIC REPORT
CHIEF EXECUTIVE’S REVIEW
Baseball representationThe baseball representation business, which
derives revenues through long-term rela-
tionships with many established and young
players, had a stable year. Headline EBITDA
increased by 17% to $7.4 million (2013: $6.3
million) on a 1% increase in revenues to
$13.2 million in 2014 (2013: $13.1 million).
The increase in Headline EBITDA was
attributable to tight cost control, with costs
down by 15% in the year. Revenues are
expected to improve going forward as we
have added 19 MLB players to our roster,
compared with a year ago.
A total of $194 million worth of con-
tracts were signed on behalf of player-cli-
ents during the 2014 off-season (2013: $150
million) – an increase of 29.3%.
Thirteen new baseball players were
added to our client list in 2014 bringing the
total baseball client list to 267 (2013: 254).
The potential of our roster of younger
players who have yet to generate significant
revenues was validated when three of our
signings were named among the game’s
top 12 prospects (“Sports on Earth” –
September 2014).
Our roster of potential new stars also
continued to grow as seven Minor League
clients were called up to Major League
teams during the year. This means that
after completing their initial three-year ser-
vice period they become eligible for market-
related salaries, which we assist them to
negotiate in return for long-term fees.
We now have 83 MLB clients (2013: 64)
and 184 Minor League baseball clients
(2013: 190), having added 12 new MLB cli-
ents and with seven moving up from our
MiLB roster, to the majors.
Sports marketingThe Sports Marketing division had a strong
year with 80% organic Headline EBITDA
growth from $2.5 million to $4.6 million.
Revenues increased to $7.7 million (2013:
$5.5 million). Its client base grew by 11% to
207 (2013: 186). We organised the first ever
rugby game between the USA Eagles and
New Zealand All Blacks on American soil
since the game turned professional in 1995.
It was played at the iconic Soldier Field, the
home of the Chicago Bears. We expect to
promote and deliver further rugby games
of this type in the future.
Our golf business, which includes top
ten ranked Jim Furyk, continued to perform
well with 12 PGA clients (2013:12) achieving
36 top ten finishes (2013: 25), including four
wins. This continued performance enables
us to negotiate better sponsorship deals for
our golf clients.
Talent marketing continues its good
corporate relationships by agreeing deals
with Hublot, Pepsi, Proctor & Gamble and
Unilever.
Coaching and broadcasting grew its client
base to 115, a 14% overall increase on 2013.
Michael Principe,Group Chief Executive13 April 2015
HIGHLIGHTS
17%increased headline EBITDA in
baseball representation
3baseball signings named among the
game's top 12 prospects
80%organic headline EBITDA growth in
sports marketing
17Annual Report 2014

Melky CabreraOutfielder, Chicago White Sox
The business continues to invest into the
future by adding young coaches to its books.
New business expansionA rights sales business was also established
with some key hires during the last quarter
of 2014. This business focuses on the sale
of perimeter advertising in sports venues
and selling team sponsorships. It is a good
fit with our expanding event ownership and
creation business. The business already
generates some revenues and is expected
to progress further during 2015. We expect
to make further investment into this area to
ensure it has the resources to grow.
As mentioned above, the acquisition of
ESP will enable us to continue to build on
the foundations in the Australian market
that we have already established. ESP
has 250 clients and offices in Melbourne,
Sydney, Adelaide and Perth in Australia;
Largs, Scotland; and Richmond, London.
The acquisition provides us with a stronger
presence in Australia, the world’s fourth
largest sport market. This will enhance the
platform that we have already established
there as well as give us a UK trading pres-
ence, coupled with excellent management
teams in both markets.
The teams for the first International
Champions Cup tournament will be Real
Madrid, Manchester City and AS Roma and
the three games will be played 18-24 July
in Melbourne. The first tournament has
partnered with the Victorian Government.
TLA has the rights to stage and deliver the
tournament annually until 2018.
The acquisition of ESP will enable us to continue to build on the foundations in the Australian market that we have already established.
18 TLA Worldwide PLC

Athlete NamePosition, Team
Kerri Walsh JenningsOlympic volleyball 3-time gold medalist
19Annual Report 2014
STRATEGIC REPORT
CHIEF FINANICAL OFFICER’S REVIEW
Headline resultsYear ended
31 December 2014($000)
Year ended 31 December 2013
($000)%
Change
Revenue 20,816 18,605 +11.9
Gross profit 20,791 17,972 +15.7
Headline EBITDA 9,021 7,269 +24.1
Headline EBITDA margin 43.3% 39.1% +4.2pp
Headline profit before tax 8,567 6,826 +25.5
Headline diluted earnings per share (cents) 4.76 4.14 +14.9
Cash balances as at 31 December 2014 of $5.9 million (2013: $4.4 million) and net debt of
$6.6 million (2013: $5.8m). The Group’s receivable days have increased on last year and
as a KPI this increase has be reviewed and steps taken to reduce the debtors days going
forward.
Donald Malter, Chief financial officer13 April 2015
This review covers the year ended 31 December 2014. For this year the Group reported a statutory profit before tax of $0.4 million (2013: profit of $0.1 million). The performance at the operating level, before interest, tax, depreciation, amortisation and exceptional charges showed a Headline EBITDA of $9.0 million (2013: $7.3 million).
20 TLA Worldwide PLC
Statutory resultsYear ended 31
December 2014($000)
Year ended 31 December 2013
($000)%
Change
Revenue 20,816 18,605 +11.9
Operating profit 1,704 1,434 +18.8
Statutory profit before tax 419 50 +740.0
Statutory diluted earnings per share (cents) 0.01 0.77 -98.7
TLA segments its operations into baseball representation and Sports Marketing as follows:
Year ended 31 December 2014
Baseball Representation
($000)
Sports Marketing
($000)Unallocated
($000)Total
($000)
Revenues 13,155 7,661 – 20,816
Cost of sales (25) – – (25)
Gross profit 13,130 7,661 – 20,791
Operating expenses excluding depreciation, amortisation,
share-based payments and exceptional items
(5,725) (3,096) (2,949) (11,770)
Headline EBITDA 7,405 4,565 (2,949) 9,021
Amortisation of intangibles arising on acquisition (3,477) (1,207) – (4,684)
Deprecation (10) (3) (47) (60)
Exceptional items and acquisition related costs (184) (250) (717) (1,151)
Share-based payment – – (1,422) (1,422)
Operating profit/(loss) 3,734 3,105 (5,135) 1,704
Finance costs (1,285)
Profit before tax 419
Tax (402)
Profit for the year 17
Year ended 31 December 2013
Baseball Representation
($000)
Sports Marketing
($000)Unallocated
($000)Total
($000)
Revenues 13,081 5,524 – 18,605
Cost of sales – (633) – (633)
Gross profit 13,081 4,891 – 17,972
Operating expenses excluding depreciation, amortisation
and exceptional items
(6,739) (2,359) (1,605) (10,703)
Headline EBITDA 6,342 2,532 (1,605) 7,269
Amortisation of intangibles arising on acquisition (3,759) (1,261) – (5,020)
Deprecation (11) (4) (18) (33)
Exceptional items and acquisition related costs – – (782) (782)
Operating profit/(loss) 2,572 1,267 (2,405) 1,434
Finance costs (1,384)
Profit before tax 50
Tax 923
Profit for the year 973
21Annual Report 2014
Headline divisional performance
BASEBALL REPRESENTATION
2014$000
2013$000
%Change
Revenue 13,155 13,081 +0.6
Headline EBITDA 7,405 6,342 +16.8
Headline EBITDA Margin 56.3% 48.5% +7.8pp
Operating profit 3,734 2,572 +45.2
Trading for the year ended 31 December 2014 saw $13.2 million of
revenue, a Headline EBITDA of $7.4 million and a statutory operat-
ing profit of $3.7 million after accounting for the amortisation of
acquired intangibles.
SPORTS MARKETING
2014$000
2013$000
%Change
Revenues 7,661 5,524 +38.7
Headline EBITDA 4,565 2,532 +80.3
Headline EBITDA Margin 59.6% 45.8% +13.8pp
Operating profit 3,105 1,267 +145.1
Trading for the year ended 31 December 2014 showed revenue of
$7.7 million, Headline EBITDA of $4.6 million and operating profit of
$3.1 million. The increase in EBITDA margin is due to the increased
profitability of the events and media businesses that the Group in-
vested in during the year.
Cash flow and banking arrangementsCash generated from operating activities
for the year ended 31 December 2014 was
$3.0 million (2013: $3.3 million). Cash as at
31 December 2014 was $5.9 million (2013:
$4.4 million) and net debt was $6.6 million
(2013: $5.8 million).
The Group has an outstanding term loan
of $6.0 million and a revolver facility of $7.0
million of which $6.6 million was drawn as
at 31 December 2014 (2013: $3.4 million).
On the 4 March 2015 the Group agreed a
new five-year $35 million facility comprising
of a $20 million term loan, which has been
used to partially fund the acquisition of
Elite Sports Properties Pty and $15 million
of working capital revolver.
Cash earn-outs payments due for 2015
total $2.6 million, all of which have been
paid since the year-end.
DividendsThe board proposes a final dividend of 0.8
pence per share (2013: 0.7 pence) payable
on 10 July 2015 to shareholders on the reg-
ister at 29 May 2015. The ex-dividend date
is 28 May 2015.
Principal risks and uncertainiesThe management of the Group and the ex-
ecution of the Group’s strategies are subject
to a number of risks. The key business risks
affecting the Group are shown below.
RISK MANAGEMENTThe significant risks that the Group faces
have been considered and policies have
been implemented to best deal with each
risk. The four most significant risks are
considered to be liquidity, finance cost risk,
customer relationship risk and management
risk. The Group is significantly based in the
US and reports in US dollars and so direct
exposure to exchange risk is considered to
be minimal.
LIQUIDITY RISKThe year-end net debt was $6.6 million
(2013: $5.8 million), which consisted of $6.0
million of interest bearing loans and a $6.6
million revolver (2013: $7.0 million of inter-
est bearing loans and $3.4 million of revolv-
er). The Group revolving facility is for a total
of $7.0 million and the Group had cash of
$5.9 million as at the year-end. The Group’s
cash and net debt position is continually
monitored. Post year-end, the Group en-
tered into a new five-year facility with Sun
Trust of $35 million comprising $20 million
of term loan and $15 million revolving credit
facility. The new facility matures on 4 March
2020. Further details are given in note 28 to
the financial statements.
FINANCE RISK COSTThe Group pays finance costs on its bank
facilities. These facilities finance costs are a
variable cost linked to LIBOR plus a margin.
Interest rates are managed through an in-
terest rate swap. The average interest rate
on the facilities for the Group in 2014 was
4.5% (2013: 4.5%)
CUSTOMER RELATIONSHIPS RISKThe Group has commercial relationships
with 474 clients. Attrition rates are low
and relationships are strong. In the case of
baseball contracts, any revenues negotiated
by the Group survive the termination of re-
lationship with a client. No client accounts
for more than 6% of revenue (2013: 6%).
MANAGEMENTIt’s likely that changes to members of the
senior management team would impact
on the Group’s ability to perform to the
expectations within its strategy. The Board
ensures that the management team is ap-
propriately rewarded for its efforts and that
succession planning is considered. In the
case of vendor management they are incen-
tivised through the ability to achieve future
earn-out payments.
22 TLA Worldwide PLC

Key Performance Indicators (KPIs)The Group manages its operational performance using a number of KPIs.
The most important of these are:
KPIYear ended 31 December 2014
Year ended 31 December 2013
Headline EBITDA $9.0 million $7.3 million
Headline EBITDA Margin 43% 39%
Profit before tax $0.4 million $0.1 million
Off-season contracts negotiated $194 million $150 million
Number of net new client wins 49 67
Debtor collection days 63 days 50 days
Jim FurykProfessional golfer, 17 PGA Tour wins
23Annual Report 2014

SPOTLIGHT
ALL BLACKS
24 TLA Worldwide PLC
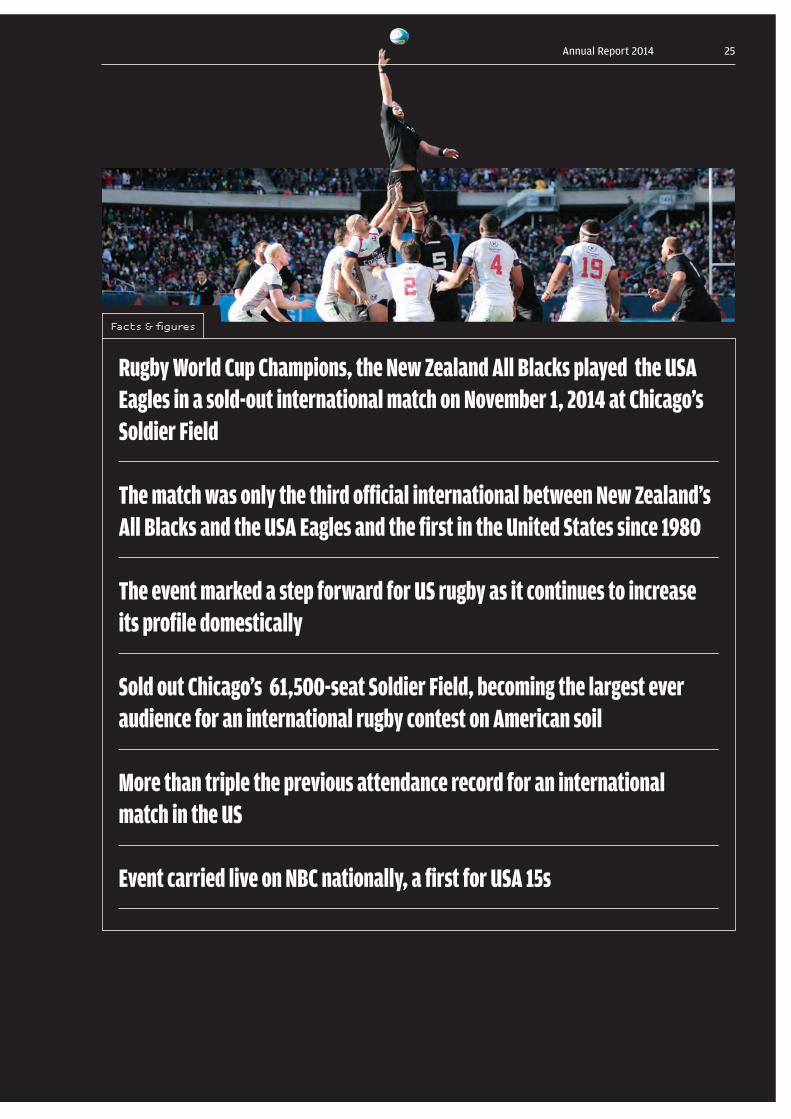
Rugby World Cup Champions, the New Zealand All Blacks played the USA Eagles in a sold-out international match on November 1, 2014 at Chicago’s Soldier Field
The match was only the third official international between New Zealand’s All Blacks and the USA Eagles and the first in the United States since 1980
The event marked a step forward for US rugby as it continues to increase its profile domestically
Sold out Chicago’s 61,500-seat Soldier Field, becoming the largest ever audience for an international rugby contest on American soil
More than triple the previous attendance record for an international match in the US
Event carried live on NBC nationally, a first for USA 15s
Facts & figures
25Annual Report 2014
Bart CampbellExecutive Chairman · 44
From 2009 until May 2013, Bart was the Group COO of Chime
Communications plc (“Chime”) sports division, called CSM Sport &
Entertainment, which has 670+ staff in 15 offices across 13 countries
and is the fourth largest sports marketing agency globally. He was
a member of the executive board of Chime. Prior to that he was
Chief Executive of the sports marketing and management business
Essentially Group plc (“Essentially”), which is part of Chime today,
starting this role in 2006. Bart is also Chairman of the Melbourne
Storm Rugby Club.
During his tenure as CEO of Essentially, Bart grew the business
from 20 to 120 professionals with offices in London, Australia,
South Africa, New Zealand, India and Japan. He is a former practic-
ing sports and commercial lawyer, with a BA and LLB from Otago
University in his native New Zealand. Bart was admitted to the bar
in 1994 before going on to complete a Masters in Commercial Law
(Hons) from Auckland University in 1999. He successfully completed
the Advanced Management Program at Harvard Business School in
2010.
Donald MalterChief Financial Officer · 49
Donald was previously CFO (North America) for BMG Chrysalis
since 2010, a joint venture between private equity firm, KKR and
European media conglomerate, Bertelsmann. Prior to this he was
CFO (North America) for Dimensional Music Publishing, LLC, a pri-
vate equity-backed music publishing house for five years. Don is
an experienced financial veteran having worked in the media and
entertainment industry for more than 20 years.
Michael PrincipeChief Executive · 44
As the Chief Executive of TLA, Mike brings nearly 15 years of experi-
ence in sports and entertainment industry to his position. Most re-
cently, Mike served as the Managing Director of Blue Entertainment
Sports Television (“BEST”), an industry leader in sports marketing,
management and production, which was recently acquired by
Lagardère Unlimited, where he also served as the Chief Operating
Officer for its parent company, Blue Equity LLC.
Prior to joining BEST, he held various executive positions with
SFX Sports Group Inc. (“SFX”), including serving as a member of its
Executive Committee and that of Executive Vice President and as
General Counsel. As one of the most accomplished executives and
dealmakers in sports, Mike has participated in more than 35 trans-
actions with an aggregate value in excess of $600 million. He is a
member of the New York Bar and the Sports Lawyers Association.
He has been named in the Sports Business Journal’s prestigious
“Forty Under 40” list.
Greg GenskeExecutive Director · 43
Greg became CEO of Legacy in 2004. He has served as lead negotia-
tor for the contracts signed by Legacy clients dating back to 2004.
Greg has advised amateur athletes in the MLB and NFL drafts, in-
cluding the first pick overall in the 2004 and 2008 MLB drafts. He
has been named in the Sports Business Journal’s prestigious “Forty
Under 40” list. Prior to entering the sports industry, he practised
with two leading national law firms as a trial attorney. Greg holds a
bachelor’s degree from Pepperdine University and J.D. from Boalt
Hall School of Law at University of California at Berkeley.
BOARD OF DIRECTORS26 TLA Worldwide PLC
Keith SadlerSenior Independent Non-Executive Director · 56
Keith was, until December 2014, Chief Financial Officer of Dods
(Group) PLC, a political communications business. He was formerly
COO and Group Finance Director of WEARE 2020 plc. Prior to this
he was Chief Executive and Group Finance Director of SPG Media
Group plc, a marketing services business, Group finance director of
The Wireless Group and two quoted regional newspaper publishers,
News Communication and Media plc and Bristol United Press plc.
Before this he was treasurer of Mirror Group Newspapers plc. Keith
is a chartered accountant and holds an honours degree in econom-
ics from the University of Kent.
Ian RobinsonNon-Executive Director · 64
Ian is currently non–executive Chairman of Jaywing Plc, an AIM
listed digital marketing and consulting business, a non-executive
director of Gusbourne Plc and an AIM-listed English sparkling-wine
business. He is non-executive Chairman of LT Pub Management Plc,
a privately owned pub and leisure asset management business. He
is also a director of a number of other privately owned businesses.
Previously he was Chief Financial Officer of Carlisle Group’s UK
staffing and facilities services operations. He has held other senior
financial appointments both in the UK and overseas. He is a Fellow
of the Institute of Chartered Accountants in England & Wales, having
trained with Peat, Marwick, Mitchell & Co (now KPMG) in London.
Andrew PearsonNon-Executive Director · 56
Andrew is a chartered accountant and as a Senior Partner for 16
years, he formed and led KPMG’s Transaction Services business
in the Midlands, building a multi-disciplined team of more than
40 senior professionals supporting corporate, private equity and
bank clients on every type of M&A transaction. Andrew currently is
a Senior Partner in WayPoint Change LLP specialising in hands-on
business turnaround and M&A projects for banks and private equity
funds.
DIGITAL COMPANION
View the digital version of this
report at www.tlaww-plc.com
27Annual Report 2014

DIRECTORS’ REPORT
The Directors present their report together with financial statements for the year ended 31 December 2014.
Political and charitable donationsNo political or charitable donations were
made during the year (2013: $nil).
Directors’ interestsThe present membership of the Board, to-
gether with biographies on each, is set out
on pages 24 and 25. All of these Directors
served throughout the year, except for Ian
Robinson who joined the Board on 22 May
2014. Directors’ interests in shares in the
Company are set in the Directors’ remu-
neration report on page 30.
Directors’ third-party indemnity provisionsThe Group maintains appropriate insurance
to cover Directors’ and officers’ liability. The
Group provides an indemnity in respect of all
the Group’s Directors. Neither the insurance
nor the indemnity provides cover where the
Director has acted fraudulently or dishonestly.
EmployeesThe Group is an Equal Opportunities
Employer and no job applicant or employee
receives less favourable treatment on the
grounds of age, sex, marital status, sexual
orientation race, colour, religion or belief.
It is the policy of the Group that indi-
viduals with disabilities, whether registered
or not, should receive full and fair consider-
ation for all job vacancies for which they are
suitable applicants. Employees who become
disabled during their working life will be
retained in employment whenever possible
and will be given help with any rehabilita-
tion and retraining.
Going concernThe Directors have reviewed forecasts for
the years ending 31 December 2015 and
31 December 2016. For this reason they
continue to adopt the going concern basis
in preparing the financial statements. See
page 46 for more detail.
Health and safetyThe Group is committed to maintaining a
safe and healthy working environment for
all staff. To that end it provides appropriate
training and supervision.
Supplier payment policyIt is the Group’s policy and practice to settle
its suppliers accounts on due dates accord-
ing to agreed terms of credit. The creditor
days across the Group for the year were 41
days (2013: 27 days). The Group has $2.3
million of trade payables as at 31 December
2014 (2013: $1.5 million).
Share capital structureDetails of the Company’s share capital are
set out in note 19 of the financial statements.
The Company has one class of ordinary
shares which carry no right to fixed income.
Each share carries the right to one vote at
general meetings of the Company. There are
no restrictions on the transfer of ordinary
Dwight Mighty,Company Secretary13 April 2015
(by order of the board)
28 TLA Worldwide PLC
shares in the capital of the Company other
than the customary restrictions contained
in the Company’s Articles of Association and
certain restrictions, which may be required
from time to time by law, for example, in-
sider trading laws. In accordance with the
Model code which forms part of the Listing
Rules of the Financial Services Authority
certain Directors and employees are re-
quired to seek approval of the Company to
deal in its shares.
The Company is not aware of any agree-
ments between shareholders that may
result in restrictions on the transfer of se-
curities and/or voting rights. The Company’s
Articles of Association contain limited
restrictions on the exercise of voting rights.
With regard to the appointment and
replacement of Directors, the Company
is governed by its Articles of Association,
the Companies Act and related legislation.
The Articles themselves may be amended
by special resolution at a general annual
meeting of shareholders. The powers of the
Directors are described in the Main Board
Terms of Reference, copies of which are
available on request.
Financial instrumentsDetails of the financial risk management
objectives and policies of the Group, includ-
ing hedging policies, are given in note 26 to
the consolidated financial statements.
Corporate and social responsibilityThe Board recognises the growing aware-
ness of social, environmental and ethical
matters and it endeavours to take account
of the interest of the Group’s stakeholders
when operating the business.
Annual General MeetingYour attention is drawn to the Notice of
Meeting enclosed with this Annual Report,
which set out the resolutions to be pro-
posed at the forthcoming Annual General
Meeting.
AuditorEach of the Directors at the date of the ap-
proval of this Annual Report confirms that:
w So far as the director is aware, there is
no relevant audit information of which
the Company’s auditor is unaware; and
w The director has taken all the steps that
he ought to have taken as a director
to make himself aware of any relevant
audit information and to establish that
the Company’s auditor is aware of that
information.
This conformation is given and should be in-
terpreted on accordance with the provision
of s418 of the Companies Act 2006.
The auditor, Deloitte LLP, has indicated
its willingness to remain in office. A resolu-
tion that it be re-appointed will be proposed
at the Annual General Meeting.
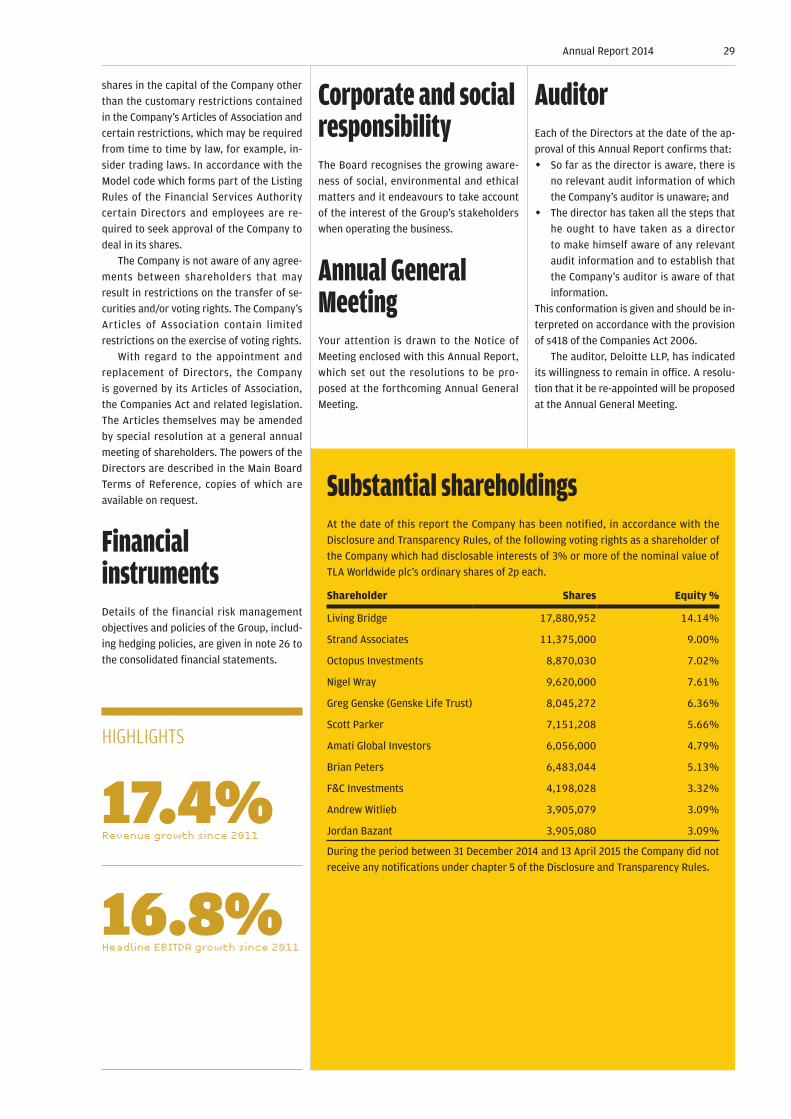
Substantial shareholdingsAt the date of this report the Company has been notified, in accordance with the
Disclosure and Transparency Rules, of the following voting rights as a shareholder of
the Company which had disclosable interests of 3% or more of the nominal value of
TLA Worldwide plc’s ordinary shares of 2p each.
Shareholder Shares Equity %
Living Bridge 17,880,952 14.14%
Strand Associates 11,375,000 9.00%
Octopus Investments 8,870,030 7.02%
Nigel Wray 9,620,000 7.61%
Greg Genske (Genske Life Trust) 8,045,272 6.36%
Scott Parker 7,151,208 5.66%
Amati Global Investors 6,056,000 4.79%
Brian Peters 6,483,044 5.13%
F&C Investments 4,198,028 3.32%
Andrew Witlieb 3,905,079 3.09%
Jordan Bazant 3,905,080 3.09%
During the period between 31 December 2014 and 13 April 2015 the Company did not
receive any notifications under chapter 5 of the Disclosure and Transparency Rules.
HIGHLIGHTS
17.4%Revenue growth since 2011
16.8%Headline EBITDA growth since 2011
29Annual Report 2014

30 TLA Worldwide PLC

DeMarco MurrayRunning Back, Philadelphia Eagles
31Annual Report 2014

DIRECTORS’ REMUNERATION REPORT
As an AIM-listed Company, the Company is not required to comply with Schedule 8 of the Companies Act. However, in accordance with AIM notice 36 the Company has provided, on page 19, the necessary disclosure of the Directors’ remuneration earned in respect of the financial year by each Director of the Company acting in such a capacity during the financial year. The Directors also feel it is appropriate to provide the following information to shareholders:
The Remuneration CommitteeThe Remuneration Committee is comprised
of:
w Ian Robinson (Chairman)
w Keith Sadler
w Bart Campbell
The Remuneration Committee is not
comprised of entirely independent non-
executive Directors. Ian Robinson, who is
affiliated to a major shareholder, and Bart
Campbell, due to his shareholding in the
Company and his influence in its formation,
are not independent under the Code. The
Board does consider them to act indepen-
dently as regards remuneration issues.
The committee met twice during the
year. The Company Secretary is the secre-
tary to the committee.
The committee seeks input from the
Chief Executive Officer and the Company
Secretary. The committee makes reference
to external evidence of pay and employ-
ment conditions in other companies and is
free to seek advice from external advisers.
Remuneration policyThe Group’s policy on remuneration for the
current year and, so far as is practicable
for subsequent years, is set out below.
However, the Remuneration Committee
believes that it should retain the flex-
ibility to adjust the remuneration policy
in accordance with the changing needs of
the business. Any changes in the policy in
subsequent years will be detailed in future
reports on remuneration. The Group must
ensure that its remuneration arrangement
attract and retain people of the right calibre
in order to ensure corporate success and
to enhance shareholder value. Its overall
approach is to attract, develop, motivate
and retain talented people at all levels, by
paying competitive salaries and benefits to
all staff and encouraging its staff to hold
shares in the group. Pay levels are set to
take account of contribution and individual
performance, wage levels elsewhere in the
Group and with reference to relevant mar-
ket information. The Group seeks to reward
its employees fairly and give them the op-
portunity to increase their earnings by link-
ing pay to achieving business and individual
targets.
The board believes that share ownership
is an effective way of strengthening employ-
ees’ involvement in the development of the
business and bringing together their inter-
est and those of shareholders and as such
anticipates granting a share option scheme
to key employees in the future.
Executive Directors are rewarded
on the basis of individual responsibility,
competence and contribution and salary
Ian Robinson,Chairman, Remuneration Committee13 April 2015
(by order of the board)
32 TLA Worldwide PLC
increases also take into account pay awards
elsewhere in the Group as well as external
market benchmarking. During the year
Bart Campbell, formerly a Non-Executive
Director, became an Executive Director.
During the year to 31 December 2014
there were four Executive Directors:
w Bart Campbell (Executive Chairman)
w Michael Principe (CEO)
w Greg Genske (Executive Director)
w Donald Malter (CFO)
Messrs Principe and Genske participate in
the Company’s healthcare scheme.
Performance-related elements form
a substantial part of the total remunera-
tion packages and are designed to align
Directors’ interest with those of sharehold-
ers. In line with best practice and to bring
the Directors’ and shareholders’ interest
further into line, Executive Directors and
the management team are encouraged to
maintain a holding of ordinary shares in the
Group.
Non-Executive Directors' feesThe Board determines fees for Non-
Executive Directors annually, taking advice
as appropriate and reflecting the time com-
mitment and responsibilities of the role.
Non-Executive Directors’ fees currently
comprise a basic fee of £30,000 per annum.
In addition, Non-Executive Directors’ are
paid £5,000 per annum for each committee
that they sit on.
Non-Executive Directors’ do not participate
in any pension schemes or LTIP. The Group
reimburses the reasonable expenses they
incur in carrying out their Directors’ duties.
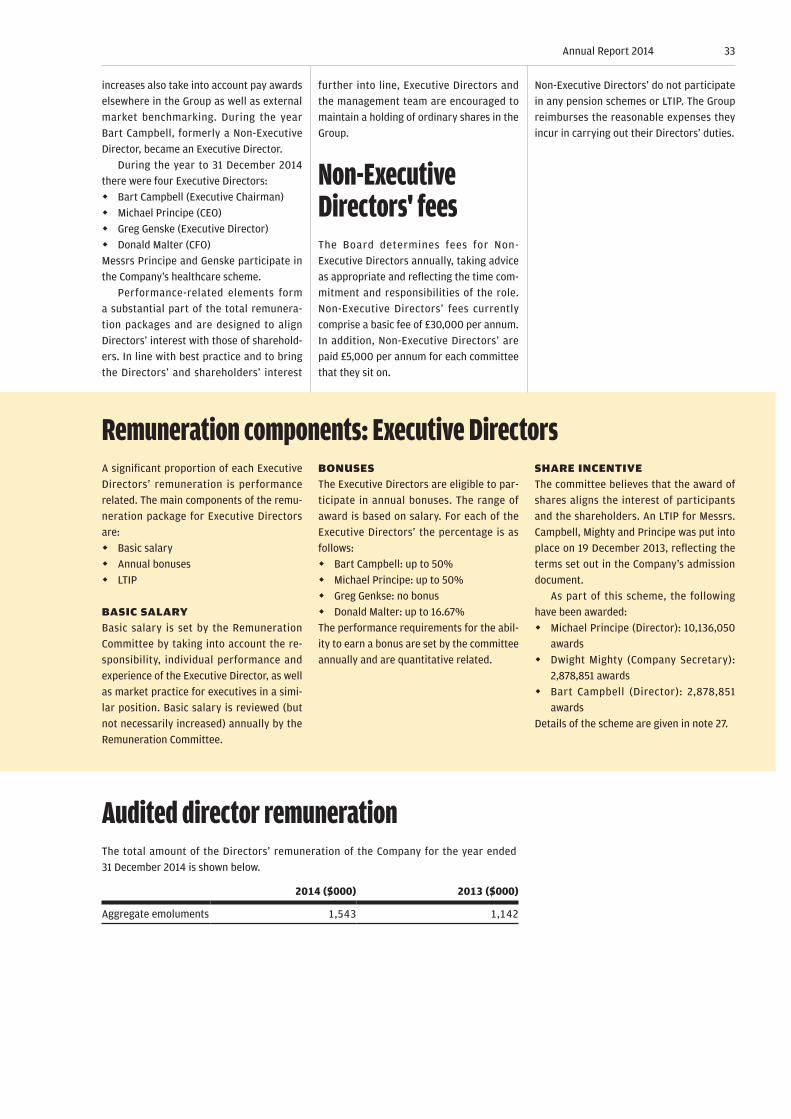
Remuneration components: Executive DirectorsA significant proportion of each Executive
Directors’ remuneration is performance
related. The main components of the remu-
neration package for Executive Directors
are:
w Basic salary
w Annual bonuses
w LTIP
BASIC SALARYBasic salary is set by the Remuneration
Committee by taking into account the re-
sponsibility, individual performance and
experience of the Executive Director, as well
as market practice for executives in a simi-
lar position. Basic salary is reviewed (but
not necessarily increased) annually by the
Remuneration Committee.
BONUSESThe Executive Directors are eligible to par-
ticipate in annual bonuses. The range of
award is based on salary. For each of the
Executive Directors’ the percentage is as
follows: w Bart Campbell: up to 50%
w Michael Principe: up to 50%
w Greg Genkse: no bonus
w Donald Malter: up to 16.67%
The performance requirements for the abil-
ity to earn a bonus are set by the committee
annually and are quantitative related.
SHARE INCENTIVEThe committee believes that the award of
shares aligns the interest of participants
and the shareholders. An LTIP for Messrs.
Campbell, Mighty and Principe was put into
place on 19 December 2013, reflecting the
terms set out in the Company’s admission
document.
As part of this scheme, the following
have been awarded: w Michael Principe (Director): 10,136,050
awards
w Dwight Mighty (Company Secretary):
2,878,851 awards
w Bart Campbell (Director): 2,878,851
awards
Details of the scheme are given in note 27.
Audited director remunerationThe total amount of the Directors’ remuneration of the Company for the year ended
31 December 2014 is shown below.
2014 ($000) 2013 ($000)
Aggregate emoluments 1,543 1,142
33Annual Report 2014
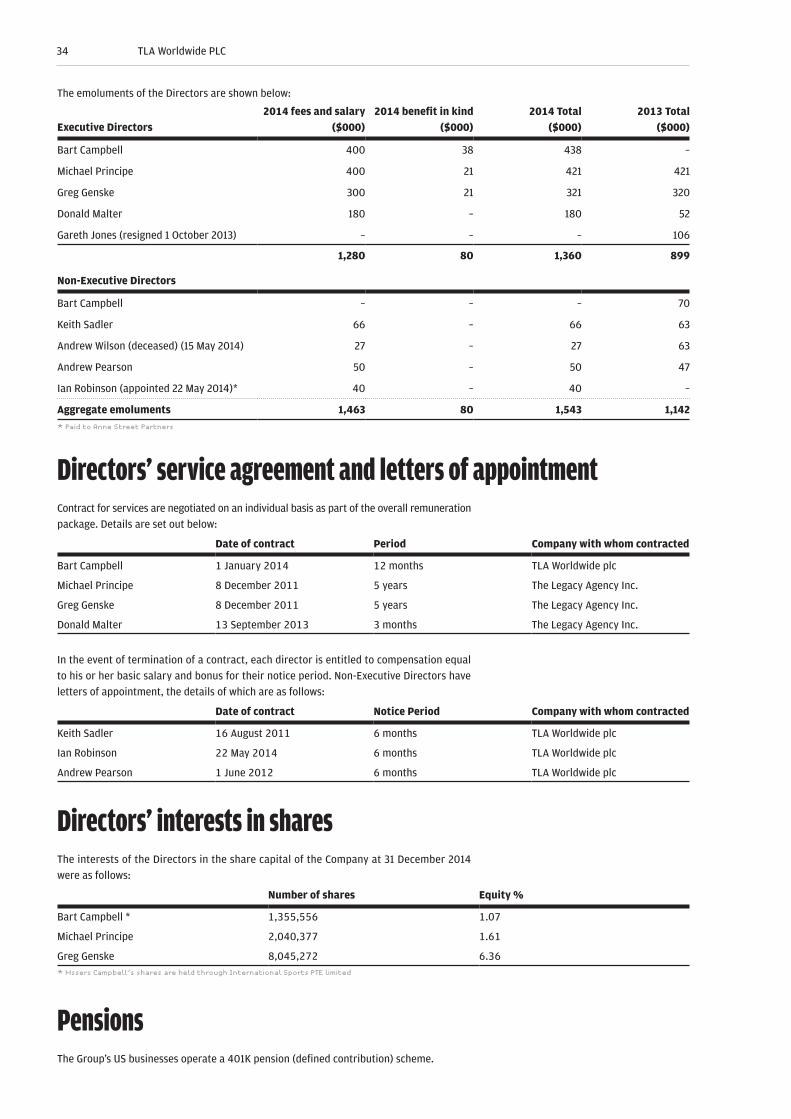
The emoluments of the Directors are shown below:
Executive Directors2014 fees and salary
($000)2014 benefit in kind
($000)2014 Total
($000)2013 Total
($000)
Bart Campbell 400 38 438 –
Michael Principe 400 21 421 421
Greg Genske 300 21 321 320
Donald Malter 180 – 180 52
Gareth Jones (resigned 1 October 2013) – – – 106
1,280 80 1,360 899
Non-Executive Directors
Bart Campbell – – – 70
Keith Sadler 66 – 66 63
Andrew Wilson (deceased) (15 May 2014) 27 – 27 63
Andrew Pearson 50 – 50 47
Ian Robinson (appointed 22 May 2014)* 40 – 40 –
Aggregate emoluments 1,463 80 1,543 1,142* Paid to Anne Street Partners
Directors’ service agreement and letters of appointmentContract for services are negotiated on an individual basis as part of the overall remuneration
package. Details are set out below:
Date of contract Period Company with whom contracted
Bart Campbell 1 January 2014 12 months TLA Worldwide plc
Michael Principe 8 December 2011 5 years The Legacy Agency Inc.
Greg Genske 8 December 2011 5 years The Legacy Agency Inc.
Donald Malter 13 September 2013 3 months The Legacy Agency Inc.
In the event of termination of a contract, each director is entitled to compensation equal
to his or her basic salary and bonus for their notice period. Non-Executive Directors have
letters of appointment, the details of which are as follows:
Date of contract Notice Period Company with whom contracted
Keith Sadler 16 August 2011 6 months TLA Worldwide plc
Ian Robinson 22 May 2014 6 months TLA Worldwide plc
Andrew Pearson 1 June 2012 6 months TLA Worldwide plc
Directors’ interests in sharesThe interests of the Directors in the share capital of the Company at 31 December 2014
were as follows:
Number of shares Equity %
Bart Campbell * 1,355,556 1.07
Michael Principe 2,040,377 1.61
Greg Genske 8,045,272 6.36* Mssers Campbell’s shares are held through International Sports PTE limited
PensionsThe Group’s US businesses operate a 401K pension (defined contribution) scheme.
34 TLA Worldwide PLC

Non-Executive DirectorshipsThe Company allows its Executive Directors
to take a limited number of outside
Directorships. Individuals retain the pay-
ments received from such services since
these appointments are not expected to im-
pinge on their principal employment. Bart
Campbell is Chairman of the Melbourne
Storm Rugby Club.
Other related party instructionsNo Director of the Company has, or had,
a disclosable interest in any contracts of
significant subsisting during or at the end
of the period. There were no disclosable
transactions by the Group under IAS24,
Related Party Disclosures. There have been
no other disclosable transactions by the
Company and its subsidiaries with Directors
of Group companies and with substantial
shareholders.
35Annual Report 2014
The BoardThe Board of TLA Worldwide plc is com-
prised of the Chairman, the Chief Executive
Officer, the Chief Financial Officer, an
Executive Director and three Non-Executive
Directors. Short biographical details of each
Director are set out on page 24 and 25. The
Board is responsible to the shareholders for
the proper management of the Group and
meets at least five times a year to set the
overall direction and strategy of the Group.
All strategic operational and investment de-
cisions are subject to Board approval.
The role of the Chief Executive and
Chairman are separate and there is a
clear division of their responsibilities. All
directors are subject to re-election every
three years. The Company has additionally
supplemented this with the good practice of
one third of the total number of Directors
standing for re-election at each Annual
General Meeting (“AGM”). Therefore,
Andrew Pearson and Keith Sadler will retire
at the upcoming AGM and, being eligible for
re-election, offer themselves for re-election.
Ian Robinson offers himself for election.
Board Committees
REMUNERATION COMMITTEEThe composition of the Remuneration
Committee is disclosed on page 18. The
Remuneration Committee, on behalf of
the Board, as and when necessary, review
and approve the contract terms, remu-
neration and other benefits of the Executive
Directors, senior management and major
remuneration plans for the Group as a
whole.
The Remuneration Committee approves
setting of objectives of the Executive
Directors and authorises their annual bonus
payments for achievement of objectives.
The Remuneration Committee approves
remuneration packages sufficient to attract
and motivate Executive Directors required
to run the Group successfully, but does not
pay more than is necessary for this service.
All the decisions of the Remuneration
Committee on remuneration matters in the
year ending 31 December 2014 were report-
ed to and endorsed by the Board. Further
details of the Group’s policies on remunera-
tion and service contracts are given in the
Directors’ remuneration report on page 30.
AUDIT COMMITTEEThe Audit Committee comprises of Non-
Executive Directors and Bart Campbell,
who became an Executive Director dur-
ing the year. By invitation, the meeting of
the Audit Committee may be attended by
other Directors and the external auditor.
The Committee meets not less than twice
annually. The Audit Committee oversees
CORPORATE GOVERNANCE REPORT
Although not required to comply with the UK corporate governance code (“the Code”) issued by the Financial Services Authority in June 2010 the Group is committed to high standards of corporate governance. Whilst the Group has not voluntarily adopted the Code, it applies a level of corporate governance which the Directors believe is appropriate for a Company of its size. This statement describes how the principles of corporate governance are applied.
Dwight Mighty,Company Secretary13 April 2015
(by order of the board)
36 TLA Worldwide PLC
the monitoring of the adequacy and effec-
tiveness of the Group’s internal controls,
accounting policies and financial reporting
and provides a forum for reporting by the
Group’s external auditor. Its duties include
keeping under review the scope and results
of the audit and its effectiveness, consid-
eration of management’s responses to any
major audit recommendations and the
independence and objectivity of the exter-
nal auditors. This will include taking into
consideration relevant UK professional and
regulatory requirements and to develop
and implement policy on the engagement
of the external auditor to supply non-audit
services, taking into account relevant ethi-
cal guidance.
NOMINATIONS COMMITTEEThe Nominations Committee comprises the
Chairman and the Non-Executive Directors.
It is responsible for monitoring the compo-
sition and balance of the Board and making
recommendations to the Board on potential
new Board appointments.
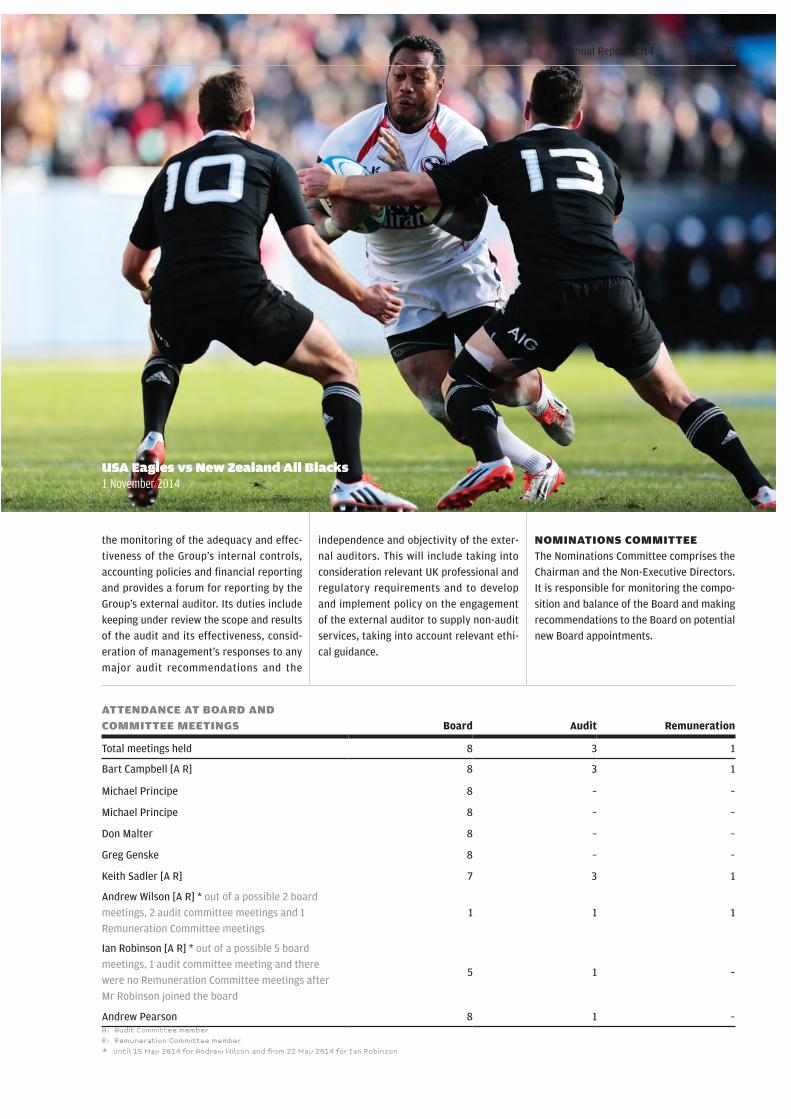
ATTENDANCE AT BOARD AND COMMITTEE MEETINGS Board Audit Remuneration
Total meetings held 8 3 1
Bart Campbell [A R] 8 3 1
Michael Principe 8 – –
Michael Principe 8 – –
Don Malter 8 – –
Greg Genske 8 – –
Keith Sadler [A R] 7 3 1
Andrew Wilson [A R] * out of a possible 2 board
meetings, 2 audit committee meetings and 1
Remuneration Committee meetings
1 1 1
Ian Robinson [A R] * out of a possible 5 board
meetings, 1 audit committee meeting and there
were no Remuneration Committee meetings after
Mr Robinson joined the board
5 1 –
Andrew Pearson 8 1 –A: Audit Committee member
R: Remuneration Committee member
* Until 15 May 2014 for Andrew Wilson and from 22 May 2014 for Ian Robinson
USA Eagles vs New Zealand All Blacks1 November 2014
37Annual Report 2014
Company SecretaryThe Company Secretary is responsible for
advising the Board through the Chairman
on all governance issues. All Directors have
access to the advice and services of the
Company Secretary.
Relationship with shareholdersThe Board recognises the importance of ef-
fective communication with the Company’s
shareholders to ensure that its strategy
and performance is understood and that
it remains accountable to shareholders.
The Company communicates to investors
through Interim Statements, audited Annual
Reports, press releases and the Company’s
website (www.tlaww-plc.com). Shareholders
are welcome to the Company’s AGM (notice
of which is provided with this report) where
they will have the opportunity to meet the
Board. The Company obtains feedback
through its brokers on the views of insti-
tutional investors on a non-attributed and
attributed basis and any concerns of major
shareholders would be communicated to
the Board.
Internal controlThe Board acknowledges its responsibil-
ity for establishing and maintaining the
Group’s internal control and will continue to
ensure that management keeps these pro-
cesses under regular review and improves
them where appropriate.
Management structureThere is clearly defined organisational
structure throughout the Group with estab-
lished lines of reporting and delegation of
authority based on job responsibilities and
experience.
Financial reportingMonthly management accounts provide
relevant, reliable, up-to-date financial and
non-financial information to management
and the Board. Annual plans, forecast and
performance targets allow management to
monitor the key business and financial ac-
tivities and the progress towards achieving
objectives. The Board approves the annual
budget.
Monitoring of controlsThe Audit Committee receives reports from
the auditor and assures itself that the in-
ternal control environment of the Group is
operating effectively. There are formal poli-
cies and procedures in place to allow the
Committee to monitor the controls in place
to ensure the integrity and accuracy of the
accounting records and to safeguard the
Group’s assets. Significant capital projects,
acquisitions and disposals require Board
approval.
Going concernThe Directors have reviewed forecasts for
the year ending 31 December 2015 and 31
December 2016. The Directors consider
the forecasts to be prudent and have as-
sessed the impact on the Group’s cash flow,
facilities and headroom within its banking
covenants. Further, the Directors have as-
sessed the future funding requirements of
the Group, including the payment of future
earn-outs, and compared the level of bor-
rowing facilities. Based on this work, the
Directors are satisfied that despite any
unavoidable economic uncertainty, the
Group has adequate resources to continue
in operational existence for the foreseeable
future, being a period of at least 12 months
from the signing of these accounts. For this
reason they continue to adopt the going
concern basis in preparing the financial
statements.
Corporate social responsibilityThe Board recognises the growing aware-
ness of social, environmental and ethical
matters and it endeavours to take into
account the interests of the Group’s stake-
holders including investors, employees,
suppliers and business partners when oper-
ating the business.
EmploymentAt a subsidiary level each individual
Company has established polices which
address key corporate objectives in the
management of employee relations, com-
munications and employee involvement,
training and personal development and
equal opportunity. The Board recognizes its
legal responsibility to ensure the wellbeing,
safety and welfare of its employees and to
maintain a safe and healthy working envi-
ronment for them and for its visitors. Health
and Safety is on the agenda for regular
scheduled plc Board and Operational Board
meetings.
38 TLA Worldwide PLC

Chris MyersCommentator, Fox Sports
DIRECTORS’ RESPONSIBILITIES STATEMENT
Company law requires the Directors to
prepare financial statements for each fi-
nancial year. Under that law the Directors
are required to prepare the Group financial
statements in accordance with International
Financial Reporting Standards (IFRSs) as
adopted by the European Union and Article
4 of the IAS Regulation and have elected to
prepare the parent company financial state-
ments in accordance with United Kingdom
Generally Accepted Accounting Practice
(United Kingdom Accounting Standards and
applicable law). Under company law the
Directors must not approve the accounts
unless they are satisfied that they give a
true and fair view of the state of affairs of
the company and of the profit or loss of the
company for that period.
In preparing the parent company financial
statements, the Directors are required to: w select suitable accounting policies and
then apply them consistently;
w make judgements and accounting esti-
mates that are reasonable and prudent;
w state whether applicable UK Accounting
Standards have been followed, subject
to any material departures disclosed
and explained in the financial state-
ments; and
w prepare the financial statements on the
going concern basis unless it is inappro-
priate to presume that the company will
continue in business.
In preparing the Group financial state-
ments, International Accounting Standard 1
requires that Directors:
w properly select and apply accounting
policies;
w present information, including account-
ing policies, in a manner that provides
relevant, reliable, comparable and un-
derstandable information;
w provide additional disclosures when
compliance with the specific require-
ments in IFRSs are insufficient to en-
able users to understand the impact of
particular transactions, other events
and conditions on the entity's financial
position and financial performance; and
w make an assessment of the company's
ability to continue as a going concern.
The Directors are responsible for keeping
adequate accounting records that are suf-
ficient to show and explain the company’s
transactions and disclose with reasonable
accuracy at any time the financial position
of the company and enable them to ensure
that the financial statements comply with
the Companies Act 2006. They are also re-
sponsible for safeguarding the assets of the
company and hence for taking reasonable
steps for the prevention and detection of
fraud and other irregularities.
Responsibility statementWe confirm that to the best of our
knowledge:
w the financial statements, prepared in ac-
cordance with the relevant financial re-
porting framework, give a true and fair
view of the assets, liabilities, financial
position and profit or loss of the com-
pany and the undertakings included in
the consolidation taken as a whole; and
w the strategic report includes a fair
review of the development and perfor-
mance of the business and the position
of the company and the undertakings
included in the consolidation taken as
a whole, together with a description of
the principal risks and uncertainties that
they face.
Michael Principe,Chief Executive Officer13 April 2015
(by order of the board)
The Directors are responsible for preparing the Annual Report and the financial statements in accordance with applicable law and regulations.
40 TLA Worldwide PLC

INDEPENDENT AUDITOR’S REPORT TO THE MEMBERS OF TLA WORLDWIDE PLC
The financial reporting framework that
has been applied in the preparation of the
Group financial statements is applicable
law and International Financial Reporting
Standards (IFRSs) as adopted by the
European Union. The financial reporting
framework that has been applied in the
preparation of the Parent Company finan-
cial statements is applicable law and United
Kingdom Accounting Standards (United
Kingdom Generally Accepted Accounting
Practice).
This report is made solely to the compa-
ny’s members, as a body, in accordance with
Chapter 3 of Part 16 of the Companies Act
2006. Our audit work has been undertaken
so that we might state to the company’s
members those matters we are required to
state to them in an auditor’s report and for
no other purpose. To the fullest extent per-
mitted by law, we do not accept or assume
responsibility to anyone other than the
company and the company’s members as a
body, for our audit work, for this report, or
for the opinions we have formed.
Respective responsibilities of directors and auditorAs explained more fully in the Directors’
Responsibilities Statement, the Directors
are responsible for the preparation of the
financial statements and for being satis-
fied that they give a true and fair view.
Our responsibility is to audit and express
an opinion on the financial statements
in accordance with applicable law and
International Standards on Auditing (UK
and Ireland). Those standards require us to
comply with the Auditing Practices Board’s
Ethical Standards for Auditors.
Scope of the audit of the financial statementsAn audit involves obtaining evidence about
the amounts and disclosures in the financial
statements sufficient to give reasonable
assurance that the financial statements are
free from material misstatement, whether
caused by fraud or error. This includes an
assessment of: whether the accounting
policies are appropriate to the Group’s
and the parent company’s circumstances
and have been consistently applied and
adequately disclosed; the reasonableness
of significant accounting estimates made by
the Directors; and the overall presentation
Simon Olsen FCA,Senior Statutory Auditorfor and on behalf of Deloitte LLPChartered Accountants and Statutory Auditor, Southampton13 April 2015
We have audited the financial statements of TLA Worldwide PLC for the year ended 31 December 2014, which comprise the Group Income Statement, Group Statement of Comprehensive Income, the Group Balance Sheet, the Group Cash Flow Statement, the Group Statement of Changes in Equity, the related notes to the Group financial statements 1 to 28, the Parent Company Balance Sheet and the related notes to the Parent Company financial statements 1 to 10.
41Annual Report 2014
of the financial statements. In addition,
we read all the financial and non-financial
information in the annual report to identify
material inconsistencies with the audited
financial statements and to identify any
information that is apparently materially
incorrect based on, or materially inconsis-
tent with, the knowledge acquired by us in
the course of performing the audit. If we be-
come aware of any apparent material mis-
statements or inconsistencies we consider
the implications for our report.
Opinion on financial statementsIn our opinion:
w The financial statements give a true and
fair view of the state of the Group’s and
of the Parent Company’s affairs as at 31
December 2014 and of the Group’s profit
for the year then ended;
w The Group financial statements have been
properly prepared in accordance with
IFRSs as adopted by the European Union;
w The Parent Company financial statements
have been properly prepared in accor-
dance with United Kingdom Generally
Accepted Accounting Practice; and
w The financial statements have been pre-
pared in accordance with the require-
ments of the Companies Act 2006.
Opinion on other matter prescribed by the Companies Act 2006In our opinion the information given in the
Strategic Report and the Directors’ Report
for the financial year for which the financial
statements are prepared is consistent with
the financial statements.
Matters on which we are required to report by exceptionWe have nothing to report in respect of the
following matters where the Companies Act
2006 requires us to report to you if, in our
opinion:
w adequate accounting records have not
been kept by the Parent Company, or
returns adequate for our audit have not
been received from branches not visited
by us; or
w the Parent Company financial state-
ments are not in agreement with the
accounting records and returns; or
w certain disclosures of Directors’ remuner-
ation specified by law are not made; or
w we have not received all the informa-
tion and explanations we require for our
audit.
42 TLA Worldwide PLC

GROUP INCOME STATEMENTFor the year ended 31 December 2014
Note
Year ended 31 December 2014
($000)
Year ended 31 December 2013
($000)
Revenue 1 20,816 18,605
Cost of sales (25) (633)
Gross profit 17,972 14,497
Administrative expenses (19,087) (16,538)
Operating profit from operations 1,704 1,434
Headline EBITDA 9,021 7,269
Amortisation of intangibles 4 (4,684) (5,020)
Depreciation 4 (60) (33)
Exceptional and acquisition-related costs 4 (1,151) (782)
Share-based payments 4 (1,422) –
Operating profit from operations 1,704 1,434
Finance costs 2 (1,285) (1,384)
Profit before taxation 4 419 50
Taxation 8 (402) 923
Profit for the year from continuing operations attributable to the equity holders in the Company
17 973
Profit per share from continuing operations:
Basic (cents) 3 0.01 0.77
Diluted (cents) 3 0.01 0.77
43Annual Report 2014
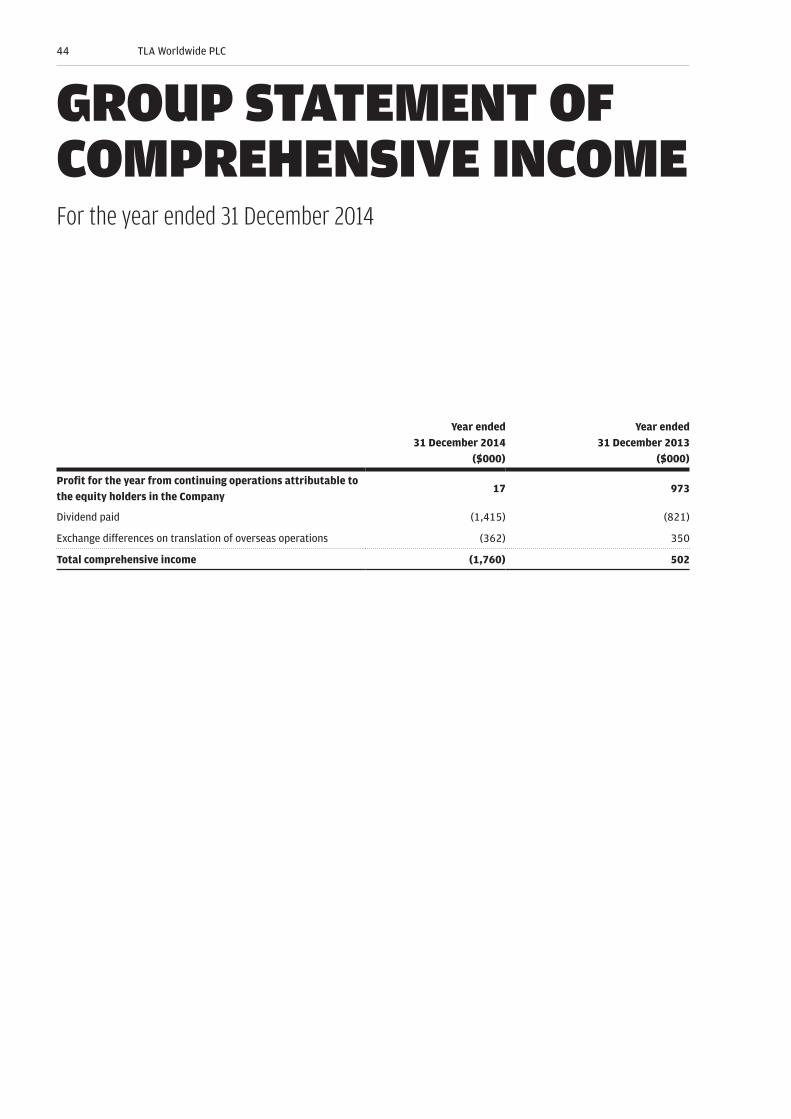
GROUP STATEMENT OF COMPREHENSIVE INCOMEFor the year ended 31 December 2014
Year ended 31 December 2014
($000)
Year ended 31 December 2013
($000)
Profit for the year from continuing operations attributable to the equity holders in the Company
17 973
Dividend paid (1,415) (821)
Exchange differences on translation of overseas operations (362) 350
Total comprehensive income (1,760) 502
44 TLA Worldwide PLC
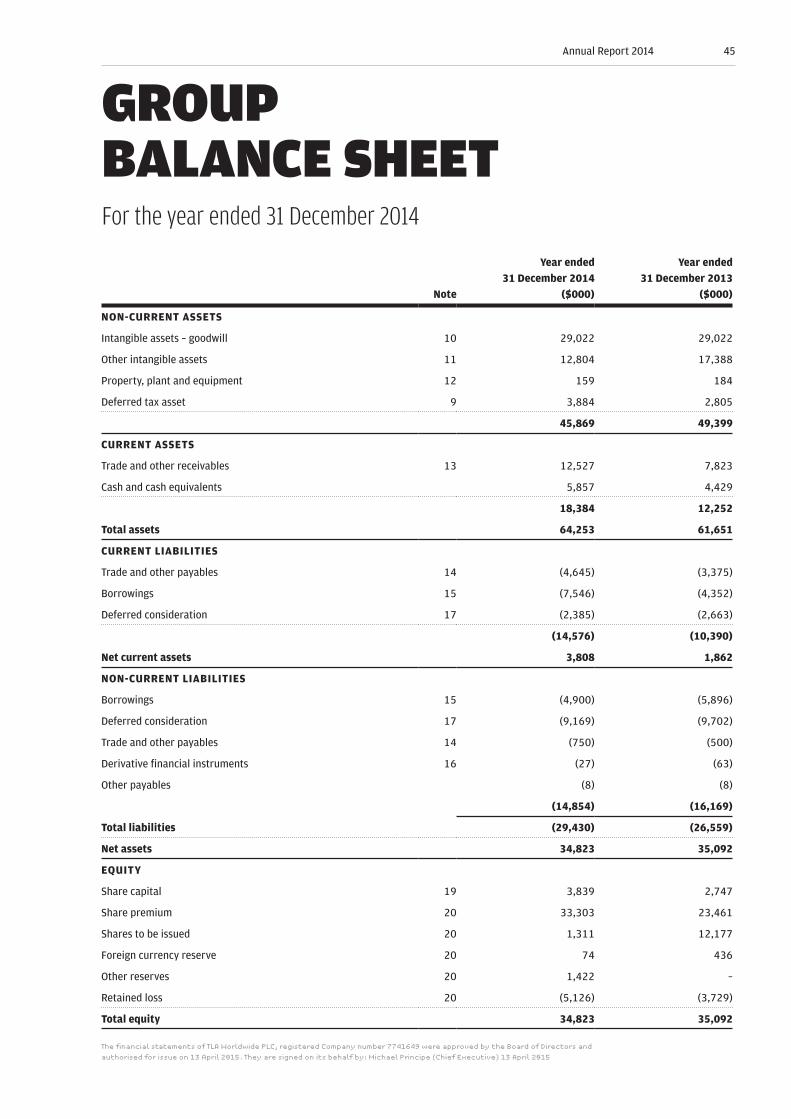
GROUP BALANCE SHEETFor the year ended 31 December 2014
Note
Year ended 31 December 2014
($000)
Year ended 31 December 2013
($000)
NON-CURRENT ASSETS
Intangible assets – goodwill 10 29,022 29,022
Other intangible assets 11 12,804 17,388
Property, plant and equipment 12 159 184
Deferred tax asset 9 3,884 2,805
45,869 49,399
CURRENT ASSETS
Trade and other receivables 13 12,527 7,823
Cash and cash equivalents 5,857 4,429
18,384 12,252
Total assets 64,253 61,651
CURRENT LIABILITIES
Trade and other payables 14 (4,645) (3,375)
Borrowings 15 (7,546) (4,352)
Deferred consideration 17 (2,385) (2,663)
(14,576) (10,390)
Net current assets 3,808 1,862
NON-CURRENT LIABILITIES
Borrowings 15 (4,900) (5,896)
Deferred consideration 17 (9,169) (9,702)
Trade and other payables 14 (750) (500)
Derivative financial instruments 16 (27) (63)
Other payables (8) (8)
(14,854) (16,169)
Total liabilities (29,430) (26,559)
Net assets 34,823 35,092
EQUITY
Share capital 19 3,839 2,747
Share premium 20 33,303 23,461
Shares to be issued 20 1,311 12,177
Foreign currency reserve 20 74 436
Other reserves 20 1,422 –
Retained loss 20 (5,126) (3,729)
Total equity 34,823 35,092
The financial statements of TLA Worldwide PLC, registered Company number 7741649 were approved by the Board of Directors and
authorised for issue on 13 April 2015. They are signed on its behalf by: Michael Principe (Chief Executive) 13 April 2015
45Annual Report 2014
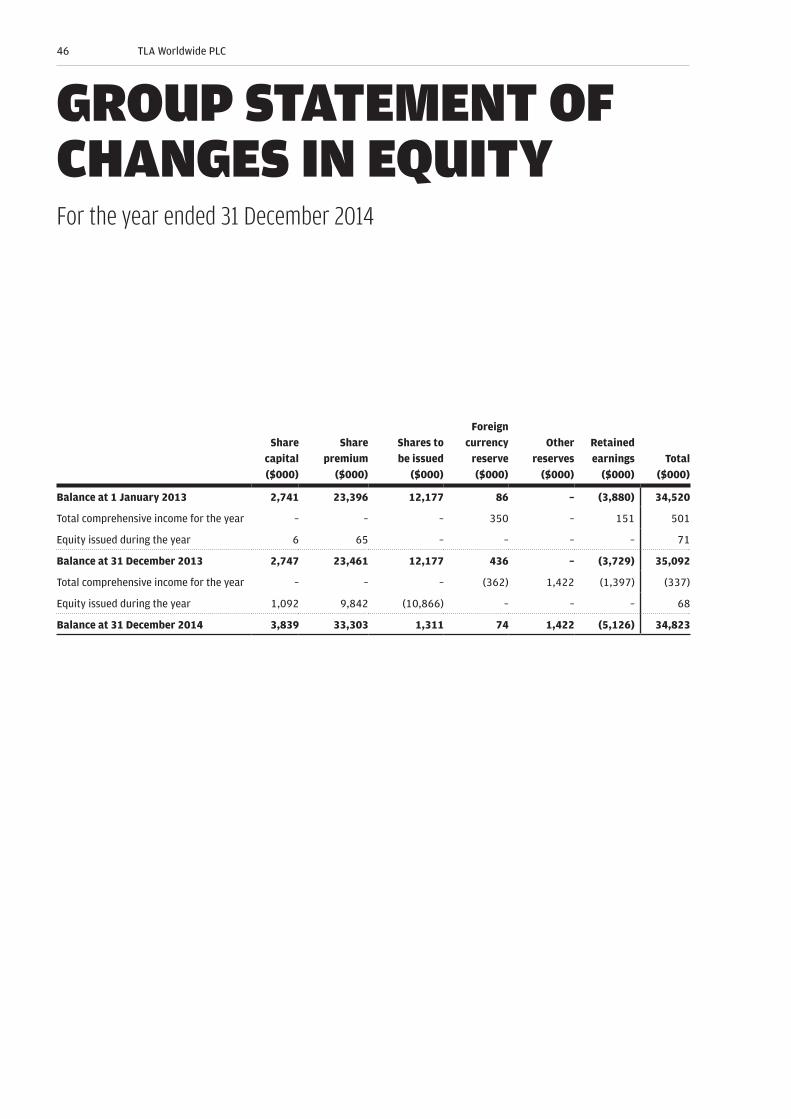
GROUP STATEMENT OF CHANGES IN EQUITYFor the year ended 31 December 2014
Share capital ($000)
Share premium
($000)
Shares to be issued
($000)
Foreign currency
reserve ($000)
Other reserves
($000)
Retained earnings
($000)Total
($000)
Balance at 1 January 2013 2,741 23,396 12,177 86 – (3,880) 34,520
Total comprehensive income for the year – – – 350 – 151 501
Equity issued during the year 6 65 – – – – 71
Balance at 31 December 2013 2,747 23,461 12,177 436 – (3,729) 35,092
Total comprehensive income for the year – – – (362) 1,422 (1,397) (337)
Equity issued during the year 1,092 9,842 (10,866) – – – 68
Balance at 31 December 2014 3,839 33,303 1,311 74 1,422 (5,126) 34,823
46 TLA Worldwide PLC
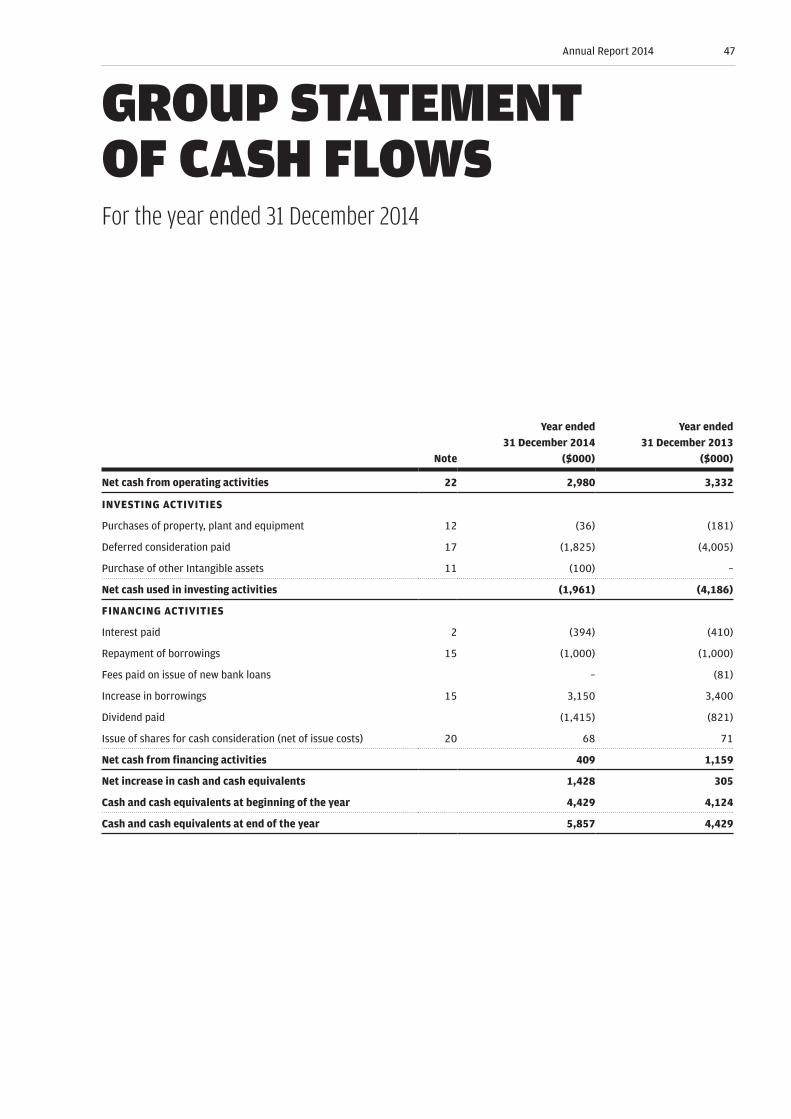
GROUP STATEMENT OF CASH FLOWSFor the year ended 31 December 2014
Note
Year ended 31 December 2014
($000)
Year ended 31 December 2013
($000)
Net cash from operating activities 22 2,980 3,332
INVESTING ACTIVITIES
Purchases of property, plant and equipment 12 (36) (181)
Deferred consideration paid 17 (1,825) (4,005)
Purchase of other Intangible assets 11 (100) –
Net cash used in investing activities (1,961) (4,186)
FINANCING ACTIVITIES
Interest paid 2 (394) (410)
Repayment of borrowings 15 (1,000) (1,000)
Fees paid on issue of new bank loans – (81)
Increase in borrowings 15 3,150 3,400
Dividend paid (1,415) (821)
Issue of shares for cash consideration (net of issue costs) 20 68 71
Net cash from financing activities 409 1,159
Net increase in cash and cash equivalents 1,428 305
Cash and cash equivalents at beginning of the year 4,429 4,124
Cash and cash equivalents at end of the year 5,857 4,429
47Annual Report 2014
PRINCIPAL ACCOUNTING POLICIES
General informationTLA Worldwide PLC (the “Company”) is
incorporated in the United Kingdom under
the Companies Act. The Company and its
subsidiaries' (together the “Group”) princi-
pal activities are set out as part of the busi-
ness review on pages 7 to 11. These financial
statements are presented in US dollars
because that is the currency of the primary
economic environment in which the Group
operates.
ADOPTION OF NEW AND REVISED STANDARDSIn the current year, the following new and
revised standard and interpretations have
been adopted: w Amendments to IAS 36: Recoverable
Amount Disclosures for Non-Financial
Assets
w Amendments to IAS 32: Offsetting finan-
cial assets and financial liabilities
None of the new or revised standards that
have been adopted affected the amounts
reported in the financial statements. At
the date of authorisation of these financial
statements the Group had not applied the
following new and revised IFRSs that have
been issued but are not yet effective: w IFRS 9: Financial Instruments
w IFRS 15: Revenue from Contracts with
Customers
w Amendments to IFRS 11: Accounting
for Acquisitions of Interests in Joint
Operations
w Amendments to IAS 16 and IAS 38:
Clarification of Acceptable Methods of
Depreciation
w Amendments to IAS 19: Defined Benefit
Plans: Employee Contributions
w Amendments to IAS 27: Equity Method in
Separate Financial Statements
w Annual Improvements to IFRSs:
2010–2012
w Amendments to: IFRS 2 Share-based
Payment, IFRS 3 Business Combinations,
IFRS 8 Operating Statements, IFRS
13 Fair Value Measurement, IAS 16
Property, Plant and Equipment, IAS 24
Related Party Disclosures and IAS 38
Intangible Assets.
w Annual Improvements to IFRSs:
2012–2014 Amendments to: IFRS
5 Non-current Assets Held for Sale
and Discontinued Operations, IFRS 7
Financial Instruments: Disclosures, IAS
19 Employee Benefits and IAS 34 Interim
Financial Reporting
The Directors have not assessed whether
the effect of the adoption of the Standards
and Interpretations listed above will have a
material impact on the financial statements
of the Group in future periods. Beyond the
information above, it is not practicable to
provide a reasonable estimate of the effect
of these standards until a detailed review
has been completed.
The accounting policies set out below
have, unless otherwise stated, been ap-
plied consistently to all periods presented
in these consolidated financial statements.
Judgements made by the Directors in the
application of these accounting policies
that have a significant effect on the consoli-
dated financial statements together with
estimates with significant risk of material
adjustment in the next year are discussed
in note 25.
Going concernThe Directors have reviewed forecasts for
the year ending 31 December 2015 and 31
December 2016. The Directors consider
the forecasts to be prudent and have as-
sessed the impact on the Group’s cash flow,
facilities and headroom within its banking
covenants. Further, the Directors have as-
sessed the future funding requirements of
the Group, including the payment of future
earn-outs, and compared the level of bor-
rowing facilities. Based on this work, the
Directors are satisfied that despite any
unavoidable economic uncertainty, the
Group has adequate resources to continue
in operational existence for the foreseeable
future, being a period of at least 12 months
from the signing of these accounts. For this
reason they continue to adopt the going
concern basis in preparing the financial
statements.
Basis of accountingThe financial statements have been pre-
pared in accordance with International
Financial Reporting Standards (IFRS). The
financial statements have also been pre-
pared in accordance with IFRSs adopted
by the European Union and therefore the
Group financial statements comply with
Article 4 of the EU IAS regulation.
The financial statements have been
prepared on the historical cost basis except
for the revaluation of financial instruments.
Historical cost is generally based on the
fair value of the consideration given in
48 TLA Worldwide PLC
exchange for the assets. The principal ac-
counting policies are set out below.
Basis of consolidationThe consolidated financial statements in-
corporate the financial statements of the
Company and entities controlled by the
Company (its subsidiaries) made up to 31
December each year. Control is achieved
where the Company has the power to gov-
ern the financial and operating policies of
an investee entity so as to obtain benefits
from its activities.
On acquisition, the assets and liabilities
and contingent liabilities of a subsidiary are
measured at their fair values at the date of
acquisition. Any excess of the cost of acqui-
sition over the fair values of the identifiable
net assets acquired is recognised as good-
will. Any deficiency of the cost of acquisition
below the fair values of the identifiable net
assets acquired (i.e. discount on acquisition)
is credited to the income statement in the
period of acquisition.
The results of subsidiaries acquired or
disposed of during the year are included in
the Consolidated Income Statement from
the effective date of acquisition or up to the
effective date of disposal, as appropriate.
Where necessary, adjustments are made
to the financial statements of subsidiaries
to bring the accounting policies used into
line with those used by the Group. All intra-
group transactions, balances, income and
expenses are eliminated on consolidation.
Business combinationsAcquisitions of subsidiaries and businesses
are accounted for using the acquisition
method. The consideration for each acqui-
sition is measured at the aggregate of the
fair values (at the date of exchange) of as-
sets given, liabilities incurred or assumed,
and equity instruments issued by the Group
in exchange for control of the acquiree.
Acquisition-related costs are recognised in
profit or loss as incurred.
Where applicable, the consideration
for the acquisition includes any asset or
liability resulting from a contingent con-
sideration arrangement, measured at its
acquisition-date fair value. Subsequent
changes in such fair values are adjusted
against the cost of acquisition where they
qualify as measurement period adjustments
(see below). All other subsequent changes
in the fair value of contingent consider-
ation classified as an asset or liability are
accounted for in accordance with relevant
IFRSs. Changes in the fair value of contin-
gent consideration classified as equity are
not recognised.
Where a business combination is
achieved in stages, the Group’s previously
held interests in the acquired entity are
re-measured to fair value at the acquisition
date (i.e. the date the Group attains control)
and the resulting gain or loss, if any, is rec-
ognised in profit or loss.
Amounts arising from interests in the
acquiree prior to the acquisition date that
have previously been recognised in other
comprehensive income are reclassified to
Income Statement, where such treatment
would be appropriate if that interest were
disposed of.
The acquiree’ s identifiable assets, li-
abilities and contingent liabilities that meet
the conditions for recognition under IFRS
3(2008) are recognised at their fair value at
the acquisition date, except that: w deferred tax assets or liabilities and li-
abilities or assets related to employee
benefit arrangements are recognised
and measured in accordance with IAS
12 Income Taxes and IAS 19 Employee
Benefits respectively;
w liabilities or equity instruments related
to the replacement by the Group of an
acquiree’ s share-based payment awards
are measured in accordance with IFRS 2
Share-based Payment; and
w assets (or disposal groups) that are clas-
sified as held for sale in accordance with
IFRS 5 Non-current Assets Held for Sale
and Discontinued Operations are mea-
sured in accordance with that Standard.
If the initial accounting for a business com-
bination is incomplete by the end of the re-
porting period in which the combination oc-
curs, the Group reports provisional amounts
for the items for which the accounting is
incomplete. Those provisional amounts are
adjusted during the measurement period
(see below), or additional assets or liabili-
ties are recognised, to reflect new informa-
tion obtained about facts and circumstances
that existed as of the acquisition date that,
if known, would have affected the amounts
recognised as of that date.
The measurement period is the period
from the date of acquisition to the date the
Group obtains complete information about
facts and circumstances that existed as
of the acquisition date, and is subject to a
maximum of one year.
RevenueRevenue is measured as the fair value of
the consideration received or receivable
and comprises amounts billed to clients in
respect of fees earned and commission-
based income fees earned from the provi-
sion of support services to other agents or
events promoters (and is stated exclusive of
any relevant sales taxes); and the revenue
or the share of revenues on events where
the Group is a promoter. Revenue is recog-
nised in line with the provision of relevant
services under the terms of the contract
or in the case of events, once the event
has occurred provided that it is probable
that the economic benefits will flow to the
Group and the amount of revenue can be
measured reliably.
Revenue can be split into five revenue
streams:
1. REPRESENTATION REVENUERepresentation revenue is generated from
a commission paid as a percentage of a
player’s base salary. Base salaries are fees
payable by baseball clubs to their players.
These fees are contractual obligations made
by the club to pay the player for a specific
number of seasons.
Contractual arrangements are reviewed
to ascertain whether the Group acts as prin-
cipal or agent with regards to third-party
costs. If the relationship is that of agent
then the recharge of third-party costs is not
recognised through revenue or cost of sales.
Revenue is recognised at the point the
player becomes contractually obliged to pay
commission to the Group.
2. SIGNING BONUSESSigning bonuses are amounts payable
by the clubs to the player for signing a
contract. The Group earns a commission
based on a percentage of the signing bonus.
Commission revenue is recognised when the
player receives the signing bonus from the
relevant baseball club, at which point the
player becomes contractually obliged to pay
commission to the Group.
3. ENDORSEMENT REVENUEEndorsement revenue is generated from
commission calculated as a percentage of
fees earned by clients for guest appear-
ances, wearing of certain attire or other
sponsorship deals. Revenue is recognised
in the period that the associated fees are
earned by the player.
49Annual Report 2014
4. SPONSORSHIP REVENUESponsorship revenue is generated from
commission calculated as a percentage of
fees earned by placing sponsors for certain
events. Revenue is recognised based on the
terms of the individual contracts, at the
point the commission becomes contractu-
ally due.
5. EVENT REVENUEEvent revenues are generated where the
Group acts a promoter for an individual
event or group of events. Revenue is rec-
ognised upon completion of the event, as
this is the point when the Group becomes
entitled to the revenue generated from that
event.
Cost of salesCost of sales includes commission-based
staff costs, including salaries, bonuses and
social security costs, and expenses reim-
bursed to commission-based agents.
Property, plant and equipmentThe fixtures and fittings are stated at cost.
Depreciation is computed on the straight-
line method using an estimated useful life
ranging from three to five years. Repairs
and maintenance are charged as an ex-
pense in the year incurred, and major im-
provements and new assets are capitalized.
It is assumed that all assets will be used
until the end of their useful life.
Intangible assets and goodwillGoodwill arising in a business combination
is recognised as an asset at the date that
control is acquired (the acquisition date).
Goodwill is measured as the excess of the
sum of the consideration transferred, the
amount of any non-controlling interest
in the acquiree and the fair value of the
acquirer’s previously held equity interest
(if any) in the entity over the net of the
acquisition date amounts of the identifiable
assets acquired and the liabilities assumed.
If, after reassessment, the Group’s inter-
est in the fair value of the acquiree’s iden-
tifiable net assets exceeds the sum of the
consideration transferred, the amount of
any non-controlling interest in the acquiree
and the fair value of the acquirer’s previ-
ously held equity interest in the acquiree (if
any), the excess is recognised immediately
in profit or loss as a bargain purchase gain.
Goodwill is not amortised but is re-
viewed for impairment at least annually. For
the purpose of impairment testing, goodwill
is allocated to each of the Group’s cash-
generating units expected to benefit from
the synergies of the combination. Cash-
generating units to which goodwill has been
allocated are tested for impairment annu-
ally, or more frequently when there is an
indication that the unit may be impaired. If
the recoverable amount of the cash-gener-
ating unit is less than the carrying amount
of the unit, the impairment loss is allocated
first to reduce the carrying amount of any
goodwill allocated to the unit and then to
the other assets of the unit pro-rata on the
basis of the carrying amount of each asset
in the unit. An impairment loss recognised
for goodwill is not reversed in a subsequent
period.
On disposal of a subsidiary, the attrib-
utable amount of goodwill is included in
the determination of the profit or loss on
disposal.
Intangible assets arising from a business
combination whose fair values can be reli-
ably measure are separated from goodwill
and amortised based on the future cash
flows attributable to the individual assets
Intangible assets with an indefinite
useful life and goodwill are systemati-
cally tested for impairment at each balance
sheet date. Other intangibles assets are
amortised from the date they are available
for use. The estimated useful lives are as
follows: w Client contracts: over the life of the
contract
w Customer relationships: 6–8 years
IMPAIRMENTFor goodwill that has an indefinite useful
life the recoverable amount is estimated
annually. For other assets the recoverable
amount is only estimated when there is
an indication that impairment may have
occurred. The recoverable amount is the
higher of fair value less costs to sell and
value in use.
TAXATIONThe tax expense represents the sum of the
tax currently payable and deferred tax.
The tax currently payable is based on
taxable profit for the year. Taxable profit
differs from net profit as reported in the
income statement because it excludes
items of income or expense that are taxable
or deductible in other years and it further
excludes items that are never taxable or
deductible. The Group’s liability for current
tax is calculated using tax rates that have
been enacted or substantively enacted by
the balance sheet date.
Deferred tax is the tax expected to be
payable or recoverable on differences be-
tween the carrying amounts of assets and
liabilities in the financial statements and
the corresponding tax bases used in the
computation of taxable profit, and is ac-
counted for using the balance sheet liability
method. Deferred tax liabilities are gener-
ally recognised for all taxable temporary
differences and deferred tax assets are
recognised to the extent that it is probable
that taxable profits will be available against
which deductible temporary differences can
be utilised. Such assets and liabilities are
not recognised if the temporary difference
arises from the initial recognition of good-
will or from the initial recognition (other
than in a business combination) of other
assets and liabilities in a transaction that
affects neither the taxable profit nor the
accounting profit.
Deferred tax liabilities are recognised
for taxable temporary differences arising
on investments in subsidiaries and associ-
ates, and interests in joint ventures, except
where the Group is able to control the re-
versal of the temporary difference and it
is probable that the temporary difference
will not reverse in the foreseeable future.
The carrying amount of deferred tax assets
is reviewed at each balance sheet date and
reduced to the extent that it is no longer
probable that sufficient taxable profits will
be available to allow all or part of the asset
to be recovered.
Deferred tax is calculated at the tax
rates that are expected to apply in the pe-
riod when the liability is settled or the asset
is realised. Deferred tax is charged or cred-
ited in the income statement, except when
it relates to items charged or credited di-
rectly to equity, in which case the deferred
tax is also dealt with in equity.
Deferred tax assets and liabilities are
offset when there is a legally enforceable
right to set off current tax assets against
current tax liabilities and when they relate
to income taxes levied by the same taxation
authority and the Group intends to settle its
current tax assets and liabilities on a net
basis.
50 TLA Worldwide PLC
Foreign currenciesThe individual financial statements of each
group company are presented in the cur-
rency of the primary economic environ-
ment in which it operates (its functional
currency). For the purpose of the consoli-
dated financial statements, the results and
financial position of each group company
are expressed in US dollars which is the
presentation currency for the consolidated
financial statements.
In preparing the financial statements of
the individual companies, transactions in
currencies other than the entity’s functional
currency (foreign currencies) are recog-
nised at the rates of exchange prevailing
on the dates of the transactions. At each
balance sheet date, monetary assets and
liabilities that are denominated in foreign
currencies are retranslated at the rates
prevailing at that date. Non-monetary items
carried at fair value that are denominated
in foreign currencies are translated at the
rates prevailing at the date when the fair
value was determined.
Non-monetary items that are measured
in terms of historical cost in a foreign cur-
rency are not retranslated.
Exchange differences are recognised
in the Income Statement in the period in
which they arise except for: w exchange differences on foreign curren-
cy borrowings relating to assets under
construction for future productive use,
which are included in the cost of those
assets when they are regarded as an
adjustment to interest costs on those
foreign currency borrowings;
w exchange differences on monetary items
receivable from or payable to a foreign
operation for which settlement is nei-
ther planned nor likely to occur (there-
fore forming part of the net investment
in the foreign operation), which are rec-
ognised initially in other comprehensive
income and reclassified from equity to
Income Statement on disposal or partial
disposal of the net investment.
For the purpose of presenting consolidated
financial statements, the assets and liabili-
ties of the Group’s foreign operations are
translated at exchange rates prevailing on
the balance sheet date. Translation differ-
ences on non-monetary financial assets and
liabilities are reported as part of the fair
value gain or loss. Translation differences
on non-monetary financial assets, such as
investments in equity securities classified
as available for sale, are included in the fair
value reserve in equity.
Goodwill and fair value adjustments
arising on the acquisition of a foreign entity
are treated as assets and liabilities of the
foreign entity and translated at the closing
rate.
Bank borrowingsInterest bearing bank loans and overdrafts
are recorded at an amount and the amount
of the proceeds received net of direct issue
costs. Finance charges, including premiums
payable on settlement or redemption and
direct issue costs, are accounted for on an
accruals basis in the consolidated income
statement using the effective interest rate
method and are added to the carrying
amount of the instrument to the extent that
they are not settled in the period in which
they arose.
Finance costsFinance costs of financial liabilities are rec-
ognised in the income statement over the
term of such instruments at a constant rate
of the carrying amount.
Operating leasesLeases where substantially all of the risks
and rewards of ownership are not trans-
ferred to the Group are treated as operat-
ing leases. Rentals under operating leases
are charged to the income statement on a
straight line basis over the period of the
lease.
Cash and cash equivalentsCash and cash equivalents comprise cash
on hand and demand deposits and other
short-term highly liquid investments that
are readily convertible to a known amount
of cash and are subject to an insignificant
risk of changes in value.
Financial instrumentsFinancial assets and financial liabilities are
recognised in the Group’s balance sheet
when the Group becomes a party to the
contractual provisions of the instrument.
FINANCIAL ASSETSAll financial assets are recognised and
derecognised on a trade date where the
purchase or sale of a financial asset is under
a contract whose terms require delivery of
the financial asset within the timeframe
established by the market concerned, and
are initially measured at fair value, plus
transaction costs, except for those financial
assets classified as at fair value through
profit or loss, which are initially measured
at fair value.
Financial assets are classified into the
following specified categories: financial
assets ‘at fair value through profit or loss’
(FVTPL), ‘held-to-maturity’ investments,
‘available-for-sale’ (AFS) financial assets
and ‘loans and receivables’. The classifica-
tion depends on the nature and purpose of
the financial assets and is determined at the
time of initial recognition.
LOANS AND RECEIVABLESTrade receivables, loans, and other re-
ceivables that have fixed or determinable
payments that are not quoted in an active
market are classified as ‘loans and receiv-
ables’. Loans and receivables are measured
at amortised cost using the effective inter-
est method, less any impairment. Interest
income is recognised by applying the ef-
fective interest rate, except for short-term
receivables when the recognition of interest
would be immaterial.
IMPAIRMENT OF FINANCIAL ASSETSFinancial assets, other than those at FVTPL,
are assessed for indicators of impairment
at each balance sheet date. Financial as-
sets are impaired where there is objective
evidence that, as a result of one or more
events that occurred after the initial recog-
nition of the financial asset, the estimated
future cash flows of the investment have
been affected.
For listed and unlisted equity invest-
ments classified as AFS, a significant or
prolonged decline in the fair value of the
security below its cost is considered to be
objective evidence of impairment.
For all other financial assets, including redeemable notes classified as AFS and fi-
nance lease receivables, objective evidence
of impairment could include:
w significant financial difficulty of the is-
suer or counterparty; or
w default or delinquency in interest or
principal payments; or
w it becoming probable that the bor-
rower will enter bankruptcy or financial
re-organisation.
51Annual Report 2014
For certain categories of financial asset,
such as trade receivables, assets that are
assessed not to be impaired individually
are, in addition, assessed for impairment
on a collective basis. Objective evidence of
impairment for a portfolio of receivables
could include the Group’s past experi-
ence of collecting payments, an increase
in the number of delayed payments in the
portfolio past the average credit period of
60 days, as well as observable changes in
national or local economic conditions that
correlate with default on receivables.
For financial assets carried at amortised
cost, the amount of the impairment is the
differences between the asset’s carrying
amount and the present value of estimated
future cash flows, discounted at the finan-
cial asset’s original effective interest rate.
The carrying amount of the financial
asset is reduced by the impairment loss di-
rectly for all financial assets with the excep-
tion of trade receivables, where the carry-
ing amount is reduced through the use of an
allowance account. When a trade receivable
is considered uncollectible, it is written off
against the allowance account. Subsequent
recoveries of amounts previously written
off are credited against the allowance ac-
count. Changes in the carrying amount of
the allowance account are recognised in the
Income Statement.
FINANCIAL LIABILITIES AND EQUITYDebt and equity instruments are classified
as either financial liabilities or as equity in
accordance with the substance of the con-
tractual arrangement.
EQUITY INSTRUMENTSAn equity instrument is any contract that
evidences a residual interest in the assets of
an entity after deducting all of its liabilities.
Equity instruments issued by the Group are
recognised at the proceeds received, net of
direct issue costs.
FINANCIAL LIABILITIESFinancial liabilities are classified as either
financial liabilities ‘at FVTPL’ or ‘other fi-
nancial liabilities’.
FINANCIAL LIABILITIES AT FVTPLFinancial liabilities are classified as at FVTPL
when the financial liability is either held for
trading or it is designated as at FVTPL.
A financial liability is classified as held
for trading if: w it has been incurred principally for the
purpose of repurchasing it in the near
term; or
w on initial recognition it is part of a port-
folio of identified financial instruments
that the Group manages together and
has a recent actual pattern of short-
term profit-taking; or
w it is a derivative that is not designated
and effective as a hedging instrument.
A financial liability other than a financial
liability held for trading may be designated
as at FVTPL upon initial recognition if:
w such designation eliminates or sig-
nificantly reduces a measurement or
recognition inconsistency that would
otherwise arise; or
w the financial liability forms part of a
group of financial assets or financial
liabilities or both, which is managed
and its performance is evaluated on a
fair value basis, in accordance with the
Group's documented risk management
or investment strategy, and information
about the grouping is provided inter-
nally on that basis; or w it forms part of a contract containing
one or more embedded derivatives,
and IAS 39 Financial Instruments:
Recognition and Measurement permits
the entire combined contract (asset or
liability) to be designated as at FVTPL.
Financial liabilities at FVTPL are stated at
fair value, with any gains or losses arising
on re-measurement recognised in Income
Statement. The net gain or loss recognised in
Income Statement incorporates any interest
paid on the financial liability and is included
in the ‘other gains and losses’ line item in the
income statement. Fair value is determined
in the manner described in note 26.
OTHER FINANCIAL LIABILITIESOther financial liabilities, including borrow-
ings, are initially measured at fair value, net
of transaction costs.
Other financial liabilities are subsequently
measured at amortised cost using the effec-
tive interest method, with interest expense
recognised on an effective yield basis.
The effective interest method is a
method of calculating the amortised cost of
a financial liability and of allocating interest
expense over the relevant period. The ef-
fective interest rate is the rate that exactly
discounts estimated future cash payments
through the expected life of the financial
liability, or, where appropriate, a shorter
period, to the net carrying amount on initial
recognition.
DERECOGNITION OF FINANCIAL LIABILITIESThe Group derecognises financial li-
abilities when, and only when, the Group’s
obligations are discharged, cancelled or
they expire.
Trade receivablesTrade receivables do not carry any inter-
est and are stated at their nominal value
as reduced by appropriate allowances for
estimated irrecoverable amounts.
Trade payablesTrade payables are not interest-bearing and
are stated at their nominal value.
DERIVATIVE FINANCIAL INSTRUMENTSThe Group entered into an interest rate
swap to manage its exposure to interest
rate risk. Further details of derivative fi-
nancial instruments the Group holds are
disclosed in note 16.
Derivatives are initially recognised at
fair value at the date a derivative contract
is entered into and are subsequently re-
measured to their fair value at each balance
sheet date. The resulting gain or loss is rec-
ognised in Income Statement immediately.
A derivative with a positive fair value
is recognised as a financial asset whereas
a derivative with a negative fair value is
recognised as a financial liability. A deriva-
tive is presented as a non-current asset or
a non-current liability if the remaining
maturity of the instrument is more than 12
months and it is not expected to be realised
or settled within 12 months. Other deriva-
tives are presented as current assets or cur-
rent liabilities.
InvestmentsInvestments are recognised and derecog-
nised on a trade date where a purchase
or sale of an investment is under contract
whose terms require the delivery of the in-
vestment within the timeframe established
by the market concerned, and are initially
measured at cost, including transaction
costs. Investments are classified either
as available for sale, and are measured at
subsequent reporting dates at fair value,
or at amortised cost, where no fair value is
readily determinable.
Gains and losses on available for sale
financial assets arising from changes in
fair value are recognised directly in equity,
until the security is disposed of or is deter-
mined to be impaired, at which time the
52 TLA Worldwide PLC
cumulative gain or loss previously recog-
nised in equity is included in the net profit
or loss for the period.
Share-based paymentsEquity-settled share-based payments to
employees and others providing similar
services are measured at the fair value of
the equity instruments at the grant date.
The fair value excludes the effect of non-
market-based vesting conditions. Details re-
garding the determination of the fair value
of equity-settled share-based transactions
are set out in note 49.
The fair value determined at the grant
date of the equity-settled share-based
payments is expensed on a straight-line
basis over the vesting period, based on the
Group’s estimate of equity instruments that
will eventually vest. At each balance sheet
date, the Group revises its estimate of the
number of equity instruments expected to
vest as a result of the effect of non-market-
based vesting conditions.
The impact of the revision of the origi-
nal estimates, if any, is recognised in profit
or loss such that the cumulative expense
reflects the revised estimate, with a cor-
responding adjustment to equity reserves.
Non-GAAP measuresHeadline EBITDA's, is operating profit be-
fore depreciation, amortisation of acquired
intangible assets, acquisition-related
charges, share-based payment charges and
exceptional items.
We believe this non-GAAP measures
provide shareholders with useful informa-
tion about the Group’s trading performance.
The reconciliation between operating profit
from continuing operations and Headline
EBITDA is shown on the face of the Group
Income Statement.
DIGITAL COMPANION
View the digital version of this
report at www.tlaww-plc.com
53Annual Report 2014


NOTES TO THE CONSOLIDATED FINANCIAL STATEMENTS
1. Segmental analysisThe Group reports its business activities
in two areas: Baseball Representation and
Sports Marketing. Unallocated represents
the Group’s costs as a public company,
along with exceptional items and acquisi-
tion-related costs (see note 4). The Group
derives its revenues in the United States of
America.
Baseball Representation primar-
ily assists the on field activities of baseball
players, including all aspects of a player’s
contract negotiation.
Sports Marketing primarily assists the
off-field activities of athletes; it represents
broadcasters and coaches in respect of
their contract negotiations; manages and
produces events, primarily in sports; and
media consultancy.
All of the Group’s revenue arises through
the rendering of services. In the year ended
31 December 2014, there were no clients
who generated in excess of 10% of total
revenue (2013: none).
56 TLA Worldwide PLC
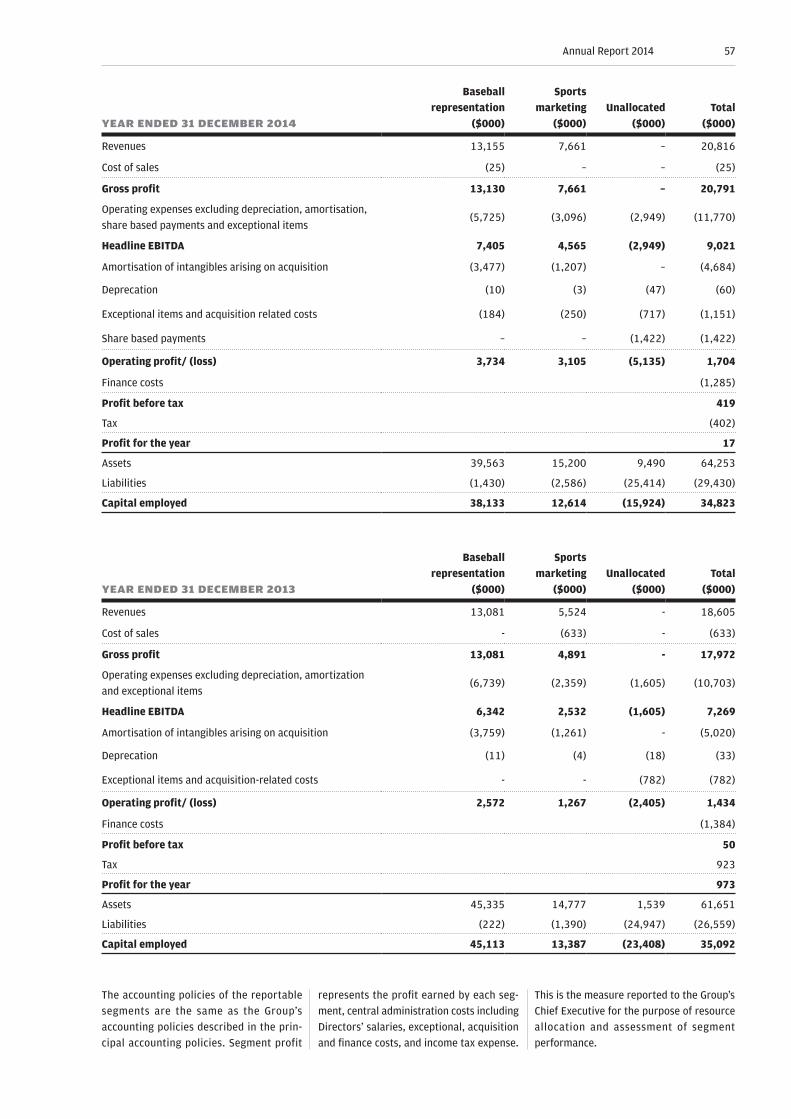
YEAR ENDED 31 DECEMBER 2014
Baseball representation
($000)
Sports marketing
($000)Unallocated
($000)Total
($000)
Revenues 13,155 7,661 – 20,816
Cost of sales (25) – – (25)
Gross profit 13,130 7,661 – 20,791
Operating expenses excluding depreciation, amortisation,
share based payments and exceptional items(5,725) (3,096) (2,949) (11,770)
Headline EBITDA 7,405 4,565 (2,949) 9,021
Amortisation of intangibles arising on acquisition (3,477) (1,207) – (4,684)
Deprecation (10) (3) (47) (60)
Exceptional items and acquisition related costs (184) (250) (717) (1,151)
Share based payments – – (1,422) (1,422)
Operating profit/ (loss) 3,734 3,105 (5,135) 1,704
Finance costs (1,285)
Profit before tax 419
Tax (402)
Profit for the year 17
Assets 39,563 15,200 9,490 64,253
Liabilities (1,430) (2,586) (25,414) (29,430)
Capital employed 38,133 12,614 (15,924) 34,823
YEAR ENDED 31 DECEMBER 2013
Baseball representation
($000)
Sports marketing
($000)Unallocated
($000)Total
($000)
Revenues 13,081 5,524 - 18,605
Cost of sales - (633) - (633)
Gross profit 13,081 4,891 - 17,972
Operating expenses excluding depreciation, amortization
and exceptional items(6,739) (2,359) (1,605) (10,703)
Headline EBITDA 6,342 2,532 (1,605) 7,269
Amortisation of intangibles arising on acquisition (3,759) (1,261) - (5,020)
Deprecation (11) (4) (18) (33)
Exceptional items and acquisition-related costs - - (782) (782)
Operating profit/ (loss) 2,572 1,267 (2,405) 1,434
Finance costs (1,384)
Profit before tax 50
Tax 923
Profit for the year 973
Assets 45,335 14,777 1,539 61,651
Liabilities (222) (1,390) (24,947) (26,559)
Capital employed 45,113 13,387 (23,408) 35,092
The accounting policies of the reportable
segments are the same as the Group’s
accounting policies described in the prin-
cipal accounting policies. Segment profit
represents the profit earned by each seg-
ment, central administration costs including
Directors’ salaries, exceptional, acquisition
and finance costs, and income tax expense.
This is the measure reported to the Group’s
Chief Executive for the purpose of resource
allocation and assessment of segment
performance.
57Annual Report 2014
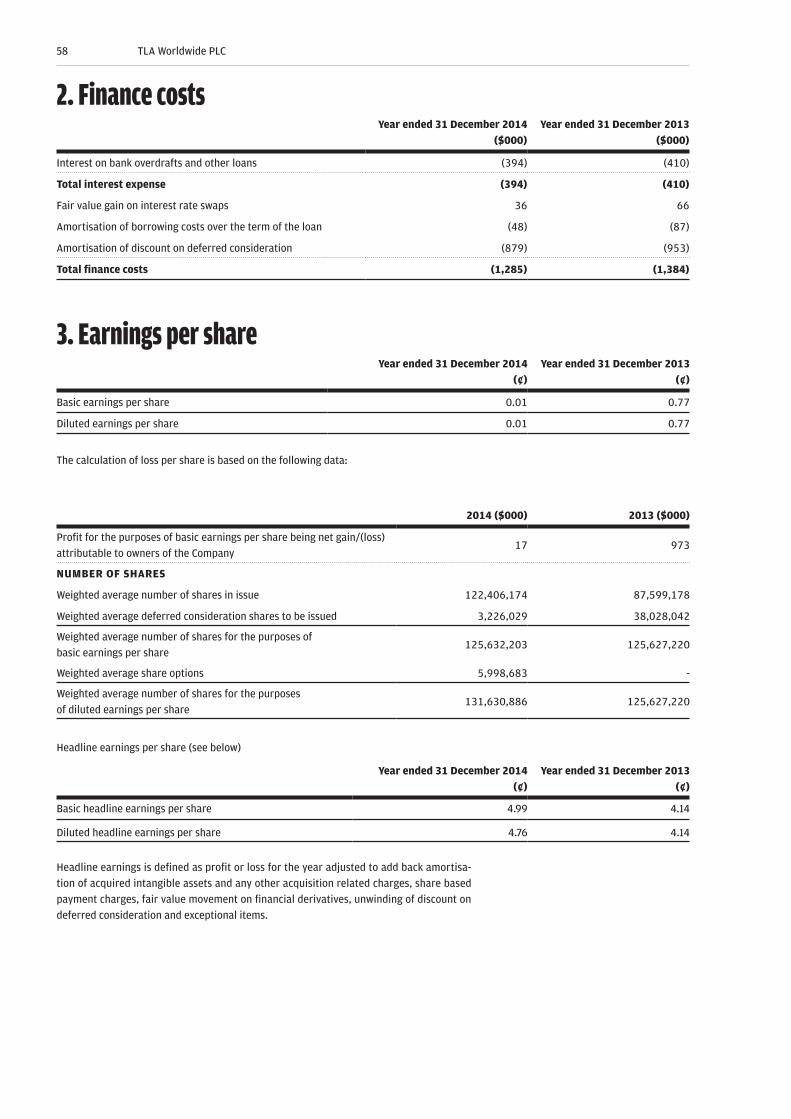
2. Finance costsYear ended 31 December 2014
($000)Year ended 31 December 2013
($000)
Interest on bank overdrafts and other loans (394) (410)
Total interest expense (394) (410)
Fair value gain on interest rate swaps 36 66
Amortisation of borrowing costs over the term of the loan (48) (87)
Amortisation of discount on deferred consideration (879) (953)
Total finance costs (1,285) (1,384)
3. Earnings per shareYear ended 31 December 2014
(¢)Year ended 31 December 2013
(¢)
Basic earnings per share 0.01 0.77
Diluted earnings per share 0.01 0.77
The calculation of loss per share is based on the following data:
2014 ($000) 2013 ($000)
Profit for the purposes of basic earnings per share being net gain/(loss)
attributable to owners of the Company17 973
NUMBER OF SHARES
Weighted average number of shares in issue 122,406,174 87,599,178
Weighted average deferred consideration shares to be issued 3,226,029 38,028,042
Weighted average number of shares for the purposes of
basic earnings per share125,632,203 125,627,220
Weighted average share options 5,998,683 -
Weighted average number of shares for the purposes
of diluted earnings per share131,630,886 125,627,220
Headline earnings per share (see below)
Year ended 31 December 2014 (¢)
Year ended 31 December 2013 (¢)
Basic headline earnings per share 4.99 4.14
Diluted headline earnings per share 4.76 4.14
Headline earnings is defined as profit or loss for the year adjusted to add back amortisa-
tion of acquired intangible assets and any other acquisition related charges, share based
payment charges, fair value movement on financial derivatives, unwinding of discount on
deferred consideration and exceptional items.
58 TLA Worldwide PLC

Year ended 31 December 2014 ($000)
Year ended 31 December 2013 ($000)
Profit attributable to shareholders 17 973
Adjusted for
Exceptional and acquisition-related costs (see note 4) 1,151 782
Share-based payments 1,422 –
Amortisation of acquired intangible assets 4,684 5,020
Fair value gain on interest rate swap (see note 16) (36) (66)
Unwinding of deferred consideration charges 878 952
Tax effect of adjusting items (1,851) (2,458)
Headline profit attributable to owners of the Company 6,265 5,203
The definition of headline profit attributable to owners of the Company has been amended
since the prior year to include the unwinding of deferred consideration charges and the tax
effect of adjusting items.
4. Profit before taxationThe following are included in profit/(loss) before tax:
Year ended 31 December 2014 ($000)
Year ended 31 December 2013 ($000)
Depreciation of property, plant and equipment 60 33
Amortisation of other intangible assets 4,684 5,020
Exceptional and acquisition-related costs (see below) 1,151 782
Staff costs (see note 7) 7,417 6,640
Share-based payments 1,422 –
Auditor’s remuneration (see note 5) 145 141
Operating leases 692 800
The exceptional and acquisition-related costs/(gains) relate to:
Year ended 31 December 2014 ($000)
Year ended 31 December 2013 ($000)
Acquisition related costs 330 –
Integration costs – 1,169
Loyalty bonus arising on acquisition 250 250
Fair value movement on valuation of deferred consideration
(note 17)387 (637)
Arbitration costs 184 –
Total exceptional and acquisition related costs 1,151 782
59Annual Report 2014
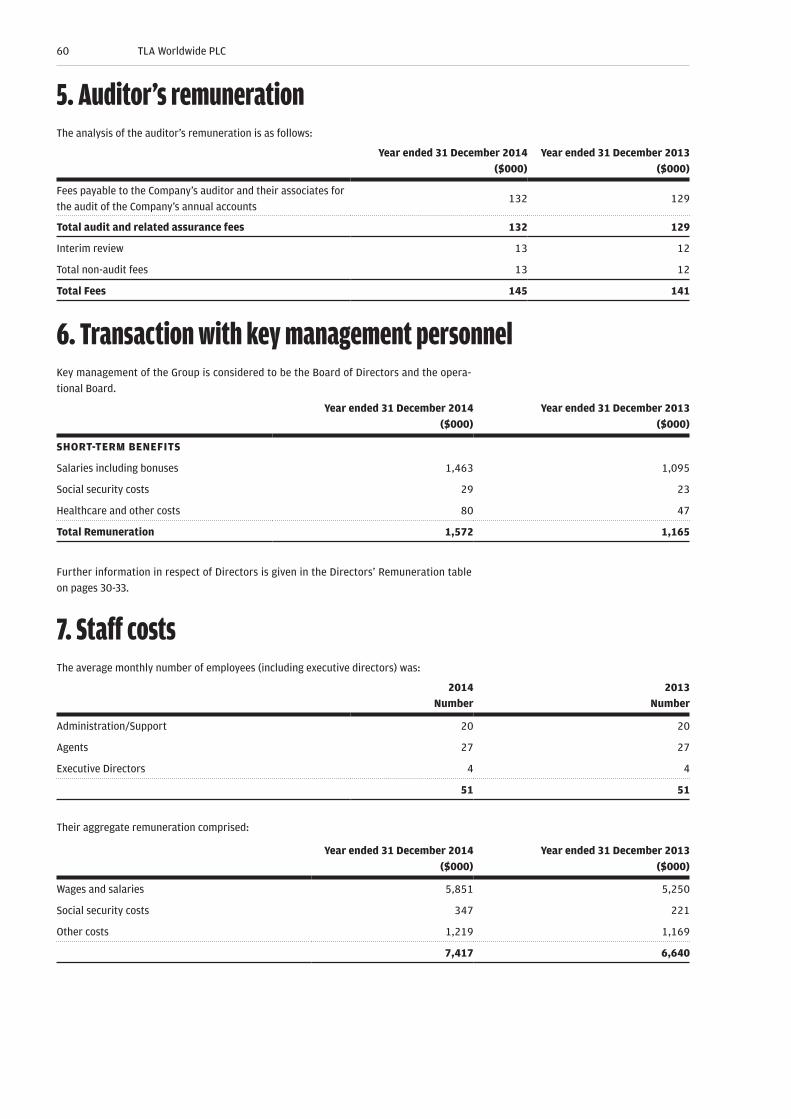
5. Auditor’s remunerationThe analysis of the auditor’s remuneration is as follows:
Year ended 31 December 2014 ($000)
Year ended 31 December 2013 ($000)
Fees payable to the Company’s auditor and their associates for
the audit of the Company’s annual accounts132 129
Total audit and related assurance fees 132 129
Interim review 13 12
Total non-audit fees 13 12
Total Fees 145 141
6. Transaction with key management personnelKey management of the Group is considered to be the Board of Directors and the opera-
tional Board.
Year ended 31 December 2014 ($000)
Year ended 31 December 2013 ($000)
SHORT-TERM BENEFITS
Salaries including bonuses 1,463 1,095
Social security costs 29 23
Healthcare and other costs 80 47
Total Remuneration 1,572 1,165
Further information in respect of Directors is given in the Directors’ Remuneration table
on pages 30-33.
7. Staff costsThe average monthly number of employees (including executive directors) was:
2014 Number
2013 Number
Administration/Support 20 20
Agents 27 27
Executive Directors 4 4
51 51
Their aggregate remuneration comprised:
Year ended 31 December 2014 ($000)
Year ended 31 December 2013 ($000)
Wages and salaries 5,851 5,250
Social security costs 347 221
Other costs 1,219 1,169
7,417 6,640
60 TLA Worldwide PLC
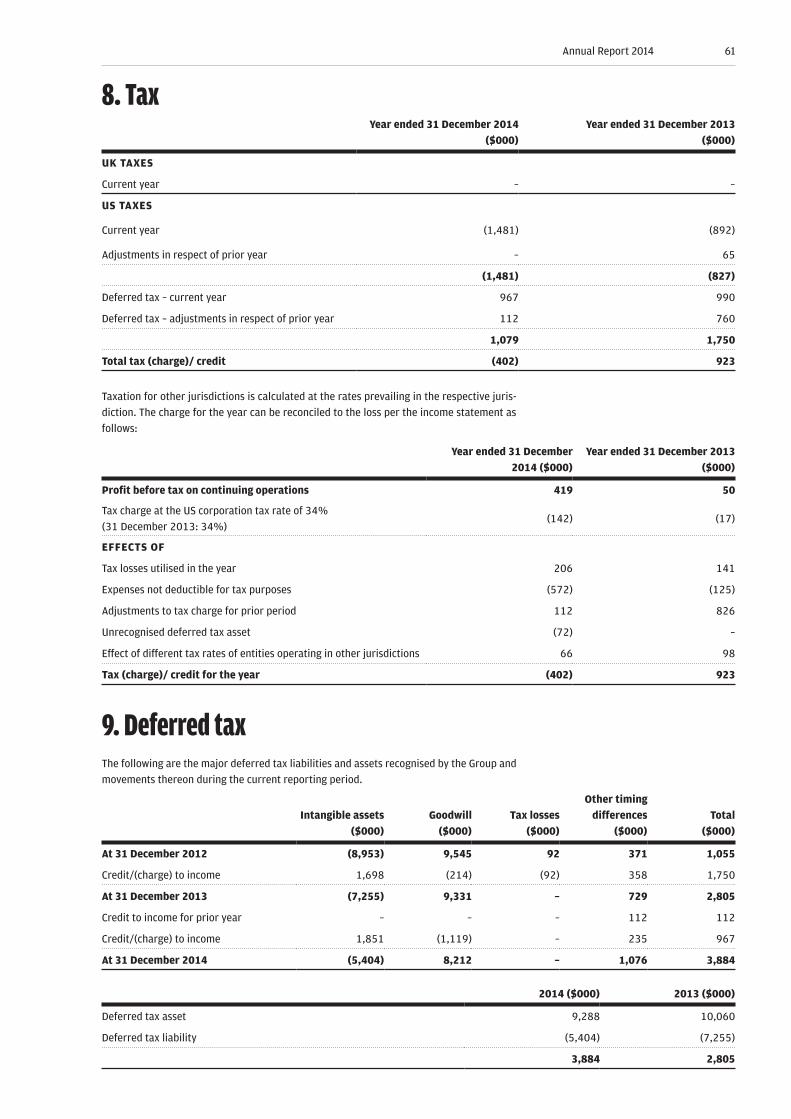
8. TaxYear ended 31 December 2014
($000)Year ended 31 December 2013
($000)
UK TAXES
Current year – –
US TAXES
Current year (1,481) (892)
Adjustments in respect of prior year – 65
(1,481) (827)
Deferred tax – current year 967 990
Deferred tax – adjustments in respect of prior year 112 760
1,079 1,750
Total tax (charge)/ credit (402) 923
Taxation for other jurisdictions is calculated at the rates prevailing in the respective juris-
diction. The charge for the year can be reconciled to the loss per the income statement as
follows:
Year ended 31 December 2014 ($000)
Year ended 31 December 2013 ($000)
Profit before tax on continuing operations 419 50
Tax charge at the US corporation tax rate of 34%
(31 December 2013: 34%)(142) (17)
EFFECTS OF
Tax losses utilised in the year 206 141
Expenses not deductible for tax purposes (572) (125)
Adjustments to tax charge for prior period 112 826
Unrecognised deferred tax asset (72) –
Effect of different tax rates of entities operating in other jurisdictions 66 98
Tax (charge)/ credit for the year (402) 923
9. Deferred taxThe following are the major deferred tax liabilities and assets recognised by the Group and
movements thereon during the current reporting period.
Intangible assets ($000)
Goodwill ($000)
Tax losses ($000)
Other timing differences
($000)Total
($000)
At 31 December 2012 (8,953) 9,545 92 371 1,055
Credit/(charge) to income 1,698 (214) (92) 358 1,750
At 31 December 2013 (7,255) 9,331 – 729 2,805
Credit to income for prior year – – – 112 112
Credit/(charge) to income 1,851 (1,119) – 235 967
At 31 December 2014 (5,404) 8,212 – 1,076 3,884
2014 ($000) 2013 ($000)
Deferred tax asset 9,288 10,060
Deferred tax liability (5,404) (7,255)
3,884 2,805
61Annual Report 2014
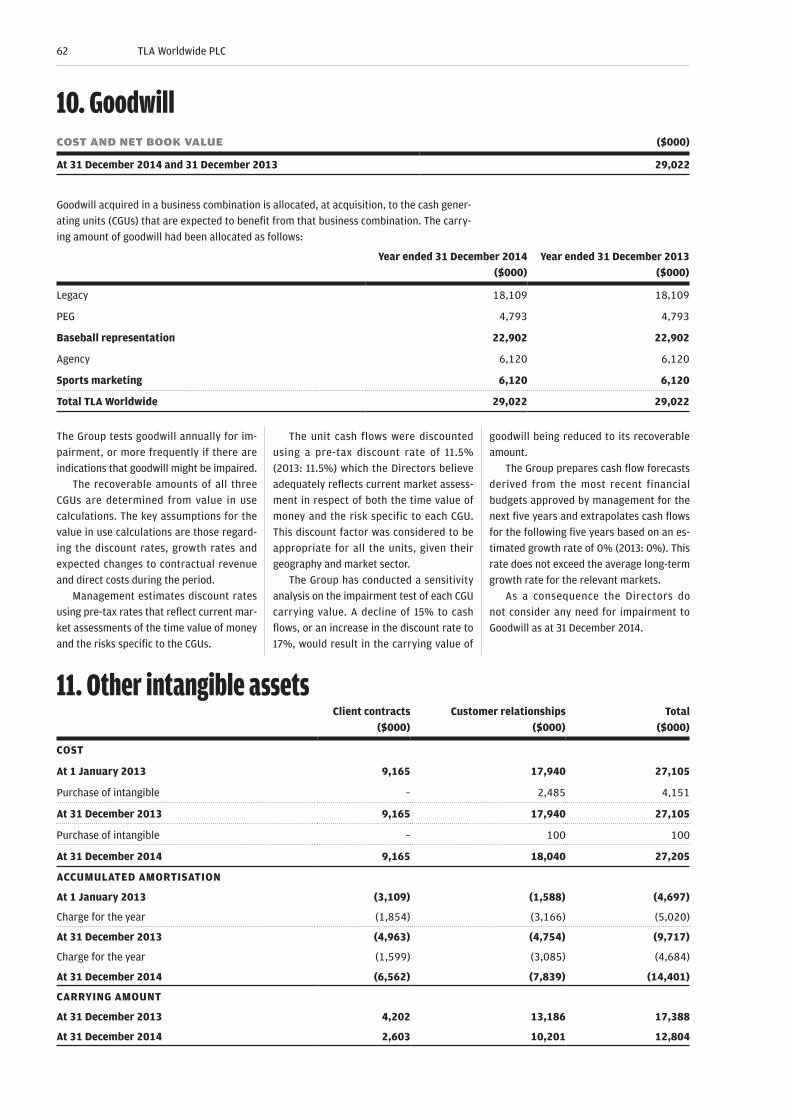
10. GoodwillCOST AND NET BOOK VALUE ($000)
At 31 December 2014 and 31 December 2013 29,022
Goodwill acquired in a business combination is allocated, at acquisition, to the cash gener-
ating units (CGUs) that are expected to benefit from that business combination. The carry-
ing amount of goodwill had been allocated as follows:
Year ended 31 December 2014 ($000)
Year ended 31 December 2013 ($000)
Legacy 18,109 18,109
PEG 4,793 4,793
Baseball representation 22,902 22,902
Agency 6,120 6,120
Sports marketing 6,120 6,120
Total TLA Worldwide 29,022 29,022
The Group tests goodwill annually for im-
pairment, or more frequently if there are
indications that goodwill might be impaired.
The recoverable amounts of all three
CGUs are determined from value in use
calculations. The key assumptions for the
value in use calculations are those regard-
ing the discount rates, growth rates and
expected changes to contractual revenue
and direct costs during the period.
Management estimates discount rates
using pre-tax rates that reflect current mar-
ket assessments of the time value of money
and the risks specific to the CGUs.
The unit cash flows were discounted
using a pre-tax discount rate of 11.5%
(2013: 11.5%) which the Directors believe
adequately reflects current market assess-
ment in respect of both the time value of
money and the risk specific to each CGU.
This discount factor was considered to be
appropriate for all the units, given their
geography and market sector.
The Group has conducted a sensitivity
analysis on the impairment test of each CGU
carrying value. A decline of 15% to cash
flows, or an increase in the discount rate to
17%, would result in the carrying value of
goodwill being reduced to its recoverable
amount.
The Group prepares cash flow forecasts
derived from the most recent financial
budgets approved by management for the
next five years and extrapolates cash flows
for the following five years based on an es-
timated growth rate of 0% (2013: 0%). This
rate does not exceed the average long-term
growth rate for the relevant markets.
As a consequence the Directors do
not consider any need for impairment to
Goodwill as at 31 December 2014.
11. Other intangible assetsClient contracts
($000)Customer relationships
($000)Total
($000)
COST
At 1 January 2013 9,165 17,940 27,105
Purchase of intangible – 2,485 4,151
At 31 December 2013 9,165 17,940 27,105
Purchase of intangible – 100 100
At 31 December 2014 9,165 18,040 27,205
ACCUMULATED AMORTISATION
At 1 January 2013 (3,109) (1,588) (4,697)
Charge for the year (1,854) (3,166) (5,020)
At 31 December 2013 (4,963) (4,754) (9,717)
Charge for the year (1,599) (3,085) (4,684)
At 31 December 2014 (6,562) (7,839) (14,401)
CARRYING AMOUNT
At 31 December 2013 4,202 13,186 17,388
At 31 December 2014 2,603 10,201 12,804
62 TLA Worldwide PLC
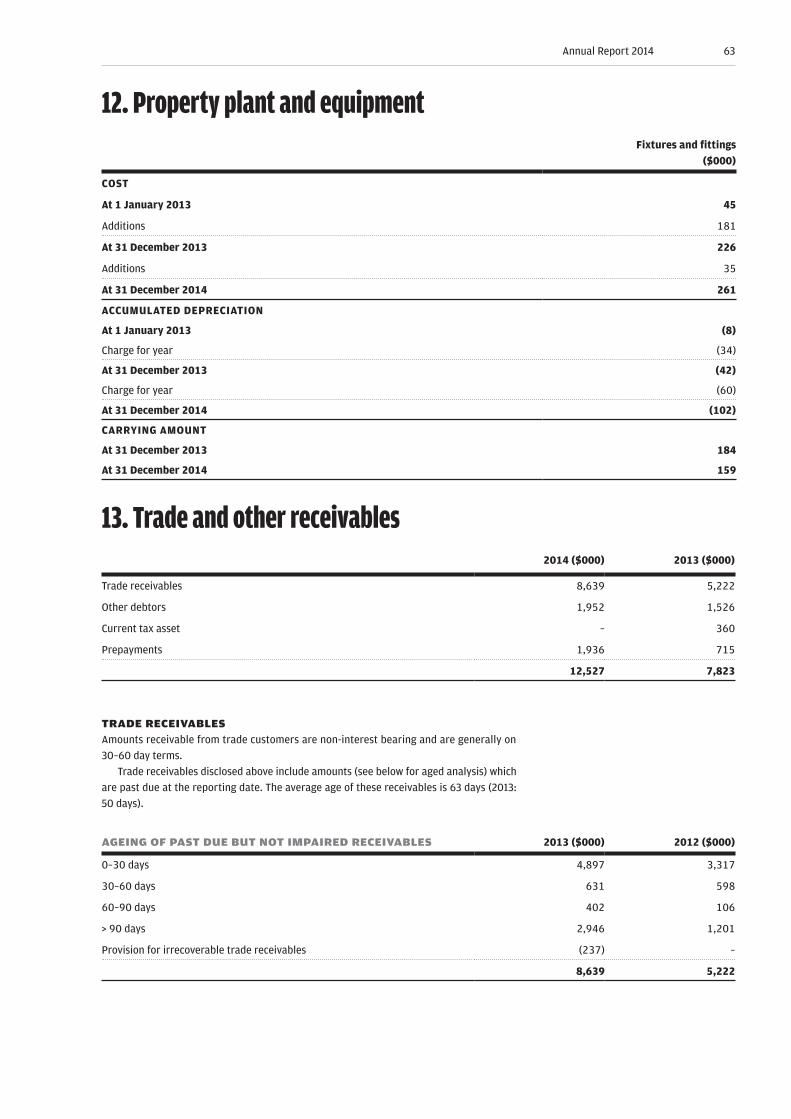
12. Property plant and equipmentFixtures and fittings
($000)
COST
At 1 January 2013 45
Additions 181
At 31 December 2013 226
Additions 35
At 31 December 2014 261
ACCUMULATED DEPRECIATION
At 1 January 2013 (8)
Charge for year (34)
At 31 December 2013 (42)
Charge for year (60)
At 31 December 2014 (102)
CARRYING AMOUNT
At 31 December 2013 184
At 31 December 2014 159
13. Trade and other receivables2014 ($000) 2013 ($000)
Trade receivables 8,639 5,222
Other debtors 1,952 1,526
Current tax asset – 360
Prepayments 1,936 715
12,527 7,823
TRADE RECEIVABLESAmounts receivable from trade customers are non-interest bearing and are generally on
30–60 day terms.
Trade receivables disclosed above include amounts (see below for aged analysis) which
are past due at the reporting date. The average age of these receivables is 63 days (2013:
50 days).
AGEING OF PAST DUE BUT NOT IMPAIRED RECEIVABLES 2013 ($000) 2012 ($000)
0–30 days 4,897 3,317
30–60 days 631 598
60–90 days 402 106
> 90 days 2,946 1,201
Provision for irrecoverable trade receivables (237) –
8,639 5,222
63Annual Report 2014
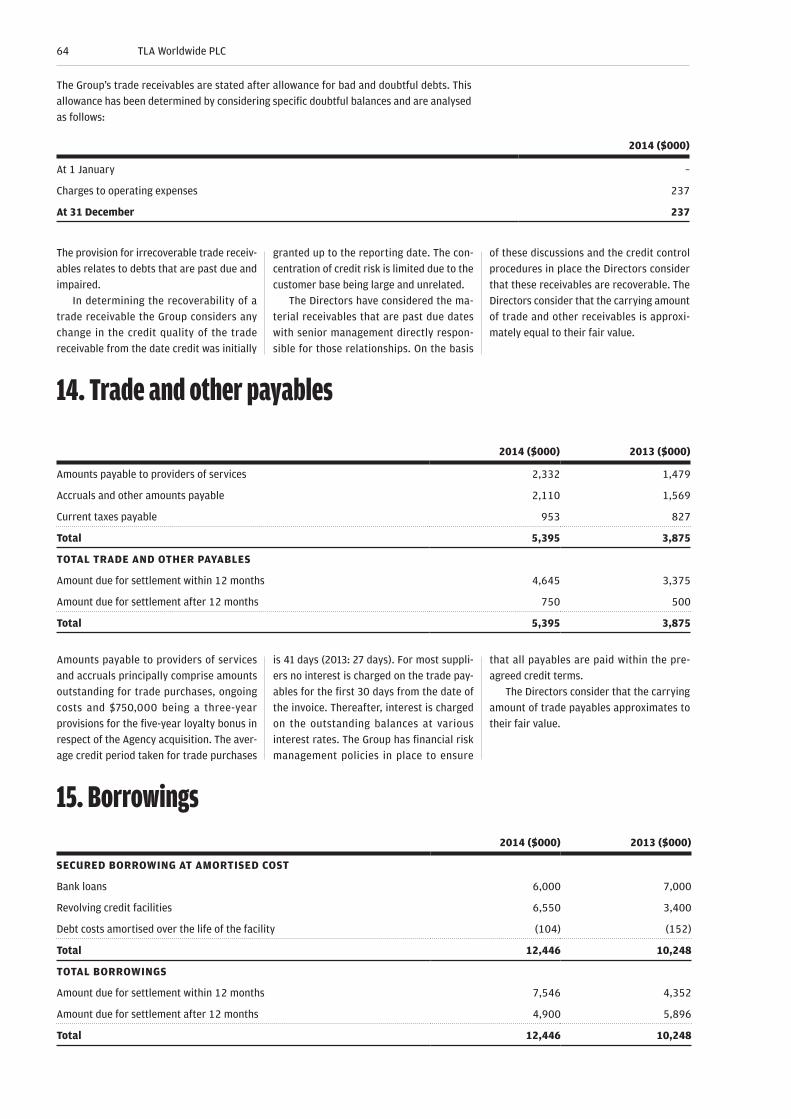
The Group’s trade receivables are stated after allowance for bad and doubtful debts. This
allowance has been determined by considering specific doubtful balances and are analysed
as follows:
2014 ($000)
At 1 January –
Charges to operating expenses 237
At 31 December 237
The provision for irrecoverable trade receiv-
ables relates to debts that are past due and
impaired.
In determining the recoverability of a
trade receivable the Group considers any
change in the credit quality of the trade
receivable from the date credit was initially
granted up to the reporting date. The con-
centration of credit risk is limited due to the
customer base being large and unrelated.
The Directors have considered the ma-
terial receivables that are past due dates
with senior management directly respon-
sible for those relationships. On the basis
of these discussions and the credit control
procedures in place the Directors consider
that these receivables are recoverable. The
Directors consider that the carrying amount
of trade and other receivables is approxi-
mately equal to their fair value.
14. Trade and other payables
2014 ($000) 2013 ($000)
Amounts payable to providers of services 2,332 1,479
Accruals and other amounts payable 2,110 1,569
Current taxes payable 953 827
Total 5,395 3,875
TOTAL TRADE AND OTHER PAYABLES
Amount due for settlement within 12 months 4,645 3,375
Amount due for settlement after 12 months 750 500
Total 5,395 3,875
Amounts payable to providers of services
and accruals principally comprise amounts
outstanding for trade purchases, ongoing
costs and $750,000 being a three-year
provisions for the five-year loyalty bonus in
respect of the Agency acquisition. The aver-
age credit period taken for trade purchases
is 41 days (2013: 27 days). For most suppli-
ers no interest is charged on the trade pay-
ables for the first 30 days from the date of
the invoice. Thereafter, interest is charged
on the outstanding balances at various
interest rates. The Group has financial risk
management policies in place to ensure
that all payables are paid within the pre-
agreed credit terms.
The Directors consider that the carrying
amount of trade payables approximates to
their fair value.
15. Borrowings2014 ($000) 2013 ($000)
SECURED BORROWING AT AMORTISED COST
Bank loans 6,000 7,000
Revolving credit facilities 6,550 3,400
Debt costs amortised over the life of the facility (104) (152)
Total 12,446 10,248
TOTAL BORROWINGS
Amount due for settlement within 12 months 7,546 4,352
Amount due for settlement after 12 months 4,900 5,896
Total 12,446 10,248
64 TLA Worldwide PLC
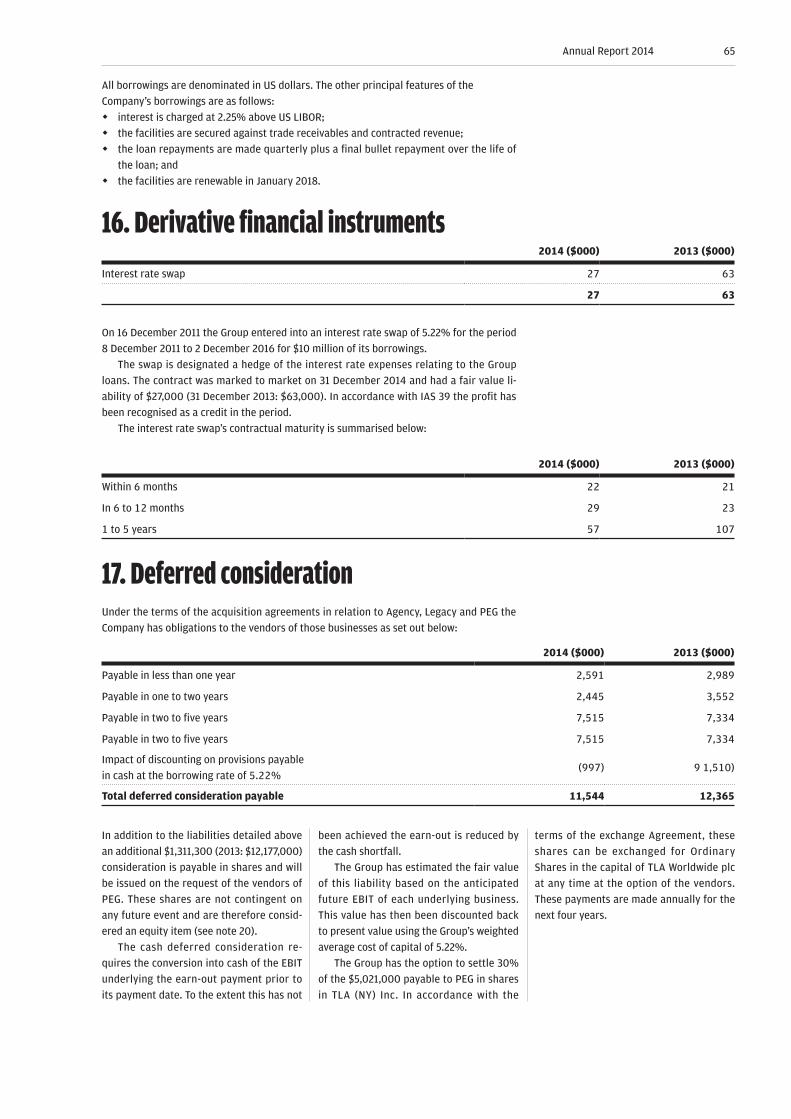
All borrowings are denominated in US dollars. The other principal features of the
Company’s borrowings are as follows:
w interest is charged at 2.25% above US LIBOR;
w the facilities are secured against trade receivables and contracted revenue;
w the loan repayments are made quarterly plus a final bullet repayment over the life of
the loan; and
w the facilities are renewable in January 2018.
16. Derivative financial instruments2014 ($000) 2013 ($000)
Interest rate swap 27 63
27 63
On 16 December 2011 the Group entered into an interest rate swap of 5.22% for the period
8 December 2011 to 2 December 2016 for $10 million of its borrowings.
The swap is designated a hedge of the interest rate expenses relating to the Group
loans. The contract was marked to market on 31 December 2014 and had a fair value li-
ability of $27,000 (31 December 2013: $63,000). In accordance with IAS 39 the profit has
been recognised as a credit in the period.
The interest rate swap’s contractual maturity is summarised below:
2014 ($000) 2013 ($000)
Within 6 months 22 21
In 6 to 12 months 29 23
1 to 5 years 57 107
17. Deferred considerationUnder the terms of the acquisition agreements in relation to Agency, Legacy and PEG the
Company has obligations to the vendors of those businesses as set out below:
2014 ($000) 2013 ($000)
Payable in less than one year 2,591 2,989
Payable in one to two years 2,445 3,552
Payable in two to five years 7,515 7,334
Payable in two to five years 7,515 7,334
Impact of discounting on provisions payable
in cash at the borrowing rate of 5.22%(997) 9 1,510)
Total deferred consideration payable 11,544 12,365
In addition to the liabilities detailed above
an additional $1,311,300 (2013: $12,177,000)
consideration is payable in shares and will
be issued on the request of the vendors of
PEG. These shares are not contingent on
any future event and are therefore consid-
ered an equity item (see note 20).
The cash deferred consideration re-
quires the conversion into cash of the EBIT
underlying the earn-out payment prior to
its payment date. To the extent this has not
been achieved the earn-out is reduced by
the cash shortfall.
The Group has estimated the fair value
of this liability based on the anticipated
future EBIT of each underlying business.
This value has then been discounted back
to present value using the Group’s weighted
average cost of capital of 5.22%.
The Group has the option to settle 30%
of the $5,021,000 payable to PEG in shares
in TLA (NY) Inc. In accordance with the
terms of the exchange Agreement, these
shares can be exchanged for Ordinary
Shares in the capital of TLA Worldwide plc
at any time at the option of the vendors.
These payments are made annually for the
next four years.
65Annual Report 2014
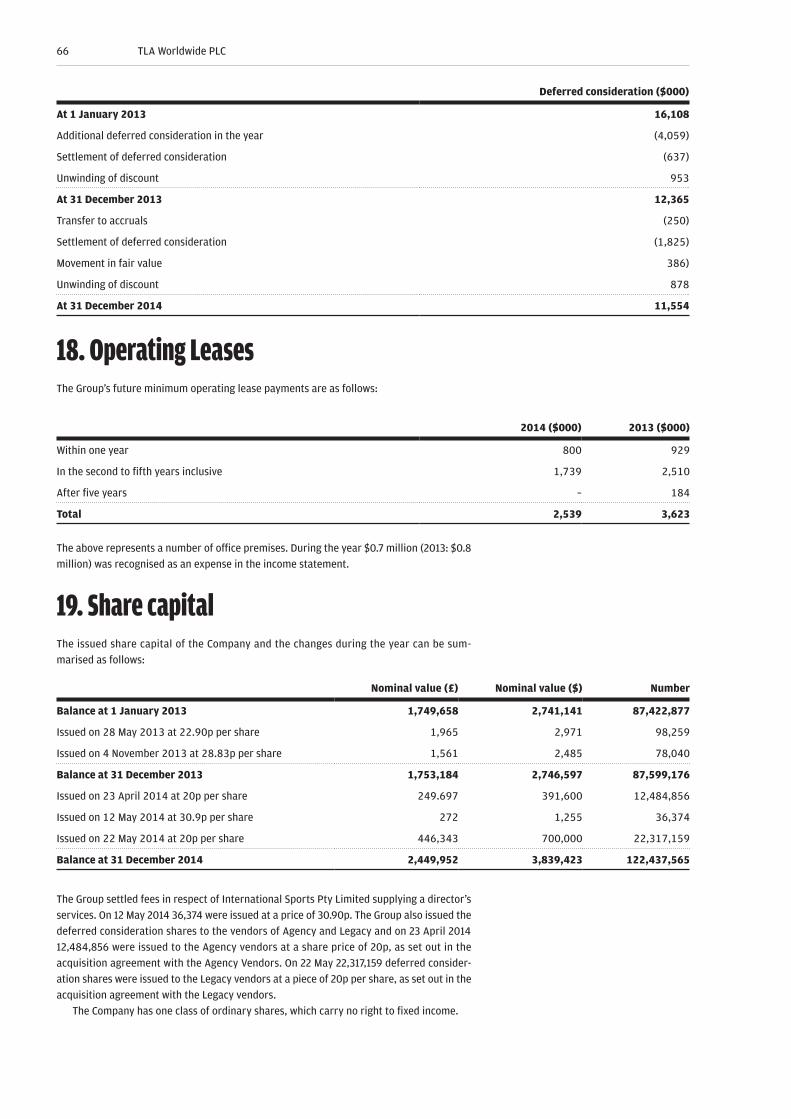
Deferred consideration ($000)
At 1 January 2013 16,108
Additional deferred consideration in the year (4,059)
Settlement of deferred consideration (637)
Unwinding of discount 953
At 31 December 2013 12,365
Transfer to accruals (250)
Settlement of deferred consideration (1,825)
Movement in fair value 386)
Unwinding of discount 878
At 31 December 2014 11,554
18. Operating LeasesThe Group’s future minimum operating lease payments are as follows:
2014 ($000) 2013 ($000)
Within one year 800 929
In the second to fifth years inclusive 1,739 2,510
After five years – 184
Total 2,539 3,623
The above represents a number of office premises. During the year $0.7 million (2013: $0.8
million) was recognised as an expense in the income statement.
19. Share capitalThe issued share capital of the Company and the changes during the year can be sum-
marised as follows:
Nominal value (£) Nominal value ($) Number
Balance at 1 January 2013 1,749,658 2,741,141 87,422,877
Issued on 28 May 2013 at 22.90p per share 1,965 2,971 98,259
Issued on 4 November 2013 at 28.83p per share 1,561 2,485 78,040
Balance at 31 December 2013 1,753,184 2,746,597 87,599,176
Issued on 23 April 2014 at 20p per share 249.697 391,600 12,484,856
Issued on 12 May 2014 at 30.9p per share 272 1,255 36,374
Issued on 22 May 2014 at 20p per share 446,343 700,000 22,317,159
Balance at 31 December 2014 2,449,952 3,839,423 122,437,565
The Group settled fees in respect of International Sports Pty Limited supplying a director’s
services. On 12 May 2014 36,374 were issued at a price of 30.90p. The Group also issued the
deferred consideration shares to the vendors of Agency and Legacy and on 23 April 2014
12,484,856 were issued to the Agency vendors at a share price of 20p, as set out in the
acquisition agreement with the Agency Vendors. On 22 May 22,317,159 deferred consider-
ation shares were issued to the Legacy vendors at a piece of 20p per share, as set out in the
acquisition agreement with the Legacy vendors.
The Company has one class of ordinary shares, which carry no right to fixed income.
66 TLA Worldwide PLC
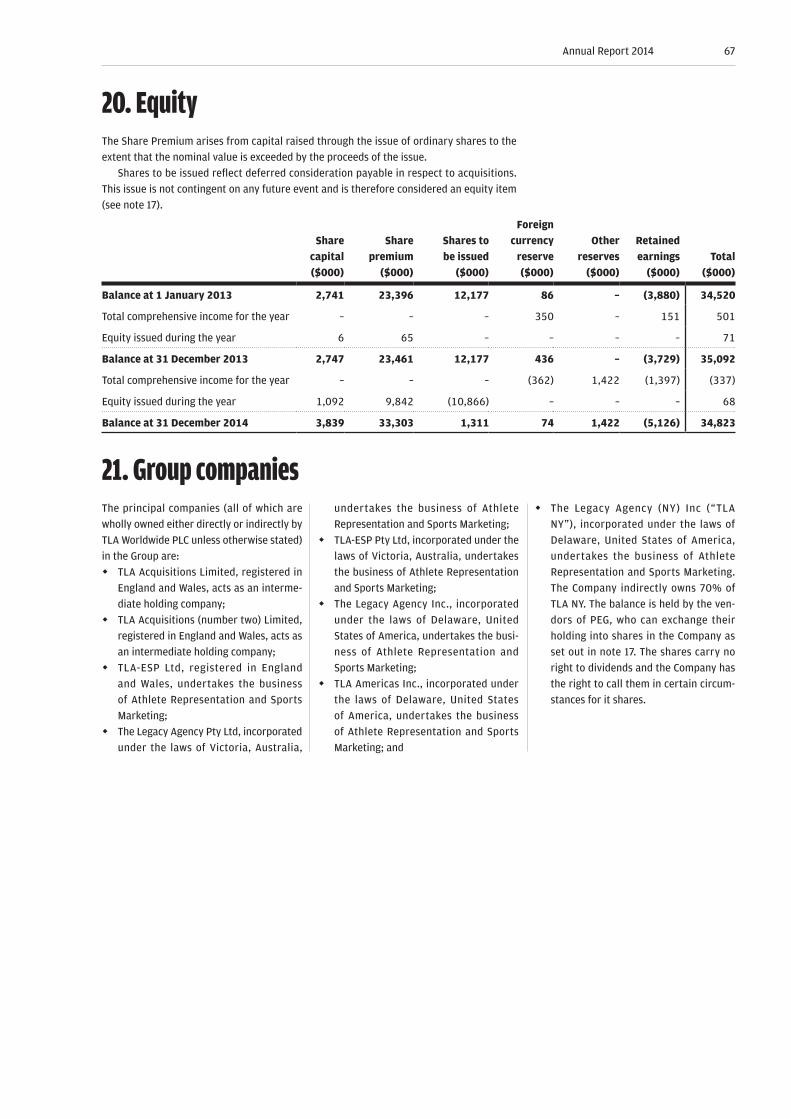
20. EquityThe Share Premium arises from capital raised through the issue of ordinary shares to the
extent that the nominal value is exceeded by the proceeds of the issue.
Shares to be issued reflect deferred consideration payable in respect to acquisitions.
This issue is not contingent on any future event and is therefore considered an equity item
(see note 17).
Share capital ($000)
Share premium
($000)
Shares to be issued
($000)
Foreign currency
reserve ($000)
Other reserves
($000)
Retained earnings
($000)Total
($000)
Balance at 1 January 2013 2,741 23,396 12,177 86 – (3,880) 34,520
Total comprehensive income for the year – – – 350 – 151 501
Equity issued during the year 6 65 – – – – 71
Balance at 31 December 2013 2,747 23,461 12,177 436 – (3,729) 35,092
Total comprehensive income for the year – – – (362) 1,422 (1,397) (337)
Equity issued during the year 1,092 9,842 (10,866) – – – 68
Balance at 31 December 2014 3,839 33,303 1,311 74 1,422 (5,126) 34,823
21. Group companiesThe principal companies (all of which are
wholly owned either directly or indirectly by
TLA Worldwide PLC unless otherwise stated)
in the Group are:
w TLA Acquisitions Limited, registered in
England and Wales, acts as an interme-
diate holding company;
w TLA Acquisitions (number two) Limited,
registered in England and Wales, acts as
an intermediate holding company;
w TLA-ESP Ltd, registered in England
and Wales, undertakes the business
of Athlete Representation and Sports
Marketing;
w The Legacy Agency Pty Ltd, incorporated
under the laws of Victoria, Australia,
undertakes the business of Athlete
Representation and Sports Marketing;
w TLA-ESP Pty Ltd, incorporated under the
laws of Victoria, Australia, undertakes
the business of Athlete Representation
and Sports Marketing;
w The Legacy Agency Inc., incorporated
under the laws of Delaware, United
States of America, undertakes the busi-
ness of Athlete Representation and
Sports Marketing;
w TLA Americas Inc., incorporated under
the laws of Delaware, United States
of America, undertakes the business
of Athlete Representation and Sports
Marketing; and
w The Legacy Agency (NY) Inc (“TLA
NY”), incorporated under the laws of
Delaware, United States of America,
undertakes the business of Athlete
Representation and Sports Marketing.
The Company indirectly owns 70% of
TLA NY. The balance is held by the ven-
dors of PEG, who can exchange their
holding into shares in the Company as
set out in note 17. The shares carry no
right to dividends and the Company has
the right to call them in certain circum-
stances for it shares.
67Annual Report 2014
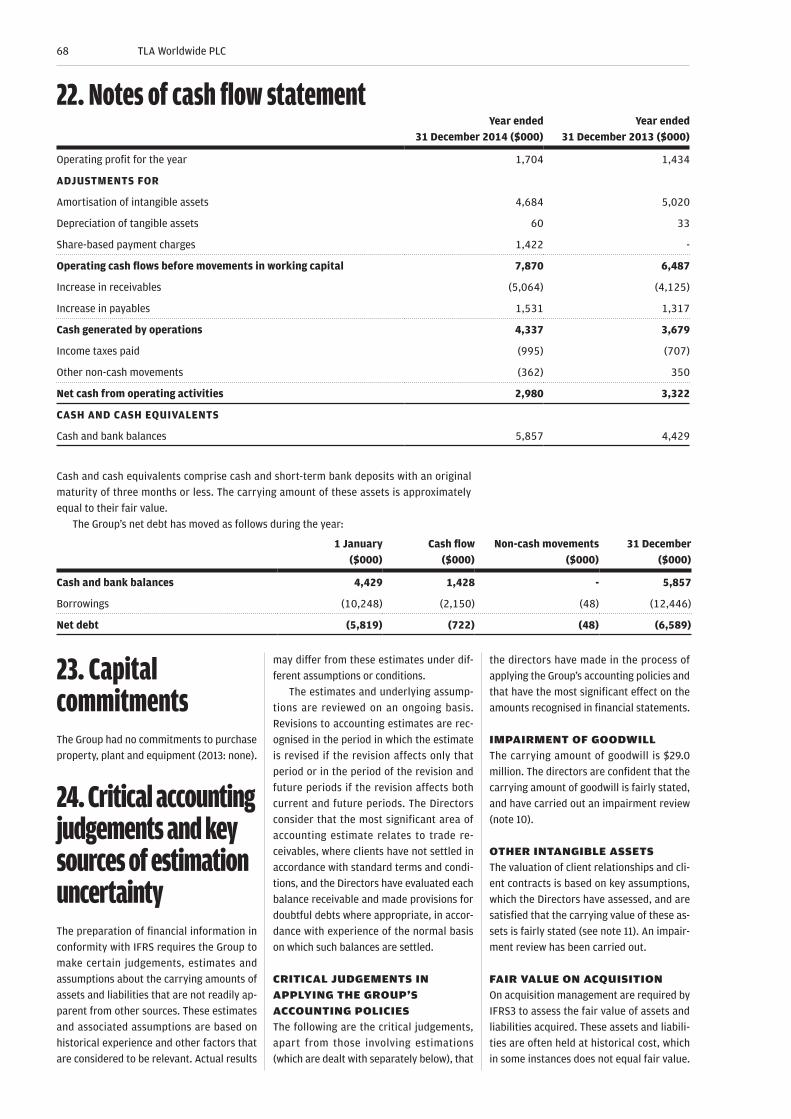
22. Notes of cash flow statement Year ended
31 December 2014 ($000)Year ended
31 December 2013 ($000)
Operating profit for the year 1,704 1,434
ADJUSTMENTS FOR
Amortisation of intangible assets 4,684 5,020
Depreciation of tangible assets 60 33
Share-based payment charges 1,422 -
Operating cash flows before movements in working capital 7,870 6,487
Increase in receivables (5,064) (4,125)
Increase in payables 1,531 1,317
Cash generated by operations 4,337 3,679
Income taxes paid (995) (707)
Other non-cash movements (362) 350
Net cash from operating activities 2,980 3,322
CASH AND CASH EQUIVALENTS
Cash and bank balances 5,857 4,429
Cash and cash equivalents comprise cash and short-term bank deposits with an original
maturity of three months or less. The carrying amount of these assets is approximately
equal to their fair value.
The Group’s net debt has moved as follows during the year:
1 January ($000)
Cash flow ($000)
Non-cash movements ($000)
31 December($000)
Cash and bank balances 4,429 1,428 - 5,857
Borrowings (10,248) (2,150) (48) (12,446)
Net debt (5,819) (722) (48) (6,589)
23. Capital commitmentsThe Group had no commitments to purchase
property, plant and equipment (2013: none).
24. Critical accounting judgements and key sources of estimation uncertaintyThe preparation of financial information in
conformity with IFRS requires the Group to
make certain judgements, estimates and
assumptions about the carrying amounts of
assets and liabilities that are not readily ap-
parent from other sources. These estimates
and associated assumptions are based on
historical experience and other factors that
are considered to be relevant. Actual results
may differ from these estimates under dif-
ferent assumptions or conditions.
The estimates and underlying assump-
tions are reviewed on an ongoing basis.
Revisions to accounting estimates are rec-
ognised in the period in which the estimate
is revised if the revision affects only that
period or in the period of the revision and
future periods if the revision affects both
current and future periods. The Directors
consider that the most significant area of
accounting estimate relates to trade re-
ceivables, where clients have not settled in
accordance with standard terms and condi-
tions, and the Directors have evaluated each
balance receivable and made provisions for
doubtful debts where appropriate, in accor-
dance with experience of the normal basis
on which such balances are settled.
CRITICAL JUDGEMENTS IN APPLYING THE GROUP’S ACCOUNTING POLICIESThe following are the critical judgements,
apart from those involving estimations
(which are dealt with separately below), that
the directors have made in the process of
applying the Group’s accounting policies and
that have the most significant effect on the
amounts recognised in financial statements.
IMPAIRMENT OF GOODWILLThe carrying amount of goodwill is $29.0
million. The directors are confident that the
carrying amount of goodwill is fairly stated,
and have carried out an impairment review
(note 10).
OTHER INTANGIBLE ASSETSThe valuation of client relationships and cli-
ent contracts is based on key assumptions,
which the Directors have assessed, and are
satisfied that the carrying value of these as-
sets is fairly stated (see note 11). An impair-
ment review has been carried out.
FAIR VALUE ON ACQUISITIONOn acquisition management are required by
IFRS3 to assess the fair value of assets and
liabilities acquired. These assets and liabili-
ties are often held at historical cost, which
in some instances does not equal fair value.
68 TLA Worldwide PLC
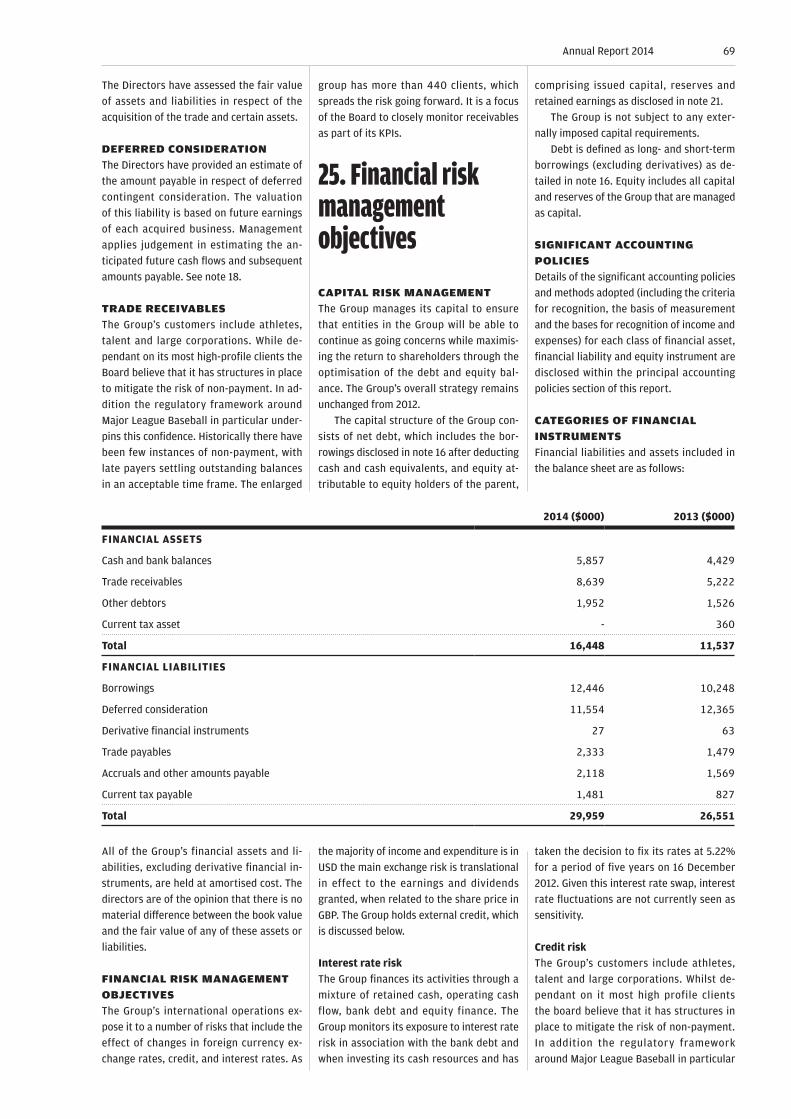
The Directors have assessed the fair value
of assets and liabilities in respect of the
acquisition of the trade and certain assets.
DEFERRED CONSIDERATIONThe Directors have provided an estimate of
the amount payable in respect of deferred
contingent consideration. The valuation
of this liability is based on future earnings
of each acquired business. Management
applies judgement in estimating the an-
ticipated future cash flows and subsequent
amounts payable. See note 18.
TRADE RECEIVABLESThe Group’s customers include athletes,
talent and large corporations. While de-
pendant on its most high-profile clients the
Board believe that it has structures in place
to mitigate the risk of non-payment. In ad-
dition the regulatory framework around
Major League Baseball in particular under-
pins this confidence. Historically there have
been few instances of non-payment, with
late payers settling outstanding balances
in an acceptable time frame. The enlarged
group has more than 440 clients, which
spreads the risk going forward. It is a focus
of the Board to closely monitor receivables
as part of its KPIs.
25. Financial risk management objectives
CAPITAL RISK MANAGEMENTThe Group manages its capital to ensure
that entities in the Group will be able to
continue as going concerns while maximis-
ing the return to shareholders through the
optimisation of the debt and equity bal-
ance. The Group’s overall strategy remains
unchanged from 2012.
The capital structure of the Group con-
sists of net debt, which includes the bor-
rowings disclosed in note 16 after deducting
cash and cash equivalents, and equity at-
tributable to equity holders of the parent,
comprising issued capital, reserves and
retained earnings as disclosed in note 21.
The Group is not subject to any exter-
nally imposed capital requirements.
Debt is defined as long- and short-term
borrowings (excluding derivatives) as de-
tailed in note 16. Equity includes all capital
and reserves of the Group that are managed
as capital.
SIGNIFICANT ACCOUNTING POLICIESDetails of the significant accounting policies
and methods adopted (including the criteria
for recognition, the basis of measurement
and the bases for recognition of income and
expenses) for each class of financial asset,
financial liability and equity instrument are
disclosed within the principal accounting
policies section of this report.
CATEGORIES OF FINANCIAL INSTRUMENTSFinancial liabilities and assets included in
the balance sheet are as follows:
2014 ($000) 2013 ($000)
FINANCIAL ASSETS
Cash and bank balances 5,857 4,429
Trade receivables 8,639 5,222
Other debtors 1,952 1,526
Current tax asset - 360
Total 16,448 11,537
FINANCIAL LIABILITIES
Borrowings 12,446 10,248
Deferred consideration 11,554 12,365
Derivative financial instruments 27 63
Trade payables 2,333 1,479
Accruals and other amounts payable 2,118 1,569
Current tax payable 1,481 827
Total 29,959 26,551
All of the Group’s financial assets and li-
abilities, excluding derivative financial in-
struments, are held at amortised cost. The
directors are of the opinion that there is no
material difference between the book value
and the fair value of any of these assets or
liabilities.
FINANCIAL RISK MANAGEMENT OBJECTIVESThe Group’s international operations ex-
pose it to a number of risks that include the
effect of changes in foreign currency ex-
change rates, credit, and interest rates. As
the majority of income and expenditure is in
USD the main exchange risk is translational
in effect to the earnings and dividends
granted, when related to the share price in
GBP. The Group holds external credit, which
is discussed below.
Interest rate riskThe Group finances its activities through a
mixture of retained cash, operating cash
flow, bank debt and equity finance. The
Group monitors its exposure to interest rate
risk in association with the bank debt and
when investing its cash resources and has
taken the decision to fix its rates at 5.22%
for a period of five years on 16 December
2012. Given this interest rate swap, interest
rate fluctuations are not currently seen as
sensitivity.
Credit riskThe Group’s customers include athletes,
talent and large corporations. Whilst de-
pendant on it most high profile clients
the board believe that it has structures in
place to mitigate the risk of non-payment.
In addition the regulatory framework
around Major League Baseball in particular
69Annual Report 2014

underpins this confidence. Historically there
have been few instances of non-payment
with late payers settling outstanding bal-
ances in an acceptable time frame.
The enlarged group has more than 440
clients, which spreads the risk going for-
ward. It is a focus of the Board to closely
monitor receivables as part of its KPIs.
Liquidity riskThe Group has continued to maintain posi-
tive cash resources well above working cap-
ital requirements, providing a strong bal-
ance sheet visible to the Group’s customer
base, but also ensuring sufficient available
funds for operations, potential expansion or
the potential financing of small acquisitions.
The following tables detail the Group’s
remaining contractual maturity for its non-
derivative financial liabilities with agreed
repayment periods. The tables have been
drawn up based on the undiscounted cash
flows of financial liabilities based on the
earliest date on which the Group can be
required to pay.
Less than 1 month 1–3 months
3 months to 1 year 1–5 years
Impact of discounting Total
31 December 2014
Borrowings – 250 750 11,550 (104) 12,446
Deferred consideration – 2,591 – 9,960 (997) 11,554
Trade payables – 2,332 – – – 2,332
Accruals – 1,360 – 758 – 2,118
Current tax payable – – 953 – – 953
Financial derivatives – – – 27 – 27
– 6,533 1,703 22,295 (1,101) 29,430
31 December 2013
Borrowings – 250 4,102 6,048 (152) 10,248
Deferred consideration – 1,030 1,959 10,890 (1,514) 12,365
Trade payables 1,479 – – – – 1,479
Accruals 1,419 – – 150 – 1,569
Current tax – – 827 – – 827
Financial derivatives – – – 63 – 63
2,898 1,280 6,888 17,151 (1,666) 26,551
Currency riskThe business principally trades in US dollars and whilst currency risk does exist, the impact
is minimal.
27. Share-based payments
EQUITY-SETTLED SHARE OPTION SCHEMEIn December 2013 the Company entered into a Long Term Incentive Scheme (“LTIP”) for
certain employees of the Group. The LTIP is split into three tranches, exercisable when
the share price reaches an average of £0.40, £0.50 and £0.60 for a three-month period
respectively.
The vesting period is five years from the Company’s IPO date of 8 December 2011. If the
awards remain unexercised after this period they expire. The awards are forfeited if the
employee leaves the Group before the award vests. Details of the LTIP awards outstanding
during the year are as follows.
No. of share options
Granted during the period 15,893,752
Forfeited during the period –
Exercised during the period –
Expired during the period –
Outstanding at 31 December 2014 15,893,752
Exercisable at the end of the year –
70 TLA Worldwide PLC
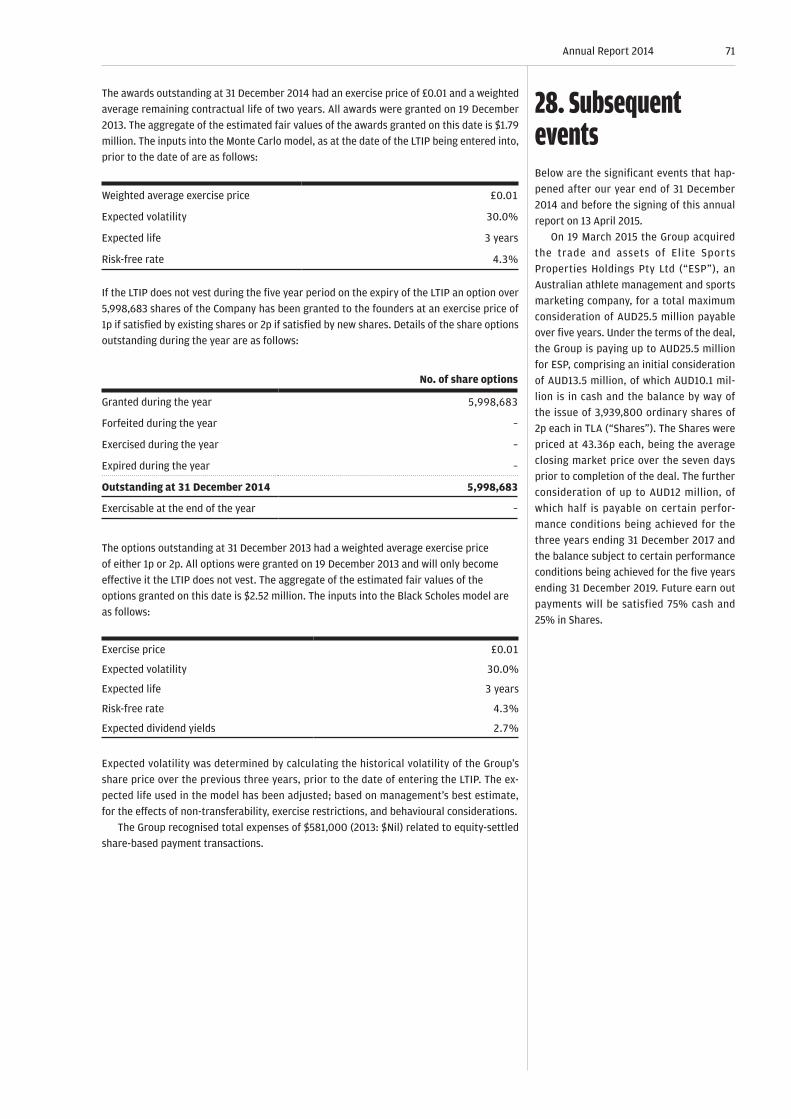
The awards outstanding at 31 December 2014 had an exercise price of £0.01 and a weighted
average remaining contractual life of two years. All awards were granted on 19 December
2013. The aggregate of the estimated fair values of the awards granted on this date is $1.79
million. The inputs into the Monte Carlo model, as at the date of the LTIP being entered into,
prior to the date of are as follows:
Weighted average exercise price £0.01
Expected volatility 30.0%
Expected life 3 years
Risk-free rate 4.3%
If the LTIP does not vest during the five year period on the expiry of the LTIP an option over
5,998,683 shares of the Company has been granted to the founders at an exercise price of
1p if satisfied by existing shares or 2p if satisfied by new shares. Details of the share options
outstanding during the year are as follows:
No. of share options
Granted during the year 5,998,683
Forfeited during the year –
Exercised during the year –
Expired during the year –
Outstanding at 31 December 2014 5,998,683
Exercisable at the end of the year –
The options outstanding at 31 December 2013 had a weighted average exercise price
of either 1p or 2p. All options were granted on 19 December 2013 and will only become
effective it the LTIP does not vest. The aggregate of the estimated fair values of the
options granted on this date is $2.52 million. The inputs into the Black Scholes model are
as follows:
Exercise price £0.01
Expected volatility 30.0%
Expected life 3 years
Risk-free rate 4.3%
Expected dividend yields 2.7%
Expected volatility was determined by calculating the historical volatility of the Group’s
share price over the previous three years, prior to the date of entering the LTIP. The ex-
pected life used in the model has been adjusted; based on management’s best estimate,
for the effects of non-transferability, exercise restrictions, and behavioural considerations.
The Group recognised total expenses of $581,000 (2013: $Nil) related to equity-settled
share-based payment transactions.
28. Subsequent eventsBelow are the significant events that hap-
pened after our year end of 31 December
2014 and before the signing of this annual
report on 13 April 2015.
On 19 March 2015 the Group acquired
the trade and assets of Elite Sports
Properties Holdings Pty Ltd (“ESP”), an
Australian athlete management and sports
marketing company, for a total maximum
consideration of AUD25.5 million payable
over five years. Under the terms of the deal,
the Group is paying up to AUD25.5 million
for ESP, comprising an initial consideration
of AUD13.5 million, of which AUD10.1 mil-
lion is in cash and the balance by way of
the issue of 3,939,800 ordinary shares of
2p each in TLA (“Shares”). The Shares were
priced at 43.36p each, being the average
closing market price over the seven days
prior to completion of the deal. The further
consideration of up to AUD12 million, of
which half is payable on certain perfor-
mance conditions being achieved for the
three years ending 31 December 2017 and
the balance subject to certain performance
conditions being achieved for the five years
ending 31 December 2019. Future earn out
payments will be satisfied 75% cash and
25% in Shares.
71Annual Report 2014

Note31 December 2014
($000)31 December 2013
($000)
FIXED ASSETS
Investments 2 16,553 16,553
Loan to subsidiary undertakings 21,077 22,946
37,630 39,499
CURRENT ASSETS
Debtors: amounts falling due within one year 3 942 165
Cash at bank and in hand 835 840
1,777 1,005
Creditors: Amounts falling due within one year 4 (372) (180)
Net current assets 1,405 825
Total assets less current liabilities 39,035 40,324
Net assets 39,035 40,324
CAPITAL AND RESERVES
Called-up Share Capital 5 3,839 2,741
Share Premium account 6 33,303 23,396
Shares to be issued 6 1,311 12,177
Profit and loss account 6 398 (1,739)
Foreign currency reserve 184 983
Shareholders’ funds 39,035 37,558
COMPANY BALANCE SHEET31 December 2014
These financial statements of TLA Worldwide plc, registration number 7741649, were approved by the Board of Directors and authorised for issue on 13 April 2015. They are signed on its behalf by:
Michael Principe13 April 2015
72 TLA Worldwide PLC

NOTES TO THE PARENT COMPANY FINANCIAL STATEMENTS
1. Accounting policies
BASIS OF PREPARATIONThese financial statements have been
prepared in accordance with applicable
United Kingdom accounting standards and
have been prepared under the historical
costs conventions and compliance with UK
Generally Accepted Accounting Standards.
As permitted by Section 408 of the
Companies Act 2006, the Company has
elected not to present its own profit and
loss account for the year. The Company’s
profit and loss account was approved by
the Board on 13 April 2015. The Company
reported a loss for the year ended 31
December 2014 of $161,000.
The principal accounting policies of the
Company are set out below.
INVESTMENTSFixed asset investments are shown at cost,
less provision for impairment.
CLASSIFICATION OF FINANCIAL INSTRUMENTS ISSUED BY THE COMPANYFinancial instruments issued by the
Company are treated as equity (i.e. form-
ing part of shareholders’ funds) only to the
extent that they meet the following two
conditions: w They include no contractual obliga-
tions upon the Company to deliver cash
or other financial assets or exchange
financial assets or financial liabilities
with another party under conditions
that are potentially unfavourable to the
Company; and
w Where the instrument will or may be
settled in the Company’s equity instru-
ments, it is either a non-derivative
that includes no obligation to deliver a
variable number of the Company’s own
equity instruments or is a derivative
that will be settled by the Company
exchanging a fixed amount of cash or
other financial assets for a fixed number
of its own equity instruments.
To the extent that this definition is not met,
the proceeds of issue are classified as fi-
nancial liability. Where the instruments for
call up share capital and share premium ac-
count excludes amounts in relation to those
shares.
Finance payments associated with
financial liabilities are dealt with as part
of finance expenses. Finance payments as-
sociated with financial instruments that are
classified in equity are dividends and are
recorded directly in equity.
TAXATIONTax on the profit or loss for the year com-
prises current and deferred tax. Tax is
recognised in the profit and loss account
except to the extent that it relates to items
recognised directly in equity in which case it
is recognised in equity.
Current tax is the expected amount on
all tax payable on the taxable income for
the year, using tax rates enacted or sub-
sequently enacted at the balance sheet
date, and any adjustment to tax payable in
respect of the previous year.
Deferred tax is recognised on all tim-
ing difference where the transactions or
events that give the Company an obligation
to pay more tax in the future, or a right to
pay less in the future, have occurred by the
balance sheet date. Deferred tax assets are
recognised when it is more likely than not
that they will be recovered. Deferred tax is
measured using rates of tax that have been
enacted or subsequently enacted by the
balance sheet date.
FOREIGN CURRENCYTransactions in foreign currencies are re-
corded at the rate of exchange at the date of
the transaction or, if hedged, at the forward
contract rate. Monetary assets and liabilities
denominated in foreign currencies at the
balance sheet date are reported at the rates
of exchange prevailing at that date or, if ap-
propriate, at the forward contract rate.
73Annual Report 2014
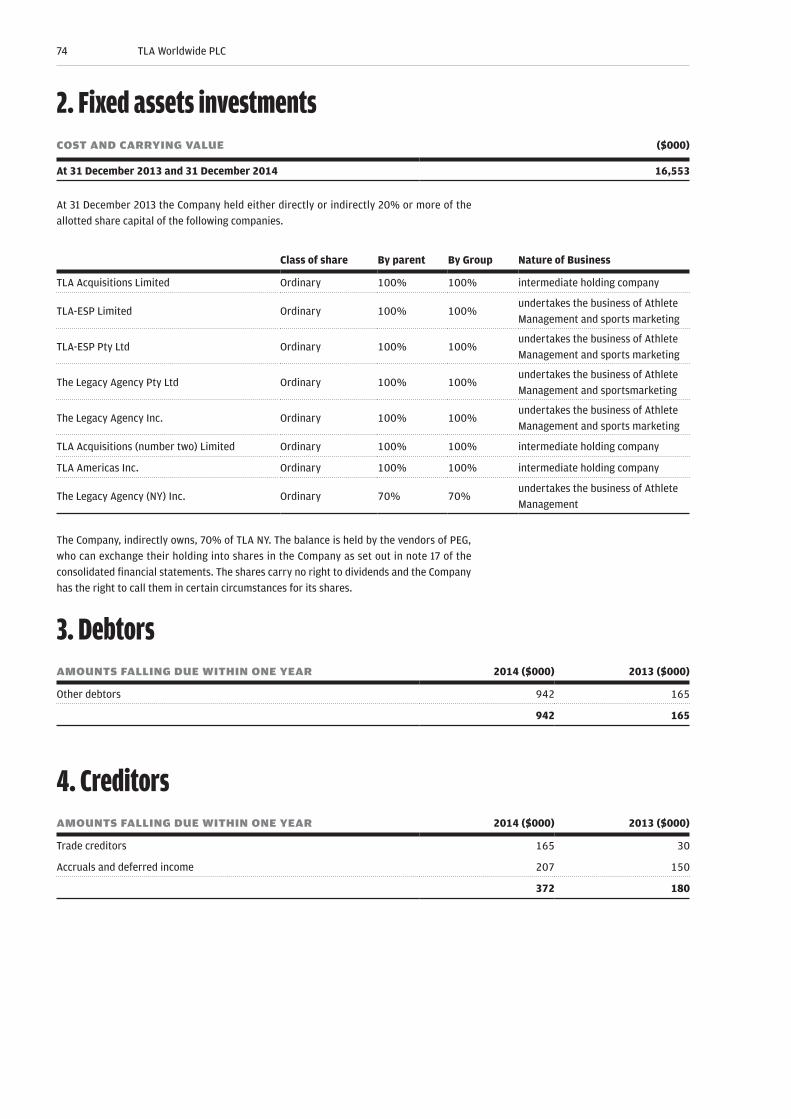
2. Fixed assets investmentsCOST AND CARRYING VALUE ($000)
At 31 December 2013 and 31 December 2014 16,553
At 31 December 2013 the Company held either directly or indirectly 20% or more of the
allotted share capital of the following companies.
Class of share By parent By Group Nature of Business
TLA Acquisitions Limited Ordinary 100% 100% intermediate holding company
TLA-ESP Limited Ordinary 100% 100%undertakes the business of Athlete
Management and sports marketing
TLA-ESP Pty Ltd Ordinary 100% 100%undertakes the business of Athlete
Management and sports marketing
The Legacy Agency Pty Ltd Ordinary 100% 100%undertakes the business of Athlete
Management and sportsmarketing
The Legacy Agency Inc. Ordinary 100% 100%undertakes the business of Athlete
Management and sports marketing
TLA Acquisitions (number two) Limited Ordinary 100% 100% intermediate holding company
TLA Americas Inc. Ordinary 100% 100% intermediate holding company
The Legacy Agency (NY) Inc. Ordinary 70% 70%undertakes the business of Athlete
Management
The Company, indirectly owns, 70% of TLA NY. The balance is held by the vendors of PEG,
who can exchange their holding into shares in the Company as set out in note 17 of the
consolidated financial statements. The shares carry no right to dividends and the Company
has the right to call them in certain circumstances for its shares.
3. DebtorsAMOUNTS FALLING DUE WITHIN ONE YEAR 2014 ($000) 2013 ($000)
Other debtors 942 165
942 165
4. CreditorsAMOUNTS FALLING DUE WITHIN ONE YEAR 2014 ($000) 2013 ($000)
Trade creditors 165 30
Accruals and deferred income 207 150
372 180
74 TLA Worldwide PLC
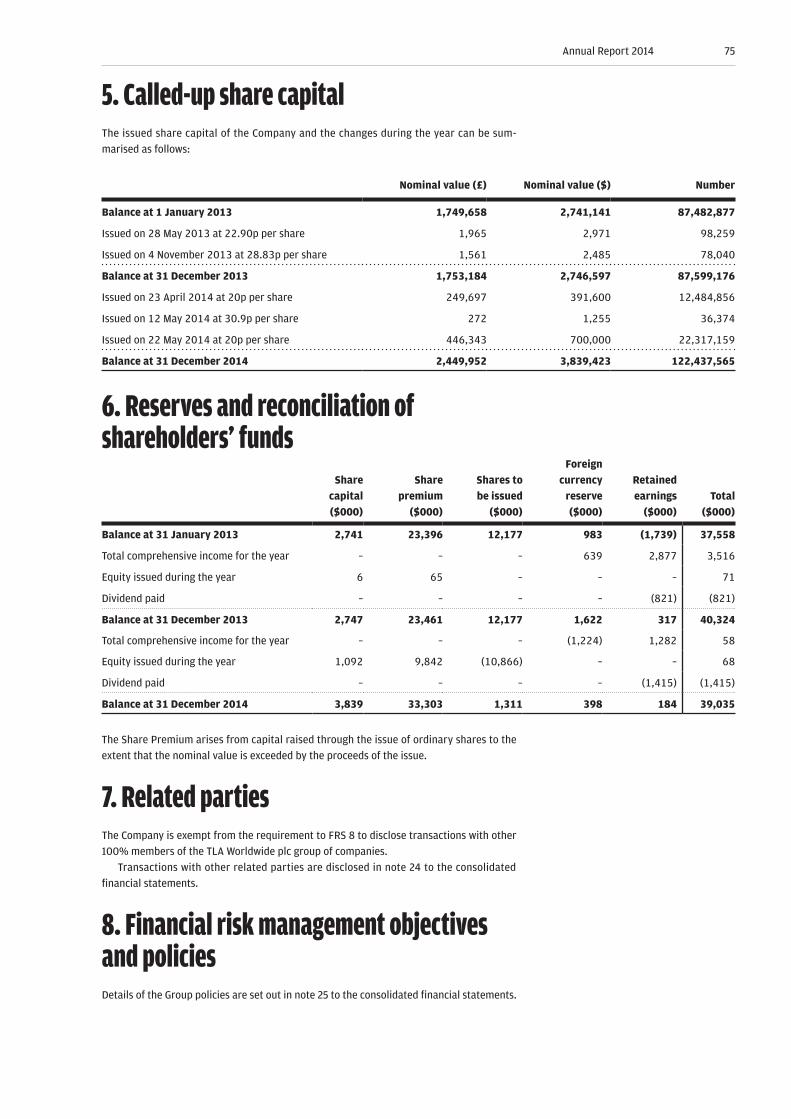
5. Called-up share capitalThe issued share capital of the Company and the changes during the year can be sum-
marised as follows:
Nominal value (£) Nominal value ($) Number
Balance at 1 January 2013 1,749,658 2,741,141 87,482,877
Issued on 28 May 2013 at 22.90p per share 1,965 2,971 98,259
Issued on 4 November 2013 at 28.83p per share 1,561 2,485 78,040
Balance at 31 December 2013 1,753,184 2,746,597 87,599,176
Issued on 23 April 2014 at 20p per share 249,697 391,600 12,484,856
Issued on 12 May 2014 at 30.9p per share 272 1,255 36,374
Issued on 22 May 2014 at 20p per share 446,343 700,000 22,317,159
Balance at 31 December 2014 2,449,952 3,839,423 122,437,565
6. Reserves and reconciliation of shareholders’ funds
Share capital ($000)
Share premium
($000)
Shares to be issued
($000)
Foreign currency
reserve ($000)
Retained earnings
($000)Total
($000)
Balance at 31 January 2013 2,741 23,396 12,177 983 (1,739) 37,558
Total comprehensive income for the year – – – 639 2,877 3,516
Equity issued during the year 6 65 – – – 71
Dividend paid – – – – (821) (821)
Balance at 31 December 2013 2,747 23,461 12,177 1,622 317 40,324
Total comprehensive income for the year – – – (1,224) 1,282 58
Equity issued during the year 1,092 9,842 (10,866) – – 68
Dividend paid – – – – (1,415) (1,415)
Balance at 31 December 2014 3,839 33,303 1,311 398 184 39,035
The Share Premium arises from capital raised through the issue of ordinary shares to the
extent that the nominal value is exceeded by the proceeds of the issue.
7. Related partiesThe Company is exempt from the requirement to FRS 8 to disclose transactions with other
100% members of the TLA Worldwide plc group of companies.
Transactions with other related parties are disclosed in note 24 to the consolidated
financial statements.
8. Financial risk management objectives and policiesDetails of the Group policies are set out in note 25 to the consolidated financial statements.
75Annual Report 2014
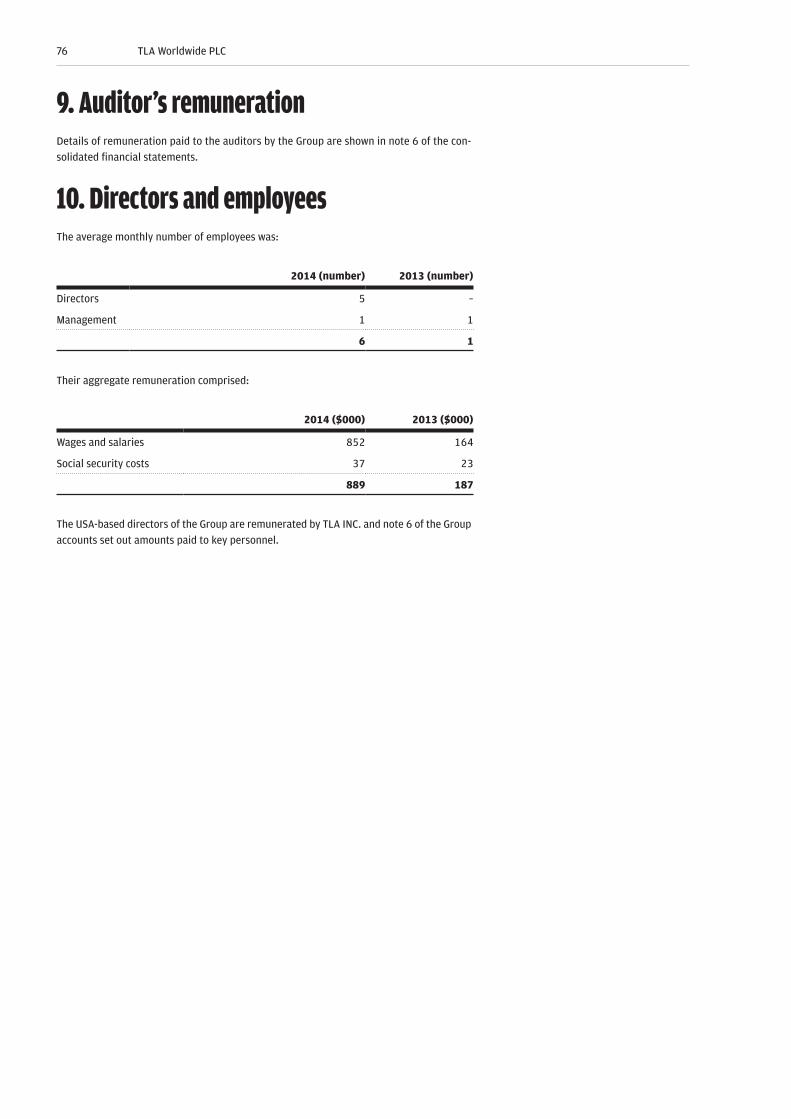
9. Auditor’s remunerationDetails of remuneration paid to the auditors by the Group are shown in note 6 of the con-
solidated financial statements.
10. Directors and employeesThe average monthly number of employees was:
2014 (number) 2013 (number)
Directors 5 –
Management 1 1
6 1
Their aggregate remuneration comprised:
2014 ($000) 2013 ($000)
Wages and salaries 852 164
Social security costs 37 23
889 187
The USA-based directors of the Group are remunerated by TLA INC. and note 6 of the Group
accounts set out amounts paid to key personnel.
76 TLA Worldwide PLC
SHAREHOLDER INFORMATION
Annual General Meeting: 22 June 2015Website: tlaww-plc.com
Advisers
AUDITORDeloitte LLP
Southampton
NOMINATED ADVISOR AND BROKERNumis Securities Limited
The London Stock Exchange Building
10 Paternoster Square
London, EC4M 7LT
REGISTRARSNeville Registrars Limited
Neville House
18 Laurel Lane
Halesowen
West Midlands B63 3DA
LAWYERS – UKDAC Beachcroft
100 Fetter Lane
London EC4A 1BN
LAWYERS – USHerrick, Feinstein LLP
2 Park Avenue
New York, New York 10016
REGISTERED OFFICE94 Pepys Road
London SE14 5SD
Registered number: 7741649
Country of incorporation: England
BANKER – UKHSBC Bank PLC
West End Corporate Banking Centre
2nd Floor, 70 Pall Mall, London SW1Y 5E
BANKERS – USSun Trust Banks Inc.
303 Peachtree Street, 32nd Floor
Atlanta, GA 30308
Design by Design to Communicate
www.dtcstudio.co.uk
This report incorporates images licensed through Getty Images
77Annual Report 2014


TLAWW-PLC.COM
TLAWW-PLC.COM