2014 ssac the hot hand a new approach
DESCRIPTION
Attempts to prove that there is indeed a hot hand in basketball.TRANSCRIPT
2014 Research Paper Competition Presented by:
1
The Hot Hand: A New Approach to an Old “Fallacy”
Andrew Bocskocsky, John Ezekowitz, and Carolyn Stein
Harvard University, Cambridge, MA, 02138
Email: [email protected], [email protected], [email protected]
Abstract The vast literature on the Hot Hand Fallacy in basketball rests on the assumption that shot selection is independent of player-perceived hot or coldness. In this paper, we challenge this assumption using a novel dataset of over 83,000 shots from the 2012-2013 National Basketball Association (NBA) season, combined with optical tracking data of both the players and the ball. We create a comprehensive model of shot difficulty using relevant initial shot conditions, and use it to show that players who have exceeded their expectation over recent shots shoot from significantly further away, face tighter defense, are more likely to take their team’s next shot, and take more difficult shots. We then turn to the Hot Hand itself and show that players who are outperforming will continue to do so, conditional on the difficulty of their present shot. Our estimates of the Hot Hand effect range from 1.2 to 2.4 percentage points in increased likelihood of making a shot.
1 Introduction Humans are inherently bad at handling uncertainty and chance. We crave order and symmetry, and this tendency often leads us astray in the face of randomness. This is evidenced by the belief in “local representativeness,” or the “law of small numbers,” first formally defined by Kahneman and Tversky (1971). Humans, the authors write, “expect the essential characteristics of a chance process to be represented not only globally in the entire sequence, but also locally, in each of its parts” (1985). The “Hot Hand” or “streak shooting” has been used as an example of local representativeness. An average NBA viewer observes Player X, a sixty percent shooter, make four shots in a row. He thinks to himself, “this isn’t representative of his normal sixty percent shooting – Player X must be hot!” The statistician, however, knows that streaks of four makes in a row are inevitable over the course of a season. Short sequences of shots need not be consistent with the player’s overall shooting percentage. This debate, seemingly long-ago settled in favor of the statistician, has given rise to perhaps the most well-known theories in behavioral economics: the Hot Hand Fallacy. The seminal piece of research that attempted to answer this question was done by Thomas Gilovich, Robert Vallone, and Amos Tversky in 1985. In this paper, the authors analyzed series of shots by players on the Philadelphia 76ers, looking for a positive correlation between successive shots, and found none. They also analyzed series of free throws by the Boston Celtics and the Cornell men’s and women’s basketball teams, and again found no evidence of serial correlation. Subsequent studies, including Adams, 1992; Koehler and Conley, 2003; Bar-Eli, Avugos and Raab, 2006; and Rao 2009 have confirmed this finding. Today, among the academic crowd, the Hot Hand is almost universally considered a “fallacy.” Larry Summers even chastised the Harvard men’s basketball team for their belief in the phenomenon (Davidson, 2013). Yet, among basketball fans and players, the Hot Hand is a myth that refuses to die. Professional players themselves reported feeling that they “almost can’t miss” after making several shots in a row (Kahneman and Tversky, 1971). Players’ actions confirm this sentiment, as shot difficulty tends to increase following several made shots (Rao, 2009). Therefore, we believe that the validity of the Hot Hand remains an open question. For, buried in the introduction of the famous Gilovich, Vallone, and Tversky paper lies a key assumption that:
“Each player has an ensemble of shots that vary in difficulty (depending, for example, on the distance from the basket and on defensive pressure), and each shot is randomly selected from this ensemble” (Gilovich, Vallone and Tversky, 1985, emphasis added).

2014 Research Paper Competition Presented by:
2
The strength of the authors’ conclusion hinges heavily on this assumption, and yet it is not difficult to envision a scenario in which it is violated. There is strong evidence that players themselves believe in the Hot Hand and may not select shots at random. Players taking more difficult shots after past makes may “cancel out” or mask the Hot Hand effect. In this paper, we use a novel dataset, provided by the SportVU tracking cameras of STATS, Inc. This dataset consists of over 83,000 shot attempts from the 2012-2013 NBA season. Synthesizing this dataset, we are able to know almost all relevant characteristics of the shot at the moment it is taken. This allows us to investigate the following two questions: First, do players (both offensive players and defenders) believe in the Hot Hand, as evidenced by their playing decisions? And second, if we control for the difficulty of the shot, does the Hot Hand effect indeed emerge? We show that players who perceive themselves to be hot based on previous shot outcomes shoot from significantly further away, face tighter defense, are more likely to take their team’s subsequent shot, and take more difficult shots. These results invalidate the shot selection independence assumption. To account for this bias, we create a comprehensive model of shot difficulty that depends on conditions of the shot the moment it is taken. These conditions include variables relevant to game situation, shot location, and defender locations. Next, we create a measure of heat which reflects the extent to which a player outperformed over his past few shots, bearing in mind how difficult those shots were. By having both a measure of shot difficulty and a measure of heat, we have a way to test for the Hot Hand, holding shot difficulty constant. The results of this test suggest that once we control for the dependence of shot selection, there may be a small yet significant Hot Hand effect.
2 Data and Empirical Preliminaries 2.1 Raw Data STATS, Inc. introduced the SportVU optical tracking system into the NBA in 2010. The system uses six cameras, three on each side of the court, to provide precise three-dimensional image tracking of the players, referees, and ball every 1/25th of a second. Our dataset consists of every game played at the 15 SportVU equipped arenas in the 2012-2013 regular season. We create a shot log which synthesizes the optical tracking data from SportVU and the play-by-play data from the NBA to create robust characterization of each shot. For each shot, we have information on the player who took the shot, the type of shot taken, and the time and score at the time of the shot. From the optical tracking data, we have the precise location of the ball and all ten players, both offensive and defensive, on the court. 2.2 Predicted Shot Difficulty Using the shot log data described in Section 2.1, we estimate a model that predicts the difficulty of each shot for player i taking shot s, based on four broad categories of determinants of shot difficulty:
P̂is = α + β * (Game Condition Controlsis)+ γ * (Shot Controlsis )
+ δ * (Defensive Controlsis)+ θ * (Player Fixed Effectsi ) ( 1 ) We use Game Condition Controls, such as time remaining and the score differential between the teams to proxy for differences in pressure, player fatigue, and effort across shots. We use Shot Controls, such as the precise distance from the basket of each shot and its play-by-play categorization (i.e., fadeaway jump shot, reverse layup, etc), to estimate the difficulty of the shot. Because shot efficiency varies non-linearly with shot distance (see Figure 1 for a visual representation), we break distance into two-by-two foot increments and include this set of mutually exclusive and exhaustive dummy variables in the shot difficulty model. This allows for a non-parametric specification, where each two-by-two foot increment’s coefficient is allowed to vary. We use Defensive Controls to measure defensive intensity. Using the SportVU data, we are able to determine and use both the absolute distance between the player shooting and the closest defender and the angle of that defender relative to a straight line between the shooter and the basket. We also include the height differential between the closest defender and the shooter. This is interacted with the distance between the two players to give a measure of size mismatch.

2014 Research Paper Competition Presented by:
3
Finally, we use Player Fixed Effects to control for differences between players. If Kevin Durant and Tyson Chandler both take identical jump shots, the two shots likely have different likelihoods of being made. Player Fixed Effects allow us to capture this difference. Shot Difficulty Regression Results Table 1 shows the fit of this regression, as well as the specific controls used. For ease of notation, we will refer to
the estimated probability of a make as simply P̂ throughout the paper. We used OLS rather than a Logit or Probit regression because of issues with model convergence. Therefore, when the model predicted values of greater than one or less than zero, we replaced them with 0.99 and 0.01 respectively.2 Because we used such a large number of variables and interactions, along with a very non-parametric specification (i.e. breaking distance into two-by-two zones rather than using a linear measure), most of the hundreds of coefficients do not have an easy interpretation. Thus, no coefficients are reported. To test the accuracy of the model, we ran it on a randomized training set consisting of half of the data. We then
predicted P̂ ’s for the validation set, creating a pseudo-out of sample test. We grouped the P̂ ’s into bins of one
percent increments, and calculated the actual make percentage for each bin. If the model is accurate, the P̂ bins should correspond closely with actual made percentages. Figure 2 presents the scatter plot of the data and illustrates that model generally fits the data very well. Defining Heat Before we can consider the effect of heat, we must first define what heat actually is. Note that we only consider consecutive shots that occur within the same game. The conventional definition of heat is: Simple Heatn = Actual % over past n shots ( 2 ) However, we believe that in order to test for the Hot Hand, we must define what we call Complex Heat. Note that
the P̂ values allow us to calculate the expected shooting percentage over the past n shots. Therefore, we define:
Complex Heatn = Actual % over past n shots - Expected % over past n shots ( 3 )
Simple Heat is the commonly understood measure of heat - it simply reflects how successful a player has been over his past few shots. However, a drawback of this is that it does not account for shot difficulty. A player who has gone five-for-five on five consecutive layups will be labeled “hotter” than a player who has made four out of five three-point attempts. Complex Heat corrects for this, and looks for players who are shooting better than expected, given the difficulty of the shots they are taking. Another drawback of Simple Heat is illustrated by the following example. Suppose a player is playing against a very short defender. It is likely that he is making more of his shots than usual, and his Simple Heat will be high. However, as long as he keeps shooting against this low-quality defender, he is still likely to make his shots - in other
words P̂ will also be high. Therefore, we see that Simple Heat and P̂ have a mechanical correlation. This is not the
case with Complex Heat, because it controls for the difficulty of the past few shots (i.e. the P̂ of the previous few shots). Continuing with the short defender example, the defender’s short stature will be controlled for when we use Complex Heat, because the difficulty of the past few shots will be lower. Finally, we note that there is some discretion in selecting how many shots we “look back” over when defining heat (i.e. what value n takes when defining Simple and Complex Heat). We ran our results for all values of n from two through seven, and found similar results. For simplicity, we report all results here for n = 4, which we believe is a reasonable number of shots. Moreover, unless otherwise noted, all results that use heat refer to Complex Heat, which we believe is the more correct measure.
3 Do Players Believe in the Hot Hand?

2014 Research Paper Competition Presented by:
4
The first question we are interested in is: Do players believe in the Hot Hand? Gilovich, Vallone and Tversky (1985) showed that players on the 76ers claimed to believe the Hot Hand was true. We are interested in whether over a quarter century later, players’ actions reflect this belief. 3.1 Empirical Strategy Shot Distance If players truly believe that the Hot Hand exists, they may attempt more difficult shots as they heat up. One way to test this is to see whether players take shots that are further away from the basket as they become hot. To see if this is the case, we run the following specification:
Shot Distanceis = α + β * (Heatis)+ γ * (Controlsis)+ θ * (Player Fixed Effectsi) ( 4 ) The controls include quarter, score differential, quarter/score differential interaction, closest defender distance, and angle, and a dummy for fast breaks. We would hypothesize that if players believe in the Hot Hand, the coefficient on heat would be positive. As players think they are becoming hot (i.e. better shooters), they optimize by taking shots that are more difficult than shots they would ordinarily attempt. An alternative explanation is that the defense buys into the Hot Hand belief and covers “hot” players more tightly, causing them to attempt shots from further away. Defender Distance As mentioned previously, if defenders believe the Hot Hand exists, they may cover hot players more tightly. To test this hypothesis, we run the following regression:
Defender Distanceis = α + β * (Heatis)+ γ * (Controlsis)+ θ * (Player Fixed Effectsi) ( 5 )
The controls in this regression include quarter, score differential, quarter/score differential interaction, fast break, shot type, and shot distance. We would hypothesize that if defenders believe in the Hot Hand, then the coefficient on heat would be negative. Intuitively, as a player becomes hotter, the defenders give him less space to shoot. Likelihood of Taking Next Shot Further, we can investigate the effect of heat on overall shot selection by players by evaluating how heat impacts the probability that a given player takes his team’s next shot. More specifically, we look at the probability that after Player X takes a shot, Player X also takes his team’s next shot as a function of heat. To do this, we estimate the following Probit model:
P (Sameis) = ϕ [α + β * (Heatis)+ γ * (Controlsis)+ θ * (Player Fixed Effectsi)] ( 6 ) In this regression, we control for “game environment” factors - quarter, score differential, and the quarter/score differential interaction. Here, if players believe in the Hot Hand, we would expect the coefficient on heat to be positive. If the shooter thinks he is heating up, he is more likely to shoot. Moreover, if his teammates also believe he is hot, they are more likely to give him the ball in a shooting position. Overall Shot Difficulty
Finally, we can use our P̂ model to investigate how heat affects overall shot difficulty. If players attempt shots that are further away and more closely guarded when they perceive themselves to be hot, we would expect that these
shots overall have a lower value of P̂. To see if this is the case, we run:
P̂is = α + β * ( Heatis ) ( 7 )

2014 Research Paper Competition Presented by:
5
Note that we don’t include controls or player fixed effects, since P̂ includes these already. If players do indeed
attempt all-around more difficult shots when hot, we would expect β to be negative (recall that a low P̂ corresponds to a more difficult shot). 3.2 Results Shot Distance Looking at the column (1) of Table 2, we see that shot distance increases with heat. The size of the effect - 2.144 feet - is significant. If a player made rather than missed one more of his past four shots (i.e. increased Complex Heat by 0.25), his estimated shot distance increases by just over 6 inches. Compared to the average shot distance of 12.5 feet, this is about a 5% increase. This supports the hypothesis that as players become hot, they attempt more difficult shots. Defender Distance Considering column (2) of Table 2, we also see that defender distance shrinks with heat. Again, to better understand the size of these coefficients, consider what happens if a player makes an additional one out of his past four shots. In this case, defender distance shrinks by 0.046 feet, or about half an inch. This is a small effect, but it is worth noting that the average defender distance is only about four feet. Therefore, the effect size is about equal to a 1% decrease in defender distance. This supports the hypothesis that as a player becomes hot, the defense plays tighter. Likelihood of Taking Next Shot Next, we consider how likely it is that a player takes his team’s next shot. Column (3) of Table 2 shows how the probability that the same player takes a team’s next shot as a function of heat. If a shooter makes an additional average-difficulty shot (i.e. all other covariates are at their mean values), then the probability of the same shooter taking the shot increases by 1.5 percentage points (0.061* 0.25). This sounds small, but remember that there are five players on a team. If the average player has about a 20% chance of taking his team’s next shot, this corresponds to a 7.6% increase in the overall probability. Overall Shot Difficulty Finally, we consider overall shot difficulty in column (4) of Table 2. Consistent with what we observed in regards to shot distance and defender distance, being hot is associated with taking overall more difficult shots. A player who
makes an additional shot will on average see his P̂ value drop by 1.0 percentage points. Given that the average shot has about a 40% chance of going in, this can be thought of as attempting a 2.5% more difficult shot. This result, and the three above it, illustrate that players behave as though they believe in the Hot Hand.
4 Testing the Hot Hand: Shot Difficulty 4.1 Empirical Strategy Now armed with evidence that shot difficulty increases with heat, we can turn our attention to whether the Hot
Hand truly exists once we control for shot difficulty. In the following section, we present results using our P̂ shot difficulty model, comment on those results, and add some discussion of potential drawbacks of this approach. First, as a baseline, we look for the Hot Hand without any control for shot difficulty. We are interested in how a player’s probability of hitting a shot varies with heat and nothing else. Therefore, we can run the following simple specification:
P(Makeis)= α + β * (Heatis) + θ * (Player Fixed Effectsi) ( 8 ) We can run this using an OLS specification to understand how the probability of making a shot varies with heat, unconditional on shot type or difficulty. This is analogous to the analysis done by Gilovich, Vallone, and Tversky (1985) and others, and will provide us with a nice baseline.

2014 Research Paper Competition Presented by:
6
Next, we can control for difficulty by using P̂ , which encapsulates all of the relevant, quantifiable controls. We can use the following relatively simple specification to test for the difficulty-controlled Hot Hand:
P(Makeis)= α + β * (Heatis) + γ * P̂is ( 9 )
Note that we no longer need player fixed effects, because P̂ encapsulates those.
If the Hot Hand does not exist, and each shot is truly independent, we would expect α = 0, β = 0, and γ= 1. In other words, the only thing that predicts P (Make) is the difficulty of the shot. However, if the Hot Hand does exist,
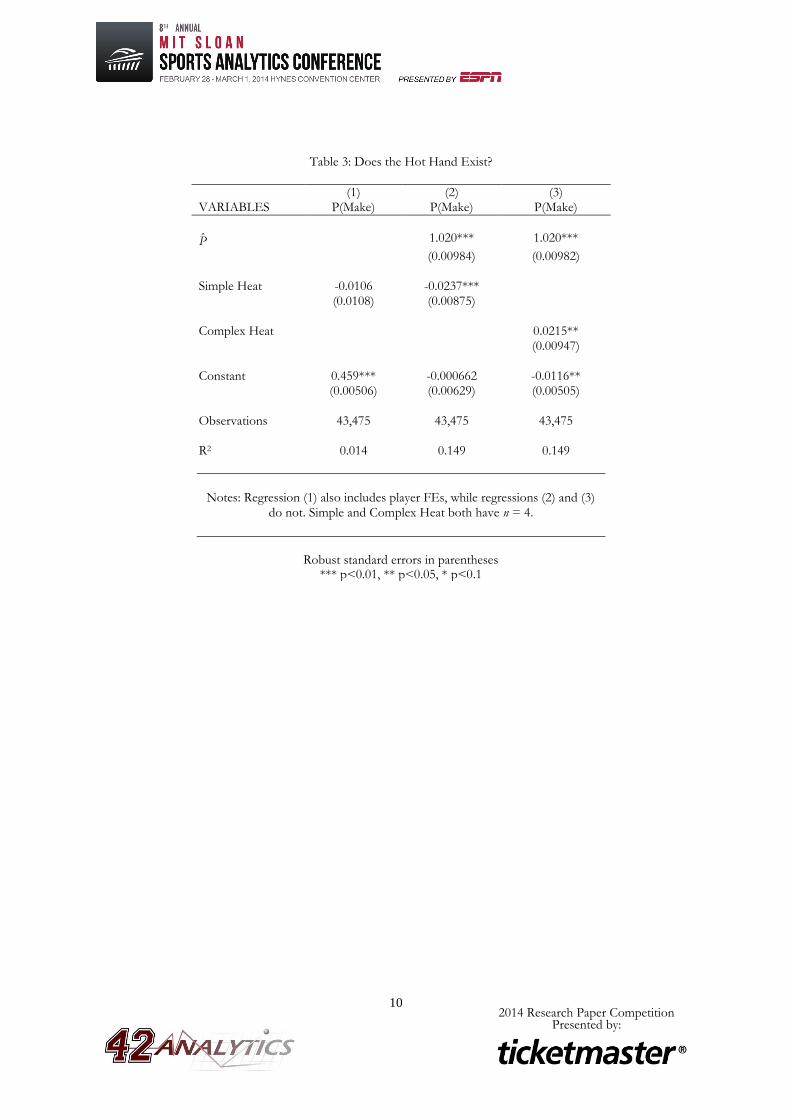
we would expect to find β > 0. 4.2 Results and Discussion Column (1) of Table 3 loosely replicates the work done by Gilovich, Vallone, and Tversky by regressing a simple measure of heat and player fixed effects against the probability of hitting a shot, with no attempt to control for shot difficulty. Our results mirror the original authors’, with the coefficient on heat being negative but insignificant.
The second column introduces shot difficulty controls via P̂, but still uses Simple Heat rather than Complex Heat. As discussed previously, Simple Heat alone may be a misleading measure of heat because it does not account for factors that affect shot difficulty and remain constant across game stretches. In column (2), we actually see a supposed significant “cold hand” effect. This dramatic shift is evidence of the bias of Simple Heat: it does not control for within-player correlation such as the short defender example. Therefore, we believe that Complex Heat is a superior measure for testing for the Hot Hand. As shown in the previous section, shot difficulty increases as a player “heats up.” Therefore, it seems possible that once we control for difficulty, the Hot Hand effect would indeed emerge. Our final specification uses Complex Heat and also controls for difficulty. Looking at column (3), we finally see a positive and significant coefficient on heat. Though significant, we acknowledge that the effect size is modest. A player who makes one more of his past four shots sees his shooting percentage increase by 0.54 percentage points. Given that the average NBA player has a field goal percentage of about 45%, this represents about a 1.2% improvement. In the same vein, if a player makes two more of his past four shots (perhaps more indicative of what it truly means to be “hot”), we see a 2.4% improvement. Based on these results, concluding that the Hot Hand exists is contingent on defining “hot” correctly. A player who makes three out of his past four layups is not hot, but a player who makes three out of his past four three-point attempts is. In other words, being hot is not about the absolute number of shots a player has previously made, but rather is about how much he has outperformed, conditional on the types of shots he has taken. There are several drawbacks to the two stage empirical strategy we employ here of first estimating a Shot Difficulty
regression and then using those results to test for the Hot Hand. The principle worry is errors-in-variables: if our P̂’s are measured too imprecisely, they may produce a biased estimator. There is reason to suspect that, despite our best efforts and the extraordinary dataset at our disposal, our Shot Difficulty model does not control for or does not correctly specify individual shot difficulties. Specific concerns include: not being able to track appendages, not specifying relationships between variables (i.e., distance from the basket, defender distance, etc.) correctly, and that
player fixed effects are not precise enough to accurately estimate P̂ for individual players. Player fixed effects change the intercept of the probability that a shot goes in for each player, but they do not account for the fact that certain players “specialize” in certain shots - in other words, they do not adjust the slopes.
5 Conclusion For thirty years, the empirical consensus that the “Hot Hand” in basketball is a fallacy of the human mind has been confirmed time and again. In the same way that evolutionary biologists might regard creationists as completely misguided, economists, psychologists and statisticians have viewed the persistent belief in the Hot Hand as entirely fallacious. Amos Tversky, co-author of the canonical paper on the subject, typifies this view when he says, “I’ve been in a thousand arguments over this topic, won them all, but convinced no one” (Bar-Eli, Avugos and Raab, 2006). In this paper, thanks to SportVU’s optical tracking data, we are able to show that the key shot selection independence assumption is not a good one. Players who have either simply made more of their last few shots, or

2014 Research Paper Competition Presented by:
7
done better than expected on those shots, tend to take more difficult shots. Additionally, hot players are much more likely to take the team’s next shot and thus are not choosing shots independently. We then extend our analysis to ask if the Hot Hand exists once we control for this dependent shot selection using a regression framework that controls for past expectation and finds a small, positive, and significant Hot Hand effect. This conception of the Hot Hand as exceeding expectations is different from the popular conception of absolute outperformance. Given the endogeneity of shot selection, however, assessing the Hot Hand only through the absolute outperformance seems flawed. We caution that our use of OLS regression as the functional form of choice for most of our analysis may not be optimal. Moreover, our effect sizes are small, and it is more likely that our estimates of standard errors are imprecise than our estimates of mean effects. It is plausible that better specifications might render these small effects insignificant. Nevertheless, our effects remain significant across different specifications and with both clustered and heteroskedasticity robust standard errors. We hope this paper will spark debate and further work on the mechanisms of the Hot Hand effect in basketball. Under- standing how both players and defenses react to perceived hotness can provide valuable insight into teams’ and players’ optimal strategies and could lead to a re-evaluation of current strategies. At the very least, our findings cast doubt on the overwhelming consensus that the Hot Hand is a fallacy. Perhaps the next time a professor addresses the Harvard Men’s basketball team, the Hot Hand will not be so quickly dismissed.
Acknowledgements
We would like to thank Matt Davis, Roland Fryer, Lawrence Katz, Carl Morris and Joe Blitzstein for their help and insight. We also thank Brian Kopp, Ryan Warkins, and STATS, Inc. for providing us with the raw data. All remaining errors are our own.
References [1] Kahneman, Daniel, and Amos Tversky. “Subjective Probability: A Judgment of Representativeness.” Cognitive Psychology 3, no. 3 (1972): 430-454. [2] Gilovich, Thomas, et al. “The Hot Hand in Basketball: On the Misperception of Random Sequences.” Cognitive Psychology 17, no. 3 (1985): 295-314. [3] Adams, Robert M. “The ‘Hot Hand’ Revisited: Successful Basketball Shooting as a Function of Intershot Interval.” Perceptual and Motor Skills 74, no. 3 (1992): 934-934. [4] Koehler, Jonathan, and Caryn Conley. “The ‘Hot Hand’ Myth in Professional Basketball.” Journal of Sport & Exercise Psychology 25 (2003): 253. [5] Bar-Eli, Michael, et al. “Twenty Years of ‘Hot hand’ Research: Review and Critique.” Psychology of Sport and Exercise 7, no. 6 (2006): 525-553. [6] Rao, Justin M. “Experts’ Perceptions of Autocorrelation: The Hot Hand Fallacy Among Professional Basketball Players.” 2009. [7] Davidson, Adam. “Boom, Bust or What? Larry Summers and Glenn Hubbard Square Off on Our Economic Future.” New York Times, May 2, 2013.

2014 Research Paper Competition Presented by:
8
Appendix: Figures and Regression Tables
Figure 1: Shot Efficiency By Zone
Figure 2: Predicted versus Actual Make Percentages

2014 Research Paper Competition Presented by:
9
Table 1: Predicting Makes - List of Variables Used in Specification
VARIABLES
Quarter Dummies
Score Differential
Shot Location Dummies
Shot Category Dummies
Fastbreak Dummy
Distance of Closest Defender
Angle of Closest Defender
Shooter-Defender Height Difference
Double Covered Dummy
Quarter x Score Differential
Shot Location Dummies x Shot Category Dummies
Distance of Closest Defender x Angle of Closest Defender
Distance of Closest Defender x Shooter-Defender Height Difference
Player Fixed Effects
Observations 70,862
R2 0.149
Table 2: Do Players Believe in the Hot Hand?
(1) (2) (3) (4) VARIABLES Shot Distance Defender Distance P(Same Shooter) P̂
Heat 2.144*** -0.183*** 0.0610*** -0.0419*** (0.180) (0.0393) (0.00927) (0.00380)
Constant 8.067*** 4.126*** 0.457*** (0.262) (0.138) (0.000904)
Observations 43,475 43,475 43,467 43,475
R2 0.296 0.167 0.003
Notes: Shot Distance, Defender Distance, and Shot Difficulty regressions are OLS, while P(Same Shooter) is probit, and coefficients are marginal effects. Regressions also include controls as described in the body of the paper. Complex Heat has n=4.
Robust standard errors in parentheses *** p<0.01, **p<0.05, * p<0.1
2014 Research Paper Competition Presented by:
10
Table 3: Does the Hot Hand Exist?
(1) (2) (3) VARIABLES P(Make) P(Make) P(Make)
P̂ 1.020*** 1.020***
(0.00984) (0.00982) Simple Heat -0.0106 -0.0237*** (0.0108) (0.00875) Complex Heat 0.0215** (0.00947) Constant 0.459*** -0.000662 -0.0116** (0.00506) (0.00629) (0.00505) Observations 43,475 43,475 43,475
R2 0.014 0.149 0.149
Notes: Regression (1) also includes player FEs, while regressions (2) and (3)
do not. Simple and Complex Heat both have n = 4.
Robust standard errors in parentheses *** p<0.01, ** p<0.05, * p<0.1