2014 program summary final
DESCRIPTION
ÂTRANSCRIPT

Annual Program
Summary Report
2013-2014 Program Year
September 1, 2013 – August 31, 2014

2
Table of Contents
Overview and Analysis……..……………………………………………………….… 3-4
Summary of Program Outcomes...….…………………………………………….. 5
School-based programs
JUMP......………………………………………………………………………………… 6-7
JOG….…………………………………………………………………………………… 8-9
E CITY…………………………………………………………………………………… 10
Employment and Internship programs
Summer Jobs Programs…….……………………………………………………………... 11-12
Pathways Internship Programs…………………………………………………………..... 13
Summer Youth Employment Program…………………………………………………… 14-15
Alumni Statistics……..…………………………………………………………………….. 16
3
Overview and Analysis
This document is the annual presentation of data and information on how Y.O.U. programs
performed relative to their goals and outcomes. Summary organizational data is presented first,
followed by sections on each individual program or project.
Y.O.U. Programs are divided into two areas:
School–based programs: year-round comprehensive initiatives that have evidence-based
practices tied to addressing school success and high school graduation, (JUMP and JOG)
and an entrepreneurship program that helps youth develop financial literacy and business
planning skills (E CITY);
Job Placement and Internship programs that provide basic employability skills, connect
youth to work opportunities that apply the employability skills they learned, and provide
an understanding of what attributes are needed to succeed in work.
Methodology
All Y.O.U. reported data has been verified by source documentation. For example a youth is not
considered a high school graduate unless a written or electronic document from the school
system proves the diploma has been received. Self-reported data is not shared unless it has been
substantiated.
Protocols for gathering information and statistics are guided by strict standards. First, program
staff collect information and store it electronically in a performance management system or other
software. Then, all information is verified by a second party that did not participate in provision
of services. For most programs Y.O.U.’s Strategic Organizational Advancement Department
functions in this role and serves as a quasi-independent entity. Because of the size and volume
of Y.O.U.’s summer jobs program, data is verified by a separate administrative team whose sole
purpose is to ensure accuracy.
Results for Program Year 2014
Graduation rates remained relatively stable from last year (2.8% decrease). This statistic is only
collected for the programs that have evidence-based curriculum that research indicates affects
high school graduation. The number of seniors used to calculate graduation this year was 144
(165 last year). Because this number is relatively small, on average every time the equivalent of
1.44 youth does not graduate, it impacted the total rate by 1%. The JUMP Glenville site
underperformed compared to the Y.O.U. average this year. Staff will investigate the reasons
why this occurred.
This year’s post-secondary success rate, 94%, is the highest score achieved to date. This may be
a reflection of program improvements, however it may be attributable to more accurate data
collection methods. In past years when a youth’s status was unknown, it was considered a non-
successful post-secondary placement. In this report, youth whose information was unknown was
not counted in the calculation of post-secondary success.

4
The primary determination of success in private sector jobs is whether youth retain employment
for at least 90 days; our organizational goal is 70%. This past year 86% met this benchmark,
6% higher than last year and 16% higher than our goal. Summer jobs statistics showed modest
changes or were stable. The number of youth placed in summer jobs decreased by 2% due to
less funding, and 94% of youth successfully completed the program, above our goal of 90% and
almost identical to last year’s rate.
Per Y.O.U.’s strategic plan, we began hosting two alumni events where we asked alumni how
they were faring in their post-secondary experience. The sample size is small, as both events
drew youth primarily from the past two program years (2012 and 2013) but as far back as 2006.
Surveys provided information on current employment and school status. Alumni data is the
only information where self-reported data is shared without verification. The information will be
used to help us develop ways to interact with alumni in the future.
For more information or to answer any questions about this report please contact:
Craig Dorn, Vice President, Strategic Organizational Advancement
Youth Opportunities Unlimited
1361 Euclid Avenue
Cleveland OH 44115
(216) 566-5445 ext. 234

5
Summary of Outcomes
PY 2014 PY 2013
Total Youth Served 4,231 4,139
Unduplicated Youth Served 4,102 3,801
Goal PY2014 PY2013
High School Graduation Rate * 85% 84.% 87%
Matriculation Rate * 85% 90% 94%
Post-Secondary Success Rate * 80% 94% 80%
Private Sector Job Retention Rate 70% 86% 81%
Subsidized Summer Job Retention Rate 90% 94% 94%
*JUMP and JOG program only
Enrollment by Program
Goal PY2014 PY2013
Goal PY2014 PY2013
JUMP 150 153 173
Pathways
Internships 100 94 n/a
JOG 170 182 153
CMSD
Experience
Internships n/a 16 65
E CITY 64 66 104*
BioMedTech
STEM GLSC
Internships 24 33 20
PrimeTime 70 116 96
Connecting
The Dots 15 13 n/a
Alumni
Events n/a 100 n/a
MyCom 225 255 279
* E CITY Goal in PY2013 was 120
Summer
Youth
Employment
Program
2,500 3,127 3,189

6
JUMP (Jobs Unlimited Mentoring Program)
An after-school program that provides youth instruction and coaching from a paid full-time
professional mentor, the aim of JUMP is to help youth graduate high school, develop a career
path, and learn employability and social-emotional skills. Other major elements of the program
include academic/attendance support, community service and college access activities. Youth
participants are self-selected and enroll during the 10th
or 11th
grade year, remaining with the
program for one year after high school graduation.
Locations: Euclid High School, John Adams High School, Shaw High School, Glenville High
School, Lincoln West High School, and MC2 Stem High School
Expected Outcomes: HS Graduation, Advance to next grade level, post-secondary success
Total youth enrolled 153
Graduation Rate 81%
Advance to next grade rate 88%
Post-secondary success rate 94%
At each site except Glenville, JUMP youth graduated at a rate higher than the school. Our goal is
to have youth graduation rates at least 15% higher than the school we are serving. This goal was
achieved at 4 of the 5 sites. MC2STEM did not have any seniors so graduation rates were not
calculated for this site.
100%
44.4%
100%
63.6%
100%
80.9%
0%
20%
40%
60%
80%
100%
Euclid
n=15
Glenville
n=9
John Adams
n=7
Lincoln West
n=11
Shaw
n=5
Total
n=47
Graduation Rates by School Site
Program Youth School
District Organizational Goal (85%)

7
JUMP (Jobs Unlimited Mentoring Program)
Our goal was achieved or exceeded at 4 of the 6 sites. Not meeting the goal at Euclid was
attributable to the low number of underclassmen served (10 of 12 advanced a grade level): each
youth who did not advance a grade represented 8.3%. We are in the process of gathering
information to determine what variables contributed to Glenville site having lower than expected
results in graduation and advancing to the next grade level.
The results above indicate 80% of graduates are living JUMP’s purpose of
being a self-sufficient adult.
83.3%
62.5%
94.4% 85.7%
96% 95% 87.6%
0%
20%
40%
60%
80%
100%
Euclid
n=12
Glenville
n=16
John Adams
n=18
Lincoln West
n=14
MC2STEM
n=25
Shaw
n=20
Total
n=105
JUMP Youth Rate of Advancing to next grade level
Organizational Goal (85%)
60% in college
7% employed
13% in college and
employed
5% not working/not
in college
15% unknown
JUMP Post-Secondary Status
n=75

8
JOG (Jobs for Ohio’s Graduates)
JOG is an in-school, classroom-based program where Y.O.U. staff teach and provide individual
coaching on career development, employability, life and leadership skills. JOG is associated
with Jobs for America’s Graduates, a national network of drop-out prevention programs in over
30 states. The program model is most effective when youth enroll during their 11th
grade year
and remain with the program for one year after HS graduation.
Because JOG is classroom based, Y.O.U. does not have control over youth enrollment as youth
are scheduled to participate by school administrators. The JOG model is designed to serve up to
45 youth per cohort. However, sometimes schools schedule additional youth in the class. So
when reporting the number of youth served there are two categories.
Total youth enrolled who receive all elements of programming
Additional youth served who took the JOG class, but did not get the full complement of
individual coaching and mentoring services.
Locations: Glenville High School, JFK High School, John Adams High School, and Lincoln
West High School.
Expected Outcomes: HS Graduation, advance to next grade level, post-secondary success
Total youth enrolled 182
Additional youth served 76
Graduation Rate 86%
Advance to next grade rate 94%
Post-secondary success rate 95%
Our goal is to have youth graduation rates at least 15% higher than the school we are serving.
This goal was achieved at 3 of our 4 sites. At John Adams our youth graduated at a rate 10%
better than the school average.
84.9% 84.9%
72.7%
95%
85.6%
0%
20%
40%
60%
80%
100%
Glenville
n=33
John F Kennedy
n=33
John Adams
n=11
Lincoln West
n=20
Total
n=97
Graduation Rates by Site
Program Youth School District Organizational Goal (85%)

9
JOG (Jobs for Ohio’s Graduates)
Goal was met or exceeded at 3 of the 4 sites and nearly met at Lincoln-West.
Staff follow youth for one year after high school graduation to determine their status. We
maintained contact with nearly 90% of graduates. Of that group, 84% were in college or
employed.
100% 100% 93.9%
84.2%
93.8%
0%
20%
40%
60%
80%
100%
Glenville
n=17
John F Kennedy
n=11
John Adams
n=33
Lincoln West
n=19
Total
n=80
Advance to next grade level rates by Site
Organizational Goal (85%)
33% in college
30% employed
21% in college
and employed
4% not working/
not in college
12% unknown
JOG Post-Secondary Status
n=91

10
E CITY (Entrepreneurship: Connecting, Inspiring & Teaching Youth)
E CITY teaches youth financial literacy, business and entrepreneurship skills using curriculum
from the Network for Teaching Entrepreneurship (NFTE). Y.O.U. is the sole licensee for NFTE
in the 4-county region including Cuyahoga, Lake, Summit and Lorain. The primary goal is to
teach how to develop a business plan and encourages youth to start a venture. Youth are also
connected to employment and college access. Recruitment is based on youth’s interest in
entrepreneurship. However, since E CITY is a scheduled class, youth are enrolled based on the
selection of school administrators.
Locations: John F Kennedy High School, Shaw High School, Horizon Science Academy,
Thomas Harvey High School (Painesville)
Expected outcomes: Increased knowledge of business planning and some youth may start a
business
Total youth enrolled 66
Average increase from pre to post assessment of business skills 25%
Number of youth who started a viable business 7
The E CITY assessment tests youth knowledge of business plan development such as sales,
marketing, financial management, production and distribution. At each site scores increased
indicating youth did acquire additional knowledge of business plan development. Youth pre-test
scores were quite variable ranging from a little over 30% at JFK to nearly 70% at Thomas
Harvey. This underscores the fact that we serve youth who enter the program with differing
baseline knowledge of business skills.
44.9%
70.3%
0%
20%
40%
60%
80%
100%
Thomas Harvey HS
n=9
Horizon Science
Academy
n=13
John F Kennedy HS
n=18
Shaw HS
n=13
Total
n=53
Average Scores for E CITY Assessment of busines knowledge by site
Pre-test and Post-test
Pretest Post-test

11
Summer Youth Employment Program (SYEP)
SYEP provides youth ages 14-24 with a 4-10 week summer work experience. Youth are
provided an opportunity to develop their employment history, gain practical work experience,
and learn what it takes to be successful in the workplace. There are several distinguishing
characteristics of this program:
Broad focus that serves almost every zip code in Cuyahoga County;
Collaboration with over 75 community partners who provide unique work experiences
and help Y.O.U. recruit youth or target particular neighborhoods;
Emphasis on financial literacy and saving money through a direct-deposit bank program
that received national recognition from United States Consumer Financial Protection
Bureau and Young America Saves;
Sustainability- and STEM-related experiences for City of Cleveland youth through the
Frank G. Jackson Summer Youth Employment Program headquartered at the City of
Cleveland Department of Water. A number of youth receive college credit through a
collaboration with Cleveland State University
Locations:
County program served youth and worksites in most communities with the majority residing
in Cleveland, Euclid, Cleveland Heights, Garfield Heights, Maple Heights, East Cleveland,
Shaker Heights, South Euclid, Warrensville Heights, Bedford, Bedford Heights, Parma,
Richmond Heights and Lakewood
City-funded programs are located at Department of Public Utilities facilities including
Cleveland Public Power, Division of Water, Water Pollution Control, Hopkins International
Airport and Burke Lakefront Airport
Expected Outcome: Successful completion of a work experience
Total youth enrolled and placed in summer jobs 3,127
Total employers participating 193
Total worksites 567
Completion rate 96%
Youth who were hired after summer program 135

12
Summer Youth Employment Program (SYEP)
All programs exceeded the goal of at least 90% completing the work experience successfully.
While retention through completion is the primary goal, we collect other statistics that
underscore the program’s success in promoting financial literacy, helping youth understand skills
needed for success at work, and good will among the employers who hire youth. The indicators
below underscore the importance of summer employment for teens.
2,803 youth (89.6%) made a savings pledge
82% of participants planned to use the savings account after the program concluded
85% of employers would hire the youth if funding permitted (up 13% over 2013.)
87% of employers would recommend the youth to another employer (3% increase from
84% in 2013)
88% employers agreed their youth had the skills they expected of an entry level
employee, (increase of 7% over 2013)
14,761 youth registered online to apply for summer employment between February 3 -
May 9, an increase of 14% from last year
98% 95% 96%
94% 97%
50%
60%
70%
80%
90%
100%
Frank Jackson
Summer Jobs
Program
n=211
MyJob
n=44
Port Control
n=23
County Younger
Youth
n=2812
County Older Youth
n=37
Summer Jobs Completion Rates by Program
Organizational Rate 90%
13
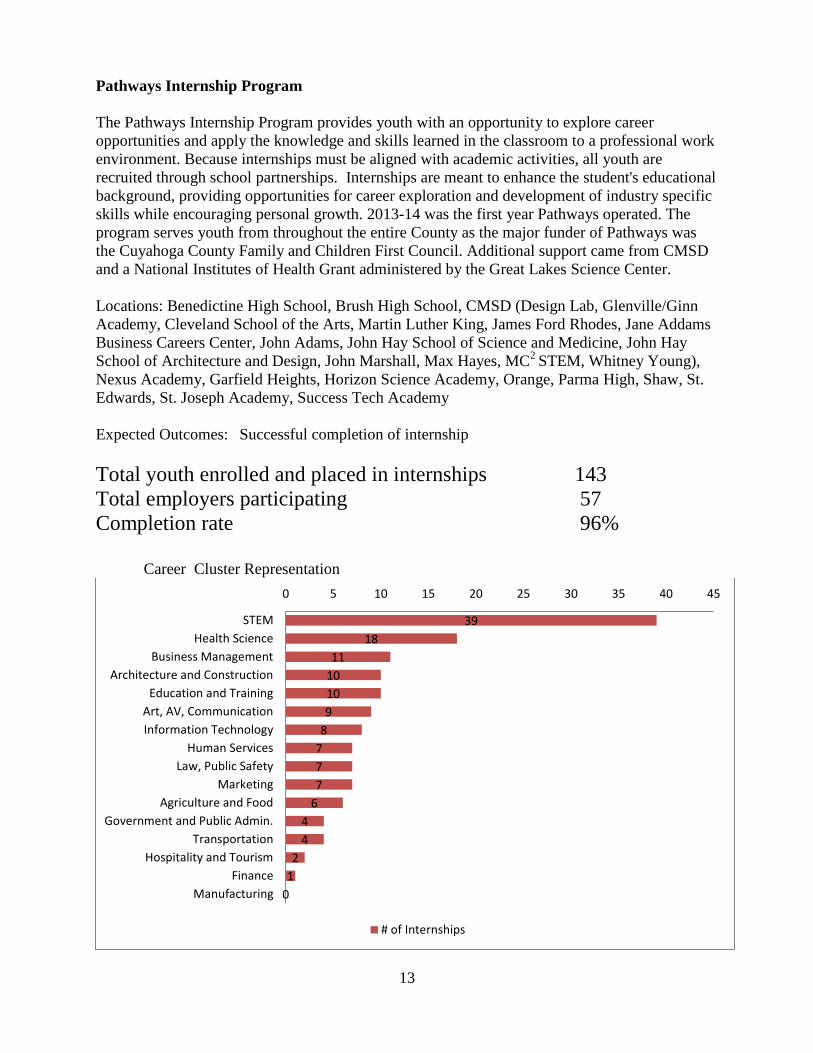
Pathways Internship Program
The Pathways Internship Program provides youth with an opportunity to explore career
opportunities and apply the knowledge and skills learned in the classroom to a professional work
environment. Because internships must be aligned with academic activities, all youth are
recruited through school partnerships. Internships are meant to enhance the student's educational
background, providing opportunities for career exploration and development of industry specific
skills while encouraging personal growth. 2013-14 was the first year Pathways operated. The
program serves youth from throughout the entire County as the major funder of Pathways was
the Cuyahoga County Family and Children First Council. Additional support came from CMSD
and a National Institutes of Health Grant administered by the Great Lakes Science Center.
Locations: Benedictine High School, Brush High School, CMSD (Design Lab, Glenville/Ginn
Academy, Cleveland School of the Arts, Martin Luther King, James Ford Rhodes, Jane Addams
Business Careers Center, John Adams, John Hay School of Science and Medicine, John Hay
School of Architecture and Design, John Marshall, Max Hayes, MC2
STEM, Whitney Young),
Nexus Academy, Garfield Heights, Horizon Science Academy, Orange, Parma High, Shaw, St.
Edwards, St. Joseph Academy, Success Tech Academy
Expected Outcomes: Successful completion of internship
Total youth enrolled and placed in internships 143
Total employers participating 57
Completion rate 96%
Career Cluster Representation
39
18
11
10
10
9
8
7
7
7
6
4
4
2
1
0
0 5 10 15 20 25 30 35 40 45
STEM
Health Science
Business Management
Architecture and Construction
Education and Training
Art, AV, Communication
Information Technology
Human Services
Law, Public Safety
Marketing
Agriculture and Food
Government and Public Admin.
Transportation
Hospitality and Tourism
Finance
Manufacturing
# of Internships

14
Job Placement Programs
Y.O.U. offered three community-based job placement programs 2014-2015 that prepare youth
for paid work experiences that include summer, temporary jobs or permanent, long-term
employment. Some models are intensive and include significant instruction, other models
provide a basic overview of job readiness.
Prime Time – (Fairfax Youth Initiative and P-16 Broadway Project)
This after-school program helps high school youth learn employability skills and participate in
community involvement activities. A Career Coach meets with students two days per week.
Youth may participate in the program for as many years as they like as long as they are still
attending high school.
Location: Cleveland Public Library Branches: Martin Luther King and Fleet
Expected outcomes: Placement and retention into work experiences
Total youth enrolled 116
Youth employed 44
Job Retention / Completion rate 84%
MyCom
A community-wide youth development initiative, MyCom has several elements including after-
school programming and neighborhood engagement. Y.O.U. is the lead agency for the youth
employment initiative. Working with neighborhood agencies, Y.O.U. provides instruction and
guidance to youth on job search techniques and places youth in private-sector and summer
employment.
Location of MyCom neighborhoods: Central, Cudell, Mt. Pleasant, Parma, St. Clair-Superior,
Shaker Heights, Slavic Village, Fairfax, Hough, Little Italy, Glenville, East Cleveland, and
Buckeye Shaker
Expected outcomes: Placement and retention into work experiences
Total youth enrolled year-round services 255
Youth employed summer jobs 1,791
Completion rate summer jobs 94%

15
Connecting the Dots
Through a partnership with Ohio Means Jobs – Cleveland-Cuyahoga County, Y.O.U. provided a
subsidized work experience for young adults between the ages of 18-21 aging out of the foster
care system. All youth participated in an employability skills boot camp that focused on
etiquette, attendance, work place communication, decision making, time management and
creating a transportation plan prior to receiving their job placement. Youth were paid $10 an
hour for 25 hours a week over a four week period.
Expected outcomes: Youth placement and retention into work experiences
Total youth enrolled 13
Youth employed 11
Job Completion rate 100%

16
Alumni Data
Y.O.U. began reaching out to alumni in 2012 to continue our relationship after high school
graduation. Two annual events provide activities and networking opportunities and allow Y.O.U.
to collect data on the employment and education status of alumni. In 2014, the youth self-
reported the following data which has not been verified by independent source documentation.
26% Working
Full-time
30% Working
Part-time
1% self employed
2% other
28% Not employed
and seeking
employment
6% Not employed or
seeking employment
7% No response
Alumni Employment Status *
n=100
48% Full-time student
10% Part-time student 2% Other
31% Not a student
9% No response
Alumni College Status *
n=100