2014 profile-of-international-home-buying-activity-2014-07-09
TRANSCRIPT

1 | P a g e
2014 Profile of International Home Buying Activity
Purchases of U.S. Real Estate by International Clients for the
Twelve Month Period Ending March 2014 NATIONAL ASSOCIATION OF REAL
Lawrence Yun, Senior Vice President Jed Smith, Managing Director, Quantitative Research Gay Cororaton, Research Economist June 2014
2 | P a g e
Table of Contents
I. INTRODUCTION AND KEY FINDINGS ....................................................................................................... 3
International Sales: $ 92.2 Billion in 12 Months Ending March 2014 ..................................................... 3
International Sales are Geographically Concentrated and Segmented .................................................. 6
Specialized Expertise: Important in International Transactions ............................................................ 7
II. INTERNATIONAL BUYERS: ORIGINS AND PREFERENCES ........................................................................ 8
Countries of Origin .................................................................................................................................. 8
State Destinations of International Buyers ............................................................................................. 9
Prices and Financing ............................................................................................................................. 12
Intended Use and Type of Property ...................................................................................................... 15
Factors and Reasons Affecting the Purchase ........................................................................................ 18
III. Profile of Top 5 Buyers by Country ....................................................................................................... 20
Canada .................................................................................................................................................. 20
China ..................................................................................................................................................... 23
India ...................................................................................................................................................... 26
Mexico .................................................................................................................................................. 29
United Kingdom .................................................................................................................................... 32
IV. REALTOR® EXPERIENCE IN SERVING INTERNATIONAL CLIENTS............................................................ 36
V. CONCLUSIONS ....................................................................................................................................... 43
APPENDIX 1: Methodology for Estimation of International Sales ............................................................... 44
APPENDIX 2: realtor.com® Data on U.S. Cities of Major Interest to Foreigners .......................................... 46
About NAR’s Commercial & Global Services Group ............................................................................. 59

3 | P a g e
I. INTRODUCTION AND KEY FINDINGS
Since 2007, the National Association of REALTORS® (NAR) has conducted a yearly survey to
measure the level of sales of U.S. residential real estate to international clients. The survey
provides information about the origin, destination, and buying preferences of international
clients as well as the challenges and opportunities faced by REALTORS® in the international
market. The 2014 Profile of International Home Buying Activity presents the analysis of data
gathered from REALTORS® on purchases of U.S. residential real estate by international clients
made during the 12 months ending March 2014. There were 3,547 respondents to the survey,
conducted from April 14 - May 14, 20141.
The term international client refers to two types of purchasers of properties.
o Type A, Non-Resident Foreigners: Foreign clients with permanent residences outside the
U.S. These clients typically purchase property for investments, vacations, or visits of less than
six months to the U.S.
o Type B, Resident Foreigners: Clients who are recent immigrants (in the country less than two
years) or temporary visa holders residing for more than six months in the U.S. for
professional, educational, or other reasons.
International Sales: $ 92.2 Billion in 12 Months Ending March 2014
For the period April 2013 through March 2014, the total sales volume to international clients
(“international sales”) has been estimated at approximately $92.2 billion, a 35 percent increase
from the previous period’s level of $68.2 billion. The dollar level of international sales was
roughly 7 percent of the total U.S. Existing Homes Sales (EHS) market of $ 1.2 trillion for the
same period2. Compared to the previous year, sales to foreigners increased both in numbers of
transactions and in average price. Of total international transactions, approximately $45.5
billion were attributed to Type A non-resident foreigners; and approximately $46.7 billion were
attributed to Type B resident foreigners. The computations are delineated in the Appendix.
1 The survey was sent to a random sample of about 100,000 REALTORS®.
2 Sales figures in dollars are not a measure of GDP, for sales represent the transfer of existing assets that
were previously counted in the GDP during the time of construction. However, GDP is generated from the sale of existing homes as a result of services during and after the transaction, for example, commissions, fees, remodeling, etc.

4 | P a g e
4% 4%
92%
Estimated Existing Home International Sales: $92.2 Billion 4/2013 through 3/2014
Type A Type B Not International
$ 66.4
$ 82.5
$68.2
$92.2
2011 2012 2013 2014
Estimated U.S. Existing Home Sales Dollar Volume to International Buyers (in Billion Dollars, 4/2013-3/2014)

5 | P a g e
International clients typically purchase upscale/higher-priced homes.
International buying activity apparently was bolstered by continued rising affluence in China,
Canada, India, Mexico, and the United Kingdom. In addition, the appreciation of the Chinese
yuan and the British pound also made the purchase of U.S. property increasingly affordable for
residents of those countries. 3 Purchasing a U.S. property remains affordable with prices still
below the peak level attained prior to the Great Recession (December 2007—June 2009). Tight
3 An appreciation or strengthening of the local currencies relative to the dollar means that international
clients need to spend less of their home currency to buy U.S. homes in dollars.
$338 $311 $316
$405 $354
$396
$232 $217 $218 $212 $228 $247
$-
$100
$200
$300
$400
$500
2009 2010 2011 2012 2013 2014
Tho
usa
nd
s
Mean Purchase Price of International and Domestic Clients ( in Thousand Dollars)
Mean Purchase Price of International Clients
Mean Purchase Price, U.S. Existing Home Sales
$247 $219 $228
$274
$226
$268
$189 $172 $170 $165
$180 $200
$0
$50
$100
$150
$200
$250
$300
2009 2010 2011 2012 2013 2014
Tho
usa
nd
s
Median Purchase Price of International and Domestic Clients ( in Thousand Dollars)
Median Purchase Price of International Clients
Median Purchase Price, U.S. Existing Home Sales

6 | P a g e
credit standards in the U.S. have also favored buyers paying with cash or making high down
payments when presenting a contract for sale. International clients frequently pay cash.
International Sales are Geographically Concentrated and Segmented
The international home sales market in the U.S. remains concentrated in terms of purchasers’
home country and preferred destination. International buyers of U.S. properties came from
nearly all over the globe, but five countries (Canada, China, Mexico, India, and the United
Kingdom) accounted for 54 percent of the reported transactions in the recent study. Canada
-7
-2
3
8
13
20
00
20
01
20
02
20
03
20
04
20
05
20
06
20
07
20
08
20
09
20
10
20
11
20
12
20
13
20
14
Percent GDP Growth
China India Canada United Kingdom Mexico
Source: IMF-WEO, April 2014
0.0000
2.0000
4.0000
6.0000
8.0000
10.0000
12.0000
14.0000
16.0000
0.0000
0.2000
0.4000
0.6000
0.8000
1.0000
1.2000
Q1
/20
10
Q2
/20
10
Q3
/20
10
Q4
/20
10
Q1
/20
11
Q2
/20
11
Q3
/20
11
Q4
/20
11
Q1
/20
12
Q2
/20
12
Q3
/20
12
Q4
/20
12
Q1
/20
13
Q2
/20
13
Q3
/20
13
Q4
/20
13
Q1
/20
14
Local Currencies Per 1 US Dollar CanadianDollar/USD Pound/USD Yuan/USD Mex Pesos/USD
Yuan, Mex Pesos Can.Dollar, UK Pound

7 | P a g e
was the top source of international clients in terms of transactions volume, but China accounted
for the largest sales dollar volume because of the higher average price of properties purchased
by Chinese buyers. Chinese buyers tended to buy properties in higher-priced markets such as
California, Washington, and New York, while Canadians bought in lower-priced markets such as
Florida and Arizona. NAR estimates that the total international sales from Chinese buyers rose
to $ 22 billion in the 12 months ended March 2014, up from $ 12.8 billion in the prior period.
This accounts for about 24 percent of the total international dollar sales.
There is international activity throughout the country, but the top five states (Florida, California,
Arizona, Texas, and New York) accounted for 55 percent of the total reported purchases by
foreigners in terms of number of units sold.
Specialized Expertise: Important in International Transactions
REALTOR® specialization on the buyer’s side of the market--such as cultural affinity or
orientation with the prospective purchaser, foreign language capabilities, and experience in
explaining U.S. real estate procedures and requirements to foreigners--appears to be important
in bringing an international transaction to successful conclusion. Approximately 28 percent of
REALTOR® respondents reported having worked with international clients, about the same as in
previous years. Approximately 88 percent of REALTORS® with international clients had 1 to 5
clients; four percent had more than 10 clients. Experience and expertise generally go hand in
hand, especially in an industry that is based on personal contact. REALTORS® looking to gain
expertise regarding working with international clients should look into NAR’s Certified
International Property Specialist (CIPS) designation. The designation offers specialized training
to help agents facilitate international transactions
Sales ($) % Share Sales ($) % Share
Canada $11.8 17% $13.8 15%
China $12.8 19% $22.0 24%
Mexico $3.6 5% $4.5 5%
India $3.9 6% $5.8 6%
United Kingdom $4.2 6% $5.8 6%
Total International Sales $68.2 $92.2
Estimate of International Sales from Major Buyers
2013 2014
( In Billion Dollars)

8 | P a g e
II. INTERNATIONAL BUYERS: ORIGINS AND PREFERENCES
Foreign purchasers are interested in U.S. real estate for a variety of reasons: as a place to live
for those relocating in the U.S. for a job or for children going to college, for investment and
portfolio diversification, and for vacation purposes. It is possible to offer some general
comments on buying preferences—although one can easily find counter examples to any
statement. Buyers tend to cluster in specific locations based on their countries of origin,
probably based on word-of-mouth and shared experiences. Proximity to the home country may
be important--e.g., Europeans locating on the East Coast and Asians locating on the West Coast.
International buyers are diverse—some looking for trophy properties and other buyers looking
for very modest vacation properties.
Countries of Origin Five countries have historically accounted for the bulk of the reported purchases: namely,
Canada, China (PRC, Hong Kong, Taiwan), Mexico, India, and the United Kingdom. In the latest
survey, these countries accounted for approximately 54 percent of the reported international
transactions from 61 countries. Canada still accounts for the largest share of clients, but China is
the fastest growing source of clients, now accounting for 16 percent in the period ending March
2014, up from 9 percent since this data was collected in 2007.
Brazil Canada China France Germany India Japan Mexico RussiaUnited
Kingdom
2010 1% 23% 9% 3% 4% 5% 1% 10% 3% 9%
2011 3% 23% 9% 4% 4% 7% 2% 7% 1% 7%
2012 3% 24% 12% 3% 3% 6% 1% 8% 2% 6%
2013 2% 23% 12% 2% 3% 5% 1% 8% 2% 5%
2014 2% 19% 16% 2% 3% 5% 2% 9% 1% 5%
0%
5%
10%
15%
20%
25%
30%
Distribution of International Sales by Country of Origin

9 | P a g e
State Destinations of International Buyers
The top four states in terms of number of buyers continued to be Florida, California, Texas, and
Arizona. In 2014, these states accounted for 55 percent of total reported international sales.
Washington is becoming increasingly attractive to international clients, possibly because it is a
magnet for technology jobs.
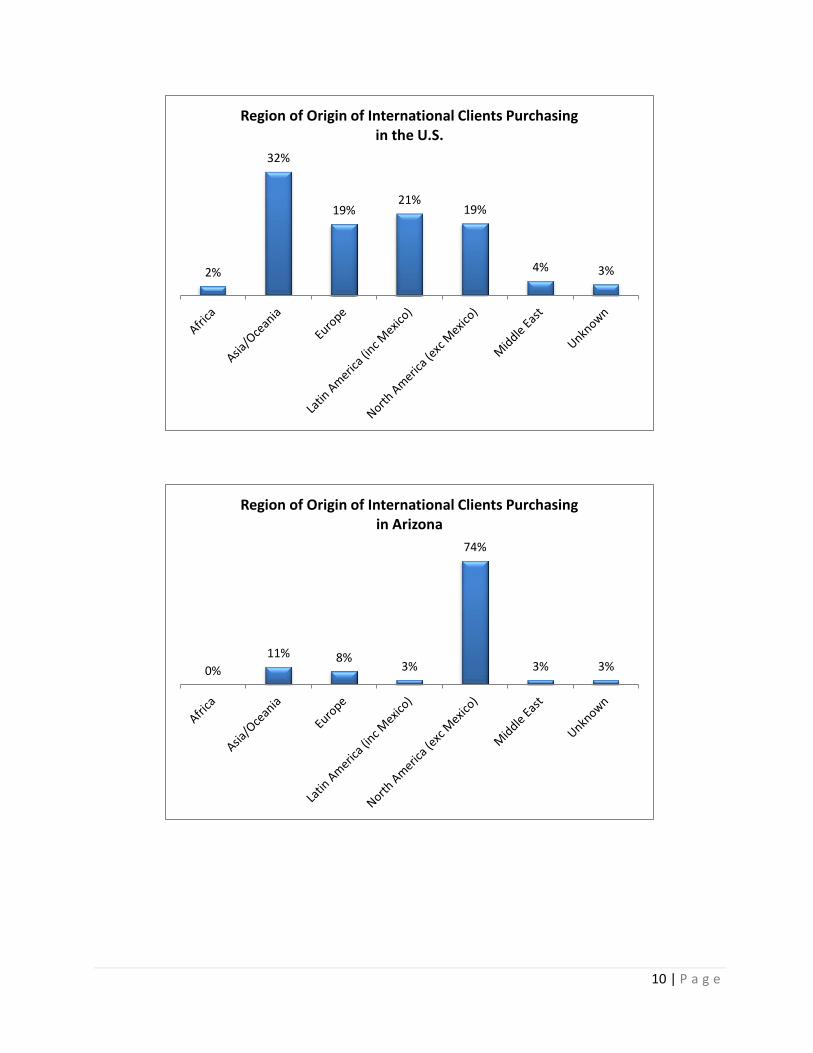
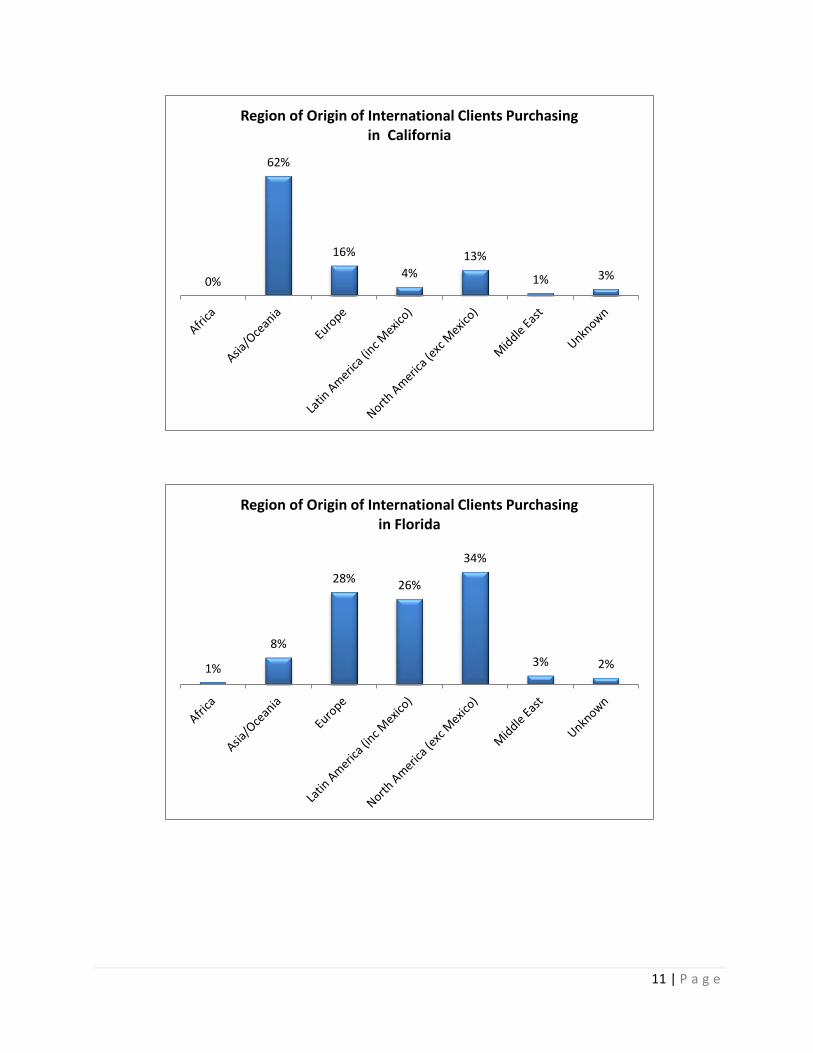
Proximity to the home country, the presence of relatives, friends and associates, job and
education opportunities, and climate and location appear to be important considerations to
prospective buyers. For example, Europeans are attracted to states with warmer climates such
as Florida and Arizona. The West Coast is attractive to Asian purchasers. Buyers from Mexico
favor states in close proximity such as Texas and Arizona. Florida appears to be attractive to
South Americans as well as Europeans and Canadians. Buyers from India are locating in
urbanized areas and states that are home to IT companies such as California, New York, and
North Carolina. Within markets in an individual state, it is not unusual to find concentrations of
people grouped by nationality. One could speculate that word-of-mouth and shared
experiences influence the purchase.
10 | P a g e
2%
32%
19% 21%
19%
4% 3%
Region of Origin of International Clients Purchasing in the U.S.
0%
11% 8% 3%
74%
3% 3%
Region of Origin of International Clients Purchasing in Arizona
11 | P a g e
0%
62%
16%
4%
13%
1% 3%
Region of Origin of International Clients Purchasing in California
1%
8%
28% 26%
34%
3% 2%
Region of Origin of International Clients Purchasing in Florida

12 | P a g e
Prices and Financing
The types of homes purchased by international clients frequently tend to be different from the
types of homes purchased by domestic U.S. buyers. For example, the international non-resident
Type A client is likely to be substantially wealthier than the median domestic buyer, may be
looking for a trophy property, and is probably looking for a property to be purchased after
having met essential living needs. The international resident Type B client will also tend to be
more affluent than many domestic buyers, and may be looking for a property in a specialized
niche, for example, a larger property suitable for multi-generational living, or a property that
establishes the individual’s presence and standing in the community.
Based on the reported transactions, the mean and median prices of international purchases
were higher compared to purchase prices of all buyers of existing homes4.
4 NAR focuses on median home prices in reporting the Existing Home Sales market. This approach integrates
market dynamics with the buying power of individuals with median incomes. However, in estimating the size of the international market, it is necessary to use average price in order to multiply by quantity in reaching total market size.
4%
18%
9%
59%
5% 3% 3%
Region of Origin of International Clients Purchasing in Texas

13 | P a g e
Approximately 46 percent of international clients bought properties worth up to $250,000.
Buyers from China, India, and the United Kingdom purchased properties above the median price.
This is because buyers from China and India tend to buy in states with higher property prices
such as California, Washington, and New York, while the Canadians tend to buy in Florida and
Arizona where prices are cheaper.
Mean Price Median Price
U.S. Existing Home Sales $247,417 $199,575
International Sales $396,180 $268,284
Average Mean and Median Prices from April 2013-March 2014
51% 56% 54% 45%
54% 46%
30% 28% 28% 30%
23% 29%
12% 10% 13% 15% 15% 16%
7% 7% 5% 10% 7% 9%
0%
20%
40%
60%
80%
100%
2009 2010 2011 2012 2013 2014
Pe
rce
nta
ge o
f R
esp
on
de
nts
Wit
h C
lien
ts
Purchase Price (Percentage Distribution)
up to $250,000 $250,001 to $500,000 $500,001 to $ 1M $ 1M up
Canada China India MexicoUnited
Kingdom
Median Price $212,500 $523,148 $342,857 $141,071 $350,000
Mean Price $314,718 $590,826 $459,028 $224,123 $499,242
$-
$100,000
$200,000
$300,000
$400,000
$500,000
$600,000
$700,000
Purchase Prices of Top 5 International Homebuying Countries Based on Reported Transactions from Apr 2013-Mar 2014

14 | P a g e
International clients frequently make all-cash purchases compared to domestic buyers. In the
2014 survey, approximately 60 percent of reported transactions were all-cash sales, up from a
third since this data was collected in 2007. In contrast, about a third of domestic sales have
been all-cash. Mortgage financing tends to be a major problem for international clients due to a
lack of a U.S. based credit history, lack of a Social Security number, difficulties in documenting
mortgage requirements, and financial profiles that are different in some cases from those
normally received by the financial institution from domestic residents.
Approximately 75 percent of REALTORS® reported that the value of the dollar had a moderate
to significant impact on international sales. The values of all currencies fluctuate based on a
variety of supply and demand factors influenced by trends in international commodities,
industry competitiveness, and the flow of international investments. When a foreign country’s
currency gains in value relative to the dollar, U.S. home prices are effectively less expensive to
the foreigner than was the case prior to the change in currency values. The converse is also
true.
28% 43%
46% 55% 62% 62% 63% 60%
69% 54%
52% 44% 36% 37% 35% 38%
0%
10%
20%
30%
40%
50%
60%
70%
80%
90%
100%
2007 2008 2009 2010 2011 2012 2013 2014
Pe
rce
nta
ge o
f R
esp
on
de
nts
Wit
h C
lien
ts
Type of Financing (Percentage Distribution)
All cash (no mortgage financing) With mortgage financing Don't know

15 | P a g e
Intended Use and Type of Property
About 42 percent of reported international transactions were intended for primary residences.
International students enrolled in U.S. colleges and universities, recent immigrants, and
professional and managerial employees of businesses and institutions who are in the U.S. on a
temporary but extended visit may plan on using the property year round for primary residence.
Non-resident foreigners are limited to 6-month stays in the U.S., so these international buyers
generally expect to use the property for vacation/rental purposes and as an investment.
Purchasing a residential/rental property may be economically advantageous for an international
buyer, for the buyer is able to use the property as a secondary/vacation home while being able
to rent out the property during the times when the owners are not personally using the
property.
23% 21% 21% 22% 24% 25%
39% 42% 40% 43% 44% 44%
37% 38% 39% 35% 33% 31%
0%
20%
40%
60%
80%
100%
2009 2010 2011 2012 2013 2014Pe
rce
nta
ge o
f R
esp
on
de
nts
Wit
h C
lien
ts
Impact of Value of Dollar (Percentage Distribution )
Not much of an effect Moderate effect Very significant effect

16 | P a g e
About half of international clients preferred to locate in a suburban area and about a quarter
located in a central city/urban area. About 13 percent located in a resort area. This is consistent
with the intended purpose of international clients to use property mostly for vacation and for
investment purposes.
21% 28% 23% 20% 17%
14%
16% 17% 17% 19%
14%
13% 14% 14% 14%
48% 37% 39% 42% 42%
2% 4% 5% 4% 4%
0%
10%
20%
30%
40%
50%
60%
70%
80%
90%
100%
2010 2011 2012 2013 2014
Pe
rce
nta
ge o
f R
esp
on
de
nts
Wit
h C
lien
ts
Intended Use of Property (Percentage Distribution )
Vacation home for family and friends Residential rental property for investment
Both For Vacation and Investment Primary residence
Commercial rental property for investment Don't know

17 | P a g e
Approximately 65 percent of transactions involved Single Family sales.5
Approximately 39 percent of reported transactions were from international clients who planned
to use the property for more than 6 months, which is consistent with earlier data that show that
buyers are buying single family homes for primary residential purposes.
5 The graph implies an absence of land sales, 2009-13. This was probably not the case. Data were too
limited for statistical reporting purposes.
25% 27% 30% 23% 25% 28%
46% 50% 43% 52% 50% 48%
15% 9% 11% 7% 11% 13%
15% 14% 17% 17% 14% 11%
0%
20%
40%
60%
80%
100%
2009 2010 2011 2012 2013 2014Pe
rce
nta
ge o
f R
esp
on
de
nts
Wit
h C
lien
ts
Type of Area (Percentage Distribution )
Central city/urban area Suburban areaSmall town/rural area Resort area
69% 67% 61% 66% 64% 65%
9% 8% 10% 7% 9% 9%
18% 23% 26% 23% 21% 18%
4% 3% 3% 4% 5% 3%
0%10%20%30%40%50%60%70%80%90%
100%
2009 2010 2011 2012 2013 2014
Type of Property Purchased (Percentage Distribution)
Detached single-family Townhouse/row house Condo/apartment
Commercial Property Land/Other

18 | P a g e
Factors and Reasons Affecting the Purchase
Of REALTORS® who had an international client, 37 percent reported that the client purchased a
property because the U.S. was a desirable location, while 56 percent cited the security and
profitability of investing in U.S. real estate.
8% 7% 8% 8% 11% 10% 13% 10% 12% 12% 9% 11%
24% 22%
24% 24% 20% 15%
38% 42% 37% 37% 41% 39%
16% 18% 19% 19% 19% 24%
0%
20%
40%
60%
80%
100%
2009 2010 2011 2012 2013 2014
Pe
rce
nta
ge o
f R
esp
on
de
nts
Wit
h C
lien
ts
Intended Months' Use (Percentage Distribution )
Less than 1 month 1 to 2 months 3 to 6 months More than 6 months Don't know
20% 18% 21% 21% 22% 25%
32% 29% 27% 31% 31% 31%
40% 45% 43% 40% 39% 37%
8% 8% 9% 8% 8% 7%
0%
20%
40%
60%
80%
100%
2009 2010 2011 2012 2013 2014Pe
rce
nta
ge o
f R
esp
on
de
nts
Wit
h C
lien
ts
Most Important Factor Influencing Purchase (Percentage Distribution )
OtherU.S. is viewed as a desirable location.U.S. real estate is viewed as profitable investment.U.S. real estate is viewed as a secure investment.

19 | P a g e
In some cases REALTORS® had international clients that did not purchase U.S. property:
cost/taxes and insurance accounted for 30 percent of the reasons cited, and financing issues
took up 19 percent.6 Immigration issues accounted for 9 percent.
Cost, taxes and insurance were mentioned by 30 percent. In some cases potential foreign
buyers were reported as not understanding the ongoing costs associated with a U.S. real
estate purchase, costs which are sometimes very different from those incurred in other
countries. Some education of the potential buyer concerning ongoing U.S. real estate
practices may be necessary.
“Could not find a property to purchase” was mentioned in 25 percent of cases. The tight
supply for property might account for this. It may also indicate that the real estate agent did
not relate well to the client’s tastes and preferences. NAR can provide extensive information
related to real estate transactions with foreign purchasers. NAR’s Commercial & Global
Services Group has extensive information on the NAR website concerning business practices
and approaches for dealing with potential foreign purchasers, including information on the
Certified International Property Specialist designation: http://www.realtor.org/global.
6 A discussion of REALTORS® with international business may be found on page 36.
10% 18% 21% 26% 24% 25% 1% 2% 1%
1% 1% 2% 30% 26% 28%
33% 29% 30% 9% 8%
8% 6%
7% 9% 21% 25% 22%
18% 21% 19%
28% 21% 20% 16% 17% 16%
0%
20%
40%
60%
80%
100%
2009 2010 2011 2012 2013 2014
Pe
rce
nta
ge o
f R
esp
on
ses
Reasons for Not Buying (Percentage Distribution )
Could not find a property to purchase Loss of home country benefitsCost/taxes/ insurance Immigration lawsFinancing issues Other
20 | P a g e
III. Profile of Top 5 Buyers by Country7
The top 5 countries of buyer origin based on closed transactions as reported in the survey were
Canada, China, Mexico, India, and the United Kingdom. The buying profiles of clients from these
countries in terms of their destination, purchase price, intended use, type of property, type of
area, and intended length of stay are presented below:
Canada
Over the 12 months ended March 2014, Canadians purchased U.S. properties estimated at $13.8
billion in total value, which is approximately 15 percent of total international sales.
Approximately 73 percent of reported purchases by Canadian buyers were for properties in
Florida, Arizona, and California. The median price of the reported properties was $212,500 and
the mean price was $314,718. Approximately 86 percent of buyers purchased on an all-cash
basis. The intended use of the property was for vacation/residential rental in a suburban or
resort area with an intended length of stay of less than six months. About half of Canadians
bought single-family type houses and about a third purchased a condominium/apartment type
house.
According to information from realtor.com ® for the 12 months ending March 2014 the five
urban markets of greatest interest to Canadians search for a home were Las Vegas, Detroit, Los
Angeles, Ft. Lauderdale, and Miami.8
7 In the following graphs some of the percentages do not add to exactly 100 percent due to rounding
conventions. 8 Source: realtor.com®. See also www.realtor.org/articles/where-are-global-buyers-searching-in-the-
united-states. realtor.com® data report searches, not completed transactions.

21 | P a g e
40%
23%
10%
3% 3%
21%
Florida Arizona California Texas Washington Other States
Canadian Home Buyer Preferences Percent Distribution of Total Canadian Purchases
All Cash 82%
With mortgage financing
18%
Type of Financing by Canadian Purchasers

22 | P a g e
Vacation home/
Residential Rental 86%
Primary residence
17%
Commercial rental
1%
Intended Use by Canadian Purchasers
Central city/urban
16%
Suburban 42% Small
town/rural 14%
Resort area 28%
Area Preferences by Canadian Purchasers

23 | P a g e
China
Over the 12 months ended March 2014, buyers from China9 purchased U.S. properties estimated
at $22 billion in total value, approximately a quarter of total international sales. Approximately
51 percent of reported purchases by Chinese buyers were in California, Washington, and New
York. The median price was $523,148, and the mean price was $590,826. Approximately 76
percent of purchases were reported as all-cash purchases. Chinese buyers preferred urban and
suburban areas. Based on data from the survey, approximately half of purchases were for
9 Includes buyers from Mainland China, Taiwan, and Hong Kong.
53%
7%
31%
9%
Detached single-family
Townhouse/row house
Condo/apartment
Commercial/Land/Other
Property Type--Canadian Purchasers
13%
21%
48%
18%
Less than 1 month
1 to 2 months
3 to 6 months
More than 6 months
Expected Months' Use: Canadian Purchasers

24 | P a g e
vacation/residential rental purposes. About 5 percent bought for commercial rental use.
International clients from China were reported in the survey as purchasing mostly detached
single-family housing with a reported intent to use the property for longer than six months.
According to information from realtor.com ® based on searches (not closings) for the 12 months
ending March 2014, the five markets of greatest interest to potential Chinese buyers were Los
Angeles, San Francisco, Irvine, New York, and Las Vegas.10
10
Source: realtor.com®. See also www.realtor.org/articles/where-are-global-buyers-searching-in-the-united-states.
35%
9% 7% 6% 6%
36%
Chinese Home Buyer Preferences* Percent Distribution of Total Chinese Purchases
*Includes buyers from mainland China, Hong Kong, and Taiwan
All Cash 76%
With mortgage financing
24%
Type of Financing by Chinese Purchasers

25 | P a g e
Vacation home/Residential Rental 56%
Primary residence
39%
Commercial rental
5%
Intended Use by Chinese Purchasers
Central city/urban
37%
Suburban 46%
Small town/rural
14%
Resort area 3%
Area Preferences by Chinese Purchasers

26 | P a g e
India
Over the 12 months ended March 2014, buyers from India purchased U.S. properties estimated
at $5.8 billion in total value, which is approximately 6 percent of total international sales. Based
on data from the survey, Indians were not as concentrated in a few key states as buyers from
Canada, Mexico, or the United Kingdom. Among the reported destination states for buyers from
India, the top states were California, Illinois, and Pennsylvania. The median price was $342,857,
and the mean price was $459,028. In contrast to other buyers, only 23 percent were all cash
sales. Indians mostly purchased single family detached homes, but about 6 percent bought for
70%
10%
12%
8%
Detached single-family
Townhouse/row house
Condo/apartment
Commercial/Land/Other
Property Type: Chinese Purchasers
22%
12%
14%
52%
Less than 1 month
1 to 2 months
3 to 6 months
More than 6 months
Expected Months' Use: Chinese Purchasers
27 | P a g e
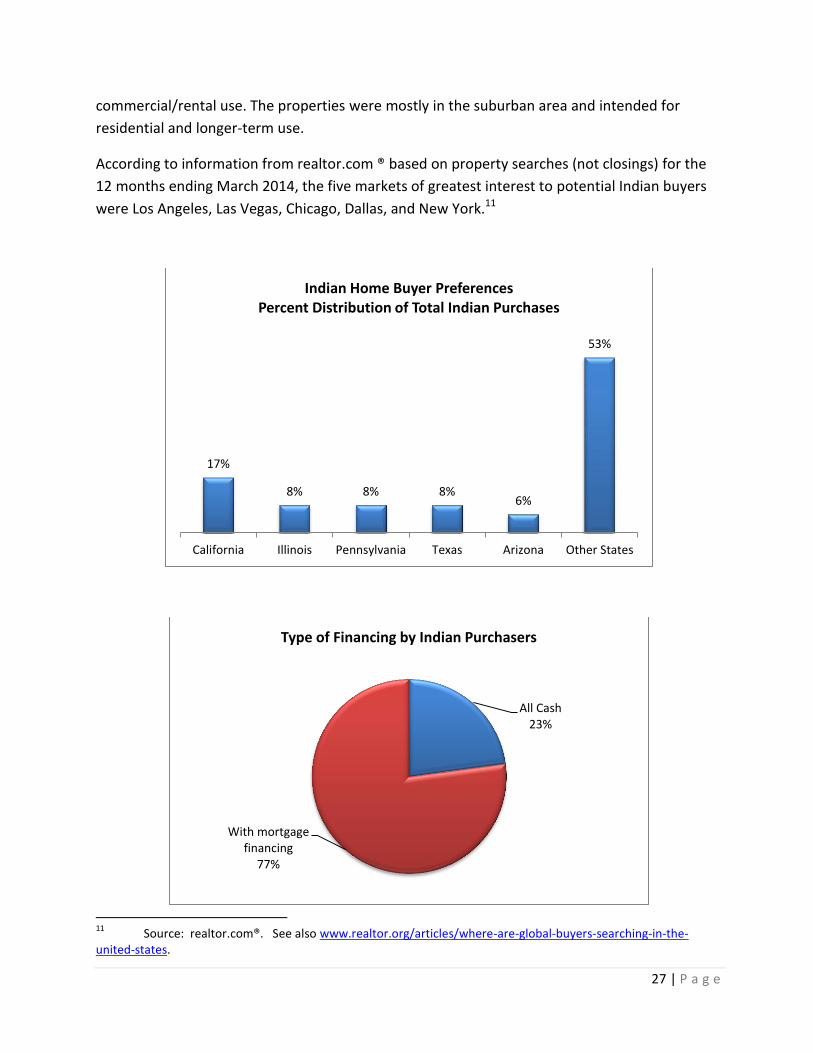
commercial/rental use. The properties were mostly in the suburban area and intended for
residential and longer-term use.
According to information from realtor.com ® based on property searches (not closings) for the
12 months ending March 2014, the five markets of greatest interest to potential Indian buyers
were Los Angeles, Las Vegas, Chicago, Dallas, and New York.11
11
Source: realtor.com®. See also www.realtor.org/articles/where-are-global-buyers-searching-in-the-united-states.
17%
8% 8% 8% 6%
53%
California Illinois Pennsylvania Texas Arizona Other States
Indian Home Buyer Preferences Percent Distribution of Total Indian Purchases
All Cash 23%
With mortgage financing
77%
Type of Financing by Indian Purchasers

28 | P a g e
Vacation home/Residen
tial Rental 14%
Primary residence
80%
Commercial rental
6%
Intended Use by Indian Purchasers
Central city/urban
20%
Suburban 74%
Small town/rural
6%
Resort area 0%
Area Preferences by Indian Purchasers

29 | P a g e
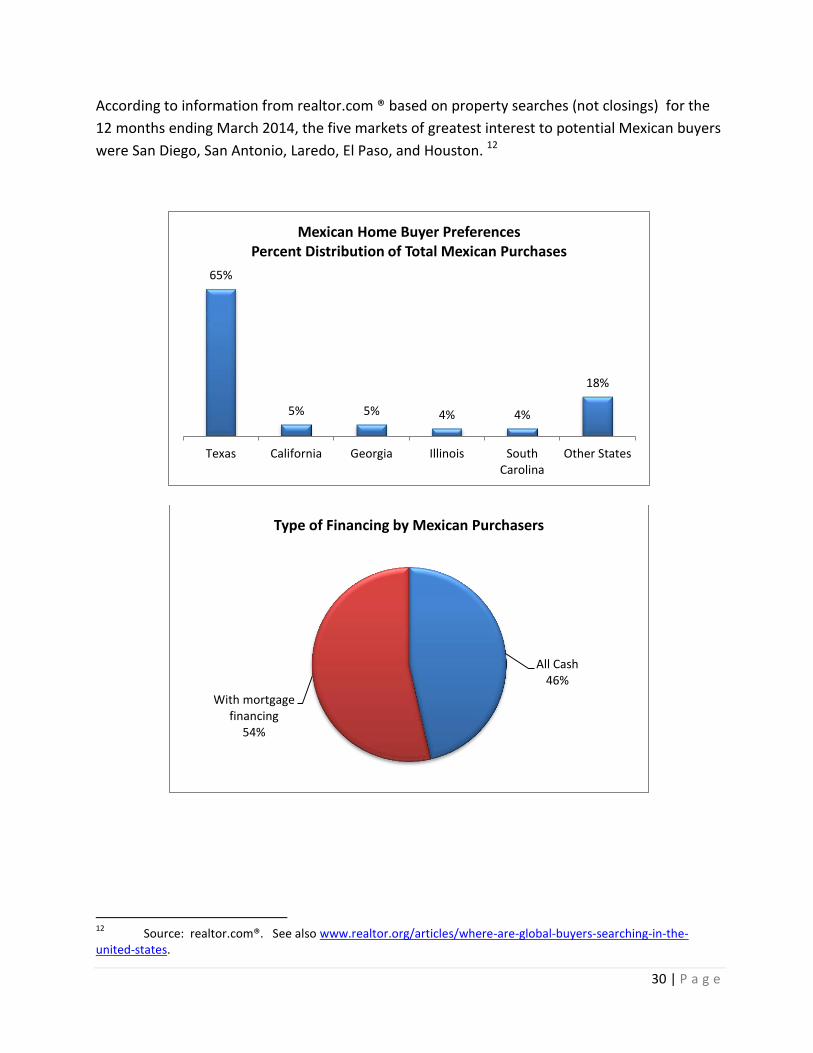
Mexico
Over the 12 months ended March 2014, buyers from Mexico purchased U.S. properties
estimated at $4.5 billion, which is approximately 5 percent of total international sales.
Approximately 70 percent of buyers from Mexico purchased in California and Texas. Based on
data from the survey, the median price was $ 141,071, and the average price was $224,123. The
purchases were an almost an even mix of all-cash and mortgage financing. Buyers from Mexico
bought mostly single-family type properties, and about 4 percent bought for commercial/rental
use. The properties were generally located in suburban and urban areas for residential use over
a period of more than six months.
72%
11%
8%
8%
Detached single-family
Townhouse/row house
Condo/apartment
Commercial/Land/Other
Property Type: Indian Purchasers
0%
0%
4%
96%
Less than 1 month
1 to 2 months
3 to 6 months
More than 6 months
Expect ed Months Use: Indian Purchasers
30 | P a g e
According to information from realtor.com ® based on property searches (not closings) for the
12 months ending March 2014, the five markets of greatest interest to potential Mexican buyers
were San Diego, San Antonio, Laredo, El Paso, and Houston. 12
12
Source: realtor.com®. See also www.realtor.org/articles/where-are-global-buyers-searching-in-the-united-states.
65%
5% 5% 4% 4%
18%
Texas California Georgia Illinois SouthCarolina
Other States
Mexican Home Buyer Preferences Percent Distribution of Total Mexican Purchases
All Cash 46%
With mortgage financing
54%
Type of Financing by Mexican Purchasers

31 | P a g e
Vacation home/ Residential
Rental 33%
Primary residence
62%
Commercial rental
4%
Intended Use by Mexican Purchasers
Central city/urban
30%
Suburban 49%
Small town/rural
19%
Resort area 2%
Area Preferences by Mexican Purchasers

32 | P a g e
United Kingdom
Over the 12 months ended March 2014, buyers from the United Kingdom purchased U.S.
properties estimated at $5.8 billion, which is approximately 6 percent of total international sales
to foreigners in the U.S. Approximately two-thirds of clients from the United Kingdom (U.K.)
purchased properties in Florida, California, and Texas. The median purchase price was $350,000,
and the average price was $499,242. The purchases reflected an almost balanced mix of
mortgage and all-cash financing. Based on data from the survey, approximately 8 in 10
purchases were located in a suburban or small town/resort area. Approximately two-thirds of
84%
5%
2%
9%
Detached single-family
Townhouse/row house
Condo/apartment
Commercial/Land/Other
Property Type: Mexican Purchasers
8%
10%
8%
74%
Less than 1 month
1 to 2 months
3 to 6 months
More than 6 months
Expected Months' Use: Mexican Purchasers

33 | P a g e
the reported purchases were single-family detached houses with a good balance of intended use
for either primary residence or vacation/rental purposes.
According to information from realtor.com ® based on property searches (not closings) for the
12 months ending March 2014, the five markets of greatest interest to potential U.K. buyers
were Los Angeles, Orlando, Houston, Las Vegas, and Kissimmee.13
13
Source: realator.com®. See also www.realtor.org/articles/where-are-global-buyers-searching-in-the-united-states.
45%
12% 9%
6% 6%
21%
Florida California Texas Maine Maryland Other States
U.K. Home Buyer Preferences Percent Distribution of Total U.K. Purchases
All Cash 59%
With mortgage financing
41%
Type of Financing by United Kingdom Purchasers

34 | P a g e
Vacation home/
Residential Rental 59%
Primary residence
42%
Commercial rental
0%
Intended Use by United Kingdom Purchasers
Central city/urban
15%
Suburban 52%
Small town/rural
9%
Resort area 24%
Area Preferences of United Kingdom Purchasers

35 | P a g e
67%
6%
24%
3%
Detached single-family
Townhouse/row house
Condo/apartment
Commercial/Land/Other
Property Type: United Kingdom Purchasers
15%
23%
8%
54%
Less than 1 month
1 to 2 months
3 to 6 months
More than 6 months
Expected Months' Use: United Kingdom Purchasers

36 | P a g e
IV. REALTOR® EXPERIENCE IN SERVING INTERNATIONAL CLIENTS
The percentage of REALTOR® respondents who reported working with international clients in
the 12 months ending March 2014 was 28 percent, essentially unchanged from the previous
year.
Of the REALTORS® who had an international client, 35 percent reported dealing with foreign
non-resident clients (Type A), 34 percent with foreign resident/recent immigrant clients (Type
B), and 30 percent reported working with both types of clients. An equal allocation of the
share of “Both Types” to Type A and Type B responses yields the share of Type A clients at 51
percent and the share of Type B at 49 percent.
32%
26%
23%
28% 28% 27% 27%
28%
20%
22%
24%
26%
28%
30%
32%
34%
36%
38%
40%
2007 2008 2009 2010 2011 2012 2013 2014
Pe
rce
nta
ge o
f R
esp
on
de
nts
Percent of REALTORS® with International Clients
41% 44% 38% 38% 35%
38% 33% 37% 36% 34%
21% 23% 25% 26% 30%
0%
20%
40%
60%
80%
100%
2010 2011 2012 2013 2014
Types of International Clients (Percentage Distribution)
TypeA (Foreign Client) TypeB (Recent Immigrant) Both Types

37 | P a g e
The bulk of REALTORS® who indicated that they had worked with an international client had 1 to
5 international clients, about the same since 2010. Only 4 percent had 11 or more transactions
in a year. REALTORS® on the buyer-side of transactions frequently use specialized skills in
working with a relatively large number of international clients in a given year. REALTORS® on
the seller-side may have relatively few international clients in a given year, for international
sales are a small portion of overall sales.
Of the REALTORS® who reported having an international client, approximately 54 percent
reported that international transactions accounted for 1 to 10 percent of their total transactions,
a decrease compared to 2013, but in line with past year’s levels. The share of REALTORS® who
reported that international transactions accounted for more than 10 percent of their total
transactions and the share of REALTORS® who reported no completed international transactions
both increased.
91% 91% 87% 88% 87% 88%
6% 6%
9% 8% 9% 8%
3% 4% 4% 5% 4% 4%
80%
85%
90%
95%
100%
2009 2010 2011 2012 2013 2014
Pe
rce
nta
ge o
f R
esp
on
de
nts
Wit
h C
lien
ts Number of International Clients, Whether or Not Client
Purchased a Property (Percentage Distribution)
1 to 5 6 to 10 11 or more

38 | P a g e
Approximately 67 percent of REALTORS® with foreign clients had 1 to 5 clients who purchased
U.S. property, down from the previous period. About six percent had 6 or more, the same as in
previous years.
Approximately 45 percent of REALTORS® who reported having an international client reported
that they had at least one client who decided not to purchase U.S. property, about the same as
in recent years.
34% 24% 22% 21% 16% 18%
49% 54% 51% 52% 58% 54%
17% 22% 27% 27% 26% 28%
0%
20%
40%
60%
80%
100%
2009 2010 2011 2012 2013 2014Pe
rce
nta
ge o
f R
esp
on
de
nts
Wit
h C
lien
ts Percent of Transactions with International Clients
(Percentage Distribution)
0% 1 to 10% more than 10%
47% 35% 31% 31% 24% 27%
49%
61% 63% 62% 70% 67%
3% 3% 4% 5% 4% 4%
0%
20%
40%
60%
80%
100%
2009 2010 2011 2012 2013 2014
Pe
rce
nta
ge o
f R
esp
on
de
nts
Wit
h C
lien
ts
Number of International Clients Who Purchased U.S. Property
(Percentage Distribution )
0 1 to 5 6 to 10 11 or more

39 | P a g e
Out of all REALTOR® respondents (with or without international clients in the past 12 months), a
lower share- 73 percent - reported a constant level or an increase in the number of international
clients in the 12 months ending March 2014. The declining share can be explained by the
increase in “Not Applicable” responses reported by those who had been in the business for less
than one year.
Over a five year time frame, a lower share of REALTORS® - about 68 percent - reported a
constant level or an increase in the number of international clients. Again, the declining share
can be explained by the increase in “Not Applicable” responses reported by those who had been
in the business for less than five years.
43%
49%
57%
50%
55%
47% 47% 45%
0%
10%
20%
30%
40%
50%
60%
2007 2008 2009 2010 2011 2012 2013 2014
Pe
rce
nta
ge o
f R
esp
on
de
nts
Wit
h
Clie
nts
Percent of REALTORS® With International Clients Who Decided NOT to Purchase U.S. Property
11% 15%
15% 15% 16% 15%
69% 65% 63% 65%
64% 58%
11% 11% 9% 8% 7%
7%
9% 9% 14% 12% 13% 20%
0%
20%
40%
60%
80%
100%
2009 2010 2011 2012 2013 2014
Pe
rce
nta
ge o
f R
esp
on
de
nts
Wit
h C
lien
ts
Change in International Clients: Past Year (Percentage Distribution )
Not applicable, have been in business less than a yearDecreasedStayed about the sameIncreased

40 | P a g e
An understanding of international buyers’ interests in approaching the U.S. real estate market
and a cultural affinity to the prospective buyers are reported by many REALTORS® to be
important to achieving successful closings. Of the REALTORS® who reported transactions with
foreigners, 59 percent reported that clients were referred to them through friends, previous
clients, and international and domestic referrals. About 19 percent of clients were obtained
through website/online listings. The primary sources of online leads were the agent’s own
website (24%), the local MLS website (16%), and other aggregators (17%). Realtor.com®, which
launched an international site (www.realtor.com/international) at the end of 2011, accounted
for 6 percent of online leads.
15% 19% 19% 18% 21% 20%
57% 56%
53% 55% 53% 48%
9% 10% 9% 9% 7% 6%
19% 15% 19% 17% 19% 26%
0%
50%
100%
2009 2010 2011 2012 2013 2014
Pe
rce
nta
ge o
f R
esp
on
de
nts
Wit
h C
lien
ts
Change in International Clients: Past 5 Years (Percentage Distribution )
Not applicable, have been in business less than 5 yearsDecreasedStayed about the sameIncreased

41 | P a g e
Comments provided by REALTORS® about their experience working with international clients are
provided in the following table14.
14
Comments were edited for brevity, clarity, and typographical errors.
18% 18% 20%
23% 26% 29%
3% 2%
3% 11% 8% 7%
13% 11% 11%
21% 22% 19%
4% 3% 3%
7% 9% 9%
0%
10%
20%
30%
40%
50%
60%
70%
80%
90%
100%
2012 2013 2014
Referral Methods for International Clients (Percentage Distribution)
Other
Signs/Ads on boards/yards
Website/Online listing
Walk-in to Office/OpenHouse/Phone call
Through referral from adomestic source
Through referral from aninternational source
Through previouscontacts/clients
Through friends
24%
2%
16%
6%
17%
4%
0%
2%
1%
16%
13%
0% 5% 10% 15% 20% 25%
Own(agent's) /firm’s/franchise's …
Other broker’s website
Local MLS website
Realtor.com
Other aggregators
Other online real estate websites
Government portal or website
Commercial listing service
Client's home country's real estate…
Don’t know
Others
Source of Online/Website Lead (Percentage Distribution)

42 | P a g e
Comments from REALTORS®
o America is often seen as a "safe haven" relative to many other countries. (CA) o Buyers also want to live in the US for its opportunities, education and freedom. (WA) o A person can buy a lot of property for a good & fair price here. (OH) o Client bought home for daughter in graduate school. She and her roommates will live there for
three years, and then daughter will go back to Hong Kong, and she will sell the home. (CA) o Most of the international buyers from Venezuela, Argentina need to take out money out of their
countries, and they view the U.S. as a secure investment and profitable. (FL) o The high price in Hong Kong has already driven a lot of investors overseas in the real estate
business. (NJ) o I don't see a lot of international clients. We don't have transient clients unless they are
associated with the university. My most recent client has a visa, and other international clients are mostly residents here (doctors) that travel back and forth. (OH)
o My international customers had been coming here for vacations for years; they decided it was time to buy. They purchased two properties down on the ocean, over $3.5M total purchased, cash. (FL)
o Finding a desirable job is getting easier for some international clients, and they view the U.S. as a desirable place to live. (TX)
o The hardest part for an international client is the mortgage. Many find "private investor" loan companies that cater to that specific type of client. These companies are very helpful especially if they have bought a business, such as a Dunkin Donuts or other fast food store. Most of the normal mortgage qualifications just do not apply with these loan companies. (PA)
o Have not sold any international real estate because it’s difficult to get a lender. (MD) o Brokers/agents who deal with foreign sellers need more information on tax withholding when
selling a property for foreigner sellers and paying taxes to the IRS. No escrow for federal tax withholding, which can make the buyers/agents liable for the taxes. (CA)
o Banks foreclose properties and hold them off the market until the market bottoms out. Cash rich foreigners swoop in and purchase bargain properties and/or distressed properties and then drive the prices up so locals cannot buy back into the area. (FL)
o I believe we are losing buyers due to the FHA costs. This needs to be changed. Upfront cost is too high, and for the life of the loan makes it unattractive to buyers.
o Air service is very important to international clients. As our airport has decreased the number of international flights (we were a Delta hub), we have had a definite decrease in international clients. (OH)
o This is very important! I sold a home to a British couple 4 years ago. This year they discovered that they are not able to acquire suitable health insurance coverage for longer than 2 weeks at a time. The husband's health is poor, so they were forced to sell their holiday home in Florida.
o Being in business less than a year makes it difficult. (PA) o If the immigration laws changes, people will be able to invest and get loans to purchase
properties in this country. Now, only cash buyers can do it. o The international clients I have worked with are for rentals and home insurance. o I am of Indian origin, and most of the buyers feel a certain amount of comfort by using a Realtor
who is familiar with their country and customs. Most of the calls just come from name recognition.
o I have a very international clientele: Israel, Argentina, Germany, Lebanon, China, France, Russia, Ireland, Yemen & more. (WI)
o Utah has a lot of immigrants the last 5 years, and they are buying homes (UT) o Colorado Springs’ high end market has not recovered from the downturn in the market. There
are many buying opportunities for international buyers, but we are not seeing any. (CO) o Working with mostly Canadian customers, and the dollar is causing some pull back due to the
exchange rate. (FL)

43 | P a g e
V. CONCLUSIONS
The dollar volume of residential purchases by residents and non-residents is estimated at $ 92
billion for the 12 months ended March 2014, a 35 percent growth from the previous year. This
accounts for approximately 7 percent of total existing home sales of about $ 1.2 trillion over the
same period. The continued recovery in the countries of origin of international clients as well as
the healthy pace of growth in China and the appreciation of some currencies against the U.S.
dollar such as the Chinese yuan and British pound appear to have enhanced the affordability of
purchasing U.S. property. International buyers who generally pay cash were also reported to
have an advantage over buyers obtaining mortgages under stricter credit standards. U.S. home
prices remain affordable in comparison to the peak level prior to the Great Recession of 2007-
2009.
Canada, China, India, Mexico and the United Kingdom remain as the major sources of buyers in
terms of number of transactions; Canada ranked first. In terms of dollar value of sales, China
ranked first, because Chinese buyers purchased more expensive homes than was the case for
Canadian buyers.
In terms of location, Florida, California, Arizona, Texas, and New York are the top preferred
locations based on the number of reported purchases.
The bulk of international purchases are all cash sales for single-family homes intended to be
used for residential purposes. Location appears to be the primary factor affecting residential
home purchases, depending on the buyer’s employment, vacation preferences, family,
educational, and investment objectives.
Personal contacts and referrals are the top sources for the majority of business opportunities
obtained by REALTORS®, Website/online listings continue to be an increasing source of clients,
with the agent’s own website as the primary source of online leads. NAR’s Commercial & Global
Services Group, including the Certified International Property Specialist (CIPS) designation can
help REALTORS® enhance their skills in navigating the challenges of dealing with international
clients; extensive information is available at www.realtor.org/global.
44 | P a g e
APPENDIX 1: Methodology for Estimation of International Sales
Data Inputs
Total U.S. Residential Sales: Sales for the 12 months ending March of each year are obtained
from the NAR Existing Home Sales series by summing monthly sales for the time period April
through March in each case.
Existing Home Sales Price: Since total market value is being computed, mean rather than
median price is used, computed on the basis of the mean of the twelve monthly mean prices for
the time periods under consideration.
Prices, International Sales: This is an average price computed on the basis of survey
information. The price is significantly higher than the average price for domestic Existing Home
Sales in general, for the foreign client typically is buying properties that are significantly above
average: foreign clients are a very different type of buyer in comparison to most home buyers.
Percent of Market that is International (non-resident): The percent of market consisting of
sales to non-resident foreigners is based on survey data from the monthly REALTORS®
Confidence Index Survey.
Methodology: Computation of International Sales ($)
Sales to non-resident foreigners (Type A): Multiply Total U.S. Residential Sales by percent of
market that is international (non-resident). Then multiply by Prices, International Sales.
Sales to resident foreigners (Type B): Multiply Sales to non-resident foreigners (Type A) by
the share of Type B to share of Type A. Then multiply by Prices, International Sales.
Total International Sales: Add Sales to Type A and Type B.
Percent International: Computed as Total International Sales to Total U.S. Residential Sales.

45 | P a g e
Calculations for International Sales
2013 2014
Type A Clients, as percent of EHS (RCI) 2.07% 2.35%
Percent Type A: 51% 51%
Percent Type B 49% 49%
Total Total
Sales Units Average Price Market Sales Units Average Price Market
US Total Sales: EHS 4,730,000 $228,383 $1,080,253,166,667 5,023,000 $247,417 $1,242,773,916,667
International Sales: Type A 98,137 $354,193 $34,759,523,171 117,846 $396,180 $46,688,223,990
Type B 94,363 $354,193 $33,422,618,434 114,797 $396,180 $45,480,369,439
Total International 192,500 $354,193 $68,182,141,605 232,643 $396,180 $92,168,593,429
Percent International 4.1% 6.3% 4.6% 7.4%
Analysis of Change
2013 2014
Sales Units Average Price Dollar Sales Sales Units Average Price Dollar Sales
EHS 8.1% 7.6% 16.4% 6% 8% 15%
Type A -4.8% -11.5% -15.7% 20% 12% 34%
Type B -8.5% -11.5% -19.0% 22% 12% 36%
Total Intl -6.6% -11.5% -17.3% 21% 12% 35%

46 | P a g e
APPENDIX 2: realtor.com® Data on U.S. Cities of Major Interest to Foreigners
The International Profile presents data for purchases by foreigners in terms of individual
states. Frequently there is a request for information on purchases by city. At this time, the
information is unavailable. However, data by city is collected by realtor.com® in terms of the
number of searches by residents of foreign countries for specific cities. It should be noted that the
data are for searches rather than closings and are for the 12 months ending 3/2014.
The realtor.com® data were processed to develop search indexes. It should be noted that
the realtor.com® data are not necessarily random15
—so the results would be expected to differ
somewhat from the random results in the International Profile.
To create a numerical value or search index corresponding to these rankings, we converted
the rankings into weights and then used the weights to create an index. The higher the index, the
higher is the rank of the country and the city. For example, across countries and cities , an index
=12 indicates that the county/city is the #1 searcher for 12 months or that a city is the #1 city
being searched by a country for 12 months (see last page for methodology) .
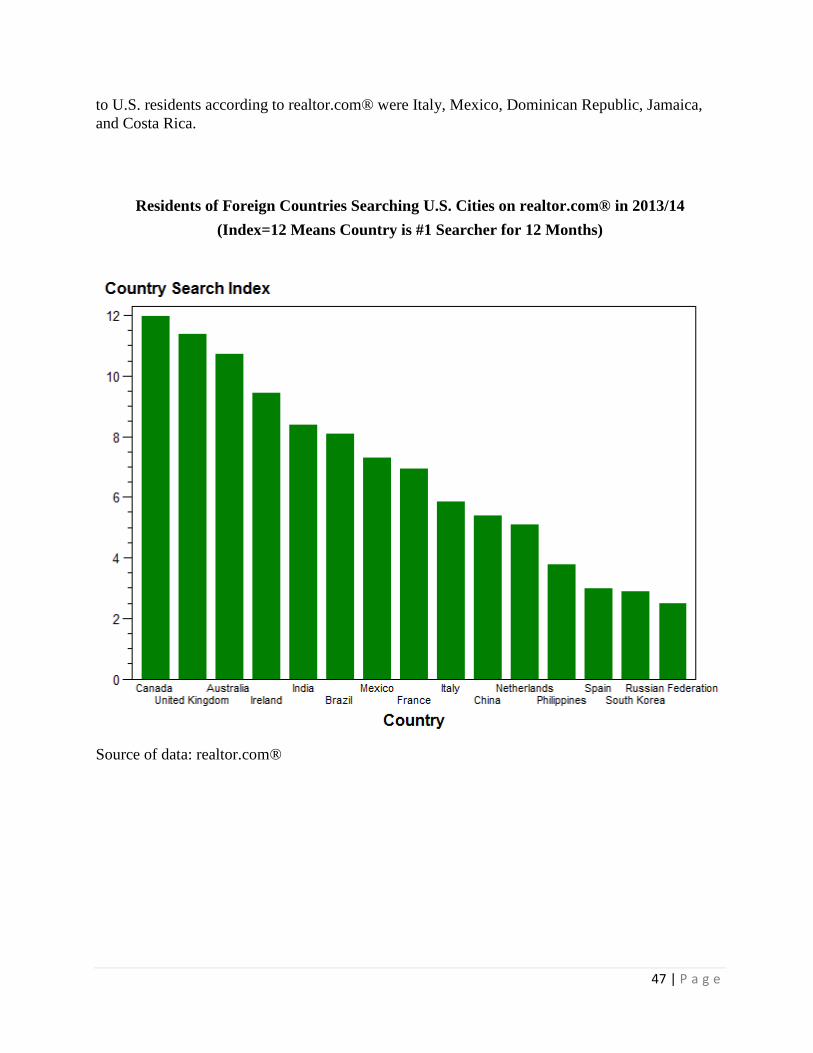
The following graphs depict the top countries and their cities of interest in 2013. The
realtor.com® search results are consistent with the data gathered from NAR’s International
Profile, which has Canada, China, Mexico, India, and the United Kingdom as the top countries of
origin of international buyers.
The realtor.com data® also reveals some surprises such as the strong interest from Ireland,
Netherlands, the Philippines, and Spain. These countries could become major potential buyers in
the future, assuming their economies grow strongly in the coming years. Regarding the search
index of each country for the top cities of interest, a surprise was Las Vegas as the # 1 choice of
Canadians. In view of what is happening in Russia politically, we also showed the destinations of
interest to Russian buyers which include the major cities in CA, FL, NY, MI, IL, and NV.
Finally, just as is the case for foreigners interested in U.S. properties, U.S. residents are
also increasingly interested in purchasing property outside of the country. A recurring question
associated with the editions of the International Profile is whether data exist for U.S. residents
purchasing abroad. The short answer is “No.” The International Profile survey only collected
information from U.S. REALTORS® concerning purchases by foreigners.
However, some data on international residential interests by U.S. residents is available
from realtor.com®. The website carries listings for available homes in a number of countries, and
data on the total number of inquiries by U.S. residents as regards to foreign real estate is available
in terms of page views rank. For the month of April 2014 the top five foreign countries of interest
15
For example, the searches are on-line, although some prospective purchasers my conduct their research though other sources.
47 | P a g e
to U.S. residents according to realtor.com® were Italy, Mexico, Dominican Republic, Jamaica,
and Costa Rica.
Residents of Foreign Countries Searching U.S. Cities on realtor.com® in 2013/14
(Index=12 Means Country is #1 Searcher for 12 Months)
Source of data: realtor.com®

48 | P a g e
Top U.S. Cities Searched on realtor.com® in 2013/14
(Index=12 - Of Major Interest ; Index=0 – Of no Interest)
Source of data: realtor.com®

49 | P a g e
Canada: Top U.S. Cities Searched by Canadians on realtor.com® in 2013/14
(Index=12 - Of major interest; Index=0- Of no interest)
Source of data: realtor.com®

50 | P a g e
China: Top U.S. Cities Searched on Chinese Residents on realtor.com® in 2013/14
(Index=12 - Of major interest; Index=0- Of no interest)
Source of data: realtor.com®

51 | P a g e
India: Top U.S. Cities Searched by Residents of India on realtor.com® in 2013/14
(Index=12 - Of major interest ; Index=0- Of no interest)
Source of data: realtor.com®

52 | P a g e
Mexico: Top U.S. Cities Searched by Residents of Mexico on realtor.com® in 2013/14
(Index=12 - Of major interest ; Index=0- Of no interest)
Source of data: realtor.com®

53 | P a g e
Top U.S. Cities Searched by Residents of the United Kingdom on realtor.com® in 2013/14
(Index=12- Of Major interest; Index= 0 – Of no interest)
Source of data: realtor.com®

54 | P a g e
Brazil: Top U.S. Cities Searched by Brazilians on realtor.com® in 2013/14
(Index=12 - Of major interest ; Index=0- Of no interest)
Source of data: realtor.com®
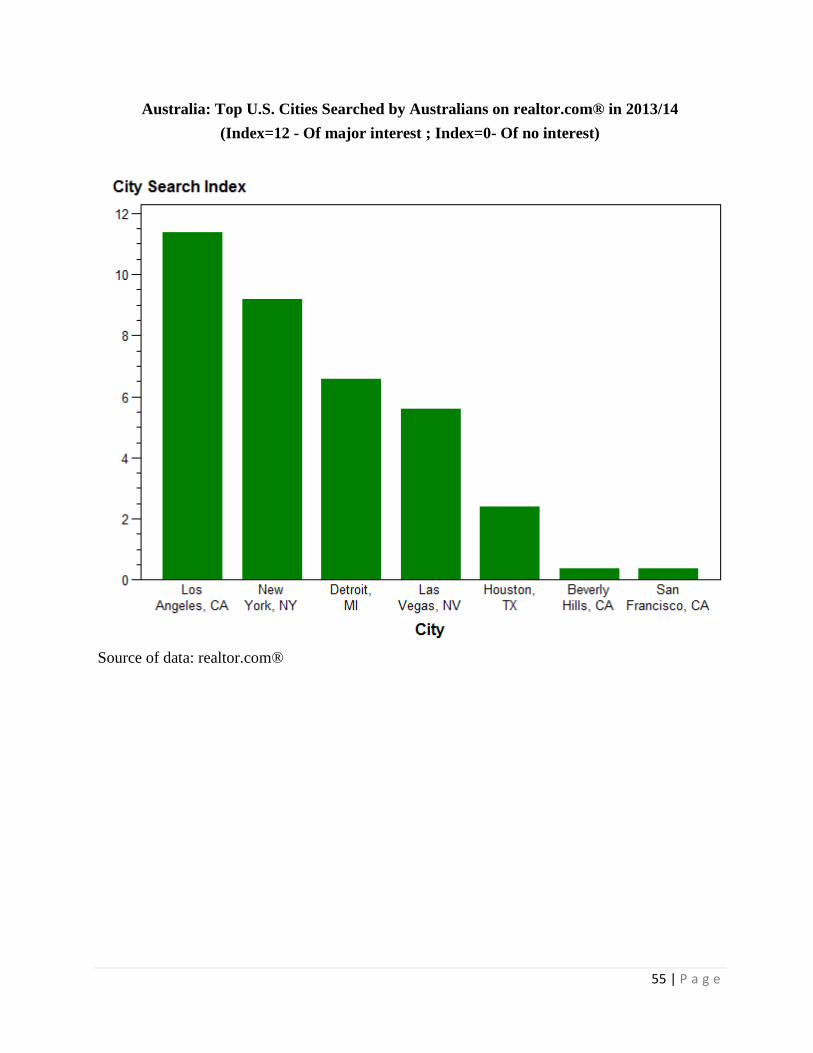
55 | P a g e
Australia: Top U.S. Cities Searched by Australians on realtor.com® in 2013/14
(Index=12 - Of major interest ; Index=0- Of no interest)
Source of data: realtor.com®

56 | P a g e
Ireland: Top U.S. Cities Searched by Irish Residents on realtor.com® in 2013/14
(Index=12 - Of major interest; Index=0- Of no interest)
Source of data: realtor.com®

57 | P a g e
Top U.S. Cities Searched by Residents of Russian on realtor.com® in 2013/14
(Index=12- Of Major interest; Index= 0 – Of no interest)
Source of data: realtor.com®

58 | P a g e
Computation Methodology Creating a “Search Index” of Top Countries Searching in U.S.
Cities on realtor.com®
realtor.com® has provided NAR with monthly data which lists the top 20 countries and their top
5 most-searched U.S. cities. To create a numerical value or search index corresponding to these
rankings we converted the rankings into weights and then created an index using the weights. The
higher the index, the higher is the rank of the country and the city. Across countries and cities ,
an index =12 indicates that the country is the #1 search for 12 months and the #1 city being
searched by a country for 12 months.
I. Creating the Search Index for Top Countries Searching Properties in the U.S.
1) Assign weights to the ranks starting with 1.0 and incrementing in a decreasing order by
0.05 (=1/20). So the weights for each country i for each month j ) will be 1=rank 1,
0.95=rank 2, 0.90=rank 3 and so on up until 0.05 =rank 20.
2) Since we want to create a search index for each country i, we sum the monthly rank for
that country across the 12 months. A Country Search Index = 12 (1 x 12) means that the
country is the #1 searcher in each of the 12 months while an Index = 0.6 (0.05 x 12) means
that the country is the #20th
searcher in each of the 12 months. Mathematically, the
country search index is:
=∑ ; 1 = 1, 2, ..20 (countries)
3) The data the Realtor.com provided includes Germany and Japan and it appears that the
searchers are likely U.S. military stationed in these countries searching for U.S. properties.
Since the data provided includes these countries, they are still included in the generation
of the weights . However, we exclude them in the list of top countries searching U.S
properties.
II. Creating the U.S. City Search Index For Each Country
4) For each country, assign weights to the ranks of each U.S. city with 1.0 and
incrementing in a decreasing order by 0.20 (=1/5). So for each country i, at each month j,
the weights for each city k ) will be: 1 =rank 1, 0.80=rank 2, 0.60 =rank 3,
0.40=rank 4 and 0.20=rank 5.
5) Since we want to create a search index for each city k in each country i ,across the 12
months j, we sum the monthly rank for that country across the 12 months. For each
country i, a U.S. City Search Index = 12 (1 x 12) means that the city is the #1 searched
city in each of the 12 months while an Index = 2.4 (0.20 x 12) means that the city is the
#5th
searched city in each of the 12 months. Mathematically, the country search index is:
=∑ ; 1 = 1, 2, ..20 (countries); j = 1, 2, 3, 4, 5

59 | P a g e
6) For the same reason cited previously that the searches from Germany and Japan are most
likely coming from U.S. military stationed in these countries, no U.S. city search indexes
were generated for these two countries.
About NAR’s Commercial & Global Services Group
The Commercial & Global Services Group of the NATIONAL ASSOCIATION OF REALTORS® plays
an integral role in opening doors for REALTORS® to compete in the global market place. By
opening markets for business and keeping members informed of the latest developments
occurring around the world, the Commercial & Global Services Group gives REALTORS® the
tools they need to succeed in the global market. NAR maintains formal partnerships with over
80 foreign real estate associations in 60 countries. These relationships are formed to advance
the interests of Realtors® worldwide, to uphold the highest standards of commercial practice
and to facilitate international business arrangements in strategic markets for REALTORS® and
non-U.S. real estate practitioners. Additionally, the Certified International Property Specialist
(CIPS) Designation offers specialized education and services to real estate professionals who aim
to profit in the global market.
For more information please visit www.realtor.org/global
60 | P a g e
history, and immigration restrictions.