2014 - nau · contact€name: dr.€kathy€hildebrand phone: 9285237101€ email:...
TRANSCRIPT

Contact Us Glossary Log out
Northern Arizona University
Traditional Program
201011
Print Report Card
Program Information
Name of Institution: Northern Arizona University
Institution/Program Type: Traditional
Academic Year: 201011
State: Arizona
Address: Office of the Vice Provost for Academic Affairs
PO BOX 4122
FLAGSTAFF, AZ, 86011
Contact Name: Dr. Kathy Hildebrand
Phone: 9285237101
Email: [email protected]
Is your institution a member of a Teacher Quality Enhancement (TQE) partnership grant: Yes
TQE partnership name or grant number, if applicable: Transition To Teaching (awarded to Arizona Department of
Education)
Section I.a Program Admission
For each element listed below, check if it is required for admission into any of your initial teacher
certification program(s) at either the undergraduate or postgraduate level.
Element Undergraduate Postgraduate
Application Yes Yes
Fee/Payment No No
Transcript Yes Yes
Fingerprint check Yes Yes
Background check No No
Experience in a classroom or working with children Yes Yes
SUBMIT REPORTS
Page 1 of 16Print Report Card
1/10/2014http://title2.westat.com/Title2IPRC/Pages/PrintReport.aspx

Minimum number of courses/credites/semester hours completed Yes Yes
Minimum high school GPA No No
Minimum undergraduate GPA Yes Yes
Minimum GPA in content area coursework Yes Yes
Minimum GPA in professional education coursework Yes No
Minimum ACT score No No
Minimum SAT score No No
Minimum GRE score No No
Minimum basic skills test score No No
Subject area/academic content test or other subject matter verification Yes Yes
Recommendation(s) Yes Yes
Essay or personal statement No No
Interview No No
Resume No No
Bachelor's degree or higher No Yes
Job offer from school/district No No
Personality test No No
Other (specify: N/A ) No No
Provide a link to your website where additional information about admissions requirements can be
found:
http://coe.nau.edu/academics/Applications/
Indicate when students are formally admitted into your initial teacher certification program:
Junior year
Does your initial teacher certification program conditionally admit students? Yes
Please provide any additional about or exceptions to the admissions information provided above:
Students are conditionally admitted if they are deficient in one or two courses required for admission that can be completed
within the first semester of conditional admission into the program. They must meet all admission requirements by the end
of the first semester of conditional admission to the program.
Section I.b Program Enrollment
Provide the number of students in the teacher preparation program in the following categories. Note that
you must report on the number of students by ethnicity and race separately. Individuals who are non
Hispanic/Latino will be reported in one of the race categories. Also note that individuals can belong to one
or more racial groups, so the sum of the members of each racial category may not necessarily add up to
the total number of students enrolled.
Total number of students enrolled in 201011: 2592
Unduplicated number of males enrolled in 201011: 522
Unduplicated number of females enrolled in 201011: 2070
201011 Number enrolled
Page 2 of 16Print Report Card
1/10/2014http://title2.westat.com/Title2IPRC/Pages/PrintReport.aspx
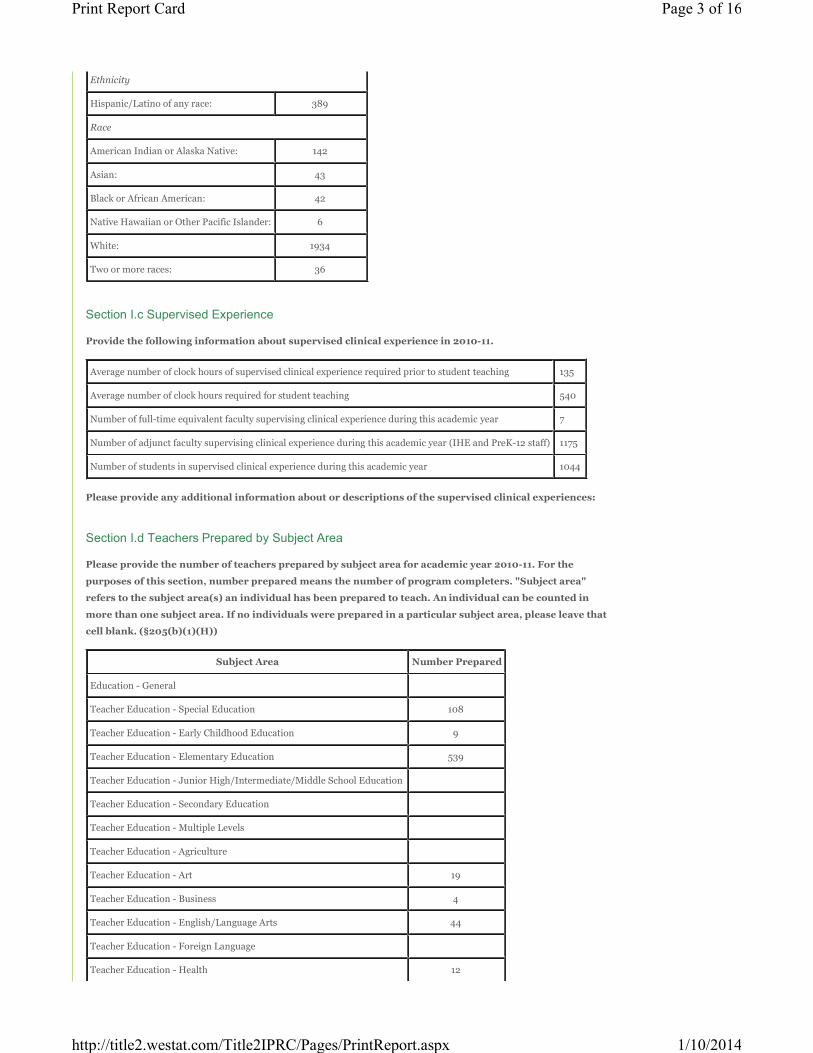
Ethnicity
Hispanic/Latino of any race: 389
Race
American Indian or Alaska Native: 142
Asian: 43
Black or African American: 42
Native Hawaiian or Other Pacific Islander: 6
White: 1934
Two or more races: 36
Section I.c Supervised Experience
Provide the following information about supervised clinical experience in 201011.
Average number of clock hours of supervised clinical experience required prior to student teaching 135
Average number of clock hours required for student teaching 540
Number of fulltime equivalent faculty supervising clinical experience during this academic year 7
Number of adjunct faculty supervising clinical experience during this academic year (IHE and PreK12 staff) 1175
Number of students in supervised clinical experience during this academic year 1044
Please provide any additional information about or descriptions of the supervised clinical experiences:
Section I.d Teachers Prepared by Subject Area
Please provide the number of teachers prepared by subject area for academic year 201011. For the
purposes of this section, number prepared means the number of program completers. "Subject area"
refers to the subject area(s) an individual has been prepared to teach. An individual can be counted in
more than one subject area. If no individuals were prepared in a particular subject area, please leave that
cell blank. (§205(b)(1)(H))
Subject Area Number Prepared
Education General
Teacher Education Special Education 108
Teacher Education Early Childhood Education 9
Teacher Education Elementary Education 539
Teacher Education Junior High/Intermediate/Middle School Education
Teacher Education Secondary Education
Teacher Education Multiple Levels
Teacher Education Agriculture
Teacher Education Art 19
Teacher Education Business 4
Teacher Education English/Language Arts 44
Teacher Education Foreign Language
Teacher Education Health 12
Page 3 of 16Print Report Card
1/10/2014http://title2.westat.com/Title2IPRC/Pages/PrintReport.aspx

Teacher Education Family and Consumer Sciences/Home Economics 3
Teacher Education Technology Teacher Education/Industrial Arts
Teacher Education Mathematics 13
Teacher Education Music 29
Teacher Education Physical Education and Coaching 18
Teacher Education Reading
Teacher Education Science Teacher Education/General Science
Teacher Education Social Science
Teacher Education Social Studies 39
Teacher Education Technical Education
Teacher Education Computer Science
Teacher Education Biology 18
Teacher Education Chemistry 3
Teacher Education Drama and Dance
Teacher Education French
Teacher Education German
Teacher Education History
Teacher Education Physics
Teacher Education Spanish
Teacher Education Speech
Teacher Education Geography
Teacher Education Latin
Teacher Education Psychology
Teacher Education Earth Science
Teacher Education English as a Second Language
Teacher Education Bilingual, Multilingual, and Multicultural Education
Education Other
Specify:
Section I.d Teachers Prepared by Academic Major
Please provide the number of teachers prepared by academic major for academic year 201011. For the
purposes of this section, number prepared means the number of program completers. "Academic major"
refers to the actual major(s) declared by the program completer. An individual can be counted in more
than one academic major. If no individuals were prepared in a particular academic major, please leave
that cell blank. (§205(b)(1)(H))
Academic Major Number Prepared
Education General
Teacher Education Special Education 108
Teacher Education Early Childhood Education 9
Page 4 of 16Print Report Card
1/10/2014http://title2.westat.com/Title2IPRC/Pages/PrintReport.aspx

Teacher Education Elementary Education 539
Teacher Education Junior High/Intermediate/Middle School Education
Teacher Education Secondary Education
Teacher Education Agriculture
Teacher Education Art 19
Teacher Education Business 4
Teacher Education English/Language Arts 44
Teacher Education Foreign Language
Teacher Education Health 12
Teacher Education Family and Consumer Sciences/Home Economics 3
Teacher Education Technology Teacher Education/Industrial Arts
Teacher Education Mathematics 13
Teacher Education Music 29
Teacher Education Physical Education and Coaching 18
Teacher Education Reading
Teacher Education Science
Teacher Education Social Science
Teacher Education Social Studies 39
Teacher Education Technical Education
Teacher Education Computer Science
Teacher Education Biology 18
Teacher Education Chemistry 3
Teacher Education Drama and Dance
Teacher Education French
Teacher Education German
Teacher Education History
Teacher Education Physics
Teacher Education Spanish
Teacher Education Speech
Teacher Education Geography
Teacher Education Latin
Teacher Education Psychology
Teacher Education Earth Science
Teacher Education English as a Second Language
Teacher Education Bilingual, Multilingual, and Multicultural Education
Education Curriculum and Instruction
Education Social and Philosophical Foundations of Education
Liberal Arts/Humanities
Page 5 of 16Print Report Card
1/10/2014http://title2.westat.com/Title2IPRC/Pages/PrintReport.aspx

Psychology
Social Sciences
Anthropology
Economics
Geography and Cartography
Political Science and Government
Sociology
Visual and Performing Arts
History
Foreign Languages
Family and Consumer Sciences/Human Sciences
English Language/Literature
Philosophy and Religious Studies
Agriculture
Communication or Journalism
Engineering
Biology
Mathematics and Statistics
Physical Sciences
Astronomy and Astrophysics
Atmospheric Sciences and Meteorology
Chemistry
Geological and Earth Sciences/Geosciences
Physics
Business/Business Administration/Accounting
Computer and Information Sciences
Other
Specify:
Section I.e Program Completers
Provide the total number of teacher preparation program completers in each of the following academic
years:
201011: 758
200910: 867
200809: 674
Section II. Annual Goals
Each institution of higher education (IHE) that conducts a traditional teacher preparation program
(including programs that offer any ongoing professional development programs) or alternative routes to
Page 6 of 16Print Report Card
1/10/2014http://title2.westat.com/Title2IPRC/Pages/PrintReport.aspx

state certification or licensure program, and that enrolls students receiving Federal assistance under this
Act, shall set annual quantifiable goals for increasing the number of prospective teachers trained in
teacher shortage areas designated by the Secretary or by the state educational agency, including
mathematics, science, special education, and instruction of limited English proficient students. IHEs that
do not have a teacher preparation program in one or more of the areas listed below can enter NA for the
area(s) in which the IHE does not have that program.
Teacher shortage area Goal for increasing prospective teachers trained
MathematicsAcademic year: 201011
Goal: 10 completers
Goal met? Yes
Description of strategies used to achieve goal:
We are recruiting math majors into the teaching profession by offering stipends during their
first year through the NAUTeach grant from the University of Texas, Austin.
Description of steps to improve performance in meeting goal or lessons
learned in meeting goal:
Monitor the number of first year candidates and their retention in the program.
ScienceAcademic year: 201011
Goal: 10 completers
Goal met? Yes
Description of strategies used to achieve goal:
We are recruiting science majors into the teaching profession by offering stipends during
their first year through the NAUTeach grant from the University of Texas, Austin.
Description of steps to improve performance in meeting goal or lessons
learned in meeting goal:
Monitor the number of first year candidates and their retention in the program.
Special educationAcademic year: 201011
Goal: 65 completers
Goal met? Yes
Description of strategies used to achieve goal:
We are recruiting elementary education BSED candidates into the major. We are also
writing grants for funding experienced teachers to enter the MEd Cross Categorical and
Severe/Profound programs.
Description of steps to improve performance in meeting goal or lessons
learned in meeting goal:
Analyze degree progress of initial BSEd and MEd candidates to provide mechanisms by
which they can complete their degree in a timely manner.
Instruction of limited
English proficient studentsAcademic year: 201011
Page 7 of 16Print Report Card
1/10/2014http://title2.westat.com/Title2IPRC/Pages/PrintReport.aspx

Goal: not applicable
Goal met?
Description of strategies used to achieve goal:
Description of steps to improve performance in meeting goal or lessons
learned in meeting goal:
Not ApplicableAcademic year: 201011
Goal: not applicable
Goal met?
Description of strategies used to achieve goal:
Description of steps to improve performance in meeting goal or lessons
learned in meeting goal:
Provide any additional comments, exceptions and explanations below:
Section II. Assurances
Please certify that your institution is in compliance with the following assurances. (§205(a)(1)(A)(iii),
§206(b)) Note: Be prepared to provide documentation and evidence for your responses, when requested,
to support the following assurances.
Preparation responds to the identified needs of the local educational agencies or States where the
program completers are likely to teach, based on past hiring and recruitment trends.
Yes
Preparation is closely linked with the needs of schools and the instructional decisions new teachers face in
the classroom.
Yes
Prospective special education teachers are prepared in core academic subjects and to instruct in core
academic subjects.
Yes
Prospective general education teachers are prepared to provide instruction to students with disabilities.
Yes
Prospective general education teachers are prepared to provide instruction to limited English proficient
students.
Yes
Prospective general education teachers are prepared to provide instruction to students from lowincome
families.
Yes
Prospective teachers are prepared to effectively teach in urban and rural schools, as applicable.
Yes
Describe your institution’s most successful strategies in meeting the assurances listed above:
a. Partner with the Arizona Department of Education on teacher preparation programs.
b. Maintain a close articulation between the elementary preparation program and the special education program –dual
major degree.
Page 8 of 16Print Report Card
1/10/2014http://title2.westat.com/Title2IPRC/Pages/PrintReport.aspx
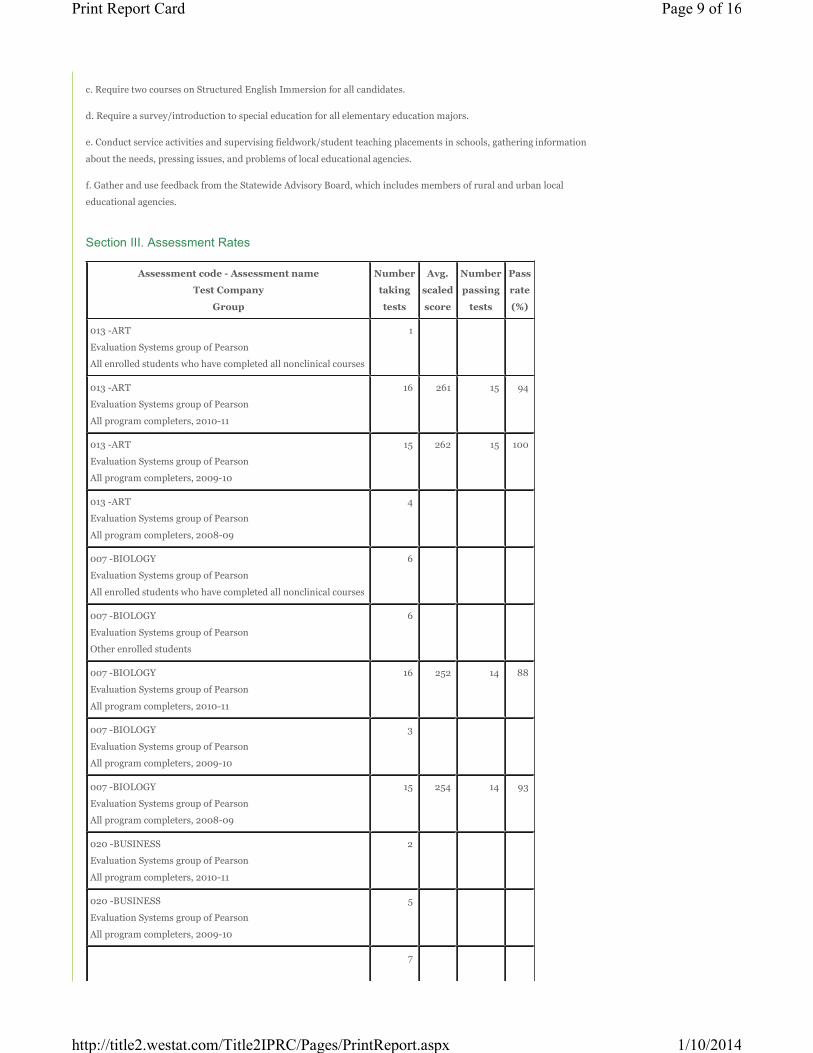
c. Require two courses on Structured English Immersion for all candidates.
d. Require a survey/introduction to special education for all elementary education majors.
e. Conduct service activities and supervising fieldwork/student teaching placements in schools, gathering information
about the needs, pressing issues, and problems of local educational agencies.
f. Gather and use feedback from the Statewide Advisory Board, which includes members of rural and urban local
educational agencies.
Section III. Assessment Rates
Assessment code Assessment name
Test Company
Group
Number
taking
tests
Avg.
scaled
score
Number
passing
tests
Pass
rate
(%)
013 ART
Evaluation Systems group of Pearson
All enrolled students who have completed all nonclinical courses
1
013 ART
Evaluation Systems group of Pearson
All program completers, 201011
16 261 15 94
013 ART
Evaluation Systems group of Pearson
All program completers, 200910
15 262 15 100
013 ART
Evaluation Systems group of Pearson
All program completers, 200809
4
007 BIOLOGY
Evaluation Systems group of Pearson
All enrolled students who have completed all nonclinical courses
6
007 BIOLOGY
Evaluation Systems group of Pearson
Other enrolled students
6
007 BIOLOGY
Evaluation Systems group of Pearson
All program completers, 201011
16 252 14 88
007 BIOLOGY
Evaluation Systems group of Pearson
All program completers, 200910
3
007 BIOLOGY
Evaluation Systems group of Pearson
All program completers, 200809
15 254 14 93
020 BUSINESS
Evaluation Systems group of Pearson
All program completers, 201011
2
020 BUSINESS
Evaluation Systems group of Pearson
All program completers, 200910
5
7
Page 9 of 16Print Report Card
1/10/2014http://title2.westat.com/Title2IPRC/Pages/PrintReport.aspx

020 BUSINESS
Evaluation Systems group of Pearson
All program completers, 200809
008 CHEMISTRY
Evaluation Systems group of Pearson
All enrolled students who have completed all nonclinical courses
1
008 CHEMISTRY
Evaluation Systems group of Pearson
Other enrolled students
1
008 CHEMISTRY
Evaluation Systems group of Pearson
All program completers, 201011
1
008 CHEMISTRY
Evaluation Systems group of Pearson
All program completers, 200910
1
008 Chemistry
Evaluation Systems group of Pearson
All program completers, 200809
1
036 EARLY CHILDHOOD EDUCATION
Evaluation Systems group of Pearson
Other enrolled students
2
036 EARLY CHILDHOOD EDUCATION
Evaluation Systems group of Pearson
All program completers, 201011
5
036 EARLY CHILDHOOD EDUCATION
Evaluation Systems group of Pearson
All program completers, 200910
12 254 11 92
036 EARLY CHILDHOOD EDUCATION
Evaluation Systems group of Pearson
All program completers, 200809
9
001 ELEMENTARY EDUCATION
Evaluation Systems group of Pearson
All enrolled students who have completed all nonclinical courses
111 256 96 86
001 ELEMENTARY EDUCATION
Evaluation Systems group of Pearson
Other enrolled students
78 247 52 67
001 ELEMENTARY EDUCATION
Evaluation Systems group of Pearson
All program completers, 201011
456 256 409 90
001 ELEMENTARY EDUCATION
Evaluation Systems group of Pearson
All program completers, 200910
481 256 448 93
001 ELEMENTARY EDUCATION
Evaluation Systems group of Pearson
All program completers, 200809
456 257 426 93
002 ENGLISH
Evaluation Systems group of Pearson
All enrolled students who have completed all nonclinical courses
2
Page 10 of 16Print Report Card
1/10/2014http://title2.westat.com/Title2IPRC/Pages/PrintReport.aspx

002 ENGLISH
Evaluation Systems group of Pearson
All program completers, 201011
36 267 36 100
002 ENGLISH
Evaluation Systems group of Pearson
All program completers, 200910
20 263 19 95
002 ENGLISH
Evaluation Systems group of Pearson
All program completers, 200809
18 265 17 94
016 FRENCH
Evaluation Systems group of Pearson
All program completers, 200809
1
017 GERMAN
Evaluation Systems group of Pearson
All enrolled students who have completed all nonclinical courses
1
018 HEALTH
Evaluation Systems group of Pearson
All program completers, 201011
8
018 Health
Evaluation Systems group of Pearson
All program completers, 200910
11 267 11 100
018 Health
Evaluation Systems group of Pearson
All program completers, 200809
7
005 HISTORY
Evaluation Systems group of Pearson
All program completers, 200809
12 259 11 92
010 MATHEMATICS
Evaluation Systems group of Pearson
All enrolled students who have completed all nonclinical courses
6
010 MATHEMATICS
Evaluation Systems group of Pearson
Other enrolled students
12 258 9 75
010 MATHEMATICS
Evaluation Systems group of Pearson
All program completers, 201011
12 267 12 100
010 MATHEMATICS
Evaluation Systems group of Pearson
All program completers, 200910
10 268 9 90
010 MATHEMATICS
Evaluation Systems group of Pearson
All program completers, 200809
4
014 MUSIC
Evaluation Systems group of Pearson
All enrolled students who have completed all nonclinical courses
1
014 MUSIC
Evaluation Systems group of Pearson
All program completers, 201011
24 263 24 100
Page 11 of 16Print Report Card
1/10/2014http://title2.westat.com/Title2IPRC/Pages/PrintReport.aspx

014 MUSIC
Evaluation Systems group of Pearson
All program completers, 200910
18 265 18 100
009 PHYSICS
Evaluation Systems group of Pearson
Other enrolled students
1
009 PHYSICS
Evaluation Systems group of Pearson
All program completers, 200910
2
009 PHYSICS
Evaluation Systems group of Pearson
All program completers, 200809
2
091 PROFESSIONAL KNOWLEDGE ELEMENTARY
Evaluation Systems group of Pearson
All enrolled students who have completed all nonclinical courses
118 268 111 94
091 PROFESSIONAL KNOWLEDGE ELEMENTARY
Evaluation Systems group of Pearson
Other enrolled students
70 260 59 84
091 PROFESSIONAL KNOWLEDGE ELEMENTARY
Evaluation Systems group of Pearson
All program completers, 201011
475 266 455 96
091 PROFESSIONAL KNOWLEDGE ELEMENTARY
Evaluation Systems group of Pearson
All program completers, 200910
491 266 472 96
091 PROFESSIONAL KNOWLEDGE ELEMENTARY
Evaluation Systems group of Pearson
All program completers, 200809
457 265 446 98
092 PROFESSIONAL KNOWLEDGE SECONDARY
Evaluation Systems group of Pearson
All enrolled students who have completed all nonclinical courses
17 262 17 100
092 PROFESSIONAL KNOWLEDGE SECONDARY
Evaluation Systems group of Pearson
Other enrolled students
10 257 9 90
092 PROFESSIONAL KNOWLEDGE SECONDARY
Evaluation Systems group of Pearson
All program completers, 201011
130 265 126 97
092 PROFESSIONAL KNOWLEDGE SECONDARY
Evaluation Systems group of Pearson
All program completers, 200910
111 264 108 97
092 PROFESSIONAL KNOWLEDGE SECONDARY
Evaluation Systems group of Pearson
All program completers, 200809
120 265 118 98
093 PROFESSIONAL KNOWLEDGEEARLY CHLDHOOD
Evaluation Systems group of Pearson
Other enrolled students
2
093 PROFESSIONAL KNOWLEDGEEARLY CHLDHOOD
Evaluation Systems group of Pearson
All program completers, 201011
5
Page 12 of 16Print Report Card
1/10/2014http://title2.westat.com/Title2IPRC/Pages/PrintReport.aspx
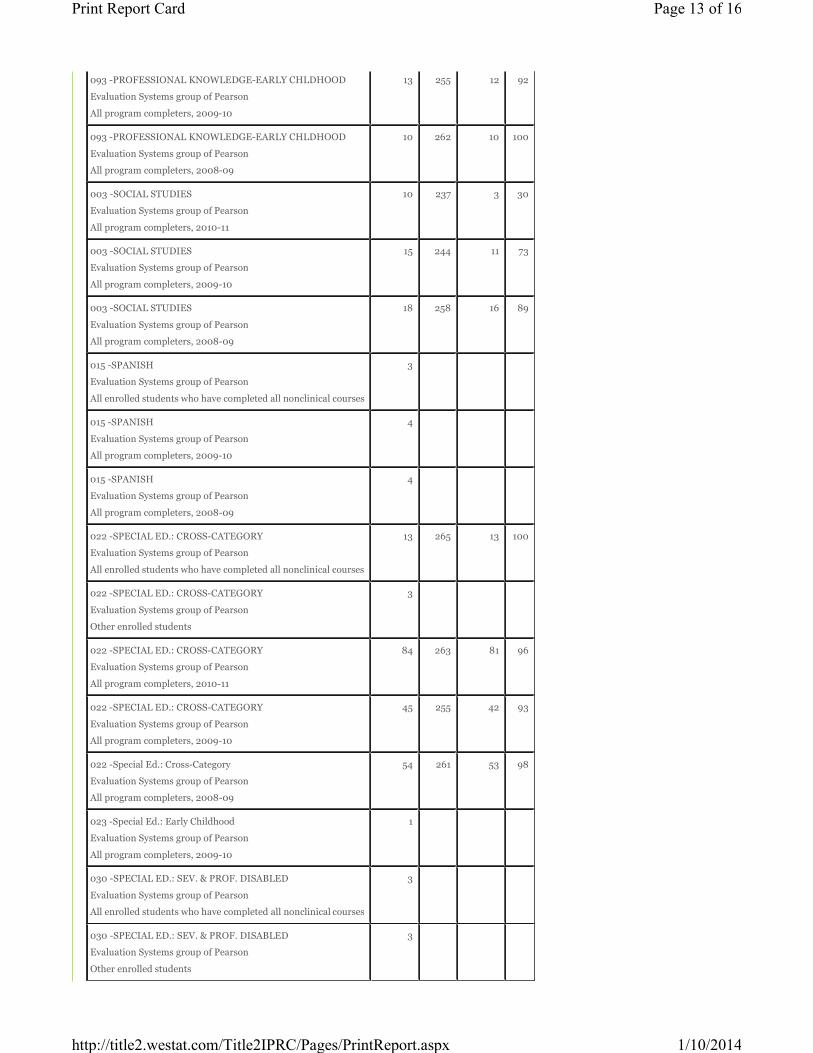
093 PROFESSIONAL KNOWLEDGEEARLY CHLDHOOD
Evaluation Systems group of Pearson
All program completers, 200910
13 255 12 92
093 PROFESSIONAL KNOWLEDGEEARLY CHLDHOOD
Evaluation Systems group of Pearson
All program completers, 200809
10 262 10 100
003 SOCIAL STUDIES
Evaluation Systems group of Pearson
All program completers, 201011
10 237 3 30
003 SOCIAL STUDIES
Evaluation Systems group of Pearson
All program completers, 200910
15 244 11 73
003 SOCIAL STUDIES
Evaluation Systems group of Pearson
All program completers, 200809
18 258 16 89
015 SPANISH
Evaluation Systems group of Pearson
All enrolled students who have completed all nonclinical courses
3
015 SPANISH
Evaluation Systems group of Pearson
All program completers, 200910
4
015 SPANISH
Evaluation Systems group of Pearson
All program completers, 200809
4
022 SPECIAL ED.: CROSSCATEGORY
Evaluation Systems group of Pearson
All enrolled students who have completed all nonclinical courses
13 265 13 100
022 SPECIAL ED.: CROSSCATEGORY
Evaluation Systems group of Pearson
Other enrolled students
3
022 SPECIAL ED.: CROSSCATEGORY
Evaluation Systems group of Pearson
All program completers, 201011
84 263 81 96
022 SPECIAL ED.: CROSSCATEGORY
Evaluation Systems group of Pearson
All program completers, 200910
45 255 42 93
022 Special Ed.: CrossCategory
Evaluation Systems group of Pearson
All program completers, 200809
54 261 53 98
023 Special Ed.: Early Childhood
Evaluation Systems group of Pearson
All program completers, 200910
1
030 SPECIAL ED.: SEV. & PROF. DISABLED
Evaluation Systems group of Pearson
All enrolled students who have completed all nonclinical courses
3
030 SPECIAL ED.: SEV. & PROF. DISABLED
Evaluation Systems group of Pearson
Other enrolled students
3
Page 13 of 16Print Report Card
1/10/2014http://title2.westat.com/Title2IPRC/Pages/PrintReport.aspx
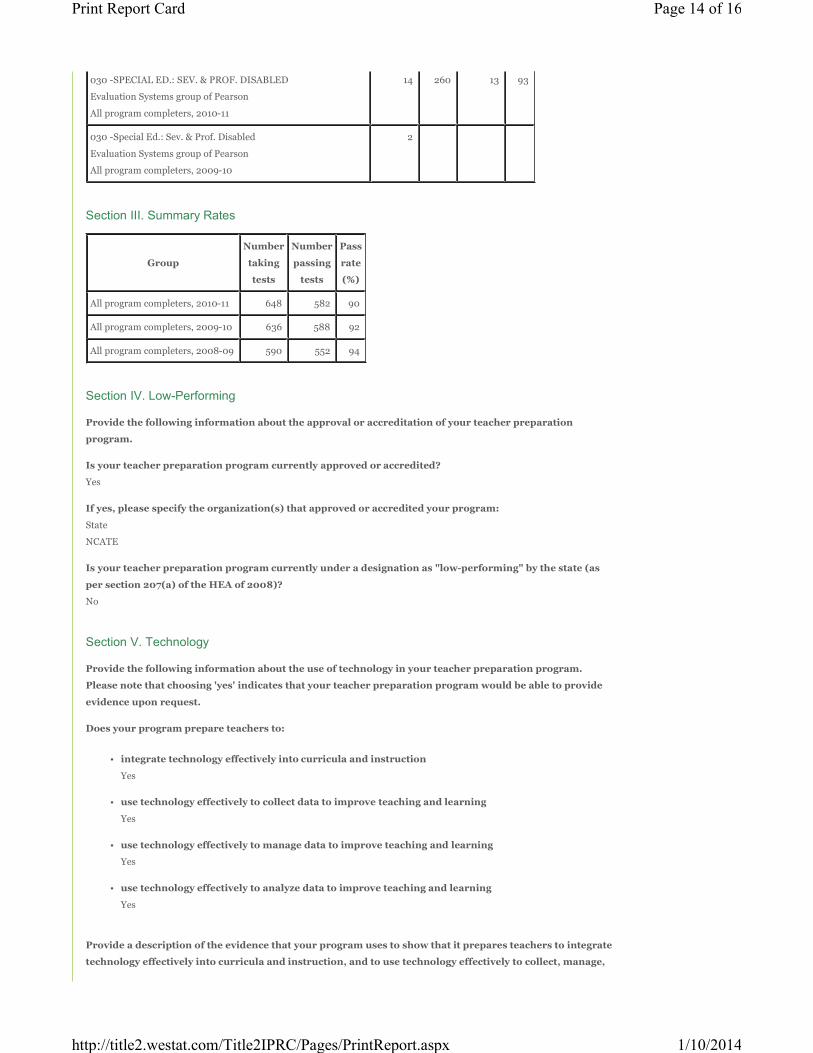
030 SPECIAL ED.: SEV. & PROF. DISABLED
Evaluation Systems group of Pearson
All program completers, 201011
14 260 13 93
030 Special Ed.: Sev. & Prof. Disabled
Evaluation Systems group of Pearson
All program completers, 200910
2
Section III. Summary Rates
Group
Number
taking
tests
Number
passing
tests
Pass
rate
(%)
All program completers, 201011 648 582 90
All program completers, 200910 636 588 92
All program completers, 200809 590 552 94
Section IV. LowPerforming
Provide the following information about the approval or accreditation of your teacher preparation
program.
Is your teacher preparation program currently approved or accredited?
Yes
If yes, please specify the organization(s) that approved or accredited your program:
State
NCATE
Is your teacher preparation program currently under a designation as "lowperforming" by the state (as
per section 207(a) of the HEA of 2008)?
No
Section V. Technology
Provide the following information about the use of technology in your teacher preparation program.
Please note that choosing 'yes' indicates that your teacher preparation program would be able to provide
evidence upon request.
Does your program prepare teachers to:
• integrate technology effectively into curricula and instruction
Yes
•use technology effectively to collect data to improve teaching and learning
Yes
•use technology effectively to manage data to improve teaching and learning
Yes
•use technology effectively to analyze data to improve teaching and learning
Yes
Provide a description of the evidence that your program uses to show that it prepares teachers to integrate
technology effectively into curricula and instruction, and to use technology effectively to collect, manage,
Page 14 of 16Print Report Card
1/10/2014http://title2.westat.com/Title2IPRC/Pages/PrintReport.aspx

and analyze data in order to improve teaching and learning for the purpose of increasing student
academic achievement. Include a description of the evidence your program uses to show that it prepares
teachers to use the principles of universal design for learning, as applicable. Include planning activities
and a timeline if any of the four elements listed above are not currently in place.
ETC 320 and 450 are required courses in all BSEd in Elementary and Special and Elementary Education programs. The
ESE low incidence Masters program requires DIS 505 Assistive Technology in the Lifespan.
In their methods courses, candidates are instructed to use technology to manage student data, and must complete key
assessments that require the use of technology.
Section VI. Teacher Training
Provide the following information about your teacher preparation program. Please note that choosing
'yes' indicates that your teacher preparation program would be able to provide evidence upon request.
Does your program prepare general education teachers to:
•teach students with disabilities effectively
Yes
•participate as a member of individualized education program teams
Yes
•teach students who are limited English proficient effectively
Yes
Provide a description of the evidence your program uses to show that it prepares general education
teachers to teach students with disabilities effectively, including training related to participation as a
member of individualized education program teams, as defined in section 614(d)(1)(B) of the Individuals
with Disabilities Education Act, and to effectively teach students who are limited English proficient.
Include planning activities and a timeline if any of the three elements listed above are not currently in
place.
All elementary education candidates take ESE 380, learning the legal standards, delivery systems, characteristics and
learning needs of exceptional children as well as effective intervention strategies for educating children with disabilities. All
elementary education majors take BME 300/430 in the BSEd programs, those in graduate programs take BME 500/631.
Both sets of courses provide the rationale/theory of second language acquisition, methods of assessing ELL students to
identify learning needs, and strategies for providing instruction to ELL students. The required ESE 450/650 course
requires an IEP project which prepares candidates in initial certification programs to be able to develop effective
instructional plans tailored to the individual learning method of children with disabilities. This course enables candidates to
prepare and participate in IEP processes.
Does your program prepare special education teachers to:
•teach students with disabilities effectively
Yes
•participate as a member of individualized education program teams
Yes
•teach students who are limited English proficient effectively
Yes
Provide a description of the evidence your program uses to show that it prepares special education
teachers to teach students with disabilities effectively, including training related to participation as a
Page 15 of 16Print Report Card
1/10/2014http://title2.westat.com/Title2IPRC/Pages/PrintReport.aspx

member of individualized education program teams, as defined in section 614(d)(1)(B) of the Individuals
with Disabilities Education Act, and to effectively teach students who are limited English proficient.
Include planning activities and a timeline if any of the three elements listed above are not currently in
place.
ESE 434, is a required course in the BSEd Dual Major program, and ESE 634, is required in the M.Ed. in Special Education
with certification. In these courses, working with low incidence students covers participating as a member in IEP teams.
The high incidence program will work to integrate this content into their foundations and methods courses during the 2010
2011 academic year. ESE 450/650 require an IEP project which prepares candidates in initial certification programs to be
able to develop effective institutional plans tailored to the individual leaning needs of children with disabilities. It prepares
Section VII. Contextual Information
Please use this space to provide any additional information that describes your teacher preparation
program(s). You may also attach information to this report card. The U.S. Department of Education is
especially interested in any evaluation plans or interim or final reports that may be available.
All of our initial teacher certification programs implement candidate assessment plans in which every candidate's
acquisition of the Arizona Professional Teaching Standards as well as respective Specialized Professional Association
standards are tracked and documented. Programs submit internal reports annually and submit formal reports to the
Specialized Professional Association on a sevenyear cycle. Our previous reports to Specialized Professional Associations
were submitted in 2008, with the next cycle of reporting to occur in 2014. We have begun surveying the employers of our
program completers through the Arizona Department of Education's system. These data are forming a baseline that will be
beneficial for revealing strengths in our programs and areas in which our programs need to improve. Preliminary data
indicate our candidates are at the state mean in all categories assessed. These include completers' content knowledge, use of
effective teaching methodologies, ability to assess students, ability to use technology, ability to develop literacy and to
incorporate strategies for English Language Learners.
Supporting Files
Northern Arizona University
Traditional Program
201011
Contact Us Glossary Log out
Title II, Higher Education ActOMB Control No.: 18400744 (exp. 12/31/2015)
Page 16 of 16Print Report Card
1/10/2014http://title2.westat.com/Title2IPRC/Pages/PrintReport.aspx