2014 life insurers factbook - acli
TRANSCRIPT
2014 Life insurers
factBook
AmericAn council of life insurers


AMERICAN COUNCIL OF LIFE INSURERS
LIFE INSURERS
FACt BOOk 2014

The American Council of Life Insurers is a Washington, D.C.-based trade association. Its member companies offer life insurance, long-term care insurance, disability income insurance, reinsurance, annuities, pensions, and other retirement and financial protection products.
© 2014 American Council of Life Insurers
No part of this publication may be reproduced, sorted in a retrieval system, or transmitted in any form or by any means—electronic, mechanical, photocopying, recording, or otherwise—without permission of the publisher.
Library of Congress Catalog Number 47–27134
ii

CONtENtS
Preface ix
Methodology xi
Key Statistics xiii
1 Overview 1
Organizational Structure 1 Stock and Mutual Life Insurers 1 Other Life Insurance Providers 1 Employment 2 Foreign Ownership 2
2 Assets 7
Bond Holdings and Acquisitions 7 Types of Bonds 8 Characteristics of Bonds 8 Stock Holdings and Acquisitions 9 Mortgages 9 Real Estate 9 Policy Loans 10 Foreign-Controlled Assets 10
3 Liabilities 23
Policy Reserves 23 Deposit-Type Contracts 24 Asset Fluctuation Reserves 24 Other Liabilities 24 Surplus Funds and Capital Stock 24 Capital Ratios 24
4 Income 35
Premium Income 35 Investment Income and Rate of Return 36 Net Gain From Operations 36
5 Expenditures 47
Contract Payments 47 From Life Insurance Policies 47 From Annuity Contracts 48 From Health Insurance Policies 48 Operating Expenses 48 Taxes 48 Investment Expenses 49
6 Reinsurance 57
Allocating Risk 57 Reinsurance Relationship 58 Underwriting Strength 58 Product Flexibility 58 Capital Managment 58 Types of Reinsurance 58 Proportional Reinsurance 58 Non-Proportional Reinsurance 59
7 Life Insurance 63
Individual Life Insurance 63 Types of Policies 64 Characteristics of Individual Policies 64 Group Life Insurance 65 Credit Life Insurance 65 Policy Claims Resisted or Compromised 66
8 Annuities 73
Group and Individual Annuities 73 Supplementary Contracts, Annuities Certain, and Other Annuities 74
9 Disability Income and Long-Term Care Insurance 79 Disability Income Insurance 79
Individual Disability Income Insurance 79 Group Disability Income Insurance 80 Long-Term Care Insurance 81 Individual Long-Term Care Insurance 81 Group Long-Term Care Coverage 82 Accelerated Benefits 82
10 In the States 83
11 Industry Rankings 95
12 Mortality and Life Expectancy 121
APPENDIX 133
A Glossary of Insurance Related Terms 135 B Historic Dates 151
C Life Insurance Related Organizations 161
D StateInsuranceOfficials 169
iii


5
ILLUStRAtIONS
Tables
Overview
1.1 U.S. Life Insurers Organizational Structure, by Number of Companies 2
1.2 Size of U.S. Life Insurers by Organizational Structure, 2013 (millions) 3
1.3 Veterans Life Insurance, 2013 3
1.4 Insurance Industry Employment in the United States 3
1.5 Foreign-Owned U.S. Life Insurers, 2009–2013 4
1.6 Foreign-Owned Life Insurers Operating in the United States, by Country of Origin 4
1.7 U.S. Life Insurers Organizational Structure, by Year 5
1.8 Insurance Industry Employment in the United States, by Year 6
Assets
2.1 Distribution of Life Insurer Assets, by Account Type, 2013 (millions) 11
2.2 Distribution of Life Insurer Assets, by Account Type and Year 12
2.3 Distribution of Long-Term General Account Bond Investments 14
2.4 Distribution of General Account Bonds, by Remaining Maturity, 2009–2013 15
2.5 Distribution of General Account Long-Term Bonds, at Time of Purchase, 2013 15
2.6 Distribution of General Account Bonds, by NAIC Quality Class 16
2.7 Quality of Mortgages Held by Life Insurers (millions) 18
2.8 General Account Mortgages for Life Insurers, by Type and Loan-to-Value
Ratios, 2013 (millions) 19
2.9 Real Estate Owned by Life Insurers, by Type 19
2.10 Foreign-Controlled Assets of U.S. Life Insurers, by Country and Year (millions) 20
2.11 Asset Distribution of Life Insurers, by Year (millions) 21
Liabilities
3.1 Liabilities and Surplus Funds of Life Insurers 25
3.2 Policy Reserves of Life Insurers, by Line of Business 27
3.3 Deposit-Type Contracts, 2013 (millions) 29
3.4 Capital Ratios of Life Insurers (percent) 29
3.5 Levels of Risk-Based Capital Held by Life Insurers, 2003–2013 30
3.6 Life Insurers Policy Reserves, by Line of Business and Year (millions) 31
3.7 Life Insurance Policy Reserves, by Type and Year (millions) 32
3.8 Life Insurer Liabilities and Surplus Funds, by Year (millions) 33
3.9 Capital Ratios of Life Insurers, by Year (percent) 34
v

6 Illustrations
Income
4.1 Income of Life Insurers 37
4.2 Premium Receipts of Life Insurers 37
4.3 Individual and Group Life Insurance Net Premium Receipts, 2013 (millions) 38
4.4 Individual and Group Annuity Considerations, 2013 (millions) 39
4.5 Individual Life Premiums and Annuity Considerations as Percentage
of Disposable Personal Income 39
4.6 Accident and Health Insurance Net Premium Receipts 39
4.7 Net Investment Income 40
4.8 Rates of Return on Invested Assets of Life Insurers 40
4.9 Net Gain From Operations After Federal Income Taxes 41
4.10 Income of Life Insurers, by Year (millions) 42
4.11 Individual Life Insurance Premium Receipts, by Year (millions) 43
4.12 Individual Annuity Considerations, by Year (millions) 44
4.13 Rates of Return on Invested Assets of Life Insurers, by Year (percent) 45
Expenditures
5.1 Expenditures of Life Insurers 49
5.2 Payments From Life Insurance Policies 50
5.3 Payments From Annuity Contracts 51
5.4 Payments From Health Insurance Policies 51
5.5 Life Insurer Home- and Field-Office Expenses 52
5.6 Taxes, Licenses, and Fees 52
5.7 Investment Expenses of Life Insurers 53
5.8 Payments Under Life Insurance Policies and Annuity Contracts,
by Year (millions) 54
5.9 Payments to Life Insurance Beneficiaries, by Year 55
5.10 Health Insurance Benefit Payments by Life Insurers, by Year (millions) 56
Reinsurance
6.1 Reinsurance Assumed and Ceded—Premiums 60
6.2 Life Reinsurance Assumed (face amount) 61
Life Insurance
7.1 Life Insurance in the United States 66
7.2 Individual Life Insurance Purchases in the United States, by Plan Type, 2013 68
7.3 Life Insurance Purchases, by Participating Status 68
7.4 Voluntary Termination Rates for Life Insurance Policies, Calculated by Face Amount (percent) 69
7.5 Voluntary Termination Rates for Life Insurance Policies, Calculated by Number
of Policies (percent) 69
7.6 Life Insurance With Disability Provisions, 2013 70
7.7 New Policy Claims Resisted or Compromised (thousands) 70
7.8 Life Insurance Purchases, by Year 71
7.9 Life Insurance in Force in the United States, by Year (millions) 72
vi

7Illustrations
Annuities
8.1 Annuity Considerations 74
8.2 Reserves for Annuity Contracts 75
8.3 Annuity Benefit Payments 75
8.4 Annuity Considerations, by Year (millions) 76
8.5 Annuity Reserves, by Year 77
In the States
10.1 Life Insurers, by State of Domicile, 2013 84
10.2 Life Insurance Purchases, by State, 2013 (millions) 85
10.3 Life Insurance in Force, by State, 2013 86
10.4 Life Insurance and Annuity Benefit Payments, by State, 2013 (thousands) 88
10.5 Payments to Life Insurance Beneficiaries, by State, 2013 (thousands) 90
10.6 Direct Premium Receipts of Life Insurers, by State, 2013 (millions) 92
10.7 Mortgages Owned by Life Insurers, by Type and State, 2013 (thousands) 93
10.8 Real Estate Owned by Life Insurers, by State, 2013 (thousands) 94
Industry Rankings
11.1 Largest Life Insurers, by Total Assets, 2013 (thousands) 96
11.2 Largest Life Insurers, by General Account Assets, 2013 (thousands) 97
11.3 Largest Life Insurers, by Separate Account Assets, 2013 (thousands) 98
11.4 Largest Life Insurers, by Individual Net Life Insurance Premiums, 2013 (thousands) 99
11.5 Largest Life Insurers, by Group Net Life Insurance Premiums, 2013 (thousands) 100
11.6 Largest Life Insurers, by Total Net Life Insurance Premiums, 2013 (thousands) 101
11.7 Largest Life Insurers, by Individual Direct Life Insurance Premiums,
2013 (thousands) 102
11.8 Largest Life Insurers, by Group Direct Life Insurance Premiums, 2013 (thousands) 103
11.9 Largest Life Insurers, by Total Direct Life Insurance Premiums, 2013 (thousands) 104
11.10 Largest Life Insurers, by Individual Life Insurance Issued, 2013 (thousands) 105
11.11 Largest Life Insurers, by Group Life Insurance Issued, 2013 (thousands) 106
11.12 Largest Life Insurers, by Total Life Insurance Issued, 2013 (thousands) 107
11.13 Largest Life Insurers, by Individual Life Insurance in Force, 2013 (thousands) 108
11.14 Largest Life Insurers, by Group Life Insurance in Force, 2013 (thousands) 109
11.15 Largest Life Insurers, by Total Life Insurance in Force, 2013 (thousands) 110
11.16 Largest Life Insurers, by Individual Net Annuity Considerations, 2013 (thousands) 111
11.17 Largest Life Insurers, by Group Net Annuity Considerations, 2013 (thousands) 112
11.18 Largest Life Insurers, by Total Net Annuity Considerations, 2013 (thousands) 113
11.19 Largest Life Insurers, by Individual Direct Annuity Considerations, 2013
(thousands) 114
11.20 Largest Life Insurers, by Group Direct Annuity Considerations, 2013 (thousands) 115
11.21 Largest Life Insurers, by Total Direct Annuity Considerations, 2013 (thousands) 116
11.22 Largest Life Insurers, by Individual Annuity Reserves, 2013 (millions) 117
11.23 Largest Life Insurers, by Group Annuity Reserves, 2013 (millions) 118
11.24 Largest Life Insurers, by Total Annuity Reserves, 2013 (millions) 119
vii

8 Illustrations
Mortality and Life Expectancy
12.1 Death Rates in the United States 122
12.2 Life Expectancy, by Age and Gender, 1900–2011 123
12.3 Mortality Tables 130
FIgures
2.1 Growth of Life Insurer Assets 12
2.2 Asset Distribution of Life Insurers, 2013 14
2.3 Mortgages Held by Life Insurers, by Type 17
2.4 Real Estate Owned by Life Insurers, 2013 17
3.1 Growth of Life Insurers’ Policy Reserves 26
3.2 Distribution of Life Insurers’ Policy Reserves, 2013 28
4.1 Distribution of Life Insurers’ Net Premium Receipts, 2013 38
5.1 Distribution of Life Insurers’ Expenditures, 2013 50
7.1 Individual, Group, and Credit Life Insurance in Force in the United States
(face amount) 67
7.2 Average Face Amount of Individual Life Insurance Policies Purchased 67
viii

9
PREFACE
The Life Insurers Fact Book, the annual statistical
report of the American Council of Life Insurers (ACLI),
provides information on trends and statistics about the
life insurance industry. ACLI represents approximately
300 legal reserve life insurer and fraternal benefit
society member companies operating in the United
States. These member companies represent over 90%
of the assets and premiums of the U.S life insurance and
annuity industry.
ACLI advocates the interests of life insurers and their
millions of policyholders before federal and state
legislators, state insurance departments, administration
officials, federal regulatory agencies, and the courts. ACLI
expands awareness of how the products offered by life
insurers—life insurance, pensions, annuities, disability
income insurance, and long-term care insurance—help
Americans plan for and achieve financial and retirement
security.
Unless otherwise noted, the data reported in the Life
Insurers Fact Book are ACLI tabulations of the National
Association of Insurance Commissioners (NAIC) 2013
statutory data for the life industry as of June 2014, and
represent U.S. legal reserve life insurance companies
and fraternal benefit societies. NAIC data are used by
permission. The NAIC does not endorse any analysis or
conclusions based on use of its data.
We would like to acknowledge ACLI staff who prepared
the Life Insurers Fact Book 2014: Michele Alexander, Jim
Bishop, Khari Cook, Bill Hart, Kyle Ritter, Harsh Sharma,
Ken Shields, Jiangmei Wang, and Matt Wellens.
Andrew Melnyk, Ph.D.
Vice President, Research
ix

MEtHODOLOGY
The assets of a fleet typically differ slightly from the sum
of the assets of individual companies in the fleet, because
the net value (stockholder equity) of the subsidiary is
counted at both the subsidiary and the parent level. This
same double-counting discrepancy exists for liabilities,
investment income, and surplus. Adjustments have been
made, when possible, to eliminate the double-counting
of assets, liabilities, investment income, and surplus.
Chapter 4 presents calculations of gross and net rates
of return on investment based on formulas traditionally
used in the industry. The net rate of return is calculated
as:
(net investment income)/ 2-year average net invested
assets. The formula for average net invested assets
is (current year net invested assets + current year
investment income due – current year borrowed money
– current year payable for securities – current year capital
notes – current year surplus notes + previous year net
invested assets + previous year investment income due –
previous year borrowed money – previous year payable
for securities – previous year capital notes – previous
year surplus notes – net investment income) / 2.
The gross rate of return on fixed-rate assets is calculated
as:
(Gross investment income on bonds)/ average net
investment in bonds. The denominator is (CY bonds
+ PY Bonds – gross investment income on bonds) /2.
Unless otherwise noted, data in the Life Insurers Fact
Book come from the annual statements of life insurers
filed with the National Association of Insurance
Commissioners (NAIC). These data represent the U.S.
insurance business of companies (or branches of foreign
companies) regulated by state insurance commissioners.
Unless otherwise noted, data for years after 2002 include
information for both life insurance companies and for
fraternal benefit societies that sell life insurance products.
Prior to 2003, data do not include fraternal benefit
insurance sales. Where fraternal data are included, they
are included as individual, rather than group, business.
Data on life insurance sales by savings banks and the U.S.
Department of Veterans Affairs are provided separately
in Chapter 1 only.
Most of the Fact Book data are reported in standardized
tables that summarize information for the current year
(2013 data), last year (2012 data), and 10 years previous
(2003 data), along with the average annual percentage
change over the last year and the last ten years. In
cases where 2003 data are not available, then the oldest
available data are reported.
Company ownership is reflected on a fleet basis. That is,
if a stock company is owned by a mutual parent, both
are now classified as mutual companies. The same is
true for insurance companies owned by non-U.S. parents.
This affects most notably tables in Chapter 1.
xi


xiii
key U.S. Life Insurers Statistics
Average annual percent change
2003 2012 2013 2003/2013 2012/2013
Life insurance in force (millions)1
Individual $9,654,731 $11,215,136 $11,365,441 1.6 1.3 Credit 7,236,191 8,011,839 8,214,718 1.3 2.5 group 152,739 93,940 81,359 -6.1 -13.4Total 17,043,661 19,320,916 19,661,518 1.4 1.8Annuity considerations (millions)2 Individual3 $165,943 $189,258 $179,578 0.8 -5.1
group 102,614 158,837 108,091 0.5 -31.9Total 268,588 348,095 287,669 0.7 -17.4
Payments under life insurance and annuity contracts (millions) Paymentstobeneficiaries $51,661 $63,259 $64,350 2.2 1.7 surrenders values4 176,204 248,322 251,512 3.6 1.3 Policyholderdividends 20,761 15,530 15,965 -2.6 2.8
annuity payments5 57,110 74,039 78,751 3.3 6.4 Matured endowments 596 442 396 -4.0 -10.3 Otherpayments6 650 612 655 0.1 7.1
Total 306,982 402,204 411,629 3.0 2.3
Income of life insurers (millions) Lifeinsurancepremiums $127,320 $135,392 $130,582 0.3 -3.6 Annuityconsiderations2 268,558 348,095 287,669 0.7 -17.4 Healthinsurancepremiums 115,827 172,300 175,084 4.2 1.6Total 511,705 655,788 593,335 1.5 -9.5
Investmentincome 179,744 228,084 237,995 2.8 4.3 Otherincome7 35,558 68,483 75,397 7.8 10.1 aggregate total 727,007 952,355 906,727 2.2 -4.8
Life insurers doing business in the United States (units) Stock 931 660 648 -3.6 -1.8 Mutual8 180 120 113 -4.5 -5.8
Fraternal9 105 82 82 -2.4 0.0 Other10 11 6 7 -4.4 16.7
Total 1,227 868 850 -3.6 -2.1
Source: ACLItabulationsofNationalAssociationofInsuranceCommissioners(NAIC)data,usedbypermission.Notes: NAICdoesnotendorseanyanalysisorconclusionsbasedonuseofitsdata.Codificationeffectivewith2001AnnualStatementfilingschangedthereportingofcertainlinesofbusiness,particularlydeposit-typecontracts,asexplainedinnumberedfootnotes.Na: Not available1Data represent net business.2Beginningin2001,excludesdepositsforguaranteedinterestcontractsduetocodification.3Includessupplementarycontractswithlifecontingencies.4Beginningin2001,excludespaymentsunderdeposit-typecontracts,andincludesannuitywithdrawalsoffunds,forwhichacomparableamountinprioryears is not available.5Excludespaymentsunderdeposit-typecontracts.6Includessomedisabilitybenefitsandretainedassets.7Includescommissionsandexpenseallowanceonreinsuranceceded.For2012and2013,includesamortizationofinterestmaintenancereserve.8Includesstockcompaniesownedbymutualholdingcompanies.9Includesstockcompaniesownedbyfraternalbenefitsocieties.10Includesfarmbureau,reciprocal,andriskretentiongroups.


FACt BOOk 2014


1U.S. life insurance companies sell the vast majority of life
insurance and annuities purchased in the United States.
Fraternal organizations and federal government agencies
are also in the marketplace, and certain Canadian life
insurers with U.S. legal reserves are allowed to sell
insurance directly from their Canadian offices to U.S.
purchasers. Data from Canadian companies are not
included in this chapter.
At the end of 2013, 850 life insurance companies were
in business in the United States (Table 1.1). The number
of active companies peaked in 1988 (Table 1.7), and has
since fallen steadily, mostly due to company mergers
and consolidations. This streamlining has helped to
reduce operating costs and general overhead, and has
significantly increased efficiency.
OrganizatiOnal Structure
Stock and Mutual Life Insurers
Most life insurers are organized as either stock or
mutual companies. Stock life insurance companies issue
stock and are owned by their stockholders. Mutual
companies are legally owned by their policyholders and
consequently do not issue stock.
Stock life insurers can be owned by other stock life
insurance companies, mutual life insurance companies,
or companies outside the life insurance industry. Only
policyholders own a mutual company, however. If a
stock company is owned by a mutual company, that
stock company is categorized as a mutual company. The
majority of life insurers are stock companies—648, or 76
percent of the industry (Table 1.1). Many life insurers
are affiliated with other life and non-life insurance
companies in fleets with a single owner.
Besides consolidation, another recent trend in the life
insurance industry is demutualization and the formation
of mutual holding companies—a structure that allows
easier and less expensive access to capital. In creating a
mutual holding company, the mutual insurer either starts
a stock insurance company or acquires a stock company.
For data in this chapter, mutual holding companies are
included in the totals for pure mutual companies.
Together, stock and mutual life insurers provide most
of the insurance and annuities underwritten by U.S.
organizations (Table 1.2). Mutual companies had $5.4
trillion of life insurance in force in 2013 and stock life
insurers, $13.8 trillion. Fraternal societies and other type
companies underwrite the remainder of U.S. insurance.
Other Life Insurance Providers
Fraternal benefit societies provide both social and
insurance benefits to their members. These organizations
are legally required to operate through a lodge system,
allowing only lodge members and their families to own
the fraternal society’s insurance. In 2013, there were 82
fraternal life insurance companies that had $330 billion of
life insurance in force and $141 billion in assets (Tables
1.1 and 1.2).
The Department of Veterans Affairs provides protection
to U.S. veterans under six insurance programs: U.S.
Government Life Insurance, National Service Life
Insurance, Veterans’ Special Life Insurance, Service-
OVerVieW
2 American Council of Life Insurers
Disabled Veterans Insurance, Veterans’ Reopened
Insurance, and Veterans’ Mortgage Life Insurance.
The federal agency also oversees three life insurance
programs for members of the uniformed services:
Servicemembers’ Group Life Insurance, SGLI Family
Coverage, and Veterans’ Group Life Insurance.
Veterans’ life insurance in force totaled $1.3 trillion
in 2013 (Table 1.3). U.S. Government Life Insurance,
covering World War I veterans, had $3 million of
insurance in force in 2013, while National Service Life
Insurance, for veterans of World War II and those covered
by the Insurance Act of 1951, totaled $6.1 billion. Service-
Disabled Veterans Insurance—for veterans separated
from service after April 1951 who have a service-
connected disability but are otherwise insurable—had
$2.7 billion of insurance in force in 2013.
The largest life insurance plan, Servicemembers’ Group
Life Insurance, had $885 billion of insurance in force
with 2.4 million policies at year-end 2013 (Table 1.3).
Table 1.1 u.S. life insurers Organizational Structure, by number of companies
In business at year’s end Average annual percent change
2012 2013 2012/2013
Stock 660 648 -1.8
Mutual1 120 113 -5.8
Fraternal2 82 82 0.0
Other3 6 7 16.7
Total 868 850 -2.1
Source: ACLI tabulations of National Association of Insurance Commissioners (NAIC) data, used by permission.Note: NAIC does not endorse any analysis or conclusions based on use of its data.1Includes stock companies owned by mutual parents (life & PC) and mutual holding companies.2Includes stock companies owned by fraternal benefit societies.3Includes farm bureau, reciprocal, and risk retention groups.
emplOyment
The insurance industry plays an important role in the
nation’s economy. In 2013, U.S. insurers employed 2.4
million individuals in all of their branches, remaining
stable from a year earlier (Table 1.4).
Government data on employees of insurance agencies
and home offices in 2013 show 1.4 million insurance
home-office personnel (339,200 in life insurance) and
943,200 insurance agents, brokers, and service personnel.
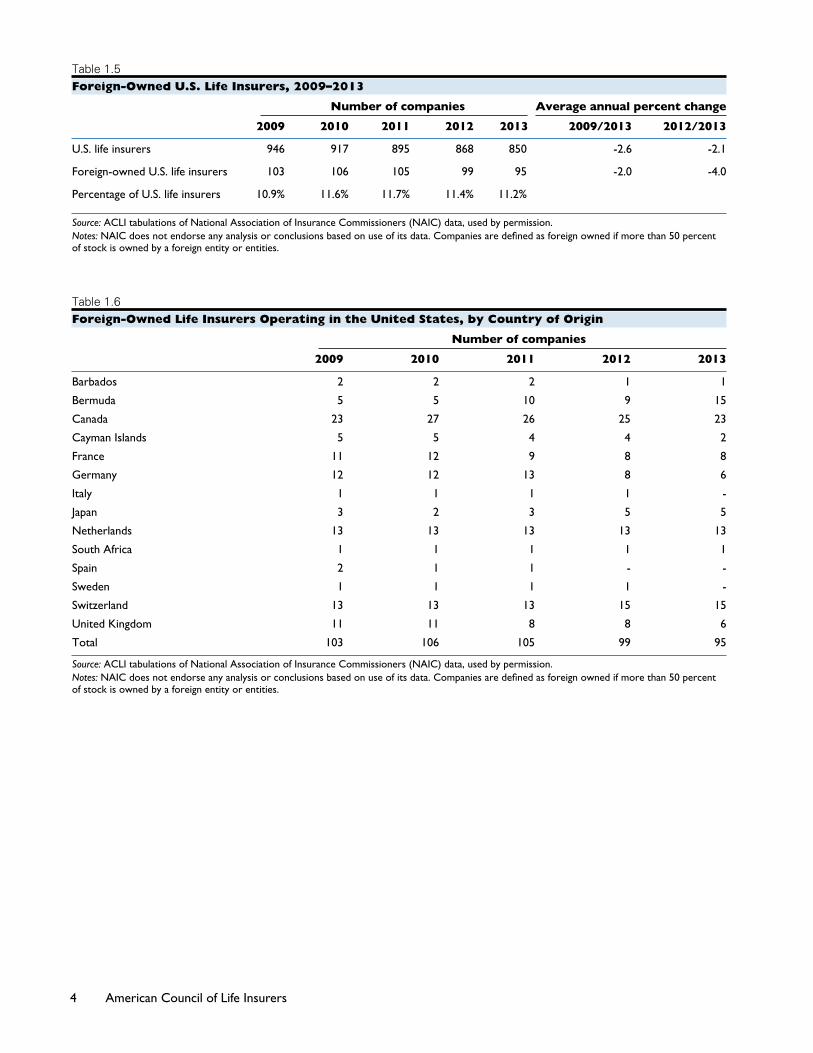
FOreign OWnerShip
The proportion of life insurance companies operating
in the United States that are foreign-owned was 11.2
percent in 2013 (Table 1.5).
Practically, the same countries have fielded the major
foreign players in the U.S. market since the mid-1990s.
Among life insurance companies operating in the United
States during 2013, Canada controlled 23 companies;
Switzerland, 15; Bermuda, 15; the Netherlands, 13;
France, 8; Germany, 6; the United Kingdom, 6 (Table
1.6).

3Overview
Table 1.2Size of u.S. life insurers, by Organizational Structure, 2013 (millions)
Stock Mutual1 Fraternal Other2 Total
Life insurance in force $13,795,758 $5,374,339 $329,985 $161,436 $19,661,518
Life insurance purchased 1,957,904 822,719 29,307 23,631 2,833,561
Assets 4,650,798 1,333,594 140,556 25,351 6,150,300
Benefit payments3 426,363 111,941 8,078 1,641 548,023
Premium income4 447,443 133,852 10,266 1,774 593,335
Source: ACLI tabulations of National Association of Insurance Commissioners (NAIC) data, used by permission.Note: NAIC does not endorse any analysis or conclusions based on use of its data.1Includes stock companies owned by mutual holding companies.2Includes farm bureau, reciprocal, and risk retention groups.3Includes payments to beneficiaries, surrender values, policy dividends, annuity payments, matured endowments, and other payments.4Includes life insurance premiums, annuity considerations, and accident and health premiums.
Table 1.3Veterans life insurance, 2013
Face amount Policies in force (millions)
Veterans programs U.S. Government Life Insurance 1,443 $3 National Service Life Insurance 492,003 6,096 Veterans’ Special Life Insurance 137,999 1,929 Service-Disabled Veterans Insurance 254,547 2,654 Veterans’ Reopened Insurance 19,810 208 Veterans’ Mortgage Life Insurance 2,454 304
Total 908,256 11,194Uniformed service member programs Servicemembers’ Group Life Insurance (SGLI) 2,376,500 884,781 Traumatic Injury Protection (TSGLI)* - 228,050 SGLI Family Coverage 3,090,000 123,834
Veterans’ Group Life Insurance 425,218 64,688
Total 5,891,718 1,301,353Aggregate total 6,799,974 1,312,547
Source: U.S. Department of Veterans Affairs.*TSGLI is a rider to the basic SGLI coverage.
Table 1.4insurance industry employment in the united States
Number employed Average annual percent change
2003 2012 2013 2003/2013 2012/2013
Home-office personnel Life insurance 440,500 347,300 339,200 -2.6 -2.3 Health insurance 351,400 463,900 472,900 3.0 1.9 Other 753,400 625,200 624,100 -1.9 -0.2
Total 1,545,300 1,436,400 1,436,200 -0.7 0.0
Agents, brokers, and service personnel 856,200 931,800 943,200 1.0 1.2
Aggregate total 2,401,500 2,368,200 2,379,400 -0.1 0.5
Source: U.S. Department of Labor, Bureau of Labor Statistics. Current Employment Statistics survey (National).Note: The Bureau of Labor Statistics adjusts annual employment data in April of the year following its survey.
4 American Council of Life Insurers
Table 1.5Foreign-Owned u.S. life insurers, 2009–2013
Number of companies Average annual percent change
2009 2010 2011 2012 2013 2009/2013 2012/2013
U.S. life insurers 946 917 895 868 850 -2.6 -2.1
Foreign-owned U.S. life insurers 103 106 105 99 95 -2.0 -4.0
Percentage of U.S. life insurers 10.9% 11.6% 11.7% 11.4% 11.2%
Source: ACLI tabulations of National Association of Insurance Commissioners (NAIC) data, used by permission.Notes: NAIC does not endorse any analysis or conclusions based on use of its data. Companies are defined as foreign owned if more than 50 percent of stock is owned by a foreign entity or entities.
Table 1.6Foreign-Owned life insurers Operating in the united States, by country of Origin
Number of companies
2009 2010 2011 2012 2013
Barbados 2 2 2 1 1
Bermuda 5 5 10 9 15
Canada 23 27 26 25 23
Cayman Islands 5 5 4 4 2
France 11 12 9 8 8
Germany 12 12 13 8 6
Italy 1 1 1 1 -
Japan 3 2 3 5 5
Netherlands 13 13 13 13 13
South Africa 1 1 1 1 1
Spain 2 1 1 - -
Sweden 1 1 1 1 -
Switzerland 13 13 13 15 15
United Kingdom 11 11 8 8 6
Total 103 106 105 99 95
Source: ACLI tabulations of National Association of Insurance Commissioners (NAIC) data, used by permission.Notes: NAIC does not endorse any analysis or conclusions based on use of its data. Companies are defined as foreign owned if more than 50 percent of stock is owned by a foreign entity or entities.

5Overview
Table 1.7u.S. life insurers Organizational Structure, by year
In business at year’s end
Year Stock Mutual Fraternals Other Total
1950 507 142 NA NA 6491955 942 165 NA NA 1,1071960 1,286 155 NA NA 1,4411965 1,475 154 NA NA 1,6291970 1,627 153 NA NA 1,7801975 1,603 143 NA NA 1,7461980 1,823 135 NA NA 1,9581981 1,855 136 NA NA 1,9911982 1,926 134 NA NA 2,0601983 1,985 132 NA NA 2,1171984 2,062 131 NA NA 2,1931985 2,133 128 NA NA 2,2611986 2,128 126 NA NA 2,2541987 2,212 125 NA NA 2,3371988 2,225 118 NA NA 2,3431989 2,153 117 NA NA 2,2701990 2,078 117 NA NA 2,1951991 1,947 117 NA NA 2,0641992 1,835 109 NA NA 1,9441993 1,736 108 NA NA 1,8441994 1,565 115 NA 10 1,6901995* 1,356 259 NA 35 1,6501996* 1,331 240 NA 36 1,6071997* 1,193 238 NA 45 1,4761998* 1,167 248 NA 29 1,4441999* 1,064 250 NA 33 1,3472000* 1,018 221 NA 30 1,2692001* 986 222 117 16 1,3412002* 956 204 114 10 1,2842003* 931 180 105 11 1,2272004* 901 161 108 9 1,1792005* 857 151 102 9 1,1192006* 818 142 103 9 1,0722007* 768 133 99 9 1,0092008* 741 132 95 8 9762009* 714 131 93 8 9462010* 700 121 89 7 9172011* 687 117 85 6 8952012* 660 120 82 6 8682013* 648 113 82 7 850
Source: ACLI tabulations of National Association of Insurance Commissioners (NAIC) data, used by permission.Notes: NAIC does not endorse any analysis or conclusions based on use of its data. After 1993, data include life insurance companies that sell accident and health insurance.NA: Not available*Beginning with 1995 data, stock companies that are part of fleets headed by non-stock companies are counted by the parent’s ownership type, not as stock companies.

6 American Council of Life Insurers
Table 1.8insurance industry employment in the united States, by year
Home-office personnel
Agents, brokers, Life Health and service Aggregate Year insurance insurance Other Total personnel total
1960 452,400 50,200 329,100 831,700 217,300 1,049,000 1965 481,200 54,200 358,000 893,400 250,300 1,143,700 1970 525,600 93,900 410,200 1,029,700 288,000 1,317,700 1975 520,500 122,100 442,700 1,085,300 356,600 1,441,900 1980 531,900 141,900 550,300 1,224,100 463,800 1,687,900 1981 542,200 142,700 552,000 1,236,900 475,800 1,712,700 1982 546,100 142,100 549,100 1,237,300 485,900 1,723,200 1983 539,900 144,800 544,200 1,228,900 498,900 1,727,800 1984 536,700 153,900 549,100 1,239,700 525,000 1,764,700 1985 559,300 170,700 561,600 1,291,600 548,200 1,839,800 1986 578,200 188,100 598,500 1,364,800 579,400 1,944,200 1987 578,000 202,100 634,900 1,415,000 611,800 2,026,800 1988 570,400 216,500 648,500 1,435,400 639,600 2,075,000 1989 550,200 228,100 660,100 1,438,400 651,800 2,090,200 1990 522,600 204,200 611,600 1,338,400 677,800 2,016,200 1991 537,200 219,000 613,500 1,369,700 681,400 2,051,100 1992 530,600 228,300 627,000 1,385,900 672,200 2,058,100 1993 552,500 237,900 640,400 1,430,800 684,000 2,114,800 1994 562,600 249,400 649,300 1,461,300 700,300 2,161,600 1995 547,200 260,100 626,800 1,434,100 712,600 2,146,700 1996 510,000 278,000 642,800 1,430,800 726,400 2,157,200 1997 505,300 292,100 678,800 1,476,200 744,100 2,220,300 1998 510,600 306,200 729,400 1,546,200 766,300 2,312,500 1999 496,100 319,200 742,800 1,558,100 783,400 2,341,500 2000 481,100 330,600 732,600 1,544,300 806,800 2,351,100 2001 470,300 340,500 728,600 1,539,400 823,000 2,362,400 2002 446,000 348,000 743,000 1,537,000 839,400 2,376,400 2003 440,500 351,400 753,400 1,545,300 856,200 2,401,500 2004 392,400 374,900 721,000 1,488,300 879,200 2,367,500 2005 334,500 430,400 680,900 1,445,800 893,200 2,339,000 2006 362,400 428,200 677,100 1,467,700 911,400 2,379,100 2007 352,800 434,400 674,000 1,461,200 930,500 2,391,700 2008 356,300 444,500 674,600 1,475,400 929,600 2,405,000 2009 362,600 440,300 660,400 1,463,300 907,400 2,370,700 2010 366,400 437,700 641,100 1,445,200 895,500 2,340,700 2011 346,700 442,300 637,200 1,426,200 910,300 2,336,500 2012 347,300 463,900 625,200 1,436,400 931,800 2,368,200 2013 339,200 472,900 624,100 1,436,200 943,200 2,379,400
Source: U.S. Department of Labor, Bureau of Labor Statistics, Current Employment Statistics survey (National).Notes: Figures comprise only those on the payroll of insurers that participate in the unemployment insurance program; The Bureau of Labor Statistics adjusts annual employment data in April of the year following its survey.

2Assets held by life insurers back the companies’
life, annuity, and health liabilities. Accumulating
these assets—via the collection of premiums from
policyholders and earnings on investments—provides
the U.S. economy with an important source of investment
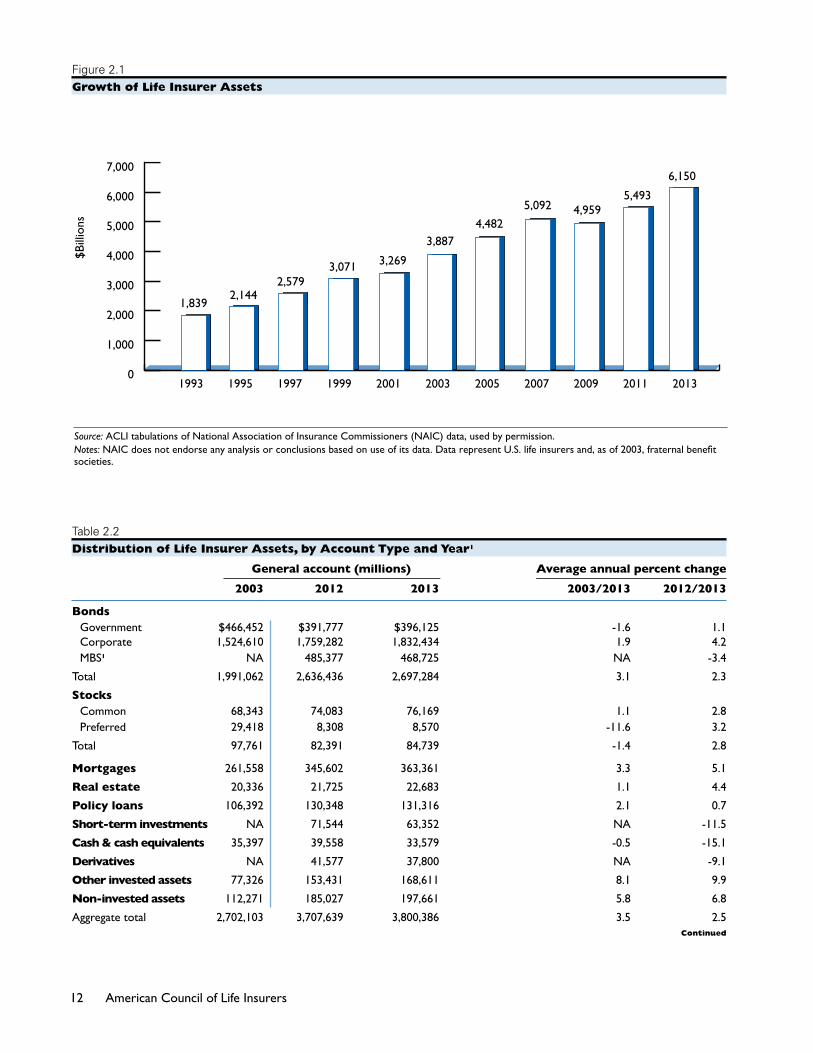
capital. Life insurers held $6.2 trillion in assets in 2013
(Table 2.1). Assets of U.S. life insurers rose 7 percent
during 2013 (Table 2.2).
Financial instruments comprise most life insurance
company assets and can generally be classified into:
n Bonds, both corporate and government
n Stocks
n Mortgage and real estate holdings
n Policy loans
A life insurer divides its assets between two accounts that
differ largely in the nature of the liabilities or obligations
for which the assets are being held and invested. The
general account supports contractual obligations for
guaranteed, fixed-dollar benefit payments, such as
life insurance policies. The separate account supports
liabilities associated with investment risk pass-through
products or lines of business, such as variable annuities,
variable life insurance, and pension products.
State laws allow assets in separate accounts to be invested
without regard to the restrictions usually placed on the
general account. A separate account portfolio might
comprise only common stocks or bonds or mortgages,
or some combination of these and other investments.
Separate account assets totaled $2.3 trillion at the end
of 2013—up 14 percent from the previous year (Table
2.2). General account assets amounted to $3.8 trillion in
2013, up 3 percent from 2012.
Bond Holdings and acquisitions
Bonds are publicly traded debt securities. Often referred
to as fixed-income securities, bonds generally offer low
risk and a greater certainty of rates of return. Not only
does the borrower (seller of the bond) agree to pay a
fixed amount of interest periodically and repay a fixed
amount of principal at maturity, but the obligation to
make payments on the bond takes precedence over
other claims of lenders and stockholders.
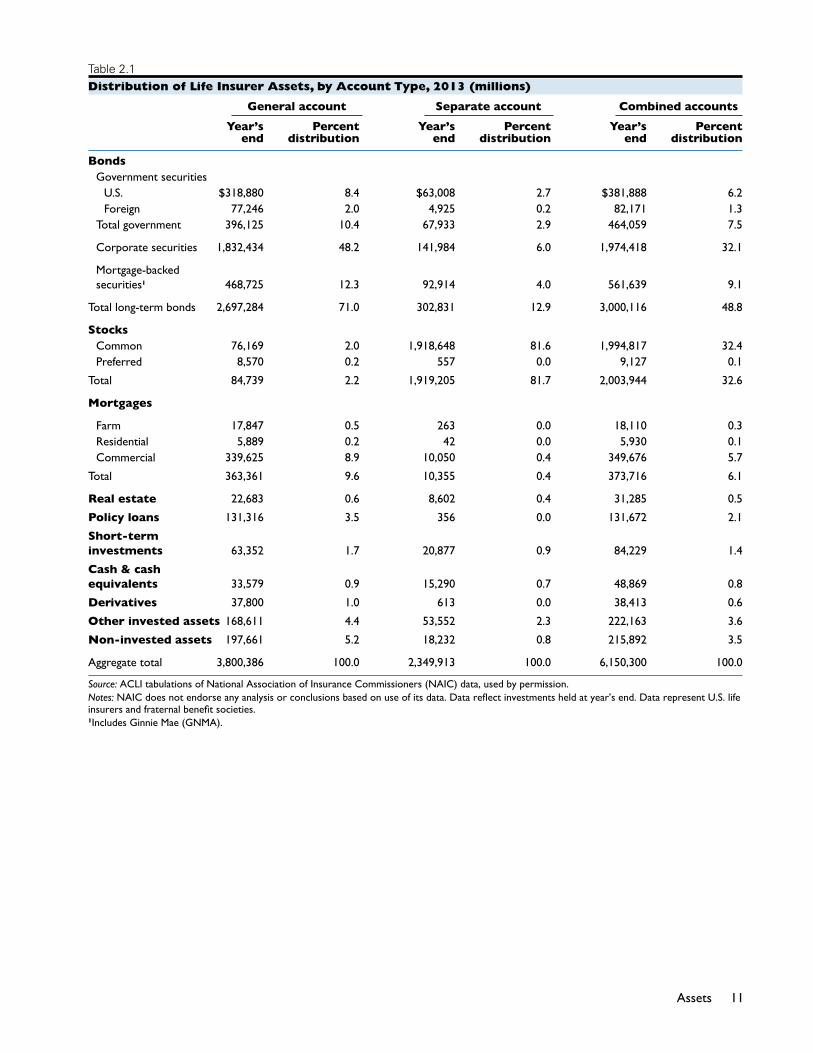
At year-end 2013, 49 percent of life insurer assets were
held in bonds. Total bond holdings of both general
and separate accounts amounted to $3 trillion, up $64
billion from 2012 (Tables 2.1–2.2). Holdings of bonds in
separate accounts increased 1 percent in 2013 to $303
billion. Bond holdings in general accounts increased to
$2.7 trillion (Table 2.2).
Bonds are issued by a variety of borrowing organizations,
including domestic and foreign corporations, the U.S.
Treasury, various U.S. government agencies, and state,
local, and foreign governments. Long-term U.S. Treasury
securities in the general account totaled $125 billion,
U.S. government obligations $52 billion, and foreign
government bonds $77 billion (Table 2.3). The largest
portion of long-term bonds was in unaffiliated securities,
with both U.S. and foreign investments totaling $1.8
trillion, or two-thirds of all long-term general account
bonds (67%). Long-term bonds issued by U.S. states,
assEts

8 American Council of Life Insurers
territories, and political subdivisions came to $45
billion, while bonds issued for revenue, assessment, and
industrial development totaled $96 billion.
Types of Bonds
Corporate Bonds
Life insurers are significant investors in the corporate
bond market, having been the largest institutional holder
of corporate bonds issued in U.S. markets since the
1930s. Private or direct placements—where the financial
institution negotiates directly with the corporation over
the terms of the offering—account for a sizable share
of life insurer investments in corporate bonds. Life
insurance companies are the major lenders in the direct
placement market.
Corporate debt issues in 2013 represented the largest
component of life insurer assets at 32 percent (Table 2.1).
Corporate debt issues totaled $2 trillion by year’s end
(Table 2.2). These investments have generally increased
steadily for many years and have grown at a 2 percent
annual rate in the last decade.
Government Bonds
Bonds of the U.S. government include U.S. Treasury
securities and others issued by federal agencies.
Government securities rose to $464 billion at the end
of 2013, up $5.1 billion from the previous year (Tables
2.1–2.2). These holdings, in addition to U.S. Treasury
and federal agency holdings include guaranteed, special
revenue, and other issues of the 50 states, District
of Columbia, Puerto Rico, and U.S. territories and
possessions and their political subdivisions.
The vast majority of long-term securities were invested
in U.S. government securities ($382 billion) as opposed
to those of foreign governments and international
agencies ($82 billion), such as the International Bank for
Reconstruction and Development (Table 2.1).
Characteristics of Bonds
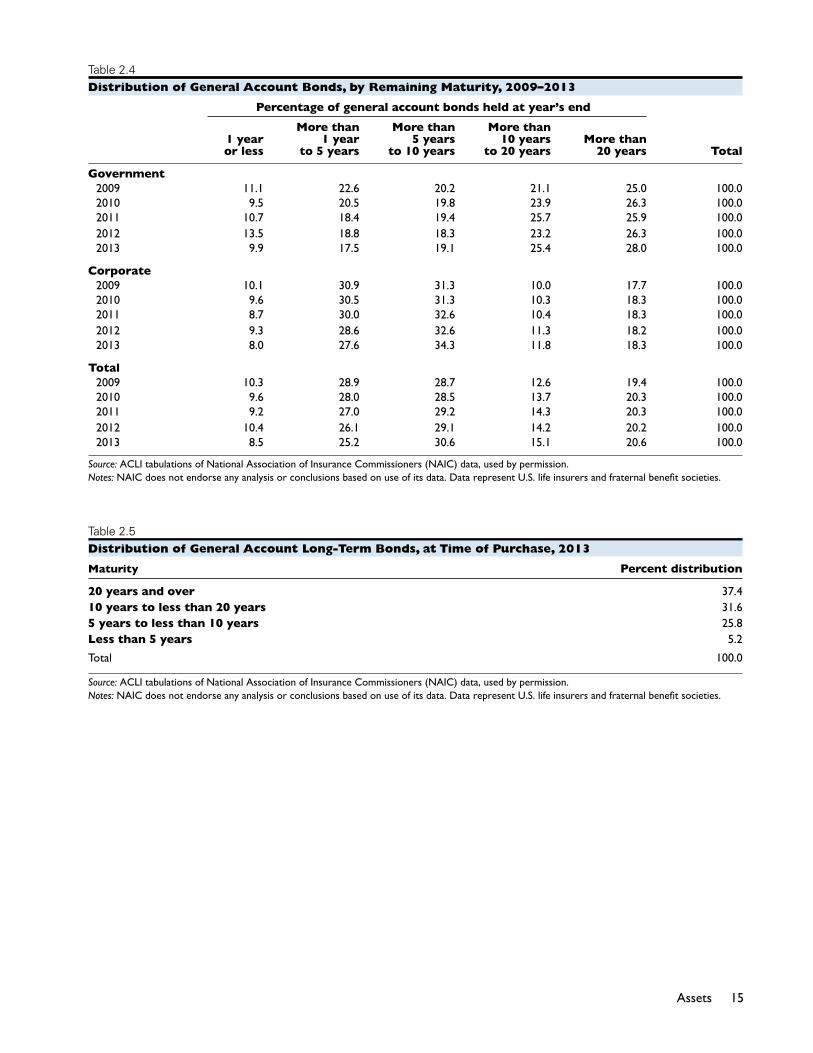
Maturity
Bonds have limited lives and expire on a given date,
called the issue’s maturity date. Thirty-one percent of
general account bonds held at year-end 2013 had a
maturity between five and 10 years. Another 25 percent
matured between one and five years, 21 percent had a
maturity over 20 years, 15 percent matured between 10
and 20 years, and 8 percent had a maturity of one year
or less (Table 2.4).
At the time of purchase, 37 percent of bonds had a
maturity date of 20 years or more, while 32 percent had
a maturity date of 10 to 20 years (Table 2.5). Bonds with
maturity dates of five to 10 years (26%), and less than
five years (5%) made up the remainder.
Quality
In purchasing a bond, investors examine its quality. The
higher the quality of the bond, the lower the risk, and
the higher the degree of assurance that investors will get
their money back at maturity. Consequently, high-quality
bonds are ideal for long-term capital accumulation.
Bond holdings can be categorized among six quality
classes established by the National Association of
Insurance Commissioners. At year-end 2013, 94 percent
of total general account bonds were investment grade,
Classes 1 and 2 (Table 2.6). The percentage of total bonds
in or near default (Class 6) was 0.1 percent.
Of the $2.8 trillion in general account bonds held by
insurance companies in 2013, $2 trillion was invested
in publicly traded bonds and $744 billion in privately
traded bonds (Table 2.6). Ninety-six percent of the
publicly traded bonds were investment grade (Classes 1
and 2) compared with 90 percent of the privately traded
bonds. Of the publicly traded bonds, 0.1 percent were
in or near default (Class 6), compared with 0.3 percent
of the privately traded bonds.

9Assets
stock Holdings and acquisitions
Life insurers’ changing portfolios reflect long-term shifts
in investment demand. Since the early 1990s, the share
of assets held in stocks has been increasing. The average
annual growth in equity holdings was 7 percent between
2003 and 2013 (Table 2.2).
Historically, stocks had been a small percentage of
total assets for reasons rooted in both the investment
philosophy of the industry and the laws regulating life
insurance. Stocks had not been heavily used as a major
investment medium for funds backing life insurance
policies because of the policies’ contractual guarantees
for specified dollar amounts.
Part of the investment shift is due to changes in the
relative yields of various investment types. Other factors
are the introduction of variable life insurance and the
growth in funding pension plans with equity securities of
life insurers and variable annuities. State laws generally
permit certain assets of these and other plans to be
maintained in an account separate from a company’s
other assets, with up to 100 percent invested in stocks
or other equities.
Life insurer holdings of corporate stock rose 16 percent
between 2012 and 2013 to $2 trillion, accounting for 33
percent of total assets. At year-end 2013, $1.9 trillion, or
96 percent, of stock held by life insurance companies
was in separate accounts (Table 2.1-2.2).
Common stock accounted for $1.99 trillion, or 99 percent,
of all stock held by life insurers in 2013 (Table 2.1).
Holdings of common stock increased 16 percent in 2013,
while there was a 1 percent increase in preferred-stock
holdings (Tables 2.1–2.2).
MortgagEs
Mortgages generally are considered riskier fixed-income
investments than bonds. Over the past decade, life
insurers have slightly reduced the relative size of their
mortgage portfolios in favor of other investments. In
2013, mortgages increased 6 percent to $374 billion and
accounted for 6 percent of combined account assets
(Tables 2.1–2.2).
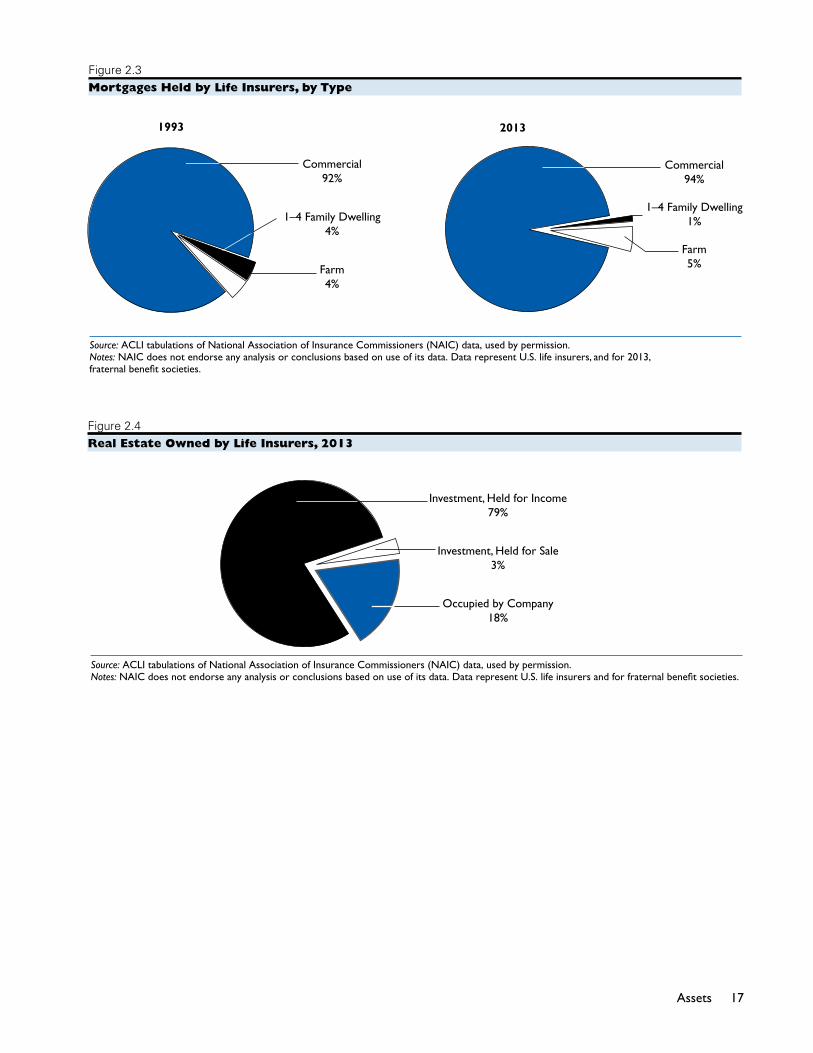
Properties underlying life insurer holdings of non-
farm, nonresidential mortgages cover a broad range of
commercial, industrial, and institutional uses. Among
them are retail stores and shopping centers, office
buildings and factories, hospitals and medical centers,
and apartment buildings. Commercial mortgages have
grown in importance, representing 94 percent ($350
billion) of U.S. mortgages held by life insurers at the end
of 2013 (Table 2.1). Mortgages for residential properties
were $6 billion, or 2 percent of total mortgages held by
life insurers on U.S. properties. Farm mortgages were
$18 billion, accounting for 5 percent of total mortgages
in 2013.
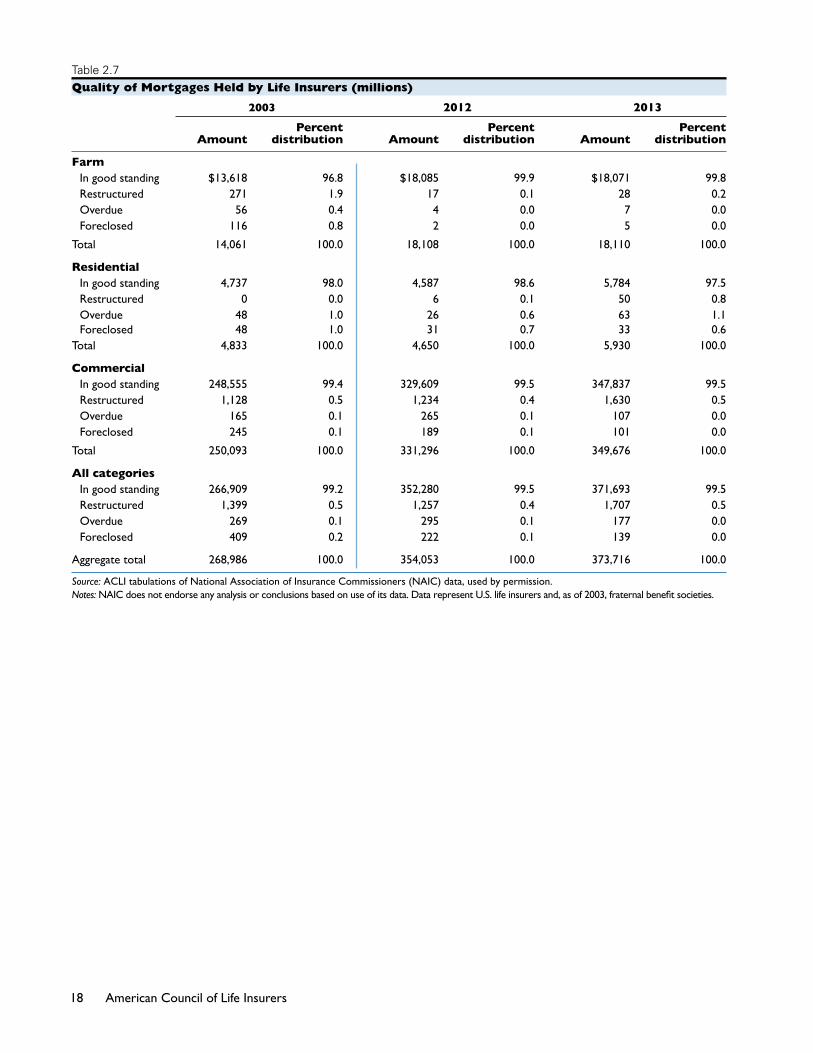
Almost all of the mortgages held by life insurers were
in good standing (99.5%) in 2013. Of industry-held
mortgages, only 0.5 percent were either restructured,
overdue, or in foreclosure in 2013 (Table 2.7).
At year-end 2013, $7 billion (2%) was held in general
account mortgages with a loan-to-value ratio above 95
percent, compared with $315 billion (87%) in mortgages
with a loan-to-value ratio below 71 percent (Table 2.8).
rEal EstatE
U.S. life insurers’ holdings of directly owned real estate
were $31 billion at the end of 2013. This represents a 2
percent increase from 2012 (Table 2.9).
By the end of 2013, real estate amounted to a half percent
of life insurers’ assets (Table 2.1). Real estate holdings
in separate accounts decreased $231 million during the
year as real estate in general accounts increased $958
million (Table 2.2).
Real estate held to produce income totaled $25 billion,
or 79 percent of all real estate owned, while real estate
held for sale amounted to $1 billion (Table 2.9, Figure
2.4). The remainder was in land and property held for
company use, primarily home and regional offices.

10 American Council of Life Insurers
Policy loans
Life insurance companies can loan money to policyholders
up to the cash value of their life insurance. Life insurers
must make these policy loans from funds that otherwise
would be invested. Since premium rates are based in
part on an anticipated investment return, interest must be
charged on the loans. Because the amount of a policy’s
protection is reduced by the amount of the loan, life
insurers advise policyholders that an outstanding loan
can seriously impair a family’s insurance planning. The
policy loan amounts shown in Tables 2.1–2.2 do not
include loans made to policyholders by banks or other
lending institutions holding borrowers’ life insurance
policies as collateral.
Life insurer loans to policyholders against the cash value
of their life insurance amounted to $132 billion by year-
end 2013, up 1 percent from the loans outstanding a
year earlier (Tables 2.1–2.2). Policy loans accounted for
2 percent of company assets at the end of 2013.
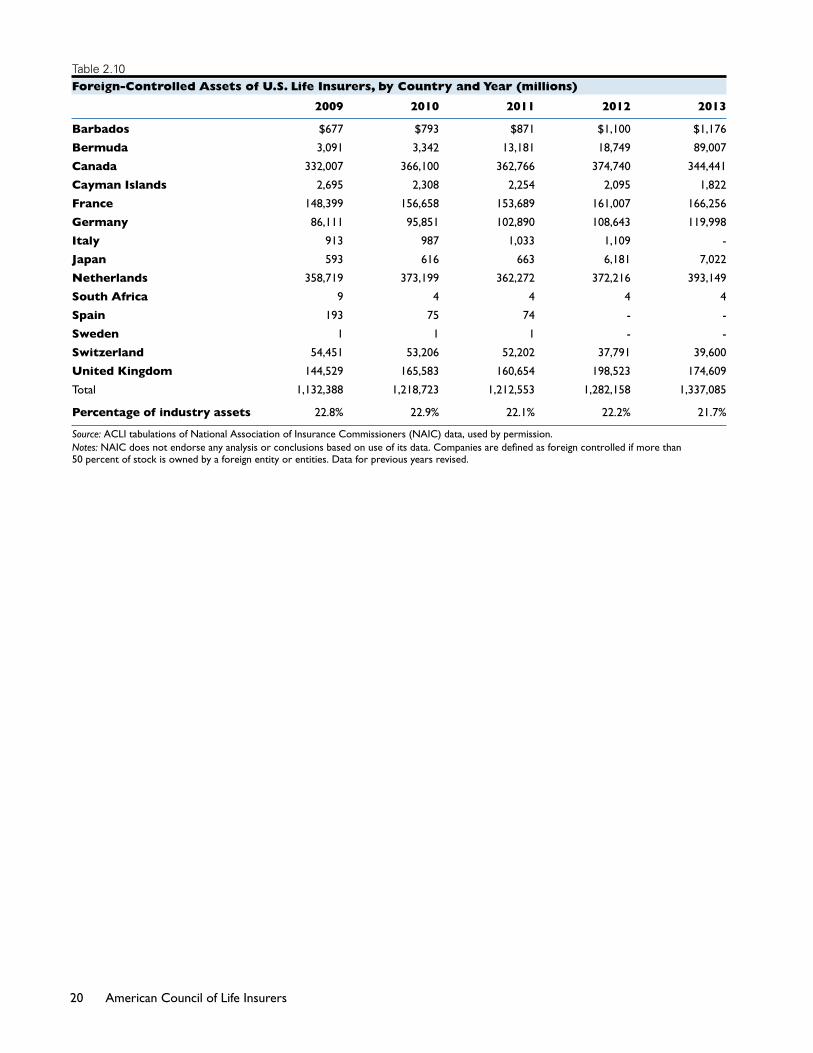
ForEign-controllEd assEts
Foreign-controlled assets were $1.34 trillion, or 21.7
percent of total industry assets in 2013, down from 2012
(Table 2.10). The Netherlands, followed by Canada, the
United Kingdom, and France own the most foreign-
controlled assets of U.S. life insurers.
11Assets
Table 2.1distribution of life insurer assets, by account type, 2013 (millions)
General account Separate account Combined accounts
Year’s Percent Year’s Percent Year’s Percent end distribution end distribution end distribution
Bonds Government securities U.S. $318,880 8.4 $63,008 2.7 $381,888 6.2 Foreign 77,246 2.0 4,925 0.2 82,171 1.3 Total government 396,125 10.4 67,933 2.9 464,059 7.5
Corporate securities 1,832,434 48.2 141,984 6.0 1,974,418 32.1
Mortgage-backed securities1 468,725 12.3 92,914 4.0 561,639 9.1
Total long-term bonds 2,697,284 71.0 302,831 12.9 3,000,116 48.8
Stocks Common 76,169 2.0 1,918,648 81.6 1,994,817 32.4 Preferred 8,570 0.2 557 0.0 9,127 0.1
Total 84,739 2.2 1,919,205 81.7 2,003,944 32.6
Mortgages
Farm 17,847 0.5 263 0.0 18,110 0.3 Residential 5,889 0.2 42 0.0 5,930 0.1 Commercial 339,625 8.9 10,050 0.4 349,676 5.7
Total 363,361 9.6 10,355 0.4 373,716 6.1
Real estate 22,683 0.6 8,602 0.4 31,285 0.5
Policy loans 131,316 3.5 356 0.0 131,672 2.1
Short-terminvestments 63,352 1.7 20,877 0.9 84,229 1.4
Cash & cashequivalents 33,579 0.9 15,290 0.7 48,869 0.8
Derivatives 37,800 1.0 613 0.0 38,413 0.6
Other invested assets 168,611 4.4 53,552 2.3 222,163 3.6
Non-invested assets 197,661 5.2 18,232 0.8 215,892 3.5
Aggregate total 3,800,386 100.0 2,349,913 100.0 6,150,300 100.0
Source: ACLI tabulations of National Association of Insurance Commissioners (NAIC) data, used by permission.Notes: NAIC does not endorse any analysis or conclusions based on use of its data. Data reflect investments held at year’s end. Data represent U.S. life insurers and fraternal benefit societies.1Includes Ginnie Mae (GNMA).
12 American Council of Life Insurers
Table 2.2distribution of life insurer assets, by account type and year1
General account (millions) Average annual percent change
2003 2012 2013 2003/2013 2012/2013
Bonds Government $466,452 $391,777 $396,125 -1.6 1.1
Corporate 1,524,610 1,759,282 1,832,434 1.9 4.2 MBS1 NA 485,377 468,725 NA -3.4
Total 1,991,062 2,636,436 2,697,284 3.1 2.3
Stocks Common 68,343 74,083 76,169 1.1 2.8 Preferred 29,418 8,308 8,570 -11.6 3.2
Total 97,761 82,391 84,739 -1.4 2.8
Mortgages 261,558 345,602 363,361 3.3 5.1
Real estate 20,336 21,725 22,683 1.1 4.4
Policy loans 106,392 130,348 131,316 2.1 0.7
Short-term investments NA 71,544 63,352 NA -11.5
Cash & cash equivalents 35,397 39,558 33,579 -0.5 -15.1
Derivatives NA 41,577 37,800 NA -9.1
Other invested assets 77,326 153,431 168,611 8.1 9.9
Non-invested assets 112,271 185,027 197,661 5.8 6.8
Aggregate total 2,702,103 3,707,639 3,800,386 3.5 2.5
continued
Figure 2.1growth of life insurer assets
Source: ACLI tabulations of National Association of Insurance Commissioners (NAIC) data, used by permission.Notes: NAIC does not endorse any analysis or conclusions based on use of its data. Data represent U.S. life insurers and, as of 2003, fraternal benefit societies.
20132011200920072005200320011999199719951993
Source: ACLI tabulations of National Association of Insurance Commissioners (NAIC) data, used by permission. Notes: NAIC does not endorse any analysis or conclusions based on use of its data. Data represent U.S. life insurers, and, as of 2003, fraternal benefit societies.
0
1,000
2,000
3,000
4,000
5,000
6,000
7,000
8000
$Bill
ions
6,150
5,4934,9595,092
4,4823,887
3,2693,0712,579
2,1441,839

13Assets
Separate account (millions) Average annual percent change
2003 2012 2013 2003/2013 2012/2013
Bonds Government $71,139 $67,135 $67,933 -0.5 1.2 Corporate 119,353 134,222 141,984 1.8 5.8 MBS1 NA 97,912 92,914 NA -5.1
Total 190,492 299,269 302,831 4.7 1.2
Stocks Common 923,733 1,642,183 1,918,648 7.6 16.8 Preferred 694 685 557 -2.2 -18.7
Total 924,427 1,642,868 1,919,205 7.6 16.8
Mortgages 7,429 8,452 10,355 3.4 22.5
Real estate 10,336 8,834 8,602 -1.8 -2.6
Policy loans 615 367 356 -5.3 -3.0
Short-term investments NA 19,104 20,877 NA 9.3
Cash & cash equivalents 14,646 19,765 15,290 0.4 -22.6
Derivatives NA 435 613 NA 40.9
Other invested assets 29,046 49,939 53,552 6.3 7.2
Non-invested assets 7,605 20,748 18,232 9.1 -12.1
Aggregate total 1,184,596 2,069,782 2,349,913 7.1 13.5
Combined accounts (millions) Average annual percent change
2003 2012 2013 2003/2013 2012/2013
Bonds Government $537,592 $458,912 $464,059 -1.5 1.1 Corporate 1,643,963 1,893,504 1,974,418 1.8 4.3 MBS1 NA 583,289 561,639 NA -3.7
Total 2,181,555 2,935,705 3,000,116 3.2 2.2
Stocks Common 992,076 1,716,266 1,994,817 7.2 16.2 Preferred 30,112 8,993 9,127 -11.3 1.5
Total 1,022,188 1,725,259 2,003,944 7.0 16.2
Mortgages 268,986 354,053 373,716 3.3 5.6
Real estate 30,672 30,559 31,285 0.2 2.4
Policy loans 107,007 130,715 131,672 2.1 0.7
Short-term investments NA 90,648 84,229 NA -7.1
Cash & cash equivalents 50,043 59,324 48,869 -0.2 -17.6
Derivatives NA 42,012 38,413 NA -8.6
Other invested assets 106,372 203,370 222,163 7.6 9.2
Non-invested assets 119,876 205,775 215,892 6.1 4.9
Aggregate total 3,886,699 5,777,420 6,150,300 4.7 6.5
Source: ACLI tabulations of National Association of Insurance Commissioners (NAIC) data, used by permission.Notes: NAIC does not endorse any analysis or conclusions based on use of its data. Data reflect investments held at year’s end. Data represent U.S. life insurers and, as of 2003, fraternal benefit societies.1Includes Ginnie Mae (GNMA).NA: Not available
Table 2.2 distribution of life insurer assets, by account type and year—continued

14 American Council of Life Insurers
Table 2.3distribution of long-term general account Bond investments
2012 2013
Amount Percent Amount Percent (millions) distribution (millions) distribution
U.S. Treasury securities $132,589 5.0 $125,083 4.6
U.S. government obligations 50,074 1.9 52,173 1.9
Foreign government 77,054 2.9 77,246 2.9
U.S. states and territories 19,093 0.7 19,350 0.7
U.S. political subdivisions 23,706 0.9 25,990 1.0
Revenue and assessment 87,053 3.3 94,085 3.5
Industrial development 2,209 0.1 2,198 0.1
Mortgage-backed securities 485,377 18.4 468,725 17.4
Pass-through securities
GNMA 18,965 0.7 18,564 0.7
FNMA and FHLMC 90,590 3.4 90,369 3.4
Privately issued 13,326 0.5 12,763 0.5
CMOs and REMICs
GNMA, FNMA, FHLMC or VA 132,458 5.0 123,789 4.6
Privately issued and collateralized by MBS 6,552 0.2 5,811 0.2
All other privately issued 223,486 8.5 217,429 8.1
Other
Unaffiliated securities 1,735,676 65.8 1,800,488 66.8
Affiliated securities 23,606 0.9 31,945 1.2
Total 2,636,436 100.0 2,697,284 100.0
Source: ACLI tabulations of National Association of Insurance Commissioners (NAIC) data, used by permission.Notes: NAIC does not endorse any analysis or conclusions based on use of its data. Data represent U.S. life insurers and fraternal benefit societies.
Source: ACLI tabulations of National Association of Insurance Commissioners (NAIC) data, used by permission.Notes: NAIC does not endorse any analysis or conclusions based on use of its data. Data represent U.S. life insurers and fraternal benefit societies.
Figure 2.2asset distribution of life insurers, 2013
GENERAL ACCOUNT
Stocks2%
Miscellaneous Assets13%
Policy Loans4%
Mortgages and Real Estate10%
Bonds71%
Source: ACLI tabulations of National Association of Insurance Commissioners (NAIC) data, used by permission. Notes: NAIC does not endorse any analysis or conclusions based on use of its data. Data represent U.S. life insurers and fraternal benefit societies.
SEPARATE ACCOUNT
Stocks82%
Bonds13%
Miscellaneous Assets5%
Mortgages and Real Estate0.8%
15Assets
Table 2.4distribution of general account Bonds, by remaining Maturity, 2009–2013
Percentage of general account bonds held at year’s end
More than More than More than 1 year 1 year 5 years 10 years More than or less to 5 years to 10 years to 20 years 20 years Total
Government 2009 11.1 22.6 20.2 21.1 25.0 100.0 2010 9.5 20.5 19.8 23.9 26.3 100.0 2011 10.7 18.4 19.4 25.7 25.9 100.0
2012 13.5 18.8 18.3 23.2 26.3 100.0 2013 9.9 17.5 19.1 25.4 28.0 100.0
Corporate 2009 10.1 30.9 31.3 10.0 17.7 100.0 2010 9.6 30.5 31.3 10.3 18.3 100.0 2011 8.7 30.0 32.6 10.4 18.3 100.0
2012 9.3 28.6 32.6 11.3 18.2 100.0 2013 8.0 27.6 34.3 11.8 18.3 100.0
Total 2009 10.3 28.9 28.7 12.6 19.4 100.0 2010 9.6 28.0 28.5 13.7 20.3 100.0 2011 9.2 27.0 29.2 14.3 20.3 100.0
2012 10.4 26.1 29.1 14.2 20.2 100.0 2013 8.5 25.2 30.6 15.1 20.6 100.0
Source: ACLI tabulations of National Association of Insurance Commissioners (NAIC) data, used by permission.Notes: NAIC does not endorse any analysis or conclusions based on use of its data. Data represent U.S. life insurers and fraternal benefit societies.
Table 2.5distribution of general account long-term Bonds, at time of Purchase, 2013
Maturity Percent distribution
20 years and over 37.410 years to less than 20 years 31.65 years to less than 10 years 25.8Less than 5 years 5.2
Total 100.0
Source: ACLI tabulations of National Association of Insurance Commissioners (NAIC) data, used by permission.Notes: NAIC does not endorse any analysis or conclusions based on use of its data. Data represent U.S. life insurers and fraternal benefit societies.

16 American Council of Life Insurers
Table 2.6distribution of general account Bonds, by naic quality class1
PUBLIC BONDS 2003 2012 2013
Percentage of Percentage of Percentage of Amount publicly Amount publicly Amount publicly NAIC quality class (millions) traded bonds (millions) traded bonds (millions) traded bonds
High quality Class 1 $1,067,072 69.1 $1,382,494 69.6 $1,403,399 69.2 Class 2 392,253 25.4 505,955 25.5 536,934 26.5Medium quality Class 3 47,529 3.1 59,181 3.0 58,452 2.9
Low quality Class 4 28,415 1.8 28,837 1.5 24,075 1.2 Class 5 6,663 0.4 6,969 0.4 4,448 0.2 Class 6 2,985 0.2 1,556 0.1 1,329 0.1
Total 1,544,917 100.0 1,984,993 100.0 2,028,638 100.0
PRIVATE BONDS 2003 2012 2013
Percentage of Percentage of Percentage of Amount privately Amount privately Amount privately NAIC quality class (millions) traded bonds (millions) traded bonds (millions) traded bonds
High quality Class 1 $187,633 42.1 $333,781 45.1 $332,702 44.7 Class 2 196,149 44.0 333,675 45.0 339,925 45.7
Medium quality Class 3 33,426 7.5 44,070 5.9 42,330 5.7
Low quality
Class 4 16,800 3.8 19,389 2.6 19,229 2.6 Class 5 7,850 1.8 7,580 1.0 7,334 1.0
Class 6 3,541 0.8 2,203 0.3 2,566 0.3
Tota l 445,400 100.0 740,699 100.0 744,085 100.0
TOTAL BONDS 2003 2012 2013
Percentage of Percentage of Percentage of Amount general Amount general Amount general NAIC quality class (millions) account bonds (millions) account bonds (millions) account bonds
High quality Class 1 $1,254,705 63.0 $1,716,276 63.0 $1,736,101 62.6 Class 2 588,403 29.6 839,630 30.8 876,859 31.6
Medium quality Class 3 80,955 4.1 103,251 3.8 100,781 3.6
Low quality Class 4 45,215 2.3 48,227 1.8 43,304 1.6 Class 5 14,513 0.7 14,549 0.5 11,782 0.4 Class 6 6,526 0.3 3,759 0.1 3,895 0.1
Aggregate total 1,990,317 100.0 2,725,691 100.0 2,772,722 100.0
Source: ACLI tabulations of National Association of Insurance Commissioners (NAIC) data, used by permission.Notes: NAIC does not endorse any analysis or conclusions based on use of its data. Figures include both government and corporate bonds held in corporate general accounts of U.S. life insurers and, as of 2003, fraternal benefit societies.NAIC bond classes are: Class 1—highest quality; Class 2—high quality; Class 3—medium quality; Class 4—low quality; Class 5—lower quality; Class 6—in or near default. Class 1 and Class 2 bonds are investment grade. 1Includes long-term bonds, short-term investments, and cash equivalents.
17Assets
Figure 2.4real Estate owned by life insurers, 2013
Source: ACLI tabulations of National Association of Insurance Commissioners (NAIC) data, used by permission. Notes: NAIC does not endorse any analysis or conclusions based on use of its data. Data represent U.S. life insurers and for fraternal benefit societies.
Figure 2.3Mortgages Held by life insurers, by type
Source: ACLI tabulations of National Association of Insurance Commissioners (NAIC) data, used by permission. Notes: NAIC does not endorse any analysis or conclusions based on use of its data. Data represent U.S. life insurers, and for 2013, fraternal benefit societies.
Commercial92%
1–4 Family Dwelling4%
Farm4%
1993 2013
Commercial94%
1–4 Family Dwelling1%
Farm5%
Source: ACLI tabulations of National Association of Insurance Commissioners (NAIC) data, used by permission. Notes: NAIC does not endorse any analysis or conclusions based on use of its data. Data represent U.S. life insurers and, for 2011, fraternal benefit societies.
Investment, Held for Income79%
Investment, Held for Sale3%
Occupied by Company18%
Source: ACLI tabulations of National Association of Insurance Commissioners (NAIC) data, used by permission. Notes: NAIC does not endorse any analysis or conclusions based on use of its data. Data represent U.S. life insurers and fraternal benefit societies.
18 American Council of Life Insurers
Table 2.7quality of Mortgages Held by life insurers (millions)
2003 2012 2013
Percent Percent Percent Amount distribution Amount distribution Amount distribution
Farm In good standing $13,618 96.8 $18,085 99.9 $18,071 99.8 Restructured 271 1.9 17 0.1 28 0.2 Overdue 56 0.4 4 0.0 7 0.0 Foreclosed 116 0.8 2 0.0 5 0.0
Total 14,061 100.0 18,108 100.0 18,110 100.0
Residential In good standing 4,737 98.0 4,587 98.6 5,784 97.5 Restructured 0 0.0 6 0.1 50 0.8 Overdue 48 1.0 26 0.6 63 1.1
Foreclosed 48 1.0 31 0.7 33 0.6Total 4,833 100.0 4,650 100.0 5,930 100.0
Commercial In good standing 248,555 99.4 329,609 99.5 347,837 99.5 Restructured 1,128 0.5 1,234 0.4 1,630 0.5 Overdue 165 0.1 265 0.1 107 0.0 Foreclosed 245 0.1 189 0.1 101 0.0
Total 250,093 100.0 331,296 100.0 349,676 100.0
All categories In good standing 266,909 99.2 352,280 99.5 371,693 99.5 Restructured 1,399 0.5 1,257 0.4 1,707 0.5 Overdue 269 0.1 295 0.1 177 0.0 Foreclosed 409 0.2 222 0.1 139 0.0
Aggregate total 268,986 100.0 354,053 100.0 373,716 100.0
Source: ACLI tabulations of National Association of Insurance Commissioners (NAIC) data, used by permission.Notes: NAIC does not endorse any analysis or conclusions based on use of its data. Data represent U.S. life insurers and, as of 2003, fraternal benefit societies.

19Assets
Table 2.8general account Mortgages for life insurers, by type and loan-to-Value ratios, 2013 (millions)
Loan-to-value ratio Farm Non-Farm Total
Above 95% $29 $6,935 $6,96591–95% 15 1,579 1,59481–90% 58 6,563 6,62171–80% 316 33,252 33,568Below 71% 17,429 297,185 314,614Total 17,847 345,514 363,361
Source: ACLI tabulations of National Association of Insurance Commissioners (NAIC) data, used by permission.Notes: NAIC does not endorse any analysis or conclusions based on use of its data. Data represent U.S. life insurers and fraternal benefit societies.
Table 2.9real Estate owned by life insurers, by type
Millions Average annual percent change
2003 2012 2013 2003/2013 2012/2013
Investment property Held for income $20,668 $24,244 $24,608 1.8 1.5 Held for sale 3,953 651 1,041 -12.5 60.0
Total 24,621 24,895 25,650 0.4 3.0
Occupied by company 6,052 5,664 5,635 -0.7 -0.5
Aggregate total 30,673 30,559 31,285 0.2 2.4
Source: ACLI tabulations of National Association of Insurance Commissioners (NAIC) data, used by permission.Notes: NAIC does not endorse any analysis or conclusions based on use of its data. Data represent U.S. life insurers and, as of 2003, fraternal benefit societies.
20 American Council of Life Insurers
Table 2.10Foreign-controlled assets of u.s. life insurers, by country and year (millions)
2009 2010 2011 2012 2013
Barbados $677 $793 $871 $1,100 $1,176
Bermuda 3,091 3,342 13,181 18,749 89,007
Canada 332,007 366,100 362,766 374,740 344,441
Cayman Islands 2,695 2,308 2,254 2,095 1,822
France 148,399 156,658 153,689 161,007 166,256
Germany 86,111 95,851 102,890 108,643 119,998
Italy 913 987 1,033 1,109 -
Japan 593 616 663 6,181 7,022
Netherlands 358,719 373,199 362,272 372,216 393,149
South Africa 9 4 4 4 4
Spain 193 75 74 - -
Sweden 1 1 1 - -
Switzerland 54,451 53,206 52,202 37,791 39,600
United Kingdom 144,529 165,583 160,654 198,523 174,609
Total 1,132,388 1,218,723 1,212,553 1,282,158 1,337,085
Percentage of industry assets 22.8% 22.9% 22.1% 22.2% 21.7%
Source: ACLI tabulations of National Association of Insurance Commissioners (NAIC) data, used by permission.Notes: NAIC does not endorse any analysis or conclusions based on use of its data. Companies are defined as foreign controlled if more than 50 percent of stock is owned by a foreign entity or entities. Data for previous years revised.

21Assets
Table 2.11asset distribution of life insurers, by year (millions)
Real Policy Miscellaneous Year Bonds Stocks Mortgages estate loans assets Total
1917 $2,537 $83 $2,021 $179 $810 $311 $5,9411920 3,298 75 2,442 172 859 474 7,3201925 4,333 81 4,808 266 1,446 604 11,5381930 6,431 519 7,598 548 2,807 977 18,8801935 10,041 583 5,357 1,990 3,540 1,705 23,2161940 17,092 605 5,972 2,065 3,091 1,977 30,8021945 32,605 999 6,636 857 1,962 1,738 44,7971950 39,366 2,103 16,102 1,445 2,413 2,591 64,0201955 47,741 3,633 29,445 2,581 3,290 3,742 90,4321960 58,555 4,981 41,771 3,765 5,231 5,273 119,5761965 70,152 9,126 60,013 4,681 7,678 7,234 158,8841970 84,166 15,420 74,375 6,320 16,064 10,909 207,2541975 121,014 28,061 89,167 9,621 24,467 16,974 289,3041980 212,618 47,366 131,080 15,033 41,411 31,702 479,2101981 233,308 47,670 137,747 18,278 48,706 40,094 525,8031982 268,288 55,730 141,989 20,624 52,961 48,571 588,1631983 308,738 64,868 150,999 22,234 54,063 54,046 654,9481984 358,897 63,335 156,699 25,767 54,505 63,776 722,9791985 421,446 77,496 171,797 28,822 54,369 71,971 825,9011986 486,583 90,864 193,842 31,615 54,055 80,592 937,5511987 557,110 96,515 213,450 34,172 53,626 89,586 1,044,4591988 640,094 104,373 232,863 37,371 54,236* 97,933 1,166,8701989 716,204 125,614 254,215 39,908 57,439 106,376 1,299,7561990 793,443 128,484 270,109 43,367 62,603 110,202 1,408,2081991 893,005 164,515 265,258 46,711 66,364 115,348 1,551,2011992 990,315 192,403 246,702 50,595 72,058 112,458 1,664,5311993 1,113,853 251,885 229,061 54,249 77,725 112,354 1,839,1271994 1,186,139 281,816 215,332 53,813 85,499 119,674 1,942,2731995 1,278,416 371,867 211,815 52,437 95,939 133,070 2,143,5441996 1,348,425 477,505 207,779 49,484 100,460 139,894 2,323,5471997 1,451,289 598,358 209,898 46,076 104,549 168,908 2,579,0781998 1,518,998 757,958 216,336 41,313 104,507 187,410 2,826,5221999 1,551,618 989,762 229,797 38,186 98,757 162,533 3,070,6532000 1,605,178 997,329 236,701 36,059 101,978 204,491 3,181,7362001 1,731,792 909,026 243,596 32,368 104,273 247,966 3,269,0192002 1,955,548 791,429 250,531 32,848 105,229 244,414 3,380,0002003 ‡ 2,181,555 1,022,188 268,986 30,673 107,007 276,291 3,886,6992004 ‡ 2,347,322 1,179,858 282,534 31,005 108,658 303,470 4,252,8462005 ‡ 2,440,412 1,285,468 294,876 32,574 109,500 319,165 4,481,9952006 ‡ 2,461,479 1,530,892 313,741 33,096 112,914 370,701 4,822,8242007 ‡ 2,571,525 1,670,338 336,150 34,943 116,633 361,997 5,091,5862008 ‡ 2,429,173 1,135,797 352,676 32,497 122,485 575,518 4,648,1472009 ‡ 2,581,575 1,385,923 336,316 27,714 123,283 503,884 4,958,693 2010 ‡ 2,744,758 1,570,225 326,988 27,851 126,821 514,561 5,311,204 2011 ‡ 2,877,492 1,546,085 342,831 28,909 129,333 568,008 5,492,6582012 ‡ 2,935,705 1,725,259 354,053 30,559 130,715 601,129 5,777,4202013 ‡ 3,000,116 2,003,944 373,716 31,285 131,672 609,567 6,150,300
Source: ACLI tabulations of National Association of Insurance Commissioners (NAIC) data, used by permission.Notes: NAIC does not endorse any analysis or conclusions based on use of its data. Beginning with 1962, data include assets in separate accounts. Data represent U.S. life insurers and, as of 2003, fraternal benefit societies.*Excludes an estimated $600 million of securitized policy loans.‡Includes fraternal benefit societies.

22 American Council of Life Insurers

The liabilities of U.S. life insurers primarily comprise
the reserves held by each insurer to back its obligations
to policyholders and their beneficiaries. Of the many
different kinds of reserves, policy and asset fluctuation
reserves are the most important. Liabilities also include
small amounts of other funds and obligations.
Based on standard accounting principles applied to all
businesses, total liabilities plus the company’s net value
must equal its total assets. Net value is a company’s surplus
plus its capital stock and is available to support policyholder
claims if necessary.
Policy ReseRves
Policy reserves concern an insurer’s obligation to its
customers arising from its product in force. State law
requires each company to maintain its policy reserves at
a level that will assure payment of all policy obligations
as they fall due. That level is calculated on an actuarial
basis, taking into account funds from future premium
payments, assumed future interest earnings, and
expected mortality experience. At the end of 2013, policy
reserves of U.S. life insurers totaled $4.8 trillion, seven
percent higher than 2012 (Table 3.1).
Policy reserves are held and identified for each type of
business conducted by a life insurer:
n Life insurance policies
n Annuities and supplementary contracts
n Health insurance policies
The composition of life insurer policy reserves has
changed over the years, reflecting a shift in the basic
types of business undertaken. Annuity contract reserves
now account for a larger proportion of total policy
reserves, while reserves set aside for life insurance
policies have a lesser share.
In 2013, reserves for life insurance comprised 29 percent
of total policy reserves, at $1.4 trillion (Figure 3.2, Table
3.2). This proportion has shrunk from 1980, when life
insurance products commanded 51 percent of total
reserves (Table 3.6). In 2013, these reserves consisted
of $1.2 trillion for individual life policies, $167 billion
for group policies, and less than $1 billion for credit life
policies (Table 3.2).
By contrast, reserves for annuities and supplementary
contracts climbed to nearly two-thirds of total reserves
in 2013 (66%), or $3.1 trillion, from 44 percent in 1980.
Much of the increase reflects the strong growth in
retirement plans administered by life insurers.
In 2013, annuity reserves consisted of $2.1 trillion for
individual annuities, up ten percent from 2012, and $1.0
trillion for group annuities, up about seven percent.
General account annuity reserves increased by three
percent while separate account reserves increased by
fourteen percent (Table 3.2). Group annuity reserves had
fallen significantly in 2001, primarily due to accounting
codification rather than actual fluctuation. In 2000,
liabilities for guaranteed interest contracts (GICs) and
premium and other deposit funds had been reported
as annuity reserves; however, as of 2001 these amounts
were counted as liabilities for deposit-type contracts.
Since most GICs and other deposit-type funds are
under group contracts, this accounting change has had
a substantial effect on group annuity reserves.
3 liABiliTies

24 American Council of Life Insurers
Reserves held under supplementary contracts with life
contingencies in 2013 totaled $20 billion, and for health
insurance policies, $228 billion.
DePosiT-TyPe conTRAcTs
Contracts issued by life insurers that do not incorporate
mortality or morbidity risks are known as deposit-type
contracts. Benefit payments under these contracts are not
contingent upon death or disability as they are in life and
disability insurance contracts, or upon continued survival
as they are in annuity contracts. Categories of deposit-
type contracts, as defined by the National Association
of Insurance Commissioners (NAIC), include GICs,
supplementary contracts without life contingencies,
annuities certain, premium and other deposit funds,
dividend and coupon accumulations, lottery payouts,
and structured settlements.
Under codified statutory accounting practices
implemented in 2001, cash inflows and outflows on
deposit-type contracts are no longer reported as income
and expenditure. Instead, they are recorded directly as
increasing or decreasing reserves. During 2013, $142
billion was deposited to these contracts and $153 billion
was withdrawn, with a total reserve of $450 billion at
year’s end (Table 3.3).
In 2013, premium and other deposit funds remained the
largest category of the deposit-type business with $68
billion in deposits, $74 billion in payments, and $199
billion in reserve at year-end. GICs received $53 billion
from policyholders and paid out $56 billion in 2013,
leaving a reserve of $144 billion at year’s end.
AsseT FlucTuATion ReseRves
Besides policy reserves, insurers are required to establish
two statutory reserves to absorb gains and losses in their
invested assets.
The asset valuation reserve (AVR) absorbs both realized
and unrealized, credit-related capital gains and losses.
The AVR consists of a default component, which provides
for credit-related losses on fixed-income assets, and an
equity component, which provides for all types of equity
investments.
The interest maintenance reserve (IMR) captures all
realized, interest-related capital gains and losses on
fixed-income assets. The IMR amortizes these gains
and losses into income over the remaining life of the
investments sold.
In 2013, the industry’s total AVR increased 7 percent
to $48 billion, and its IMR increased 1 percent to $27
billion (Table 3.1).
oTheR liABiliTies
In addition to reserves, other liability funds of U.S.
life insurers at the end of 2013 included $43 billion in
policy and contract claims; $18 billion set aside for the
following year’s dividend payments to policyholders;
and $404 billion for liabilities not directly allocable to
policyholders—incurred expenses, mandatory reserves
for fluctuations in security values, and insurance
premiums paid in advance, for example (Table 3.1).
suRPlus FunDs AnD cAPiTAl sTock
Surplus and capital amounted to $348 billion for U.S. life
insurers at the end of 2013 (Table 3.1). Surplus funds
provide extra reserve safeguards for such contingencies
as an unexpected rise in death rates among policyholders,
unusual changes in the value of securities, and general
protection for policy obligations. Several factors influence
the amount of surplus that a life insurer retains, including
company size, kinds of insurance written, mortality
experience, general business conditions, and government
regulation. Capital refers to the total par value of shares
of the companies’ capital stock.
cAPiTAl RATios
One measure of the adequacy of a life insurer’s surplus is
its capital ratio: surplus funds plus capital stock plus AVR
as a percentage of general account assets. Theoretically,
the higher the capital ratio, the better a company is able to
withstand adverse investment and mortality experience.
However, the type of company and the distribution of
its book of business can make comparisons among
companies and with an industry wide average much less
meaningful. In 2013, the aggregate capital ratio of U.S.
life insurers was 10.4 percent (Table 3.4).

25Liabilities
Life insurance regulators created the risk-based capital
(RBC) ratio to monitor life insurance company solvency.
Risk-based capital, calculated according to an NAIC
model law, is considered the minimum amount of capital
an insurer needs to avoid triggering regulatory action.
The RBC ratio is total adjusted capital divided by risk-
based capital, for a threshold ratio of 100 percent. The
ratio provides a means for evaluating the adequacy of
an insurer’s capital relative to the risks inherent in the
insurer’s operations.
From 1993 when life insurers began reporting risk-based
capital, the average RBC ratio rose steadily to a plateau
of 290 percent in 1997, which remained unbroken
until 2001. That year, the ratio jumped to 346 percent,
mainly due to two changes enacted by NAIC: accounting
codification and an adjusted RBC formula that reflects
changed risks for assets. In 2013, the ratio increased to
481 percent. (Table 3.5).
Most companies have an RBC ratio well above the regulatory
minimum level of 100 percent. By year-end 2013, 780
companies, or 94 percent of life insurers, had a ratio of 200
percent or more. These companies carried 99 percent of
the industry’s total assets.
Table 3.1liabilities and surplus Funds of life insurers
General account (millions) Average annual percent change
2003 2012 2013 2003/2013 2012/2013
ReservesPolicy reserves1 $1,863,929 $2,609,151 $2,683,610 3.7 2.9Other reserves Liabilities for deposit-type contracts2 296,269 280,313 274,573 -0.8 -2.0 Asset valuation reserve (AVR) 29,187 45,411 48,365 5.2 6.5 Policy and contract claims 37,202 43,281 43,425 1.6 0.3 Funds set aside for policyholder dividends 18,825 17,150 17,603 -0.7 2.6 Interest maintenance reserve (IMR) 14,653 26,087 26,815 6.2 2.8 Miscellaneous reserves3 10,433 29,738 32,792 12.1 10.3
Total other reserves 406,568 441,979 443,573 0.9 0.4
Total reserves 2,270,497 3,051,130 3,127,183 3.3 2.5
Non-reserve liabilities 203,083 318,627 327,364 4.9 2.7Total liabilities 2,473,580 3,369,757 3,454,547 3.4 2.5
Capital and surplus 228,400 337,881 345,839 4.2 2.4Total liabilities and surplus funds 2,710,027 3,707,639 3,800,386 3.4 2.5
Separate account (millions) Average annual percent change
2003 2012 2013 2003/2013 2012/2013
ReservesPolicy reserves1 $1,031,074 $1,840,282 $2,096,125 7.4 13.9Other reserves Liabilities for deposit-type contracts2 114,285 150,218 175,875 4.4 17.1 Interest maintenance reserve (IMR) 237 252 -306 NC NCTotal other reserves 114,522 150,469 175,569 4.4 16.7
Total reserves 1,145,596 1,990,752 2,271,694 7.1 14.1
Non-reserve liabilities 37,693 76,470 76,191 7.3 -0.4Total liabilities 1,183,289 2,067,221 2,347,885 7.1 13.6
Surplus 2,921 2,560 2,028 -3.6 -20.8Total liabilities and surplus funds 1,178,163 2,069,782 2,349,913 7.1 13.5
continued

26 American Council of Life Insurers
Table 3.1liabilities and surplus Funds of life insurers—continued
Combined account (millions) Average annual percent change
2003 2012 2013 2003/2013 2012/2013
ReservesPolicy reserves1 $2,895,003 $4,449,433 $4,779,735 5.1 7.4Other reserves Liabilities for deposit-type contracts2 410,554 430,531 450,448 0.9 4.6 Asset valuation reserve (AVR) 29,187 45,411 48,365 5.2 6.5 Policy and contract claims 37,202 43,281 43,425 1.6 0.3 Funds set aside for policyholder dividends 18,825 17,150 17,603 -0.7 2.6 Interest maintenance reserve (IMR) 14,890 26,339 26,509 5.9 0.6 Miscellaneous reserves3 10,433 29,738 32,792 12.1 10.3
Total other reserves 521,090 592,449 619,142 1.7 4.5
Total reserves 3,416,093 5,041,882 5,398,877 4.7 7.1
Non-reserve liabilities 240,776 395,097 403,555 5.3 2.1Total liabilities 3,656,869 5,436,979 5,802,432 4.7 6.7
Capital and surplus 231,321 340,442 347,868 4.2 2.2Total liabilities and surplus funds 3,888,190 5,777,420 6,150,300 4.7 6.5
Source: ACLI tabulations of National Association of Insurance Commissioners (NAIC) data, used by permission.Notes: NAIC does not endorse any analysis or conclusions based on use of its data. Codification effective with 2001 Annual Statement filings changed the reporting of certain lines of business, particularly deposit-type contracts, as explained in numbered footnotes. Data represent U.S. life insurers and, as of 2003, fraternal benefit societies.NC: Not calculated1Beginning in 2001, excludes reserves for guaranteed interest contracts (GICs).2Prior to 2001, included supplementary contracts without life contingencies and policyholder dividend accumulations; beginning in 2001, also includes liabilities for GICs, and premium and other deposits.3Includes insurance premiums paid in advance. The amount previously was included in non-reserve liabilities.
OtherAnnuity
Life
20132011200920072005200320011999199719951993
Source: ACLI tabulations of National Association of Insurance Commissioners (NAIC) data, used by permission. Notes: NAIC does not endorse any analysis or conclusions based on use of its data. Data represent U.S. life insurers and, as of 2003, fraternal benefit societies.
Growth of Life Insurers' Policy ReservesFigure 3.1
1,0001,500
2,500
3,500
500
2,000
3,000
4,0004,5005,0006,000
$Bill
ions

27Liabilities
Table 3.2Policy Reserves of life insurers, by line of Business
General account (millions) Average annual percent change
2003 2012 2013 2003/2013 2012/2013
Life insurance Individual $715,320 $997,641 $1,026,261 3.7 2.9
Group 41,606 60,034 60,251 3.8 0.4
Credit 2,200 637 620 -11.9 -2.6
Total 759,126 1,058,311 1,087,132 3.7 2.7
Annuities1
Individual 678,498 984,719 1,014,017 4.1 3.0 Group 289,691 323,713 339,058 1.6 4.7
Supplementary contracts with life contingencies 14,575 18,284 19,286 2.8 5.5
Total 982,764 1,326,716 1,372,360 3.4 3.4Health insurance Individual 84,855 166,726 164,857 6.9 -1.1 Group 34,843 56,318 58,227 5.3 3.4
Credit 2,342 1,079 1,034 -7.8 -4.2
Total 122,039 224,123 224,118 6.3 0.0
Aggregate total 1,863,929 2,609,151 2,683,610 3.7 2.9
Separate account (millions) Average annual percent change
2003 2012 2013 2003/2013 2012/2013
Life insurance
Individual $112,572 $150,735 $171,467 4.3 13.8
Group 49,443 93,000 106,436 8.0 14.4
Total 162,015 243,735 277,903 5.5 14.0
Annuities1 Individual 494,125 957,811 1,123,369 8.6 17.3
Group 372,783 634,382 689,686 6.3 8.7
Supplementary contracts with life contingencies 740 955 1,058 3.6 10.8
Total 867,648 1,593,148 1,814,113 7.7 13.9
Health insurance
Individual 43 - - NC NC
Group 1,369 3,399 4,109 11.6 20.9
Total 1,411 3,399 4,109 11.3 20.9
Aggregate total 1,031,074 1,840,282 2,096,125 7.4 13.9
continued

28 American Council of Life Insurers
Figure 3.2Distribution of life insurers’ Policy Reserves, 2013
Source: ACLI tabulations of National Association of Insurance Commissioners (NAIC) data, used by permission. Notes: NAIC does not endorse any analysis or conclusions based on use of its data. Data represent U.S. life insurers and fraternal benefit societies.
Table 3.2Policy Reserves of life insurers, by line of Business—continued
Combined account (millions) Average annual percent change
2003 2012 2013 2003/2013 2012/2013
Life insurance
Individual $827,892 $1,148,376 $1,197,727 3.8 4.3
Group 91,049 153,034 166,687 6.2 8.9
Credit 2,200 637 620 -11.9 -2.6
Total 921,142 1,302,046 1,365,035 4.0 4.8
Annuities1
Individual 1,172,623 1,942,530 2,137,385 6.2 10.0
Group 662,474 958,095 1,028,743 4.5 7.4
Supplementary contracts
with life contingencies 15,315 19,239 20,344 2.9 5.7
Total 1,850,411 2,919,865 3,186,473 5.6 9.1
Health insurance
Individual 84,898 166,726 164,857 6.9 -1.1
Group 36,211 59,716 62,337 5.6 4.4
Credit 2,342 1,079 1,034 -7.8 -4.2
Total 123,451 227,521 228,227 6.3 0.3
Aggregate total 2,895,003 4,449,433 4,779,735 5.1 7.4
Source: ACLI tabulations of National Association of Insurance Commissioners (NAIC) data, used by permission.Notes: NAIC does not endorse any analysis or conclusions based on use of its data. Codification effective with 2001 Annual Statement filings changed the reporting of certain lines of business, particularly deposit-type contracts, as explained in numbered footnotes. Data represent U.S. life insurers and, as of 2003, fraternal benefit socieites.NC: Not calculated1As of 2001, excludes reserves for guaranteed interest contracts (GICs). Figures for GICs are presented in Table 3.3.
Annuities66%
Health Insurance5%
Life Insurance29%
Supplementary Contracts0.43%
Source: ACLI tabulations of National Association of Insurance Commissioners (NAIC) data, used by permission. Notes: NAIC does not endorse any analysis or conclusions based on use of its data. Data represent U.S. life insurers and, as of 2003, fraternal benefit societies.
Distribution of Life Insurers’ Policy Reserves, 2013Figure 3.2

29Liabilities
Table 3.3Deposit-Type contracts, 2013 (millions)
Deposits Withdrawals Reserves
General account Guaranteed interest contracts (GICs) $40,644 $45,803 $67,933
Annuities certain 4,555 5,981 41,272
Supplementary contracts without life contingencies 15,001 15,369 42,842
Dividend accumulations or refunds 872 1,920 22,165
Premium and other deposit funds 53,487 57,899 100,361
Total 114,559 126,972 274,573
Separate account Guaranteed interest contracts (GICs) 12,383 10,488 76,543
Annuities certain 16 85 790
Supplementary contracts without life contingencies 19 40 127
Dividend accumulations or refunds
Premium and other deposit funds 14,885 15,689 98,416
Total 27,304 26,302 175,875
Combined account Guaranteed interest contracts (GICs) 53,027 56,291 144,476
Annuities certain 4,571 6,066 42,062
Supplementary contracts without life contingencies 15,020 15,409 42,969
Dividend accumulations or refunds 872 1,920 22,165
Premium and other deposit funds 68,372 73,588 198,776
Total 141,862 153,274 450,448
Source: ACLI tabulations of National Association of Insurance Commissioners (NAIC) data, used by permission.Notes: NAIC does not endorse any analysis or conclusions based on use of its data. Data represent U.S. life insurers and fraternal benefit societies.
Table 3.4capital Ratios of life insurers (percent)
2003 2012 2013
Including AVR 9.6 10.4 10.4
Excluding AVR 8.5 9.2 9.2
Source: ACLI tabulations of National Association of Insurance Commissioners (NAIC) data, used by permission.Notes: NAIC does not endorse any analysis or conclusions based on use of its data. Capital ratio is equal to capital plus surplus plus the asset valuation reserve (AVR) divided by general account assets. Data represent U.S. life insurers and, as of 2003, fraternal benefit societies.

30 American Council of Life Insurers
Table 3.5levels of Risk-Based capital held by life insurers, 2003–2013
Number of companies
Risk-based capital ratio 2003 2004 2005 2006 2007 2008 2009 2010 2011 2012 2013
200 percent or more 1,051 1,026 997 948 892 830 812 803 794 776 780 175–199 30 18 19 19 23 31 29 20 19 22 17 150–174 24 21 16 22 11 17 20 26 23 15 12 125–149 30 25 15 21 13 19 15 13 11 17 7 100–124 18 13 10 5 5 8 10 10 9 6 5 Less than 100 percent 22 16 14 14 16 36 19 11 10 8 7
Total 1,175 1,119 1,071 1,029 960 941 905 883 866 844 828Average risk-based capital ratio 357% 390% 409% 411% 406% 382% 418% 450% 457% 466% 481%
Percentage of companies (percent)
Risk-based capital ratio 2003 2004 2005 2006 2007 2008 2009 2010 2011 2012 2013
200 percent or more 89.4 91.7 93.1 92.1 92.9 88.2 89.7 90.9 91.7 91.9 94.2 175–199 2.6 1.6 1.8 1.8 2.4 3.3 3.2 2.3 2.2 2.6 2.1 150–174 2.0 1.9 1.5 2.1 1.1 1.8 2.2 2.9 2.7 1.8 1.4 125–149 2.6 2.2 1.4 2.0 1.4 2.0 1.7 1.5 1.3 2.0 0.8 100–124 1.5 1.2 0.9 0.5 0.5 0.9 1.1 1.1 1.0 0.7 0.6 Less than 100 percent 1.9 1.4 1.3 1.4 1.7 3.8 2.1 1.2 1.2 0.9 0.8Total 100.0 100.0 100.0 100.0 100.0 100.0 100.0 100.0 100.0 100.0 100.0
Distribution of total assets (percent)
Risk-based capital ratio 2003 2004 2005 2006 2007 2008 2009 2010 2011 2012 2013
200 percent or more 98.3 98.4 98.8 99.0 99.4 97.0 98.7 99.0 98.9 99.2 99.5 175–199 0.4 0.1 0.5 0.2 0.2 2.2 0.2 0.2 0.3 0.3 0.1 150–174 0.4 0.5 0.4 0.3 0.0 0.5 0.5 0.6 0.7 0.2 0.3 125–149 0.3 0.9 0.2 0.4 0.4 0.1 0.5 0.1 0.0 0.1 0.1 100–124 0.4 0.0 0.0 0.0 0.0 0.0 0.0 0.0 0.1 0.1 0.0 Less than 100 percent 0.3 0.1 0.1 0.0 0.0 0.2 0.1 0.1 0.0 0.0 0.0Total 100.0 100.0 100.0 100.0 100.0 100.0 100.0 100.0 100.0 100.0 100.0
Source: ACLI tabulations of National Association of Insurance Commissioners (NAIC) data, used by permission.Notes: NAIC does not endorse any analysis or conclusions based on use of its data. Risk-based capital ratio is total adjusted capital divided by total risk-based capital. Data represent U.S. life insurers and, as of 2003, fraternal benefit societies.

31Liabilities
Table 3.6life insurers Policy Reserves, by line of Business and year (millions)
Year Amount Year Amount Year Amount Year Amount
1890 $670 1910 $3,226 1925 $9,927 1940 $27,2381900 1,443 1915 4,399 1930 16,231 1945 38,6671905 2,295 1920 6,338 1935 20,404 1950 54,946
Life Health Annuities1 SupplementaryYear insurance insurance Individual Group contracts2 Total
1955 $54,588 $575 * $13,216 $6,980 $75,3591960 70,791 865 $4,327 14,952 7,538 98,4731965 90,795 1,432 5,028 22,187 8,178 127,6201970 115,442 3,474 6,951 34,009 7,903 167,7791975 150,063 6,293 12,442 59,907 8,411 237,1161980 197,865 11,015 31,543 140,417 9,499 390,3391981 206,986 11,931 38,800 160,992 9,322 428,0311982 213,783 13,181 51,002 191,898 9,496 479,3601983 220,968 14,956 64,661 221,724 10,132 532,4411984 225,904 16,552 76,983 254,592 10,162 584,1931985 235,854 18,805 96,969 303,021 10,653 665,3021986 252,035 21,294 121,146 355,756 11,693 761,9241987 276,404 23,994 156,135 392,540 13,060 862,1331988 299,901 26,852 193,820 433,889 14,501 968,9631989 324,178 29,855 239,593 473,934 16,118 1,083,6781990 348,774 33,448 282,129 515,794 16,822 1,196,9671991 372,082 38,225 328,325 548,191 17,955 1,304,7781992 402,413 45,159 380,677 559,774 19,068 1,407,0911993 436,293 51,386 439,390 601,836 20,898 1,549,8031994 468,469 58,019 482,172 612,394 22,989 1,644,0431995 511,021 63,233 594,147 618,666 25,258 1,812,3251996 556,133 69,567 622,012 690,482 27,596 1,965,7901997 606,260 74,902 693,011 761,951 28,435 2,164,5591998 655,983 82,020 763,329 845,164 30,952 2,377,4491999 705,226 91,662 873,519 907,181 32,338 2,609,9262000 741,603 95,704 880,874 960,128 33,542 2,711,8512001 815,544 100,706 944,961 571,451 13,309 2,445,9722002 832,927 110,768 980,065 569,856 13,699 2,507,3142003‡ 921,142 123,451 1,172,623 662,474 15,315 2,895,0032004‡ 987,568 133,641 1,311,552 712,149 15,587 3,160,4972005‡ 1,029,486 140,895 1,415,104 758,484 15,847 3,359,8152006‡ 1,109,868 153,104 1,521,074 806,944 16,753 3,607,7432007‡ 1,148,256 166,148 1,615,276 843,146 17,819 3,790,6452008‡ 1,134,470 186,105 1,421,597 715,587 13,107 3,470,8672009‡ 1,178,290 196,131 1,623,764 797,989 16,077 3,812,2512010‡ 1,223,899 213,896 1,779,931 863,100 16,761 4,097,5872011‡ 1,285,684 229,459 1,840,174 871,126 18,008 4,244,4512012‡ 1,302,046 227,521 1,942,530 958,095 19,239 4,449,4332013‡ 1,365,035 228,227 2,137,385 1,028,743 20,344 4,779,735
Source: ACLI tabulations of National Association of Insurance Commissioners (NAIC) data, used by permission.Notes: NAIC does not endorse any analysis or conclusions based on use of its data. Before 1947, the business of health insurance departments of life insurers was not included in this series. Codification effective with 2001 Annual Statement filings changed the reporting of annuities. Data represent U.S. life insurers and, as of 2003, fraternal benefit societies.*Included with group annuities.‡Includes fraternal benefit societies.1Beginning in 2001, excludes reserves for guaranteed interest contracts (GICs). Figures for GICs are shown in Table 3.3.2Beginning in 2001, includes reserves for supplementary contracts with life contingencies; reserves for supplementary contracts without life contingencies are included in liabilities for deposit-type contracts in Table 3.3.

32 American Council of Life Insurers
Table 3.7life insurance Policy Reserves, by Type and year (millions)
Year Individual Group Credit Total
1956 $56,875 $787 -- $57,6621960 69,524 1,267 -- 70,7911965 88,784 2,011 -- 90,7951970 112,349 3,093 -- 115,4421975 144,368 4,995 $700 150,0631980 187,872 8,818 1,175 197,8651981 196,407 9,379 1,200 206,9861982 202,789 9,766 1,228 213,7831983 209,466 10,148 1,354 220,9681984 215,309 9,111 1,484 225,9041985 224,204 9,927 1,723 235,8541986 239,295 10,770 1,970 252,0351987 263,515 10,559 2,330 276,4041988 285,853 11,581 2,467 299,9011989 309,168 12,569 2,441 324,1781990 332,808 13,506 2,460 348,7741991 355,719 13,950 2,413 372,0821992 381,323 18,684 2,406 402,4131993 412,542 21,336 2,415 436,2931994 441,894 23,911 2,664 468,4691995 480,967 27,342 2,712 511,0211996 523,901 29,396 2,836 556,1331997 565,601 37,787 2,872 606,2601998 608,283 44,515 3,184 655,9831999 645,499 56,426 3,302 705,2262000 679,546 58,493 3,564 741,6032001 720,583 91,563 3,398 815,5442002 746,383 83,742 2,802 832,9272003‡ 827,892 91,049 2,200 921,1422004‡ 881,817 103,931 1,820 987,5682005‡ 923,429 104,463 1,594 1,029,4862006‡ 988,620 119,841 1,407 1,109,8682007‡ 1,011,179 135,733 1,343 1,148,2562008‡ 999,991 133,291 1,189 1,134,4702009‡ 1,043,493 133,828 969 1,178,2902010‡ 1,083,731 139,360 807 1,223,8992011‡ 1,141,356 143,661 667 1,285,6842012‡ 1,148,376 153,034 637 1,302,0462013‡ 1,197,727 166,687 620 1,365,035
Source: ACLI tabulations of National Association of Insurance Commissioners (NAIC) data, used by permission.Notes: NAIC does not endorse any analysis or conclusions based on use of its data. Credit life insurance is limited to insurance on loans of 10 years’ or less duration. Prior to 1973, all credit insurance was included in the individual and group categories. Data represent U.S. life insurers and, as of 2003, fraternal benefit societies.‡Includes fraternal benefit societies.
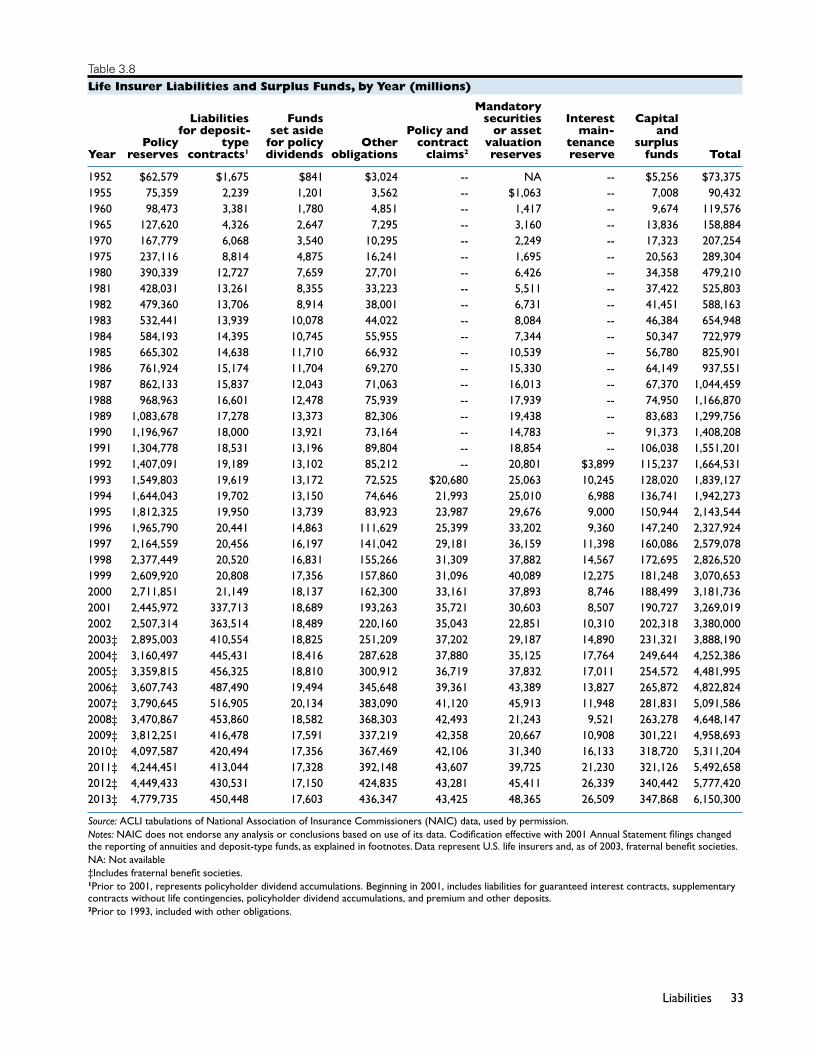
33Liabilities
Table 3.8life insurer liabilities and surplus Funds, by year (millions)
Mandatory Liabilities Funds securities Interest Capital for deposit- set aside Policy and or asset main- and Policy type for policy Other contract valuation tenance surplus Year reserves contracts1 dividends obligations claims2 reserves reserve funds Total
1952 $62,579 $1,675 $841 $3,024 -- NA -- $5,256 $73,3751955 75,359 2,239 1,201 3,562 -- $1,063 -- 7,008 90,4321960 98,473 3,381 1,780 4,851 -- 1,417 -- 9,674 119,5761965 127,620 4,326 2,647 7,295 -- 3,160 -- 13,836 158,8841970 167,779 6,068 3,540 10,295 -- 2,249 -- 17,323 207,2541975 237,116 8,814 4,875 16,241 -- 1,695 -- 20,563 289,3041980 390,339 12,727 7,659 27,701 -- 6,426 -- 34,358 479,2101981 428,031 13,261 8,355 33,223 -- 5,511 -- 37,422 525,8031982 479,360 13,706 8,914 38,001 -- 6,731 -- 41,451 588,1631983 532,441 13,939 10,078 44,022 -- 8,084 -- 46,384 654,9481984 584,193 14,395 10,745 55,955 -- 7,344 -- 50,347 722,9791985 665,302 14,638 11,710 66,932 -- 10,539 -- 56,780 825,9011986 761,924 15,174 11,704 69,270 -- 15,330 -- 64,149 937,5511987 862,133 15,837 12,043 71,063 -- 16,013 -- 67,370 1,044,4591988 968,963 16,601 12,478 75,939 -- 17,939 -- 74,950 1,166,8701989 1,083,678 17,278 13,373 82,306 -- 19,438 -- 83,683 1,299,7561990 1,196,967 18,000 13,921 73,164 -- 14,783 -- 91,373 1,408,2081991 1,304,778 18,531 13,196 89,804 -- 18,854 -- 106,038 1,551,2011992 1,407,091 19,189 13,102 85,212 -- 20,801 $3,899 115,237 1,664,5311993 1,549,803 19,619 13,172 72,525 $20,680 25,063 10,245 128,020 1,839,1271994 1,644,043 19,702 13,150 74,646 21,993 25,010 6,988 136,741 1,942,2731995 1,812,325 19,950 13,739 83,923 23,987 29,676 9,000 150,944 2,143,5441996 1,965,790 20,441 14,863 111,629 25,399 33,202 9,360 147,240 2,327,9241997 2,164,559 20,456 16,197 141,042 29,181 36,159 11,398 160,086 2,579,0781998 2,377,449 20,520 16,831 155,266 31,309 37,882 14,567 172,695 2,826,5201999 2,609,920 20,808 17,356 157,860 31,096 40,089 12,275 181,248 3,070,6532000 2,711,851 21,149 18,137 162,300 33,161 37,893 8,746 188,499 3,181,7362001 2,445,972 337,713 18,689 193,263 35,721 30,603 8,507 190,727 3,269,0192002 2,507,314 363,514 18,489 220,160 35,043 22,851 10,310 202,318 3,380,0002003‡ 2,895,003 410,554 18,825 251,209 37,202 29,187 14,890 231,321 3,888,1902004‡ 3,160,497 445,431 18,416 287,628 37,880 35,125 17,764 249,644 4,252,3862005‡ 3,359,815 456,325 18,810 300,912 36,719 37,832 17,011 254,572 4,481,9952006‡ 3,607,743 487,490 19,494 345,648 39,361 43,389 13,827 265,872 4,822,8242007‡ 3,790,645 516,905 20,134 383,090 41,120 45,913 11,948 281,831 5,091,5862008‡ 3,470,867 453,860 18,582 368,303 42,493 21,243 9,521 263,278 4,648,1472009‡ 3,812,251 416,478 17,591 337,219 42,358 20,667 10,908 301,221 4,958,6932010‡ 4,097,587 420,494 17,356 367,469 42,106 31,340 16,133 318,720 5,311,2042011‡ 4,244,451 413,044 17,328 392,148 43,607 39,725 21,230 321,126 5,492,6582012‡ 4,449,433 430,531 17,150 424,835 43,281 45,411 26,339 340,442 5,777,4202013‡ 4,779,735 450,448 17,603 436,347 43,425 48,365 26,509 347,868 6,150,300
Source: ACLI tabulations of National Association of Insurance Commissioners (NAIC) data, used by permission.Notes: NAIC does not endorse any analysis or conclusions based on use of its data. Codification effective with 2001 Annual Statement filings changed the reporting of annuities and deposit-type funds, as explained in footnotes. Data represent U.S. life insurers and, as of 2003, fraternal benefit societies.NA: Not available‡Includes fraternal benefit societies.1Prior to 2001, represents policyholder dividend accumulations. Beginning in 2001, includes liabilities for guaranteed interest contracts, supplementary contracts without life contingencies, policyholder dividend accumulations, and premium and other deposits.2Prior to 1993, included with other obligations.

34 American Council of Life Insurers
Table 3.9capital Ratios of life insurers, by year (percent)
Including Excluding Including Excluding Year MSVR/AVR MSVR/AVR Year MSVR/AVR MSVR/AVR
1970 9.7 8.6 2000 11.1 9.21975 8.1 7.4 2001 10.1 8.71980 9.2 7.7 2002 9.3 8.41985 9.1 7.7 2003‡ 9.6 8.51990 8.5 7.3 2004‡ 9.8 8.61991 9.3 7.9 2005‡ 9.7 8.51992 9.6 8.1 2006‡ 10.0 8.61993 10.0 8.4 2007‡ 10.3 8.91994 10.2 8.6 2008‡ 8.7 8.1 1995 10.7 9.0 2009‡ 9.7 9.11996 11.9 10.0 2010‡ 10.1 9.21997 10.6 8.7 2011‡ 9.9 8.81998 11.0 9.0 2012‡ 10.4 9.21999 11.1 9.1 2013‡ 10.4 9.2
Source: ACLI tabulations of National Association of Insurance Commissioners (NAIC) data, used by permission.Notes: NAIC does not endorse any analysis or conclusions based on use of its data. Capital ratio is equal to capital plus surplus plus the asset valuation reserve (AVR), or mandatory securities valuation reserve (MSVR) prior to 1992, divided by general account assets. Data represent U.S. life insurers and, as of 2003, fraternal benefit societies.‡Includes fraternal benefit societies.

4The gross income of life insurance companies comes
from two main sources: premiums paid by policyholders
and earnings on investments. In 2013, total income
of all U.S. life insurers decreased 4.8 percent to $907
billion (Table 4.1). Insurance premiums and annuity
considerations contributed 65 percent of total income.
Investment earnings contributed 26 percent. The
remainder of gross income came from amortization of
interest maintenance reserve, commissions and expense
allowance on reinsurance ceded, and miscellaneous
income.
Under statutory accounting rules, net gain from
(insurance) operations is calculated prior to net income.
Net gain from operations equals gross income minus
operating expenditures, policyholder dividends, and
federal income taxes. Capital gains, net of tax, are then
added to net gain from operations to calculate (after
tax) net income.
Premium income
Premium receipts—derived from sales of life insurance,
health insurance, and annuities—decreased 9.5 percent
to $593 billion in 2013 (Table 4.2).
The mix of premiums from life insurance and annuity
considerations has changed markedly over time. Prior to
1986, premium receipts from life policies were greater
than annuity considerations, but starting in 1986, annuity
premiums have exceeded life insurance premiums
(Table 4.10). By 2013, life policies accounted for just
over one-fifth of premium receipts (22%), while annuity
considerations contributed just under half (48%) (Figure
4.1).
Premiums for life insurance policies totaled $131 billion
in 2013, a 3.6 percent decrease from the previous year
(Table 4.2). Individual policy premiums accounted for
the largest share at $103 billion, or 79 percent. Most
were renewals, representing $72 billion, or 70 percent,
of individual premiums (Table 4.3). Group insurance
was the second-largest contributor to life insurance
premiums at $27 billion, or 20 percent of the total. Again,
renewals constituted the largest portion at $23 billion, or
87 percent, of all group premiums. Credit life provided
$720 million of all life insurance premiums (Table 4.2).
Americans spent 0.8 percent of total disposable (after-
tax) personal income on individual life insurance in
2013 (Table 4.5).
Annuity considerations decreased 17.4 percent in 2013
to $288 billion (Table 4.2). Individual annuities provided
$180 billion in premium receipts, decreasing 5.1 percent
from 2012. Of individual annuity considerations, first-year
annuity considerations constitute the largest share of
this category at $111 billion, while group considerations
counted renewals as the largest contributor with $66
billion (Table 4.4). Individual annuity considerations
amounted to 1.44 percent of disposable personal income
in 2013 (Table 4.5).
Premiums for accident and health insurance increased
1.6 percent to $175 billion in 2013 (Table 4.1) with group
premiums being the largest portion at $96 billion, up 3.1
percent from 2012 (Table 4.2). Individual accident and
health premiums decreased slightly to $78.8 billion, with
the largest share at $36 billion coming from guaranteed
renewable contracts (Table 4.6).
income

36 American Council of Life Insurers
investment income and rate of return
Net investment income of life insurance companies
amounted to $226 billion in 2013 (Table 4.7). The largest
source of investment income was from bonds at $141
billion, followed by common stock ($47 billion) and
mortgage loans ($20 billion). Gross investment income
increased 4.3 percent from 2012. Investment expenses,
taxes, and deductions totaling $12 billion were up 2.3
percent from the previous year.
As a way of tracking investment performance, life
insurers routinely calculate their net rate of return on
invested assets. The net rate of return on invested assets
is determined by dividing net investment income by the
two-year average of the net invested assets. The gross
rate of return on total fixed income assets is calculated
by dividing the gross investment income on bonds by
the average net investment in bonds.
In 2013, life insurers’ net rate of return on total assets
was 4.20 percent, down slightly from a year earlier
(Table 4.8). This net rate is an annual average based
on aggregates of all U.S. life insurance companies after
investment expenses, but before federal income taxes.
Excluding separate accounts, the portfolio net rate of
return on general account assets was 5.09 percent in
2013, up from 5.07 percent in 2012.
The gross rate of return on fixed-income assets measures
the return on bonds, preferred stocks, and mortgages.
It does not account for depreciation or investment
expenses and excludes equity investments (other than
preferred stocks), avoiding the uneven treatment of gains
in the numerator and denominator of net rate data.
Gross rate data apply to fixed-income assets of both
general and separate accounts. The industry’s gross rate
on total fixed-income assets was 4.91 percent in 2013
down from 5.30 percent in 2012.
net Gain from oPerations
Statutory accounting calculates net gain from (insurance)
operations as gross income minus operating expenses,
policyholder dividends, and federal income taxes (not
including tax on capital gains, since capital gains are
not included in gain from operations). Net gain from
operations after federal income taxes increased 17
percent in 2013 to $63 billion (Table 4.9). Net gains can
be calculated separately for each major line of business.
Net gains from annuities were $33 billion compared with
$28 billion in net gains a year ago. The net gain from life
insurance decreased 19 percent to $8 billion.
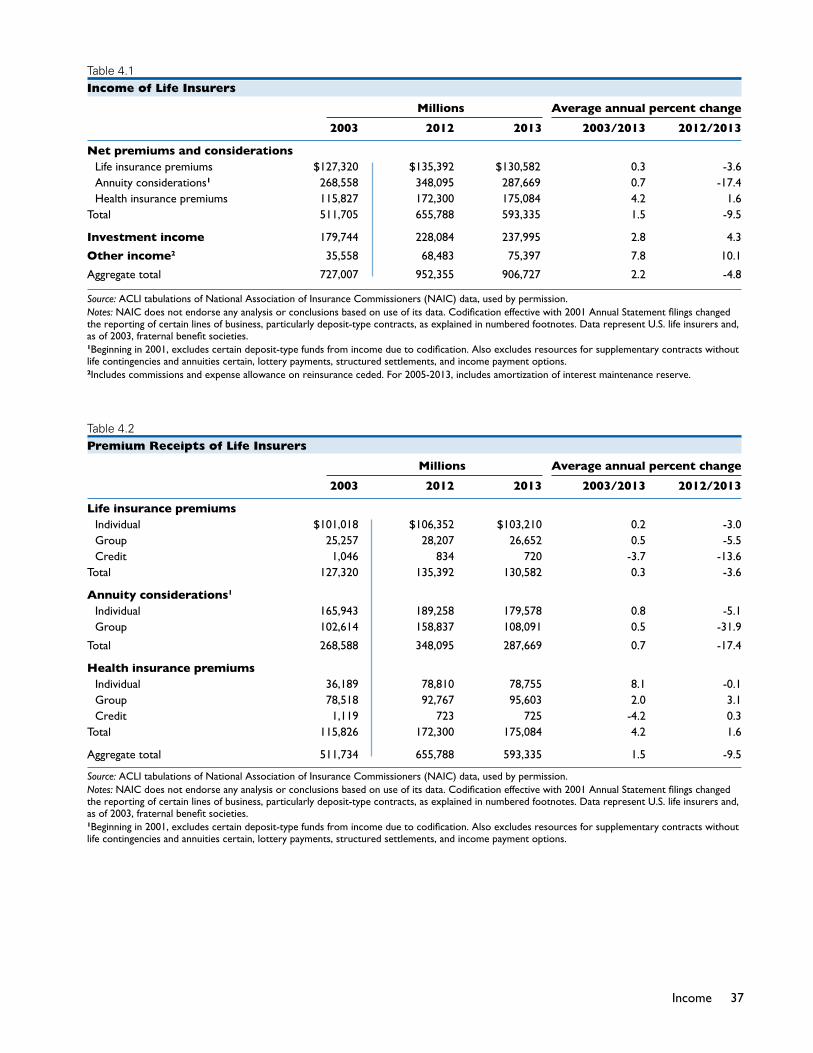
37Income
Table 4.1income of Life insurers
Millions Average annual percent change
2003 2012 2013 2003/2013 2012/2013
Net premiums and considerations Life insurance premiums $127,320 $135,392 $130,582 0.3 -3.6 Annuity considerations1 268,558 348,095 287,669 0.7 -17.4 Health insurance premiums 115,827 172,300 175,084 4.2 1.6Total 511,705 655,788 593,335 1.5 -9.5
Investment income 179,744 228,084 237,995 2.8 4.3
Other income2 35,558 68,483 75,397 7.8 10.1
Aggregate total 727,007 952,355 906,727 2.2 -4.8
Source: ACLI tabulations of National Association of Insurance Commissioners (NAIC) data, used by permission.Notes: NAIC does not endorse any analysis or conclusions based on use of its data. Codification effective with 2001 Annual Statement filings changed the reporting of certain lines of business, particularly deposit-type contracts, as explained in numbered footnotes. Data represent U.S. life insurers and, as of 2003, fraternal benefit societies.1Beginning in 2001, excludes certain deposit-type funds from income due to codification. Also excludes resources for supplementary contracts without life contingencies and annuities certain, lottery payments, structured settlements, and income payment options.2Includes commissions and expense allowance on reinsurance ceded. For 2005-2013, includes amortization of interest maintenance reserve.
Table 4.2Premium receipts of Life insurers
Millions Average annual percent change
2003 2012 2013 2003/2013 2012/2013
Life insurance premiums Individual $101,018 $106,352 $103,210 0.2 -3.0 Group 25,257 28,207 26,652 0.5 -5.5 Credit 1,046 834 720 -3.7 -13.6Total 127,320 135,392 130,582 0.3 -3.6
Annuity considerations1
Individual 165,943 189,258 179,578 0.8 -5.1 Group 102,614 158,837 108,091 0.5 -31.9
Total 268,588 348,095 287,669 0.7 -17.4
Health insurance premiums Individual 36,189 78,810 78,755 8.1 -0.1 Group 78,518 92,767 95,603 2.0 3.1 Credit 1,119 723 725 -4.2 0.3Total 115,826 172,300 175,084 4.2 1.6
Aggregate total 511,734 655,788 593,335 1.5 -9.5
Source: ACLI tabulations of National Association of Insurance Commissioners (NAIC) data, used by permission.Notes: NAIC does not endorse any analysis or conclusions based on use of its data. Codification effective with 2001 Annual Statement filings changed the reporting of certain lines of business, particularly deposit-type contracts, as explained in numbered footnotes. Data represent U.S. life insurers and, as of 2003, fraternal benefit societies.1Beginning in 2001, excludes certain deposit-type funds from income due to codification. Also excludes resources for supplementary contracts without life contingencies and annuities certain, lottery payments, structured settlements, and income payment options.

38 American Council of Life Insurers
Table 4.3individual and Group Life insurance net Premium receipts, 2013 (millions)
Percent Percent Percent Individual distribution Group distribution Total distribution
First-year $17,796 17.2 $1,265 4.7 $19,061 14.7 Single1 13,244 12.8 2,267 8.5 15,511 11.9Renewal 72,171 69.9 23,119 86.7 95,290 73.4
Aggregate total 103,210 100.0 26,652 100.0 129,862 100.0
Source: ACLI tabulations of National Association of Insurance Commissioners (NAIC) data, used by permission.Notes: NAIC does not endorse any analysis or conclusions based on use of its data. Codification effective with 2001 Annual Statement filings changed the reporting of certain lines of business, particularly deposit-type contracts. Data represent U.S. life insurers and fraternal benefit societies.1Includes dividend additions, excess premiums beyond planned periodic premiums, and single-premium riders.
Figure 4.1distribution of Life insurers’ net Premium receipts, 2013
Source: ACLI tabulations of National Association of Insurance Commissioners (NAIC) data, used by permission. Notes: NAIC does not endorse any analysis or conclusions based on use of its data. Data represent U.S. life insurers and fraternal benefit societies.Source: ACLI tabulations of National Association of Insurance Commissioners (NAIC) data, used by permission. Notes: NAIC does not endorse any analysis or conclusions based on use of its data. Data represent U.S. life insurers and fraternal benefit societies.
Annuity Considerations48%
Life Insurance Premiums22%
Health Insurance Premiums30%
Distribution of Life Insurers’ Net Premium Receipts, 2013Figure 4.1

39Income
Table 4.4individual and Group annuity considerations, 2013 (millions)
Percent Percent Percent Individual1 distribution Group1 distribution Total distribution
First-year $110,625 61.6 $26,005 24.1 $136,630 47.5
Single2 61,068 34.0 15,940 14.7 77,008 26.8
Renewal 7,885 4.4 66,145 61.2 74,030 25.7
Total 179,578 100.0 108,091 100.0 287,669 100.0
Source: ACLI tabulations of National Association of Insurance Commissioners (NAIC) data, used by permission.Notes: NAIC does not endorse any analysis or conclusions based on use of its data. Codification effective in 2001 Annual Statement filings changed the reporting of certain lines of business, particularly deposit-type contracts, as explained in numbered footnotes. Data represent U.S. life insurers and fraternal benefit societies.1Beginning in 2001, excludes certain deposit-type funds from income due to codification, and includes supplementary contracts with life contingencies. Also excludes reserves for supplementary contracts without life contingencies and annuities certain, lottery payouts, structured settlements, and income payout options.2Includes supplementary contracts with life contingencies for individual annuity considerations.
Table 4.5individual Life Premiums and annuity considerations as Percentage of disposable Personal income
Percent
2003 2012 2013
Individual
Life premiums 1.19 0.87 0.83
Annuity considerations1 1.96 1.55 1.44
Total 3.15 2.41 2.27
Sources: U.S. Department of Commerce; ACLI tabulations of National Association of Insurance Commissioners (NAIC) data, used by permission.Notes: NAIC does not endorse any analysis or conclusions based on use of its data. Codification effective with 2001 Annual Statement filings changed the reporting of certain lines of business, particularly deposit-type contracts, as explained in numbered footnotes. Data represent U.S. life insurers and, as of 2003, fraternal benefit societies. U.S. Department of Commerce data from past years may be revised.1Beginning in 2001, excludes certain deposit-type funds from income due to codification, and includes supplementary contracts with life contingencies. Also excludes reserves for supplementary contracts without life contingencies and annuities certain, lottery payouts, structured settlements, and income payout options.
Table 4.6accident and Health insurance net Premium receipts
Millions Average annual percent change
2003 2012 2013 2003/2013 2012/2013
Group $78,518 $92,767 $95,603 2.0 3.1
Credit 1,119 723 725 -4.2 0.3
Individual
Collectively renewable 206 24 23 -19.9 -5.2 Noncancelable 5,237 6,419 3,856 -3.0 -39.9
Guaranteed renewable 25,814 36,220 35,517 3.2 -1.9 Nonrenewable 1,186 3,260 3,264 10.7 0.1
Other accident 587 12,887 15,211 38.5 18.0 All other 3,159 20,000 20,885 20.8 4.4
Total 36,189 78,810 78,755 8.1 -0.1
Aggregate total 115,826 172,300 175,084 4.2 1.6
Source: ACLI tabulations of National Association of Insurance Commissioners (NAIC) data, used by permission.Notes: NAIC does not endorse any analysis or conclusions based on use of its data. Premium receipts are net of reinsurance. Data represent U.S. life insurers and, as of 2003, fraternal benefit societies.
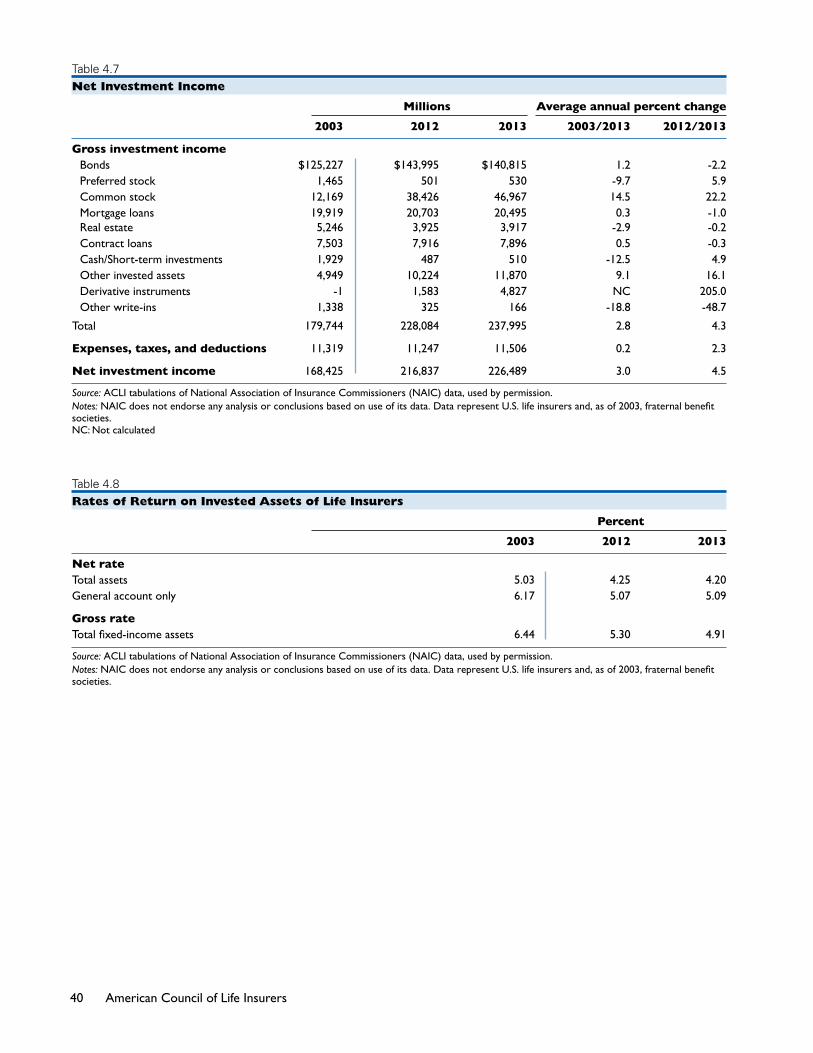
40 American Council of Life Insurers
Table 4.7net investment income
Millions Average annual percent change
2003 2012 2013 2003/2013 2012/2013
Gross investment income Bonds $125,227 $143,995 $140,815 1.2 -2.2 Preferred stock 1,465 501 530 -9.7 5.9 Common stock 12,169 38,426 46,967 14.5 22.2 Mortgage loans 19,919 20,703 20,495 0.3 -1.0
Real estate 5,246 3,925 3,917 -2.9 -0.2 Contract loans 7,503 7,916 7,896 0.5 -0.3 Cash/Short-term investments 1,929 487 510 -12.5 4.9 Other invested assets 4,949 10,224 11,870 9.1 16.1 Derivative instruments -1 1,583 4,827 NC 205.0 Other write-ins 1,338 325 166 -18.8 -48.7
Total 179,744 228,084 237,995 2.8 4.3
Expenses, taxes, and deductions 11,319 11,247 11,506 0.2 2.3
Net investment income 168,425 216,837 226,489 3.0 4.5
Source: ACLI tabulations of National Association of Insurance Commissioners (NAIC) data, used by permission.Notes: NAIC does not endorse any analysis or conclusions based on use of its data. Data represent U.S. life insurers and, as of 2003, fraternal benefit societies. NC: Not calculated
Table 4.8rates of return on invested assets of Life insurers
Percent
2003 2012 2013
Net rateTotal assets 5.03 4.25 4.20General account only 6.17 5.07 5.09
Gross rateTotal fixed-income assets 6.44 5.30 4.91
Source: ACLI tabulations of National Association of Insurance Commissioners (NAIC) data, used by permission.Notes: NAIC does not endorse any analysis or conclusions based on use of its data. Data represent U.S. life insurers and, as of 2003, fraternal benefit societies.
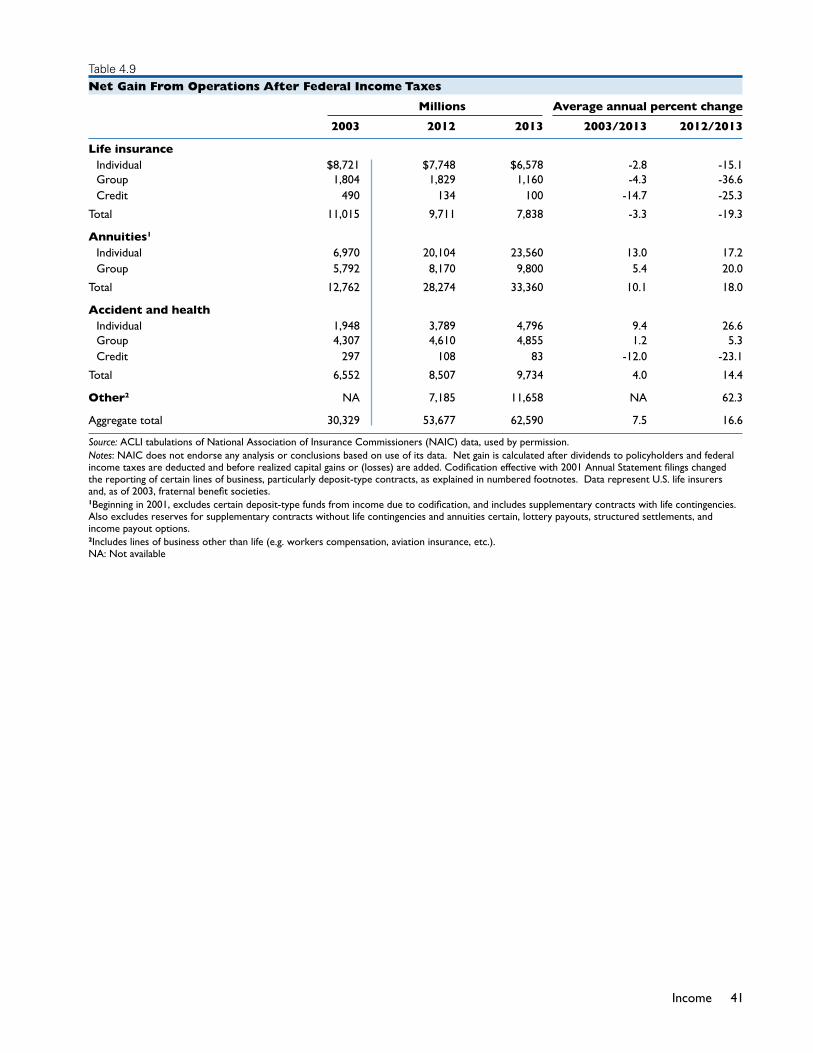
41Income
Table 4.9net Gain from operations after federal income taxes
Millions Average annual percent change
2003 2012 2013 2003/2013 2012/2013
Life insurance Individual $8,721 $7,748 $6,578 -2.8 -15.1
Group 1,804 1,829 1,160 -4.3 -36.6 Credit 490 134 100 -14.7 -25.3
Total 11,015 9,711 7,838 -3.3 -19.3
Annuities1
Individual 6,970 20,104 23,560 13.0 17.2 Group 5,792 8,170 9,800 5.4 20.0
Total 12,762 28,274 33,360 10.1 18.0
Accident and health Individual 1,948 3,789 4,796 9.4 26.6
Group 4,307 4,610 4,855 1.2 5.3 Credit 297 108 83 -12.0 -23.1
Total 6,552 8,507 9,734 4.0 14.4
Other2 NA 7,185 11,658 NA 62.3
Aggregate total 30,329 53,677 62,590 7.5 16.6
Source: ACLI tabulations of National Association of Insurance Commissioners (NAIC) data, used by permission.Notes: NAIC does not endorse any analysis or conclusions based on use of its data. Net gain is calculated after dividends to policyholders and federal income taxes are deducted and before realized capital gains or (losses) are added. Codification effective with 2001 Annual Statement filings changed the reporting of certain lines of business, particularly deposit-type contracts, as explained in numbered footnotes. Data represent U.S. life insurers and, as of 2003, fraternal benefit societies.1Beginning in 2001, excludes certain deposit-type funds from income due to codification, and includes supplementary contracts with life contingencies. Also excludes reserves for supplementary contracts without life contingencies and annuities certain, lottery payouts, structured settlements, and income payout options.2Includes lines of business other than life (e.g. workers compensation, aviation insurance, etc.). NA: Not available

42 American Council of Life Insurers
Table 4.10income of Life insurers, by Year (millions)
Net premium receipts
Life Health Total insurance Annuity insurance premium Investment Other Year premiums considerations premiums receipts income1 income2 Total income
1911 $626 $4 — $630 $182 $24 $8361915 776 6 — 782 241 20 1,0431920 1,374 7 — 1,381 341 42 1,7641925 2,340 38 — 2,378 551 89 3,0181930 3,416 101 — 3,517 891 186 4,5941935 3,182 491 — 3,673 1,013 386 5,0721940 3,501 386 — 3,887 1,231 540 5,6581945 4,589 570 — 5,159 1,445 1,070 7,6741950 6,249 939 $1,001 8,189 2,075 1,073 11,3371955 8,903 1,288 2,355 12,546 2,801 1,197 16,5441960 11,998 1,341 4,026 17,365 4,304 1,338 23,0071965 16,083 2,260 6,261 24,604 6,778 1,785 33,1671970 21,679 3,721 11,367 36,767 10,144 2,143 49,0541975 29,336 10,165 19,074 58,575 16,488 2,959 78,0221980 40,829 22,429 29,366 92,624 33,928 4,336 130,8881985 60,127 53,899 41,837 155,863 67,952 10,212 234,0271986 66,213 83,712* 44,153 194,078 75,435 12,744 282,2571987 76,737 88,677 47,549 212,963 82,875 18,460 314,2981988 73,531 103,278 52,306 229,115 92,042 16,983 338,1401989 73,290 114,997 56,079 244,366 103,965 18,987 367,3181990 76,692 129,064 58,254 264,010 111,853 26,337 402,2001991 79,301 123,590 60,900 263,791 118,984 28,247 411,0221992 83,868 132,645 65,545 282,058 121,389 23,469 426,9161993 94,448 156,445 68,658 319,551 124,205 22,594 466,3501994 98,948 153,019 86,184 338,151 125,999 28,478 492,6281995 102,766 158,389 90,038 351,193 143,967 32,894 528,0541996 107,598 178,416 92,183 378,197 152,700 30,190 561,0871997 115,039 197,529 92,737 405,305 170,713 34,628 610,6461998 119,897 229,493 94,881 444,271 176,801 42,311 663,3831999 120,274 270,212 100,049 490,535 186,563 49,830 726,9282000 130,616 306,693 105,619 542,928 220,862 47,679 811,4692001 125,314 251,255^ 103,413 479,982 203,399 41,068 724,4482002 134,483 269,296^ 108,703 512,482 180,855 40,676 734,0132003‡ 127,320 268,558^ 115,827 511,705 179,744 35,558 727,0072004‡ 139,691 276,677^ 125,752 542,120 186,827 27,863 756,8102005‡ 142,261 277,117^ 118,267 537,645 206,859 34,521 779,0242006‡ 149,223 302,727^ 141,198 593,149 239,669 50,779 883,5972007‡ 142,661 314,225^ 151,462 608,348 267,394 74,624 950,3662008‡ 147,182 328,135^ 165,034 640,350 260,123 40,166 940,6382009‡ 124,564 231,580^ 166,164 522,308 211,650 47,468 781,4262010‡ 104,648 293,622^ 172,717 570,987 212,841 78,741 862,5702011‡ 127,455 334,895^ 171,647 633,997 221,007 60,332 915,3362012‡ 135,392 348,095^ 172,300 655,788 228,084 68,483 952,3552013‡ 130,582 287,669^ 175,084 593,335 237,995 75,397 906,727
Source: ACLI tabulations of National Association of Insurance Commissioners (NAIC) data, used by permission.Notes: NAIC does not endorse any analysis or conclusions based on use of its data. Codification effective with 2001 Annual Statement filings changed the reporting of certain lines of business, particularly deposit-type contracts, as explained in footnotes. Prior to 1947, the business of health insurance departments of life insurers was not included in this series. Data represent U.S. life insurers and, as of 2003, fraternal benefit societies.*Unusually large increase due to NAIC-mandated change in reporting method for group annuity considerations.^Excludes certain deposit-type funds from income due to codification.‡Includes fraternal benefit societies.1Beginning in 2000 represents gross investment income. Prior to 2000, figures are net of investment expenses.2Beginning in 1975, includes commissions and expense allowance on reinsurance ceded. Beginning in 1992, includes amortization of the interest maintenance reserve.
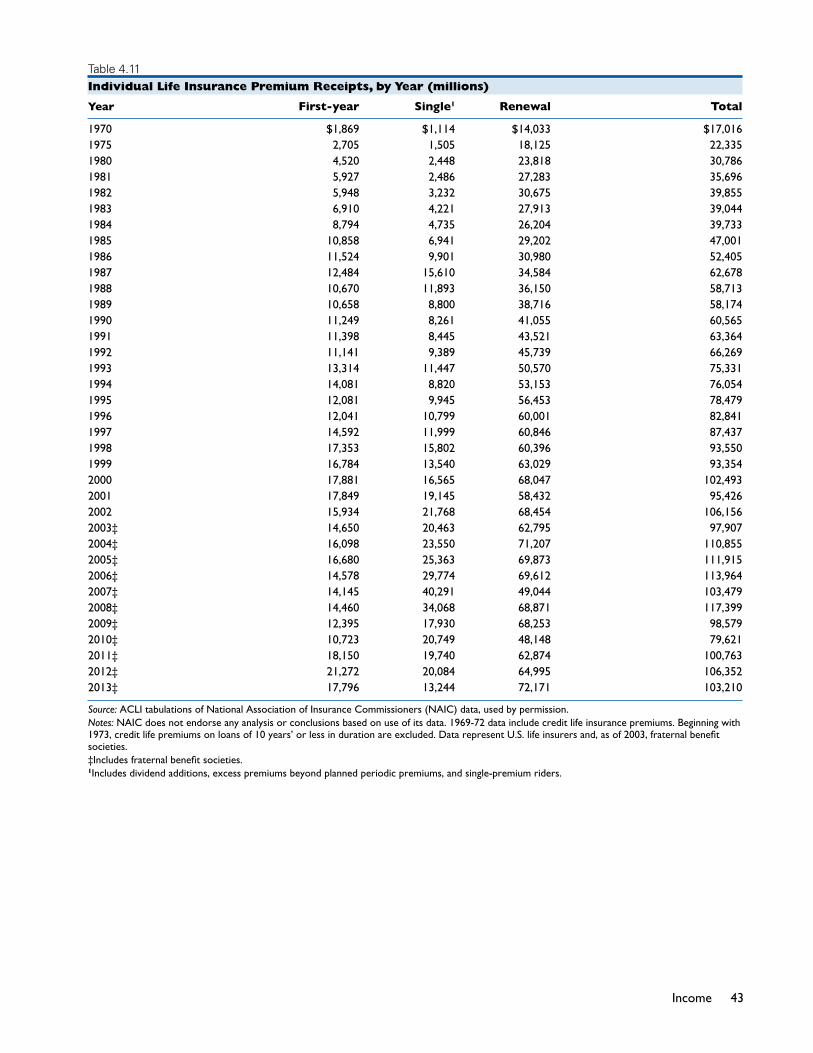
43Income
Table 4.11individual Life insurance Premium receipts, by Year (millions)
Year First-year Single1 Renewal Total
1970 $1,869 $1,114 $14,033 $17,0161975 2,705 1,505 18,125 22,3351980 4,520 2,448 23,818 30,7861981 5,927 2,486 27,283 35,6961982 5,948 3,232 30,675 39,8551983 6,910 4,221 27,913 39,0441984 8,794 4,735 26,204 39,7331985 10,858 6,941 29,202 47,0011986 11,524 9,901 30,980 52,4051987 12,484 15,610 34,584 62,6781988 10,670 11,893 36,150 58,7131989 10,658 8,800 38,716 58,1741990 11,249 8,261 41,055 60,5651991 11,398 8,445 43,521 63,3641992 11,141 9,389 45,739 66,2691993 13,314 11,447 50,570 75,3311994 14,081 8,820 53,153 76,0541995 12,081 9,945 56,453 78,4791996 12,041 10,799 60,001 82,8411997 14,592 11,999 60,846 87,4371998 17,353 15,802 60,396 93,5501999 16,784 13,540 63,029 93,3542000 17,881 16,565 68,047 102,4932001 17,849 19,145 58,432 95,4262002 15,934 21,768 68,454 106,1562003‡ 14,650 20,463 62,795 97,9072004‡ 16,098 23,550 71,207 110,8552005‡ 16,680 25,363 69,873 111,9152006‡ 14,578 29,774 69,612 113,9642007‡ 14,145 40,291 49,044 103,4792008‡ 14,460 34,068 68,871 117,3992009‡ 12,395 17,930 68,253 98,5792010‡ 10,723 20,749 48,148 79,6212011‡ 18,150 19,740 62,874 100,7632012‡ 21,272 20,084 64,995 106,3522013‡ 17,796 13,244 72,171 103,210
Source: ACLI tabulations of National Association of Insurance Commissioners (NAIC) data, used by permission.Notes: NAIC does not endorse any analysis or conclusions based on use of its data. 1969-72 data include credit life insurance premiums. Beginning with 1973, credit life premiums on loans of 10 years’ or less in duration are excluded. Data represent U.S. life insurers and, as of 2003, fraternal benefit societies.‡Includes fraternal benefit societies.1Includes dividend additions, excess premiums beyond planned periodic premiums, and single-premium riders.

44 American Council of Life Insurers
Table 4.12individual annuity considerations, by Year (millions)
Deposit-type Year First-year Single Renewal funds1 Total
1970 $183 $230 $547 — $9601975 728 808 1,128 — 2,6641980 839 3,033 2,424 NA 6,2961981 1,240 6,100 2,950 NA 10,2901982 2,863 8,769 3,564 NA 15,1961983 2,211 7,842 3,950 NA 14,0031984 2,385 8,673 4,648 NA 15,7061985 3,390 11,095 6,406 NA 20,8911986 4,683 13,281 8,153 NA 26,1171987 6,238 18,578 8,948 NA 33,7641988 7,875 28,053 7,856 NA 43,7841989 5,597 20,970 6,437 $16,403 49,4071990 6,080 22,777 6,992 17,817 53,6651991 5,854 21,930 6,732 17,154 51,6701992 6,775 21,964 7,378 25,232 61,3481993 8,793 23,393 6,513 38,288 76,9871994 8,263 22,901 6,448 43,221 80,8321995 7,913 22,898 8,725 37,834 77,3701996 9,727 19,802 6,461 48,077 84,0671997 10,806 22,441 6,781 50,145 90,1741998 11,092 17,129 7,179 60,047 95,4461999 14,599 19,470 6,784 74,767 115,6212000 15,050 27,022 7,480 90,099 139,6512001* 51,576 63,078 27,002 NA 141,6562002* 64,731 75,412 28,291 NA 168,4342003*‡ 61,439 75,410 24,855 NA 161,7042004*‡ 60,568 86,383 25,188 NA 172,1402005*‡ 66,771 78,354 21,907 NA 167,0322006*‡ 81,923 77,193 27,967 NA 187,0832007*‡ 92,395 71,268 28,841 NA 192,5032008*‡ 89,758 94,111 25,097 NA 208,9652009*‡ 93,919 19,331 15,603 NA 128,8532010*‡ 100,286 61,164 28,496 NA 189,9462011*‡ 120,303 60,168 37,366 NA 217,8372012*‡ 107,865 53,941 27,452 NA 189,2582013*‡ 110,625 61,068 7,885 NA 179,578
Source: ACLI tabulations of National Association of Insurance Commissioners (NAIC) data, used by permission.Notes: NAIC does not endorse any analysis or conclusions based on use of its data. Codification effective with 2001 Annual Statement filings changed the reporting of certain lines of business, particularly deposit-type contracts, as explained in footnotes. Data represent U.S. life insurers and, as of 2003, fraternal benefit societies.NA: Not available*Certain deposit-type funds are excluded from income under codification, making data after 2000 incomparable.‡Includes fraternal benefit societies.1First included in annual statements for 1978 and divided into first-year, single, and renewal annuity considerations through 1988.

45Income
Table 4.13rates of return on invested assets of Life insurers, by Year (percent)
Net rate Gross rate
Year Totalassets Generalaccountonly Totalfixed-incomeassets
1920 4.83 NA NA1925 5.11 NA NA1930 5.05 NA NA1935 3.70 NA NA1940 3.45 NA NA1945 3.11 NA NA1950 3.13 NA NA1955 3.51 NA NA1960 4.11 NA NA1965 4.61 4.61 NA1970 5.30 5.34 5.851975 6.36 6.44 7.371980 8.02 8.06 9.261981 8.57 8.53 9.871982 8.91 8.87 10.351983 8.96 9.08 10.631984 9.45 9.65 11.351985 9.63 9.87 12.231986 9.35 9.64 11.141987 9.10 9.39 10.621988 9.03 9.41 10.511989 9.10 9.47 10.581990 8.89 9.31 10.341991 8.63 9.09 10.051992 8.08 8.58 9.441993 7.52 8.04 8.711994 7.14 7.63 8.221995 7.41 7.90 8.431996 7.25 7.75 8.171997 7.35 7.86 8.081998 6.95 7.58 8.001999 6.71 7.49 7.932000 7.05 7.40 7.912001 6.31 7.13 7.622002 5.38 6.64 7.132003‡ 5.03 6.17 6.442004‡ 4.80 5.93 6.032005‡ 4.90 5.88 5.962006‡ 5.35 5.95 5.992007‡ 5.71 6.01 6.102008‡ 5.70 5.63 6.012009‡ 4.60 5.25 5.912010‡ 4.33 5.37 5.682011‡ 4.35 5.29 5.732012‡ 4.25 5.07 5.302013‡ 4.20 5.09 4.91
Source: ACLI tabulations of National Association of Insurance Commissioners (NAIC) data, used by permission.Notes: NAIC does not endorse any analysis or conclusions based on use of its data. Before 1940, some federal income taxes were deducted from net investment income; beginning with 1940, rates are calculated before deducting any federal income taxes. Beginning in 1994, rates include amortization of the interest maintenance reserve. Data represent U.S. life insurers and, as of 2003, fraternal benefit societies.‡ Includes fraternal benefit societies.NA: Not available

46 American Council of Life Insurers
5Life insurance company expenditures include benefit
payments and other contract payments, operating
expenses, taxes, additions to reserves, and investment
expenses. Contract payments accounted for 69 percent
of expenditures at $548 billion in 2013 (Table 5.1, Figure
5.1). Operating expenses were $117 billion for the
second-largest category at 15 percent.
Additions to reserves comprised 13 percent of 2013 total
expenditures, taxes claimed 2 percent and investment
expenses claimed 1 percent. Each expenditure category
is detailed in this chapter, with the exception of reserves,
which are discussed in Chapter 3.
ContraCt Payments
From Life Insurance Policies
Several factors affect the pattern of life insurance benefit
payments. Primary among them are changes in the
death rate of policyholders and the growth in group life
insurance and other term insurance policies that do not
incorporate a cash value.
These payments have increased steadily for many years,
reflecting greater use of life insurance not only to provide
funds for the family whose breadwinner dies, but also for
family financial needs during the policyholder’s lifetime.
Nationally, increasing life insurance ownership has been
the main reason for the almost uninterrupted rise in
life insurance death payments over the years, despite
a general decline in death rates among policyholders.
To Beneficiaries
During 2013 life insurers paid $64 billion to beneficiaries
of policyholders who died; a 1.7% increase from 2012
(Table 5.2). Of this total, individual life insurance policies
accounted for two-thirds and provided $43 billion
(67%). Group life insurance payments to beneficiaries
ranked second at $21 billion, or 32 percent of total death
payments. Benefits paid under short-term individual and
group credit life insurance policies (on loans of 10 years’
or less duration) totaled $331 million in 2013.
To Policyholders
Although the basic purpose of life insurance is to protect
against the economic risks of death, it can also generate
value for the individual policyholder. Cash surrender
values paid on life insurance policies terminated
voluntarily during 2013 declined by 9 percent to $29
billion from a year earlier (Table 5.2).
Policyholder dividends represent the return of part of the
payments that policyholders made on policies sold on
a participating basis, and reflect the portion not needed
by the company after payment of claims, additions
to reserves, and administrative expenses. Dividends
accounted for $13 billion, or 12 percent of payments
from life insurance policies in 2013.
Endowment insurance guarantees that the policy’s
face amount will be paid by the insurance company
regardless of whether the insured dies during the policy’s
term, as long as premiums are paid as required. These
policies specify a maturity date. Matured endowment
payments totaled $396 million in 2013.
eXPenDItUres

48 American Council of Life Insurers
Other payments, including disability payments and
retained assets under life insurance policies, totaled $638
million in 2013.
From Annuity Contracts
Annuity benefit payments increased by 6.4 percent
to $79 billion in 2013 (Table 5.3). Beginning in 2001,
payments and withdrawals from deposit-type contracts
are no longer reported as expenditures but directly as a
deduction from reserves.
Sixty-one percent of the annuity benefit payments, or $48
billion, was paid to individual annuity owners, while $28
billion, or 36 percent, was paid to group annuity owners.
The remainder was paid under supplementary contracts
with life contingencies—an agreement between an
insurer and a life insurance policyholder or beneficiary
in which the beneficiary chooses to receive the policy’s
proceeds over a lifetime rather than in a lump sum.
Life insurers paid $223 billion on voluntarily terminated
annuities in 2013, $3 billion in dividends to annuity
owners, and small amounts of death benefits, disability
benefits, and matured endowments.
From Health Insurance Policies
Health insurance has become a notable aspect of U.S.
life insurers’ services. Life insurance companies paid
$127 billion in health insurance benefits to Americans
in 2013—$72 billion under group contracts and $55
billion under individual policies (Table 5.4). Life insurers’
total health insurance benefit payments to Americans
increased 3 percent from 2012.
These statistics do not include disability payments under
life insurance policies, health insurance and accidental
death and dismemberment payments by casualty and
other health insurance companies, or administrative-
service-only arrangements.
oPeratIng eXPenses
Operating expenses of life insurance companies include
commissions to agents and home- and field-office
expenses. In 2013, agent commissions comprised 7
percent of expenditures at $54 billion (Table 5.1). Home-
and field-office expenses were $62 billion, or 8 percent
of total expenditures.
Of total office expenses, $38 billion, or 60 percent, was
in salaries and payments to employee and agent benefit
plans (Table 5.5). In 2013, life insurers also spent $7
billion on office equipment and supplies, $2 billion on
office rent, $3 billion on fees associated with policy
issuance and claim settlement, $2 billion on advertising,
and $1 billion on travel.
taXes
Life insurance companies incurred $18 billion in taxes to
federal, state, and local governments in 2013, 12 percent
less than in 2012 (Table 5.6). Fifty-two percent of these
taxes were income taxes at $9 billion. Significant year-
to-year variation in federal income taxes is largely due
to changes in capital gain/loss obligations.
Another large tax obligation of life insurers’ is payment
of taxes on premiums that companies collect in each
state. In 2013, U.S. life insurers incurred $5 billion in
state taxes on premiums collected from life, health, and
annuity business.
As employers of over one-third of a million home-office
personnel, U.S. life insurers also incurred $2 billion
in Social Security taxes in 2013. This figure does not
include Social Security taxes paid by employees or self-
employed agents.
Miscellaneous taxes, licenses, and fees accounted for
close to $2 billion in 2013. These taxes do not include
amounts associated with investment management.

49Expenditures
Investment eXPenses
Expenses, fees, and taxes associated with investment
management totaled $12 billion in 2013 (Table 5.7).
Salaries and welfare expenses is the largest category
at about $2.3 billion followed by interest expenses at
$2.1 billion.
Table 5.1expenditures of Life Insurers
Millions Average annual percent change
2003 2012 2013 2003/2013 2012/2013
Contract payments Life insurance $105,041 $108,208 $106,751 0.2 -1.3 Annuities1 201,941 293,996 304,878 4.2 3.7
Health insurance 81,882 123,772 127,453 4.5 3.0 Other payments2 8,963 8,193 8,941 0.0 9.1
Total 397,826 534,170 548,023 3.3 2.6
Additions to policy reserve funds3 131,008 164,272 101,670 -2.5 -38.1
Operating expenses Commissions to agents 46,480 53,817 54,183 1.5 0.7 Home- and field-office expenses 46,960 60,862 62,406 2.9 2.5
Total 93,441 114,679 116,589 2.2 1.7
Taxes4 16,866 20,190 17,749 0.5 -12.1
Investment expenses5 11,445 11,247 11,506 0.1 2.3
Aggregate total 650,586 844,557 795,536 2.0 -5.8
Source: ACLI tabulations of National Association of Insurance Commissioners (NAIC) data, used by permission.Notes: NAIC does not endorse any analysis or conclusions based on use of its data. Codification effective with 2001 Annual Statement filings changed the reporting of certain lines of business, particularly deposit-type contracts, as explained in numbered footnotes. Data represent U.S. life insurers and, as of 2003, fraternal benefit societies.1Beginning in 2001, excludes payments under deposit-type contracts (such payments are shown in Table 3.3). Does not include payments from supplementary contracts without life contingencies and annuities certain, lottery payouts, structured settlements, and income payout options.2Includes group conversions and interest on policy or contract funds. Prior to 2001, also includes payments on dividend accumulations and supplementary contracts without life contingencies.3Beginning in 2001, excludes addition to reserves for deposit-type contracts.4Includes foreign and U.S. federal income taxes, including taxes on capital gains; excludes investment taxes. Data for 1997 do not include foreign income taxes.5Includes investment-related taxes and fees.

50 American Council of Life Insurers
Table 5.2Payments From Life Insurance Policies
Millions Average annual percent change
2003 2012 2013 2003/2013 2012/2013
Payments to beneficiaries Individual $32,901 $43,109 $43,405 2.8 0.7 Group 18,064 19,820 20,615 1.3 4.0
Credit 695 331 331 -7.2 0.0Total 51,661 63,259 64,350 2.2 1.7
Surrender values Individual 33,973 30,300 27,477 -2.1 -9.3 Group 1,970 1,179 1,227 -4.6 4.0Total 35,943 31,479 28,704 -2.2 -8.8
Policyholder dividends 16,234 12,515 12,664 -2.5 1.2
Matured endowments 559 442 396 -3.4 -10.3
Other payments1 645 512 638 -0.1 24.5
Aggregate total 105,041 108,208 106,751 0.2 -1.3
Source: ACLI tabulations of National Association of Insurance Commissioners (NAIC) data, used by permission.Notes: NAIC does not endorse any analysis or conclusions based on use of its data. Data represent U.S. life insurers and, as of 2003, fraternal benefit societies.1Includes disability benefits and retained assets.
Figure 5.1Distribution of Life Insurers’ expenditures, 2013
Source: ACLI tabulations of National Association of Insurance Commissioners (NAIC) data, used by permission. Notes: NAIC does not endorse any analysis or conclusions based on use of its data. Data represent U.S. life insurers and fraternal benefit societies.
Benefit Payments69%
Additions to Reserves13%
Taxes2%
Investment Expenses1%
Operating expenses15%
Source: ACLI tabulations of National Association of Insurance Commissioners (NAIC) data, used by permission. Notes: NAIC does not endorse any analysis or conclusions based on use of its data. Data represent U.S. life insurers and fraternal benefit societies.
Distribution of Life Insurers’ Expenditures, 2013Figure 5.1

51Expenditures
Table 5.3Payments From annuity Contracts
Millions Average annual percent change
2003 2012 2013 2003/2013 2012/2013
Annuity benefits1
Individual1 $29,996 $47,364 $48,219 4.9 1.8 Group1 24,743 24,567 28,236 1.3 14.9
Supplementary contracts with life contingencies 2,371 2,108 2,296 -0.3 8.9
Total 57,110 74,039 78,751 3.3 6.4
Surrenders values2
Individual 73,014 118,637 122,359 5.3 3.1 Group 67,248 98,205 100,449 4.1 2.3
Total 140,261 216,843 222,808 4.7 2.8
Policyholder dividends 4,527 3,015 3,301 -3.1 9.5
Matured endowments 37 * * -52.1 21.5
Other payments3 6 100 18 12.3 -82.4
Aggregate total 201,941 293,996 304,878 4.2 3.7
Source: ACLI tabulations of National Association of Insurance Commissioners (NAIC) data, used by permission.Notes: NAIC does not endorse any analysis or conclusions based on use of its data. Codification effective with 2001 Annual Statement filings changed the reporting of certain lines of business, particularly deposit-type contracts, as explained in numbered footnotes. Data represent U.S. life insurers and, as of 2003, fraternal benefit societies.1Beginning in 2001, excludes payments under deposit-type contracts (such payments are shown in Table 3.3). Does not include payments from annuities certain and supplementary contracts without life contingencies, lottery payouts, structured settlements, and income payout options. 2Beginning in 2001, excludes surrender benefits and fund withdrawals from deposit-type contracts. 3Includes death benefits, disability benefits, and retained assets. *Fewer than $500,000.
Table 5.4Payments From Health Insurance Policies
Millions Average annual percent change
2003 2012 2013 2003/2013 2012/2013
Group $60,317 $69,505 $71,862 1.8 3.4
Individual 20,812 53,915 55,271 10.3 2.5
Credit 753 353 319 -8.2 -9.5
Total 81,882 123,772 127,453 4.5 3.0
Source: ACLI tabulations of National Association of Insurance Commissioners (NAIC) data, used by permission.Notes: NAIC does not endorse any analysis or conclusions based on use of its data. Data represent U.S. life insurers and, as of 2003, fraternal benefit societies.

52 American Council of Life Insurers
Table 5.5Life Insurer Home- and Field-office expenses
Millions Average annual percent change
2003 2012 2013 2003/2013 2012/2013
Rental $2,857 $2,434 $2,450 -1.5 0.6
Employment
Salaries 23,442 29,340 30,113 2.5 2.6 Welfare contributions and payments 5,532 7,101 7,515 3.1 5.8Total 28,974 36,441 37,629 2.6 3.3Fees associated with policy issuance/claim settlement 3,089 3,088 3,023 -0.2 -2.1
Travel 1,034 1,226 1,282 2.2 4.6
Advertising 2,024 2,415 2,342 1.5 -3.0
Office equipment/supplies 7,091 6,929 7,005 -0.1 1.1
Miscellaneous 1,891 8,328 8,675 16.5 4.2
Aggregate total 46,960 60,862 62,406 2.9 2.5
Source: ACLI tabulations of National Association of Insurance Commissioners (NAIC) data, used by permission.Notes: NAIC does not endorse any analysis or conclusions based on use of its data. Figures exclude investment expenses. Data represent U.S. life insurers and, as of 2003, fraternal benefit societies.
Table 5.6taxes, Licenses, and Fees
Millions Average annual percent change
2003 2012 2013 2003/2013 2012/2013
Income taxes1 $10,299 $11,899 $9,279 -1.0 -22.0
Social Security taxes 1,585 1,944 1,981 2.3 1.9
State taxes on premiums 3,823 4,471 4,609 1.9 3.1
Real estate taxes 13 26 29 8.0 8.1
Miscellaneous taxes, licenses, and fees 1,146 1,850 1,851 4.9 0.0
Total 16,866 20,190 17,749 0.5 -12.1
Source: ACLI tabulations of National Association of Insurance Commissioners (NAIC) data, used by permission.Notes: NAIC does not endorse any analysis or conclusions based on use of its data. Figures exclude investment taxes. Data represent U.S. life insurers and, as of 2003, fraternal benefit societies.1Includes foreign and U.S. federal income taxes, including taxes on capital gains; excludes non-income, state, and investment taxes.

53Expenditures
Table 5.7Investment expenses of Life Insurers
Millions Average annual percent change
2003 2012 2013 2003/2013 2012/2013
Rental $233 $180 $186 -2.2 3.3
Employment
Salaries 1,375 1,809 1,962 3.6 8.5 Welfare contributions/payments 181 299 347 6.7 16.1
Total 1,556 2,107 2,309 4.0 9.6
Real estate expenses 1,775 1,491 1,465 -1.9 -1.8
Interest 1,942 2,265 2,150 1.0 -5.1
Depreciation on invested assets 986 758 774 -2.4 2.1
Investment taxes and fees1
Real estate 708 472 494 -3.5 4.8 Other 101 96 104 0.2 8.5
Total 810 567 598 -3.0 5.4
Other 4,143 3,879 4,024 -0.3 3.7
Aggregate total 11,445 11,247 11,506 0.1 2.3
Source: ACLI tabulations of National Association of Insurance Commissioners (NAIC) data, used by permission.Notes: NAIC does not endorse any analysis or conclusions based on use of its data. Data represent U.S. life insurers and, as of 2003, fraternal benefit societies.1Excludes federal income taxes and taxes on capital gains.

54 American Council of Life Insurers
Table 5.8Payments Under Life Insurance Policies and annuity Contracts, by year (millions)
Payments Surrenders and withdrawals1 Policy- Matured to bene- Life Annuity holder Annuity endow- Other Year ficiaries policies contracts2 dividends payments2 ments payments3 Total
1940 $995 $652 NA $468 $176 $269 $104 $2,6641945 1,280 211 NA 466 216 407 88 2,6681950 1,590 592 NA 627 327 495 100 3,7311955 2,241 896 NA 1,021 501 614 110 5,3831960 3,346 1,633 NA 1,512 830 673 124 8,1181965 4,831 1,932 NA 2,259 1,300 931 163 11,4161970 7,017 2,887 NA 3,214 2,120 978 233 16,4491975 9,192 3,763 NA 4,544 3,665 946 426 22,5361980 12,884 6,678 NA 6,785 10,195 908 592 38,0421981 14,154 7,961 NA 7,838 12,021 883 627 43,4841982 15,066 10,779 NA 7,922 12,814 839 574 47,9941983 15,660 12,605 NA 8,641 13,564 824 566 51,8601984 16,752 14,731 NA 9,700 17,912 771 566 60,4321985 18,226 15,589 NA 10,121 21,259 779 536 66,5101986 19,479 14,741 NA 10,122 22,657 766 540 68,3051987 20,530 14,864 NA 10,466 24,316 752 504 71,4321988 21,660 14,456 NA 11,046 25,665 751 513 74,0911989 23,261 14,859 NA 11,417 29,383 727 554 80,2011990 24,567 18,022 NA 11,953 32,575 700 568 88,3851991 25,407 16,282 NA 12,066 36,615 668 547 91,5851992 27,235 16,814 NA 12,203 37,550 649 592 95,0431993 28,819 16,904 NA 12,714 40,325 598 615 99,9751994 32,583 18,014 $92,779 15,915 40,412 647 459 200,8091995 34,545 19,501 105,449 17,816 48,457 1,007 860 227,6351996 36,257 24,454 115,747 18,064 51,069 741 614 246,9461997 37,488 24,016 140,842 17,981 55,080 563 608 276,5781998 40,101 26,816 154,463 18,865 60,410 572 607 301,8341999 41,363 32,833 198,311 19,149 62,485 528 620 355,2882000 44,143 27,173 213,989 20,001 68,668 604 605 375,1812001 46,512 30,653 151,315 19,993 55,197 549 648 304,8672002 48,166 32,909 142,948 21,033 54,950 621 649 301,2762003‡ 51,661 35,943 140,261 20,761 57,110 596 650 306,9822004‡ 51,576 35,485 162,876 18,981 61,162 595 866 331,5412005‡ 52,996 39,157 190,329 17,919 63,935 640 695 365,6722006‡ 55,694 38,463 237,813 18,429 71,087 612 566 422,6642007‡ 57,957 47,670 262,343 19,519 72,332 623 564 461,0082008‡ 59,949 58,629 236,654 19,053 69,648 614 555 445,1012009‡ 59,470 48,141 182,705 16,163 67,068 573 768 374,8882010‡ 58,392 35,843 184,071 15,942 70,090 562 699 365,5992011‡ 62,132 33,511 206,166 15,547 74,518 606 676 393,1562012‡ 63,259 31,479 216,843 15,530 74,039 442 612 402,204 2013‡ 64,350 28,704 222,808 15,965 78,751 396 655 411,629
Source: ACLI tabulations of National Association of Insurance Commissioners (NAIC) data, used by permission.Notes: NAIC does not endorse any analysis or conclusions based on use of its data. Codification effective with 2001 Annual Statement filings changed the reporting of certain lines of business, particularly deposit-type contracts, as explained in footnotes. Data represent U.S. life insurers and, as of 2003, fraternal benefit societies.NA: Not available‡Includes fraternal benefit societies.1Beginning in 1994, includes annuity withdrawals of funds. An amount comparable to prior years is not available.2Beginning in 2001, excludes payments under deposit-type contracts (see Table 3.3).3Includes some disability benefits and retained assets.

55Expenditures
Table 5.9Payments to Life Insurance Beneficiaries, by year
Policies in thousands/Amounts in millions
Individual Group Credit1 Total
Year Policies Amount Policies Amount Policies Amount Policies Amount
1940 974 $891 50 $104 — — 1,024 $9951945 1,226 1,109 92 171 — — 1,318 1,2801950 1,246 1,307 133 283 — — 1,379 1,5901955 1,418 1,650 243 591 — — 1,661 2,2411960 1,644 2,231 394 1,115 — — 2,038 3,3461965 1,866 3,007 636 1,824 — — 2,502 4,8311970 1,974 3,990 767 3,027 — — 2,741 7,0171975 1,998 4,901 591 3,807 337 $484 2,926 9,1921980 2,045 6,587 637 5,671 285 626 2,967 12,8841981 2,016 7,117 668 6,374 324 663 3,008 14,1541982 1,997 7,457 645 6,953 331 656 2,973 15,0661983 2,004 7,776 663 7,256 252 628 2,919 15,6601984 2,158 8,457 675 7,655 248 640 3,081 16,7521985 2,013 9,264 683 8,275 262 687 2,958 18,2261986 2,039 10,030 686 8,675 246 774 2,971 19,4791987 1,981 10,593 690 9,073 262 864 2,933 20,5301988 2,044 11,416 695 9,346 276 898 3,015 21,6601989 1,988 12,332 763 10,029 240 900 2,991 23,2611990 1,965 13,439 728 10,281 238 847 2,931 24,5671991 1,984 13,949 674 10,582 219 876 2,877 25,4071992 1,926 15,287 643 11,022 186 926 2,755 27,2351993 1,945 16,584 668 11,572 136 663 2,749 28,8191994 2,388 18,792 870 12,914 240 877 2,974 32,5831995 2,405 20,106 767 13,527 224 912 3,396 34,5451996 2,401 21,351 867 14,016 273 890 3,541 36,2571997 2,480 22,695 843 13,898 274 895 3,597 37,4881998 2,435 24,838 819 14,425 391 838 3,644 40,1011999 2,715 25,274 875 15,260 380 829 3,970 41,3632000 2,561 27,267 877 16,055 383 821 3,821 44,1432001 2,688* 28,346 935 17,393 313 773 3,936 46,5122002 2,632 30,117 942 17,308 341 741 3,915 48,1662003‡ 2,673 32,901 1,107 18,064 293 695 4,073 51,6612004‡ 2,786 32,222 826 18,708 241 646 3,853 51,5762005‡ 2,586 32,760 989 19,633 310 603 3,885 52,9962006‡ 2,568 34,525 1,027 20,601 276 568 3,870 55,6942007‡ 2,483 36,272 1,016 21,168 262 516 3,761 57,9572008‡ 2,463 37,893 1,027 21,525 281 531 3,771 59,9492009‡ 2,402 38,306 964 20,638 237 527 3,603 59,4702010‡ 2,407 39,045 943 18,890 214 458 3,564 58,3922011‡ 2,563 41,869 917 19,832 92 431 3,572 62,1322012‡ 3,512 43,109 946 19,820 185 331 4,644 63,2592013‡ 3,146 43,405 978 20,615 110 331 4,235 64,350
Source: ACLI tabulations of National Association of Insurance Commissioners (NAIC) data, used by permission.Notes: NAIC does not endorse any analysis or conclusions based on use of its data. Data represent U.S. life insurers and, as of 2003, fraternal benefit societies.*Corrected to include industrial policies.‡Includes fraternal benefit societies.1Prior to 1973, death payments under credit life are included in individual and group categories.

56 American Council of Life Insurers
Table 5.10Health Insurance Benefit Payments by Life Insurers, by year (millions)
Year Group Individual Total
1948 $225 $101 $3261950 375 119 4941955 1,064 326 1,3901960 2,102 531 2,6331965 3,572 841 4,4131970 6,840 1,368 8,2081975 12,410 1,910 14,3201980 19,759 3,279 23,0381981 21,049 3,425 24,4741982 22,288 3,767 26,0551983 22,799 4,113 26,9121984 22,782 4,271 27,0531985 22,830 4,468 27,2981986 24,249 4,717 28,9661987 29,452 5,417 34,8691988 32,063 6,320 38,3831989 32,375 7,057 39,4321990 32,054 7,956 40,0101991 33,933 8,672 42,6051992 35,434 9,516 44,9501993 35,775 10,232 46,0071994 48,218 11,856 60,0741995 51,674 13,040 64,7141996 53,297 13,401 66,6981997 53,393 14,039 67,4321998 55,239 14,791 70,0301999 58,203 16,261 74,4642000 61,098 17,685 78,7842001 58,211 18,093 76,3042002 59,523 19,200 78,7232003‡ 60,317 20,812 81,1292004‡ 65,237 22,551 87,7892005‡ 59,313 19,615 78,9282006‡ 62,407 34,048 96,4552007‡ 66,641 38,982 105,6232008‡ 71,376 47,089 118,4652009‡ 71,077 50,501 121,5782010‡ 68,441 53,634 122,0752011‡ 67,032 53,204 120,2362012‡ 69,505 53,915 123,4192013‡ 71,862 55,271 127,133
Source: ACLI tabulations of National Association of Insurance Commissioners (NAIC) data, used by permission.Notes: NAIC does not endorse any analysis or conclusions based on use of its data. Figures exclude policy dividends. 1994-96 data have been revised to reflect the addition of life insurers that sell accident and health insurance. Data represent U.S. life insurers and, as of 2003, fraternal benefit societies.‡Includes fraternal benefit societies.

6Reinsurance is a risk management tool used by insurers
to spread risk and manage capital. The insurer transfers
some or all of an insurance risk to another insurer.
The insurer transferring the risk is called the “ceding
insurer”. The insurer accepting the risk is called the
“assuming insurer” or “reinsurer”. For life insurers, the
risk transferred may be mortality, longevity or morbidity
risk, surrender or expense risk, investment risk, or a
combination of these risks.
Reinsurance has made possible the protection of a wider
array of individuals and groups than would otherwise
be feasible. An insurer who is approached by an
applicant who presents an unusual risk—or who needs
an amount of life insurance policy that is larger than the
insurer’s retention limit (the amount of risk an insurer
has determined it can judiciously retain)—may still be
able to offer the policy to the consumer if part of the
risk is transferred to a reinsurer. A ceding insurer also
uses reinsurance to limit its risk on a group of policies
to avoid fluctuations in claim levels or to lower the risk
of claims involving multiple deaths from single events.
Virtually all life insurers buy reinsurance to improve
their risk profile. In 2013, 89 percent of life insurers
with life premiums ceded at least some of those
premiums as reinsurance. Among insurers with accident
and health premiums, 85 percent ceded accident and
health premiums as reinsurance. Forty nine percent of
insurers doing annuity business in 2013 ceded annuity
considerations, excluding deposit-type funds. The Society
of Actuaries annually publishes more detailed data on the
life reinsurance marketplace in the Reinsurance News.
AllocAting Risk
In order for families to have peace of mind and for
economies to thrive, there must be a mechanism to
deal with large financial risk. Life insurers provide that
financial security. Reinsurance spreads the risk of loss
between two insurance companies. The risk can be
spread even further if the ceding insurer uses more than
one reinsurer, or the reinsurer in turn transfers some of
that risk to another reinsurer, or retrocessionaire.
In the most basic reinsurance arrangement, a single
insurer issuing policies to the public cedes business to a
single reinsurer, usually an independent firm operating in
the open marketplace. Insurers sometimes cede business
to affiliates to aggregate similar risks in one entity for
efficient risk management. Insurance groups also use
captive reinsurers to reinsure risks exclusively from
affiliated companies to access capital markets.
When reinsurance exists, the ceding insurer transferring
the risk retains its financial relationship with, and legal
obligation to pay claims to, the policyholder. The
policyholder will not even be aware that part of the risk
in their policy is covered by a reinsurer. The reinsurer
indemnifies, or reimburses, the ceding insurer for losses
incurred on the reinsured policies.
Reinsurance is now a global business. Of the $189 billion
total reinsurance premiums paid by U.S. life insurers in
2013, 66 percent was paid to reinsurers domiciled in
the U.S. and 34 percent to reinsurers domiciled in other
countries.
REINSURANCE
58 American Council of Life Insurers
REinsURAncE RElAtionship
Underwriting strength
A closely related motivation for reinsurance is obtaining
the reinsurer’s underwriting assistance and proficiency.
Reinsurers review and maintain policy and claim records
on a large volume of risks from many ceding companies
whose policyholders are diverse and geographically
distributed. The risk pool from which they develop and
provide underwriting knowledge is larger and wider
than is normally available to a single primary insurer.
Underwriting is further strengthened when risk is spread
to more than one reinsurer or retrocessionaire, because
of the exposure to an even broader range of policies and
claims. Confidence that underwriters are competently
and professionally meeting its underwriting needs allows
a ceding insurer to concentrate on other activities to
expand its business.
product Flexibility
Another reason to reinsure is the opportunity it gives a
ceding insurer to exit from some product lines and enter
others. If an insurer has issued policies in a particular
product line that it wishes to discontinue, the insurer
can reinsure most or all of the risk on those policies.
Conversely, if an insurer wants to enter a particular
product line, reinsurers can help with product
development and assume some of the product’s risk.
Later, as the primary insurer gains more confidence in
its ability to underwrite and develop the product, the
insurer might retain more of the risk on new business and
recapture provisions in the reinsurance treaty might allow
it to take back some of the risk the reinsurer assumed.
capital Management
Reinsurance also helps a ceding insurer manage its
capital efficiently. This is especially helpful to a life
insurer issuing new policies because initial costs
(expenses plus reserves) are often higher than premiums
received. Sharing those initial costs and risks with a
reinsurer helps the ceding insurer manage its cash flows.
typEs oF REinsURAncE
Various reinsurance plans are available based on ceding
companies’ needs and their reasons for reinsuring.
Plans can be broadly classified as either proportional
reinsurance, specifying in advance the amounts or
percentages of risk for which the reinsurer is liable,
or nonproportional, specifying instead the loss limits,
time limits, or conditions beyond which a reinsurer will
reimburse some or all of the ceding insurer’s benefit
payments.
proportional Reinsurance
Specified amounts or percentages are shared between
ceding companies and reinsurers in proportional
reinsurance. Excess of retention allocates risk by amount.
The ceding insurer establishes a dollar amount beyond
which it is unwilling to retain risk, and the reinsurer
assumes risk over this amount, up to the reinsurer’s
retention limit. In contrast, quota share allocates by
percentage, where the ceding insurer and reinsurer
establish the percentage of risk for which each will retain
or assume responsibility.
Proportional plans, commonly used in life insurance
include:
n Yearly renewable term (YRT) In this type, mortality
risk is the only risk transferred to the reinsurer. The
reinsurance premium varies each year with the age
of the insured. YRT reinsurance allows a ceding
insurer to transfer mortality risk, but it leaves the
insurer responsible for establishing reserves for the
remainder of the policy benefits. Despite its name,
YRT is not yearly renewable. The reinsurer may
not terminate coverage until the original insurance
policy terminates.

59Reinsurance
n Coinsurance The ceding insurer transfers a
proportionate share of all the policy risks and cash
flows. The reinsurer re-ceives its share of premiums,
pays its share of benefits, sets up its share of reserves,
and pays an allowance to the ceding insurer to cover
its share of the costs of administering the policy.
n Modified coinsurance The reinsurer transfers its
share of reserves back to the ceding insurer while
the risk remains with the reinsurer. The ceding
insurer, however, must pay interest to replace what
the reinsurer would have earned had it retained
its share of the reserve. This arrangement allows
the ceding insurer to reduce potential credit risk
and to retain control over investments. The latter is
particularly important where the insurer is using a
unique investment strategy.
nonproportional reinsurance
Nonproportional plans can be used for all types of
insurance. Common uses include:
n Stop loss The reinsurer remits some or all of a ceding
company’s aggregate claims above a predetermined
dollar amount (the attachment point), or above a
percentage of premiums during a specified period.
n Excess of time Most often used for disability or long-
term care reinsurance, this type of plan specifies the
time after which a reinsurer pays some or all of the
claims.
n Catastrophe The reinsurer covers claims that
exceed a specified amount or number of insureds
due to a single event resulting in more than one
loss, as in an accident or natural disaster.

60 American Council of Life Insurers
Table 6.1Reinsurance Assumed and Ceded—Premiums
Millions Average annual percentage change
2003 2012 2013 2003/2013 2012/2013
pREMiUMs pAiD on cEDED BUsinEsslife insurance Individual $37,045 $74,336 $96,859 10.1 30.3 Affiliates 16,607 35,094 48,350 11.3 37.8 Non-Affiliates 20,438 39,241 48,509 9.0 23.6 Group 5,692 10,864 12,409 8.1 14.2 Affiliates 2,539 8,480 8,566 12.9 1.0 Non-Affiliates 3,153 2,384 3,842 2.0 61.2 Credit 885 551 461 -6.3 -16.3
Total 43,623 85,751 109,729 9.7 28.0
Annuity considerations1
Individual 34,003 28,317 32,683 -0.4 15.4 Affiliates 26,544 17,643 29,922 1.2 69.6 Non-Affiliates 7,458 10,674 2,761 -9.5 -74.1 Group 3,429 10,369 15,570 16.3 50.2 Affiliates 1,905 7,817 5,776 11.7 -26.1 Non-Affiliates 1,524 2,552 9,794 20.4 283.8Total 37,431 38,686 48,252 2.6 24.7
Accident and health insurance Individual 7,922 11,289 11,574 3.9 2.5 Affiliates 3,388 6,192 6,713 7.1 8.4 Non-Affiliates 4,534 5,098 4,861 0.7 -4.6 Group 12,875 18,011 19,213 4.1 6.7 Affiliates 6,594 11,850 11,851 6.0 0.0 Non-Affiliates 6,280 6,161 7,363 1.6 19.5 Credit 1,009 371 356 -9.9 -4.2Total 21,806 29,672 31,143 3.6 5.0
Aggregatetotal 102,860 154,109 189,124 6.3 22.7
pREMiUMs FRoM AssUMED BUsinEsslife insurance Individual $22,812 $43,630 $65,904 11.2 51.1 Affiliates 3,666 11,445 22,336 19.8 95.2 Non-Affiliates 19,147 32,185 43,568 8.6 35.4 Group 3,675 4,616 5,481 4.1 18.8 Affiliates 346 2,488 1,411 15.1 -43.3 Non-Affiliates 3,329 2,128 4,071 2.0 91.3 Credit 519 256 191 -9.5 -25.2
Total 27,006 48,502 71,577 10.2 47.6
Annuity considerations1
Individual 18,484 17,039 5,124 -12.0 -69.9 Affiliates 12,436 5,975 2,705 -14.1 -54.7 Non-Affiliates 6,048 11,064 2,419 -8.8 -78.1 Group 3,401 5,136 3,569 0.5 -30.5
Affiliates 2,530 377 1,594 -4.5 322.9 Non-Affiliates 871 4,759 1,975 8.5 -58.5
Total 21,886 22,175 8,693 -8.8 -60.8
Continued
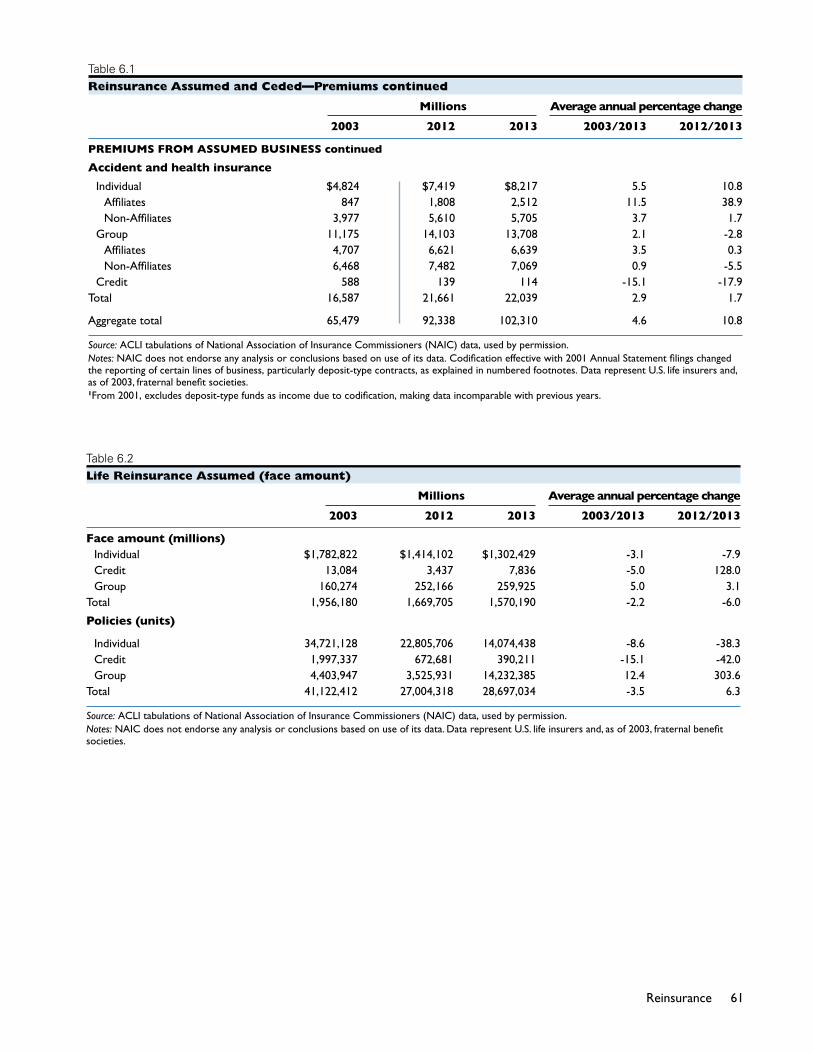
61Reinsurance
Table 6.1Reinsurance Assumed and Ceded—Premiums continued
Millions Average annual percentage change
2003 2012 2013 2003/2013 2012/2013
pREMiUMs FRoM AssUMED BUsinEss continued
Accident and health insurance
Individual $4,824 $7,419 $8,217 5.5 10.8 Affiliates 847 1,808 2,512 11.5 38.9 Non-Affiliates 3,977 5,610 5,705 3.7 1.7 Group 11,175 14,103 13,708 2.1 -2.8 Affiliates 4,707 6,621 6,639 3.5 0.3 Non-Affiliates 6,468 7,482 7,069 0.9 -5.5 Credit 588 139 114 -15.1 -17.9Total 16,587 21,661 22,039 2.9 1.7
Aggregatetotal 65,479 92,338 102,310 4.6 10.8
Source: ACLItabulationsofNationalAssociationofInsuranceCommissioners(NAIC)data,usedbypermission.Notes: NAICdoesnotendorseanyanalysisorconclusionsbasedonuseofitsdata.Codificationeffectivewith2001AnnualStatementfilingschangedthereportingofcertainlinesofbusiness,particularlydeposit-typecontracts,asexplainedinnumberedfootnotes.DatarepresentU.S.lifeinsurersand,asof2003,fraternalbenefitsocieties.1From2001,excludesdeposit-typefundsasincomeduetocodification,makingdataincomparablewithpreviousyears.
Table 6.2Life Reinsurance Assumed (face amount)
Millions Average annual percentage change
2003 2012 2013 2003/2013 2012/2013
Face amount (millions) Individual $1,782,822 $1,414,102 $1,302,429 -3.1 -7.9 Credit 13,084 3,437 7,836 -5.0 128.0 Group 160,274 252,166 259,925 5.0 3.1Total 1,956,180 1,669,705 1,570,190 -2.2 -6.0
policies (units)
Individual 34,721,128 22,805,706 14,074,438 -8.6 -38.3 Credit 1,997,337 672,681 390,211 -15.1 -42.0 Group 4,403,947 3,525,931 14,232,385 12.4 303.6Total 41,122,412 27,004,318 28,697,034 -3.5 6.3
Source: ACLItabulationsofNationalAssociationofInsuranceCommissioners(NAIC)data,usedbypermission.Notes: NAICdoesnotendorseanyanalysisorconclusionsbasedonuseofitsdata.DatarepresentU.S.lifeinsurersand,asof2003,fraternalbenefitsocieties.

62 American Council of Life Insurers

7People buy life insurance to protect their dependents
against financial hardship when the insured person, the
policyholder, dies. Many life insurance products also allow
policyholders to accumulate savings that can be used in a
time of financial need. Most American families depend on
life insurance to provide this economic protection: Seventy
percent own some type of life insurance, according to
LIMRA International.
Americans purchased $2.8 trillion of new life insurance
coverage in 2013, a 1 percent decrease from 2012. By the
end of 2013, total life insurance coverage in the United
States was $19.7 trillion, an increase of 2 percent from
2012 (Table 7.1).
Three types of life insurance policies predominate the
market. Individual insurance is underwritten separately
for each individual who seeks insurance protection. Group
insurance is underwritten on a group as a whole, such
as the employees of a company or the members of an
organization. Credit insurance guarantees payment of
some debt, such as a mortgage or other loan, in the event
the insured person dies, and can be bought on either an
individual or a group basis. Insurance on loans of 10 years’
or less duration is classified as credit insurance in National
Association of Insurance Commissioners accounts;
insurance on longer loans is included in individual or
group policy data in this chapter. Life insurance policies
offered by fraternal benefit societies are considered
individual insurance.
IndIvIdual lIfe Insurance
Individual life is the most widely used form of life
insurance protection, accounting for 58 percent of all life
insurance in force in the United States at year-end 2013
(Table 7.1). Typically purchased through life insurance
agents, this insurance is issued under individual policies
with face amounts as low as $1,000, although larger
minimum amounts are more typical in today’s market.
While individual life is principally used for family
protection, it also is widely used for business purposes.
A business may purchase life insurance to protect against
the economic loss that would result from the death of the
owner or a key employee.
Individual life insurance protection in the United States
totaled $11.4 trillion at the end of 2013 and has grown at
an average annual rate of 1.6 percent since 2003, when
$9.7 trillion was in force (Table 7.1).
The average size of new individual life policies purchased
has decreased since its peak in 2008 to $165,000 in 2013
(Figure 7.2). The number of individual policies purchased
totaled 9.9 million in 2013 (Table 7.1).
Individual life policies offer two basic types of protection:
covering a specified term, or permanently covering one’s
whole life.
lIfe Insurance

64 American Council of Life Insurers
Types of Policies
Term Insurance
Term insurance policies provide life insurance coverage
for a specified period, usually greater than one year. Term
policies provide no further benefits when the term expires,
and no buildup of cash value occurs. If this insurance is
not renewed at the end of its term, coverage lapses and
no payment would be made to the beneficiary in the
event of death.
Of new individual life policies purchased in 2013, 36
percent, or 3.5 million, were term insurance, totaling
$1.1 trillion, or 66 percent, of the individual life face
amount issued (Table 7.2). The most popular form of term
insurance is level term, which offers a fixed premium.
Permanent Insurance
Unlike term insurance, permanent life (or whole life)
insurance provides protection for as long as the insured
lives. Permanent life policies also have a savings
component, building cash value that can help families
meet financial emergencies, pay for special goals, or
provide income for retirement years.
There are four types of permanent life insurance policies:
traditional whole life, universal life (UL), variable life (VL),
and variable-universal life (VUL). The annual premium for
traditional whole life policies remains constant throughout
the life of the policy. In earlier years, the premium is
higher than the actual cost of the insurance, but in later
years it becomes substantially lower than the actual cost
of protection. The excess amount of each premium in the
early years is held in reserve as the policy’s cash value. This
cash value grows over time from investment earnings and
future premium payments, providing funds for the cost
of coverage as the insured grows older. If a policyholder
decides to give up the insurance protection, he or she
receives the cash value upon surrendering the policy,
less any outstanding policy loans. Universal life allows
varying premium payment amounts subject to a certain
minimum and maximum. For variable life, the death
benefit and cash value vary subject to the performance
of a portfolio of investments chosen by the policyholder.
VUL combines the flexible premium payment options of
UL with the varied investment options of VL.
In 2013, direct purchases of permanent life constituted 64
percent of U.S. individual life insurance policies issued
and 34 percent of the total face amount issued (Table 7.2).
Participating and Nonparticipating Insurance
Traditional whole life and term insurance policies can be
purchased on a participating or nonparticipating basis.
A participating policy allows the policyholder to share
in the insurance company’s surplus. With this type of
life insurance, a policyholder receives annual dividends
representing that portion of the premium not needed
by the company for death payments to beneficiaries,
additions to reserves, or administrative expenses. Nearly
three-fourths of individual life policies’ face amount
purchased were nonparticipating at $1.21 trillion (74%)
in 2013 (Table 7.3).
Characteristics of Individual Policies
Lapses and Surrenders
A policy lapses if its premium is not paid by the end
of a specified time, often called the grace period.
Policyholders have different reasons for terminating their
policies, sometimes using cash values to address financial
emergencies or achieve long-term goals. Rates of voluntary
policy termination by policyholders vary considerably
among life insurers. Each company’s rate depends on
many factors, including the types of policies written and
the ratio of new policies to older ones in force with the
company.
The voluntary termination rate of individual life insurance
policies reached 5.7 percent by 2013 (Table 7.4). Of
the individual life policies that have been voluntarily
terminated, 18 percent were surrendered.
The life insurance business vigorously seeks to minimize
the lapsing of policies. For example, agent training focuses
on realistic identification of clients’ life insurance needs,
and careful analysis of the use of family income for
protection. Since the voluntary termination rate is higher
for policies on which loans are outstanding, companies
urge that loans be used only in genuine financial
emergencies, and that they be repaid promptly.
65Life Insurance
Most insurers offer policyholders time after their policy is
delivered to consider whether to keep the policy. These
companies will refund the premium in full if, within the
prescribed time, the policyholder decides not to keep
his or her policy.
Some policies that lapse still have a cash value, entitling
the policyholder to some form of payment under a cash
surrender value non-forfeiture option. All coverage under
the policy terminates at the time of the surrender.
Disability Provisions
Besides the benefit payable upon death of the insured,
many life insurance policies or policy riders provide
disability benefits to cover financial losses that result from
a sickness or injury. The most common supplementary
benefit is waiver of premium. Of individual life policies
in force in 2013, 90 percent, or 33 million, allowed the
premium to be waived during disability, representing $4.4
trillion, or 99 percent, of the individual life face amount
in force with disability provisions (Table 7.6).
Group lIfe Insurance
Group life insurance is a contract between an insurance
company and some group to insure all of the group’s
members, usually under term coverage. Common
examples are employer-provided life insurance and
insurance offered through unions and professional
associations. Employees or other group members receive
certificates denoting their participation in the group
coverage. In 2013, group insurance represented 41 percent
of all life insurance policies in force (Table 7.1).
Group purchases increased 2 percent in 2013 to $1.14
trillion. At the end of 2013, group life insurance provided
$8.2 trillion of protection, 3 percent more than a year
earlier (Table 7.1).
Group insurance contracts can provide benefits beyond
term insurance. Employees often can retain coverage
after retirement by paying premiums directly to the
insurer. Many policies also offer survivor benefits,
usually continuing monthly payments to the spouse of
an employee who dies before retirement; payments may
extend for life or to the age at which Social Security
retirement payments become available, but cease on
remarriage. Contingent benefits to dependent children in
the event of a spouse’s death are available as well. The
initial value of these survivor benefits can range from three
to 10 times an employee’s annual salary.
As with individual life policies, group policies can be
purchased on either a participating or nonparticipating
basis. Most group life policies are nonparticipating—95
percent of those purchased in 2013, at $1.1 trillion (Table
7.3).
The voluntary termination rate of group life insurance
policies increased to 6.5 percent from 6.2 percent a year
earlier. The voluntary lapses in 2013 increased to 6.4
percent from 5.6 percent in 2012 (Table 7.4).
Group policies also provide disability benefits. Of group
life policies in force in 2013, 93 percent, or 56 million,
provided for waiver of premium, representing $4.2 trillion,
or 92 percent, of the group life face amount in force with
disability provisions (Table 7.6).
credIt lIfe Insurance
Credit life insurance pays the balance on loans of 10 years’
or less duration if the borrower dies before repaying the
amount due. At year-end 2013, $81 billion of credit life
insurance was in force, down 13 percent from the previous
year (Table 7.1).
Credit life, commonly part of consumer credit contracts,
is term insurance, generally decreasing in amount as a
loan is repaid. It protects the borrower’s family, as well as
the lender, against unpaid debt that may be left at death.
Life insurers issue credit insurance through lenders such
as banks, finance companies, credit unions, and retailers,
who in turn make arrangements with borrowers.
As with other life policies, credit policies can be purchased
on either a participating or nonparticipating basis. Of
credit life policies purchased in 2013, 85 percent, or $47
billion, were nonparticipating (Table 7.3).
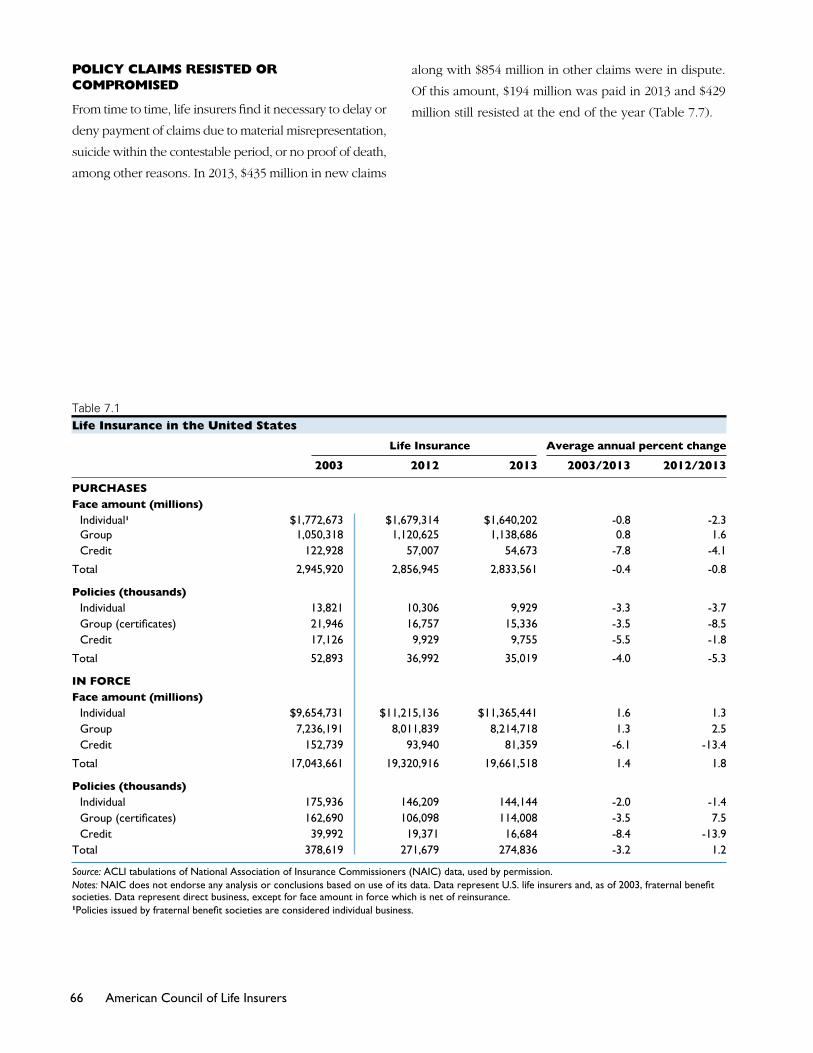
66 American Council of Life Insurers
along with $854 million in other claims were in dispute.
Of this amount, $194 million was paid in 2013 and $429
million still resisted at the end of the year (Table 7.7).
Table 7.1life Insurance in the united states
Life Insurance Average annual percent change
2003 2012 2013 2003/2013 2012/2013
PURCHASESFace amount (millions) Individual1 $1,772,673 $1,679,314 $1,640,202 -0.8 -2.3 Group 1,050,318 1,120,625 1,138,686 0.8 1.6 Credit 122,928 57,007 54,673 -7.8 -4.1
Total 2,945,920 2,856,945 2,833,561 -0.4 -0.8
Policies (thousands) Individual 13,821 10,306 9,929 -3.3 -3.7 Group(certificates) 21,946 16,757 15,336 -3.5 -8.5 Credit 17,126 9,929 9,755 -5.5 -1.8
Total 52,893 36,992 35,019 -4.0 -5.3
IN FORCEFace amount (millions) Individual $9,654,731 $11,215,136 $11,365,441 1.6 1.3 Group 7,236,191 8,011,839 8,214,718 1.3 2.5 Credit 152,739 93,940 81,359 -6.1 -13.4
Total 17,043,661 19,320,916 19,661,518 1.4 1.8
Policies (thousands) Individual 175,936 146,209 144,144 -2.0 -1.4 Group(certificates) 162,690 106,098 114,008 -3.5 7.5 Credit 39,992 19,371 16,684 -8.4 -13.9Total 378,619 271,679 274,836 -3.2 1.2
Source: ACLItabulationsofNationalAssociationofInsuranceCommissioners(NAIC)data,usedbypermission.Notes: NAICdoesnotendorseanyanalysisorconclusionsbasedonuseofitsdata.DatarepresentU.S.lifeinsurersand,asof2003,fraternalbenefitsocieties.Datarepresentdirectbusiness,exceptforfaceamountinforcewhichisnetofreinsurance.1Policiesissuedbyfraternalbenefitsocietiesareconsideredindividualbusiness.
polIcy claIms resIsted or compromIsed
From time to time, life insurers find it necessary to delay or
deny payment of claims due to material misrepresentation,
suicide within the contestable period, or no proof of death,
among other reasons. In 2013, $435 million in new claims

67Life Insurance
Figure 7.1Individual, Group, and credit life Insurance in force in the united states (face amount)
Source: ACLItabulationsofNationalAssociationofInsuranceCommissioners(NAIC)data,usedbypermission.NAICdoesnotendorseanyanalysis or conclusions based on use of its data.Notes:DatarepresentU.S.lifeinsurers,and,asof2003,fraternalbenefitsocieties.
Figure 7.2average face amount of Individual life Insurance policies purchased
Source: ACLItabulationsofNationalAssociationofInsuranceCommissioners(NAIC)data,usedbypermission.NAICdoesnotendorseanyanalysis or conclusions based on use of its data.Notes:DatarepresentU.S.lifeinsurers,and,asof2003,fraternalbenefitsocieties.
Source: ACLI tabulations of National Association of Insurance Commissioners (NAIC) data, used by permission. Notes: NAIC does not endorse any analysis or conclusions based on use of its data. Data represent U.S. life insurers, and, as of 2003, fraternal benefit societies.
CreditGroup
Individual
$ Trillions
20132011200920072005200320011999199719951993199119891987
Individual, Group, and Credit Life Insurance in Force in the United States (face amount)Figure 7.1
5
10
15
20
Source: ACLI tabulations of National Association of Insurance Commissioners (NAIC) data, used by permission. Notes: NAIC does not endorse any analysis or conclusions based on use of its data. Data represent U.S. life insurers, and, as of 2003, fraternal benefit societies.
$Thousands
Average Face Amount of Individual Life Insurance Policies PurchasedFigure 7.2
81
103114
83
120128
157175 172 165162
20132011200920072005200320011999199719951993
50
0
100
150
200

68 American Council of Life Insurers
Table 7.2Individual life Insurance purchases in the united states, by plan type, 2013
Policies in thousands/Amounts in millions
Policies Percent Face amount Percent
Term insurance Decreasing 133 1.4 $1,676 0.1 Level 3,348 34.9 984,214 61.1 Decreasingotherterm1 NA NA 2,363 0.1 Levelotherterm2 NA NA 66,038 4.1 Term additions NA NA 1,113 0.1Total 3,481 36.3 1,055,404 65.5
Whole life and endowment 6,106 63.7 555,459 34.5
Aggregate total 9,587 100.0 1,610,863 100.0
Source: ACLItabulationsofNationalAssociationofInsuranceCommissioners(NAIC)data,usedbypermission.Notes: NAICdoesnotendorseanyanalysisorconclusionsbasedonuseofitsdata.Doesnotincludefraternalbenefitsocieties.NA: Not available1Includesdecreasingterminsuranceonspousesandchildrenunderfamilypolicies.2Includeslevelterminsuranceonspousesandchildrenunderfamilypolicies.
Table 7.3life Insurance purchases, by participating status
Individual Group Credit Total
Face Face Face Face amount amount amount amount (millions) Percent (millions) Percent (millions) Percent (millions) Percent
2003 Nonparticipating $1,401,746 79.1 $854,213 81.3 $100,487 81.7 $2,356,446 80.0 Participating 370,927 20.9 196,105 18.7 22,441 18.3 589,474 20.0
Total 1,772,673 100.0 1,050,318 100.0 122,928 100.0 2,945,920 100.0
2012 Nonparticipating 1,248,447 74.3 1,057,331 94.4 44,852 78.7 2,350,630 82.3 Participating 430,866 25.7 63,294 5.6 12,155 21.3 506,316 17.7
Total 1,679,314 100.0 1,120,625 100.0 57,007 100.0 2,856,945 100.0
2013 Nonparticipating 1,211,101 73.8 1,076,704 94.6 46,622 85.3 2,334,426 82.4 Participating 429,101 26.2 61,982 5.4 8,051 14.7 499,135 17.6Total 1,640,202 100.0 1,138,686 100.0 54,673 100.0 2,833,561 100.0
Source: ACLItabulationsofNationalAssociationofInsuranceCommissioners(NAIC)data,usedbypermission.Notes: NAICdoesnotendorseanyanalysisorconclusionsbasedonuseofitsdata.DatarepresentU.S.lifeinsurers;dataforfraternalbenefitsocietiesnot included.
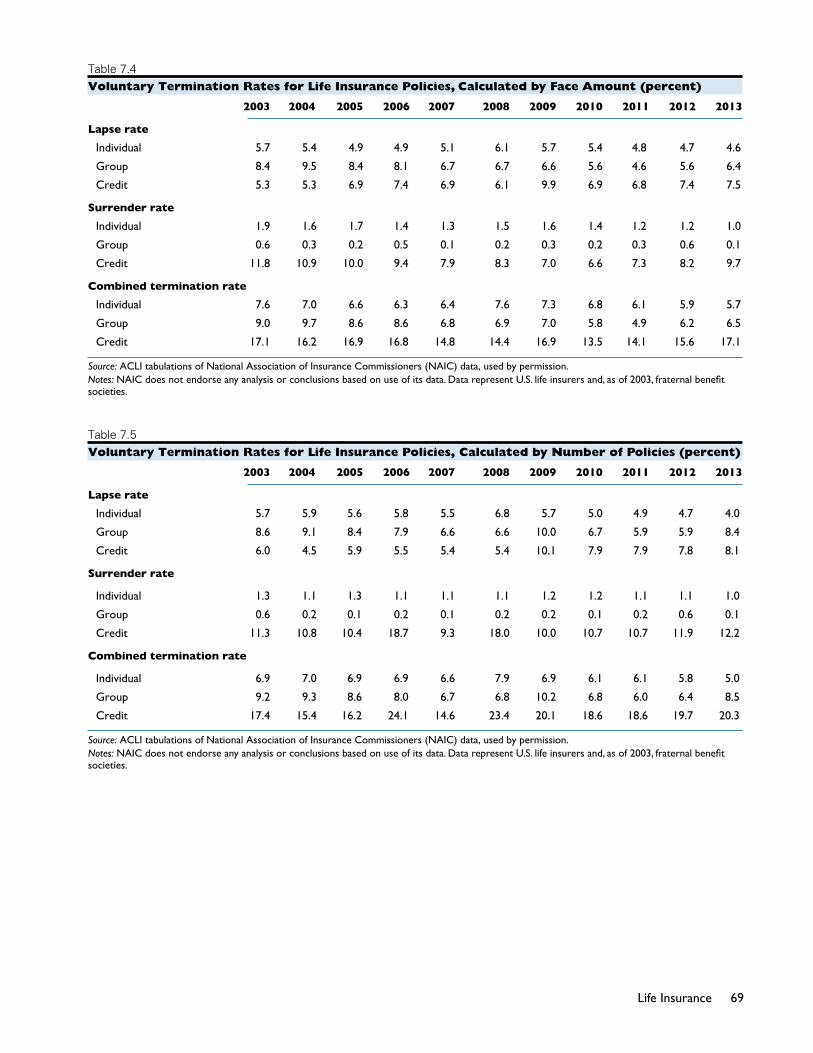
69Life Insurance
Table 7.4voluntary termination rates for life Insurance policies, calculated by face amount (percent)
2003 2004 2005 2006 2007 2008 2009 2010 2011 2012 2013
Lapse rate
Individual 5.7 5.4 4.9 4.9 5.1 6.1 5.7 5.4 4.8 4.7 4.6
Group 8.4 9.5 8.4 8.1 6.7 6.7 6.6 5.6 4.6 5.6 6.4
Credit 5.3 5.3 6.9 7.4 6.9 6.1 9.9 6.9 6.8 7.4 7.5
Surrender rate
Individual 1.9 1.6 1.7 1.4 1.3 1.5 1.6 1.4 1.2 1.2 1.0
Group 0.6 0.3 0.2 0.5 0.1 0.2 0.3 0.2 0.3 0.6 0.1
Credit 11.8 10.9 10.0 9.4 7.9 8.3 7.0 6.6 7.3 8.2 9.7
Combined termination rate
Individual 7.6 7.0 6.6 6.3 6.4 7.6 7.3 6.8 6.1 5.9 5.7
Group 9.0 9.7 8.6 8.6 6.8 6.9 7.0 5.8 4.9 6.2 6.5
Credit 17.1 16.2 16.9 16.8 14.8 14.4 16.9 13.5 14.1 15.6 17.1
Source: ACLItabulationsofNationalAssociationofInsuranceCommissioners(NAIC)data,usedbypermission.Notes: NAICdoesnotendorseanyanalysisorconclusionsbasedonuseofitsdata.DatarepresentU.S.lifeinsurersand,asof2003,fraternalbenefitsocieties.
Table 7.5voluntary termination rates for life Insurance policies, calculated by number of policies (percent)
2003 2004 2005 2006 2007 2008 2009 2010 2011 2012 2013
Lapse rate
Individual 5.7 5.9 5.6 5.8 5.5 6.8 5.7 5.0 4.9 4.7 4.0
Group 8.6 9.1 8.4 7.9 6.6 6.6 10.0 6.7 5.9 5.9 8.4
Credit 6.0 4.5 5.9 5.5 5.4 5.4 10.1 7.9 7.9 7.8 8.1
Surrender rate
Individual 1.3 1.1 1.3 1.1 1.1 1.1 1.2 1.2 1.1 1.1 1.0
Group 0.6 0.2 0.1 0.2 0.1 0.2 0.2 0.1 0.2 0.6 0.1
Credit 11.3 10.8 10.4 18.7 9.3 18.0 10.0 10.7 10.7 11.9 12.2
Combined termination rate
Individual 6.9 7.0 6.9 6.9 6.6 7.9 6.9 6.1 6.1 5.8 5.0
Group 9.2 9.3 8.6 8.0 6.7 6.8 10.2 6.8 6.0 6.4 8.5
Credit 17.4 15.4 16.2 24.1 14.6 23.4 20.1 18.6 18.6 19.7 20.3
Source: ACLItabulationsofNationalAssociationofInsuranceCommissioners(NAIC)data,usedbypermission.Notes: NAICdoesnotendorseanyanalysisorconclusionsbasedonuseofitsdata.DatarepresentU.S.lifeinsurersand,asof2003,fraternalbenefitsocieties.

70 American Council of Life Insurers
Table 7.7new policy claims resisted or compromised (thousands)
2003 2012 2013
Face Face Face amount Percent amount Percent amount Percent
New claims in dispute $266,739 31.8 $323,282 27.9 $435,366 33.8All other claims in dispute 573,053 68.2 836,101 72.1 854,367 66.2
Total claims in dispute 839,792 100.0 1,159,383 100.0 1,289,733 100.0
Amount paid for new claims 20,013 25.0 51,509 32.7 65,943 34.0Amount paid for claims previously resisted 59,882 75.0 105,788 67.3 128,130 66.0
Total amount paid 79,896 100.0 157,297 100.0 194,073 100.0
Amount resisted at year’s end1 424,194 386,964 429,192
Source: ACLItabulationsofNationalAssociationofInsuranceCommissioners(NAIC)data,usedbypermission.Notes: NAICdoesnotendorseanyanalysisorconclusionsbasedonuseofitsdata.DatarepresentU.S.lifeinsurersandfraternalbenefitsocieties.1Notequaltosubtractingtotalamountpaidfromtotalclaimsindispute.Theamountpaidforclaimsdisposedofusuallyvariesfromtheamountclaimed.
Table 7.6life Insurance With disability provisions, 2013
Policiesandcertificatesinthousands/Amountsinmillions
Percent Percent of policies of amount Policies in force Face amount in force
Individual1, 2
Waiver of premium 33,290 23.1 $4,409,222 38.8 Disabilityincome 310 0.2 19,017 0.2 Extendedbenefits‡ 0 0.0 0 0.0 Other 3,187 2.2 37,946 0.3
Total 36,787 25.5 4,466,186 39.3
Group3
Waiver of premium 56,330 49.4 4,246,385 51.7 Disabilityincome 585 0.5 21,002 0.3 Extendedbenefits 1,422 1.2 102,782 1.3 Other 2,108 1.8 233,311 2.8
Total 60,445 53.0 4,603,481 56.0
Credit4
Waiver of premium 6 0.0 272 0.3 Disabilityincome 445 2.7 2,176 2.7 Extendedbenefits 18 0.1 139 0.2Total 470 2.8 2,588 3.2
Source: ACLItabulationsofNationalAssociationofInsuranceCommissioners(NAIC)data,usedbypermission.Notes: NAICdoesnotendorseanyanalysisorconclusionsbasedonuseofitsdata.DatarepresentU.S.lifeinsurers.1Doesnotincludefraternalbenefitsocieties.2Policiesinforcetotaled144million,withafaceamountof$11.4trillion.3Certificatesinforcetotaled114million,withafaceamountof$8.2trillion.4Policiesinforcetotaled17million,withafaceamountof$81billion.‡Lessthan500policiesandlessthan$500,000faceamount.
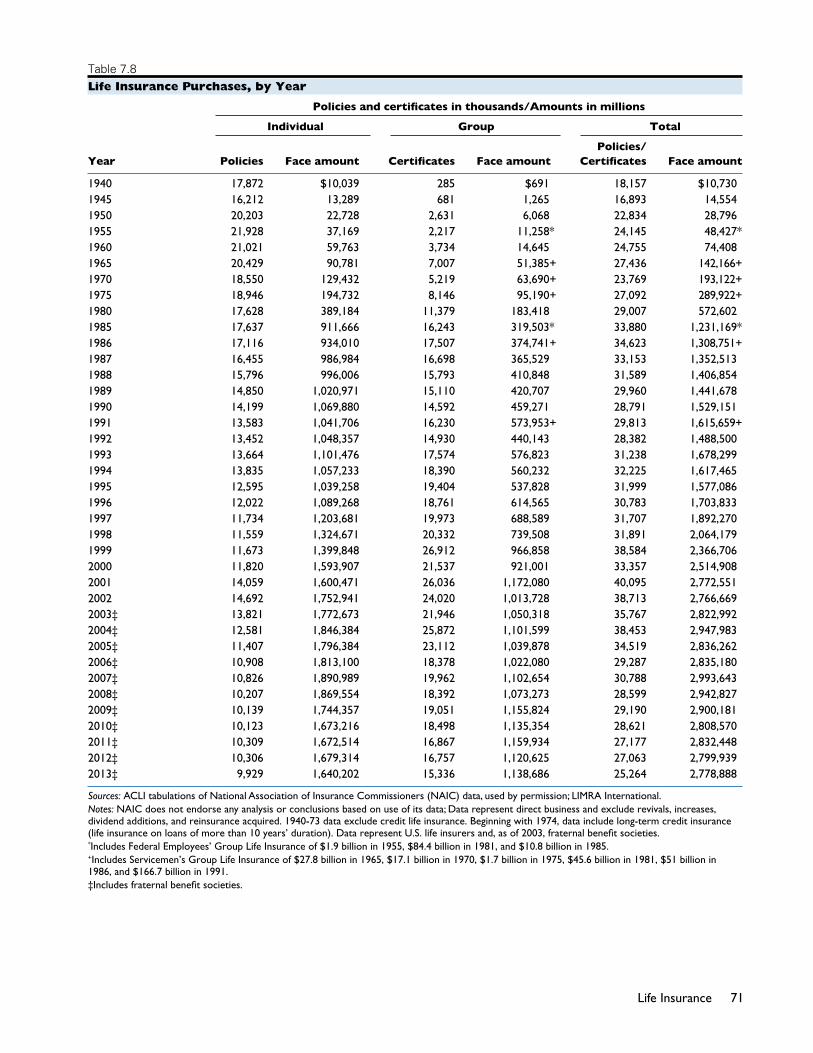
71Life Insurance
Table 7.8life Insurance purchases, by year
Policiesandcertificatesinthousands/Amountsinmillions
Individual Group Total
Policies/ Year Policies Faceamount Certificates Faceamount Certificates Face amount
1940 17,872 $10,039 285 $691 18,157 $10,7301945 16,212 13,289 681 1,265 16,893 14,5541950 20,203 22,728 2,631 6,068 22,834 28,7961955 21,928 37,169 2,217 11,258* 24,145 48,427*1960 21,021 59,763 3,734 14,645 24,755 74,4081965 20,429 90,781 7,007 51,385+ 27,436 142,166+1970 18,550 129,432 5,219 63,690+ 23,769 193,122+1975 18,946 194,732 8,146 95,190+ 27,092 289,922+1980 17,628 389,184 11,379 183,418 29,007 572,6021985 17,637 911,666 16,243 319,503* 33,880 1,231,169*1986 17,116 934,010 17,507 374,741+ 34,623 1,308,751+1987 16,455 986,984 16,698 365,529 33,153 1,352,5131988 15,796 996,006 15,793 410,848 31,589 1,406,8541989 14,850 1,020,971 15,110 420,707 29,960 1,441,6781990 14,199 1,069,880 14,592 459,271 28,791 1,529,1511991 13,583 1,041,706 16,230 573,953+ 29,813 1,615,659+1992 13,452 1,048,357 14,930 440,143 28,382 1,488,5001993 13,664 1,101,476 17,574 576,823 31,238 1,678,2991994 13,835 1,057,233 18,390 560,232 32,225 1,617,4651995 12,595 1,039,258 19,404 537,828 31,999 1,577,0861996 12,022 1,089,268 18,761 614,565 30,783 1,703,8331997 11,734 1,203,681 19,973 688,589 31,707 1,892,2701998 11,559 1,324,671 20,332 739,508 31,891 2,064,1791999 11,673 1,399,848 26,912 966,858 38,584 2,366,7062000 11,820 1,593,907 21,537 921,001 33,357 2,514,9082001 14,059 1,600,471 26,036 1,172,080 40,095 2,772,5512002 14,692 1,752,941 24,020 1,013,728 38,713 2,766,6692003‡ 13,821 1,772,673 21,946 1,050,318 35,767 2,822,9922004‡ 12,581 1,846,384 25,872 1,101,599 38,453 2,947,9832005‡ 11,407 1,796,384 23,112 1,039,878 34,519 2,836,2622006‡ 10,908 1,813,100 18,378 1,022,080 29,287 2,835,1802007‡ 10,826 1,890,989 19,962 1,102,654 30,788 2,993,6432008‡ 10,207 1,869,554 18,392 1,073,273 28,599 2,942,8272009‡ 10,139 1,744,357 19,051 1,155,824 29,190 2,900,1812010‡ 10,123 1,673,216 18,498 1,135,354 28,621 2,808,5702011‡ 10,309 1,672,514 16,867 1,159,934 27,177 2,832,4482012‡ 10,306 1,679,314 16,757 1,120,625 27,063 2,799,9392013‡ 9,929 1,640,202 15,336 1,138,686 25,264 2,778,888
Sources: ACLItabulationsofNationalAssociationofInsuranceCommissioners(NAIC)data,usedbypermission;LIMRAInternational.Notes: NAICdoesnotendorseanyanalysisorconclusionsbasedonuseofitsdata;Datarepresentdirectbusinessandexcluderevivals,increases,dividendadditions,andreinsuranceacquired.1940-73dataexcludecreditlifeinsurance.Beginningwith1974,dataincludelong-termcreditinsurance(lifeinsuranceonloansofmorethan10years’duration).DatarepresentU.S.lifeinsurersand,asof2003,fraternalbenefitsocieties.*IncludesFederalEmployees’GroupLifeInsuranceof$1.9billionin1955,$84.4billionin1981,and$10.8billionin1985.+IncludesServicemen’sGroupLifeInsuranceof$27.8billionin1965,$17.1billionin1970,$1.7billionin1975,$45.6billionin1981,$51billionin1986, and $166.7 billion in 1991.‡Includesfraternalbenefitsocieties.

72 American Council of Life Insurers
Table 7.9life Insurance in force in the united states, by year (millions)
Individual Group Credit Total
Policies/ Year Policies Faceamount Certificates Faceamount Policies1 Faceamount Certificates Faceamount
1900 14 $7,573 — — — — 14 $7,5731905 22 11,863 — — — — 22 11,8631910 29 14,908 — — — — 29 14,9081915 41 20,929 * $100 — — 41 21,0291920 64 38,966 2 1,570 * $4 66 40,5401925 94 65,210 3 4,247 * 18 97 69,4751930 118 96,539 6 9,801 * 73 124 106,4131935 114 88,155 6 10,208 1 101 121 98,4641940 122 100,212 9 14,938 3 380 134 115,5301945 149 129,225 12 22,172 2 365 163 151,7621950 172 182,531 19 47,793 11 3,844 202 234,1681955 192 256,494 32 101,345 28 14,493 252 372,3321960 195 381,444 44 175,903 43 29,101 282 586,4481965 196 539,456 61 308,078 63 53,020 320 900,5541970 197 773,374 80 551,357 78 77,392 355 1,402,1231975 204 1,122,844 96 904,695 80 112,032 380 2,139,5711980 206 1,796,468 118 1,579,355 78 165,215 402 3,541,0381985 186 3,275,539 130 2,561,595 70 215,973 386 6,053,1071990 177 5,391,053 141 3,753,506 71 248,038 389 9,392,5971991 170 5,700,252 141 4,057,606 64 228,478 375 9,986,3361992 168 5,962,783 142 4,240,919 56 202,090 366 10,405,7921993 169 6,448,885 142 4,456,338 52 199,518 363 11,104,7411994 169 6,448,758 145 4,443,179 52 189,398 366 11,081,3351995 166 6,890,386 147 4,604,856 57 201,083 370 11,696,3251996 166 7,425,746 139 5,067,804 50 210,746 355 12,704,2961997 162 7,872,561 142 5,279,042 47 212,255 351 13,363,8581998 160 8,523,258 152 5,735,273 46 212,917 359 14,471,4481999 162 9,172,397 159 6,110,218 46 213,453 367 15,496,0692000 163 9,376,370 156 6,376,127 50 200,770 369 15,953,2672001 166 9,345,723 163 6,765,074 48 178,851 377 16,289,6482002 169 9,311,729 164 6,876,075 42 158,534 375 16,346,3382003‡ 176 9,654,731 163 7,236,191 40 152,739 379 17,043,6612004‡ 168 9,717,377 165 7,630,503 39 160,371 373 17,508,2522005‡ 166 9,969,899 167 8,263,019 40 165,605 373 18,398,5232006‡ 161 10,056,501 177 8,905,646 37 150,289 375 19,112,4362007‡ 158 10,231,765 180 9,157,919 36 149,536 374 19,539,2192008‡ 156 10,254,379 148 8,717,453 31 148,443 335 19,120,2762009‡ 153 10,324,455 113 7,688,328 25 125,512 291 18,138,2952010‡ 152 10,483,516 109 7,830,631 23 111,805 284 18,425,9522011‡ 151 10,993,501 112 8,119,879 23 105,685 286 19,219,0652012‡ 146 11,215,136 106 8,011,839 19 93,940 272 19,320,9162013‡ 144 11,365,441 114 8,214,718 17 81,359 275 19,661,518
Sources: ACLItabulationsofNationalAssociationofInsuranceCommissioners(NAIC)data,usedbypermission;SpectatorYearBook.Notes: NAICdoesnotendorseanyanalysisorconclusionsbasedonuseofitsdata;Datarepresentdirectbusinessforpolicies/certificates andnetbusinessforfaceamounts.Beginningin1959,dataincludeAlaskaandHawaii.1994-97dataforindividualamountandgroupcertificateswererevised.Individualandgroupcategoriesincludecreditlifeinsuranceonloansofmorethan10years’duration;creditcategoryislimitedtolifeinsuranceonloansof10years’orlessduration.Totalsrepresentalllifeinsurance(netofreinsurance)onresidentsoftheUnitedStates,whetherissuedbyU.S.orforeign companies.*Fewerthan500,000.‡Includesfraternalbenefitsocieties. 1Includesgroupcreditcertificates.

8Annuities are financial contracts that pay a steady stream
of income for either a fixed period of time or for the
lifetime of the annuity owner (the annuitant). Most
pension and retirement plan assets held by life insurers
are annuity contracts. Because they can guarantee a
stream of income for life, annuities protect annuity
owners against the possibility of outliving their financial
resources.
Annuities are sold as either immediate annuities or
deferred annuities. Immediate annuities begin making
annuity payments immediately, while deferred annuities
defer the onset of annuity payments until some later date
(typically when the annuity owner retires). During the
deferral or accumulation phase, the annuity owner makes
premium payments into the annuity and the savings
inside the annuity grows to maximize the later annuity
payments back to the annuity owner.
Codification of annual statements, effective for 2001
filings, changed the way certain lines of business are
categorized and reported. This is particularly true of
annuities and deposit-type contracts (e.g., guaranteed
interest contracts or GICs). Prior to 2001, deposit-type
funds were included with annuities; now they are
reported separately. As a result, annuity data prior to
2001 is not comparable with 2001 or later data.
During 2013, payments into annuities, known as
considerations, decreased 17 percent to $307 billion
(Table 8.1), while annuity reserves increased 9 percent
to $3.3 trillion (Table 8.2).
Annuities provide a variety of features designed to
meet different needs. Depending on risk tolerance, an
annuitant can choose a fixed annuity, which provides
stable returns, or a variable annuity which is backed
by equity investments for potentially greater, but
uncertain, returns. A joint and survivor annuity ensures
an income stream as long as either spouse is alive. Under
some options, payouts will continue to a designated
beneficiary after the annuitant’s death.
Group and IndIvIdual annuItIes
Contributions to group annuities, which are sold through
employer-sponsored retirement plans, decreased to $108
billion in 2013, 32 percent lower than in 2012 (Table
8.1). Reserves for this type of annuity accounted for
nearly one-third of all annuity reserves by the end of
2013 (31%), or $1 trillion (Table 8.2). Benefit payments to
group annuitants increased to $28 billion, up 15 percent
from 2012 (Table 8.3).
Employer-sponsored retirement plans are divided
between two types that differ according to their benefits
structure. Defined benefit plans provide a specified
monthly benefit during retirement. The benefit amount
is usually based on an employee’s salary and length of
service. The employer funds such plans and bears the
entire investment risk.
Profit-sharing, 401(k), 403(b), and 457 plans are defined
contribution plans. Rather than specifying benefits
and retirement income, this type of plan specifies
contributions, usually as a fixed amount or a percentage
annuItIes

74 American Council of Life Insurers
of income, where the employee bears the investment
risk. The benefit received under defined contribution
plans is determined by contributions, investment returns,
and expenses. Annuitization of the balance at retirement
is not mandatory, and lump sums have been the most
popular distribution method.
A person can also buy an annuity directly from a life
insurer. During 2013, Americans deposited $180 billion
in individual annuities, down 5 percent from 2012 (Table
8.1). Individual annuity owners received $51 billion in
benefit payments, leaving $2 trillion in individual annuity
reserves at year-end 2013 (Tables 8.2–8.3).
supplementary ContraCts, annuItIes CertaIn, and other annuItIes
A supplementary contract is an agreement between an
insurer and a life insurance policyholder or beneficiary
in which the beneficiary chooses to receive the policy’s
proceeds over a period of time instead of as a lump sum.
If this period is the lifetime of the beneficiary, the contract
is a supplementary contract with life contingencies,
essentially a life annuity; if the payments continue for a
specific period, the contract is called a supplementary
contract without life contingencies, or an annuity certain.
During 2013, $20 billion was deposited into supplementary
contracts without life contingencies and annuities certain,
8 percent less than in 2012 (Table 8.1), and $21 billion
was paid to policyholders or beneficiaries (Table 8.3),
leaving a total reserve of $85 billion at the end of 2013
to back future claims (Table 8.2).
Table 8.1annuity Considerations
Millions Average annual percentage change
2003 2012 2013 2003/2013 2012/2013
Individual annuities1 $165,943 $189,258 $179,578 0.8 -5.1 Group annuities 102,614 158,837 108,091 0.5 -31.9
Annuities certain and supplementary contracts without life contingencies 21,811 21,340 19,591 -1.1 -8.2
Total 290,369 369,435 307,260 0.6 -16.8
Source: ACLI tabulations of National Association of Insurance Commissioners (NAIC) data, used by permission.Notes: NAIC does not endorse any analysis or conclusions based on use of its data. Data represent U.S. life insurers and, as of 2003, fraternal benefit societies.1Includes supplementary contracts with life contingencies.

75Annuities
Table 8.2reserves for annuity Contracts
Millions Average annual percentage change
2003 2012 2013 2003/2013 2012/2013
Individual annuities1 $1,187,938 $1,961,770 $2,157,576 6.1 10.0 Group annuities 662,474 958,095 1,028,738 4.5 7.4
Annuities certain and supplementary contracts without life contingencies 49,582 83,820 85,031 5.5 1.4
Total 1,899,994 3,003,685 3,271,345 5.6 8.9
Source: ACLI tabulations of National Association of Insurance Commissioners (NAIC) data, used by permission.Notes: NAIC does not endorse any analysis or conclusions based on use of its data. Data represent U.S. life insurers and, as of 2003, fraternal benefit societies.1Includes supplementary contracts with life contingencies.
Table 8.3annuity Benefit payments
Millions Average annual percentage change
2003 2012 2013 2003/2013 2012/2013
Individual annuities1 $32,367 $49,472 $50,515 4.6 2.1 Group annuities 24,743 24,567 28,236 1.3 14.9
Annuities certain and supplementary contracts without life contingencies 20,347 22,842 21,476 0.5 -6.0
Total 77,457 96,881 100,227 2.6 3.5
Source: ACLI tabulations of National Association of Insurance Commissioners (NAIC) data, used by permission.Notes: NAIC does not endorse any analysis or conclusions based on use of its data. Data represent U.S. life insurers and, as of 2003, fraternal benefit societies.1Includes supplementary contracts with life contingencies.

76 American Council of Life Insurers
Table 8.4annuity Considerations, by year (millions)
Year Individual1 Group2 Other3 Total
1977 $4,552 $10,422 NA $14,9741978 4,454 11,885 NA 16,3391979 4,976 12,963 NA 17,9391980 6,296 16,133 NA 22,4291981 10,290 17,289 NA 27,5791982 15,196 19,448 NA 34,6441983 14,003 16,541 NA 30,5441984 15,706 27,153 NA 42,8591985 20,891 33,008 NA 53,8991986 26,117 57,595 NA 83,7121987 33,764 54,913 NA 88,6771988 43,784 59,494 NA 103,2781989 49,407 65,590 NA 114,9971990 53,665 75,399 NA 129,0641991 51,671 71,919 NA 123,5901992 61,348 71,297 NA 132,6451993 76,987 79,458 NA 156,4451994 80,832 73,017 NA 153,8491995 77,370 82,565 NA 159,9351996 84,067 92,228 NA 176,2951997 90,192 107,355 NA 197,5471998 95,446 134,047 NA 229,4931999 115,621 154,591 NA 270,2122000 143,071 163,622 NA 306,69320014 141,656 109,599 $22,675 273,93020024 168,428 100,861 22,608 291,89720034 165,943 102,614 21,811 290,36920044 172,140 104,537 24,352 301,02920054 167,032 110,084 25,479 302,59620064 187,083 115,645 26,344 329,07120074 192,503 121,722 27,119 341,34420084 208,965 119,169 26,842 354,97620094 128,853 102,727 24,053 255,63320104 189,946 103,677 27,372 320,99520114 217,837 117,058 24,247 359,14220124 189,258 158,837 21,340 369,43520134 179,578 108,091 19,591 307,260
Source: ACLI tabulations of National Association of Insurance Commissioners (NAIC) data, used by permission.Notes: NAIC does not endorse any analysis or conclusions based on use of its data. Data represent U.S. life insurers and, as of 2003, fraternal benefit societies.NA: Not available1Beginning in 2001, includes supplementary contracts with life contingencies.2Beginning in 1986, data reflect a change in statutory reporting methods mandated by the National Association of Insurance Commissioners.3Includes supplementary contracts without life contingencies, annuities certain, lottery payouts, structured settlements, and income payment options.4Codification effective with 2001 Annual Statement filings changed the way certain lines of business are categorized and reported, particularly deposit-type contracts. Since most guaranteed interest contracts (GICs) and other deposit-type funds are under group contracts, this accounting change has had a substantial effect on group annuities.

77Annuities
Table 8.5annuity reserves, by year
Year Reserves (millions) Year Reserves (millions)
1960 $18,8501965 27,3501970 41,1751975 72,2101980 166,8501981 193,2101982 233,7901983 269,4251984 313,2151985 373,4751986 441,3901987 495,4201988 562,1551989 624,2901990 695,700 1991 745,9501992 768,2151993 825,3751994 878,460
1995 $972,5601996 1,312,4941997 1,454,9621998 1,608,4941999 1,780,6992000 1,819,68020011 1,585,00820021 1,619,07520031 1,899,99420041 2,105,88220051 2,258,24020061 2,415,15820071 2,548,49020081 2,223,44120091 2,512,33420101 2,739,68620111 2,810,71720121 3,003,68520131 3,271,345
Source: ACLI tabulations of National Association of Insurance Commissioners (NAIC) data, used by permission.Notes: NAIC does not endorse any analysis or conclusions based on use of its data. Data represent U.S. life insurers and, as of 2003, fraternal benefit societies.1Codification effective with 2001 Annual Statement filings changed the way certain lines of business are categorized and reported, particularly deposit-type contracts. Since most guaranteed interest contracts (GICs) and other deposit-type funds are under group contracts, this accounting change has had a substantial effect on group annuities.

78 American Council of Life Insurers

9Disability income insurance and long-term care insurance
provide important financial protection for American
families. Disability income insurance serves as paycheck
protection for workers by replacing a portion of earnings
if an insured employee is unable to work due to accident
or illness. Long-term care insurance protects retirement
savings and alleviates financial hardships that might
otherwise impoverish a family paying for long-term
care needs.
Disability income insurance
Prolonged unemployment due to disability can
jeopardize a worker’s lifestyle and savings for retirement.
The risk of becoming disabled is significant: According
to the U.S. Census Bureau, nearly 17 percent of working-
age Americans reported a disability in 2010. Of those
with a disability 41% were employed compared to the
79 percent of working-age Americans with no disability.
Disability income policies commonly provide 50 to 70
percent of an insured’s pre-disability income while an
insured employee is unable to work due to accident or
illness. In addition to choices in benefits and elimination
periods, some policies provide comprehensive protection
while others define disability more narrowly, covering
only accidental injury or illness. Policies may also include
coverage for partial disability, residual benefits, cost-
of-living adjustments, survivor benefits, and pension
supplements. Many also include benefits to help people
return to work following a disability.
Often insurers will reduce benefits if an employee
is receiving disability payments from other sources.
Workers compensation pays cash benefits to workers
disabled by an on-the-job accident or illness. Because
workers compensation is a state-administered program,
rules governing payment, benefit levels, and length of
coverage vary considerably from state to state. Workers
whose illness or injury is not caused on the job may
be eligible for paid sick leave or state-mandated short-
term disability benefits. The federal disability insurance
program under the Social Security Administration, known
as SSDI, provides cash assistance to people with long-
term disabilities who are unable to work. SSDI’s modest
income support is limited to those who meet a very strict
test of work disability.
Both individual and group disability income insurance
pay benefits as an indemnity—usually weekly or
monthly. Disability income insurance may be offered by
employers, purchased individually, or used to protect a
business. Employers may offer insurance for either short-
or long-term disabilities, or provide comprehensive
disability protection. Some policies reimburse businesses
for expenses associated with disability. Each of these
types of policies is described below.
Individual Disability Income Insurance
Individual disability income policies are sold to the
self-employed, professionals, and to a market of diverse
needs. Some people prefer individual coverage rather
than group coverage because the former is portable.
Workers, whose employers provide only basic coverage,
may buy additional disability insurance through an
Disability income anD lonG-term care insurance
80 American Council of Life Insurers
individual policy. Companies also purchase disability
income insurance to protect or dispose of the business
if a key employee or the owner becomes disabled.
Personal Coverage
Most people buy individual disability income insurance
to protect against long-term disability. Individual policies
typically cover both occupational and non-occupational
accidents and sickness for a selected term. Individual
long-term disability benefits are not subject to income
tax if the policyholder pays the premiums in full. Since
benefits are designed to replace earned income, most
people do not purchase coverage beyond their working
years.
Disability income insurance for individuals is offered
primarily in two forms. Non-cancellable policies give
policyholders the right to continue coverage as long
as premiums are paid on time. The insurer cannot
change the premiums or benefits prior to an age stated
in the policy, usually 65. Insurers also offer guaranteed
renewable policies that can be automatically renewed
with the same benefits. The premium for this type of
policy may be increased only if it is changed for the
entire class of policyholders.
Business Coverage
A small proportion of individual disability income
policies is bought by business owners.
Key-person disability insurance replaces income lost
when an essential employee or owner is unable to
work. Some policies pay benefits directly to the insured
as salary continuation, while others pay benefits to the
business to protect the company from sudden loss of
income, credit, or profits. Another form of protection is
disability buy-sell insurance, which pays benefits to the
business to enable owners to purchase interest in the
company from a disabled partner or owner.
Businesses frequently obtain a disability income policy
to cover business overhead expenses, including wages,
in case the owner becomes disabled. A business also
can purchase reducing term disability insurance to
help cover loan repayments, purchase agreements, or
salary contracts if the owner or key employee becomes
disabled. This type of insurance is in effect for the
length of the loan or other commitment, and coverage
is reduced as the amount due is paid off.
Group Disability Income Insurance
Many disability income policies are offered as part of an
employee group benefit package. Employers purchase
disability coverage from an insurance company or
self-insure the benefits. According to the U.S. Bureau
of Labor Statistics, 39 percent of all workers in private
industry were participating in short-term disability
income insurance in 2013; 32 percent were participating
in long-term disability income insurance.
Short-Term Coverage
Short-term coverage helps protect against loss of income
for employees unable to work because of a temporary
illness or injury. Such sickness and accident plans replace
a portion of earnings for a fixed period of time. Benefits
commonly last 24 weeks, although coverage can range
from 13 to 104 weeks. Short-term disability income
insurance also can offer protection during the waiting
period before a worker becomes eligible for SSDI or
long-term disability coverage.
Disability income insurance pays short-term benefits as
either a percentage of employee earnings or a flat dollar
amount. The most common plans pay a percentage of
earnings, typically replacing from one-half to two-thirds
of pre-disability income. A majority of these plans places
a dollar limit on the weekly or monthly benefit. Benefits
also can vary depending on length of service and other
factors. Most short-term coverage requires a waiting
period, usually one to seven days, before benefits begin.

81Long-Term Care and Disability Income Insurance
Long-Term Coverage
Long-term disability income plans cover both occupational
and non-occupational sickness and accidents. Benefits
typically start when short-term benefits are exhausted
after a waiting period of three to six months following
the onset of disability. These policies generally provide
benefits for persons up to age 65 or Social Security
retirement age. In certain cases, long-term coverage may
provide benefits for life.
Almost all group long-term disability plans coordinate
with Social Security and typically require claimants to
apply for SSDI benefits. Disability insurers frequently
offset benefits payable under private insurance dollar-
for-dollar with SSDI payments. Benefits also are subject
to income tax if the employer pays the premiums; they
are not taxable if the employee pays the premiums.
lonG-term care insurance
Long-term care insurance pays for services to help
policyholders who are unable to perform certain
activities of daily living without assistance—such as
bathing, eating, dressing, using the toilet, and transferring
from bed to chair. This insurance also pays benefits
when the insured person requires supervision due to a
cognitive impairment such as Alzheimer’s disease.
Since the likelihood of chronic illness or disability
increases with age, long-term care insurance traditionally
has been sold to older Americans. However, the younger
the purchaser, the lower the premiums, and within the
last 10 years, group insurance plans have begun covering
working-age people. In 2013, life insurers collected $11
billion in long-term care insurance premiums (NAIC
data).
The market for private long-term care insurance is closely
linked to federal and state government policy. Public
funding for long-term care comes from two main sources.
Medicaid—a joint federal-state program that targets low
income people—is the primary government funding
source for long-term care. To qualify, beneficiaries must
deplete most of their assets and meet a strict income test.
Medicare primarily pays for medically related recovery
and rehabilitation services at home or in a nursing home.
There are two basic types of long-term care insurance:
individual insurance and group. The latter is employer-
sponsored or offered through an association. These
products are considered long-term if the benefit is one
year or longer. Long-term care protection also is available
through life insurance policies that accelerate the death
benefits for individuals with chronic conditions.
Long-term care insurance has evolved in response to
changes in the long-term care delivery system and
consumer preferences. When first sold in 1972, policies
covered only skilled care in a nursing home after a period
of hospitalization. Since the mid-1980s, consumers have
demanded greater choice and more help in maintaining
their quality of life. Insurers now offer policies covering
services that promote independent living including
personal care, assisted living, care management, support
for family caregivers, home modifications, homemaker
services, and hospice, in addition to institutional care.
Coverage for long-term care also varies by how benefits
are paid. Traditional indemnity policies offer a fixed
daily payment to eligible beneficiaries, usually in a
nursing home. Other policies reimburse the insured
for expenses, up to the policy’s daily maximum—for
example, $150 per day for nursing home care or $100
per day for home care. Most reimbursement policies
now pool benefit dollars under more flexible spending
limits, so that a beneficiary can receive payment for either
nursing-home care or home- and community-based
care. A third payment method uses a disability model,
providing a cash benefit when eligibility requirements
are met, regardless of whether the insured actually uses
any long-term care services.

82 American Council of Life Insurers
Individual Long-Term Care Coverage
Individual long-term care insurance can be tailored
to meet financial and lifestyle goals. The policyholder
selects the length of benefit term (one to five years or
a lifetime) and other options such as the amount of
maximum daily benefit, length of elimination period,
level of care, inflation protection, and nonforfeiture
benefits.
Most individual long-term care insurance is offered as
a guaranteed renewable policy—renewable with the
same benefits as long as premiums are paid on time.
Premiums cannot be increased unless they are changed
for the entire class of policyholders. Since long-term care
policies do not build cash value, buying a nonforfeiture
benefit or selecting a policy with contingent nonforfeiture
protection allows the insured to receive benefits upon
surrendering the policy. Some policies offer riders that
return premiums upon the death of the insured.
Group Long-Term Care Coverage
Businesses, some state governments, unions, and
fraternal and other associations such as AARP sponsor
group long-term care insurance. Groups can either
purchase long-term care coverage from an insurance
company or self-insure. Under self-insured plans, the
members of the group, usually employees, assume all
risks and expenses of providing long-term care coverage.
Most employers offering this benefit purchase group
insurance coverage.
Group long-term care insurance typically is offered as a
voluntary benefit for which the employee pays some or
all of the premium. Long-term care insurance purchased
through the workplace also is portable: Employees can
retain coverage in retirement or if they change employers
by paying the entire premium directly to the insurer.
According to the U.S. Bureau of Labor Statistics, 16
percent of all workers in private industry had access to
long-term care insurance at work in 2013.
accelerateD benefits
To help pay long-term care costs, certain life insurance
policies allow the policyholder to access benefits prior
to death. Circumstances that can trigger these accelerated
benefits include diagnosis of a terminal illness or a
medical condition that would drastically shorten the
policyholder’s life span, the need for long-term care, or
permanent confinement in a nursing home. Accelerated
benefit provisions may be integrated in the policy or
more typically attached as a rider.
10The life insurance industry is integral to the economies of
all 50 states and the District of Columbia. In 2013, 833 life
insurers were domiciled in the United States, and another
17 were domiciled in U.S. territories (Table 10.1). The
companies’ investments contribute to state economies as
Americans and their families achieve financial security
through life insurance products.
Billions of dollars of life insurance coverage is purchased
in each state every year, ranging from $298 billion in
California to $4 billion in Vermont in 2013 (Table 10.2).
Total life insurance in force ranged from $3.3 trillion in
California to $46 billion in Wyoming (Table 10.3).
Payments from life insurers are a mainstay of financial
security for residents in every state. Death payments under
life insurance policies were greatest in California ($8.1
billion) and Texas ($5.7 billion) during 2013 (Table 10.4).
Life insurance beneficiaries in 11 other states received
payments totaling over $2 billion, and 16 states had death
payments between $1 billion and $2 billion. Table 10.5
breaks down death payments among individual, group,
and credit policies.
Annuity payments are another source of financial security
provided by life insurers nationwide. In 2013, payments
from annuities totaled $8.6 billion in California followed
by $6.8 billion in New York (Table 10.4). Residents of
22 other states received annuity payments totaling more
than $1 billion.
Table 10.6 reports the distribution of premium receipts by
state in 2013 across the various product lines offered by
life insurers—life insurance, annuities, health insurance,
and deposit-type funds. The greatest premium amounts
for life insurance, health insurance, and annuities were
collected in California ($58 billion) and New York ($45
billion).
Life insurers are a significant source of investment capital
in each state, particularly through real estate loans. U.S. life
insurers held $361 billion in domestic mortgages in 2013.
Mortgage holdings ranged from $93 million in Vermont
to $77 billion in California (Table 10.7). Life insurers also
directly own real estate across the country—$31 billion
worth in 2013 (Table 10.8). California and Texas had the
most real estate owned by life insurers, with $6.8 billion
and $2.2 billion, respectively.
IN THE STATES

84 American Council of Life Insurers
Table 10.1Life Insurers, by State of Domicile, 2013
Alabama 10 Nebraska 28Alaska - Nevada 1Arizona 29 New Hampshire 2Arkansas 22 New Jersey 6California 12 New Mexico 1Colorado 10 New York 87Connecticut 26 North Carolina 3Delaware 27 North Dakota 4District of Columbia 1 Ohio 40Florida 11 Oklahoma 23Georgia 15 Oregon 2Hawaii 3 Pennsylvania 33Idaho 1 Rhode Island 1Illinois 59 South Carolina 12Indiana 25 South Dakota 3Iowa 28 Tennessee 9Kansas 12 Texas 113Kentucky 7 Utah 12Louisiana 26 Vermont 3Maine 1 Virginia 4Maryland 3 Washington 8Massachusetts 16 West Virginia - Michigan 21 Wisconsin 24Minnesota 14 Wyoming 1Mississippi 11 Total U.S. 833Missouri 22 Montana 1 Guam 3 Puerto Rico 14
Aggregate total 850
Source: ACLI tabulations of National Association of Insurance Commissioners (NAIC) data, used by permission.Notes: NAIC does not endorse any analysis or conclusions based on use of its data. Data represent U.S. life insurers and fraternal benefit societies.

85In the States
Table 10.2Life Insurance Purchases, by State, 2013 (face amount in millions)
Individual Group Credit Total
Alabama $23,948 $12,678 $1,208 $37,834Alaska 3,046 2,314 22 5,382Arizona 28,029 20,749 307 49,085Arkansas 11,381 6,165 350 17,896California 203,692 93,815 811 298,318Colorado 32,560 17,127 219 49,906Connecticut 26,681 18,858 323 45,862Delaware 6,528 6,354 63 12,945District of Columbia 4,585 14,921 50 19,556Florida 93,138 56,999 2,859 152,996Georgia 52,860 48,934 3,513 105,307Hawaii 7,181 1,628 231 9,040Idaho 7,434 1,944 231 9,608Illinois 73,453 47,875 1,742 123,071Indiana 25,659 18,214 839 44,713Iowa 18,301 8,332 695 27,328Kansas 15,223 6,262 503 21,989Kentucky 15,719 12,417 1,272 29,408Louisiana 25,249 14,193 2,112 41,554Maine 3,690 2,295 358 6,342Maryland 33,609 28,126 666 62,401Massachusetts 39,725 47,616 186 87,527Michigan 37,194 32,028 1,854 71,076Minnesota 34,497 25,948 440 60,885Mississippi 13,669 5,130 1,088 19,888Missouri 28,246 22,725 891 51,861Montana 3,856 1,499 135 5,490Nebraska 12,373 9,009 268 21,650Nevada 12,704 5,879 58 18,641New Hampshire 5,870 3,957 544 10,371New Jersey 65,119 31,833 381 97,334New Mexico 5,852 4,951 541 11,345New York 132,792 59,936 1,933 194,661North Carolina 45,555 26,646 2,932 75,134North Dakota 5,128 1,811 300 7,239Ohio 44,728 38,272 1,636 84,636Oklahoma 15,441 13,850 719 30,010Oregon 14,619 13,936 305 28,859Pennsylvania 59,534 51,219 2,246 112,999Rhode Island 5,033 3,428 26 8,486South Carolina 21,198 11,156 2,559 34,913South Dakota 6,511 3,703 158 10,371Tennessee 31,287 24,154 1,836 57,277Texas 129,921 105,990 9,182 245,093Utah 19,579 7,661 776 28,016Vermont 2,386 1,349 154 3,888Virginia 40,796 29,216 1,229 71,241Washington 30,483 20,072 220 50,775West Virginia 5,039 5,390 357 10,786Wisconsin 27,942 22,471 917 51,330Wyoming 3,273 1,511 109 4,894Total U.S. 1,612,316 1,072,547 52,353 2,737,216
Other1 32,416 4,902 2,927 40,245
Aggregate total 1,644,731 1,077,449 55,280 2,777,461
Source: ACLI tabulations of National Association of Insurance Commissioners (NAIC) data, used by permission.Notes: NAIC does not endorse any analysis or conclusions based on use of its data. Data represent direct business of U.S. life insurers and fraternal benefit societies.1Includes Puerto Rico, American Samoa, Guam, U.S. Virgin Islands, Canada, N. Mariana Islands and other aggregates.

86 American Council of Life Insurers
Table 10.3Life Insurance in Force, by State, 2013
Thousands of policies/Millions of dollars
Individual Group1 Credit Total Policies Face amount Face amount Policies2 Face amount Face amount
Alabama 5,198 $254,256 $122,426 298 $1,288 $377,970Alaska 172 37,050 22,717 14 94 59,861Arizona 1,728 297,403 169,293 84 819 467,515Arkansas 1,570 117,189 70,683 113 533 188,406California 9,863 2,237,281 1,056,451 358 1,492 3,295,224Colorado 1,855 348,229 181,118 87 479 529,825Connecticut 1,544 350,792 161,589 73 643 513,024Delaware 462 85,853 97,231 20 132 183,216District of Columbia 277 42,184 129,023 20 100 171,307Florida 7,056 1,022,640 539,292 611 3,281 1,565,213Georgia 5,045 582,431 363,390 970 2,732 948,554Hawaii 562 84,346 37,730 63 395 122,471Idaho 490 78,269 41,073 63 409 119,750Illinois 6,579 868,965 499,654 456 2,274 1,370,892Indiana 3,183 310,124 185,334 302 1,178 496,636Iowa 1,858 210,385 96,523 126 1,046 307,954Kansas 1,490 177,062 92,619 119 842 270,524Kentucky 2,192 176,354 132,542 387 1,417 310,312Louisiana 3,869 250,285 140,824 636 2,766 393,875Maine 478 56,394 48,294 62 519 105,207Maryland 3,917 395,919 242,737 309 1,206 639,863Massachusetts 2,561 525,822 294,694 94 474 820,990Michigan 3,983 465,222 341,197 401 2,702 809,121Minnesota 2,622 422,554 235,670 124 1,249 659,473Mississippi 1,980 135,236 69,335 329 1,266 205,837Missouri 3,020 323,571 209,802 233 1,395 534,768Montana 352 46,366 21,524 32 212 68,102
Continued

87In the States
Table 10.3Life Insurance in Force, by State, 2013—continued
Thousands of policies/Millions of dollars
Individual Group1 Credit Total Policies Face amount Face amount Policies2 Face amount Face amount
Nebraska 1,078 135,311 73,063 63 407 208,781Nevada 681 124,565 56,471 36 155 181,191New Hampshire 530 83,903 42,003 107 960 126,866New Jersey 3,800 798,253 533,576 123 903 1,332,732New Mexico 635 69,048 77,234 124 966 147,248New York 7,881 1,484,064 673,243 592 4,107 2,161,414North Carolina 5,464 546,072 358,850 553 2,419 907,340North Dakota 394 47,285 20,398 50 546 68,228Ohio 5,906 587,520 378,710 318 2,303 968,533Oklahoma 1,472 158,544 100,150 158 1,103 259,797Oregon 1,065 178,050 100,991 119 582 279,622Pennsylvania 6,994 763,786 482,662 500 3,484 1,249,932Rhode Island 400 65,544 47,717 14 92 113,353South Carolina 3,124 228,236 134,373 805 1,958 364,567South Dakota 502 70,485 22,945 39 296 93,726Tennessee 3,551 349,226 239,835 402 2,192 591,253Texas 10,335 1,298,655 871,423 1,605 13,447 2,183,526Utah 780 183,153 83,617 229 1,343 268,113Vermont 274 32,287 17,794 26 214 50,295Virginia 4,103 490,864 399,125 314 1,951 891,940Washington 1,824 348,880 239,613 99 583 589,076West Virginia 934 55,453 52,233 75 545 108,231Wisconsin 3,049 345,919 190,133 201 1,188 537,239Wyoming 224 30,803 15,475 18 161 46,440
Total U.S. 138,904 18,378,085 10,814,400 12,955 72,845 29,265,330
Other3 5,207 295,369 68,744 3,730 20,885 384,998
Aggregate total 144,111 18,673,454 10,883,144 16,685 93,730 29,650,328
Source: ACLI tabulations of National Association of Insurance Commissioners (NAIC) data, used by permission.Notes: NAIC does not endorse any analysis or conclusions based on use of its data. Credit category is limited to life insurance on loans of 10 years or less duration. Ordinary and group categories include credit life insurance on loans of more than 10 years duration. Data represent direct business of U.S. life insurers and fraternal benefit societies.1Omits policies due to double counting.2Includes group credit certificates.3Includes Puerto Rico, American Samoa, Guam, U.S. Virgin Islands, Canada, N. Mariana Islands and other aggregates.

88 American Council of Life Insurers
Table 10.4Life Insurance and Annuity Benefit Payments, by State, 2013 (thousands)
Policy and contract Death Annuity Surrender Other dividends payments payments1 values payments2 Total
Alabama $197,213 $1,491,118 $864,108 $3,038,079 $24,329 $5,614,847Alaska 24,177 253,266 109,088 456,019 1,741 844,292Arizona 264,499 1,768,941 1,707,935 4,986,902 27,201 8,755,478Arkansas 114,518 773,392 487,166 1,572,907 9,341 2,957,324California 1,493,877 8,191,059 8,550,381 27,043,319 145,950 45,424,585Colorado 291,283 1,188,237 1,217,911 4,877,742 21,940 7,597,113Connecticut 396,949 1,520,067 2,485,653 11,433,383 21,717 15,857,769Delaware 62,788 808,159 891,887 3,217,718 8,148 4,988,701District of Columbia 55,272 266,909 193,220 1,352,932 156,728 2,025,060Florida 1,020,566 5,599,901 5,545,131 18,600,090 109,696 30,875,385Georgia 482,021 2,901,469 1,478,485 6,293,564 43,154 11,198,693Hawaii 86,555 353,850 423,608 1,477,255 8,822 2,350,091Idaho 77,055 373,493 340,987 939,490 6,812 1,737,838Illinois 1,027,132 3,687,499 3,775,941 11,386,337 44,496 19,921,405Indiana 417,380 1,641,695 1,633,858 5,095,314 45,222 8,833,469Iowa 335,405 1,123,503 974,576 3,734,337 23,710 6,191,531Kansas 198,685 1,010,308 632,224 2,619,621 15,514 4,476,353Kentucky 199,770 1,178,701 819,891 2,882,356 50,943 5,131,661Louisiana 206,380 1,252,302 848,805 3,644,004 23,478 5,974,969Maine 92,015 370,332 327,298 1,083,065 10,592 1,883,303Maryland 394,938 1,884,902 1,619,312 5,067,341 33,252 8,999,745Massachusetts 654,165 1,805,742 2,513,727 11,874,864 41,024 16,889,522Michigan 615,089 2,655,860 3,728,838 9,660,821 52,900 16,713,508Minnesota 424,528 2,602,433 1,430,405 5,903,344 35,930 10,396,640Mississippi 89,296 773,538 350,847 1,546,705 11,864 2,772,250Missouri 342,184 1,730,747 1,513,485 5,956,107 41,413 9,583,936Montana 60,033 241,497 215,566 594,599 4,846 1,116,542
Continued
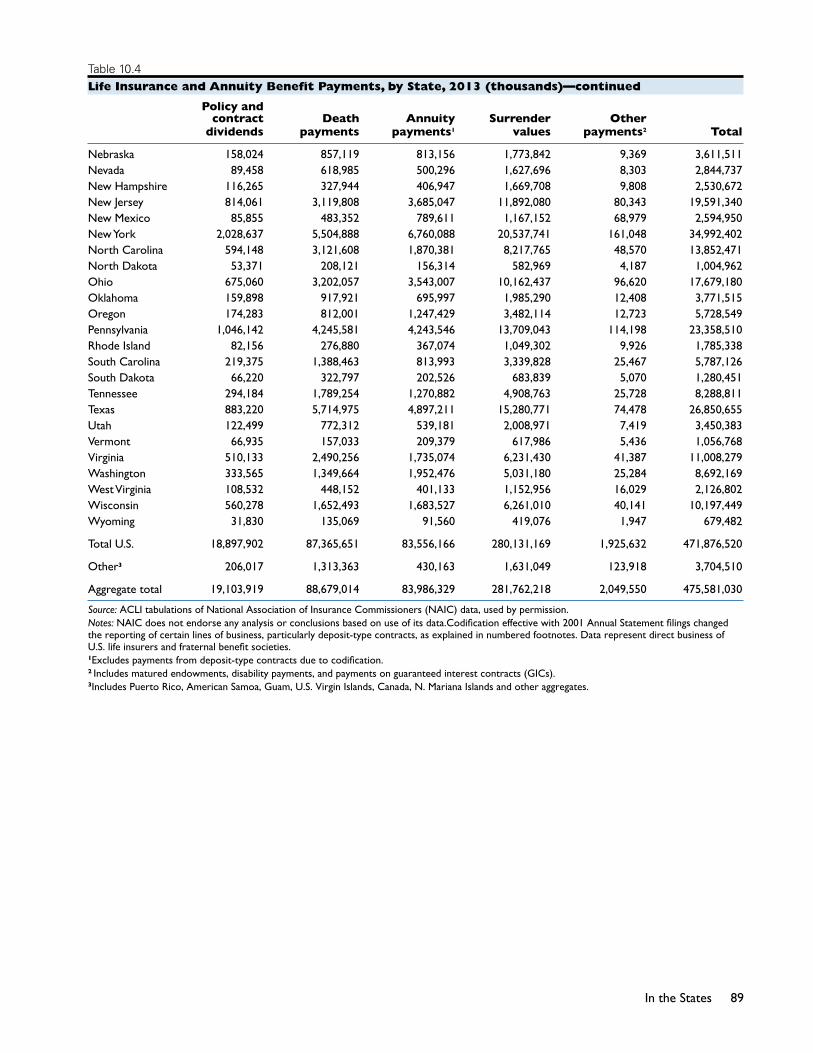
89In the States
Table 10.4Life Insurance and Annuity Benefit Payments, by State, 2013 (thousands)—continued
Policy and contract Death Annuity Surrender Other dividends payments payments1 values payments2 Total
Nebraska 158,024 857,119 813,156 1,773,842 9,369 3,611,511Nevada 89,458 618,985 500,296 1,627,696 8,303 2,844,737New Hampshire 116,265 327,944 406,947 1,669,708 9,808 2,530,672New Jersey 814,061 3,119,808 3,685,047 11,892,080 80,343 19,591,340New Mexico 85,855 483,352 789,611 1,167,152 68,979 2,594,950New York 2,028,637 5,504,888 6,760,088 20,537,741 161,048 34,992,402North Carolina 594,148 3,121,608 1,870,381 8,217,765 48,570 13,852,471North Dakota 53,371 208,121 156,314 582,969 4,187 1,004,962Ohio 675,060 3,202,057 3,543,007 10,162,437 96,620 17,679,180Oklahoma 159,898 917,921 695,997 1,985,290 12,408 3,771,515Oregon 174,283 812,001 1,247,429 3,482,114 12,723 5,728,549Pennsylvania 1,046,142 4,245,581 4,243,546 13,709,043 114,198 23,358,510Rhode Island 82,156 276,880 367,074 1,049,302 9,926 1,785,338South Carolina 219,375 1,388,463 813,993 3,339,828 25,467 5,787,126South Dakota 66,220 322,797 202,526 683,839 5,070 1,280,451Tennessee 294,184 1,789,254 1,270,882 4,908,763 25,728 8,288,811Texas 883,220 5,714,975 4,897,211 15,280,771 74,478 26,850,655Utah 122,499 772,312 539,181 2,008,971 7,419 3,450,383Vermont 66,935 157,033 209,379 617,986 5,436 1,056,768Virginia 510,133 2,490,256 1,735,074 6,231,430 41,387 11,008,279Washington 333,565 1,349,664 1,952,476 5,031,180 25,284 8,692,169West Virginia 108,532 448,152 401,133 1,152,956 16,029 2,126,802Wisconsin 560,278 1,652,493 1,683,527 6,261,010 40,141 10,197,449Wyoming 31,830 135,069 91,560 419,076 1,947 679,482
Total U.S. 18,897,902 87,365,651 83,556,166 280,131,169 1,925,632 471,876,520
Other3 206,017 1,313,363 430,163 1,631,049 123,918 3,704,510
Aggregate total 19,103,919 88,679,014 83,986,329 281,762,218 2,049,550 475,581,030
Source: ACLI tabulations of National Association of Insurance Commissioners (NAIC) data, used by permission.Notes: NAIC does not endorse any analysis or conclusions based on use of its data.Codification effective with 2001 Annual Statement filings changed the reporting of certain lines of business, particularly deposit-type contracts, as explained in numbered footnotes. Data represent direct business of U.S. life insurers and fraternal benefit societies.1Excludes payments from deposit-type contracts due to codification.2 Includes matured endowments, disability payments, and payments on guaranteed interest contracts (GICs).3Includes Puerto Rico, American Samoa, Guam, U.S. Virgin Islands, Canada, N. Mariana Islands and other aggregates.

90 American Council of Life Insurers
Table 10.5Payments to Life Insurance Beneficiaries, by State, 2013 (thousands)
Individual Group Credit Total
Alabama $1,017,902 $465,813 $7,403 $1,491,118Alaska 121,484 131,182 600 253,266Arizona 1,022,159 744,749 2,033 1,768,941Arkansas 472,201 297,687 3,504 773,392California 6,326,622 1,858,768 5,669 8,191,059Colorado 826,810 358,867 2,560 1,188,237Connecticut 908,408 609,975 1,684 1,520,067Delaware 438,321 368,947 890 808,159District of Columbia 129,411 137,077 420 266,909Florida 4,134,508 1,446,740 18,654 5,599,901Georgia 2,029,195 857,702 14,572 2,901,469Hawaii 224,285 128,404 1,161 353,850Idaho 219,483 152,027 1,983 373,493Illinois 2,648,898 1,028,063 10,538 3,687,499Indiana 1,102,623 530,838 8,234 1,641,695Iowa 811,033 307,657 4,813 1,123,503Kansas 713,909 292,211 4,188 1,010,308Kentucky 696,044 474,259 8,398 1,178,701Louisiana 887,215 352,931 12,156 1,252,302Maine 201,688 165,718 2,926 370,332Maryland 1,191,729 688,013 5,159 1,884,902Massachusetts 1,306,818 497,333 1,591 1,805,742Michigan 1,783,943 856,937 14,979 2,655,860Minnesota 2,192,402 404,804 5,228 2,602,433Mississippi 537,840 227,816 7,882 773,538Missouri 1,105,206 616,055 9,486 1,730,747Montana 173,147 67,149 1,202 241,497
Continued

91In the States
Table 10.5Payments to Life Insurance Beneficiaries, by State, 2013 (thousands)—continued
Individual Group Credit Total
Nebraska 516,298 338,837 1,983 857,119Nevada 334,944 283,426 614 618,985New Hampshire 232,846 93,092 2,006 327,944New Jersey 2,066,440 1,050,270 3,098 3,119,808New Mexico 284,102 195,501 3,750 483,352New York 4,321,051 1,163,509 20,328 5,504,888North Carolina 2,230,935 875,476 15,197 3,121,608North Dakota 150,920 54,651 2,550 208,121Ohio 2,284,642 905,269 12,146 3,202,057Oklahoma 630,248 281,746 5,928 917,921Oregon 546,162 262,179 3,660 812,001Pennsylvania 2,840,864 1,383,185 21,532 4,245,581Rhode Island 183,799 92,563 518 276,880South Carolina 947,623 429,925 10,915 1,388,463South Dakota 207,330 114,311 1,156 322,797Tennessee 1,193,397 582,576 13,281 1,789,254Texas 3,873,804 1,809,244 31,927 5,714,975Utah 571,344 198,144 2,824 772,312Vermont 113,229 42,953 851 157,033Virginia 1,566,984 914,232 9,039 2,490,256Washington 968,866 376,973 3,824 1,349,664West Virginia 279,639 165,143 3,369 448,152Wisconsin 1,275,996 370,291 6,207 1,652,493Wyoming 100,431 33,986 651 135,069
Total U.S. 60,945,180 26,085,204 335,267 87,365,651
Other1 1,102,015 146,614 64,734 1,313,363
Aggregate total 62,047,195 26,231,818 400,001 88,679,014
Source: ACLI tabulations of National Association of Insurance Commissioners (NAIC) data, used by permission.Notes: NAIC does not endorse any analysis or conclusions based on use of its data. Data represent direct business of U.S. life insurers and fraternal benefit societies.1Includes Puerto Rico, American Samoa, Guam, U.S. Virgin Islands, Canada, N. Mariana Islands and other aggregates.

92 American Council of Life Insurers
Table 10.6Direct Premium Receipts of Life Insurers, by State, 2013 (millions)
Life Annuity Health Deposit-type Total funds1
Alabama $2,104 $3,164 $1,646 $270 $7,184Alaska 338 559 339 24 1,260Arizona 2,114 5,491 3,707 331 11,643Arkansas 1,071 1,707 1,217 102 4,098California 14,744 29,437 14,224 2,372 60,777Colorado 2,327 5,545 3,537 767 12,176Connecticut 2,467 5,952 2,657 8,948 20,024Delaware 1,268 3,835 514 36,800 42,417District of Columbia 396 967 681 196 2,239Florida 8,231 21,343 12,376 1,205 43,155Georgia 4,523 7,369 6,554 600 19,045Hawaii 786 1,612 915 82 3,395Idaho 518 1,130 619 68 2,334Illinois 6,811 13,490 6,279 1,757 28,337Indiana 2,670 5,813 4,296 912 13,690Iowa 1,785 5,502 1,545 8,156 16,987Kansas 1,333 2,699 3,390 1,165 8,587Kentucky 1,554 3,332 3,012 213 8,112Louisiana 2,219 4,113 2,128 250 8,710Maine 439 1,244 933 99 2,715Maryland 2,893 7,003 3,113 710 13,718Massachusetts 3,767 11,597 2,895 1,305 19,564Michigan 4,052 11,350 4,074 1,225 20,701Minnesota 4,318 6,997 1,938 571 13,824Mississippi 1,259 1,641 1,927 93 4,920Missouri 2,710 8,226 3,810 895 15,642Montana 345 665 471 36 1,517Nebraska 1,030 1,970 1,303 391 4,694Nevada 886 1,730 1,132 223 3,970New Hampshire 574 1,939 653 454 3,620New Jersey 5,770 13,799 5,692 2,325 27,586New Mexico 646 1,270 928 76 2,920New York 11,177 26,321 7,947 16,709 62,154North Carolina 4,351 9,377 5,134 1,596 20,459North Dakota 413 804 328 57 1,603Ohio 5,020 11,784 8,415 4,130 29,348Oklahoma 1,380 2,254 1,922 183 5,739Oregon 1,131 3,489 1,884 242 6,746Pennsylvania 6,264 21,146 5,986 3,522 36,918Rhode Island 466 1,291 694 73 2,524South Carolina 1,977 3,860 2,307 170 8,315South Dakota 614 710 456 58 1,837Tennessee 2,779 5,563 3,015 507 11,865Texas 10,508 18,419 16,219 1,628 46,773Utah 1,235 2,388 1,076 169 4,868Vermont 262 638 331 50 1,280Virginia 4,018 7,385 4,756 760 16,919Washington 2,302 5,656 2,899 304 11,160West Virginia 642 1,267 1,391 111 3,411Wisconsin 2,759 6,541 4,476 532 14,308Wyoming 283 454 357 27 1,120
Total U.S. 143,527 321,837 168,097 103,447 736,907
Other2 8,104 2,702 13,277 191 24,274
Aggregate total 151,630 324,539 181,374 103,638 761,182
Source: ACLI tabulations of National Association of Insurance Commissioners (NAIC) data, used by permission.Notes: NAIC does not endorse any analysis or conclusions based on use of its data. Codification effective with 2001 Annual Statement filings changed the reporting of certain lines of business, particularly deposit-type contracts. Data represent direct business of U.S. life insurers and fraternal benefit societies.1Includes guaranteed interest contracts, supplemental contracts and annuities certain, dividend accumulations or refunds, and other deposit funds.2Includes Puerto Rico, American Samoa, Guam, U.S. Virgin Islands, Canada, N. Mariana Islands and other aggregates.

93In the States
Table 10.7Mortgages Owned by Life Insurers, by Type and State, 2013 (thousands)
Farm Non-farm Total
Alabama $639,212 $1,530,355 $2,169,567Alaska 1,301 219,678 220,979Arizona 116,956 7,247,063 7,364,018Arkansas 928,425 396,372 1,324,797California 4,825,879 71,870,774 76,696,653Colorado 212,953 6,763,050 6,976,004Connecticut 1,113 2,734,834 2,735,947Delaware 7,519 853,471 860,991District of Columbia - 10,019,495 10,019,495Florida 989,901 19,368,547 20,358,448Georgia 442,388 11,018,173 11,460,561Hawaii 3,578 1,664,858 1,668,436Idaho 687,614 657,233 1,344,847Illinois 802,718 17,473,497 18,276,215Indiana 560,029 2,921,924 3,481,953Iowa 562,011 968,359 1,530,370Kansas 124,786 1,809,854 1,934,640Kentucky 62,744 1,801,266 1,864,009Louisiana 101,001 963,489 1,064,490Maine 269,194 436,235 705,430Maryland 10,647 10,853,634 10,864,281Massachusetts - 8,539,643 8,539,643Michigan 55,944 4,312,840 4,368,784Minnesota 355,406 5,332,166 5,687,573Mississippi 759,438 632,454 1,391,892Missouri 394,631 3,191,900 3,586,531Montana 234,450 114,222 348,673Nebraska 498,232 1,229,761 1,727,993Nevada 13,464 2,872,179 2,885,642New Hampshire 9,438 584,571 594,010New Jersey 25,147 14,080,589 14,105,737New Mexico 145,776 907,476 1,053,252New York 11,090 30,874,472 30,885,562North Carolina 91,584 7,725,811 7,817,396North Dakota 40,331 185,420 225,751Ohio 181,484 7,108,266 7,289,749Oklahoma 104,535 1,046,368 1,150,903Oregon 677,417 4,915,916 5,593,334Pennsylvania 146,410 8,270,652 8,417,062Rhode Island - 277,851 277,851South Carolina 201,191 2,273,088 2,474,278South Dakota 297,887 100,021 397,908Tennessee 47,899 4,223,936 4,271,835Texas 572,928 32,021,750 32,594,678Utah 20,407 3,495,647 3,516,054Vermont - 93,276 93,276Virginia 141,207 12,485,225 12,626,432Washington 663,424 11,906,601 12,570,025West Virginia 136,670 210,205 346,875Wisconsin 140,394 2,865,870 3,006,264Wyoming 103,750 51,043 154,793
Total U.S. 17,420,503 343,501,384 360,921,888
Other1 689,764 12,104,470 12,794,234
Aggregate total 18,110,267 355,605,854 373,716,122
Source: ACLI tabulations of National Association of Insurance Commissioners (NAIC) data, used by permission.Notes: NAIC does not endorse any analysis or conclusions based on use of its data. Data represent U.S. life insurers and fraternal benefit societies.1Includes U.S. territories and possessions, various/multistate categories and foreign countries.
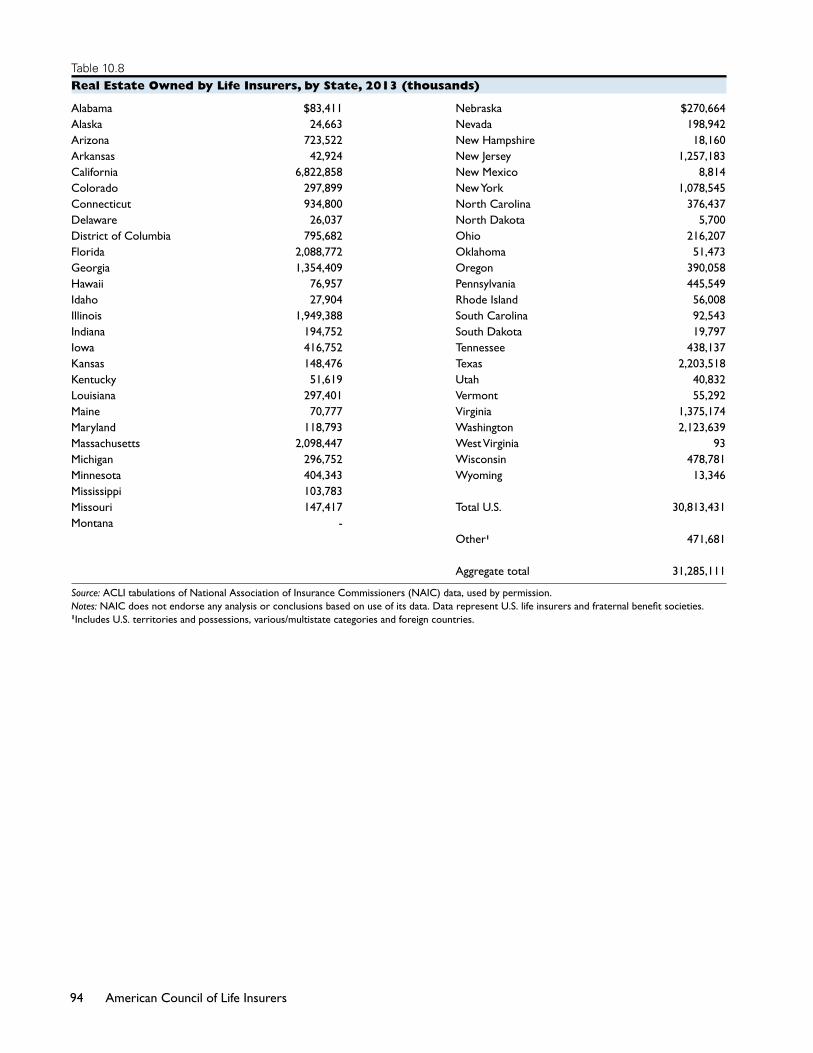
94 American Council of Life Insurers
Table 10.8Real Estate Owned by Life Insurers, by State, 2013 (thousands)
Alabama $83,411 Nebraska $270,664Alaska 24,663 Nevada 198,942Arizona 723,522 New Hampshire 18,160Arkansas 42,924 New Jersey 1,257,183California 6,822,858 New Mexico 8,814Colorado 297,899 New York 1,078,545Connecticut 934,800 North Carolina 376,437Delaware 26,037 North Dakota 5,700District of Columbia 795,682 Ohio 216,207Florida 2,088,772 Oklahoma 51,473Georgia 1,354,409 Oregon 390,058Hawaii 76,957 Pennsylvania 445,549Idaho 27,904 Rhode Island 56,008Illinois 1,949,388 South Carolina 92,543Indiana 194,752 South Dakota 19,797Iowa 416,752 Tennessee 438,137Kansas 148,476 Texas 2,203,518Kentucky 51,619 Utah 40,832Louisiana 297,401 Vermont 55,292Maine 70,777 Virginia 1,375,174Maryland 118,793 Washington 2,123,639Massachusetts 2,098,447 West Virginia 93Michigan 296,752 Wisconsin 478,781Minnesota 404,343 Wyoming 13,346Mississippi 103,783 Missouri 147,417 Total U.S. 30,813,431Montana - Other1 471,681 Aggregate total 31,285,111
Source: ACLI tabulations of National Association of Insurance Commissioners (NAIC) data, used by permission.Notes: NAIC does not endorse any analysis or conclusions based on use of its data. Data represent U.S. life insurers and fraternal benefit societies.1Includes U.S. territories and possessions, various/multistate categories and foreign countries.

11The U.S. life insurance industry in 2013 is made up of 850
companies with sales and operations across the country.
Many of these companies are stand-alone entities, with
no life insurer affiliate or subsidiary operating in the
United States. Others are organized into groups or
fleets of affiliates and subsidiaries. This chapter presents
rankings of the 25 largest life insurance groups (counting
stand-alone companies as a group of one) based on
assets, premiums and annuity considerations, and life
insurance coverage.
INDUSTRY RANKINGS

96 American Council of Life Insurers
Table 11.1Largest Life Insurers, by Total Assets, 2013 (thousands)
MetLife, Inc. $585,386,780
Prudential Financial 531,952,019
Manulife Financial 264,181,879
American International Group 263,529,710
TIAA-CREF 258,109,146
New York Life 252,522,731
Northwestern Mutual 217,172,957
Lincoln Financial 213,168,994
AEGON USA, LLC 198,528,941
Massachusetts Mutual 195,073,535
ING North America 194,620,111
Hartford Life, Inc. 189,498,025
Jackson National 171,983,486
AXA Financial 163,533,188
Principal Financial 143,852,314
Nationwide 127,458,061
Pacific Life 114,388,899
Ameriprise Financial 110,420,928
AFLAC 108,719,140
Allianz 107,297,532
Thrivent Financial For Lutherans 75,629,758
Genworth Financial 69,044,712
State Farm 62,776,163
Athene Group 61,233,284
Guardian 59,991,846
Source: ACLI tabulations of National Association of Insurance Commissioners (NAIC) data, used by permission.Notes: NAIC does not endorse any analysis or conclusions based on use of its data. Group totals represent a collection of life insurers based on organizational structure. Data are as of December 31, 2013.

97Industry Rankings
Table 11.2Largest Life Insurers, by General Account Assets, 2013 (thousands)
MetLife, Inc. $329,626,163
TIAA-CREF 232,092,154
New York Life 209,395,337
Prudential Financial 203,875,491
American International Group 192,471,332
Northwestern Mutual 191,830,051
Massachusetts Mutual 130,595,289
AFLAC 108,513,879
Manulife Financial 107,280,233
Lincoln Financial 93,576,175
AEGON USA, LLC 87,715,500
ING North America 85,928,203
Allianz 76,177,409
Jackson National 63,196,207
State Farm 61,182,117
Athene Group 61,128,118
Principal Financial 59,282,581
Genworth Financial 58,453,155
Thrivent Financial For Lutherans 53,565,113
Pacific Life 53,449,329
Allstate 50,414,532
Sammons Financial 49,231,441
Guardian 47,831,285
AXA Financial 47,521,721
Guggenheim Group 43,566,359
Source: ACLI tabulations of National Association of Insurance Commissioners (NAIC) data, used by permission.Notes: NAIC does not endorse any analysis or conclusions based on use of its data. Group totals represent a collection of life insurers based on organizational structure. Data are as of December 31, 2013.
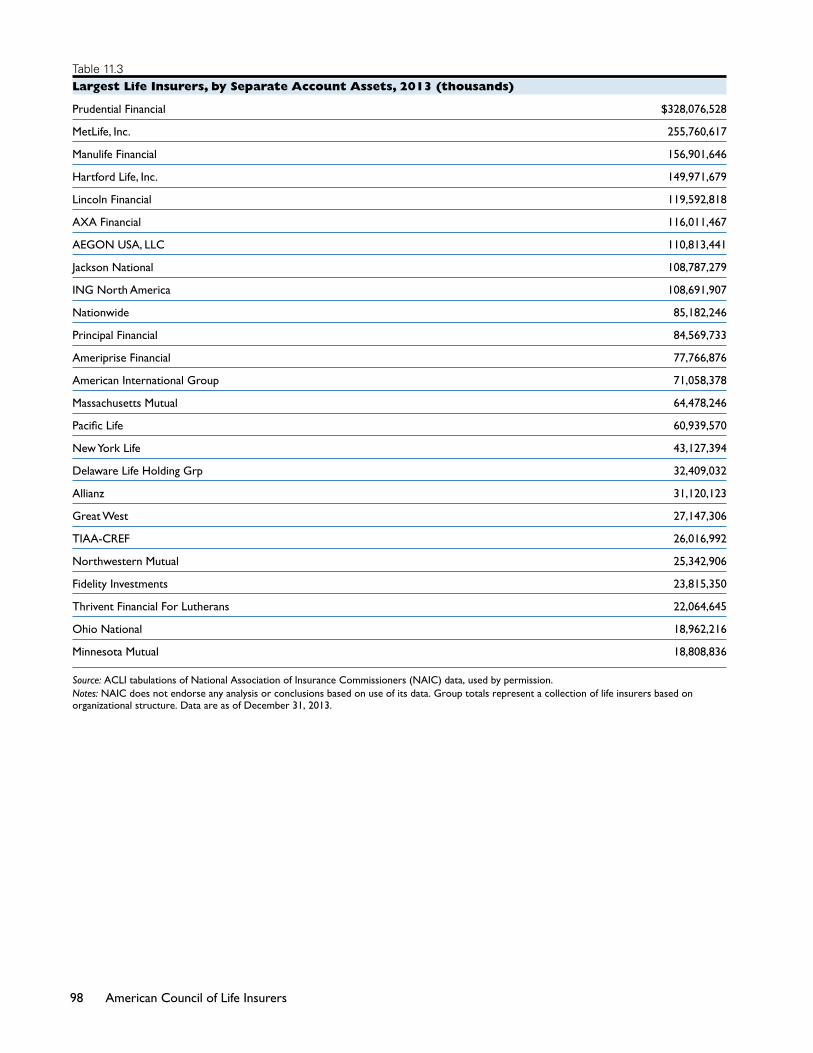
98 American Council of Life Insurers
Table 11.3Largest Life Insurers, by Separate Account Assets, 2013 (thousands)
Prudential Financial $328,076,528
MetLife, Inc. 255,760,617
Manulife Financial 156,901,646
Hartford Life, Inc. 149,971,679
Lincoln Financial 119,592,818
AXA Financial 116,011,467
AEGON USA, LLC 110,813,441
Jackson National 108,787,279
ING North America 108,691,907
Nationwide 85,182,246
Principal Financial 84,569,733
Ameriprise Financial 77,766,876
American International Group 71,058,378
Massachusetts Mutual 64,478,246
Pacific Life 60,939,570
New York Life 43,127,394
Delaware Life Holding Grp 32,409,032
Allianz 31,120,123
Great West 27,147,306
TIAA-CREF 26,016,992
Northwestern Mutual 25,342,906
Fidelity Investments 23,815,350
Thrivent Financial For Lutherans 22,064,645
Ohio National 18,962,216
Minnesota Mutual 18,808,836
Source: ACLI tabulations of National Association of Insurance Commissioners (NAIC) data, used by permission.Notes: NAIC does not endorse any analysis or conclusions based on use of its data. Group totals represent a collection of life insurers based on organizational structure. Data are as of December 31, 2013.

99Industry Rankings
Table 11.4Largest Life Insurers, by Individual Net Life Insurance Premiums, 2013 (thousands)
Northwestern Mutual $12,391,100
Prudential Financial 9,408,616
New York Life 7,473,320
Global Atlantic Financial 5,444,065
AFLAC 4,976,967
Massachusetts Mutual 4,504,501
State Farm 4,242,582
MetLife, Inc. 3,777,562
Lincoln Financial 3,602,444
Guardian 3,476,751
Manulife Financial 2,879,557
American International Group 2,293,359
Pacific Life 2,175,077
Protective Life 2,154,220
AEGON USA, LLC 2,030,589
AXA Financial 1,782,725
Allstate 1,649,146
RGA Group 1,606,296
Sammons Financial 1,514,628
Thrivent Financial For Lutherans 1,492,685
Delaware Life Holding Grp 1,428,057
Swiss Re America 1,348,957
Torchmark 1,329,514
Minnesota Mutual 1,188,423
Western and Southern Financial 1,146,406
Source: ACLI tabulations of National Association of Insurance Commissioners (NAIC) data, used by permission.Notes: NAIC does not endorse any analysis or conclusions based on use of its data. Group totals represent a collection of life insurers based on organizational structure. Data are as of December 31, 2013. Figures are net of reinsurance.

100 American Council of Life Insurers
Table 11.5Largest Life Insurers, by Group Net Life Insurance Premiums, 2013 (thousands)
MetLife, Inc. $5,578,990
Prudential Financial 3,980,769
New York Life 2,047,913
CIGNA 1,566,845
Minnesota Mutual 1,506,351
Massachusetts Mutual 1,057,114
Lincoln Financial 742,170
UNUM 713,366
Nationwide 603,558
Sun Life Assurance 562,483
StanCorp Financial 556,903
Aetna 555,744
Hartford Life, Inc. 525,887
Assurant, Inc. 486,425
Guardian 426,332
Torchmark 422,425
Homesteaders Life Company 376,001
Mutual of Omaha 340,269
Principal Financial 337,150
Wellpoint, Inc. 291,640
HCSC 282,576
NATIONAL GUARDIAN LIFE INS Group 260,375
Forethought Financial 241,591
Liberty Mutual 226,751
AEGON USA, LLC 205,313
Source: ACLI tabulations of National Association of Insurance Commissioners (NAIC) data, used by permission.Notes: NAIC does not endorse any analysis or conclusions based on use of its data. Group totals represent a collection of life insurers based on organizational structure. Data are as of December 31, 2013. Figures are net of reinsurance.
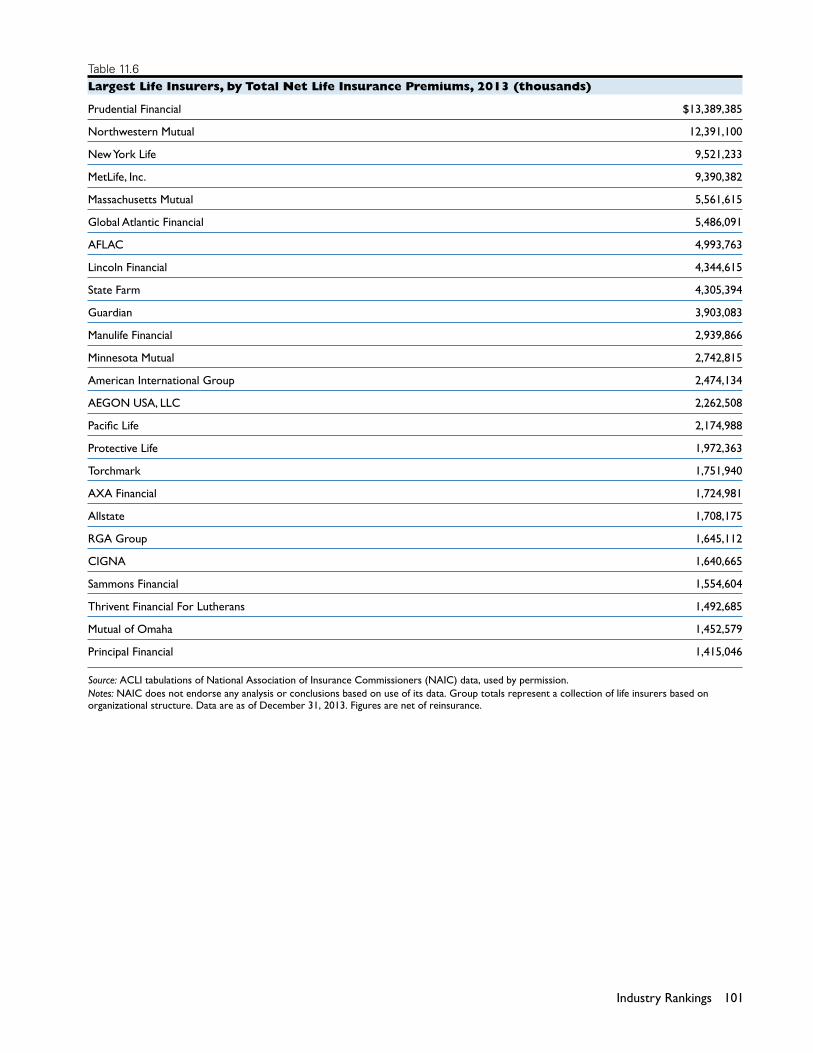
101Industry Rankings
Table 11.6Largest Life Insurers, by Total Net Life Insurance Premiums, 2013 (thousands)
Prudential Financial $13,389,385
Northwestern Mutual 12,391,100
New York Life 9,521,233
MetLife, Inc. 9,390,382
Massachusetts Mutual 5,561,615
Global Atlantic Financial 5,486,091
AFLAC 4,993,763
Lincoln Financial 4,344,615
State Farm 4,305,394
Guardian 3,903,083
Manulife Financial 2,939,866
Minnesota Mutual 2,742,815
American International Group 2,474,134
AEGON USA, LLC 2,262,508
Pacific Life 2,174,988
Protective Life 1,972,363
Torchmark 1,751,940
AXA Financial 1,724,981
Allstate 1,708,175
RGA Group 1,645,112
CIGNA 1,640,665
Sammons Financial 1,554,604
Thrivent Financial For Lutherans 1,492,685
Mutual of Omaha 1,452,579
Principal Financial 1,415,046
Source: ACLI tabulations of National Association of Insurance Commissioners (NAIC) data, used by permission.Notes: NAIC does not endorse any analysis or conclusions based on use of its data. Group totals represent a collection of life insurers based on organizational structure. Data are as of December 31, 2013. Figures are net of reinsurance.
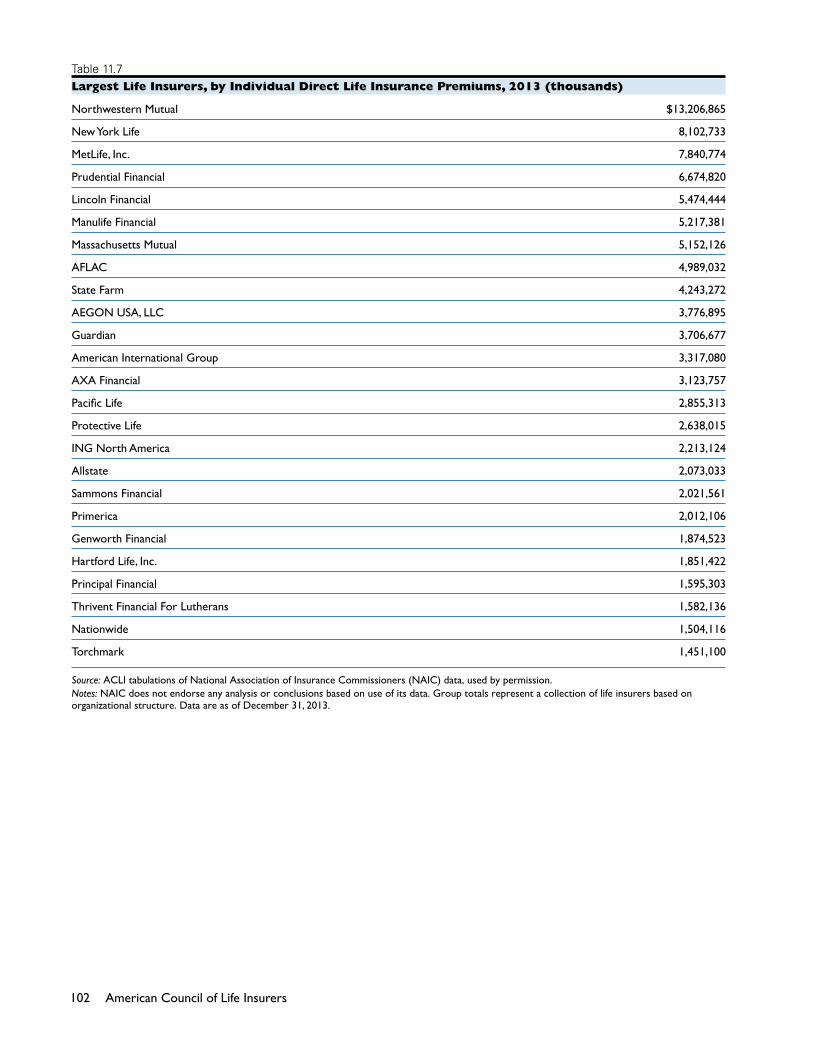
102 American Council of Life Insurers
Table 11.7Largest Life Insurers, by Individual Direct Life Insurance Premiums, 2013 (thousands)
Northwestern Mutual $13,206,865
New York Life 8,102,733
MetLife, Inc. 7,840,774
Prudential Financial 6,674,820
Lincoln Financial 5,474,444
Manulife Financial 5,217,381
Massachusetts Mutual 5,152,126
AFLAC 4,989,032
State Farm 4,243,272
AEGON USA, LLC 3,776,895
Guardian 3,706,677
American International Group 3,317,080
AXA Financial 3,123,757
Pacific Life 2,855,313
Protective Life 2,638,015
ING North America 2,213,124
Allstate 2,073,033
Sammons Financial 2,021,561
Primerica 2,012,106
Genworth Financial 1,874,523
Hartford Life, Inc. 1,851,422
Principal Financial 1,595,303
Thrivent Financial For Lutherans 1,582,136
Nationwide 1,504,116
Torchmark 1,451,100
Source: ACLI tabulations of National Association of Insurance Commissioners (NAIC) data, used by permission.Notes: NAIC does not endorse any analysis or conclusions based on use of its data. Group totals represent a collection of life insurers based on organizational structure. Data are as of December 31, 2013.

103Industry Rankings
Table 11.8Largest Life Insurers, by Group Direct Life Insurance Premiums, 2013 (thousands)
MetLife, Inc. $8,138,752
Prudential Financial 4,661,530
Minnesota Mutual 1,908,303
New York Life 1,685,144
CIGNA 1,623,436
Hartford Life, Inc. 1,273,929
UNUM 1,252,337
Massachusetts Mutual 1,110,897
Aetna 1,024,643
StanCorp Financial 779,446
Lincoln Financial 739,522
Nationwide 622,735
Sun Life Assurance 610,633
Assurant, Inc. 492,222
ING North America 480,921
Tokio Marine Holdings Inc Group 458,858
Torchmark 437,286
Guardian 428,344
Homesteaders Life Company 376,812
Mutual of Omaha 341,486
Principal Financial 340,689
AEGON USA, LLC 301,371
Wellpoint, Inc. 298,749
HCSC 290,396
CUNA Mutual 280,806
Source: ACLI tabulations of National Association of Insurance Commissioners (NAIC) data, used by permission.Notes: NAIC does not endorse any analysis or conclusions based on use of its data. Group totals represent a collection of life insurers based on organizational structure. Data are as of December 31, 2013.
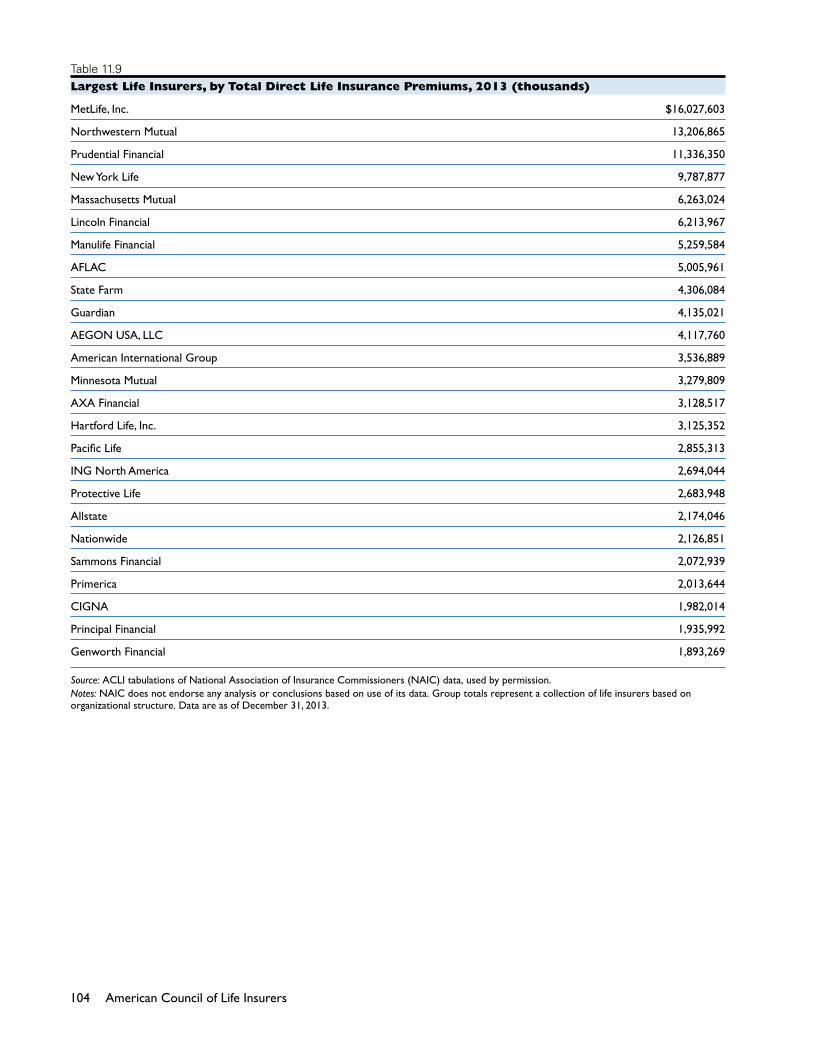
104 American Council of Life Insurers
Table 11.9Largest Life Insurers, by Total Direct Life Insurance Premiums, 2013 (thousands)
MetLife, Inc. $16,027,603
Northwestern Mutual 13,206,865
Prudential Financial 11,336,350
New York Life 9,787,877
Massachusetts Mutual 6,263,024
Lincoln Financial 6,213,967
Manulife Financial 5,259,584
AFLAC 5,005,961
State Farm 4,306,084
Guardian 4,135,021
AEGON USA, LLC 4,117,760
American International Group 3,536,889
Minnesota Mutual 3,279,809
AXA Financial 3,128,517
Hartford Life, Inc. 3,125,352
Pacific Life 2,855,313
ING North America 2,694,044
Protective Life 2,683,948
Allstate 2,174,046
Nationwide 2,126,851
Sammons Financial 2,072,939
Primerica 2,013,644
CIGNA 1,982,014
Principal Financial 1,935,992
Genworth Financial 1,893,269
Source: ACLI tabulations of National Association of Insurance Commissioners (NAIC) data, used by permission.Notes: NAIC does not endorse any analysis or conclusions based on use of its data. Group totals represent a collection of life insurers based on organizational structure. Data are as of December 31, 2013.
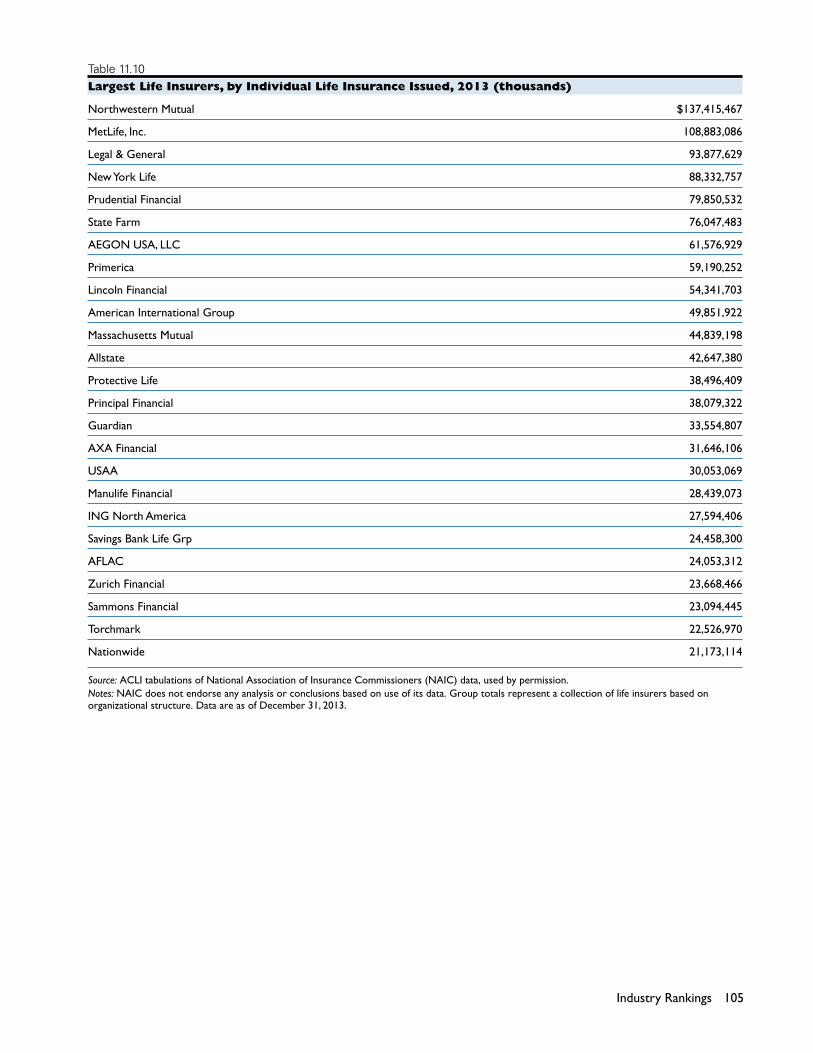
105Industry Rankings
Table 11.10Largest Life Insurers, by Individual Life Insurance Issued, 2013 (thousands)
Northwestern Mutual $137,415,467
MetLife, Inc. 108,883,086
Legal & General 93,877,629
New York Life 88,332,757
Prudential Financial 79,850,532
State Farm 76,047,483
AEGON USA, LLC 61,576,929
Primerica 59,190,252
Lincoln Financial 54,341,703
American International Group 49,851,922
Massachusetts Mutual 44,839,198
Allstate 42,647,380
Protective Life 38,496,409
Principal Financial 38,079,322
Guardian 33,554,807
AXA Financial 31,646,106
USAA 30,053,069
Manulife Financial 28,439,073
ING North America 27,594,406
Savings Bank Life Grp 24,458,300
AFLAC 24,053,312
Zurich Financial 23,668,466
Sammons Financial 23,094,445
Torchmark 22,526,970
Nationwide 21,173,114
Source: ACLI tabulations of National Association of Insurance Commissioners (NAIC) data, used by permission.Notes: NAIC does not endorse any analysis or conclusions based on use of its data. Group totals represent a collection of life insurers based on organizational structure. Data are as of December 31, 2013.

106 American Council of Life Insurers
Table 11.11Largest Life Insurers, by Group Life Insurance Issued, 2013 (thousands)
MetLife, Inc. $200,072,047
Minnesota Mutual 116,518,626
CIGNA 86,550,104
Aetna 71,381,027
UNUM 68,998,128
Sun Life Assurance 68,387,897
Lincoln Financial 60,682,793
Prudential Financial 43,955,246
Tokio Marine Holdings Inc Group 43,930,436
Hartford Life, Inc. 35,168,579
Guardian 34,910,019
StanCorp Financial 34,538,429
Mutual of Omaha 33,607,772
ING North America 32,150,644
Principal Financial 24,719,154
Liberty Mutual 22,737,097
Torchmark 20,335,317
UnitedHealth 14,302,789
Assurant, Inc. 12,999,172
New York Life 9,080,355
HCSC 8,062,758
Automobile Club MI Group 7,752,501
Symetra Financial 6,684,543
Wellpoint, Inc. 6,617,009
Arkansas Blue Cross & Blue Shield 5,768,698
Source: ACLI tabulations of National Association of Insurance Commissioners (NAIC) data, used by permission.Notes: NAIC does not endorse any analysis or conclusions based on use of its data. Group totals represent a collection of life insurers based on organizational structure. Data are as of December 31, 2013.

107Industry Rankings
Table 11.12Largest Life Insurers, by Total Life Insurance Issued, 2013 (thousands)
MetLife, Inc. $309,058,458
Minnesota Mutual 137,895,847
Northwestern Mutual 137,415,467
Prudential Financial 123,805,778
Lincoln Financial 115,024,496
New York Life 97,413,112
Legal & General 93,897,908
CIGNA 86,719,483
UNUM 80,026,454
State Farm 76,172,678
Aetna 71,642,964
Guardian 68,464,826
Sun Life Assurance 68,439,464
AEGON USA, LLC 66,563,955
Principal Financial 62,798,476
ING North America 59,745,050
Primerica 59,190,252
American International Group 53,666,183
Hartford Life, Inc. 49,602,240
Massachusetts Mutual 48,868,621
Mutual of Omaha 45,681,119
Allstate 44,465,017
Tokio Marine Holdings Inc Group 43,934,529
Torchmark 42,862,287
Protective Life 40,148,556
Source: ACLI tabulations of National Association of Insurance Commissioners (NAIC) data, used by permission.Notes: NAIC does not endorse any analysis or conclusions based on use of its data. Group totals represent a collection of life insurers based on organizational structure. Data are as of December 31, 2013.

108 American Council of Life Insurers
Table 11.13Largest Life Insurers, by Individual Life Insurance in Force, 2013 (thousands)
Northwestern Mutual $979,605,050
State Farm 784,236,275
American International Group 701,616,096
New York Life 630,369,130
Swiss Re America 507,299,813
MetLife, Inc. 491,944,951
RGA Group 465,315,286
Berkshire Hathaway 451,680,035
Prudential Financial 404,766,293
AXA Financial 374,751,065
Munich American Holding 330,632,035
Allstate 281,264,631
AEGON USA, LLC 277,002,852
Genworth Financial 262,015,021
Protective Life 191,071,196
Guardian 183,561,586
Lincoln Financial 179,904,042
Massachusetts Mutual 158,714,726
AFLAC 152,014,150
Manulife Financial 145,236,988
Thrivent Financial For Lutherans 133,023,317
Jackson National 130,390,530
USAA 112,835,624
Pacific Life 105,763,019
Torchmark 105,492,457
Source: ACLI tabulations of National Association of Insurance Commissioners (NAIC) data, used by permission.Notes: NAIC does not endorse any analysis or conclusions based on use of its data. Group totals represent a collection of life insurers based on organizational structure. Data are as of December 31, 2013. Amounts exclude reinsurance ceded.

109Industry Rankings
Table 11.14Largest Life Insurers, by Group Life Insurance in Force, 2013 (thousands)
Prudential Financial $1,939,418,005
MetLife, Inc. 1,421,625,308
Minnesota Mutual 630,685,730
CIGNA 526,286,534
New York Life 370,407,110
Lincoln Financial 367,993,791
UNUM 271,495,536
Aetna 262,989,114
Sun Life Assurance 259,027,605
StanCorp Financial 196,342,539
Guardian 180,694,955
Mutual of Omaha 147,838,615
Hartford Life, Inc. 142,810,085
Principal Financial 117,042,673
Liberty Mutual 115,082,706
UnitedHealth 107,008,882
HCSC 97,577,965
Munich American Holding 81,228,532
Wellpoint, Inc. 74,243,930
American International Group 68,652,178
Assurant, Inc. 67,515,444
Arkansas Blue Cross & Blue Shield 53,135,297
Tokio Marine Holdings Inc Group 41,809,089
Great West 40,594,479
Nationwide 39,673,140
Source: ACLI tabulations of National Association of Insurance Commissioners (NAIC) data, used by permission.Notes: NAIC does not endorse any analysis or conclusions based on use of its data. Group totals represent a collection of life insurers based on organizational structure. Data are as of December 31, 2013. Amounts exclude reinsurance ceded.

110 American Council of Life Insurers
Table 11.15Largest Life Insurers, by Total Life Insurance in Force, 2013 (thousands)
Prudential Financial $2,344,184,552
MetLife, Inc. 1,920,329,034
New York Life 1,000,776,240
Northwestern Mutual 980,974,681
State Farm 798,155,729
American International Group 770,271,921
Minnesota Mutual 692,323,282
Lincoln Financial 547,897,833
CIGNA 535,385,925
Swiss Re America 530,185,814
RGA Group 487,024,083
Berkshire Hathaway 481,117,319
Munich American Holding 412,617,232
AXA Financial 375,606,894
Guardian 364,256,541
UNUM 328,541,682
AEGON USA, LLC 298,746,745
Allstate 288,135,410
Sun Life Assurance 273,259,677
Genworth Financial 264,228,267
Aetna 263,859,822
Mutual of Omaha 214,784,942
Massachusetts Mutual 196,644,341
StanCorp Financial 196,374,638
Protective Life 193,589,376
Source: ACLI tabulations of National Association of Insurance Commissioners (NAIC) data, used by permission.Notes: NAIC does not endorse any analysis or conclusions based on use of its data. Group totals represent a collection of life insurers based on organizational structure. Data are as of December 31, 2013. Amounts exclude reinsurance ceded.

111Industry Rankings
Table 11.16Largest Life Insurers, by Individual Net Annuity Considerations, 2013 (thousands)
Jackson National $20,584,280
Lincoln Financial 14,482,338
American International Group 10,719,013
Prudential Financial 10,714,401
Guggenheim Group 9,956,002
MetLife, Inc. 9,882,100
New York Life 8,994,085
Allianz 8,601,964
AEGON USA, LLC 8,472,208
TIAA-CREF 7,106,737
Nationwide 7,035,668
Pacific Life 6,751,059
AXA Financial 6,741,252
Ameriprise Financial 5,394,037
American Financial 3,966,189
American Equity Investment Group 3,888,415
Massachusetts Mutual 3,581,713
Thrivent Financial For Lutherans 3,536,205
Sammons Financial 3,241,756
Genworth Financial 3,147,964
Protective Life 3,022,424
Berkshire Hathaway 2,466,947
Northwestern Mutual 2,384,595
Symetra Financial 2,366,204
Principal Financial 2,257,377
Source: ACLI tabulations of National Association of Insurance Commissioners (NAIC) data, used by permission.Notes: NAIC does not endorse any analysis or conclusions based on use of its data. Group totals represent a collection of life insurers based on organizational structure. Data are as of December 31, 2013. Figures are net of reinsurance and exclude deposit-type funds and supplementary contracts.

112 American Council of Life Insurers
Table 11.17Largest Life Insurers, by Group Net Annuity Considerations, 2013 (thousands)
ING North America $14,372,250
MetLife, Inc. 13,195,544
Massachusetts Mutual 11,124,117
AEGON USA, LLC 10,772,146
Manulife Financial 9,755,479
Prudential Financial 8,425,471
American International Group 7,643,661
TIAA-CREF 5,374,186
Great West 4,753,438
New York Life 4,457,107
Nationwide 3,338,129
Lincoln Financial 2,933,462
Jackson National 2,695,474
OneAmerica Financial 2,555,495
AXA Financial 2,393,200
Minnesota Mutual 1,448,181
StanCorp Financial 1,392,108
Berkshire Hathaway 1,278,266
Mutual of America Life Insurance Company 1,249,647
CUNA Mutual 617,732
Ameritas 606,063
Sammons Financial 549,168
Sentry Insurance Group 476,788
Principal Financial 465,653
Guggenheim Group 400,569
Source: ACLI tabulations of National Association of Insurance Commissioners (NAIC) data, used by permission.Notes: NAIC does not endorse any analysis or conclusions based on use of its data. Group totals represent a collection of life insurers based on organizational structure. Data are as of December 31, 2013. Figures are net of reinsurance and exclude deposit-type funds and supplementary contracts.
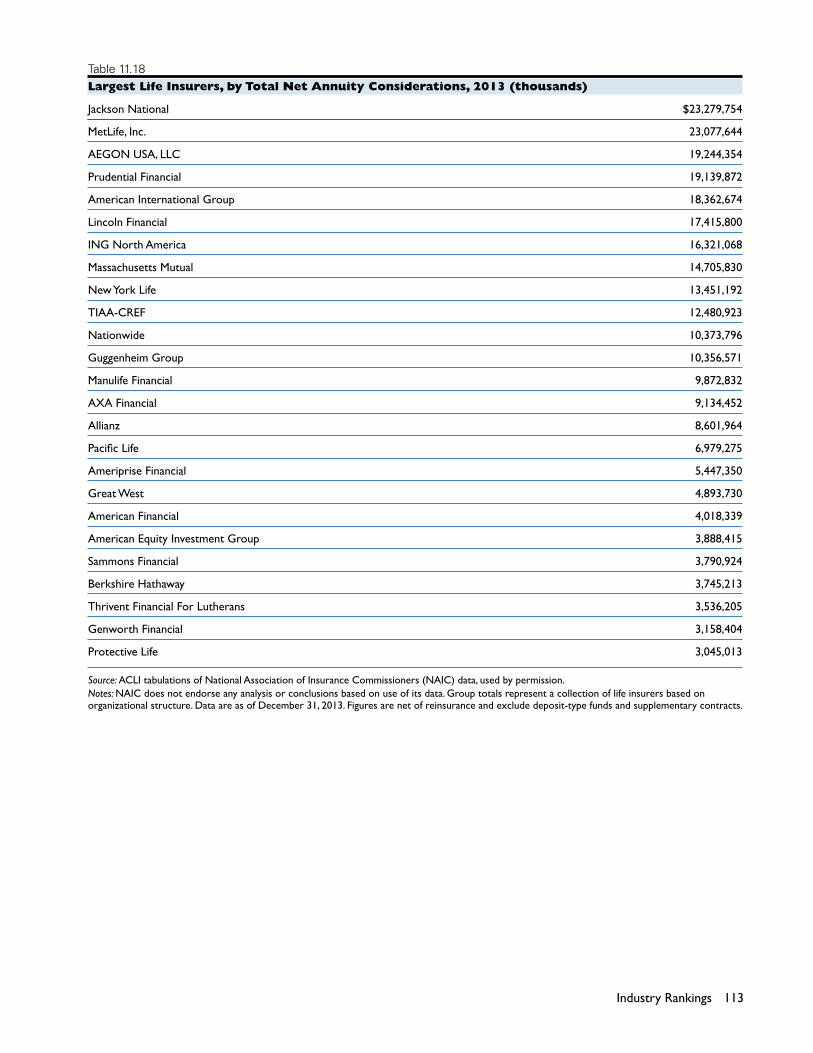
113Industry Rankings
Table 11.18Largest Life Insurers, by Total Net Annuity Considerations, 2013 (thousands)
Jackson National $23,279,754
MetLife, Inc. 23,077,644
AEGON USA, LLC 19,244,354
Prudential Financial 19,139,872
American International Group 18,362,674
Lincoln Financial 17,415,800
ING North America 16,321,068
Massachusetts Mutual 14,705,830
New York Life 13,451,192
TIAA-CREF 12,480,923
Nationwide 10,373,796
Guggenheim Group 10,356,571
Manulife Financial 9,872,832
AXA Financial 9,134,452
Allianz 8,601,964
Pacific Life 6,979,275
Ameriprise Financial 5,447,350
Great West 4,893,730
American Financial 4,018,339
American Equity Investment Group 3,888,415
Sammons Financial 3,790,924
Berkshire Hathaway 3,745,213
Thrivent Financial For Lutherans 3,536,205
Genworth Financial 3,158,404
Protective Life 3,045,013
Source: ACLI tabulations of National Association of Insurance Commissioners (NAIC) data, used by permission.Notes: NAIC does not endorse any analysis or conclusions based on use of its data. Group totals represent a collection of life insurers based on organizational structure. Data are as of December 31, 2013. Figures are net of reinsurance and exclude deposit-type funds and supplementary contracts.

114 American Council of Life Insurers
Table 11.19Largest Life Insurers, by Individual Direct Annuity Considerations, 2013 (thousands)
Jackson National $20,590,973
Lincoln Financial 15,174,058
Prudential Financial 11,580,254
MetLife, Inc. 10,968,397
American International Group 10,333,249
Guggenheim Group 9,248,824
Allianz 9,075,853
New York Life 8,994,085
AEGON USA, LLC 8,542,397
AXA Financial 7,325,014
TIAA-CREF 7,106,737
Nationwide 7,047,252
Pacific Life 7,022,835
Ameriprise Financial 5,394,035
American Equity Investment Group 4,175,119
American Financial 3,966,074
Massachusetts Mutual 3,581,608
Thrivent Financial For Lutherans 3,536,205
Sammons Financial 3,407,555
Athene Group 2,733,935
Protective Life 2,564,513
Ohio National 2,394,186
Northwestern Mutual 2,384,595
Symetra Financial 2,367,077
Principal Financial 2,257,377
Source: ACLI tabulations of National Association of Insurance Commissioners (NAIC) data, used by permission.Notes: NAIC does not endorse any analysis or conclusions based on use of its data. Group totals represent a collection of life insurers based on organizational structure. Data are as of December 31, 2013. Amounts exclude deposit-type funds and supplementary contracts.

115Industry Rankings
Table 11.20Largest Life Insurers, by Group Direct Annuity Considerations, 2013 (thousands)
ING North America $14,545,397
Manulife Financial 14,251,634
MetLife, Inc. 13,196,741
AEGON USA, LLC 10,783,263
Massachusetts Mutual 9,279,497
Prudential Financial 8,304,244
American International Group 7,644,937
TIAA-CREF 5,374,186
Great West 4,751,378
New York Life 4,457,107
Nationwide 3,338,394
Lincoln Financial 2,932,720
AXA Financial 2,715,797
Jackson National 2,695,474
OneAmerica Financial 2,545,037
Hartford Life, Inc. 1,988,081
Minnesota Mutual 1,447,612
StanCorp Financial 1,392,108
Mutual of America Life Insurance Company 1,249,647
CUNA Mutual 934,746
Berkshire Hathaway 806,288
Ameritas 606,063
Sammons Financial 567,987
Sentry Insurance Group 476,788
Guggenheim Group 471,155
Source: ACLI tabulations of National Association of Insurance Commissioners (NAIC) data, used by permission.Notes: NAIC does not endorse any analysis or conclusions based on use of its data. Group totals represent a collection of life insurers based on organizational structure. Data are as of December 31, 2013. Amounts exclude deposit-type funds and supplementary contracts.
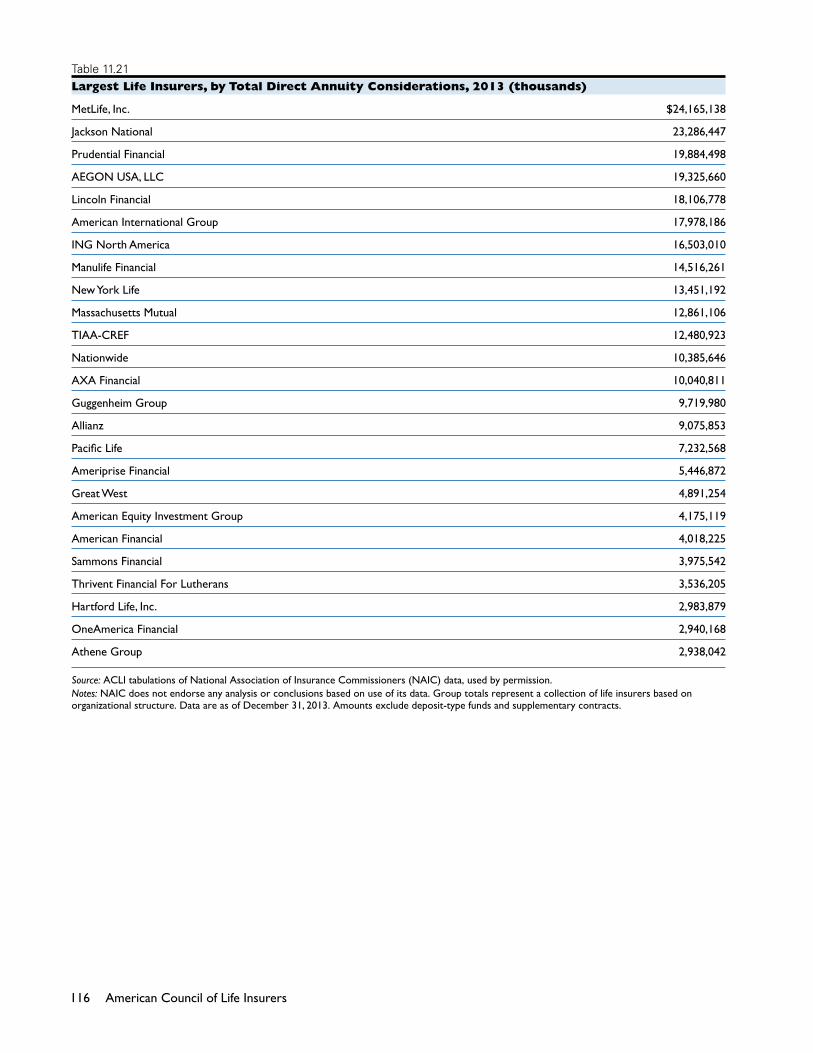
116 American Council of Life Insurers
Table 11.21Largest Life Insurers, by Total Direct Annuity Considerations, 2013 (thousands)
MetLife, Inc. $24,165,138
Jackson National 23,286,447
Prudential Financial 19,884,498
AEGON USA, LLC 19,325,660
Lincoln Financial 18,106,778
American International Group 17,978,186
ING North America 16,503,010
Manulife Financial 14,516,261
New York Life 13,451,192
Massachusetts Mutual 12,861,106
TIAA-CREF 12,480,923
Nationwide 10,385,646
AXA Financial 10,040,811
Guggenheim Group 9,719,980
Allianz 9,075,853
Pacific Life 7,232,568
Ameriprise Financial 5,446,872
Great West 4,891,254
American Equity Investment Group 4,175,119
American Financial 4,018,225
Sammons Financial 3,975,542
Thrivent Financial For Lutherans 3,536,205
Hartford Life, Inc. 2,983,879
OneAmerica Financial 2,940,168
Athene Group 2,938,042
Source: ACLI tabulations of National Association of Insurance Commissioners (NAIC) data, used by permission.Notes: NAIC does not endorse any analysis or conclusions based on use of its data. Group totals represent a collection of life insurers based on organizational structure. Data are as of December 31, 2013. Amounts exclude deposit-type funds and supplementary contracts.

117Industry Rankings
Table 11.22Largest Life Insurers, by Individual Annuity Reserves, 2013 (millions)
MetLife, Inc. $191,986
TIAA-CREF 168,209
Jackson National 126,293
Lincoln Financial 124,633
American International Group 121,901
Prudential Financial 110,231
Allianz 88,984
Ameriprise Financial 85,555
New York Life 77,463
Hartford Life, Inc. 72,720
AEGON USA, LLC 70,693
Pacific Life 69,044
Manulife Financial 59,582
Nationwide 56,669
ING North America 45,345
AXA Financial 43,061
Athene Group 42,513
Thrivent Financial For Lutherans 33,738
Guggenheim Group 31,145
American Equity Investment Group 27,296
Allstate 26,424
Genworth Financial 25,603
Massachusetts Mutual 25,412
Fidelity Investments 23,919
Protective Life 22,293
Source: ACLI tabulations of National Association of Insurance Commissioners (NAIC) data, used by permission.Notes: NAIC does not endorse any analysis or conclusions based on use of its data. Group totals represent a collection of life insurers based on organizational structure. Data are as of December 31, 2013. Amounts exclude deposit-type funds and supplementary contracts.

118 American Council of Life Insurers
Table 11.23Largest Life Insurers, by Group Annuity Reserves, 2013 (millions)
Prudential Financial $138,145
MetLife, Inc. 116,152
ING North America 105,166
Manulife Financial 94,559
AXA Financial 76,408
Massachusetts Mutual 59,756
American International Group 59,599
AEGON USA, LLC 52,098
TIAA-CREF 36,907
Nationwide 36,658
Great West 30,978
Hartford Life, Inc. 24,315
Lincoln Financial 19,950
Delaware Life Holding Grp 18,170
OneAmerica Financial 16,307
Jackson National 15,267
Minnesota Mutual 13,410
New York Life 12,980
StanCorp Financial 8,743
Allstate 7,894
Sammons Financial 7,541
Principal Financial 7,513
Northwestern Mutual 5,355
CUNA Mutual 5,015
Ameritas 4,912
Source: ACLI tabulations of National Association of Insurance Commissioners (NAIC) data, used by permission.Notes: NAIC does not endorse any analysis or conclusions based on use of its data. Group totals represent a collection of life insurers based on organizational structure. Data are as of December 31, 2013. Amounts exclude deposit-type funds and supplementary contracts.

119Industry Rankings
Table 11.24Largest Life Insurers, by Total Annuity Reserves, 2013 (millions)
MetLife, Inc. $308,138
Prudential Financial 248,377
TIAA-CREF 205,116
American International Group 181,500
Manulife Financial 154,141
ING North America 150,510
Lincoln Financial 144,584
Jackson National 141,561
AEGON USA, LLC 122,792
AXA Financial 119,469
Hartford Life, Inc. 97,035
Nationwide 93,327
New York Life 90,443
Allianz 89,003
Ameriprise Financial 87,909
Massachusetts Mutual 85,169
Pacific Life 71,715
Athene Group 45,500
Allstate 34,318
Thrivent Financial For Lutherans 33,738
Great West 33,277
Guggenheim Group 33,153
Principal Financial 27,416
American Equity Investment Group 27,296
Genworth Financial 26,621
Source: ACLI tabulations of National Association of Insurance Commissioners (NAIC) data, used by permission.Notes: NAIC does not endorse any analysis or conclusions based on use of its data. Group totals represent a collection of life insurers based on organizational structure. Data are as of December 31, 2013. Amounts exclude deposit-type funds and supplementary contracts.

120 American Council of Life Insurers

12 MORTALITY AND LIFE EXPECTANCY
U.S. mortality rates and life expectancies have improved
dramatically over the long term. The aggregate, age-
adjusted death rate (per 1,000 population) has fallen
from 17.9 in 1940 to 7.4 in 2011 (Table 12.1). The death
rate among males dropped from 19.8 to 8.8 over this
period, and among females, from 16 to 6.3.
Life expectancy at age 25 is currently 52.5 years for
males and 56.9 years for females (Table 12.2). A man
who retired in 2011 at age 65 could expect to live 17.8
years more on average, while a 65-year-old woman could
expect to live another 20.3 years.
Examining trend data for life expectancy over the past
century yields startling contrasts. A 25-year-old during
1900–02 could expect to live 39.1 years more vs. 54.8
additional years for a 25-year-old in 2011.
Because of increased longevity, the last thirteen years
shown in Table 12.2 have been extended to include
life expectancy for men and women at age 100. This
is consistent with the 2001 Commissioners Standard
Ordinary (CSO) Mortality Table. The 2001 CSO mortality
table was introduced by the Society of Actuaries and
adopted by the National Association of Insurance
Commissioners for life insurers to use in underwriting
insurance (Table 12.3). It is the prevailing mortality table
and has been adopted by most states.

122 American Council of Life Insurers
Table 12.1Death Rates in the United States
Age-adjusted rate per 1,000 population1
Year Male Female Total
1940 19.8 16.0 17.91950 16.7 12.4 14.51960 16.1 11.1 13.41970 15.4 9.7 12.21975 14.2 8.6 10.91980 13.5 8.2 10.41985 12.8 7.8 9.91986 12.6 7.8 9.81987 12.5 7.7 9.71988 12.5 7.8 9.81989 12.2 7.6 9.51990 12.0 7.5 9.41991 11.8 7.4 9.21992 11.6 7.3 9.11993 11.8 7.5 9.31994 11.6 7.4 9.11995 11.4 7.4 9.11996 11.2 7.3 8.91997 10.9 7.3 8.81998 10.7 7.2 8.71999 10.7 7.3 8.82000 10.5 7.3 8.72001 10.4 7.3 8.62002 10.3 7.2 8.62003 10.1 7.2 8.42004 9.7 6.9 8.12005 9.7 6.9 8.22006 9.4 6.7 7.92007 9.2 6.6 7.82008 9.2 6.6 7.72009 8.9 6.4 7.52010 8.9 6.3 7.52011 8.8 6.3 7.4
Source: U.S. Department of Health and Human Services’ National Center for Health Statistics, National Vital Statistics Reports.1Based on population estimates from the 2000 census, which were modified for consistency with Office of Management and Budget racial categories as of 1977. All death rates have been revised, and may differ from previously published rates that were based on 1990 population estimates.

123Mortality
Table 12.2Life Expectancy, by Age and Gender, 1900–2011
Age Male Female Total
1900–02 Newborn 47.9 50.7 49.2 1 54.4 56.1 55.2 5 54.2 55.8 55.0 15 46.1 47.6 46.8 25 38.4 39.9 39.1 35 31.2 32.7 31.9 45 24.1 25.4 24.8 55 17.4 18.4 17.9 65 11.5 12.2 11.9 75 6.8 7.3 7.1 85 3.8 4.1 4.0
Age Male Female Total
1909–11 Newborn 49.9 53.2 51.5 1 56.0 58.4 57.1 5 55.1 57.4 56.2 15 46.7 48.9 47.7 25 38.6 40.7 39.6 35 30.9 33.0 31.9 45 23.8 25.4 24.5 55 17.0 18.1 17.6 65 11.2 12.0 11.6 75 6.8 7.2 7.0 85 3.9 4.1 4.0
Age Male Female Total
1919–21 Newborn 55.5 57.4 56.4 1 59.5 60.5 59.9 5 57.6 58.4 58.0 15 49.1 49.7 49.4 25 41.1 41.9 41.5 35 33.4 34.4 33.9 45 25.8 26.7 26.3 55 18.5 19.3 18.9 65 12.2 12.7 12.5 75 7.3 7.7 7.5 85 4.1 4.3 4.2
Age Male Female Total
1929–31 Newborn 57.7 60.9 59.2 1 60.8 65.4 61.9 5 58.1 60.7 59.3 15 49.2 51.5 50.3 25 40.8 43.1 41.9 35 32.7 34.9 33.7 45 24.9 26.9 25.8 55 17.8 19.4 18.5 65 11.7 12.8 12.2 75 7.0 7.6 7.3 85 4.0 4.3 4.2
Continued

124 American Council of Life Insurers
Table 12.2Life Expectancy, by Age and Gender, 1900–2011—Continued
Age Male Female Total
1939–41 Newborn 61.6 65.9 63.6 1 64.0 67.7 65.8 5 60.8 64.4 62.5 15 51.4 55.0 53.1 25 42.5 45.9 44.1 35 33.8 37.0 35.3 45 25.5 28.5 26.9 55 18.2 20.5 19.3 65 12.1 13.6 12.8 75 7.2 8.0 7.6 85 4.1 4.5 4.3
Age Male Female Total
1949–51 Newborn 65.5 71.0 68.1 1 66.7 71.8 69.2 5 63.1 68.2 65.5 15 53.6 58.5 55.9 25 44.4 49.0 46.6 35 35.2 39.6 37.3 45 26.6 30.6 28.5 55 19.0 22.3 20.6 65 12.7 15.0 13.8 75 7.8 8.9 8.4 85 4.4 4.9 4.7
Age Male Female Total
1959–61 Newborn 66.8 73.2 69.9 1 67.8 73.9 70.8 5 64.1 70.2 67.0 15 54.4 60.5 57.3 25 45.2 50.8 47.9 35 35.9 41.3 38.5 45 27.1 32.1 29.5 55 19.3 23.5 21.4 65 13.0 15.8 14.4 75 8.0 9.3 8.7 85 4.4 4.7 4.6
Age Male Female Total
1969–71 Newborn 67.0 74.6 70.8 1 67.6 75.0 71.2 5 63.8 71.2 67.4 15 54.1 61.4 57.7 25 45.1 51.8 48.4 35 36.0 42.3 39.1 45 27.2 33.1 30.1 55 19.4 24.6 22.0 65 13.0 16.8 15.0 75 8.1 10.3 9.3 85 4.7 5.6 5.3
Continued

125Mortality
Table 12.2Life Expectancy, by Age and Gender, 1900–2011—Continued
Age Male Female Total
1979–81 Newborn 70.1 77.6 73.9 1 70.1 77.5 73.8 5 66.3 73.7 70.0 15 56.5 63.8 60.2 25 47.4 54.2 50.8 35 38.2 44.5 41.4 45 29.2 35.2 32.3 55 21.1 26.4 23.9 65 14.2 18.4 16.5 75 8.9 11.6 10.5 85 5.1 6.4 6.0
Age Male Female Total
1989–91 Newborn 71.8 78.8 75.4 1 71.6 78.5 75.1 5 67.7 74.6 71.2 15 57.9 64.7 61.4 25 48.7 55.0 51.9 35 39.6 45.4 42.6 45 30.7 36.0 33.4 55 22.3 27.1 24.8 65 15.1 19.0 17.3 75 9.4 12.1 11.0 85 5.3 6.7 6.2
Age Male Female Total
1998 Newborn 73.8 79.5 76.7 1 73.4 79.0 76.3 5 69.5 75.1 72.4 15 59.7 65.2 62.5 25 50.3 55.5 53.0 35 41.0 45.8 43.5 45 31.9 36.4 34.3 55 23.5 27.4 25.5 65 16.0 19.2 17.8 75 10.0 12.2 11.3 85 5.5 6.7 6.3 100 2.3 2.7 2.6
Age Male Female Total
1999 Newborn 73.9 79.4 76.7 1 73.5 78.9 76.3 5 69.6 75.0 72.4 15 59.8 65.1 62.5 25 50.4 55.4 53.0 35 41.1 45.7 43.5 45 32.0 36.3 34.3 55 23.5 27.3 25.5 65 16.1 19.1 17.7 75 10.0 12.1 11.2 85 5.5 6.6 6.3 100 2.4 2.7 2.6
Continued

126 American Council of Life Insurers
Table 12.2Life Expectancy, by Age and Gender, 1900–2011—Continued
Age Male Female Total
2000 Newborn 74.1 79.5 76.9 1 73.7 79.0 76.4 5 69.8 75.1 72.5 15 59.9 65.2 62.6 25 50.6 55.4 53.1 35 41.3 45.8 43.6 45 32.2 36.3 34.4 55 23.8 27.4 25.7 65 16.3 19.2 17.9 75 10.1 12.1 11.3 85 5.6 6.7 6.3 100 2.4 2.7 2.6
Age Male Female Total
2001 Newborn 74.4 79.8 77.2 1 74.0 79.3 76.7 5 70.1 75.4 72.8 15 60.2 65.5 62.9 25 50.9 55.7 53.4 35 41.5 46.0 43.9 45 32.5 36.6 34.7 55 24.0 27.7 26.0 65 16.4 19.4 18.1 75 10.2 12.4 11.5 85 5.7 6.9 6.5 100 2.5 2.8 2.7
Age Male Female Total
2002 Newborn 74.5 79.9 77.3 1 74.1 79.4 76.8 5 70.2 75.4 72.9 15 60.3 65.5 63.0 25 51.0 55.8 53.5 35 41.6 46.1 44.0 45 32.6 36.7 34.8 55 24.1 27.7 26.1 65 16.6 19.5 18.2 75 10.3 12.4 11.5 85 5.7 6.9 6.5 100 2.5 2.8 2.7
Continued

127Mortality
Table 12.2Life Expectancy, by Age and Gender, 1900–2011—Continued
Age Male Female Total
2003 Newborn 74.8 80.1 77.5 1 74.3 79.6 77.0 5 70.4 75.7 73.1 15 60.6 65.8 63.2 25 51.2 56.0 53.7 35 41.9 46.4 44.2 45 32.8 37.0 35.0 55 24.4 28.0 26.3 65 16.8 19.8 18.4 75 10.5 12.6 11.8 85 6.0 7.2 6.8 100 2.3 2.6 2.6
Age Male Female Total
2004 Newborn 75.2 80.4 77.8 1 74.7 79.9 77.4 5 70.8 76.0 73.5 15 61.0 66.1 63.6 25 51.6 56.3 54.0 35 42.2 46.6 44.5 45 33.1 37.2 35.3 55 24.7 28.3 26.6 65 17.1 20.0 18.7 75 10.7 12.8 11.9 85 6.1 7.2 6.8 100 2.3 2.6 2.6
Age Male Female Total
2005 Newborn 75.2 80.4 77.8 1 74.7 79.9 77.4 5 70.8 76.0 73.5 15 61.0 66.1 63.6 25 51.6 56.4 54.1 35 42.3 46.7 44.6 45 33.2 37.3 35.3 55 24.8 28.3 26.7 65 17.2 20.0 18.7 75 10.8 12.8 12.0 85 6.1 7.2 6.8 100 2.3 2.6 2.6
Continued

128 American Council of Life Insurers
Table 12.2Life Expectancy, by Age and Gender, 1900–2011—Continued
Age Male Female Total
2006 Newborn 75.1 80.2 77.7 1 74.7 79.7 77.2 5 70.8 75.8 73.3 15 60.9 65.9 63.4 25 51.5 56.1 53.9 35 42.2 46.4 44.4 45 33.1 37.0 35.2 55 24.7 28.0 26.5 65 17.0 19.7 18.5 75 10.5 12.3 11.6 85 5.7 6.8 6.4 100 2.0 2.3 2.3
Age Male Female Total
2007 Newborn 75.4 80.4 77.9 1 74.9 79.9 77.5 5 71.0 76.0 73.6 15 61.1 66.1 63.7 25 51.8 56.3 54.1 35 42.5 46.7 44.6 45 33.3 37.2 35.4 55 24.9 28.2 26.7 65 17.2 19.9 18.6 75 10.6 12.5 11.7 85 5.8 6.8 6.5 100 2.1 2.3 2.3
Age Male Female Total
2008 Newborn 75.5 80.5 78.0 1 75.1 80.0 77.6 5 71.2 76.1 73.7 15 61.3 66.1 63.8 25 51.9 56.4 54.2 35 42.6 46.7 44.7 45 33.4 37.2 35.4 55 24.9 28.3 26.7 65 17.2 19.9 18.7 75 10.6 12.5 11.7 85 5.8 6.8 6.5 100 2.1 2.3 2.3
Continued
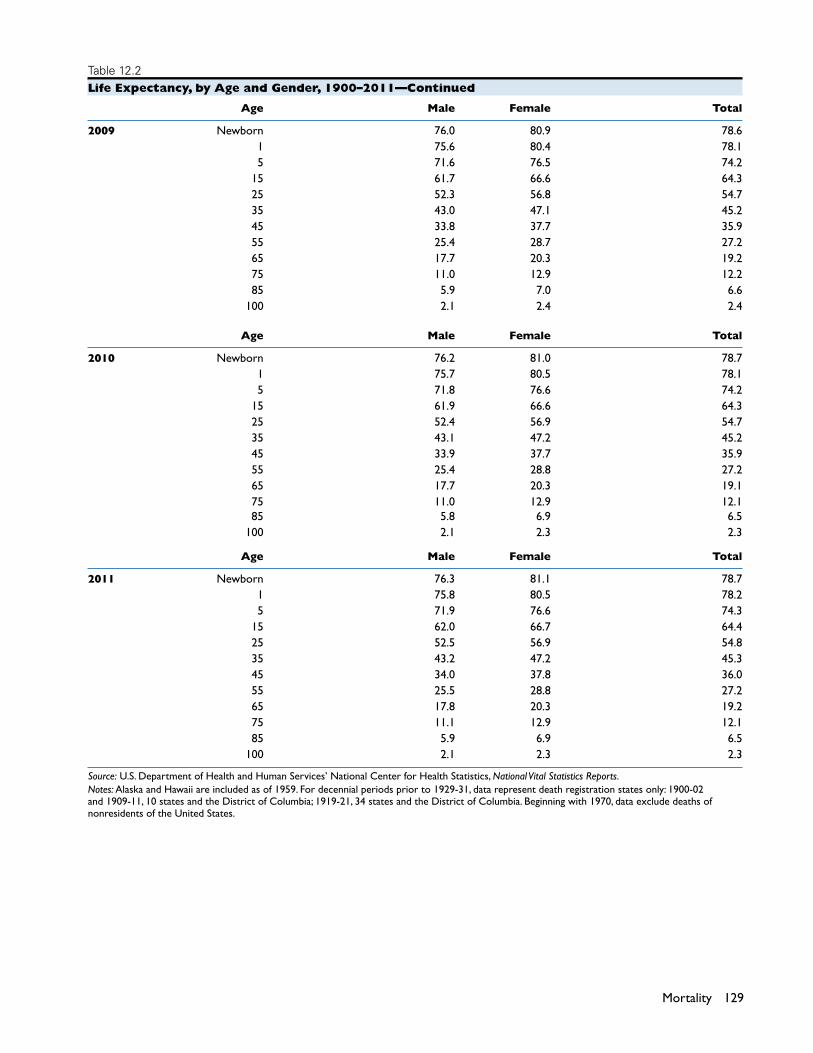
129Mortality
Table 12.2Life Expectancy, by Age and Gender, 1900–2011—Continued
Age Male Female Total
2009 Newborn 76.0 80.9 78.6 1 75.6 80.4 78.1 5 71.6 76.5 74.2 15 61.7 66.6 64.3 25 52.3 56.8 54.7 35 43.0 47.1 45.2 45 33.8 37.7 35.9 55 25.4 28.7 27.2 65 17.7 20.3 19.2 75 11.0 12.9 12.2 85 5.9 7.0 6.6 100 2.1 2.4 2.4
Age Male Female Total
2010 Newborn 76.2 81.0 78.7 1 75.7 80.5 78.1 5 71.8 76.6 74.2 15 61.9 66.6 64.3 25 52.4 56.9 54.7 35 43.1 47.2 45.2 45 33.9 37.7 35.9 55 25.4 28.8 27.2 65 17.7 20.3 19.1 75 11.0 12.9 12.1 85 5.8 6.9 6.5 100 2.1 2.3 2.3
Age Male Female Total
2011 Newborn 76.3 81.1 78.7 1 75.8 80.5 78.2 5 71.9 76.6 74.3 15 62.0 66.7 64.4 25 52.5 56.9 54.8 35 43.2 47.2 45.3 45 34.0 37.8 36.0 55 25.5 28.8 27.2 65 17.8 20.3 19.2 75 11.1 12.9 12.1 85 5.9 6.9 6.5 100 2.1 2.3 2.3
Source: U.S. Department of Health and Human Services’ National Center for Health Statistics, National Vital Statistics Reports.Notes: Alaska and Hawaii are included as of 1959. For decennial periods prior to 1929-31, data represent death registration states only: 1900-02 and 1909-11, 10 states and the District of Columbia; 1919-21, 34 states and the District of Columbia. Beginning with 1970, data exclude deaths of nonresidents of the United States.
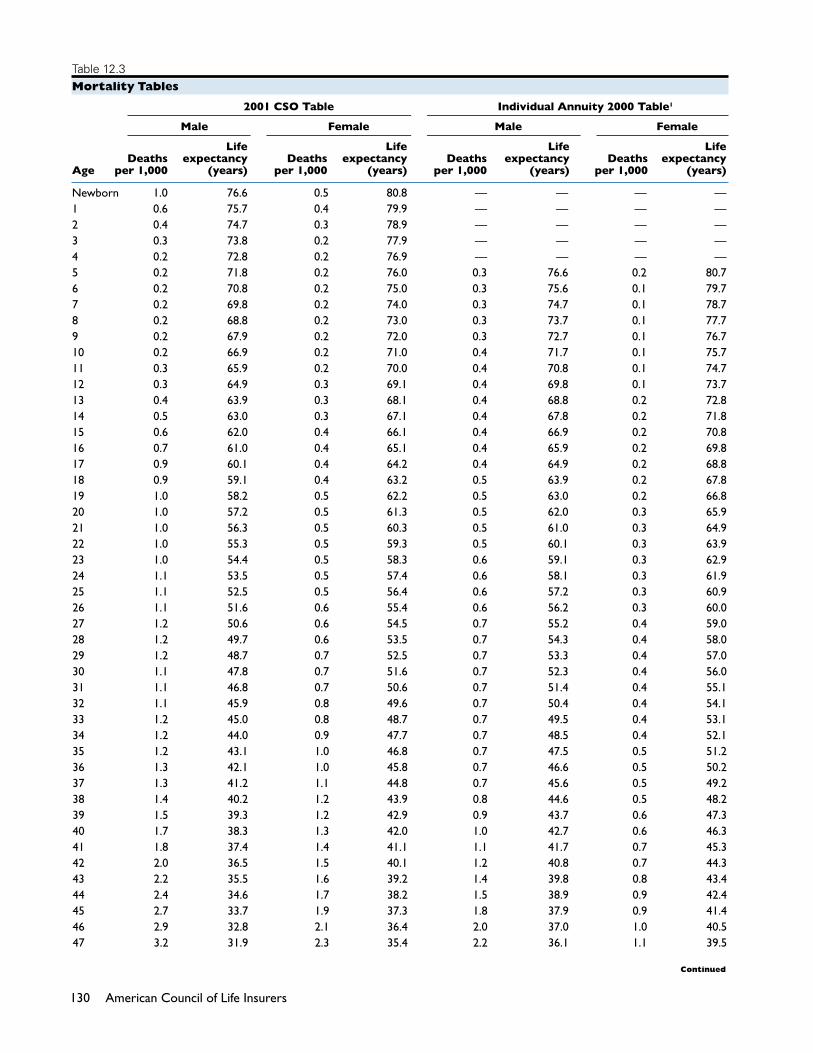
130 American Council of Life Insurers
Table 12.3Mortality Tables
2001 CSO Table Individual Annuity 2000 Table1
Male Female Male Female
Life Life Life Life Deaths expectancy Deaths expectancy Deaths expectancy Deaths expectancy Age per 1,000 (years) per 1,000 (years) per 1,000 (years) per 1,000 (years)
Newborn 1.0 76.6 0.5 80.8 — — — —1 0.6 75.7 0.4 79.9 — — — —2 0.4 74.7 0.3 78.9 — — — —3 0.3 73.8 0.2 77.9 — — — —4 0.2 72.8 0.2 76.9 — — — —5 0.2 71.8 0.2 76.0 0.3 76.6 0.2 80.76 0.2 70.8 0.2 75.0 0.3 75.6 0.1 79.77 0.2 69.8 0.2 74.0 0.3 74.7 0.1 78.78 0.2 68.8 0.2 73.0 0.3 73.7 0.1 77.79 0.2 67.9 0.2 72.0 0.3 72.7 0.1 76.710 0.2 66.9 0.2 71.0 0.4 71.7 0.1 75.711 0.3 65.9 0.2 70.0 0.4 70.8 0.1 74.712 0.3 64.9 0.3 69.1 0.4 69.8 0.1 73.713 0.4 63.9 0.3 68.1 0.4 68.8 0.2 72.814 0.5 63.0 0.3 67.1 0.4 67.8 0.2 71.815 0.6 62.0 0.4 66.1 0.4 66.9 0.2 70.816 0.7 61.0 0.4 65.1 0.4 65.9 0.2 69.817 0.9 60.1 0.4 64.2 0.4 64.9 0.2 68.818 0.9 59.1 0.4 63.2 0.5 63.9 0.2 67.819 1.0 58.2 0.5 62.2 0.5 63.0 0.2 66.820 1.0 57.2 0.5 61.3 0.5 62.0 0.3 65.921 1.0 56.3 0.5 60.3 0.5 61.0 0.3 64.922 1.0 55.3 0.5 59.3 0.5 60.1 0.3 63.923 1.0 54.4 0.5 58.3 0.6 59.1 0.3 62.924 1.1 53.5 0.5 57.4 0.6 58.1 0.3 61.925 1.1 52.5 0.5 56.4 0.6 57.2 0.3 60.926 1.1 51.6 0.6 55.4 0.6 56.2 0.3 60.027 1.2 50.6 0.6 54.5 0.7 55.2 0.4 59.028 1.2 49.7 0.6 53.5 0.7 54.3 0.4 58.029 1.2 48.7 0.7 52.5 0.7 53.3 0.4 57.030 1.1 47.8 0.7 51.6 0.7 52.3 0.4 56.031 1.1 46.8 0.7 50.6 0.7 51.4 0.4 55.132 1.1 45.9 0.8 49.6 0.7 50.4 0.4 54.133 1.2 45.0 0.8 48.7 0.7 49.5 0.4 53.134 1.2 44.0 0.9 47.7 0.7 48.5 0.4 52.135 1.2 43.1 1.0 46.8 0.7 47.5 0.5 51.236 1.3 42.1 1.0 45.8 0.7 46.6 0.5 50.237 1.3 41.2 1.1 44.8 0.7 45.6 0.5 49.238 1.4 40.2 1.2 43.9 0.8 44.6 0.5 48.239 1.5 39.3 1.2 42.9 0.9 43.7 0.6 47.340 1.7 38.3 1.3 42.0 1.0 42.7 0.6 46.341 1.8 37.4 1.4 41.1 1.1 41.7 0.7 45.342 2.0 36.5 1.5 40.1 1.2 40.8 0.7 44.343 2.2 35.5 1.6 39.2 1.4 39.8 0.8 43.444 2.4 34.6 1.7 38.2 1.5 38.9 0.9 42.445 2.7 33.7 1.9 37.3 1.8 37.9 0.9 41.446 2.9 32.8 2.1 36.4 2.0 37.0 1.0 40.547 3.2 31.9 2.3 35.4 2.2 36.1 1.1 39.5
Continued

131Mortality
Table 12.3Mortality Tables—Continued
2001 CSO Table Individual Annuity 2000 Table1
Male Female Male Female
Life Life Life Life Deaths expectancy Deaths expectancy Deaths expectancy Deaths expectancy Age per 1,000 (years) per 1,000 (years) per 1,000 (years) per 1,000 (years)
48 3.3 31.0 2.5 34.5 2.5 35.2 1.3 38.649 3.5 30.1 2.8 33.6 2.7 34.2 1.4 37.650 3.8 29.2 3.1 32.7 3.0 33.3 1.5 36.751 4.1 28.3 3.4 31.8 3.3 32.4 1.7 35.752 4.5 27.4 3.8 30.9 3.6 31.5 1.9 34.853 4.9 26.5 4.2 30.0 3.9 30.7 2.0 33.854 5.5 25.6 4.6 29.1 4.2 29.8 2.2 32.955 6.2 24.8 5.1 28.3 4.5 28.9 2.5 32.056 6.9 23.9 5.6 27.4 4.9 28.0 2.7 31.157 7.6 23.1 6.2 26.6 5.2 27.2 2.9 30.158 8.3 22.3 6.8 25.7 5.6 26.3 3.2 29.259 9.0 21.5 7.4 24.9 6.0 25.4 3.5 28.360 9.9 20.6 8.0 24.1 6.4 24.6 3.9 27.461 10.9 19.8 8.7 23.3 6.9 23.7 4.2 26.562 12.3 19.1 9.4 22.5 7.5 22.9 4.7 25.663 13.7 18.3 10.1 21.7 8.2 22.1 5.1 24.864 15.2 17.5 11.0 20.9 9.0 21.3 5.7 23.965 16.9 16.8 11.9 20.1 9.9 20.4 6.3 23.066 18.5 16.1 12.8 19.4 11.0 19.6 6.9 22.267 20.1 15.4 13.9 18.6 12.3 18.9 7.6 21.368 21.9 14.7 15.1 17.9 13.7 18.1 8.3 20.569 23.6 14.0 16.4 17.1 15.2 17.3 9.1 19.670 25.8 13.3 17.8 16.4 17.0 16.6 10.0 18.871 28.2 12.7 19.5 15.7 18.9 15.9 11.1 18.072 31.3 12.0 21.3 15.0 21.0 15.2 12.4 17.273 34.6 11.4 23.3 14.3 23.2 14.5 13.9 16.474 38.1 10.8 25.5 13.6 25.6 13.8 15.6 15.675 41.9 10.2 27.9 13.0 28.3 13.2 17.6 14.976 46.1 9.6 30.5 12.3 31.2 12.5 19.8 14.177 50.9 9.0 33.4 11.7 34.4 11.9 22.3 13.478 56.6 8.5 36.6 11.1 37.9 11.3 25.2 12.779 63.1 8.0 40.1 10.5 41.8 10.8 28.3 12.080 70.1 7.5 43.9 9.9 46.0 10.2 31.9 11.381 78.2 7.0 49.1 9.3 50.6 9.7 36.0 10.782 86.5 6.6 55.0 8.8 55.7 9.2 40.6 10.183 95.5 6.1 60.8 8.3 61.1 8.7 45.7 9.584 105.4 5.7 67.3 7.8 66.9 8.2 51.5 8.985 116.6 5.4 74.5 7.3 73.3 7.8 57.9 8.486 128.9 5.0 81.0 6.9 80.1 7.3 65.1 7.987 142.4 4.7 90.8 6.4 87.4 6.9 73.1 7.488 156.7 4.4 101.1 6.0 95.2 6.5 82.0 6.989 171.9 4.1 112.0 5.6 103.5 6.2 91.6 6.590 187.7 3.8 121.9 5.3 112.2 5.8 101.8 6.191 202.4 3.6 126.9 5.0 121.4 5.5 112.4 5.792 217.8 3.4 136.9 4.6 131.0 5.2 123.3 5.493 234.0 3.1 151.6 4.3 141.0 4.9 134.5 5.194 251.1 3.0 170.3 3.9 151.4 4.6 145.7 4.895 269.2 2.8 193.7 3.6 162.2 4.3 156.8 4.5
Continued

132 American Council of Life Insurers
Table 12.3Mortality Tables—Continued
2001 CSO Table Individual Annuity 2000 Table1
Male Female Male Female
Life Life Life Life Deaths expectancy Deaths expectancy Deaths expectancy Deaths expectancy Age per 1,000 (years) per 1,000 (years) per 1,000 (years) per 1,000 (years)
96 285.6 2.6 215.7 3.4 173.3 4.1 167.8 4.297 303.2 2.5 238.5 3.2 184.7 3.8 178.6 4.098 321.9 2.3 242.2 3.0 196.9 3.6 189.6 3.899 341.9 2.2 255.2 2.8 210.5 3.4 201.6 3.5100 363.2 2.1 275.7 2.6 225.8 3.1 215.0 3.3101 380.1 2.0 297.8 2.4 243.4 2.9 230.6 3.0102 398.1 1.9 322.2 2.2 263.7 2.7 248.8 2.8103 417.2 1.8 349.1 2.1 287.3 2.4 270.3 2.6104 437.6 1.7 378.6 1.9 314.6 2.2 295.7 2.3105 459.2 1.6 410.6 1.7 346.2 2.0 325.6 2.1106 482.2 1.5 443.3 1.6 382.4 1.8 360.5 1.9107 506.7 1.4 476.9 1.5 423.8 1.6 401.1 1.7108 532.7 1.3 510.7 1.4 470.9 1.4 447.9 1.5109 560.3 1.2 545.8 1.3 524.1 1.3 501.5 1.3110 589.6 1.1 581.8 1.2 584.0 1.1 562.6 1.2111 620.8 1.1 616.3 1.1 651.0 1.0 631.6 1.0112 653.8 1.0 649.9 1.0 725.6 0.8 709.3 0.9113 688.9 0.9 680.4 0.9 808.3 0.7 796.2 0.7114 726.2 0.9 723.4 0.9 899.6 0.6 892.9 0.6115 765.7 0.8 763.4 0.8 1000.0 0.5 1000.0 0.5116 807.6 0.7 804.9 0.7117 852.1 0.7 850.4 0.7118 899.2 0.6 892.4 0.6119 949.2 0.6 935.1 0.6120 1000.0 0.5 1000.0 0.5
Source: National Association of Insurance Commissioners.1Projected to 2000. Mortality rates are conservative in relation to the actual and projected experience on which they are based.

Appendix

135
A Accelerated death benefit Benefit paid, under clearly defined health-related circumstances,
to a policyholder prior to his or her death. Accelerated death benefits are also known as living
benefits.
Accidental death benefit A provision added to a life insurance policy for payment of an
additional benefit if death is caused by an accident. Also known as double indemnity.
Actuary A person professionally trained in the technical aspects of insurance and related
fields, particularly in the mathematics of insurance such as the calculation of premiums,
reserves, and other values.
Adjustable life insurance A type of life insurance that allows the policyholder to change the
plan of insurance, raise or lower the policy’s face amount, increase or decrease the premium,
and lengthen or shorten the protection period.
Adjuster A person, usually employed by a property/casualty insurer, who evaluates losses
and settles claims. Independent adjusters are independent contractors who adjust claims for
the insurance companies.
Agent A representative of an insurance company who is authorized to sell and service
insurance contracts. Life insurance agents are also known as life underwriters or producers.
Annuitant The person whose life expectancy is used to determine the payout of an annuity.
Annuity A financial contract issued by a life insurance company that offers tax-deferred
savings and a choice of payout options to meet an owner’s needs in retirement: income for
life, income for a certain period of time, or a lump sum.
Annuity certain A contract that provides an income for a specified number of years,
regardless of life or death.
A GLOSSARY Of InSuRAnce-ReLAted teRmS (AS OF SepTeMBeR 2014)
136 American Council of Life Insurers
Annuity consideration The payment, or one of regular periodic payments, that a policyholder
makes to an annuity.
Application A statement of information made by a prospective purchaser that helps the insurer
assess the acceptability of risk.
Assets Property owned by an insurance company—including stocks, bonds and real estate. Insurance
accounting focuses on solvency and the ability to pay claims, therefore a conservative valuation of
assets is required. This prohibits companies from listing assets on their balance sheets when values
are uncertain.
Asset valuation reserve (AVR) A reserve that makes provisions for credit-related losses on fixed-
income assets (default component) as well as all types of equity investments (equity component).
Assignment The legal transfer of one person’s interest in an insurance policy to another person.
Assume To accept the risk of potential loss from another insurer.
Assumption reinsurance A reinsurance agreement in which one company permanently transfers
full responsibility for a block of policies to another company. After the transfer, the ceding company
is no longer a party to the insurance agreement.
Automatic premium loan A loan provision in a life insurance policy allowing any premium
not paid by the end of the grace period (usually 30 or 31 days) to be paid automatically through a
policy loan if cash value is sufficient.
B Balance sheet Information on a company’s financial condition at a single point in time showing
assets, investments, and liabilities. The balance sheet also reveals a company’s equity, known as
policyholder surplus. Changes in the surplus are one indicator of a company’s financial standing.
Bank holding company A company that owns or controls one or more banks. The Federal
Reserve regulates and supervises bank holding company activities such as approving mergers and
acquisitions. The authority of the Reserve applies even though a bank owned by a holding company
may be under the primary supervision of the Comptroller of the Currency or the FDIC.
Beneficiary The person or financial entity (for instance, a trust fund) named in a life insurance
policy or annuity contract as the recipient of policy proceeds in the event of the policyholder’s death.
Benefit The amount payable by the insurance company to a claimant, assignee, or beneficiary
when the insured suffers a loss covered by the policy.
Bond A security obligating the issuer to pay interest at specified intervals and to repay the principal
at maturity. Bonds are a form of suretyship: Various types guarantee a payment or reimbursement
for financial losses resulting from dishonesty, failure to perform, and other failures.
137Glossary
Bond rating An evaluation of a bond’s financial strength by an established rating agency such as
Standard & Poor’s or Moody’s Investor Services.
Broker A sales and service representative who handles insurance for clients and generally sells
insurance of various kinds from one company or several.
Business disability insurance Disability insurance purchased by a business on a member of a
firm. This insurance is often used to protect business partners against loss caused by a partner’s
disability and to reimburse corporations for loss caused by the disability of a key employee.
Business life insurance Insurance purchased by a business on the life of a member of the firm.
This insurance protects surviving business partners against loss caused by the death of a partner
and reimburses corporations for loss caused by the death of a key employee.
C Capacity The amount of insurance available to meet demand. Availability depends on the industry’s
capacity for risk. For an individual insurer, it is the maximum amount of risk it can underwrite
based on its financial condition. An insurer’s capital relative to its exposure to loss is an important
measure of its solvency.
Capital stock The initial book value of stock sold by a company to start its operations.
Captive agent A person who represents only one insurance company and is restricted by agreement
from submitting business to any other company unless rejected first by the captive agent’s company.
Cash balance plan A defined benefit plan that strongly resembles a defined contribution plan.
Benefits accrue through employer contributions to employee accounts and interest credits to balances
in those accounts. The accounts serve as bookkeeping devices to track benefit accruals.
Cash value The amount available in cash upon surrender of a permanent life insurance policy.
Also known as cash surrender value.
Cede To transfer the risk of potential loss to another insurer.
Certificate A statement issued to persons insured under a group policy that defines the essential
provisions of their coverage.
Claim Notification to an insurance company that payment of an amount is due under the terms
of a policy.
COBRA (Consolidated Omnibus Budget Reconciliation Act) A federal law under which group
health plans sponsored by employers with twenty or more employees must offer continuation of
insurance coverage to employees and their dependents after they leave their employment. Under
COBRA, coverage can be continued for up to 18 months; the employee pays the entire premium.

138 American Council of Life Insurers
Codification A process undertaken by NAIC to redefine life company statutory accounting to
ensure consistency in how companies present their accounts in their annual statements. This process
culminated in the 2001 annual statements, the structure of which was noticeably different from the
previous years.
Convertible term insurance Term insurance that can be exchanged, at the option of the
policyholder and without evidence of insurability, for another plan of insurance.
Credit disability insurance Disability insurance issued through a lender or lending agency to
cover payment of a loan, an installment purchase, or other obligation in case of disability.
Credit life insurance Term life insurance issued through a lender or lending agency to cover
payment of a loan, an installment purchase, or other obligation in case of death.
d Declination Rejection of an application for insurance coverage by an insurance company, usually
due to the applicant’s health or occupation.
Deductible The amount of loss paid by the policyholder. Either a specified dollar amount, a
percentage of the claim amount, or a specified amount of time that must elapse before benefits are
paid. The larger the deductible, the lower the premium charged for the same coverage.
Deferred annuity A contract in which annuity payouts begin at a future date.
Deferred group annuity A type of group annuity providing for the purchase each year of a paid-
up deferred annuity for each group member. The total amount received by a member at retirement
is the sum of these deferred annuities.
Defined benefit plan A pension plan that specifies the benefits an employee will receive after
retirement. Benefits typically are based on length of service and salary, and are usually funded by
the employer on behalf of each plan participant.
Defined contribution plan A pension plan that specifies the contributions made by employees,
and in many cases the employer, on behalf of each plan participant. These funds accumulate for each
participant until retirement, when they are distributed as a lump sum or monthly annuity. Benefits
are based on the amount of contributions plus earnings.
Deposit administration group annuity A type of group annuity that allows contributions to
accumulate in an undivided fund, out of which annuities are purchased as each member of the
group retires.
Deposit term insurance A form of term insurance in which the first-year premium is larger than
subsequent premiums. A partial endowment typically is paid at the end of the term period. In many
cases, the partial endowment can be applied toward the purchase of a new term or whole life policy.

139Glossary
Deposit-type contracts Contracts that do not include mortality or morbidity risks.
Disability A physical or mental condition that makes an insured person incapable of working.
Disability benefit The benefit paid under a disability income insurance policy; also a feature
added to some life insurance policies providing for waiver of premium, and sometimes payment of
monthly income, if the policyholder becomes totally and permanently disabled.
Disability income insurance Insurance that provides periodic payments, or in some cases a
lump-sum payment, based on the insured’s income replacement needs, when the insured is unable
to work due to illness or injury.
Dividend An amount of money returned to the holder of a participating life insurance policy. The
money results from actual mortality, interest, and expenses that were more favorable than expected
when the premiums were set. The amount of any dividend is set by the insurer based on the insurer’s
standards.
Dividend addition An amount of paid-up insurance purchased with a policy dividend and added
to the policy’s face amount.
e Earned premium The portion of premium that applies to the expired part of the policy period.
Insurance premiums are payable in advance but the insurance company does not fully earn them
until the policy period expires.
Endowment Life insurance payable to the policyholder on the policy’s maturity date, or to a
beneficiary if the insured dies prior to that date.
Evidence of insurability The common requirement by life insurance companies that potential
policyholders undergo a physical examination or medical tests, such as blood pressure or cholesterol
screening, before the applicant can purchase an individual life insurance policy.
Extended term insurance A form of insurance available as a non-forfeiture option providing the
original amount of insurance for a limited time.
Extra risk A person possessing a greater-than-average likelihood of loss.
F Face amount The amount stated on the face of a life insurance policy that will be paid upon death
or policy maturity. The amount excludes dividend additions or additional amounts payable under
accidental death or other special provisions.
Family policy A life insurance policy providing insurance on all or several family members in one
contract. It generally provides whole life insurance on the principal breadwinner and small amounts
of term insurance on the spouse and children, including those born after the policy is issued.

140 American Council of Life Insurers
Fiduciary A person or organization authorized to control or manage pension assets to administer a
pension plan. Fiduciaries are legally obligated to discharge their duties solely in the interest of plan
participants and beneficiaries, and are accountable for any actions that may be construed by courts as
breaching that trust.
Fixed annuity A deferred annuity contract in which the life insurance company credits a fixed rate
of return on premiums paid or an immediate annuity in which the periodic amount is fixed.
Flexible premium policy or annuity A life insurance policy or annuity contract that allows the
amount and frequency of premium payments to be varied.
401(k) plan An employment-based retirement savings plan that allows employees to make tax-
deferred contributions from current earnings.
403(b) plan A retirement savings plan, similar to a 401(k), for employees of charitable and educational
organizations.
457 plan A retirement savings plan, similar to a 401(k), for employees of state and municipal
governments.
Fraternal life insurance Life insurance provided by fraternal orders or societies to their members.
Fraud Intentional lying or concealment by policyholders to obtain payment of an insurance claim
that would otherwise not be paid, or lying or misrepresentation by the insurance company managers,
employees, agents, and brokers for financial gain.
G General account An undivided account in which life insurers record all incoming funds. A general
account is usually an insurer’s largest, although separate accounts can also be used to fund specific
liabilities as well.
Grace period A period of usually a number of days following each insurance premium due date
except the first, during which an overdue premium may be paid and the policy be maintained. All
policy provisions remain in force during this period.
Group annuity A pension plan providing annuities at retirement to a group of people under a
master contract, usually issued to an employer for the benefit of employees. Each group member
holds a certificate as evidence of his or her annuity.
Group life insurance Life insurance on a group of people, usually issued to an employer for the
benefit of employees. Each group member holds a certificate as evidence of his or her insurance.
Guaranteed interest contract (GIC) A contract offered by an insurance company guaranteeing
a rate of return on assets for a fixed period, and payment of principal and accumulated interest at the
end of the period. GICs sometimes are used to fund the fixed-income option in defined contribution
plans, such as 401(k)s.

141Glossary
i Immediate annuity An annuity contract in which periodic payments begin immediately or within
one year of the policy’s issue.
Indemnity reinsurance A form of reinsurance in which the risk is passed to a reinsurer, which
reimburses the ceding company for covered losses. The ceding company retains its liability to and
contractual relationship with the insured.
Individual life insurance Paid by an individual and is payable upon death. Premiums can be paid
annually, semiannually, quarterly, or monthly.
Individual policy pension trust A type of pension plan frequently used for small groups and
administered by trustees authorized to purchase individual level-premium policies or annuity contracts
for each plan member. The policies usually provide both life insurance and retirement benefits.
Individual retirement account (IRA) An account to which a person can make annual
contributions of earnings up to a specified dollar limit. These contributions are tax-deductible for
workers who are not covered by an employment-based retirement plan, regardless of income, or
whose income does not exceed certain taxable income levels.
Insolvency Insurer’s legal inability to pay its future policyholder obligations. Insurance insolvency
standards and the regulatory actions taken vary from state to state. Typically, the first indications of
an insurer’s financial stress are its inability to pass the financial tests regulators routinely administer.
Institutional investor An organization such as a bank or insurance company that buys and sells
large quantities of securities.
Insurable Interest This doctrine requires that a person or company be in a position to suffer
monetary loss before they can purchase life insurance on another person’s life, or property insurance
on another’s property. The interest must exist at the time the insurance contract is issued.
Insurable risk Risks for which it is relatively easy to get insurance. Such risks meet certain criteria
including being definable, accidental in nature, and part of a group of similar risks large enough
to make losses predictable. Such conditions make it possible for an insurer to offer insurance at a
reasonable rate.
Insurance A system to make coverage of large financial losses affordable by pooling the risks of
many individuals or business entities and transferring them to an insurance company in return for
a premium.
Insurance examiner The state insurance department representative assigned to conduct the official
audit and examination of an insurance company’s operations.
Insured The person on whose life an insurance policy is issued. Also known as insured life.

142 American Council of Life Insurers
Interest maintenance reserve (IMR) A reserve that captures all realized, interest-related capital
gains and losses on fixed-income assets. These gains and losses are amortized into income over the
remaining life of the investment sold.
J Joint and survivor annuity An annuity in which payments are made to the owner for life and,
after the owner’s death, to the designated beneficiary for life.
K Keogh (H.R. 10) account A retirement savings account to which a self-employed person can
make annual tax-deductible contributions, subject to limitations.
L Lapsed policy An insurance policy terminated at the end of the grace period because of nonpayment
of premiums. See non-forfeiture value.
Legal reserve life insurance company A life insurer operating under state insurance laws that
specify the minimum basis for reserves that the company must maintain on its policies.
Level premium life insurance Life insurance for which the premium remains the same from year
to year. The premium is more than the actual cost of protection during earlier years of the policy
and less than the actual cost in later years. The initial overpayments build a reserve which, together
with interest to be earned, balances the underpayments of later years.
Life annuity An annuity contract that provides periodic income payments for life.
Life expectancy The average years of life remaining for a group of persons of a given age, according
to a mortality table.
Life insurance in force The sum of face amounts and dividend additions of life insurance policies
outstanding at a given time. Additional amounts payable under accidental death or other special
provisions are excluded.
Limited payment life insurance Whole life insurance on which premiums are payable for a
specified number of years, or until death if it occurs before the end of the specified period.
Long-term care insurance Insurance that provides financial protection for persons who become
unable to care for themselves because of chronic illness, disability, or cognitive impairment such as
Alzheimer’s disease.
Lump-sum distribution The non-periodic withdrawal of money invested in an annuity.
M Malpractice insurance Professional liability coverage for physicians, lawyers, and other specialists
against lawsuits alleging negligence or errors and omissions that have harmed their clients.

143Glossary
Managed care An arrangement between an employer or insurer and selected providers to provide
comprehensive health care at a discount to members of the insured group and coordinate the
financing and delivery of health care. Managed care uses medical protocols and procedures agreed
on by the medical profession to be cost effective. These protocols are also known as medical practice
guidelines.
Master policy A policy issued to an employer or trustee establishing a group insurance plan for
designated members of an eligible group.
Mediation Legal procedure in which a third party or parties attempts to resolve a conflict between
two other parties. Mediation can be binding or non-binding.
Medicaid A federal and state public assistance program created in 1965 and administered by the
states for people whose income and resources are insufficient to pay for health care.
Medicare Federal program for people sixty-five years or older that pays part of the costs associated
with their health care such as hospital stays, surgery, home care and nursing care.
Mortality and expense charge The fee for a guarantee that annuity payments will continue for
life.
Mortality table A statistical table showing the death rate at each age, usually expressed per
thousand.
Mutual life insurance company A life insurance company without stockholders whose
management is directed by a board elected by the policyholders. Mutual companies generally issue
participating insurance.
n Non-forfeiture value The value of an insurance policy if it is cancelled or required premium
payments are not paid. The value is available to the policyholder either as cash or reduced paid-up
insurance.
Non-medical limit The maximum face value of a policy that a given company will issue without
a medical examination of the applicant.
Nonparticipating policy A life insurance policy under which the company does not distribute to
policyholders any part of its surplus. Premiums usually are lower than for comparable participating
policies. Some nonparticipating policies have both a maximum premium and a current lower premium,
which reflects anticipated experience more favorable than the company is willing to guarantee. The
current premium may change from time to time for the entire block of business to which the policy
belongs. See participating policy.
Nonproportional reinsurance A form of reinsurance in which the reinsurer’s liability depends
on the number or amount of claims incurred in a given period.
144 American Council of Life Insurers
O Operating expenses The cost of maintaining a business, including property, insurance, taxes,
utilities and rent, but excludes income tax, depreciation, and other financing expenses.
Options Contracts that allow, but do not oblige, the buying or selling of assets at a certain date at
a set price.
Ordinary life insurance A life insurance policy that remains in force for the insured’s lifetime,
usually for a level premium. Also referred to as whole life insurance. In contrast, term life insurance
only lasts for a specified number of years (but may be renewable).
p Paid-up insurance Insurance on which all required premiums have been paid; frequently refers
to the reduced paid-up insurance available as a nonforfeiture option.
Partial disability benefit A benefit sometimes found in disability income policies providing
payment of reduced monthly income if the insured cannot work full time or is unable to earn a
specified percentage of predisability earnings due to a disability.
Participating policy A life insurance policy under which the company distributes to policyholders
the part of its surplus that its board of directors determines is not needed at the end of the business
year. Such a distribution reduces the premium that the policyholder had paid. See policy dividend
and nonparticipating policy.
Pensions Programs to provide employees with retirement income after they meet minimum age and
service requirements. Life insurers hold some of these funds. Over the last 25 years, the responsibility
of funding these retirement accounts has shifted from the employers (who offered defined benefit
plans promising a specific retirement income) to employees (who now have defined contribution
plans that are financed by their own contributions and not always matched by employers).
Permanent life insurance Generally, insurance that can stay in force for the life of the insured
and accrues cash value, such as whole life or endowment. May also be referred to as ordinary life
insurance.
Policy The printed document that a company issues to the policyholder, which states the terms of
the insurance contract.
Policy dividend A refund of part of the premium on a participating life insurance policy, reflecting
the difference between the premium charged and actual experience.
Policyholder/Policy owner The owner of an insurance policy, who may be the insured, a relative
of the insured such as a spouse, or a nonnatural person such as a partnership or corporation.
Policy illustration A depiction of how a life insurance policy will work, showing premiums, death
benefits, cash values, and information about other factors that may affect policy costs.

145Glossary
Policy loan The amount a policyholder can borrow at a specified rate of interest from the issuing
company, using the insurance policy’s value as collateral. If the policyholder dies with the debt
partially or fully unpaid, the insurance company deducts the amount borrowed, plus accumulated
interest, from the amount payable to beneficiaries.
Policy reserves The funds that a life insurance company holds specifically for fulfilling its policy
obligations. Reserves are required by law to be calculated so that, together with future premium
payments and anticipated interest earnings, they enable the company to pay all future claims.
Preferred risk A person considered less of a risk than the standard risk.
Premium The payment, or one of the periodic payments, that a policyholder makes to own an
insurance policy or annuity.
Premium loan A policy loan for paying premiums.
Proportional reinsurance A form of reinsurance in which the amount ceded is defined at the
point the risk is transferred, not at the point of claim. The amount of risk may vary with time by
formula.
Q Qualified plan An employee benefit plan that meets Internal Revenue Code requirements. Employer
contributions to such plans are immediately deductible. Contributions to and earnings in such plans
are not included in the employee’s income until distributed to the employee. Also known as tax-
qualified plan.
R Rated policy An insurance policy issued at a higher-than-standard premium rate to cover extra
risk, as when the insured has impaired health or a hazardous occupation. Also known as extra-risk
policy.
Reduced paid-up insurance A form of insurance available as a nonforfeiture option providing
for continuation of the original insurance plan at a reduced amount.
Reinstatement The restoration of a lapsed insurance policy. The company requires evidence of
insurability and payment of past-due premiums plus interest.
Reinsurance The transfer of some or all of the insurance risk to another insurer. The company
transferring the risk is called the ceding company; the company receiving the risk is called the
assuming company or reinsurer.
Reinsure To transfer the risk of potential loss from one insurer to another insurer.
146 American Council of Life Insurers
Renewable term insurance Term insurance that can be renewed at the end of the term, at the
policyholder’s option and without evidence of insurability, for a limited number of successive terms.
Rates increase at each renewal as the insured ages.
Reserve The amount required to be carried as a liability on an insurer’s financial statement to
provide for future commitments under policies outstanding.
Retrocede To cede insurance risk from one reinsurer to another reinsurer.
Retrocessionaire A reinsurer that contractually accepts from another reinsurer a portion of the
ceding company’s underlying risk. The transfer is known as a retrocession.
Return-to-work program A program that helps persons with activity limitations return to work.
Assistance may involve maximizing medical improvement to diminish the effect of limitations, or
facilitating job or job-site accommodations, retraining, or other means of taking activity limitations
into account.
Rider An amendment to an insurance policy that expands or restricts the policy’s benefits or excludes
certain conditions from coverage. See accelerated death benefit and accidental death benefit.
Risk-based capital (RBC) Method developed by the National Association of Insurance
Commissioners to measure the minimum amount of capital that an insurance company needs to
support its overall business operations. RBC sets capital requirements that consider the size and
degree of risk taken by the insurer and presumes that stakeholders will still receive limited payment
should insolvency occur. RBC has four components:
Asset risk Determines an asset’s default of principal or interest, or fluctuation in market value, as
a result of market changes.
Credit risk Measures the default risk on amounts due from policyholders, reinsurers, or creditors.
Off-balance-sheet risk Measures the risk from excessive growth rates, contingent liabilities, or
other items not reflected on the balance sheet.
Underwriting risk Calculates the risk from underestimating liabilities from business already written,
or inadequately pricing current or prospective business.
Risk classification The process by which a company decides how its premium rates for life insurance
should differ according to the risk characteristics of persons insured—their age, occupation, gender,
and health status, for example—and how the resulting rules are applied to individual applications.
See underwriting.
147Glossary
Roth IRA An individual retirement account (IRA) in which earnings on contributions are not taxed
at distribution, as long as the contributions have been in the account for five years and the account
holder is at least age 59 1/2, disabled, or deceased. Contributions to a Roth IRA are not tax-deductible.
S Self-insured plan A retirement plan funded through a fiduciary—generally a bank but sometimes
a group of people—which directly invests the accumulated funds. Retirement payments are made
from these funds as they fall due. Also known as trusteed plan or directly invested plan.
Separate account An asset account maintained independently from the insurer’s general investment
account and used primarily for retirement plans and variable life products. This arrangement permits
wider latitude in the choice of investments, particularly in equities.
Settlement options The several ways, other than immediate payment in cash, that a policyholder
or beneficiary may choose to have policy benefits paid. See supplementary contract.
Standard risk A person possessing an average likelihood of loss.
Stock life insurance company A life insurance company owned by stockholders who elect
a board to direct the company’s management. Stock companies generally issue nonparticipating
insurance.
Straight life annuity An annuity whose periodic payouts stop when the annuitant dies.
Straight life insurance Whole life insurance on which premiums are payable for life.
Structured settlement An agreement allowing a person who is responsible for making payments
to a claimant to assign to a third party the obligation of making those payments. An annuity contract
is often used to make structured settlement payments.
Substandard risk A person who cannot meet the normal health requirements of a standard insurance
policy. Protection is provided under a waiver, special policy form, or higher premium charge. Also
known as impaired risk.
Supplementary contract An agreement between a life insurance company and a policyholder
or beneficiary in which the company retains the cash sum payable under an insurance policy and
makes payments according to the settlement option chosen.
Surplus The remainder after an insurer’s liabilities are subtracted from it’s assets. The financial
cushion that protects policyholders in case of unexpectedly high claims.
T Term-certain annuity An annuity which makes periodic payments over a fixed number of years.
See annuity certain.
148 American Council of Life Insurers
Term insurance Insurance that covers the insured for a certain period of time, known as the term.
The policy pays death benefits only if the insured dies during the term, which can be one, five, ten
or even twenty years.
Terminal funded group plans The reserves under an annuity contract for benefits accumulated
outside of the contract, such as under a defined benefit retirement plan that has been terminated.
Third-party administrator Outside group that performs administrative functions for an insurance
company.
Title insurance Insurance that indemnifies real estate owners in case clear ownership of the
property is challenged by the discovery of faults in the title.
Tort A legal term denoting a wrongful act resulting in injury or damage on which a civil court
action or legal proceeding may be based.
Total disability The inability of a person to perform all essential functions of his or her occupation,
or in some cases any occupation, due to a physical or mental impairment.
U Umbrella policy Coverage for losses beyond the limits of underlying property-casualty, homeowners,
or auto insurance policies. While the umbrella applies to losses over the dollar amount in underlying
policies, coverage terms are sometimes broader than those specified in the underlying policies.
Unallocated contract A contract under which premiums and contributions are deposited to a
fund, rather than used immediately, to purchase annuities for benefit plan participants.
Underwriting The process of classifying applicants for insurance by identifying such characteristics
as age, gender, health, occupation, and hobbies. People with similar characteristics are grouped
together and charged a premium based on the group’s level of risk.
Uninsurable risk Risks for which insurance coverage may not be available.
Universal life insurance A type of permanent life insurance that allows the insured, after the initial
payment, to pay premiums at various times and in varying amounts, subject to certain minimums and
maximums. To increase the death benefit, the insurance company usually requires the policyholder
to furnish satisfactory evidence of continued good health. Also known as adjustable life insurance.
V Variable annuity A contract in which the premiums paid are invested in separate accounts which
holds funds, including bond and stock funds. The selection of funds is guided by the level of risk
assumed. The account value reflects the performance of the funds that the owner has chosen for
investment.

149Glossary
Variable life insurance A type of permanent insurance providing death benefits and cash values
that vary with the performance of a portfolio of investments. The policyholder may allocate premiums
among investments offering varying degrees of risk, including stocks, bonds, combinations of both,
and accounts that guarantee interest and principal.
Variable-universal life insurance A type of permanent insurance that combines the premium
flexibility of universal life insurance with a death benefit that varies as in variable life insurance.
Excess interest credited to the cash value depends on the investment results of separate accounts
investing in equities, bonds, real estate, and others. The policyholder selects the accounts to which
premium payments are made.
Vesting The right of an employee to all or a portion of the benefits he or she has accrued, even
if employment terminates. Employee contributions, as in a 401(k) plan, always are fully vested.
Employer contributions vest according to a schedule defined by the plan and are usually based on
years of service.
Viatical settlement companies Life insurance companies that purchase life insurance policies at
a discounted value from a policyholder who is elderly or terminally ill. The companies then assume
the premium payments and collect the face value of the policy upon the death of the person originally
insured.
Void When an insurance policy is freed from legal obligations for reasons specified in the policy
contract (i.e., a policy could be voided by an insurer if information given by a policyholder is proven
untrue).
W Waiver of premium A provision that sets conditions under which an insurance company would
keep a policy in full force without the payment of premiums. The waiver is used most frequently
for policyholders who become totally and permanently disabled.
Whole life insurance The most common type of permanent life insurance, in which premiums
generally remain constant over the life of the policy and must be paid periodically in the amount
specified in the policy. Also known as ordinary life insurance.
Workers compensation Insurance that pays for medical care related to on-the-job injuries and
physical rehabilitation. Workers compensation helps cover lost wages while an injured worker is
unable to work. State laws vary widely on benefit amounts paid and other compensation provisions.

151Historic Dates
HIStORIc dAteS (AS Of SePtemBeR 2014)
1759 The first life insurance company in the United States—The Corporation for Relief of the Poor and
Distressed Presbyterian Ministers and of the Poor and Distressed Widows and Children of Presbyterian
Ministers—is established in Philadelphia by the Synod of the Presbyterian Church.
1769 Benjamin Franklin said: “A policy of life assurance is the cheapest and safest mode of making
certain provision for one’s family. It is time our people understood and practiced more generally
life assurance. Many a widow and orphan have great reason to be thankful that the advantage of
life assurance was understood and embraced by the husband and father. A large amount has been
paid… to widows and orphans when it formed almost their only recourse.”
1777 The Corporation for Relief of Poor and Distressed Presbyterian Ministers and of the Poor and
Distressed Widows and Children of Presbyterian Ministers voted to lend the Continental Loan Office
5,000 pounds, which amounted to over half the Corporation’s total reserves. This loan was used to
finance the war effort of the Continental Army during the American Revolution.
1789 Professor Edward Wigglesworth of Harvard prepares a modified table of mortality based
on Massachusetts experience, the first computation of premiums and reserves on a scientific basis
in the United States.
1794 The Insurance Company of North America is chartered as the first general insurance company to sell
life insurance in America. In five years, only six policies are issued, and the company discontinues
its life insurance business in 1804.
1812 The Pennsylvania Company for Insurance on Lives and Granting Annuities is incorporated, the first
corporation to be organized in America solely for issuing life insurance policies and annuities. The
first policy is issued in 1813. The company discontinues issuing life policies in 1872.
1830 New York Life Insurance and Trust Company, the first American life insurance company to employ
agents, is started. The company later discontinues its life insurance business and subsequently is
merged with the Bank of New York.
1835 A charter is granted to New England Mutual Life Insurance Company of Boston—the first to a mutual
company in America. The company begins operating in December 1843.
B

152 American Council of Life Insurers
1836 The Girard Life Insurance, Annuity and Trust Company of Philadelphia is established on the new
principle of granting policyholders participation in profits. The first policy dividends are allotted in
1844 as additions of insurance to policies in force three or more years. Initially a stock company,
the insurer later becomes a trust company.
1840 The New York Legislature passes a bill providing that the proceeds of a policy made out to a widow
as beneficiary must be paid to her, exempt from creditors’ claims. Enacted into law, this measure
strengthens the protective power of life insurance policies.
1842 The Mutual Life Insurance Company of New York is chartered. The company’s first policy is issued
February 1, 1843, marking the beginning of mutual life insurance as it is known today.
1848 The first policy loans are granted.
1849 New York passes the first general insurance law.
1851 New Hampshire establishes the first regulatory body to examine the affairs of insurance companies.
1853 Policy valuation tables, which Elizur Wright developed over nine years, are published.
1857 New York City establishes a pension fund for its policemen, the first pension plan covering state or
local government employees.
1859 New York establishes the first state insurance department.
1861 Massachusetts is the first state to require nonforfeiture values as part of life policies.
The first war risk insurance is written by life insurance companies during the Civil War.
1864 The Manhattan Life Insurance Company is the first U.S. company to write an incontestable clause
into a policy.
1866 The Treasury Department rules that death benefits from a life insurance policy are not subject to an
income tax enacted in 1862 to fund the Civil War.
1868 The American Experience Table of Mortality is published as part of a New York law. Covering
experience from 1843 to 1858, it remains the table most widely used by American companies until
the 1940s.
1869 The U.S. Supreme Court holds insurance not to be a transaction in commerce, and affirms the validity
of state regulation of insurance.
The earliest organization of life insurance agents is recorded in Chicago.

153Historic Dates
1871 The first convention of state insurance commissioners is held in New York City.
1873 The first weekly premium policy is issued in the United States.
1875 The industrial insurance agency system is introduced in the United States.
The first pension plan in U.S. industry is established by the American Express Company, financed
solely by the employer.
1880 The first formal pension plan supported jointly by employer and employee contributions is established
by the Baltimore & Ohio Railroad Company.
Cash surrender values are first established by law in Massachusetts.
1892 Columbia University adopts a pension plan for its professors, the first private college retirement plan,
effective at age 65 with a minimum of 15 years’ service.
1893 The first pension plan for public school teachers is established in Chicago.
1901 Carnegie Steel Company establishes the first enduring pension plan in a manufacturing company.
This plan, with some modifications, is taken over by the United States Steel Company in 1911.
1905 The first functioning trade union pension plan is established by the Granite Cutters. Earlier trade
union plans, set up by the Pattern Makers (1900) and National Association of Letter Carriers (1902),
never paid benefits before dissolution.
The Armstrong investigation of life insurance by the New York Legislature results in many changes
in insurance laws.
1911 The first group life insurance for employees is introduced.
1913 Modern tax code enacted: maintains public policy of exempting benefits from a life insurance policy.
1917 Government-sponsored life insurance for World War I servicemen is offered under the War Risk
Insurance Act. This program subsequently becomes known as U.S. Government Life Insurance.
1920 Congress creates the Federal Civil Service Retirement and Disability Fund.
1921 Metropolitan Life Insurance Company issues the first group annuity contract in the United States.
The Revenue Act makes employer contributions to profit-sharing trusts tax-exempt. Its provisions
are extended to pension trusts in 1926.
1928 The first examinations are held for chartered life underwriters.

154 American Council of Life Insurers
1935 The Social Security Act is enacted.
The Railroad Retirement System is established. It is amended in 1937 to create a unified system for
the industry.
1939 The temporary National Economic Committee begins an investigation of the life insurance business.
1940 Congress adopts the National Service Life Insurance Act, providing insurance for men and women
in service in World War II.
1941 New York forms the first state guaranty association mechanism for life and health insurance companies.
1944 The U.S. Supreme Court holds that insurance is commerce, and that when conducted across state
lines, it is interstate commerce and subject to federal laws.
1945 The McCarran-Ferguson Act declares that state regulation of insurance is in the public interest and
grants an exemption from antitrust laws to the extent that the business is regulated by state law.
1949 The U.S. Supreme Court rules that employers are required to bargain on pensions.
1952 The College Retirement Equities Fund is established as the first variable annuity fund.
1954 The Participating Annuity Life Insurance Company offers the first variable annuity contracts to the
general public.
The Federal Employees’ Group Life Insurance Act is introduced, providing group life insurance
and accidental death and dismemberment insurance to civilian officers and employees of the U.S.
government through private insurance companies.
1959 Arkansas is the first state to pass laws permitting life insurance companies to issue variable annuities
and authorizing the establishment of separate accounts.
Early 1960s Most states now have laws specifically allowing life insurance companies to maintain separate
accounts, freeing pension fund investments from some of the limitations applied to companies’
general accounts.
1962 H.R. 10 (Keogh Act), officially known as the Self-Employed Individual Retirement Act, is adopted.
1963–64 The Securities and Exchange Commission rules that separate account acquisitions are an issuance
of securities subject to regulation under the Securities Act, but tax-qualified group pension plans,
including variable annuities, are exempted from the act’s registration and prospectus requirements.

155Historic Dates
1965 The Servicemen’s Group Life Insurance Act is introduced, providing members on active duty in the
uniformed services with group life insurance underwritten by private insurers through a contract
with the Veterans Administration.
1974 The Employee Retirement Income Security Act (ERISA) is signed into law. ERISA primarily protects
the benefits of participants in private plans, assures reasonable vesting provisions, and broadens
the opportunity to set up plans for the self-employed and workers who have no private retirement
plans.
1976 The first individual variable life insurance policy is issued in the United States.
1977 The first universal life insurance policy is issued in the United States.
1978 The Age Discrimination in Employment Act Amendments raise the mandatory retirement age from 65
to 70 for most private-sector and state and local government employees, and eliminate it for federal
employees.
1981 The Economic Recovery Tax Act is signed into law. It allows all workers to claim tax deductions,
within limits, for retirement savings; liberalizes tax deductions for retirement savings, interest, and
dividend exclusions; and reduces or eliminates estate and gift taxes for most individuals.
1982 The Tax Equity and Fiscal Responsibility Act revises the life insurance company taxation formula
and repeals the use of modified coinsurance in tax calculations; imposes a penalty tax on certain
annuity withdrawals; places limitations on pension plan benefits; and imposes additional restrictions
on certain plans.
1983 The U.S. Supreme Court decides in Arizona Governing Committee for Tax-Deferred Annuity and
Deferred Compensation Plans v. Norris that employee retirement benefits based on contributions
made after August 1, 1983, must be calculated without regard to the employee’s gender.
The Social Security Amendments increase Social Security taxes and make a portion of Social Security
benefits taxable for high-income retirees; limit cost-of-living adjustments under some circumstances;
make new federal employees, members of Congress, the president, and other federal officials subject
to Social Security taxes; and gradually increase the retirement age to 67 by 2027.
1984 The Retirement Equity Act lowers the minimum age for vesting and participation in retirement plans;
requires the spouse’s written consent before joint and survivor coverage may be waived under
pension plans; and requires payment of a survivor annuity if a vested participant dies before the
annuity’s starting date.
The Tax Reform Act significantly changes the basis on which life insurance companies are taxed
and includes universal life insurance within the definition of life insurance, preserving its positive
tax treatment.

156 American Council of Life Insurers
1985 Montana becomes the first state to forbid gender discrimination in the setting of premium rates for
all types of insurance, effective October 1.
1986 The Tax Reform Act eliminates the tax deductibility of individual retirement account (IRA) contributions
for highly paid persons covered by pension plans; reduces the maximum contribution to salary
reduction [401(k)] plans; and limits the deductibility of interest paid on loans against corporate-owned
life insurance policies.
1987 The Revenue Act establishes faster funding requirements for underfunded pension plans, a variable-
rate Pension Benefit Guaranty Corp. premium, and a lower full-funding limitation for qualified plans.
1988 The Technical and Miscellaneous Revenue Act creates a new class of life insurance contract—in which
policy loans and surrender payments are subject to taxation similar to that of deferred annuities—and
increases the excise tax on excess pension assets upon termination of qualified plans.
1990 A significant federal tax is imposed on life insurers’ deferred acquisition costs. It becomes known
as the DAC tax.
1991 All 50 states and Puerto Rico now have life and health insurance company guaranty association
mechanisms.
1993 The Omnibus Budget Reconciliation Act reduces the amount of annual compensation for calculating
retirement benefits to $150,000 from $235,840.
In John Hancock v. Harris Trust and Savings Bank, the U.S. Supreme Court rules that certain assets in John
Hancock Life Insurance Company’s general account are “plan assets” and that the company’s actions
regarding their management and disposition must be judged against ERISA’s fiduciary standards.
1995 In NationsBank v. Variable Annuity Life Insurance Company, the U.S. Supreme Court rules that annuities
are not a form of insurance under the National Bank Act, effectively allowing national banks to sell
annuities without limitation.
The Internal Revenue Service states in proposed regulations that bank-issued, hybrid CD-annuities
are taxable to purchasers.
1996 The Small Business Job Protection Act (SBA) amends ERISA to clarify the U.S. Supreme Court’s decision
in John Hancock v. Harris Trust and Savings Bank and protect insurers from lawsuits brought for
past actions taken in good-faith reliance on government rules. SBA also contains a wide variety of
pension simplification provisions and creates a new SIMPLE plan for small employers.

157Historic Dates
The Health Insurance Portability and Accountability Act (HIPAA) clarifies the tax treatment of long-
term care and accelerated death benefits. HIPAA permits qualified long-term care insurance and
services to be treated like accident and health insurance for tax purposes, and treats accelerated
death benefits paid to terminally and chronically ill individuals as amounts paid by reason of the
death of the insured under a life insurance contract.
1997 The Financial Services Agreement of the General Agreement on Trade in Services locks in liberalization
measures in crucial world markets. Its framework reduces or eliminates government barriers that
either prevent financial services from being freely provided across national borders or discriminate
against firms with foreign ownership.
Section 408A of the Taxpayer Relief Act, beginning January 1, 1998, creates the Roth IRA, in which
contributions are not deductible but qualified distributions are excluded from gross income.
1998 The Insurance Marketplace Standards Association (IMSA) is launched. The voluntary membership
organization promotes high ethical standards in the sale of individual life insurance and individual
annuity products through IMSA’s Principles and Code of Ethical Market Conduct.
1999 The Gramm-Leach-Bliley Financial Services Modernization Act eliminates laws enacted during the Depression
to restrict affiliations among insurers, banks, and securities firms. The act clarifies that insurance regulators
oversee the insurance activities of all financial institutions and prohibits insurance underwriting in bank
operating subsidiaries. The new law also prevents banking regulators from unilaterally broadening banks’
insurance powers or circumventing the state insurance regulatory system; requires federal courts to grant
equal deference to federal and state regulators in resolving insurance disputes; and permits a mutual life
insurer to relocate if its state fails to enact a mutual holding company law.
2000 The Electronic Signatures in Global and National Commerce Act ensures that life insurers and their
customers can transact business over the Internet by setting national standards and making electronic
signatures and records legally binding.
Legislation granting permanent normal trade relations to China is enacted, setting the stage for China’s
accession to the World Trade Organization.
2001 The Economic Growth and Tax Relief Reconciliation Act, containing pension reform measures and
retirement saving incentives, is signed into law. The act raises the limits on contributions to 401(k)-
type retirement plans and IRAs, and indexes the limits for inflation; allows those 50 and older to make
additional catch-up contributions to 401(k)-type plans and IRAs annually; shortens vesting schedules
for 401(k) plans; eases rules on rolling over retirement savings among private-sector, public-sector,
and nonprofits’ plans; and reduces administrative requirements for small businesses that set up and
maintain retirement plans.
The USA Patriot Act is signed into law, requiring life insurers and other financial institutions to establish
anti-money-laundering programs with internal procedures and controls, a designated compliance
officer, ongoing employee training, and independent audits.
158 American Council of Life Insurers
2002 The Victims of Terrorism Tax Relief Act is enacted, protecting life insurers that issue structured
settlement annuities from adverse tax treatment when a beneficiary transfers the stream of income
from such an annuity to a third party.
2003 NAIC adopts the Senior Protection in Annuity Transactions Model Law.
2004 Congress passes and the President signs the Pension Funding Equity Act of 2004. The bill establishes
a two-year temporary replacement for the 30-year Treasury interest rate and becomes effective
January 1, 2005. Included in the bill is a permanent repeal of section 809 of the tax code, which
affects mutual life insurance companies.
2005 Commissioners’ 2001 Standard Ordinary Mortality Tables, (2001 CSO Tables), which had been
previously adopted by the NAIC, were adopted by a majority of the states, thus putting them in
effect for state regulatory purposes. These new tables replace the 1980 CSO Tables.
2006 Interstate Insurance Product Regulation Compact Commission was created to develop uniform
standards for insurance products, to provide a central clearing house for regulatory review and to
enhance cooperation and coordinate efforts between state insurance departments.
Pension Protection Act of 2006 was signed into law by President Bush, strengthening the federal
pension insurance system and expanding opportunities for Americans to achieve a secure retirement.
The legislation makes permanent increased contribution limits to 401(k)s and IRAs; establishes
defined-contribution auto-enrollment; encourages annuities as payout options in employer-sponsored
retirement plans; and permits the combination of long-term care insurance and annuities.
2010 The Wall Street Reform and Consumer Protection Act (Dodd-Frank Act) is signed into law creating a
new Federal Insurance Office within the Department of Treasury. The Federal Insurance Office will
be responsible for understanding and advising Congress and the administration on insurance-related
issues and helping negotiate international regulatory equivalency agreements.
2011 Illinois Insurance Director Michael McRaith is appointed the first director of the new Federal Office
of Insurance (FIO) created by the Dodd-Frank Act. He will report to and advise the Secretary of
Treasury on all life insurance matters.
Roy Woodall, Jr., was confirmed in September 2011, by the U.S. Senate, to serve as the first independent
member with insurance expertise on the Financial Stability Oversight Council (FSOC).

159Historic Dates
2012 The Supreme Court upholds the health care reform law, its mandate for individual health care
coverage and most of its other provisions. By this decision, the Court removed major uncertainties
regarding health care reform in the U.S.
The Federal Insurance Office (FIO) establishes the Federal Advisory Committee on Insurance (FACI),
a fifteen member board tasked with advising the FIO Director on emerging insurance issues. The
FACI convenes its first public meeting in March.
2013 The Federal Insurance Office (FIO) releases a report entitled How To Modernize And Improve The
System Of Insurance Regulation In The United States. The report presents several recommendations
of the FIO on how the US system of insurance regulation can be updated for the 21st century.

160 American Council of Life Insurers

161Organizations
LIfe InSuRAnce ReLAted ORGAnIZAtIOnS (AS Of SePtemBeR 2014)
nAmerica’s Health Insurance Plans (AHIP) 601 Pennsylvania Avenue, NW South Building, Suite 500 Washington, DC 20004 (202) 778–3200 www.ahip.org Chairman: Eric H. Schultz President & CEO: Karen Ignagni
AHIP is a trade association representing companies that finance and deliver health care and provide other health insurance products and services.
n American Academy of Actuaries 1850 M Street, NW, Suite 300 Washington, DC 20036 (202) 223–8196 www.actuary.org President: Tom Terry
The academy is a public policy and communications organization representing actuaries in all practice specialties. Provides liaison with federal and state governments, relations with other professions, dissemination of public information, and development of standards of professional conduct. Develops standards of practice through the Actuarial Standards Board, an independent body within the academy. Consists largely of members of the Casualty Actuarial Society, Conference of Consulting Actuaries, Society of Actuaries, and actuaries enrolled under ERISA. Membership criteria include experience and education standards.
n The American College270 S. Bryn Mawr Avenue
Bryn Mawr, PA 19010 (610) 526–1000 www.theamericancollege.edu President and Chief Executive Officer: Dr. Robert R. Johnson
The College offers professional certification and graduate degree distance-education to those seeking career growth in financial services. Offers studies through the S.S. Huebner School leading to the award of Chartered Life Underwriter (CLU), Chartered Financial Consultant (ChFC), Registered Health Underwriter (RHU), and Registered Employee Benefits Consultant (REBC) diplomas and professional designations. Grants a Master of Science in Financial Services degree through the Graduate School of Financial Sciences, and a Master of Management degree through the Richard D. Irwin Graduate School of Management. Accredited by the Middle States Association of Colleges and Schools’ Commission on Higher Education.
C

162 American Council of Life Insurers
nAmerican Council of Life Insurers (ACLI) 101 Constitution Avenue, NW, Suite 700 Washington, DC 20001–2133 (202) 624–2000 www.acli.com
Chairman: Roger W. Crandall (MassMutual)
Chairman-Elect: Deanna Mulligan (The Guardian Life Insurance Company) President and Chief Executive Officer: Dirk A. Kempthorne
The American Council of Life Insurers (ACLI) is a Washington, D.C.-based trade association with more than 300 legal reserve life insurer and fraternal benefit society member companies operating in the United States. ACLI advocates in federal, state and international forums. Its members represent more than 90 percent of the assets and premiums of the U.S. life insurance and annuity industry. In addition to life insurance, annuities and other workplace and individual retirement plans, ACLI members offer long-term care and disability income insurance, and reinsurance.
nAmerican Fraternal Alliance (AFA) 1301 West 22nd Street, Suite 700 Oak Brook, IL 60523 (630) 522–6322 www.fraternalalliance.org Chairman: William B. McKinney Vice-Chair: Harald E. Borrmann
The Fraternal Alliance is the association and voice of fraternal benefit societies, which provides education, guidance, standards, and information on best practices and governance.
n American Risk and Insurance Association (ARIA) 716 Providence Road Malvern, PA 19355–3402 (610) 640–1997 www.aria.org President: Patricia Born President-Elect: Andreas Richter
ARIA is a society of insurance educators and others interested in risk and insurance education and research.
n American Society of Pension Professionals & Actuaries (ASPPA) 4245 N. Fairfax Drive, Suite 750 Arlington, VA 22203 (703) 516–9300 www.asppa.org President: David M. Lipkin President-Elect: Kyla M. Keck
ASPA educates pension actuaries, consultants, administrators, and other benefits professionals, and preserves and enhances the private pension system in developing a cohesive and coherent national retirement income policy. Offers an examination program for employee benefits professionals and represents the interests of its members before appropriate forums.

163Organizations
n Association of Home Office Underwriters (AHOU) 1155 15th Street, NW Suite 500 Washington, DC 20005 (202) 962-0167
President: Norm Leblond
Executive Vice President: Cheryl Johns
The mission of the AHOU is to advance the knowledge of sound underwriting of life and disability insurance risks, toward which end it holds meetings, publishes papers and discussions, and promotes educational programs. The association also provides valuable information sharing and networking opportunities to its members.
n Conference of Consulting Actuaries 3880 Salem Lake Drive, Suite H Long Grove, IL 60047–5292 (847) 719–6500 www.ccactuaries.org President: John J. Schubert President-Elect: Phillip A. Merdinger
The conference advances the quality of consulting practice, supports the needs of consulting actuaries, and represents their interests. Comprises consulting actuaries in all disciplines.
n Consumer Credit Industry Association (CCIA) 6300 Powers Ferry Road, Suite 600-286 Atlanta, GA 30339 (678) 858–4001 www.cciaonline.com Chair: Todd Schubert President: Dick Williams
CCIA is a national trade organization for insurers that underwrite consumer credit insurance in the areas of life, accident and health, property, and involuntary unemployment insurance. Acts to preserve, promote and enhance the availability, utility, and integrity of insurance and related products and services delivered in connection with financial transactions.
n Financial Services Roundtable 1001 Pennsylvania Avenue, NW, Suite 500 South Washington, DC 20004 (202) 289–4322 www.fsround.org President and CEO: Tim Pawlenty
The roundtable is a forum for financial industry leaders to share information and inform public policy with matters relating to the financial services industry.

164 American Council of Life Insurers
n Global Federation of Insurance Associations (GFIA) c/o Insurance Europe rue Montoyer 51 B-1000 Brussels, Belgium http://www.gfiainsurance.org/en/ Chair: Frank Swedlove (Canadian Life & Health Insurance Association)
GFIA is a non-profit association established to represent national and regional insurance associations that serve the general interests of life, health, general insurance and reinsurance companies and to make representations to national governments, international regulators, and others on their behalf.
n The Griffith Insurance Education Foundation 720 Providence Rd, Suite 100 Malvern, PA 19355 (855) 288-7743 www.griffithfoundation.org Chairman: Janice Abraham (United Educators Insurance) Executive Director: Kevin Brown
The foundation was founded at a major mid-western university to develop and support an insurance and risk management program. It promotes the teaching of risk management and insurance by colleges, universities, and other institutions of higher learning, and student participation in these programs, and offers education programs for public policy-makers on managing risks through insurance mechanisms.
n Health Insurance Association of America (HIAA) See America’s Health Insurance Plans (AHIP).
n Insurance and Financial Communicators Association (IFCA) 515 East Grant Rd Ste 141 Box 250 Tucson, AZ 85705 (602) 350-0717 www.ifcaonline.com President: Ralph Chaump
IFCA is an international organization dedicated to the ongoing professional development of its members in life insurance and related financial services communications. The association operates on a volunteer basis and offers programs and activities for its members. IFCA’s primary objective is to encourage and promote the exchange of experience and ideas through an extensive program of formal schools, workshops, seminars, newsletters, research studies, networking, international awards competition, and meetings.
n Insurance Accounting and Systems Association (IASA) IASA International Office 3511 Shannon Road, Suite 160 Durham, NC 27707 (919) 489–0991 www.iasa.org President: Forrest Mills, Jr.
IASA works to enhance individual, organizational, and industry effectiveness by facilitating the exchange of information and ideas among insurance-related professionals.
165Organizations
n Insurance Information Institute (III) 110 William Street New York, NY 10038 (212) 346–5500 www.iii.org President: Robert P. Hartwig
The mission of III is to improve public understanding of insurance. III provides definitive insurance information and statistics for government, media, educational institutions, and the public.
n Insured Retirement Institute (IRI) 1101 New York Avenue, NW Suite 825 Washington, DC 20005 (202) 469-3000 www.irionline.org Chairman: John L. Carter President: Catherine J. Weatherford
With over 350 members, IRI represents all segments of the annuity and variable life industry. It serves as a forum for the exchange of information, and provides the public, media, and industry with information on the benefits of annuities and related products.
n International Association of Insurance Supervisors (IAIS) c/o Bank for International Settlements CH-4002 Basel Switzerland +41 61 225 7300 Secretary General: Yoshihiro Kawai
The IAIS is a voluntary membership organization composed of insurance supervisors and regulators from around the world. The organization’s goal is to create a consistent and effective
system of global insurance regulation to promote policyholder protections and financial stability.
n International Claim Association (ICA) 1155 15th Street, NW, Suite 500 Washington, DC 20005 Phone: (202) 452–0143 www.claim.org President: Doris Erdman President-Elect: David W. Grannan
ICA is composed of life and health insurance company officers and employees who handle their companies’ claims function.
n Life Communicators Association See Insurance and Financial Communicators Association (IFCA).
166 American Council of Life Insurers
n Life Insurers Council (LIC) 2300 Windy Ridge Parkway, Suite 600 Atlanta, GA 30339 (770) 984–3724 http://loma.org/lic President & CEO: Robert A. Kerzner
A council of LOMA, LIC is an association of insurance companies that serve the basic insurance needs of the general public, including the underserved market, through various distribution methods by promoting standards of business conduct which are in the best interests of policyholders; representing its members by addressing legislative, regulatory and consumer issues; and promoting the interchange of experience and ideas for the betterment of the public and the insurance industry.
n LIMRA International, Inc. 300 Day Hill Road Windsor, CT 06095–4761 (860) 688–3358 www.limra.com President and Chief Executive Officer: Robert A. Kerzner
LIMRA is a member-owned organization dedicated to meeting the marketing information needs of companies involved in marketing annuity, disability, health, life, mutual fund, and retirement savings products. LIMRA works to improve the efficiency of life insurance distribution through scientific management methods, serves as the principal source of industry sales and marketing statistics, conducts research, provides consulting and management educational services, and prepares a wide range of publications.
n LOMA (Life Office Management Association) 2300 Windy Ridge Parkway, Suite 600 Atlanta, GA 30339–8443 (770) 951–1770 www.loma.org President and Chief Executive Officer: Robert A. Kerzner
An international association through which more than 1,200 insurance and financial services companies from over 80 countries engage in research and educational activities to improve company operations. Members are involved in life and health insurance, managed care, annuities, pensions, banking, securities, and other financial services areas. LOMA is committed to working as partners with members worldwide to improve management and operations through quality employee development, research, information sharing, and related products and services.
n MIB Group, Inc. 50 Braintree Hill Park, Suite 400 Braintree, MA 02184–8734 (781) 751-6000 www.mib.com
Formerly the Medical Information Bureau, MIB is a nonprofit association founded by medical directors to provide a central information exchange for more than 600 member life insurance companies.

167Organizations
n MDRT 325 W. Touhy Avenue Park Ridge, IL 60068–4265 (847) 692–6378 www.mdrt.org
MDRT (formerly Million Dollar Round Table) is composed of life insurance agents who consistently sell a predetermined amount of life insurance annually and maintain membership in the National Association of Insurance and Financial Advisors.
n National Association of Insurance Commissioners (NAIC) 1100 Walnut Street, Suite 1500 Kansas City, MO 64106–2197 (816) 842–3600 www.naic.org President: Adam Hamm Chief Executive Officer: Sen. Ben Nelson
NAIC is an organization of state insurance regulators from the 50 states, the District of Columbia and the four U.S. territories. NAIC functions as a regulatory support organization and serves the public interest by promoting uniformity of legislation and regulation, facilitating the fair and equitable treatment of insurance consumers, promoting the reliability, solvency and financial solidity of insurance institutions, and supporting and improving state regulation of insurance.
n National Association of Insurance and Financial Advisors (NAIFA) 2901 Telestar Court Falls Church, VA 22042–1205 (877) 866–2432 www.naifa.org President: Juli McNeely Chief Executive Officer: Susan B. Waters, DM, CAE
NAIFA is a national nonprofit organization representing the interests of more than 200,000 insurance and financial advisors nationwide, through its federation of over 600 state and local associations. NAIFA is the nation’s largest financial services membership association. Promotes high ethical standards, supports legislation in the interest of policyholders and agents, participates in community service, and provides agent education seminars and sales congresses.
n National Association for Variable Annuities (NAVA) See Insured Retirement Institute (IRI)
n National Fraternal Congress of America (NFCA) See American Fraternal Alliance (AFA)
168 American Council of Life Insurers
n National Organization of Life and Health Insurance Guaranty Associations (NOLHGA) 13873 Park Center Road, Suite 329 Herndon, VA 20171 (703) 481–5206 www.nolhga.com Chairman: Melody R. J. Jensen Vice-Chair: Peter G. Gallani
NOLHGA is a voluntary association comprised of the life and health insurance guaranty associations of all 50 states, the District of Columbia, and Puerto Rico. This nonprofit organization assists its members in handling multi-state insolvencies, coordinates their resolution, and provides a forum for resolving issues and problems related to the operation of state life and health insurance guaranty associations.
n Society of Actuaries (SOA) 475 N. Martingale Road, Suite 600 Schaumburg, IL 60173 (847) 706–3500 www.soa.org
President: Mark J. Freedman
SOA is an organization of skilled professionals applying mathematical and economic probabilities to financial security programs. Educates and qualifies candidates to become members, provides continuing education and professional development programs, promotes and publishes actuarial research, and maintains and enforces a professional conduct code for its members. The Society determines membership by successful completion of a rigorous set of examinations leading to the designation of Associate or Fellow in the society.
n Society of Financial Service Professionals (SFSP) 19 Campus Boulevard, Suite 100 Newtown Square, PA 19073–3239 (610) 526–2500 www.financialpro.org President: James M. Christian
President-Elect: Michael P. Dow
SFSP is an organization of professionals who have earned designations in the fields of insurance and financial services. The Society comprises agents, company executives, insurance regulators, educators, attorneys, certified public accountants, and bank trust officers, who participate in local chapters.
n S.S. Huebner Foundation for Insurance Education Department of Risk Management and Insurance Georgia State University PO Box 4036 Atlanta, GA 30302-4036 (404) 413-7462 http://huebnerfoundation.org/ Executive Director: Conrad S. Ciccotello
The foundation’s mission is to strengthen insurance education at the university level by increasing the number of professors specializing in insurance. The foundation makes fellowship grants for doctoral study and publishes research studies in the field of insurance.

169State Insurance Officials
StAte InSuRAnce OffIcIALS (AS Of SePtemBeR 2014)
n Alabama Jim L. Ridling Commissioner of Insurance Alabama Department of Insurance P.O. Box 303351 Montgomery, AL 36130–3551 (334) 269–3550 www.aldoi.gov
nAlaska Lori K. Wing-Heier Director Insurance Department of Commerce, Community, and Economic Development Alaska Division of Insurance 9th Floor State Office Building 333 Willoughby Avenue Juneau, AK 99811-0805 (907) 465–2515 www.commerce.state.ak.us/insurance
nAmerican Samoa Tau Tanuvasa Insurance Commissioner Office of the Governor American Samoa Government A P Lutali Executive Office Building Pago Pago, American Samoa 85018-7269 (684) 633-4116
nArizona Germaine L. Marks Director of Insurance Arizona Department of Insurance 2910 N. 44th Street, Suite 210 Phoenix, AZ 85018–7269 (602) 364–3100 www.id.state.az.us
nArkansas Jay Bradford Insurance Commissioner Arkansas Insurance Department 1200 West Third Street Little Rock, AR 72201-1904 (501) 371–2600 www.insurance.arkansas.gov
n California Dave Jones Insurance Commissioner California Department of Insurance 300 Capitol Mall, Suite 1700 Sacramento, CA 95814 (916) 492–3500 www.insurance.ca.gov
nColorado Marguerite Salazar Insurance Commissioner Colorado Division of Insurance 1560 Broadway, Suite 850 Denver, CO 80202 (303) 894–7499 www.dora.state.co.us/insurance
nConnecticut Thomas B. Leonardi Insurance Commissioner Connecticut Insurance Department 153 Market Street, 7th Floor Hartford, CT 06103 (860) 297–3800 www.ct.gov/cid/site/default.asp
D

170 American Council of Life Insurers
nDelaware Karen Weldin Stewart Insurance Commissioner Delaware Department of Insurance 841 Silver Lake Boulevard Dover, DE 19904 (302) 674–7300 www.delawareinsurance.gov
n District of Columbia Chester A. McPherson Acting Commissioner Government of the District of Columbia Department of Insurance, Securities and Banking 810 First Street, NE, Suite 701 Washington, DC, 20002 (202) 727–8000 www.disb.dc.gov
nFlorida Kevin M. McCarty Commissioner Florida Office of Insurance Regulation 200 East Gaines Street Tallahassee, FL 32399-0305 (850) 413–3140 www.floir.com
nGeorgia Ralph T. Hudgens Insurance Commissioner Office of Insurance and Safety Fire Commissioner Two Martin Luther King, Jr. Drive West Tower, Suite 704 Atlanta, GA 30334 (404) 656–2070 www.gainsurance.org
nGaum Artemio B. Ilagan Banking & Insurance Commissioner Guam Dept. of Revenue & Taxation Regulatory Division PO Box 23607 GMF Barrigada, Guam 96921 (671) 635-1817 https://www.guamtax.com/
nHawaii Gordon I. Ito Insurance Commissioner Hawaii Insurance Division King Kalakaua Building 335 Merchant Street, Room 213 Honolulu, HI 96813 (808) 586–2790 www.cca.hawaii.gov/dcca/ins
n Idaho William W. Deal Director of Insurance Idaho Department of Insurance 700 West State Street, 3rd Floor P.O. Box 83720 Boise, ID 83720-0043 (208) 334–4250 www.doi.idaho.gov
n Illinois Andrew Boron Director of Insurance Illinois Department of Insurance 320 W. Washington Street Springfield, IL 62767-0001 (217) 782–4515 www.insurance.illinois.gov
n Indiana Stephen W. Robertson Insurance Commissioner Indiana Department of Insurance 311 W. Washington Street, Suite 300 Indianapolis, IN 46204–2787 (317) 232–2385 www.in.gov/idoi
n Iowa Nick Gerhart Insurance Commissioner Iowa Insurance Division Two Ruan Center 601 Locust Street, 4th Floor Des Moines, IA 50309-3738 (515) 281–5705 www.iid.state.ia.us
nKansas Sandy Praeger Insurance Commissioner Kansas Insurance Department 420 SW 9th Street Topeka, KS 66612–1678 (785) 296–3071 www.ksinsurance.org
nKentucky Sharon P. Clark Insurance Commissioner Kentucky Department of Insurance 215 W. Main Street Frankfort, KY 40601 (502) 564–3630 http://insurance.ky.gov

171State Insurance Officials
nLouisiana James J. Donelon Commissioner of Insurance Louisiana Department of Insurance 1702 N. Third Street Baton Rouge, LA 70802 (225) 342–5900 www.ldi.la.gov
nMaine Eric A. Cioppa Superintendent of the Bureau of Insurance Maine Department of Professional & Financial Regulation 34 State House Station Augusta, ME 04333-0034 (207) 624–8475 www.maine.gov/pfr/insurance
n Maryland Therese M. Goldsmith Insurance Commissioner Maryland Insurance Administration 200 St. Paul Place, Suite 2700 Baltimore, MD 21202 (410) 468–2000 www.mdinsurance.state.md.us
nMassachusetts Joseph G. Murphy Commissioner of the Division of Insurance Massachusetts Office of Consumer Affairs and Business Regulation 1000 Washington Street, Suite 810 Boston, MA 02118 (617) 521–7794 www.mass.gov/doi
nMichigan Annette E. Flood Director of Insurance Michigan Department of Insurance and Financial Services Ottawa Building, 3rd Floor 611 W. Ottawa Street Lansing, MI 48933–1070 (517) 373-0220 www.michigan.gov/difs
nMinnesota Mike Rothman Commissioner Minnesota Department of Commerce 85 7th Place East, Suite 500 St. Paul, MN 55101-2198 (651) 539-1500 www.mn.gov/commerce/insurance
nMississippi Mike Chaney Commissioner of Insurance and State Fire Marshall Mississippi Insurance Department 1001 Woolfolk State Office Building 501 N. West Street Jackson, MS 39201 (601) 359–3569 www.mid.ms.gov
nMissouri John M. Huff Director of Insurance Missouri Department of Insurance, Financial Institutions & Professional Registration 301 West High Street, Room 530 Jefferson City, MO 65102 (573) 751–4126 www.difp.mo.gov
n Montana Monica J. Lindeen Commissioner of Securities and Insurance Montana State Auditor’s Office 840 Helena Avenue Helena, MT 59601 (406) 444–2040 www.csi.mt.gov
nNebraska Bruce R. Ramge Director of Insurance Nebraska Department of Insurance Terminal Building 941 O Street, Suite 400 Lincoln, NE 68508-3639 (402) 471–2201 www.doi.nebraska.gov
nNevada Scott J. Kipper Commissioner of Insurance Nevada Division of Insurance 1818 East College Parkway, Suite 103 Carson City, NV 89706 (775) 687–0700 www.doi.nebraska.gov
nNew Hampshire Roger A. Sevigny Insurance Commissioner New Hampshire Insurance Department 21 South Fruit Street, Suite 14 Concord, NH 03301 (603) 271–2261 www.nh.gov/insurance

172 American Council of Life Insurers
nNew Jersey Kenneth E. Kobylowski Commissioner of Insurance New Jersey Department of Banking and Insurance 20 West State Street P.O. Box 325 Trenton, NJ 08625-0325 (609) 292–7272 www.state.nj.us/dobi/index.html
nNew Mexico John G. Franchini Superintendent of Insurance New Mexico Office of Superintendent of Insurance Division of Insurance PERA Building, 4th Floor 1120 Paseo de Peralta Santa Fe, NM 87501 (505) 827–4601 www.osi.state.nm.us
n New York Benjamin M. Lawsky Superintendent of Financial Services New York State Department of Financial Services One State Street New York, NY 10004-1511 (212) 480–6400 www.dfs.ny.gov
nNorth Carolina Wayne Goodman Commissioner of Insurance North Carolina Department of Insurance 1201 Mail Service Center Raleigh, NC 27699–1201 (919) 807-6750 www.ncdoi.com
nNorth Dakota Adam W. Hamm Insurance Commissioner North Dakota Insurance Department 600 East Boulevard Avenue Bismarck, ND 58505–0320 (701) 328–2440 www.nd.gov/ndins
nNorthern Mariana Islands Sixto K. Igisomar Insurance Commissioner Department of Commerce Caller Box 10007 CK Saipan, MP 96950 (670) 664-3077 http://commerce.gov.mp/divisions/insurance/
nOhio Mary Taylor Director of Insurance Ohio Department of Insurance 50 W. Town Street Third Floor, Suite 300 Columbus, OH 43215 (614) 644–2658 www.insurance.ohio.gov
nOklahoma John D. Doak Insurance Commissioner Oklahoma Insurance Department Five Corporate Plaza 3625 N.W. 56th Street, Suite 100 Oklahoma City, OK 73112-4511 (405) 521–2828 www.ok.gov/oid
nOregon Laura Cali Insurance Commissioner Oregon Insurance Division 350 Winter Street, NE, Room 440 Salem, OR 97301-3883 (503) 947–7984 www.insurance.oregon.gov
n Pennsylvania Michael F. Consedine Insurance Commissioner Pennsylvania Insurance Department 1326 Strawberry Square Harrisburg, PA 17120 (717) 787-7000 www.insurance.pa.gov
n Puerto Rico Ángela Weyne Insurance Commissioner Oficina de la Comisionado de Seguros (Office of the Commissioner of Insurance) B5 Calle Tabonuco Suite 216, PMB 356 Guaynabo, PR 00968-3029 (787) 304-8686 http://www.ocs.gobierno.pr/enocspr/
nRhode Island Joseph Torti, III Deputy Director & Superintendent of Insurance Rhode Island Department of Business Regulation Division of Insurance 1511 Pontiac Avenue, Bldg. 69-2 Cranston, RI 02920-4407 (401) 462–9500 www.dbr.state.ri.us/divisions/insurance

173State Insurance Officials
nSouth Carolina Raymond G. Farmer Director of Insurance South Carolina Department of Insurance 124 S. Euclid Avenue, 2nd Floor Columbia, SC 29201 (803) 737–6160 www.doi.sc.gov
nSouth Dakota Merle D. Scheiber Director of Insurance South Dakota Division of Insurance 124 S. Euclid Avenue, 2nd Floor Pierre, SD 57501 (605) 773–3563 www.dir.sd.gov/insurance
nTennessee Julie Mix McPeak Commissioner of Insurance Tennessee Department of Commerce and Insurance Insurance Division 500 James Robertson Parkway Davy Crockett Tower Nashville, TN 37243-0565 (615) 741–2241 www.state.tn.us/commerce
nTexas Julia Rathgeber Commissioner of Insurance Texas Department of Insurance 333 Guadalupe Street Austin, TX 78701 (615) 741–2241 www.state.tn.us/commerce
nUnited States Virgin Islands Gregory R. Francis Lieutenant Governor Division of Banking and Insurance No. 5049 Kongens Gade St. Thomas, VI 00802 (340) 773-6459 http://ltg.gov.vi/division-of-banking-and- insurance.html
n Utah Todd E. Kiser Commissioner of Insurance Utah Insurance Department State Office Building, Room 3110 Salt Lake City, UT 84114 (801) 538–3800 www.insurance.utah.gov
nVermont Susan L. Donegan Commissioner of Insurance State of Vermont Department Financial Regulation 89 Main Street, Drawer 20 Montpelier, VT 05620–3101 (802) 828–3301 www.dfr.vermont.gov
nVirginia Jacqueline K. Cunningham Commissioner of Insurance Virginia State Corporation Commission Bureau of Insurance Tyler Building, 1300 E. Main Street Richmond, VA 23219 (804) 371–9741 www.scc.virginia.gov/boi
nWashington Mike Kreidler Insurance Commissioner Washington State Office of the Insurance Commissioner 5000 Capitol Boulevard, SE Tumwater, WA 98501 (360) 725–7000 www.insurance.wa.gov
nWest Virginia Michael D. Riley Insurance Commissioner West Virginia Offices of the Insurance Commissioner 1124 Smith Street Charleston, WV 25301 (304) 558–3386 www.wvinsurance.gov
nWisconsin Ted Nickel Commissioner of Insurance Wisconsin Office of the Commissioner of Insurance 125 South Webster Street Madison, WI 53703-3474 (608) 266–3585 www.oci.wi.gov
n Wyoming Tom C. Hirsig Insurance Commissioner Wyoming Department of Insurance 106 East 6th Avenue Cheyenne, WY 82002-0440 (307) 777–7401 http://doi.wyo.gov


AMERICAN COUNCIL OF LIFE INSURERS
101 Constitution Avenue, NW, Suite 700
Washington, DC 20001–21133
www.acl i .com