2014 interim results - china · pdf filesupporting nfc 8-megapixel camera self-owned channel...
TRANSCRIPT

1

2
2014 Interim Results
China Mobile Limited
14 August 2014
3
Management Present
Executive Director & Chairman Mr. XI Guohua
Mr. LI Yue Executive Director & CEO
Mr. SHA Yuejia Executive Director & Vice President
Mr. XUE Taohai Executive Director, Vice President & CFO

4
Overall Results for 1H 2014
Financial Results for 1H 2014
2
3
Operating Performance for 1H 2014
1
Agenda
5
Agenda
Overall Results for 1H 2014 1
6
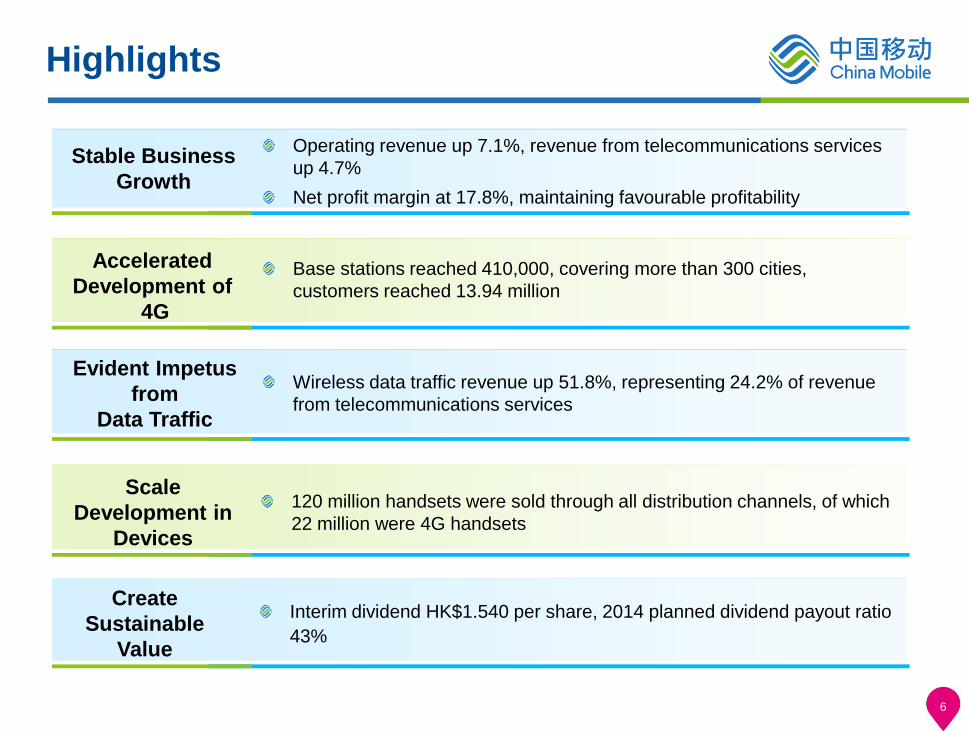
Highlights
Evident Impetus
from
Data Traffic
Wireless data traffic revenue up 51.8%, representing 24.2% of revenue
from telecommunications services
Operating revenue up 7.1%, revenue from telecommunications services
up 4.7%
Net profit margin at 17.8%, maintaining favourable profitability
120 million handsets were sold through all distribution channels, of which
22 million were 4G handsets
Scale
Development in
Devices
Base stations reached 410,000, covering more than 300 cities,
customers reached 13.94 million
Create
Sustainable
Value
Interim dividend HK$1.540 per share, 2014 planned dividend payout ratio
43%
Stable Business
Growth
Accelerated
Development of
4G

7
Operating Performance
Note 1: Pilot program for the transformation from business tax to value-added tax extended to cover the telecommunications
industry from 1 June 2014
Note 2: EBITDA Margin = EBITDA/Operating Revenue
1H 2013 1H 2014 Changes
Operating Revenue (RMB Billion) 303.104 324.681 7.1%
of which: Revenue from
Telecommunications Services
(RMB Billion)
284.671 297.910 4.7%
EBITDA (RMB Billion) 123.687 118.265 -4.4%
EBITDA Margin 40.8% 36.4% -4.4ppt
EBITDA as % of Revenue from
Telecommunications Services 43.4% 39.7% -3.7ppt
Net Profit (RMB Billion) 63.128 57.742 -8.5%
Net Profit Margin 20.8% 17.8% -3.0ppt
Basic Earnings per Share (RMB) 3.14 2.86 -9.0%
2

8
Transformation
Promote Strategic Transformation
Voice-centric operations
Developing communications services Developing digital services
Mobile communications services Innovative full-services
Data-centric operations
Smart device
proliferation and
4G commercialization
Broad prospects
for digital services
Alleviate the
decline in voice
services
Accelerated
OTT substitution
2014
Drive data traffic
growth
Expand new
areas
Digital
Services
Data
Traffic Voice
9
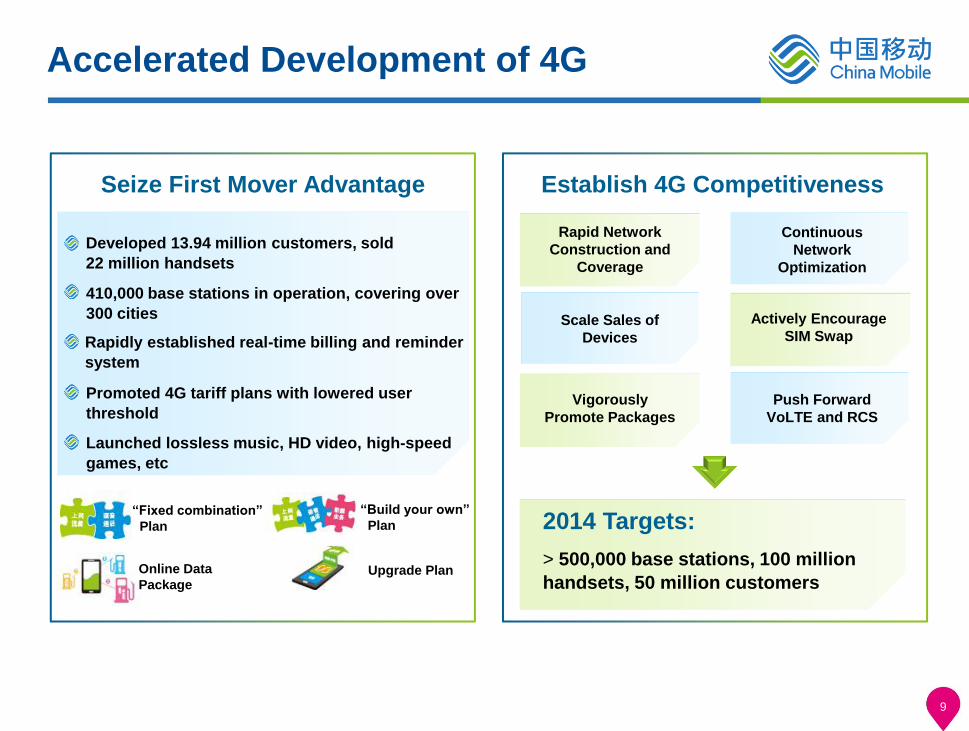
Accelerated Development of 4G
Scale Sales of
Devices
Actively Encourage
SIM Swap
Vigorously
Promote Packages
Rapid Network
Construction and
Coverage
Continuous
Network
Optimization
Push Forward
VoLTE and RCS
Seize First Mover Advantage Establish 4G Competitiveness
410,000 base stations in operation, covering over
300 cities
Rapidly established real-time billing and reminder
system
Promoted 4G tariff plans with lowered user
threshold
Developed 13.94 million customers, sold
22 million handsets
Launched lossless music, HD video, high-speed
games, etc
2014 Targets:
> 500,000 base stations, 100 million
handsets, 50 million customers
“Fixed combination”
Plan
Online Data
Package
“Build your own”
Plan
Upgrade Plan

10
APs reached 4.41 million
Improved authentication, roaming,
device matching and tariff optimization
Traffic Diversion
Top Priority
Realize contiguous coverage in
almost all cities, urban counties and
effective coverage in key villages
and towns by the year-end
Rapid network construction,
enhanced optimization
Core Bearer
Base stations reached 500,000
Enhanced customer experience
and uplifted network utilization
Base stations reached 900,000
Optimized existing base stations,
safeguarded leadership in
coverage and voice quality
Advantage Assured
Deepen Four-Network Co-ordination

11
4G
32.8
83.8
225.2
74.9
Reasonable Investment
Transmission Mobile communications networks
Support systems Business development
Others Buildings & infrastructure
CAPEX Structure in 1H 2014 (RMB Billion)
CAPEX
1H 2014 2014 Budget
Maintain voice advantage, satisfy demand for data traffic,
support business innovation and strengthen accumulation of resources
48.7%
36.2%
3.2%
3.0%
6.2% 2.7%

12 12
Strive to Create Value for Shareholders

13
Agenda
2 Operating Performance for 1H 2014

14
Innovative Development
Business Performance
Improved Service Enhanced Quality
Network - enhanced customer perception
Product - improved customer experience
Internet traffic on-net rate uplifted
Data traffic carriage optimized
Front-end localization and back-end
centralization
Transparent consumption and customization
Regulated spam messages and malware
Customer complaints rate remained lowest in
the industry
Device Company Lowered device prices and channel costs
Self-branded handsets set a trend for industry
Entrepreneurship
Promoted VoLTE and RCS
Developed digital services
Promoted efficient and centralized channels
Innovated customer preference oriented
marketing model
International
Company Innovated
roaming tariffs
Promoted 4G
roaming
Government and
Corporate Company Increased market
share
Enhanced products
capabilities

15
(RMB Billion)
Traditional Businesses under Pressure
(RMB Billion)
SMS & MMS Revenue
5.3%
165.778 175.072
1H 2013 1H 2014
Strive to maintain value of traditional businesses and
extend the window period of strategic transformation
20.979
18.212
13.2%
1H 2013 1H 2014
Voice Services Revenue

16
Actively Develop 4G
Base Stations Handsets Sold
(Million units)
22
100
Customers
(Million)
13.94
50.00
1H 2014 2014 Plan 1H 2014 2014 Plan
410,000
>500,000
1H 2014 2014 Plan
Network Construction Build the world’s largest 4G network
by the year-end
Realized international roaming with
8 operators
Business Development
Undertook 13.4% of mobile data traffic recently
4G: 2 times of blended ARPU; 6 times of blended DOU
Customer Feedback Significantly shortened time delay of
internet access
Greatly enhanced customer perception
in video, etc
Globalized Operation 39 TD-LTE commercial networks
world-wide
“One handset around the world”

17
Handsets Sold
120
22
100
200 (Million Units)
1H 2014 2014 Plan
4G handset
Scale Development of Devices
Number of 4G Handset Models
and Unit Price
Debuted self-branded, 5-mode 10 frequency handset
“M811” at ~RMB1,000
High, medium and low-end 4G chipsets increasingly
mature
Device subsidies inclined to 4G
Qualcomm chipsets
Five-inch HD screen
More than 5 million 4G handsets sold in June
Nearly 140 handset models of 4G at ~RMB1,000, price
of 5-mode handsets reduced to below RMB800
Supporting NFC
8-megapixel camera
Self-owned
Channel
E-commerce
Channel
Social
Channel
Handset models available for sale
Jan Feb Mar Apr May Jun
5,100 4,300
3,200 2,600
2,200
242
19 27 47
161
1,900
Average unit price (RMB)
100
18
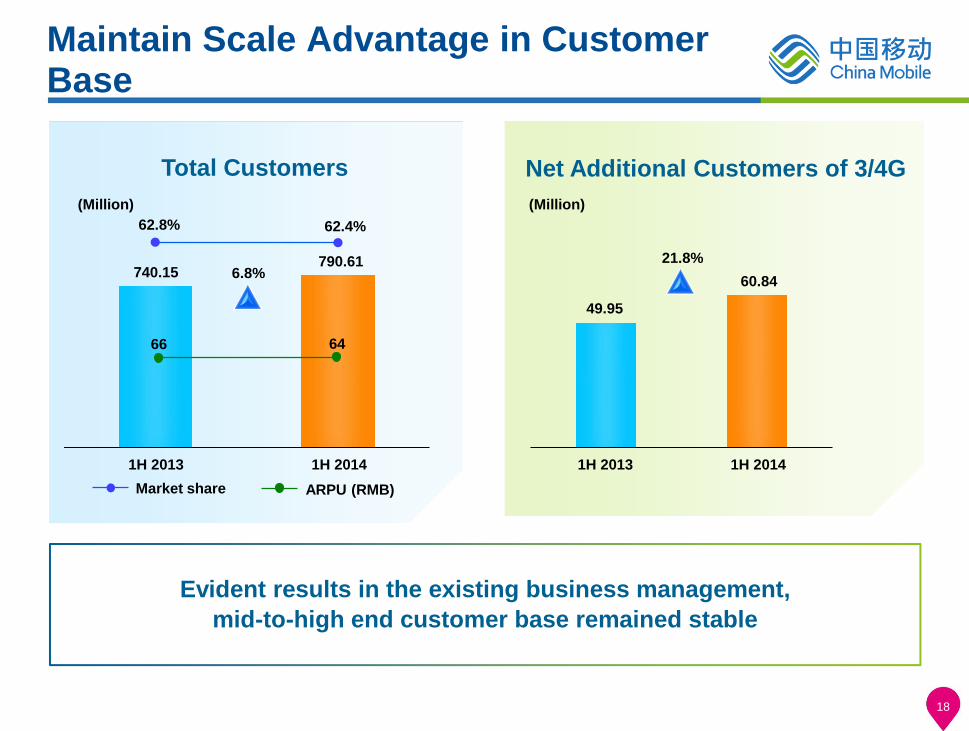
Maintain Scale Advantage in Customer Base
Total Customers Net Additional Customers of 3/4G
(Million)
Evident results in the existing business management,
mid-to-high end customer base remained stable
1H 2013 1H 2014
21.8%
49.95
60.84
66 64
ARPU (RMB)
(Million)
1H 2013 1H 2014
6.8% 740.15 790.61
Market share
62.8% 62.4%

19
Strengthen Data Traffic Operations
Customer DOU
(MB)
80 153
2G 3G 4G
729
Data Traffic YoY Growth
91.4%
176.3%
Mobile data traffic 3/4G data traffic
Mobile Data Traffic
1H2013
46.121
70.097
16.2%
23.5%
1H2014
222.8
426.5 52.0%
91.4%
WLAN
46.4%
22.9%
1H2013 1H2014
(RMB Billion)
1H2013 1H2014 1H2013 1H2014
Data Traffic Revenue (RMB Billion)
Data Traffic Revenue
Mobile data traffic revenue / Revenue from
telecommunications services
1.282 1.877
668.6
821.9
(Billion MB) (Billion MB)
20
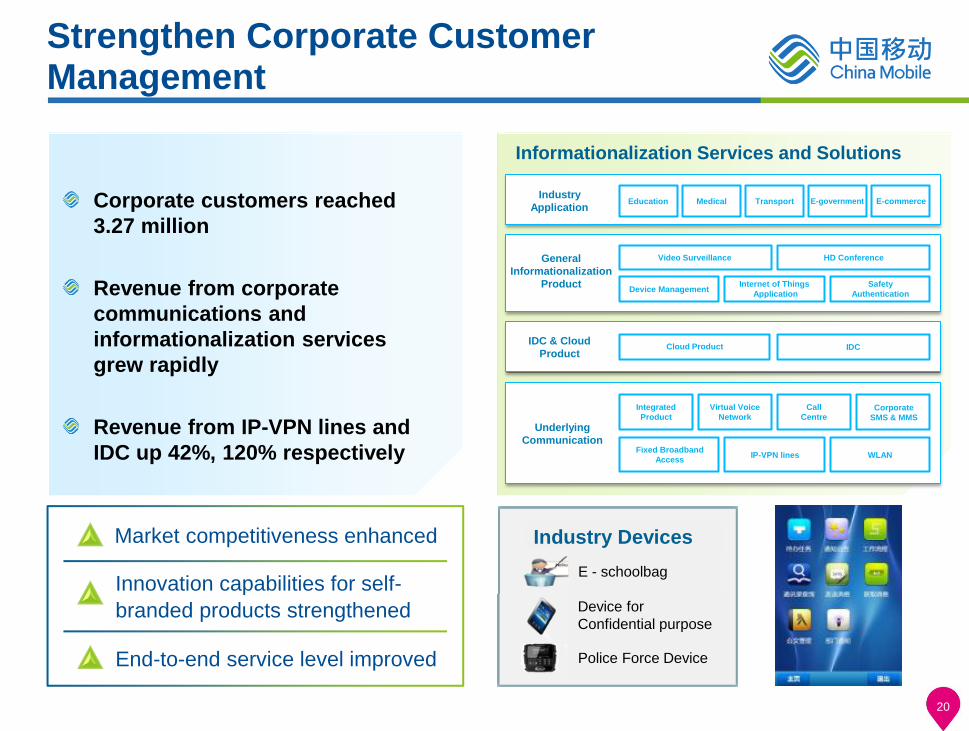
Strengthen Corporate Customer Management
Informationalization Services and Solutions
Corporate customers reached
3.27 million
Revenue from corporate
communications and
informationalization services
grew rapidly
Revenue from IP-VPN lines and
IDC up 42%, 120% respectively
Education Medical Transport E-government E-commerce
Device Management Internet of Things
Application
Safety
Authentication
Cloud Product IDC
Video Surveillance HD Conference
Industry
Application
General
Informationalization
Product
IDC & Cloud
Product
Underlying
Communication
WLAN
Market competitiveness enhanced
E - schoolbag
Device for
Confidential purpose
Police Force Device
Industry Devices
Integrated
Product
Virtual Voice
Network
Call
Centre Corporate
SMS & MMS
Fixed Broadband
Access IP-VPN lines
Innovation capabilities for self-
branded products strengthened
End-to-end service level improved

21
Develop Digital Services
New Calls New Messages New Contacts
Device Native Mode Supports VoLTE and RCS
Mobile Changes Life
Communications
Life
Entertainment
Business
Family
Unified Communications
Internet of Things M2M Device
Revenue from “and - Entertainment” comprises music, reading,
video, gaming, animation, MM and Mobile Paper
“and - Entertainment” Revenue
13.413 4.4% 14.007
1H 2013 1H 2014
(RMB Billion)
(Million)
27.27
39.95
1H 2013 1H 2014
46.5%

22
Measures
Innovative Marketing System and Strictly Control Marketing Costs
Enhance the marketization of device sales to cut down device subsidies
Promote transformation of social channels to reduce reliance on commissions for mobile number subscription
Strengthen the centralized management of advertising and promotion to reduce expenses
Gradually eliminate physical products promotion, close VIP lounges at airports to reduce the investment of
low-efficiency marketing resources
Strengthen customer retention and loyalty management to promote existing business operation
Simplify and unify tariff plans and enhance tariff concessions to benefit customers more directly
* Device subsidies listed under “cost of products sold” in the statement.
Targets
More convenient
services
Promote 3-year plan, gradually build up
efficient marketing system
More streamlined businesses
* Selling expenses and device subsidies
are expected to be reduced by over
RMB20 billion in 2014
Continue to strictly control marketing
costs in the next 2 years
Strictly Control Marketing Costs
More explicit communications
More benefits to
the customers
23
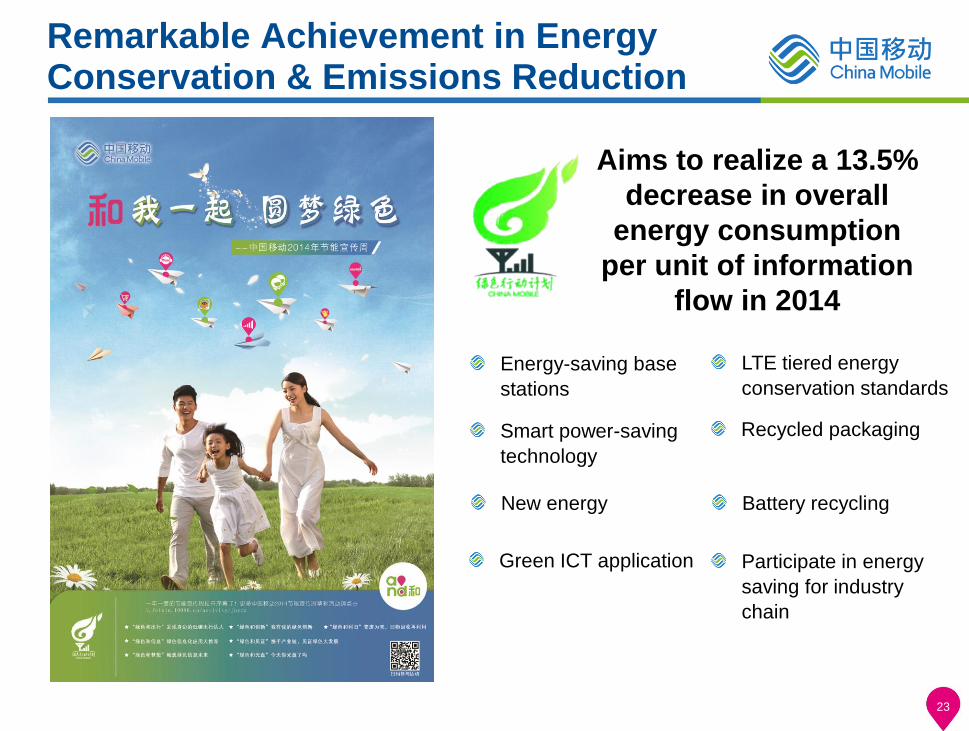
Remarkable Achievement in Energy Conservation & Emissions Reduction
Aims to realize a 13.5%
decrease in overall
energy consumption
per unit of information
flow in 2014
Battery recycling New energy
Energy-saving base
stations
Smart power-saving
technology
Green ICT application
LTE tiered energy
conservation standards
Recycled packaging
Participate in energy
saving for industry
chain

24
Commit to “Mobile Changes Life Become a Trustworthy Digital Services Expert”
24

25
Agenda
Financial Results for 1H 2014 3

26
Stable Revenue Growth
Operating Revenue
(RMB Million)
1H2013 1H2014
297,910 4.7%
284,671
(RMB Million)
Revenue from
Telecommunications Services
1H2013 1H2014
324,681
7.1%
303,104
Mobile Data Traffic
Total Voice Usage
Total Customers
(Billion MB)
(Billion Minutes)
1H2013 1H2014
45.2%
Revenue from Sales of
Products and Others
18,433
26,771
(RMB Million)
(Million) 790.61
1H2013 1H2014
6.8% 740.15
1H2013
222.8
426.5 91.4%
1H2014
2,137.6
1H2013 1H2014
2,134.1
0.2%
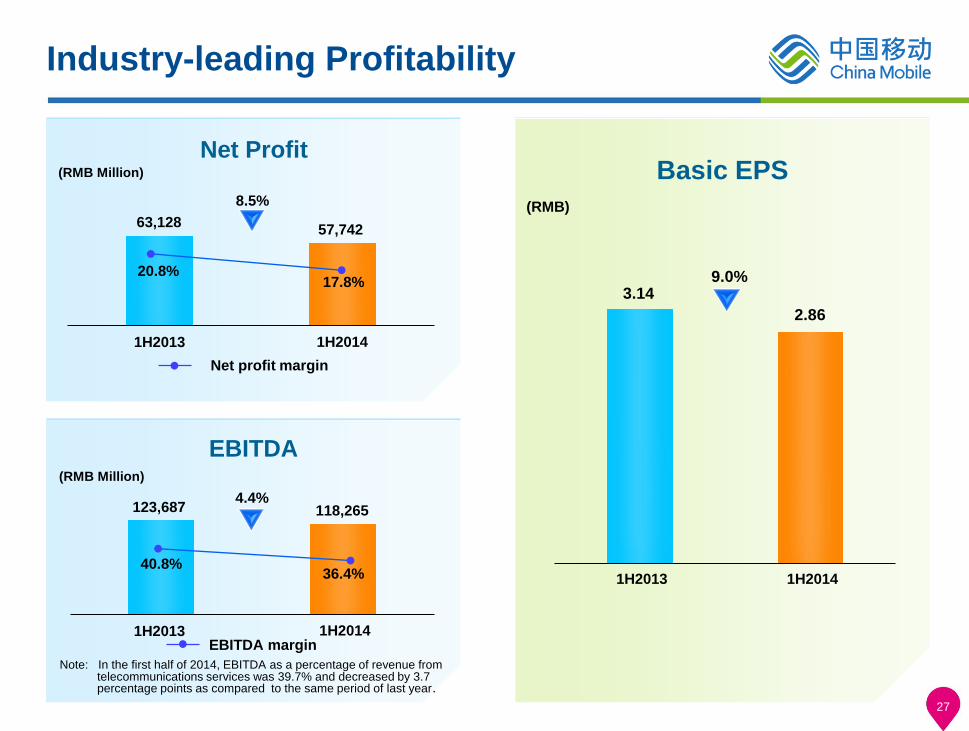
27
EBITDA
Net Profit
Industry-leading Profitability
(RMB Million)
(RMB Million)
63,128 57,742
20.8% 17.8%
1H2013 1H2014
8.5%
Net profit margin
1H2013 1H2014
118,265
40.8% 36.4%
4.4%
EBITDA margin
123,687
(RMB)
Basic EPS
1H2013
3.14
2.86
9.0%
1H2014
Note: In the first half of 2014, EBITDA as a percentage of revenue from telecommunications services was 39.7% and decreased by 3.7 percentage points as compared to the same period of last year.

28
Healthy and Efficient
Capital Management
Continued healthy
cash flow generating
capability
Secure fund
management
Centralized fund
allocation
Highly centralized
corporate financing
Prudent investment
strategies
Healthy Cash Flow Maintained Continuously
(RMB Million)
Free Cash Flow
Net Cash Inflow from
Operating Activities
(RMB Million)
120,066 125,206
1H2013 1H2014
Support the
continuously
favorable business
growth
Provided a solid
foundation for the
sustainable healthy
development of the
Company
Created value for
shareholders
1H2013 1H2014
68,192
36,296
29
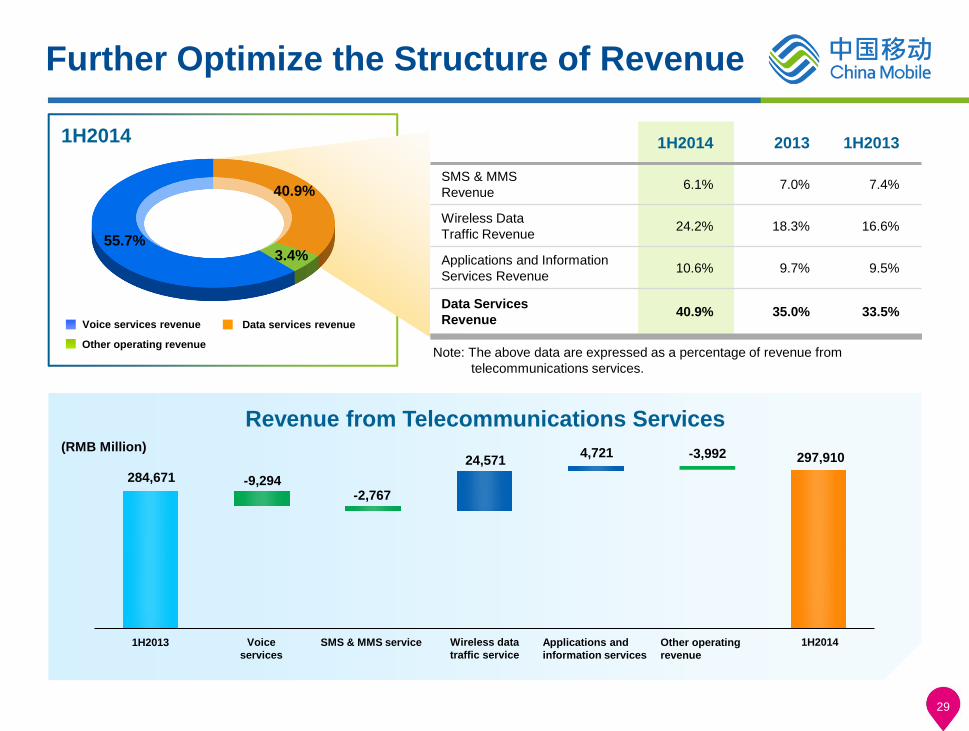
1H2014 2013 1H2013
SMS & MMS
Revenue 6.1% 7.0% 7.4%
Wireless Data
Traffic Revenue 24.2% 18.3% 16.6%
Applications and Information
Services Revenue 10.6% 9.7% 9.5%
Data Services
Revenue 40.9% 35.0% 33.5%
Further Optimize the Structure of Revenue
Note: The above data are expressed as a percentage of revenue from
telecommunications services.
1H2014
Voice services revenue Data services revenue
Other operating revenue
55.7%
40.9%
3.4%
Revenue from Telecommunications Services
-3,992 297,910 4,721
-9,294 284,671
24,571
-2,767
Voice
services
Wireless data
traffic service
Applications and
information services
1H2014 1H2013 Other operating
revenue
SMS & MMS service
(RMB Million)
30
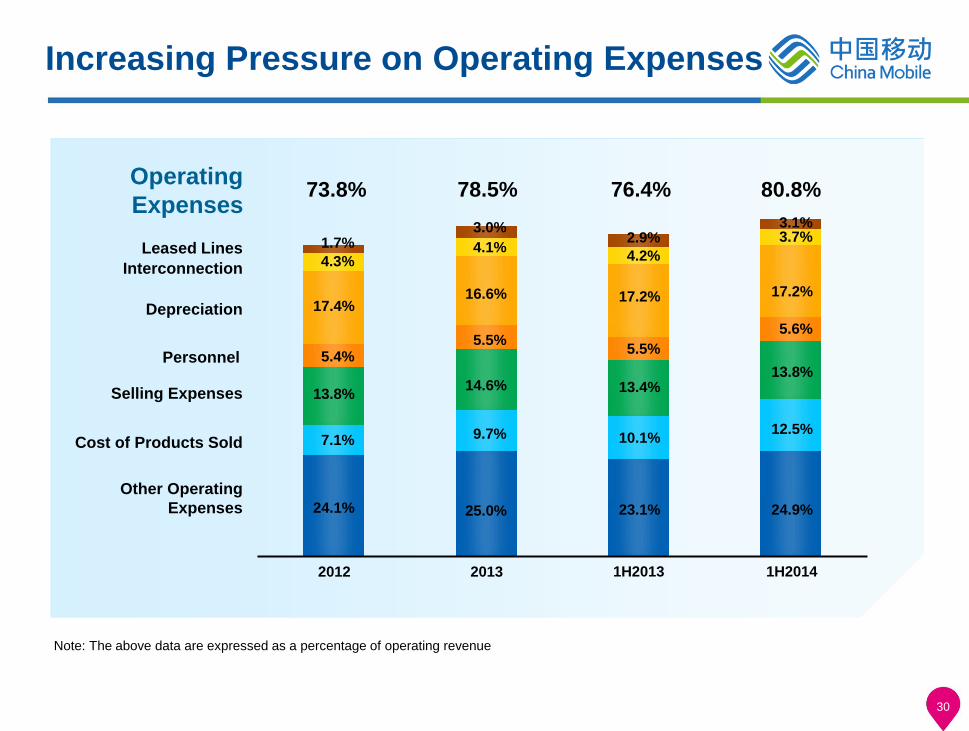
Increasing Pressure on Operating Expenses
Operating
Expenses
2013 1H2014
3.7%
17.2%
5.6%
13.8%
24.9%
80.8%
12.5%
3.1%
2012 1H2013
17.4%
5.4%
13.8%
24.1%
73.8%
7.1%
1.7%
16.6%
5.5%
14.6%
25.0%
78.5%
9.7%
3.0%
4.3 % 4.1%
4.2%
17.2%
5.5%
13.4%
23.1%
76.4%
10.1%
2.9%
Cost of Products Sold
Personnel
Depreciation
Interconnection
Leased Lines
Selling Expenses
Other Operating
Expenses
Note: The above data are expressed as a percentage of operating revenue
31
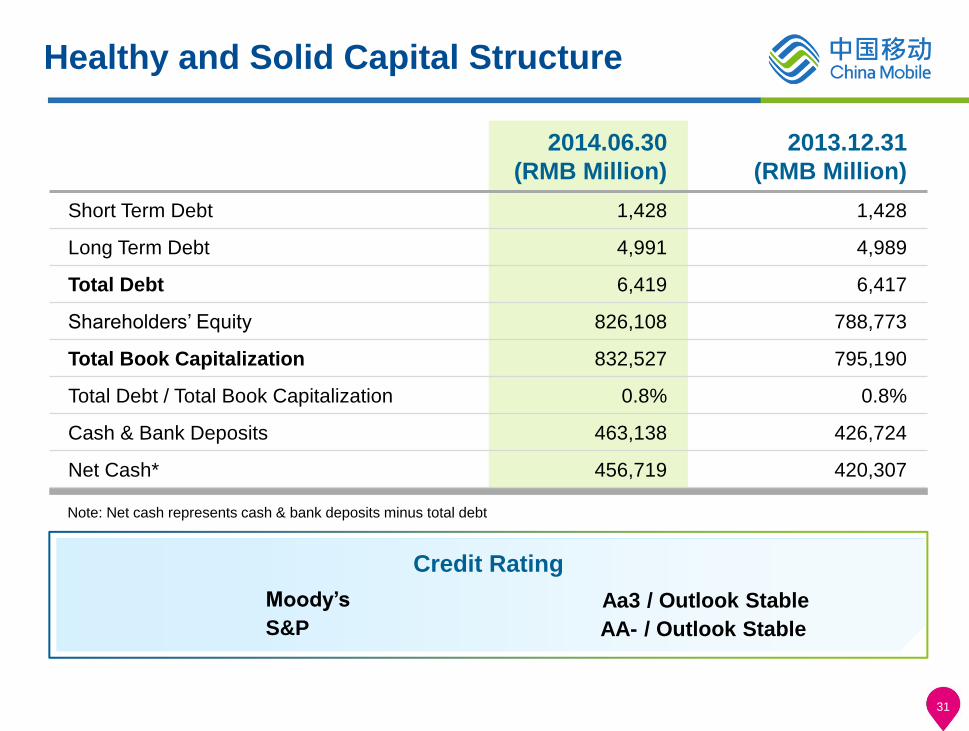
2014.06.30
(RMB Million)
2013.12.31
(RMB Million)
Short Term Debt 1,428 1,428
Long Term Debt 4,991 4,989
Total Debt 6,419 6,417
Shareholders’ Equity 826,108 788,773
Total Book Capitalization 832,527 795,190
Total Debt / Total Book Capitalization 0.8% 0.8%
Cash & Bank Deposits 463,138 426,724
Net Cash* 456,719 420,307
Healthy and Solid Capital Structure
Note: Net cash represents cash & bank deposits minus total debt
Credit Rating
Moody’s
S&P
Aa3 / Outlook Stable
AA- / Outlook Stable
32
Thank You
33
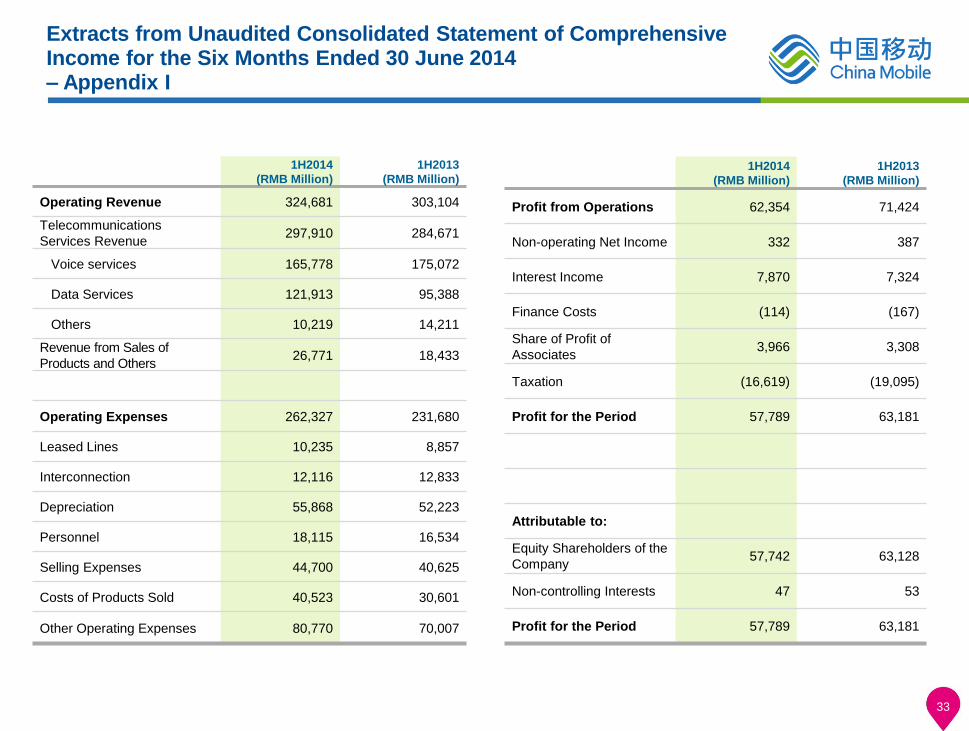
Extracts from Unaudited Consolidated Statement of Comprehensive Income for the Six Months Ended 30 June 2014 – Appendix I
1H2014
(RMB Million)
1H2013
(RMB Million)
Operating Revenue 324,681 303,104
Telecommunications
Services Revenue 297,910 284,671
Voice services 165,778 175,072
Data Services 121,913 95,388
Others 10,219 14,211
Revenue from Sales of
Products and Others 26,771 18,433
Operating Expenses 262,327 231,680
Leased Lines 10,235 8,857
Interconnection 12,116 12,833
Depreciation 55,868 52,223
Personnel 18,115 16,534
Selling Expenses 44,700 40,625
Costs of Products Sold 40,523 30,601
Other Operating Expenses 80,770 70,007
1H2014
(RMB Million)
1H2013
(RMB Million)
Profit from Operations 62,354 71,424
Non-operating Net Income 332 387
Interest Income 7,870 7,324
Finance Costs (114) (167)
Share of Profit of
Associates 3,966 3,308
Taxation (16,619) (19,095)
Profit for the Period 57,789 63,181
Attributable to:
Equity Shareholders of the
Company 57,742 63,128
Non-controlling Interests 47 53
Profit for the Period 57,789 63,181

34
Extracts from Unaudited Consolidated Balance Sheet as at 30 June 2014 – Appendix II
2014.06.30
(RMB Million)
2013.12.31
(RMB Million)
Current Assets 505,985 467,189
Non-current Assets 738,181 700,203
Total Assets 1,244,166 1,167,392
Current Liabilities (410,298) (370,913)
Non-current Liabilities (5,772) (5,755)
Total Liabilities (416,070) (376,668)
Net Assets 828,096 790,724

35
Operating Data – Appendix III
1H2014 2013
Total Customers (Million) 790.61 767.21
of which: 3G Customers (Million) 238.52 191.62
4G Customers (Million) 13.94 -
MOU (Minutes/User/Month) 460 486
ARPU (RMB/User/Month) 64 67
Average Voice Services Revenue per Minute (RMB) 0.078 0.082
Total Voice Usage (Billion Minutes) 2,134.1 4,316.0
Mobile Data Traffic (Billion MB) 426.5 526.8
SMS Usage (Billion Message) 305.8 734.1
Average Monthly Churn Rate 3.18% 3.15%
Average Handset Data Traffic per Month
(MB/User/Month) 119 72
Handsets Sold through
All Distribution Channels (Million) 120 150
36
Certain Statements contained in this document may be viewed as “forward-looking
statement” within the meaning of Section 27A of the U.S. Securities Act of 1993, as
amended, and Section 21E of the U.S. Securities Exchange Act of 1934, as
amended. Such forward-looking statements involve known and unknown risks,
uncertainties and other factors, which may cause the actual performance, financial
condition or results of operations of China Mobile Limited (the “Company”) to be
materially different from any future performance, financial conditions and results of
operations implied by such forward-looking statements. Further information
regarding these risks, uncertainties and other factors is included in the Company’s
most recent Annual Report on Form 20-F filed with the U.S. Securities and
Exchange Commission (the “SEC”) and the Company’s other filings with the SEC.
Forward-looking Statement