2014 infectious disease annual report - licking county health department …€¦ · ·...
TRANSCRIPT

Licking County Health Department
2014 Infectious Disease Annual Report
Healthy people living in healthy communities

2014 Infectious Disease Annual Report
Healthy people living in healthy communities
SUMMARY OF 2014 EVENTSThe Licking County Health Department (LCHD) is dedicated to conducting disease surveillance and continues to evaluate investigation protocols to better serve county residents. Notable events from 2014 that members of the LCHD Epidemiological Team (Epi Team) participated in include: the Ebola preparedness response, a Measles Outbreak, and a Mumps Outbreak. During the Ebola preparedness response, Epi Team members familiarized themselves with new recommendations and protocols developed by the Centers for Disease Control and Prevention and responded to an event in the county. The event was a false alarm, but an excellent opportunity to test our department’s response. Working plans have been updated to account for the events from 2014, and new plans are being drafted to address other important issues.
HEALTH ALERT NETWORK Several Health Alert Network (HAN) messages were sent out to local providers providing information on infectious disease activity and guidance. During the Ebola preparedness response, the network proved its value for quickly disseminating information to county partners.
IRIS RECRUITMENTThe LCHD continues to recruit and expand the Influenza Reporting Information System (IRIS) in order to collect more data on influenza activity in the county. One additional provider was added to the program and a recruitment letter was sent to all of the long-term care facilities gauging their interest in participating in IRIS. A few locations were reporting influenza statistics during peak weeks, but have slowed as influenza activity for the season is winding down.
LCHD EPI TEAMThe LCHD’s Epidemiological Team met frequently during 2014 to discuss local infectious disease activity and emerging issues in the county. The team consists of staff from LCHD and a representative from Licking Memorial Health Systems (LMHS). During the Ebola preparedness response, the team expanded to include more members from LMHS and Emergency Management Agency (EMA). The team met to coordinate a potential response for an Ebola case in the county. Together, the team was able to distribute information directly from CDC and Ohio Department of Health (ODH) out to county partners and first responders. Team members also provided guidance during Ebola drills and exercises conducted in the county.
STAFF INFECTIOUS DISEASE TRAININGThe LCHD’s Infectious Disease Nurse held a training with the department’s environmental staff to discuss common infectious diseases in the county and explain how investigations are conducted. Collaboration between environmental health and nursing are important in preventing, controlling and reducing all types of diseases in the county.

2014 Infectious Disease Annual Report
Healthy people living in healthy communities
REPORTABLE DISEASESThere are three classes of reportable diseases in Ohio which require different timeframes for notifications based on their importance and impact on the health of the public.
CLASS A = 3 casesDiseases of major public health concern because of the severity of disease or potential for epidemic spread – report immediately via telephone upon recognition that a case, a suspected case, or a positive laboratory result exists.
CLASS B = 1,149 casesDisease of public health concern needing timely response because of potential for epidemic spread – report by the end of the next business day after the existence of a case, suspected case, or a positive laboratory result is known.
CLASS C = 8 outbreaksReport an outbreak, unusual incident or epidemic of other diseases by the end of the next business day.
2014 Licking County Confirmed Outbreaks
1 Hepatitis C - chronic: 70.1
2 Pertussis: 34.4
3 Campylobacteriosis: 18.4
4 Salmonella: 10.7
5 Hepatitis B (including delta) - chronic : 10.1
Top 5 Class B Incidence Rates (Rates per 100,000)
GONORRHEA• 49.6% increase from 2013• 37.5% of cases were coinfections of Chlamydia
CHLAMYDIA • 3% increase from 2013• 27.1% of cases had prior Chlamydia infections
Sexually Transmitted Diseases

2014 Infectious Disease Annual Report
Healthy people living in healthy communities
Top Reportable Diseases in Licking County in Comparison to Central Region Counties (Rate per 100,000)
CENTRAL REGION COUNTIES
HEPATITIS C - CHRONIC PERTUSSIS CAMPYLOBACTERIOSIS SALMONELLOSIS HEPATITIS B - CHRONIC CHLAMYDIA GONORRHEA
Cases Rate Cases Rate Cases Rate Cases Rate Cases Rate Cases Rate Cases Rate
Crawford 87 203.2 1 2.3 1 2.3 3 7.0 20 46.7 191 446.2 23 53.7
Delaware 86 46.5 45 24.3 13 7.0 17 9.2 35 18.9 312 168.7 50 27.0
Fairfield 247 165.9 18 12.1 2 1.3 13 8.7 40 26.9 323 217.0 43 28.9
Fayette 63 218.1 5 17.3 10 34.6 1 3.5 26 90.0 89 308.2 6 20.8
Franklin 1,764 145.5 363 29.9 82 6.8 161 13.3 652 53.8 8,579 707.7 2,953 243.6
Hardin 59 186.5 2 6.3 11 34.8 2 6.3 8 25.3 73 230.7 11 34.8
Knox 64 105.2 6 9.9 7 11.5 8 13.2 4 6.6 130 213.8 12 19.7
Licking 118 70.1 58 34.4 31 18.4 18 10.7 17 10.1 556 330.2 136 80.8
Logan 32 70.4 30 66.0 3 6.6 5 11.0 1 2.2 113 248.5 28 61.6
Madison 150 346.6 8 18.5 11 25.4 0 0.0 32 73.9 105 242.6 15 34.7
Marion 191 289.8 4 6.1 4 6.1 10 15.2 42 63.7 367 556.9 105 159.3
Morrow 43 122.7 4 11.4 4 11.4 6 17.1 5 14.3 66 188.4 4 11.4
Pickaway 1,101 1,955.5 8 14.2 7 12.4 6 10.7 95 168.7 145 257.5 27 48.0
Union 702 1,316.9 8 15.0 23 43.1 8 15.0 263 493.4 230 431.5 36 67.5
Wyandot 16 71.3 0 0.0 4 17.8 0 0.0 2 8.9 40 178.2 5 22.3
OHIO 18,546 160.0 1,464 12.6 940 8.1 1,202 10.4 3,825 33.0 53,580 462.1 15,767 136.0

2014 Infectious Disease Annual Report
Healthy people living in healthy communities
Review of Top Reportable Diseases in Licking County
HEPATITIS C – CHRONIC: Increases in Hepatitis C cases continue to be seen across Ohio. The major contributing factor appears to be an increase in the use of injection drugs. Prescription drug abuse is resulting in cheaper alternatives, such as heroin, and leading to more Hepatitis cases.
PERTUSSIS: Reporting lag continues to be a major issue for public health when attempting to control the spread of Pertussis. Several factors come into play including cases not seeking medical attention during the communicable stage of disease, clinicians misdiagnosing cases, and cases not isolating themselves for recommended timeframes. Licking County had the second highest rate of Pertussis in 2014 in the Central Ohio Region. The county had one confirmed outbreak linked to a local school.
CAMPYLOBACTERIOSIS: Sporadic cases of Campylobacter (Campy) continue to occur throughout Licking County. A common exposure identified amongst cases in 2014 that could potentially explain Campy infections was home-raised chickens for egg production. The source of infection cannot be confirm at this time, but LCHD staff continue to collect data to investigate this topic. Campylobacter cases decreased by 26.2 percent compared to 2013 but ranked third in the top reportable diseases for 2014.
SALMONELLOSIS: A single confirmed outbreak of Salmonella was reported in 2014three members of the same household. All other cases were isolated throughout the county. Salmonella increased by 20.0 percent compared to 2013.
HEPATITIS B – CHRONIC: Increases in Hepatitis B cases can be attributed to the use of injection drugs.
CHLAMYDIA: Licking County had an increase in Chlamydia cases (3 percent increase from 2013) and ranked fifth amongst the Central Ohio Region counties for Chlamydia levels. 27.1 percent of the cases reported in 2014 had prior Chlamydia infections.
GONORRHEA: A significant increase (49.6 percent) in the number of Gonorrhea cases were identified in 2014. 37.5 percent of Gonorrhea cases were co-infections of Chlamydia
in 2014. Chlamydia has been the primary focus of STD interventions in the county, but based on these figures Gonorrhea will also become a priority.

2014 Infectious Disease Annual Report
Healthy people living in healthy communities
INFLUENZAThe Licking County Health Department uses several different techniques to track local influenza activity. Influenza is not a reportable disease unless under certain conditions including a case being hospitalized, a pediatric death, or detection of a novel strain. In 2010, LCHD developed the Influenza Reporting Information System (IRIS) which collects weekly influenza statistics from local providers. Predicting influenza activity is a difficult task, but based on our historical data, flu seasons can start as early as Week 39 and last through Week 26. For this report, data will be included for the 2013 – 2014 season and 2014 – 2015 season.
Licking County Influenza Surveillance Flu Totals
Flu TotalsCases
IRIS HospitalizationsPediatric Mortality
Novel Total
2013 - 2014 Season 904 51 0 0 955
2014 - 2015 Season 1,852 62 1 0 1,915
Total Cases in 2014 1,692 64 1 0 1,757
*Flu seasons typically over-lap two calendar years. Total Cases in 2014 countfrom Jan. 1 - Dec. 31, 2014.
Licking County Influenza Surveillance Flu Types
Flu TotalsIRIS Flu Types
Rapid A's Rapid B's Symptomatic Total
2013 - 2014 Season 519 128 257 904
2014 - 2015 Season 1029 156 667 1,852
Total Cases in 2014 983 134 575 1,692
*Flu seasons typically over-lap two calendar years. Total Cases in 2014 countfrom Jan. 1 - Dec. 31, 2014.

2014 Infectious Disease Annual Report
Healthy people living in healthy communities
OUTBREAKSThe Licking County Health Department investigated a total of eight outbreaks in 2014. Typically, outbreaks are reported to LCHD from either nursing homes or daycares. In 2014, 63 percent of the outbreaks in Licking County occurred in nursing homes and daycares. Causes of these outbreaks included Norovirus, Influenza, Scabies, and Hand, Foot, and Mouth Disease. Licking County had a single case involved in a multi-state outbreak of Campylobacter associated with a mission trip to the Dominican Republic. A Salmonella outbreak confined to a single household and a Pertussis outbreak linked to a local school rounded out the investigations conducted in 2014.
NOROVIRUS
Looking at historical figures for confirmed outbreaks of Norovirus in Licking County, 77 percent of these outbreaks have occurred between the months of January - March. Norovirus has been the number one cause of outbreaks in Licking County, dating back to 2001.
HISTORY OF OUTBREAKS
Attempts were made to analyze all available data on Licking County outbreaks to determine if a timeframe can be associated with a causative agent. With the exception of Norovirus, more data needs to be collected to draw any conclusions.

2014 Infectious Disease Annual Report
Healthy people living in healthy communities
2014REPORTABLE DISEASE JAN FEB MAR APR MAY JUN JUL AUG SEP OCT NOV DEC YTD
Amebiasis 0 0 0 0 0 0 0 0 0 0 0 0 0 −
Anaplasmosis - Anaplasma phagocytophilum 0 0 0 0 0 0 0 0 0 0 0 1 1
Anthrax 0 0 0 0 0 0 0 0 0 0 0 0 0 −
Botulism - foodborne 0 0 0 0 0 0 0 0 0 0 0 0 0 −
Botulism - infant 0 0 0 0 0 0 0 0 0 0 1 0 1
Botulism - wound 0 0 0 0 0 0 0 0 0 0 0 0 0 −
Brucellosis 0 0 0 0 0 0 0 0 0 0 0 0 0 −
Campylobacteriosis 1 1 2 2 1 5 10 4 0 1 3 1 31
Chancroid 0 0 0 0 0 0 0 0 0 0 0 0 0 −
Chlamydia 47 39 48 52 51 36 30 44 47 57 57 48 556
Cholera 0 0 0 0 0 0 0 0 0 0 0 0 0 −
Coccidiodomycosis 0 0 0 0 0 0 0 0 0 0 0 0 0 −
Creutzfeldt - Jakob Disease 0 0 0 0 0 0 0 0 1 0 0 0 1 −
Creutzfeldt - Jakob Disease - variant (vCJD) 0 0 0 0 0 0 0 0 0 0 0 0 0 −
Cryptosporidiosis 0 0 0 0 0 1 1 0 1 2 0 0 5
Cyclosporiasis 0 0 0 0 0 0 0 0 0 0 0 0 0 −
Cytomegalovirus - congenital (CMV) 0 0 0 0 0 0 0 0 0 0 0 0 0
Dengue 0 0 0 0 0 0 0 0 0 0 0 0 0 −
Dengue Hemorrhagic Fever 0 0 0 0 0 0 0 0 0 0 0 0 0 −
Diphtheria 0 0 0 0 0 0 0 0 0 0 0 0 0 −
E.coli - Not O157:H7 0 0 0 1 0 0 1 0 0 0 0 0 2
E.coli - O157:H7 0 0 0 0 0 1 0 1 0 0 0 0 2
E.coli - Unknown serotype 0 0 0 0 0 0 1 0 0 0 0 0 1 −
*Arrows indicate an increase or decrease compared to 2013 Infectious Disease Totals.

2014 Infectious Disease Annual Report
Healthy people living in healthy communities
2014REPORTABLE DISEASE JAN FEB MAR APR MAY JUN JUL AUG SEP OCT NOV DEC YTD
Eastern equine encephalitis virus disease 0 0 0 0 0 0 0 0 0 0 0 0 0 −
Ehrlichiosis/Anaplasmosis - Undetermined 0 0 0 0 0 0 0 0 0 0 0 0 0 −
Ehrlichiosis-Ehrlichia chaffeensis 0 0 0 0 0 0 0 1 0 0 0 0 1
Ehrlichiosis-Ehrlichia ewingii 0 0 0 0 0 0 0 0 0 0 0 0 0 −
Encephalitis - post chickenpox 0 0 0 0 0 0 0 0 0 0 0 0 0 −
Encephalitis - post mumps 0 0 0 0 0 0 0 0 0 0 0 0 0 −
Encephalitis - post other infection 0 0 0 0 0 0 0 0 0 0 0 0 0 −
Encephalitis - primary viral 0 0 0 0 0 0 0 0 0 0 0 0 0 −
Giardiasis 1 0 0 0 0 0 0 0 0 0 0 0 1
Gonorrhea 8 9 13 10 12 10 8 12 13 17 11 13 136
Granuloma inguinale 0 0 0 0 0 0 0 0 0 0 0 0 0 −
Haemophilus influenzae (invasive disease) 0 0 0 0 0 0 0 0 0 0 1 1 2
Hantavirus - infection 0 0 0 0 0 0 0 0 0 0 0 0 0 −
Hantavirus - pulmonary syndrome 0 0 0 0 0 0 0 0 0 0 0 0 0 −
Hemolytic uremic syndrome (HUS) 0 0 0 0 0 0 0 0 0 0 0 0 0 −
Hepatitis - acute viral undetermined etiology 0 0 0 0 0 0 0 0 0 0 0 0 0 −
Hepatitis A 0 0 0 0 0 0 0 0 0 1 0 0 1
Hepatitis B - investigation 0 0 0 0 0 0 0 0 0 0 0 0 0 −
Hepatitis B - Perinatal Infection 0 1 0 0 1 0 0 0 0 0 0 0 2
Hepatitis B (including delta) - acute 0 0 0 0 1 1 0 0 0 0 0 0 2
Hepatitis B (including delta) - acute/chronic 0 0 0 0 0 0 0 0 0 0 0 0 0 −
Hepatitis B (including delta) - chronic 2 0 0 0 1 3 0 0 1 4 3 3 17
Hepatitis C - acute 0 0 0 0 0 0 1 0 0 0 0 0 1
*Arrows indicate an increase or decrease compared to 2013 Infectious Disease Totals.

2014 Infectious Disease Annual Report
Healthy people living in healthy communities
2014REPORTABLE DISEASE JAN FEB MAR APR MAY JUN JUL AUG SEP OCT NOV DEC YTD
Hepatitis C - acute/chronic 0 0 0 0 0 0 0 0 0 0 0 0 0 −
Hepatitis C - chronic 12 6 17 13 7 11 5 8 8 7 11 13 118
Hepatitis E 0 0 0 0 0 0 0 0 0 0 0 0 0 −
Herpes - congenital 0 0 0 0 0 0 0 0 0 0 0 0 0 −
Immigrant Investigation 0 0 0 0 0 0 0 0 0 0 0 0 0 −
Influenza – ODH Lab Results 0 0 0 0 0 0 0 0 0 0 0 0 0 −
Influenza – associated hospitalization 23 7 10 1 0 1 0 0 0 0 1 58 101
Influenza – associated pediatric mortality 0 0 0 0 0 0 0 0 0 0 1 0 1
Influenza Seasonal (IRIS) 545 96 31 40 5 2 1 3 4 16 22 927 1692
Kawasaki disease 0 0 0 0 0 0 0 0 0 0 0 0 0 −
LaCrosse virus disease 0 0 0 0 0 0 0 0 1 0 0 0 1 −
Legionellosis – Legionnaires’ Disease 1 0 1 0 0 0 0 4 2 1 0 0 9
Leprosy (Hansen Disease) 0 0 0 0 0 0 0 0 0 0 0 0 0 −
Leptospirosis 0 0 0 0 0 0 0 0 0 0 0 0 0 −
Listeriosis 0 0 1 0 0 1 0 0 0 0 0 0 2
Lyme Disease 0 0 0 1 1 2 0 1 0 0 0 0 5 −
Lymphogranuloma venereum (LGV) 0 0 0 0 0 0 0 0 0 0 0 0 0 −
Malaria 0 0 0 0 0 0 0 0 0 0 0 0 0 −
Measles – imported from outside Ohio 0 0 0 0 0 0 0 0 0 0 0 0 0 −
Measles – indigenous to Ohio 0 0 0 0 3 0 0 0 0 0 0 0 3
Measles – status not determined 0 0 0 0 0 0 0 0 0 0 0 0 0 −
Meningitis – aseptic/viral 1 0 0 0 0 0 0 0 1 2 0 0 4
Meningitis – bacterial (Not N. meningitidis) 0 0 0 0 0 0 0 0 0 0 0 0 0 −
* Arrows indicate an increase or decrease compared to 2013 Infectious Disease Totals.
2014 Infectious Disease Annual Report
Healthy people living in healthy communities
2014REPORTABLE DISEASE JAN FEB MAR APR MAY JUN JUL AUG SEP OCT NOV DEC YTD
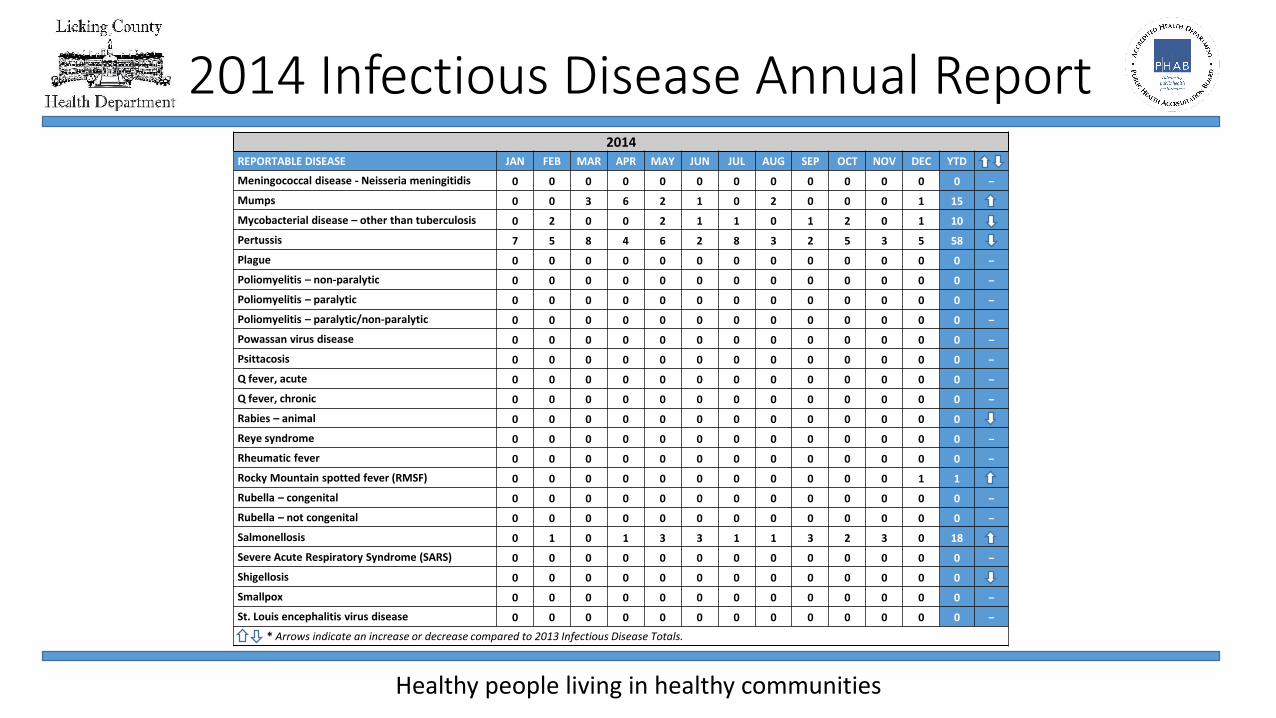
Meningococcal disease - Neisseria meningitidis 0 0 0 0 0 0 0 0 0 0 0 0 0 −
Mumps 0 0 3 6 2 1 0 2 0 0 0 1 15
Mycobacterial disease – other than tuberculosis 0 2 0 0 2 1 1 0 1 2 0 1 10
Pertussis 7 5 8 4 6 2 8 3 2 5 3 5 58
Plague 0 0 0 0 0 0 0 0 0 0 0 0 0 −
Poliomyelitis – non-paralytic 0 0 0 0 0 0 0 0 0 0 0 0 0 −
Poliomyelitis – paralytic 0 0 0 0 0 0 0 0 0 0 0 0 0 −
Poliomyelitis – paralytic/non-paralytic 0 0 0 0 0 0 0 0 0 0 0 0 0 −
Powassan virus disease 0 0 0 0 0 0 0 0 0 0 0 0 0 −
Psittacosis 0 0 0 0 0 0 0 0 0 0 0 0 0 −
Q fever, acute 0 0 0 0 0 0 0 0 0 0 0 0 0 −
Q fever, chronic 0 0 0 0 0 0 0 0 0 0 0 0 0 −
Rabies – animal 0 0 0 0 0 0 0 0 0 0 0 0 0
Reye syndrome 0 0 0 0 0 0 0 0 0 0 0 0 0 −
Rheumatic fever 0 0 0 0 0 0 0 0 0 0 0 0 0 −
Rocky Mountain spotted fever (RMSF) 0 0 0 0 0 0 0 0 0 0 0 1 1
Rubella – congenital 0 0 0 0 0 0 0 0 0 0 0 0 0 −
Rubella – not congenital 0 0 0 0 0 0 0 0 0 0 0 0 0 −
Salmonellosis 0 1 0 1 3 3 1 1 3 2 3 0 18
Severe Acute Respiratory Syndrome (SARS) 0 0 0 0 0 0 0 0 0 0 0 0 0 −
Shigellosis 0 0 0 0 0 0 0 0 0 0 0 0 0
Smallpox 0 0 0 0 0 0 0 0 0 0 0 0 0 −
St. Louis encephalitis virus disease 0 0 0 0 0 0 0 0 0 0 0 0 0 −
* Arrows indicate an increase or decrease compared to 2013 Infectious Disease Totals.

2014 Infectious Disease Annual Report
Healthy people living in healthy communities
2014REPORTABLE DISEASE JAN FEB MAR APR MAY JUN JUL AUG SEP OCT NOV DEC YTD
Staphylococcal aureus - intermediate (VISA) 0 0 0 0 0 0 0 0 0 0 0 0 0 −
Staphylococcal aureus - vancomycin resistant (VRSA) 0 0 0 0 0 0 0 0 0 0 0 0 0 −
Streptococcal – Group A – invasive 0 0 1 0 0 0 0 0 0 0 0 0 1
Streptococcal – Group B – in newborn 0 0 0 0 0 0 0 0 0 0 0 0 0 −
Streptococcal toxic shock syndrome (STSS) 0 0 0 0 0 0 0 0 0 0 0 0 0 −
Streptococcus pneumoniae - unknown resistance 4 1 0 2 0 0 1 1 0 1 0 1 11
Streptococcus pneumoniae – intermediate resistance 2 0 1 0 0 1 0 0 2 0 0 1 7
Syphilis – congenital 0 0 0 0 0 0 0 0 0 0 0 0 0 −
Syphilis – early latent (<1 year) 0 0 0 1 0 0 1 0 0 2 1 0 5
Syphilis – late latent (>1 year) asymptomatic 1 0 0 0 1 0 0 0 1 0 0 0 3 −
Syphilis – late with no neurosyphilis 0 0 0 0 0 0 0 0 0 0 0 0 0 −
Syphilis – neurosyphilis 0 0 0 0 0 0 0 0 0 0 0 0 0 −
Syphilis – primary 0 0 0 0 0 0 0 0 0 1 0 0 1
Syphilis – secondary 0 0 0 0 0 0 0 0 0 2 0 1 3 −
Syphilis – stage Unknown 0 0 0 0 0 0 0 0 0 0 0 0 0 −
Syphilis – unknown latent 0 0 0 0 0 0 0 0 0 0 0 0 0 −
Tetanus 0 0 0 0 0 0 0 0 0 0 0 0 0 −
Toxic shock syndrome (TSS) 0 0 0 0 0 0 0 0 0 0 0 0 0 −
Toxoplasmosis – congenital 0 0 0 0 0 0 0 0 0 0 0 0 0 −
Trichinosis 0 0 0 0 0 0 0 0 0 0 0 0 0 −
Tuberculosis 0 0 0 0 0 0 0 0 0 1 0 0 1 −
Tuberculosis – multi-drug resistant (MDR-TB) 0 0 0 0 0 0 0 0 0 0 0 0 0 −
* Arrows indicate an increase or decrease compared to 2013 Infectious Disease Totals.

2014 Infectious Disease Annual Report
Healthy people living in healthy communities
2014REPORTABLE DISEASE JAN FEB MAR APR MAY JUN JUL AUG SEP OCT NOV DEC YTD
Tularemia 0 0 0 0 0 0 0 0 0 0 0 0 0 −
Typhoid fever 0 0 0 0 0 0 0 0 0 0 0 0 0 −
Typhus fever 0 0 0 0 0 0 0 0 0 0 0 0 0 −
Varicella 1 0 0 2 2 0 0 2 0 0 0 0 7
Vibrio parahaemolyticus infection 0 0 0 0 0 0 0 0 0 0 0 0 0 −
Vibrio vulnificus infection 0 0 0 0 0 0 0 0 0 0 0 0 0 −
Vibriosis – other (not cholera) 0 0 0 0 0 0 0 0 0 0 0 0 0 −
Viral Hemorrhagic Fever (VHF) 0 0 0 0 0 0 0 0 0 0 0 0 0 −
West Nile virus disease 0 0 0 0 0 0 0 0 1 0 0 0 1
Western equine encephalitis virus disease 0 0 0 0 0 0 0 0 0 0 0 0 0 −
Yellow fever 0 0 0 0 0 0 0 0 0 0 0 0 0 −
Yersiniosis 0 0 0 0 0 0 0 0 0 0 0 0 0 −
* Arrows indicate an increase or decrease compared to 2013 Infectious Disease Totals.