2014 hospital inpatient discharge data annual report
TRANSCRIPT

2014 Hospital Inpatient Discharge Data Report New Mexico Department of Health
2014 Hospital Inpatient
Discharge Data Annual Report Health Systems Epidemiology Program
Epidemiology and Response Division
New Mexico Department of Health

2014 Hospital Inpatient Discharge Data Report 2 New Mexico Department of Health
2014 Hospital Inpatient Discharge Data Annual Report
Report Prepared by:
Victoria F. Dirmyer, PhD Kenneth Geter, MS Paige Best, MPH
Dataset Prepared by:
Gabriel Worley Brian Woods
Health Systems Epidemiology Program Epidemiology and Response Division New Mexico Department of Health
Retta Ward, MPH, Secretary of Health
Lynn Gallagher, Deputy Secretary of Health Michael Landen, MD, MPH, State Epidemiologist

2014 Hospital Inpatient Discharge Data Report 3 New Mexico Department of Health
Table of Contents
Executive Summary ………………………………………………………………………….……… 6
Methods ………...…………………………………………………………………………………… 7
Key Findings ………………………………………………………………………………………… 9
Overview of Hospitals and Hospitalizations in New Mexico
New Mexico Health and Human Services Regions …………………………………….…… 11
Location of New Mexico Hospitals …………………………………………………………. 11
Service Category of Participating New Mexico Hospitals ………………………………….. 12
Overall Hospital Inpatient Discharges
Demographic Characteristics of Discharged Patients
Figure 1. Discharges by Age and Sex, New Mexico, 2014 ………………………... 13
Figure 2. Discharge Rates by Age and Sex, New Mexico, 2014 …………………... 13
Figure 3. Discharges by Health Region and Sex, New Mexico, 2014 ……….…….. 14
Figure 4. Discharge Rates by Health Region and Sex, New Mexico, 2014 ...……... 14
Figure 5. Discharges by Age and Sex, New Mexico, 2011-2014 ……...…………... 15
Figure 6. Discharge Rates by Health Region and Sex, New Mexico, 2011-2014 …. 15
Figure 7. Discharges by Age and Sex, New Mexico (2012-2014) and
United States (2010) ………………………………………………………. 16
Discharges by Length of Stay
Figure 8. Percent of Hospital Inpatient Discharges by Average Length of Stay and Age,
New Mexico, 2014 ……………………………………………………………….. 16
Discharges by National Center for Health Statistics Top 21 Diagnoses
Table 1. Number of Discharges by NCHS Category and Sex, New Mexico, 2014 .. 17
Table 2. Discharge Rates by NCHS Category and Sex, New Mexico, 2014 ………. 18
Table 3. Number of Discharges by NCHS Category and Age Group, New Mexico,
2014 ………………………………………………………………………… 19
Table 4. Discharge Rates by NCHS Category and Age Group, New Mexico, 2014 .. 20
Table 5. Number of Discharges by NCHS Category and Health Region,
New Mexico, 2014 …………………………………………………………. 21
Table 6. Discharges Rates by NCHS Category and Health Region,
New Mexico, 2014 …………………………………………………………. 22
Figure 9. Discharge Rates by NCHS Category, New Mexico (2011-2014) and United
States (2010) …………………..……………………………………………. 23

2014 Hospital Inpatient Discharge Data Report 4 New Mexico Department of Health
Table of Contents – Continued
Patient Discharge Status
Figure 10. Percent of Discharges by Discharge Status and Sex, New Mexico, 2014 24
Table 7. Number of Discharges by Discharge Status and Sex, New Mexico, 2014 24
Leaving Against Medical Advice
Figure 11. Rate of AMA Discharges by Age, New Mexico, 2011-2014 …………… 25
Figure 12. Rate of AMA Discharges by Health Region, New Mexico, 2011-2014 … 25
In-Hospital Mortality
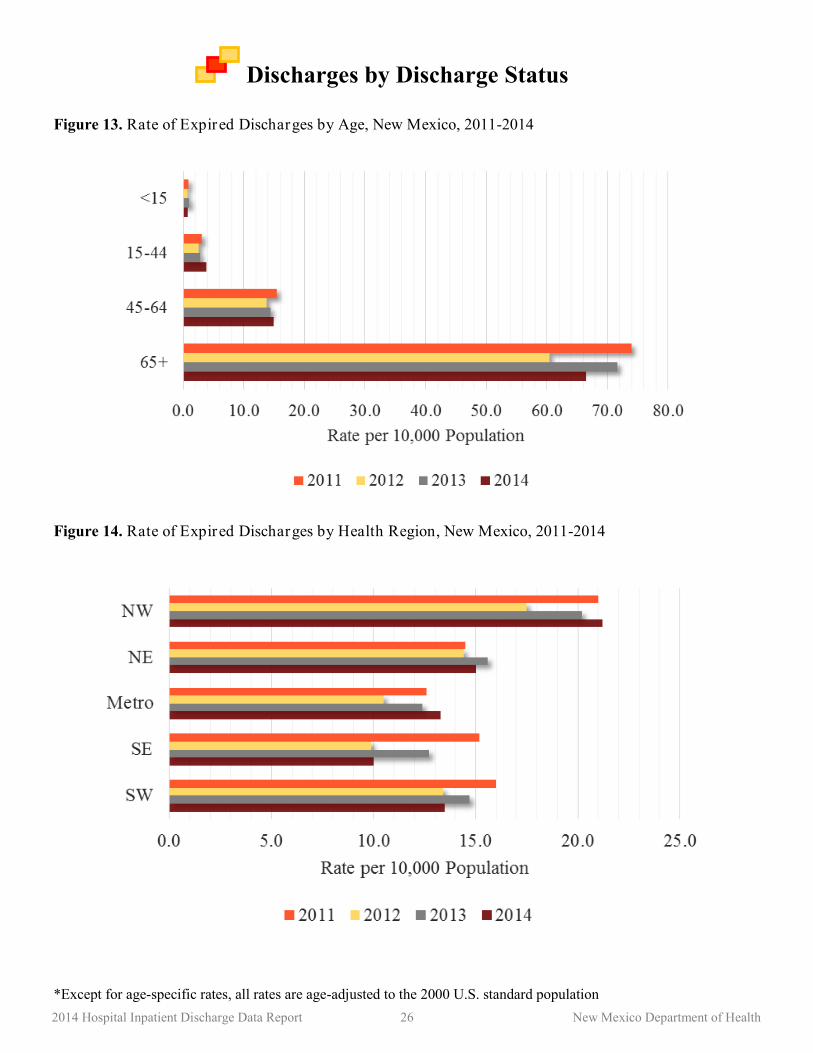
Figure 13. Rate of Expired Discharges by Age, New Mexico, 2011-2014 …………. 26
Figure 14. Rate of Expired Discharges by Health Region, New Mexico, 2011-2014. 26
Primary Payer Type
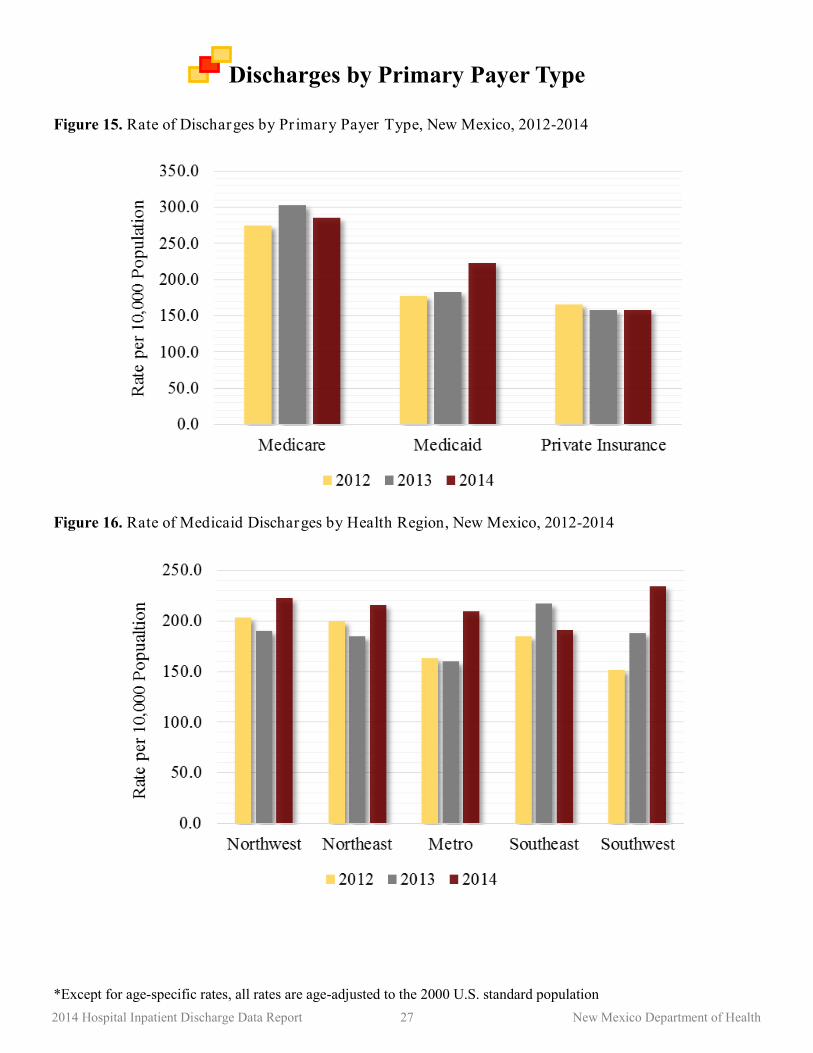
Figure 15. Rate of Discharges by Primary Payer Type, New Mexico, 2012-2014 …. 27
Figure 16. Rate of Medicaid Discharges by Health Region, New Mexico, 2012-2014 27
Figure 17. Rate of Medicare Discharges by Health Region, New Mexico, 2012-2014 28
Figure 18. Rate of Private Insurance Discharges by Health Region, New Mexico,
2012-2014 ………………………………………………………………….. 28
Special Topic: Ambulatory Care Sensitive Conditions
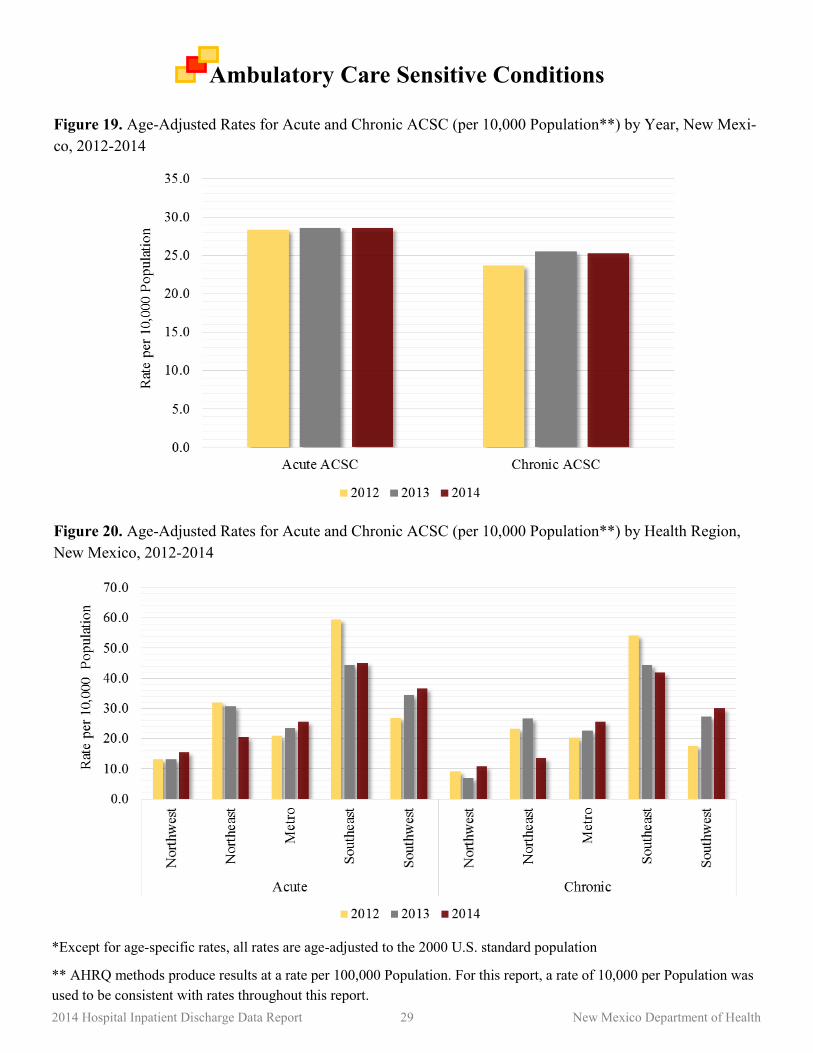
Figure 19. Age-Adjusted Rates for Acute and Chronic ACSC (per 10,000
Population) by Year, New Mexico, 2012-2014.……………….…………… 29
Figure 20. Age-Adjusted Rates for Acute and Chronic ACSC (per 10,000
Population) by Health Region, New Mexico, 2012-2014 .…….…………… 29
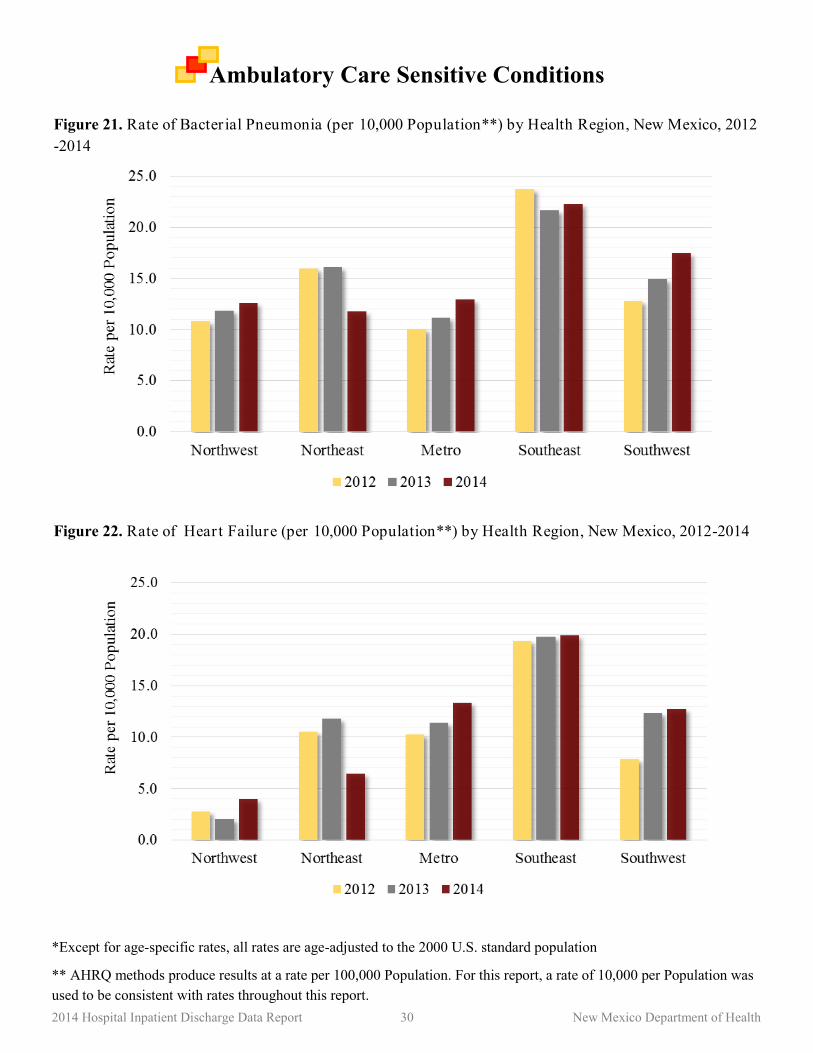
Figure 21. Rate of Bacterial Pneumonia (per 10,000 Population) by Health Region,
New Mexico, 2012-2014 ……………………………………….…………… 30
Figure 22. Rate of Heart Failure (per 10,000 Population) by Health Region,
New Mexico, 2012-2014 ……………………………………….…………… 30
Special Topic: Out of State Hospitalizations for New Mexico Residents
Figure 23. Percent of Arizona Hospitalizations based on New Mexico Patient
Residence, 2013 ……………………………………….……………………. 31
Figure 24. Percent of Colorado Hospitalizations based on New Mexico Patient
Residence, 2013 ……………………………………….……………………. 32
Figure 25. Percent of Texas Hospitalizations based on New Mexico Patient
Residence, 2013 ……………………………………….……………………. 33

2014 Hospital Inpatient Discharge Data Report 5 New Mexico Department of Health
Table of Contents – Continued
Figure 26. Hospitalization Rates (per 10,000 Population) based on New Mexico Patient
Residence, 2013 …………………………..……………...…………….. 34
Appendix
Appendix Table 1. Number of Discharges by Category of First-Listed Diagnosis and Sex,
New Mexico, 2014 ……………………………………………………… 36
Appendix Table 2. Discharge Rates by Category of First-Listed Diagnosis and Sex,
New Mexico, 2014 ……………………………………………………… 37
Appendix Table 3. Number of Discharges by Category of First-Listed Diagnosis and Age
Group, New Mexico, 2014 ……………………………………………… 38
Appendix Table 4. Discharge Rates by Category of First-Listed Diagnosis and Age Group,
New Mexico, 2014 ………………………………………………………. 39
Appendix Table 5. Number of Discharges by Category of First-Listed Diagnosis and Health
Region, New Mexico, 2014 ……………………………………………… 40
Appendix Table 6. Discharge Rates by Category of First-Listed Diagnosis and Health Region,
New Mexico, 2014 ……………………………………………………… 41
Appendix Figure 1. Discharge Rates by Category of First-Listed Diagnosis, New Mexico
(2011-2014) and United States (2010) …………………………………. 42
Appendix Table 7. Average Length of Stay by Category of First-Listed Diagnosis and
Sex, New Mexico, 2014 ………………………….………………… 43
Appendix Table 8. Average Length of Stay by Category of First-Listed Diagnosis and
Health Region, New Mexico, 2014 ……….…………………………… 44
Appendix Table 9. Average Length of Stay by Category of First-Listed Diagnosis and
Age Group, New Mexico, 2014 ………………….……………………. 45

2014 Hospital Inpatient Discharge Data Report 6 New Mexico Department of Health
Executive Summary
The NMDOH maintains the Hospital Inpatient Discharge Database (HIDD). This report is based on data
generated from the HIDD. The hospital inpatient diagnoses contained in the database were coded using the
International Classification of Diseases, Ninth Revision, Clinical Modification (ICD-9-CM). General and
specialty hospitals in the state are annually required to report hospital inpatient discharge data to the
NMDOH. Federal facilities are not required to report HIDD data to the NMDOH. Therefore, data from In-
dian Health Service (IHS) facilities and the Veterans Affairs (VA) Hospital are not included. However,
the NMDOH is exploring ways to access IHS and VA Hospital data.
An inpatient discharge occurs when a patient is admitted overnight to a hospital and leaves that hospital.
Thus, an individual who is transferred from hospital A to hospital B would be included in the discharges
from hospital A with a second discharge from hospital B.
This report presents overall New Mexico hospital inpatient discharge numbers, rates, and average
lengths of stay by age, Sex and region. In 2014, 37 general and 13 specialty hospitals reported hospital inpa-
tient discharge data to the NMDOH. These 37 non-federal, general hospitals reported a total of 155,006
discharges for New Mexico State residents (data from specialty hospitals were not included in this report).
Duplicate records and records with out-of-state or unknown zip codes, unknown age, unknown sex, un-
known or invalid primary diagnosis codes and discharges that were not inpatient discharges were excluded
from this count. Discharges of newborns were also excluded to be consistent with federal reporting stand-
ards.
Of the 155,006 reported discharges, approximately 60 percent were among females and 40 percent were
among males. Thirty-five percent of all discharges occurred among residents over the age of 64 years. The
highest discharge rate by region was 740.7 discharges per 10,000 population in the Southeast region, and the
lowest rates were in the Northeast region (679.6 discharges per 10,000 population).
2014 Hospital Inpatient Discharge Data Report 7 New Mexico Department of Health
Methods
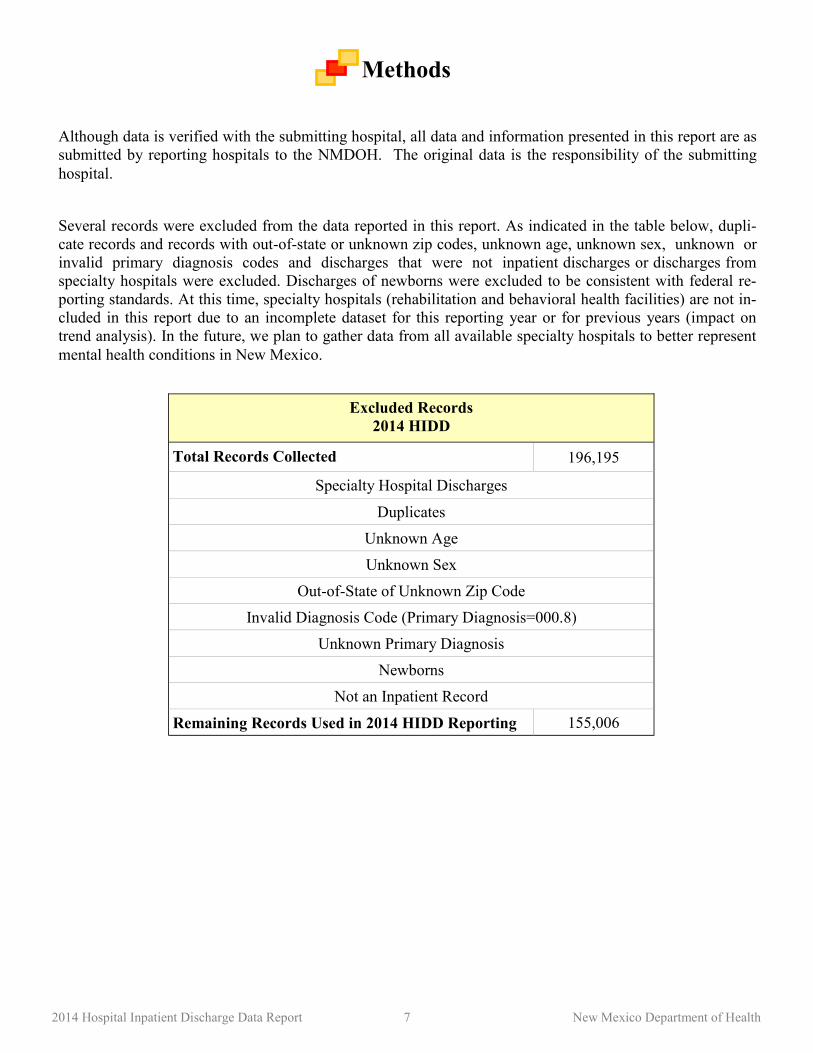
Although data is verified with the submitting hospital, all data and information presented in this report are as
submitted by reporting hospitals to the NMDOH. The original data is the responsibility of the submitting
hospital.
Several records were excluded from the data reported in this report. As indicated in the table below, dupli-
cate records and records with out-of-state or unknown zip codes, unknown age, unknown sex, unknown or
invalid primary diagnosis codes and discharges that were not inpatient discharges or discharges from
specialty hospitals were excluded. Discharges of newborns were excluded to be consistent with federal re-
porting standards. At this time, specialty hospitals (rehabilitation and behavioral health facilities) are not in-
cluded in this report due to an incomplete dataset for this reporting year or for previous years (impact on
trend analysis). In the future, we plan to gather data from all available specialty hospitals to better represent
mental health conditions in New Mexico.
Excluded Records
2014 HIDD
Total Records Collected 196,195
Specialty Hospital Discharges
Duplicates
Unknown Age
Unknown Sex
Out-of-State of Unknown Zip Code
Invalid Diagnosis Code (Primary Diagnosis=000.8)
Unknown Primary Diagnosis
Newborns
Not an Inpatient Record
Remaining Records Used in 2014 HIDD Reporting 155,006

2014 Hospital Inpatient Discharge Data Report 8 New Mexico Department of Health
Methods
New Mexico Hospital Inpatient Discharge Data: The New Mexico Health Information System (HIS)
was established in 1989 pursuant to the Health Information System Act, Section 24-14A-1 through Section
24-14A-10 NMSA 1978. The NMDOH is charged with creating rules regarding the collection, use and re-
porting of these data (NMAC 7.1.27). The rule relates to several specific areas, including specific infor-
mation to be reported by state licensed general and specialty hospitals, the data access policy and public
reporting requirements.
All New Mexico general and specialty hospitals are required to report hospital inpatient discharge data to
the NMDOH quarterly (not including federal hospitals). The NMDOH maintains the Hospital Inpatient Dis-
charge Database (HIDD). The 2014 New Mexico data presented in this report was generated from the
HIDD. The HIDD dataset is uploaded to NMDOH’s public health information resource: NM-IBIS (https://
ibis.health.state.nm.us/). The majority of the tables and graphs included in this report were generated from
queries completed on this platform.
United States Hospital Inpatient Discharge Data: U.S. data used for comparison with New Mexico data
were provided by the National Center for Health Statistics’ National Health Statistics Reports. The report
presents the most current nationally representative data on inpatient care, excluding newborns, in the U.S.
Data are from the 2010 National Hospital Discharge Survey, the longest continuously running nationally
representative survey of hospital utilization. This survey is a probability sample survey of non-federal hospi-
tals.
State Population Estimates: State population estimates used for the denominator in hospitalization dis-
charge rates were generated by the NM Population Estimates, Geospatial and Population Studies (GPS) Pro-
gram, University of New Mexico (http://gps.unm.edu/). The GPS evaluates all input data and employs a
housing unit-based methodology, validated by building permits and birth/death records. Population denomi-
nators 2014 were used. Rates were age-adjusted to the 2000 U.S. standard population, when indicated.
Ambulatory Care Sensitive Conditions: High rates of ambulatory care sensitive conditions (ACSC) are
an indication of a lack of access to, availability of, or quality of primary care services. Quality of primary
care services is illustrated by low rates of ACSC. ACSC are illnesses that can often be managed effectively
on an outpatient basis and generally do not result in hospitalization if managed properly. These conditions
include, but are not limited to bacterial pneumonia and congestive heart failure. These conditions commonly
impact a large number of people and often result in unnecessary hospitalizations. This causes health care
costs to increase, which could be avoided through quality primary care and early interventions.
The Agency of Healthcare Quality and Research’s (AHRQ) Prevention Quality Indicators calculation meth-
ods were used for this analysis (http://www.qualityindicators.ahrq.gov/Modules/PQI_TechSpec.aspx). The
New Mexico Hospital Inpatient Discharge Database (NM-HIDD) for 2014 was used to calculate age-adjusted
rates per 10,000 population for the ambulatory care sensitive conditions. The top 2 conditions were chosen
from the 2014 ACSC analysis. To analyze the trend, the rates were compared to the rates for these conditions
for 2012 and 2013 hospitalization dataset. In addition, to calculating the New Mexico rates for the top 2 con-
ditions, rates by health region were also calculated to identify trends within the regions.
Definitions: Definitions for diagnoses and procedures presented in this report may be found at http://
www.cdc.gov/nchs/icd/icd9cm.htm.

2014 Hospital Inpatient Discharge Data Report 9 New Mexico Department of Health
Key Findings
Demographic Characteristics of Discharged Patients
Among patients less than 15 years old, 55.0% were male. Among patients 15-44 years old, 74.2% were
female. The discharge rate among females aged 15-44 was 940.7 per 10,000 population compared to 317.6
per 10,000 for male patients in the same age group.
Among all five health regions, there were more female discharged patients compared to male discharged
patients.
The Southeast region had the highest discharge rate for females at 912.8 per 10,000 population and the
highest overall discharge rate (both males and females combined) at 740.7 per 10,000 population. The
highest discharge rate for males was in the Northwest region at 666.2 per 10,000 population. These trends
are similar to 2013 HIDD results, but the discharge rates were lower in 2014.
From 2011-2014, there has been a slight decrease in the discharge rate of females for four health regions,
the exception being the Metro region. Among male patients, a similar trend was observed with discharge
rate decreases for four of the five health regions.
Comparing discharge rates between New Mexico (2012-2014) and the U.S. (2010), New Mexico had low-
er discharge rates for all 4 age groups (<15 Years, 15-44 Years, 45-64 Years, and 65+ Years), as well as
for both males and females.
Patients who were between the ages of 15-44 years had the lowest average length of stay. Patients who
were less than 15 years old had the longest average length of stay.
Discharges by National Center for Health Statistics Top 21 Diagnoses
The top five reasons for hospitalization by category of the NCHS top 21 diagnoses for males were Heart
Disease (6,673), Psychoses* (4,151), Septicemia (4,139), Pneumonia (3,005), and Fractures (2,201). The
number of hospitalizations for Psychoses, Septicemia, and Pneumonia increased from 2013 to 2014.
The top five reasons for hospitalization by category of NCHS top 21 diagnoses for females were Heart
Disease (5,561), Septicemia (4,395), Psychoses* (3,628), Pneumonia (3,106), and Fractures (2,934). The
number of hospitalizations for Septicemia and Pneumonia increased from 2013 to 2014.
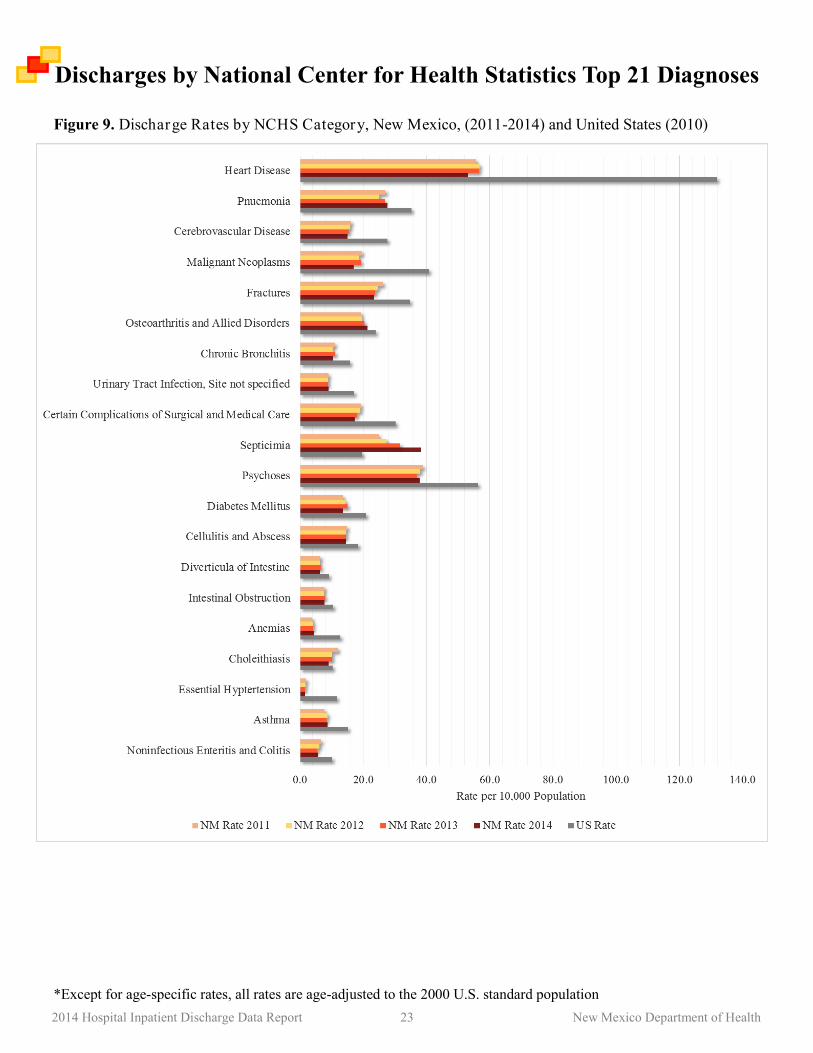
The overall state rate for Pneumonia, Septicemia, and Psychoses* increased from 2013 to 2014; 26.9 to
27.7, 31.7 to 38.3, and 36.8 to 37.9 respectively.
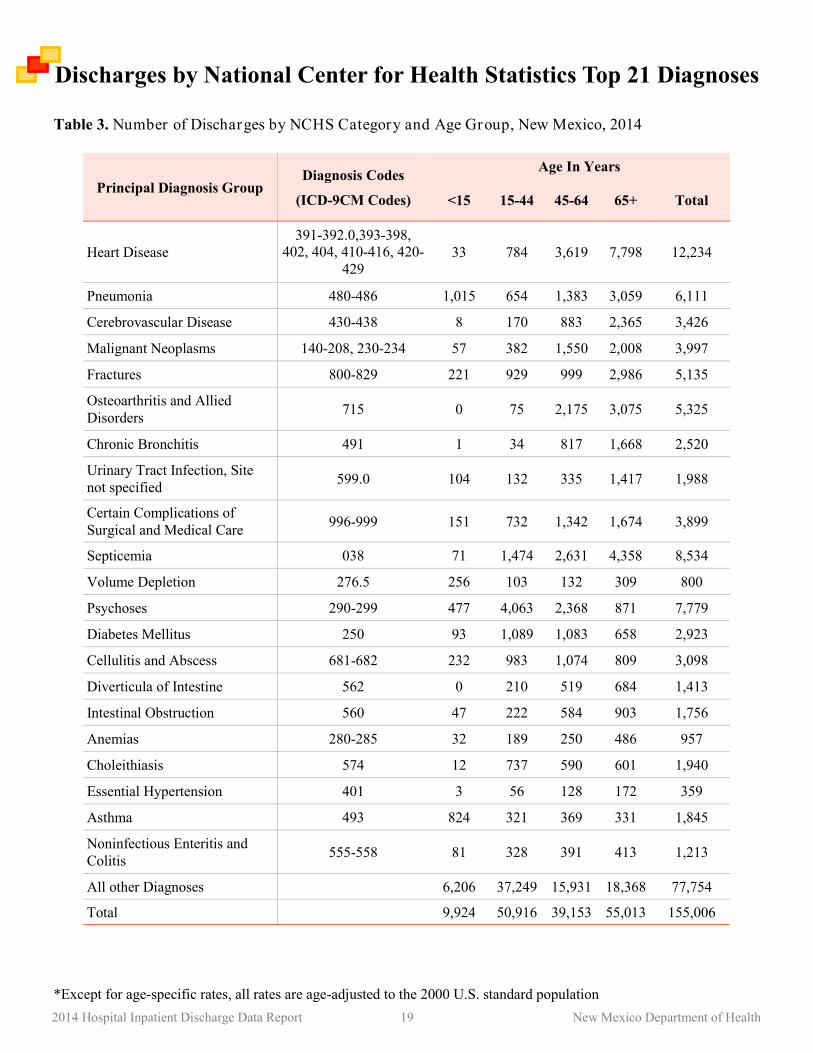
The top reason for hospitalization by category of NCHS top 21 diagnoses for patients less than 15 years
old was Pneumonia (1,015), among patients 15-44 years was Psychoses* (4,063), among patients 45-64
years was Heart Disease (3,619), and among patients 65 or older was Heart Disease (7,798).
The top reason for hospitalization by category of NCHS top 21 diagnoses for the Northwest, Northeast,
Metro, and Southwest regions was Heart Disease (1,279; 1,657; 5,253; and 2,409 respectively). The top
reason for hospitalization in the Southeast region was Psychoses* (1,774).
*See notation on page 7 regarding Specialty Hospitals.

2014 Hospital Inpatient Discharge Data Report 10 New Mexico Department of Health
Key Findings
Patient Discharge Status
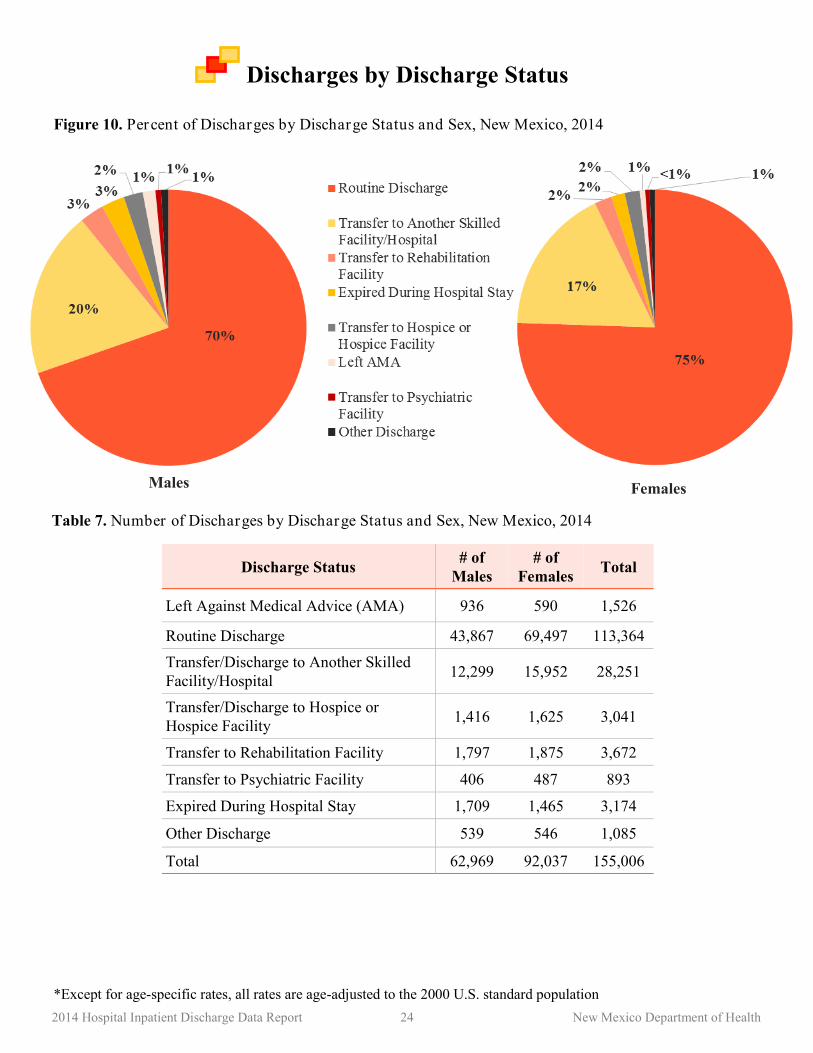
Among male and female patients, 70% and 75% of the discharges were routine, respectively. Transfers/
discharges to another skilled facility/hospital occurred 20% and 17% of the time, respectively.
Among female patients, 590 (0.6%) left against medical advice and 1,465 (1.6%) died during their hospital
stay.
Among male patients, 936 (1.5%) left against medical advice and 1,709 (2.7%) died during their hospital
stay.
The rate of patients leaving against medical advice increased from 2011 to 2014 among patients aged 15-
44, 45-64, and 65+ years.
The Southeast region had the largest increase in the rate of patients leaving against medical advice, in-
creasing from 7.5 per 10,000 population in 2011 to 11.0 per 10,000 population in 2014.
The rate of patients who died while an inpatient remained relatively constant from 2011 to 2014 for all age
groups except patients 65+ years.
The Northwest and Metro regions had increases in the rate of patients who died while an inpatient; increas-
ing from 20.2 per 10,000 population in 2013 to 21.2 per 10,000 population in 2014 and 12.4 per 10,000
population in 2013 to 13.3 per 10,000 population in 2014, respectively.
Primary Payer Types
The age adjusted rate of Medicaid discharges increased from 2012 to 2014. With increases in Medicaid
discharge rates for four of the health regions; the Southeast region saw a decrease from 2012 to 2014.
Ambulatory Care Sensitive Conditions (ACSC)
Bacterial Pneumonia has remained the condition with the highest hospitalization rate for the three year pe-
riod (2012-2014).
From 2012-2014, the rates for Bacterial Pneumonia decreased in the Northeast health region. However,
Bacterial Pneumonia rates have increased slightly in the last three years in the other four health regions.
For 2014, the Southeast region had the highest rates for Acute ACSC at 45.0 per 10,000 population. The
Southeast region also had the highest rates for Chronic ACSC (42.0 per 10,000 population).
Out of State Hospitalizations for New Mexico Residents
For 2013, Arizona hospitals provided services for 4,933 hospital discharges for New Mexico residents.
The top NCHS health category for these hospital admissions was Malignant Neoplasms, followed closely
by Heart Disease.
For 2013, Colorado hospitals provided services for 1,986 hospital discharges for New Mexico residents.
The top NCHS health category for these hospital admissions was Osteoarthritis and Allied Disorders.
For 2013, Texas hospitals provided services for 16,894 hospital discharges for New Mexico residents. The
top NCHS health category for these hospital admissions was Heart Disease.
2014 Hospital Inpatient Discharge Data Report 11 New Mexico Department of Health
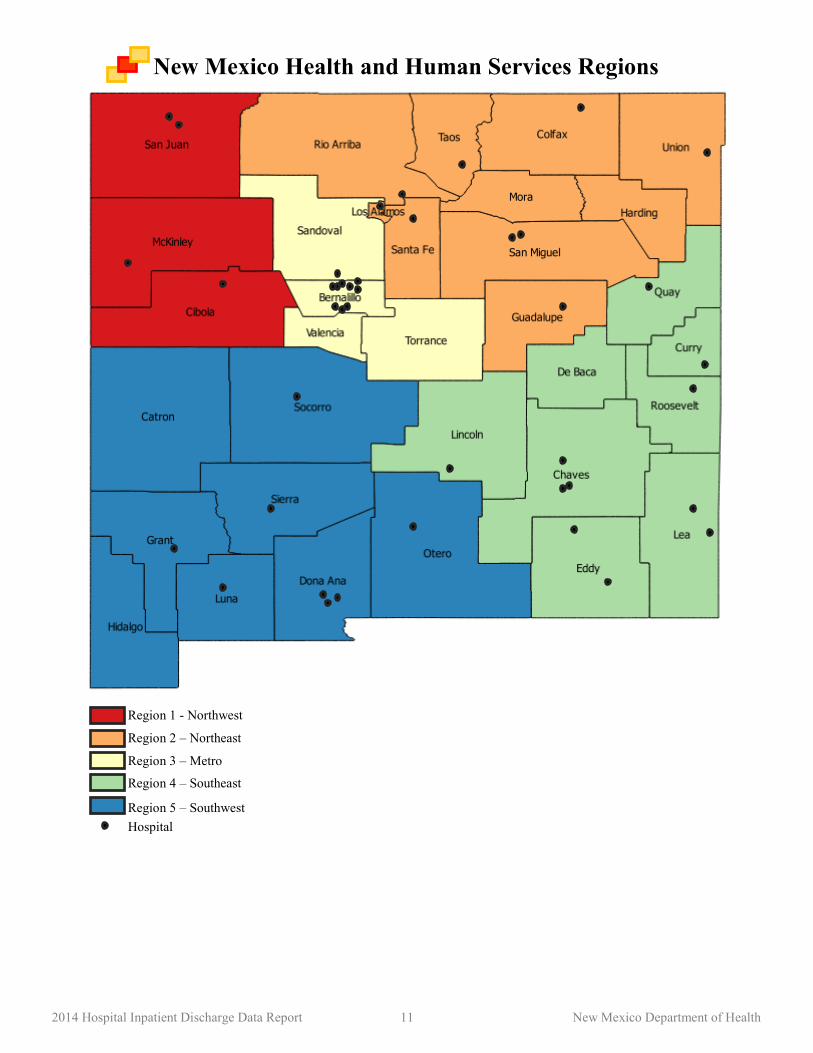
New Mexico Health and Human Services Regions
Region 1 - Northwest
Region 2 – Northeast
Region 3 – Metro
Region 4 – Southeast
Region 5 – Southwest
Hospital

2014 Hospital Inpatient Discharge Data Report 12 New Mexico Department of Health
General Hospitals Reporting in 2014 Advanced Care Hospital of Southern NM Memorial Medical Center
Alta Vista Regional Hospital Mimbres Memorial Hospital
Artesia General Hospital Miners' Colfax Medical Center
Carlsbad Medical Center Mountain View Regional Medical Center
CHRISTUS St. Vincent Regional Medical Center/
Physician's Medical Center of Santa Fe
Nor-Lea General Hospital
Cibola General Hospital Plains Regional Medical Center - Clovis
Dr. Dan C Trigg Memorial Hospital Presbyterian Hospital
Eastern NM Medical Center Presbyterian Espanola Hospital
Gerald Champion Regional Medical Center Presbyterian Kaseman Hospital
Gila Regional Medical Center Presbyterian Rust Medical Center
Guadalupe County Hospital Rehoboth McKinley Christian Health
Holy Cross Hospital Roosevelt General Hospital
Lea Regional Hospital San Juan Regional Medical Center
Lincoln County Medical Center Sierra Vista Hospital
Los Alamos Medical Center Socorro General Hospital
Lovelace Medical Center/Heart Hospital of NM Union County General Hospital
Lovelace Regional Hospital-Roswell UNM Hospital
Lovelace Westside Hospital UNM Sandoval Regional Medical Center
Lovelace Women's Hospital
New Mexico Hospitals Reporting Hospital Inpatient Discharge Data for 2014

2014 Hospital Inpatient Discharge Data Report 13 New Mexico Department of Health
Demographic Characteristics of Discharged Patients
Figure 1. Number of Discharges by Age and Sex, New Mexico, 2014
*Except for age-specific rates, all rates are age-adjusted to the 2000 U.S. standard population
Figure 2. Discharge Rates by Age and Sex, New Mexico, 2014
2014 Hospital Inpatient Discharge Data Report 14 New Mexico Department of Health
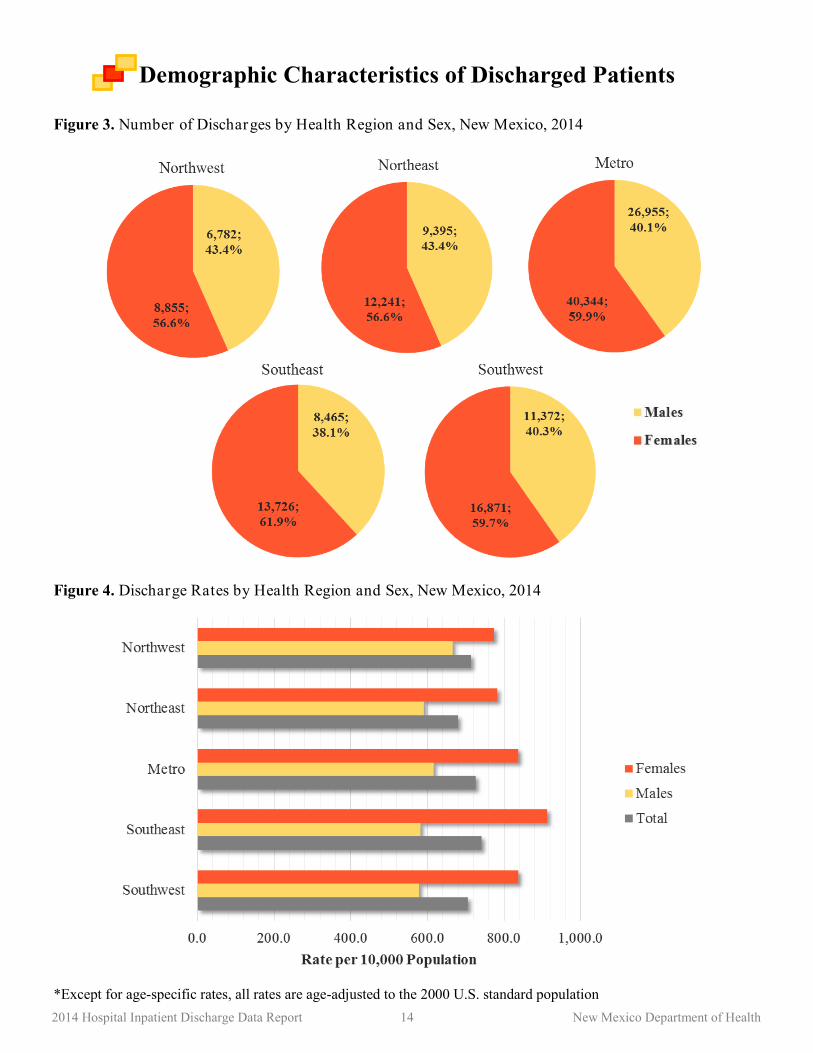
Demographic Characteristics of Discharged Patients
Figure 3. Number of Discharges by Health Region and Sex, New Mexico, 2014
Figure 4. Discharge Rates by Health Region and Sex, New Mexico, 2014
*Except for age-specific rates, all rates are age-adjusted to the 2000 U.S. standard population

2014 Hospital Inpatient Discharge Data Report 15 New Mexico Department of Health
Demographic Characteristics of Discharged Patients
Figure 5. Discharges Rates by Age and Sex, New Mexico, 2011-2014
Figure 6. Discharge Rates by Health Region and Sex, New Mexico, 2011-2014
*Except for age-specific rates, all rates are age-adjusted to the 2000 U.S. standard population

2014 Hospital Inpatient Discharge Data Report 16 New Mexico Department of Health
Demographic Characteristics of Discharged Patients
Figure 7. Discharge Rates by Age and Sex, New Mexico (2012-2014) and United States (2010)
Figure 8. Percent of Hospital Inpatient Discharges by Average Length of Stay and Age, New Mexico, 2014
*Except for age-specific rates, all rates are age-adjusted to the 2000 U.S. standard population
2014 Hospital Inpatient Discharge Data Report 17 New Mexico Department of Health
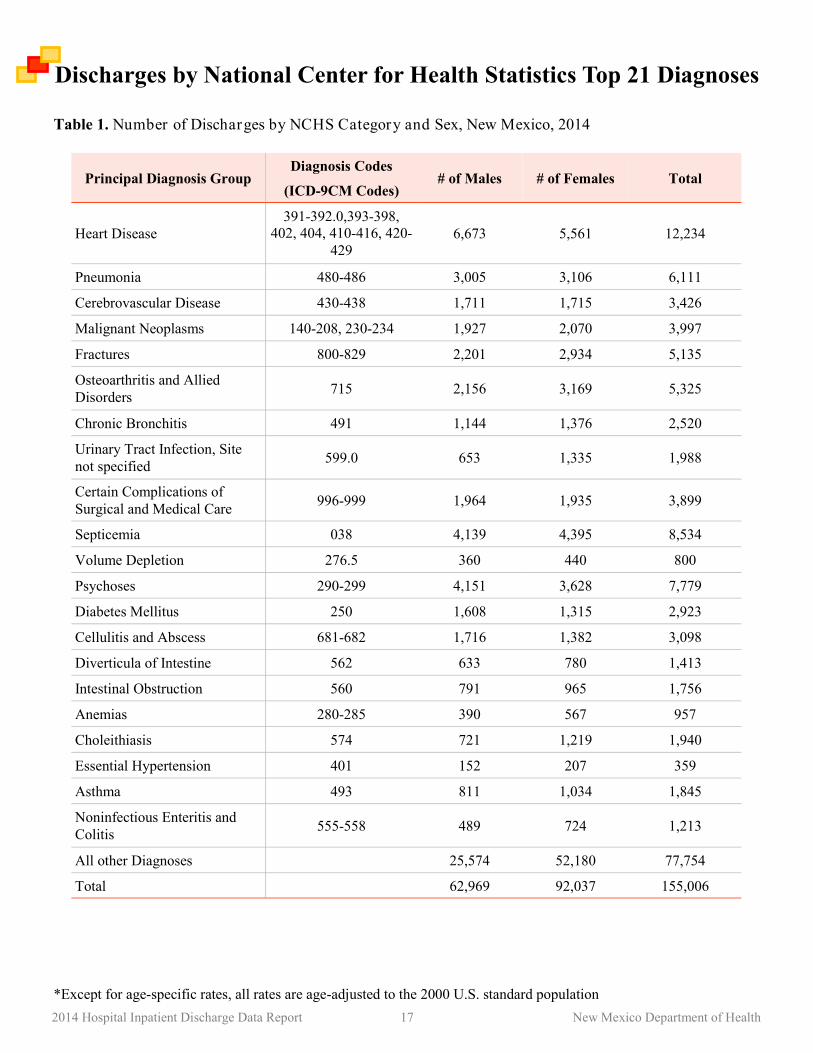
Discharges by National Center for Health Statistics Top 21 Diagnoses
Table 1. Number of Discharges by NCHS Category and Sex, New Mexico, 2014
*Except for age-specific rates, all rates are age-adjusted to the 2000 U.S. standard population
Principal Diagnosis Group Diagnosis Codes
(ICD-9CM Codes) # of Males # of Females Total
Heart Disease
391-392.0,393-398,
402, 404, 410-416, 420-
429
6,673 5,561 12,234
Pneumonia 480-486 3,005 3,106 6,111
Cerebrovascular Disease 430-438 1,711 1,715 3,426
Malignant Neoplasms 140-208, 230-234 1,927 2,070 3,997
Fractures 800-829 2,201 2,934 5,135
Osteoarthritis and Allied
Disorders 715 2,156 3,169 5,325
Chronic Bronchitis 491 1,144 1,376 2,520
Urinary Tract Infection, Site
not specified 599.0 653 1,335 1,988
Certain Complications of
Surgical and Medical Care 996-999 1,964 1,935 3,899
Septicemia 038 4,139 4,395 8,534
Volume Depletion 276.5 360 440 800
Psychoses 290-299 4,151 3,628 7,779
Diabetes Mellitus 250 1,608 1,315 2,923
Cellulitis and Abscess 681-682 1,716 1,382 3,098
Diverticula of Intestine 562 633 780 1,413
Intestinal Obstruction 560 791 965 1,756
Anemias 280-285 390 567 957
Choleithiasis 574 721 1,219 1,940
Essential Hypertension 401 152 207 359
Asthma 493 811 1,034 1,845
Noninfectious Enteritis and
Colitis 555-558 489 724 1,213
All other Diagnoses 25,574 52,180 77,754
Total 62,969 92,037 155,006
2014 Hospital Inpatient Discharge Data Report 18 New Mexico Department of Health
Discharges by National Center for Health Statistics Top 21 Diagnoses
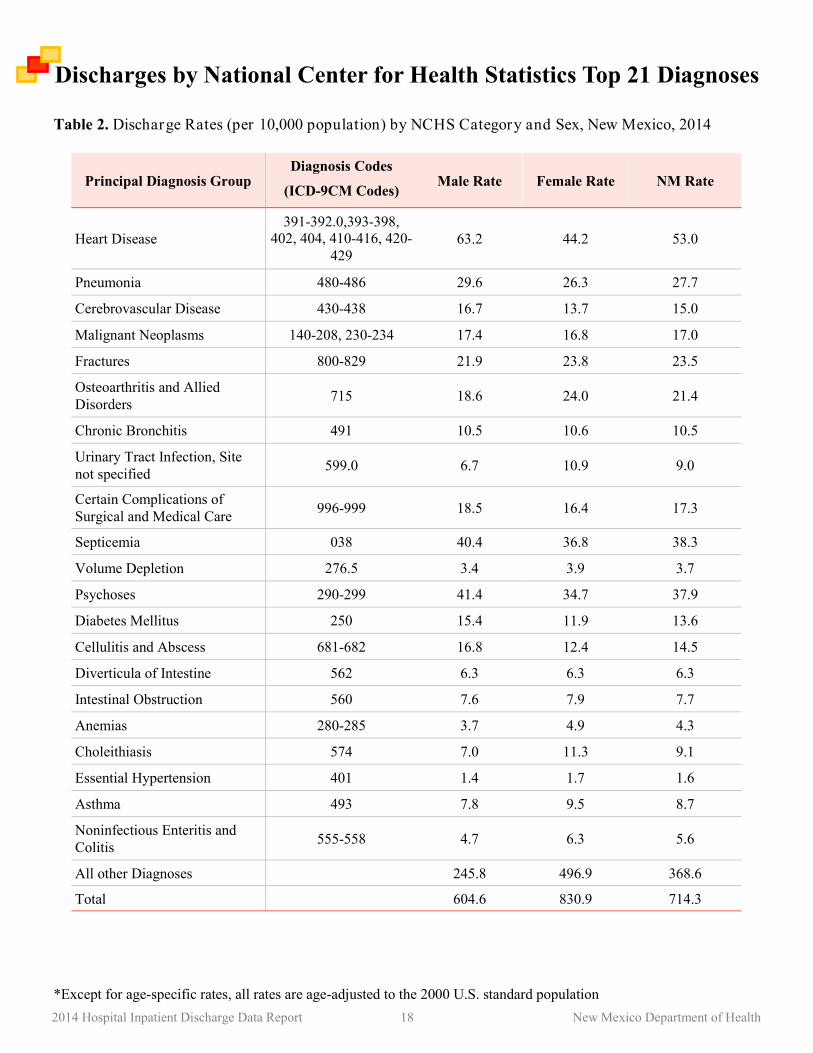
Table 2. Discharge Rates (per 10,000 population) by NCHS Category and Sex, New Mexico, 2014
*Except for age-specific rates, all rates are age-adjusted to the 2000 U.S. standard population
Principal Diagnosis Group Diagnosis Codes
(ICD-9CM Codes) Male Rate Female Rate NM Rate
Heart Disease
391-392.0,393-398,
402, 404, 410-416, 420-
429
63.2 44.2 53.0
Pneumonia 480-486 29.6 26.3 27.7
Cerebrovascular Disease 430-438 16.7 13.7 15.0
Malignant Neoplasms 140-208, 230-234 17.4 16.8 17.0
Fractures 800-829 21.9 23.8 23.5
Osteoarthritis and Allied
Disorders 715 18.6 24.0 21.4
Chronic Bronchitis 491 10.5 10.6 10.5
Urinary Tract Infection, Site
not specified 599.0 6.7 10.9 9.0
Certain Complications of
Surgical and Medical Care 996-999 18.5 16.4 17.3
Septicemia 038 40.4 36.8 38.3
Volume Depletion 276.5 3.4 3.9 3.7
Psychoses 290-299 41.4 34.7 37.9
Diabetes Mellitus 250 15.4 11.9 13.6
Cellulitis and Abscess 681-682 16.8 12.4 14.5
Diverticula of Intestine 562 6.3 6.3 6.3
Intestinal Obstruction 560 7.6 7.9 7.7
Anemias 280-285 3.7 4.9 4.3
Choleithiasis 574 7.0 11.3 9.1
Essential Hypertension 401 1.4 1.7 1.6
Asthma 493 7.8 9.5 8.7
Noninfectious Enteritis and
Colitis 555-558 4.7 6.3 5.6
All other Diagnoses 245.8 496.9 368.6
Total 604.6 830.9 714.3
2014 Hospital Inpatient Discharge Data Report 19 New Mexico Department of Health
Discharges by National Center for Health Statistics Top 21 Diagnoses
Table 3. Number of Discharges by NCHS Category and Age Group, New Mexico, 2014
*Except for age-specific rates, all rates are age-adjusted to the 2000 U.S. standard population
Principal Diagnosis Group Diagnosis Codes
(ICD-9CM Codes)
Age In Years
<15 15-44 45-64 65+ Total
Heart Disease
391-392.0,393-398,
402, 404, 410-416, 420-
429
33 784 3,619 7,798 12,234
Pneumonia 480-486 1,015 654 1,383 3,059 6,111
Cerebrovascular Disease 430-438 8 170 883 2,365 3,426
Malignant Neoplasms 140-208, 230-234 57 382 1,550 2,008 3,997
Fractures 800-829 221 929 999 2,986 5,135
Osteoarthritis and Allied
Disorders 715 0 75 2,175 3,075 5,325
Chronic Bronchitis 491 1 34 817 1,668 2,520
Urinary Tract Infection, Site
not specified 599.0 104 132 335 1,417 1,988
Certain Complications of
Surgical and Medical Care 996-999 151 732 1,342 1,674 3,899
Septicemia 038 71 1,474 2,631 4,358 8,534
Volume Depletion 276.5 256 103 132 309 800
Psychoses 290-299 477 4,063 2,368 871 7,779
Diabetes Mellitus 250 93 1,089 1,083 658 2,923
Cellulitis and Abscess 681-682 232 983 1,074 809 3,098
Diverticula of Intestine 562 0 210 519 684 1,413
Intestinal Obstruction 560 47 222 584 903 1,756
Anemias 280-285 32 189 250 486 957
Choleithiasis 574 12 737 590 601 1,940
Essential Hypertension 401 3 56 128 172 359
Asthma 493 824 321 369 331 1,845
Noninfectious Enteritis and
Colitis 555-558 81 328 391 413 1,213
All other Diagnoses 6,206 37,249 15,931 18,368 77,754
Total 9,924 50,916 39,153 55,013 155,006

2014 Hospital Inpatient Discharge Data Report 20 New Mexico Department of Health
Discharges by National Center for Health Statistics Top 21 Diagnoses
Table 4. Discharge Rates (per 10,000 population) by NCHS Category and Age Group, New Mexico,
2014
*Except for age-specific rates, all rates are age-adjusted to the 2000 U.S. standard population
Principal Diagnosis Group Diagnosis Codes
(ICD-9CM Codes)
Age In Years
<15 15-44 45-64 65+ NM Rate
Heart Disease
391-392.0,393-398,
402, 404, 410-416, 420-
429
0.8 9.6 65.3 264.8 58.3
Pneumonia 480-486 23.4 8.0 25.0 103.9 29.1
Cerebrovascular Disease 430-438 0.2 2.1 15.9 80.3 16.3
Malignant Neoplasms 140-208, 230-234 1.3 4.7 28.0 68.2 19.0
Fractures 800-829 5.1 11.4 18.0 101.4 24.5
Osteoarthritis and Allied
Disorders 715 0.0 0.9 39.2 104.4 25.4
Chronic Bronchitis 491 0.0 0.4 14.7 56.6 12.0
Urinary Tract Infection, Site
not specified 599.0 2.4 1.6 6.0 48.1 9.5
Certain Complications of
Surgical and Medical Care 996-999 3.5 9.0 24.2 56.8 18.6
Septicemia 038 1.6 18.1 47.5 148.0 40.7
Volume Depletion 276.5 5.9 1.3 2.4 10.5 3.8
Psychoses 290-299 11.0 49.8 42.7 29.6 37.1
Diabetes Mellitus 250 2.1 13.4 19.5 22.4 13.9
Cellulitis and Abscess 681-682 5.3 12.1 19.4 27.5 14.8
Diverticula of Intestine 562 0.0 2.6 9.4 23.2 6.7
Intestinal Obstruction 560 1.1 2.7 10.5 30.7 8.4
Anemias 280-285 0.7 2.3 4.5 16.5 4.6
Choleithiasis 574 0.3 9.0 10.6 20.4 9.2
Essential Hypertension 401 0.1 0.7 2.3 5.8 7.7
Asthma 493 19.0 3.9 6.7 11.2 8.8
Noninfectious Enteritis and
Colitis 555-558 1.9 4.0 7.0 14.0 5.8
All other Diagnoses 142.8 457.0 287.4 623.8 370.5
Total 228.4 624.7 706.3 1,868.20 738.7

2014 Hospital Inpatient Discharge Data Report 21 New Mexico Department of Health
Discharges by National Center for Health Statistics Top 21 Diagnoses
Table 5. Number of Discharges by NCHS Category and Health Region, New Mexico, 2014
*Except for age-specific rates, all rates are age-adjusted to the 2000 U.S. standard population
Principal Diagnosis Group Diagnosis Codes
(ICD-9CM Codes)
Health Region
NW NE Metro SE SW Total
Heart Disease
391-392.0,393-398,
402, 404, 410-416, 420-
429
1,279 1,657 5,253 1,636 2,409 12,234
Pneumonia 480-486 761 978 2,028 1,101 1,243 6,111
Cerebrovascular Disease 430-438 316 530 1,626 372 582 3,426
Malignant Neoplasms 140-208, 230-234 402 649 1,925 324 697 3,997
Fractures 800-829 541 870 2,399 504 821 5,135
Osteoarthritis and Allied
Disorders 715 466 872 2,678 482 827 5,325
Chronic Bronchitis 491 159 378 711 623 649 2,520
Urinary Tract Infection, Site
not specified 599.0 168 249 741 401 429 1,988
Certain Complications of
Surgical and Medical Care 996-999 448 552 1,798 341 760 3,899
Septicemia 038 980 1,066 3,899 1,240 1,349 8,534
Volume Depletion 276.5 68 89 257 177 209 800
Psychoses 290-299 646 710 3,237 1,774 1,412 7,779
Diabetes Mellitus 250 317 329 1,200 495 582 2,923
Cellulitis and Abscess 681-682 306 512 1,360 451 469 3,098
Diverticula of Intestine 562 124 225 566 194 304 1,413
Intestinal Obstruction 560 169 321 690 250 326 1,756
Anemias 280-285 82 106 388 165 216 957
Choleithiasis 574 239 281 790 208 422 1,940
Essential Hypertension 401 25 25 170 61 78 359
Asthma 493 156 229 836 383 241 1,845
Noninfectious Enteritis and
Colitis 555-558 97 142 506 227 241 1,213
All other Diagnoses 7,888 10,866 34,241 10,782 13,977 77,754
Total 15,637 21,636 67,299 22,191 28,243 155,006

2014 Hospital Inpatient Discharge Data Report 22 New Mexico Department of Health
Discharges by National Center for Health Statistics Top 21 Diagnoses
Table 6. Discharge Rates (per 10,000 population) by NCHS Category and Health Region, New Mexico,
2014
*See notation on page 7 regarding Specialty Hospitals.
*Except for age-specific rates, all rates are age-adjusted to the 2000 U.S. standard population
Principal Diagnosis Group Diagnosis Codes
(ICD-9CM Codes)
Health Region
NW NE Metro SE SW NM
Rate
Heart Disease
391-392.0,393-398,
402, 404, 410-416, 420-
429
60.6 44.0 55.2 51.6 53.7 58.3
Pneumonia 480-486 34.8 29.7 21.9 35.4 29.9 27.7
Cerebrovascular Disease 430-438 15.3 14.4 17.2 11.7 13.0 15.0
Malignant Neoplasms 140-208, 230-234 18.4 16.8 19.6 10.2 15.8 17.0
Fractures 800-829 26.1 26.0 26.0 16.3 19.3 23.5
Osteoarthritis and Allied
Disorders 715 20.4 20.8 26.3 14.4 17.4 21.4
Chronic Bronchitis 491 7.4 9.6 7.2 19.1 13.9 10.5
Urinary Tract Infection, Site
not specified 599.0 8.3 7.3 8.7 12.7 9.9 9.0
Certain Complications of
Surgical and Medical Care 996-999 20.8 15.5 18.8 11.2 18.0 17.3
Septicemia 038 46.8 31.2 41.5 40.1 31.8 38.3
Volume Depletion 276.5 3.0 2.7 2.8 5.6 5.2 3.7
Psychoses* 290-299 29.1 25.3 35.8 64.2 39.5 37.9
Diabetes Mellitus 250 14.5 10.6 12.9 17.2 15.2 13.6
Cellulitis and Abscess 681-682 14.0 16.4 14.8 15.6 12.1 14.5
Diverticula of Intestine 562 6.0 6.2 6.1 6.3 7.3 6.3
Intestinal Obstruction 560 7.9 8.9 7.4 8.0 7.6 7.7
Anemias 280-285 3.8 3.2 4.2 5.4 5.3 4.3
Choleithiasis 574 10.8 8.9 8.6 7.2 11.0 9.1
Essential Hypertension 401 1.2 0.7 1.8 2.1 1.8 1.6
Asthma 493 6.5 7.8 9.3 12.7 6.2 8.7
Noninfectious Enteritis and
Colitis 555-558 4.4 4.3 5.5 7.7 6.2 5.6
All other Diagnoses 354.5 369.4 375.3 366.3 364.6 368.6
Total 714.6 679.6 726.2 740.7 704.9 714.3
2014 Hospital Inpatient Discharge Data Report 23 New Mexico Department of Health
Discharges by National Center for Health Statistics Top 21 Diagnoses
Figure 9. Discharge Rates by NCHS Category, New Mexico, (2011-2014) and United States (2010)
*Except for age-specific rates, all rates are age-adjusted to the 2000 U.S. standard population
2014 Hospital Inpatient Discharge Data Report 24 New Mexico Department of Health
Discharges by Discharge Status
Figure 10. Percent of Discharges by Discharge Status and Sex, New Mexico, 2014
*Except for age-specific rates, all rates are age-adjusted to the 2000 U.S. standard population
Males Females
Discharge Status # of
Males
# of
Females Total
Left Against Medical Advice (AMA) 936 590 1,526
Routine Discharge 43,867 69,497 113,364
Transfer/Discharge to Another Skilled
Facility/Hospital 12,299 15,952 28,251
Transfer/Discharge to Hospice or
Hospice Facility 1,416 1,625 3,041
Transfer to Rehabilitation Facility 1,797 1,875 3,672
Transfer to Psychiatric Facility 406 487 893
Expired During Hospital Stay 1,709 1,465 3,174
Other Discharge 539 546 1,085
Total 62,969 92,037 155,006
Table 7. Number of Discharges by Discharge Status and Sex, New Mexico, 2014

2014 Hospital Inpatient Discharge Data Report 25 New Mexico Department of Health
Discharges by Discharge Status
Figure 11. Rate of AMA Discharges by Age, New Mexico, 2011-2014
*Except for age-specific rates, all rates are age-adjusted to the 2000 U.S. standard population
Figure 12. Rate of AMA Discharges by Health Region, New Mexico, 2011-2014
2014 Hospital Inpatient Discharge Data Report 26 New Mexico Department of Health
Discharges by Discharge Status
Figure 13. Rate of Expired Discharges by Age, New Mexico, 2011-2014
*Except for age-specific rates, all rates are age-adjusted to the 2000 U.S. standard population
Figure 14. Rate of Expired Discharges by Health Region, New Mexico, 2011-2014
2014 Hospital Inpatient Discharge Data Report 27 New Mexico Department of Health
Discharges by Primary Payer Type
Figure 15. Rate of Discharges by Pr imary Payer Type, New Mexico, 2012-2014
*Except for age-specific rates, all rates are age-adjusted to the 2000 U.S. standard population
Figure 16. Rate of Medicaid Discharges by Health Region, New Mexico, 2012-2014

2014 Hospital Inpatient Discharge Data Report 28 New Mexico Department of Health
Discharges by Primary Payer Type
*Except for age-specific rates, all rates are age-adjusted to the 2000 U.S. standard population
Figure 18. Rate of Pr ivate Insurance Discharges by Health Region, New Mexico, 2012-2014
Figure 17. Rate of Medicare Discharges by Health Region, New Mexico, 2012-2014
2014 Hospital Inpatient Discharge Data Report 29 New Mexico Department of Health
Ambulatory Care Sensitive Conditions
Figure 19. Age-Adjusted Rates for Acute and Chronic ACSC (per 10,000 Population**) by Year, New Mexi-
co, 2012-2014
*Except for age-specific rates, all rates are age-adjusted to the 2000 U.S. standard population
** AHRQ methods produce results at a rate per 100,000 Population. For this report, a rate of 10,000 per Population was
used to be consistent with rates throughout this report.
Figure 20. Age-Adjusted Rates for Acute and Chronic ACSC (per 10,000 Population**) by Health Region,
New Mexico, 2012-2014
2014 Hospital Inpatient Discharge Data Report 30 New Mexico Department of Health
Ambulatory Care Sensitive Conditions
Figure 21. Rate of Bacter ial Pneumonia (per 10,000 Population**) by Health Region, New Mexico, 2012
-2014
Figure 22. Rate of Hear t Failure (per 10,000 Population**) by Health Region, New Mexico, 2012-2014
*Except for age-specific rates, all rates are age-adjusted to the 2000 U.S. standard population
** AHRQ methods produce results at a rate per 100,000 Population. For this report, a rate of 10,000 per Population was
used to be consistent with rates throughout this report.

2014 Hospital Inpatient Discharge Data Report 31 New Mexico Department of Health
Arizona Hospitalization Data for New Mexico Residents
*Except for age-specific rates, all rates are age-adjusted to the 2000 U.S. standard population
Figure 23. Percent of Arizona Hospitalizations based on New Mexico Patient Residence, 2013
In 2013, Arizona hospitals provided services for 4,933 hospital discharges for New Mexico residents. When
the Arizona hospitalizations were added to the New Mexico HIDD dataset, there was a total of 195,169 hos-
pital discharges. Arizona hospital discharges accounted for 2.5% of the total NM-HIDD + Arizona data. Alt-
hough this percentage is below 5%, in Catron county, Arizona hospitalization data accounted for 67.6% of
all hospitalization data for Catron county residents. A high percentage was also observed for Hidalgo county
residents. The top NCHS health category for these hospital discharges was Malignant Neoplasms, followed
closely by Heart Disease.
Data Source: Arizona Department of Health Services.
2014 Hospital Inpatient Discharge Data Report 32 New Mexico Department of Health
Colorado Hospitalization Data for New Mexico Residents
*Except for age-specific rates, all rates are age-adjusted to the 2000 U.S. standard population
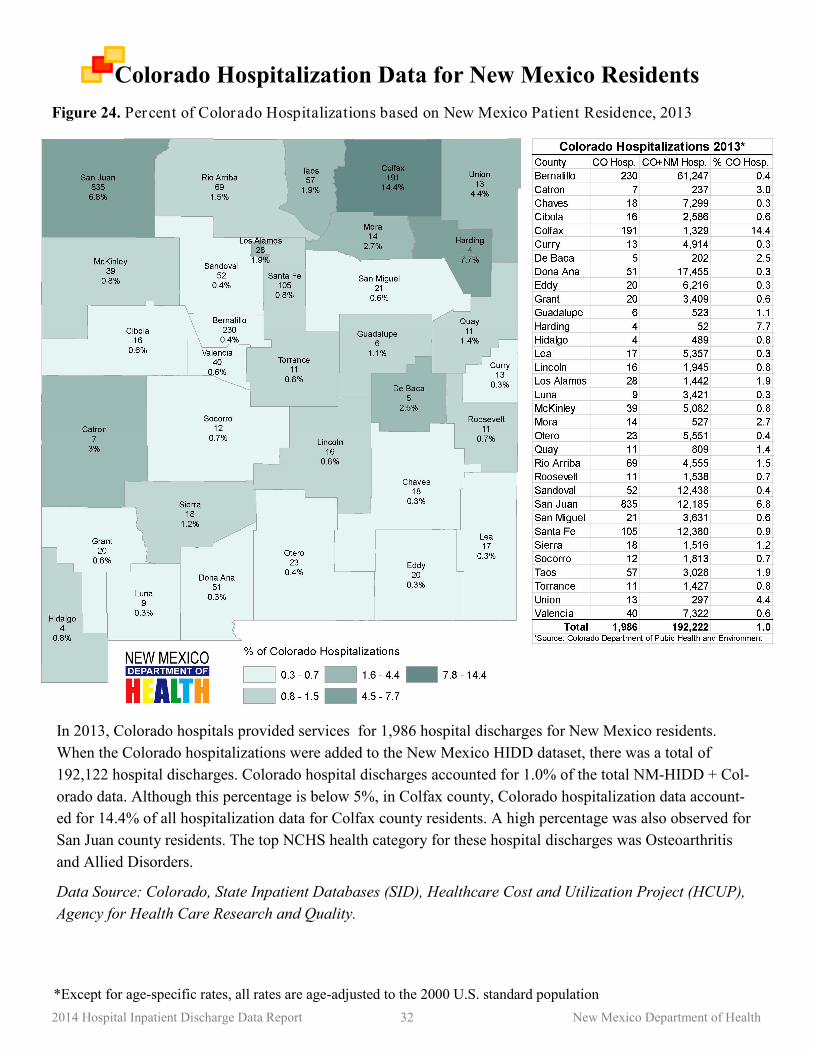
Figure 24. Percent of Colorado Hospitalizations based on New Mexico Patient Residence, 2013
In 2013, Colorado hospitals provided services for 1,986 hospital discharges for New Mexico residents.
When the Colorado hospitalizations were added to the New Mexico HIDD dataset, there was a total of
192,122 hospital discharges. Colorado hospital discharges accounted for 1.0% of the total NM-HIDD + Col-
orado data. Although this percentage is below 5%, in Colfax county, Colorado hospitalization data account-
ed for 14.4% of all hospitalization data for Colfax county residents. A high percentage was also observed for
San Juan county residents. The top NCHS health category for these hospital discharges was Osteoarthritis
and Allied Disorders.
Data Source: Colorado, State Inpatient Databases (SID), Healthcare Cost and Utilization Project (HCUP),
Agency for Health Care Research and Quality.
2014 Hospital Inpatient Discharge Data Report 33 New Mexico Department of Health
Texas Hospitalization Data for New Mexico Residents
*Except for age-specific rates, all rates are age-adjusted to the 2000 U.S. standard population
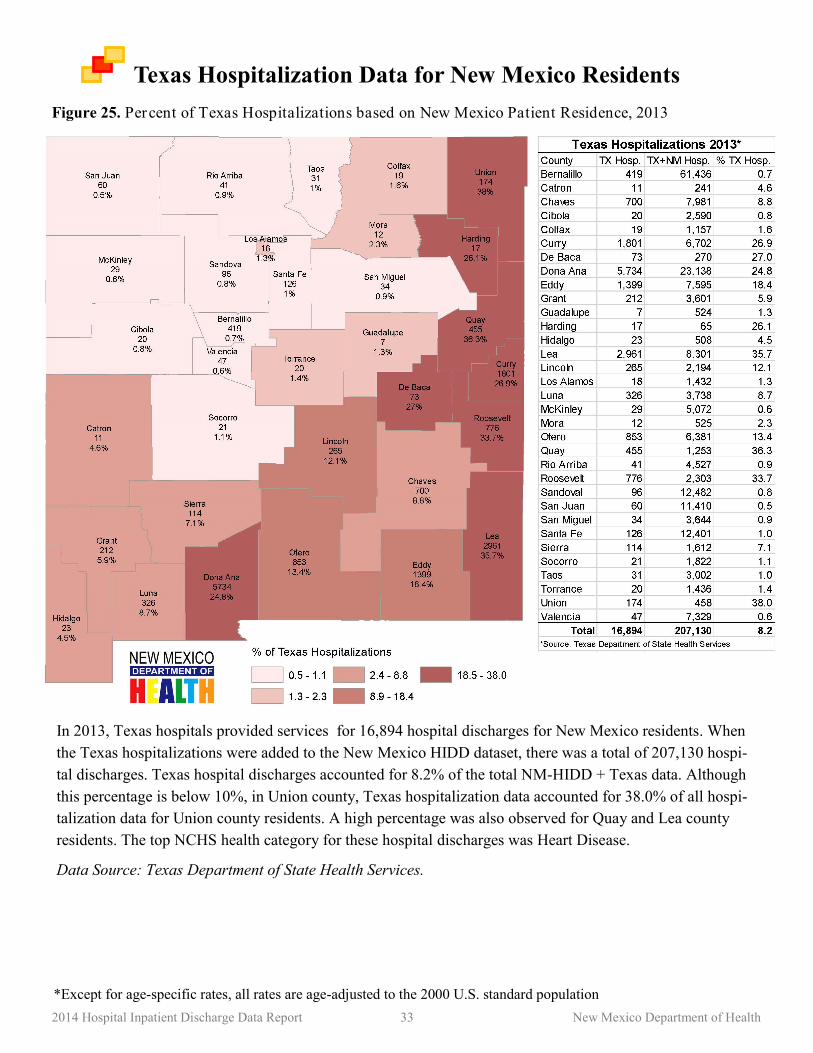
Figure 25. Percent of Texas Hospitalizations based on New Mexico Patient Residence, 2013
In 2013, Texas hospitals provided services for 16,894 hospital discharges for New Mexico residents. When
the Texas hospitalizations were added to the New Mexico HIDD dataset, there was a total of 207,130 hospi-
tal discharges. Texas hospital discharges accounted for 8.2% of the total NM-HIDD + Texas data. Although
this percentage is below 10%, in Union county, Texas hospitalization data accounted for 38.0% of all hospi-
talization data for Union county residents. A high percentage was also observed for Quay and Lea county
residents. The top NCHS health category for these hospital discharges was Heart Disease.
Data Source: Texas Department of State Health Services.

2014 Hospital Inpatient Discharge Data Report 34 New Mexico Department of Health
Hospitalization Data for New Mexico Residents
*Except for age-specific rates, all rates are age-adjusted to the 2000 U.S. standard population
Figure 26. Hospitalization Rates (per 10,000 Population) based on New Mexico Patient Residence, 2013
In 2013, non-federal, general acute and specialty facilities provided services for 190,236 discharges for New
Mexico residents. Additional discharge information from federal and out-of-state hospitals/facilities in-
creased the number of discharges for New Mexico residents to 218,421 discharges. The top NCHS health
categories for all New Mexico resident hospital discharges was Other Diagnoses, Heart Disease, and Psy-
choses. The crude rate of hospitalizations for New Mexico residents in 2013 was 1,042.5 hospitalizations per
100,000 population.

2014 Hospital Inpatient Discharge Data Report 35 New Mexico Department of Health
Appendix

2014 Hospital Inpatient Discharge Data Report 36 New Mexico Department of Health
Discharges by Category of First-Listed Diagnosis
Appendix Table 1. Number of Discharges by Category of First-Listed Diagnosis and Sex, New Mexico,
2014
*Except for age-specific rates, all rates are age-adjusted to the 2000 U.S. standard population
Category of First-Listed Diagnosis Diagnosis Codes
(ICD-9CM Codes) # of Males
# of
Females Total
Infectious and Parasitic Diseases 001-139 5,187 5,616 10,803
Neoplasms 140-239 2,221 3,102 5,323
Endocrine, Nutritional and Metabolic
Diseases, and Immunity Disorders 240-279 2,819 3,022 5,841
Diseases of the Blood and Blood-Forming
Organs 280-289 636 820 1,456
Mental Disorders 290-319 4,852 4,283 9,135
Diseases of the Nervous System and
Sense Organs 320-389 1,434 1,661 3,095
Diseases of the Circulatory System 390-459 9,970 8,777 18,747
Diseases of the Respiratory System 460-519 8,084 8,351 16,435
Diseases of the Digestive System 520-579 8,867 9,228 18,095
Diseases of the Genitourinary System 580-629 2,799 4,940 7,739
Complications of Pregnancy, Childbirth,
and Puerperium 630-677 0 3,508 3,508
Diseases of the Skin and Subcutaneous
Tissue 680-709 1,942 1,574 3,516
Diseases of the Muscoloskeletal System
and Connective Tissue 710-739 4,140 5,143 9,283
Congenital Anomalies 740-759 334 290 624
Certain Conditions Originating in the
Perinatal Period 760-779 524 402 926
Symptoms, Signs, and Ill-Defined
Conditions 780-799 1,851 2,346 4,197
Injury and Poisoning 800-999 6,482 6,788 13,270
Supplementary Classifications V01-V84 827 22,186 23,013
Ungroupable Diagnoses 0 0 0
Total 62,969 92,037 155,006
2014 Hospital Inpatient Discharge Data Report 37 New Mexico Department of Health
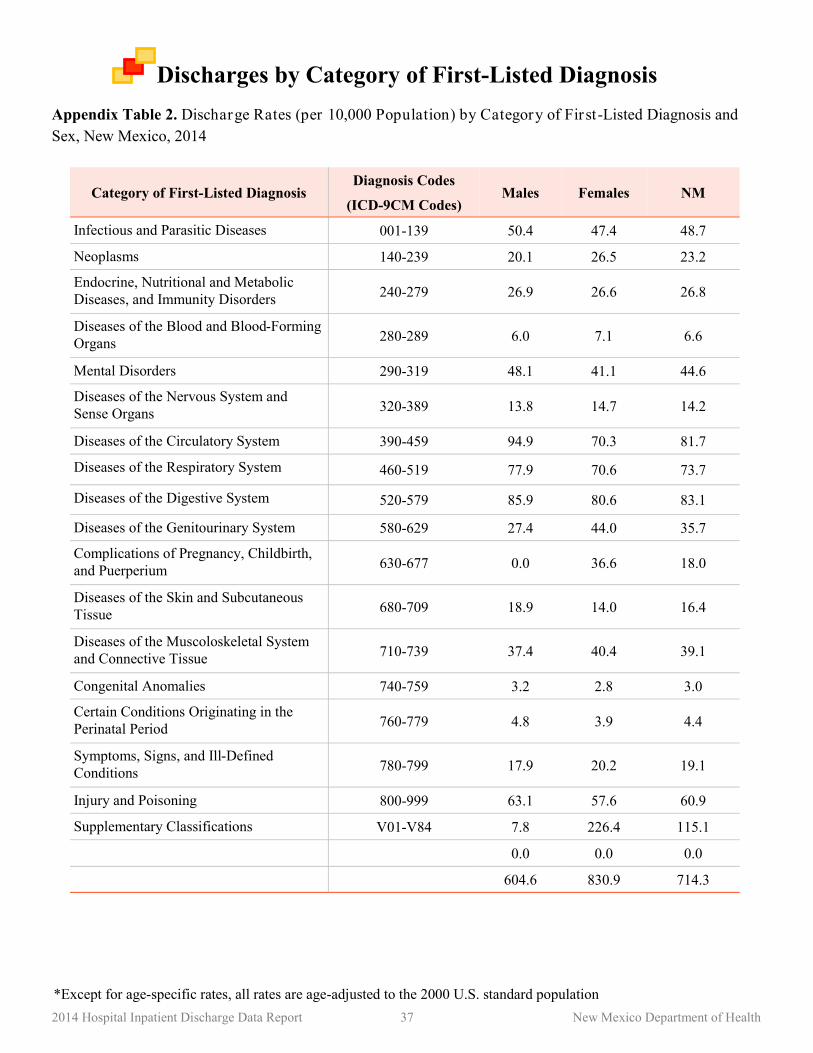
Discharges by Category of First-Listed Diagnosis
Appendix Table 2. Discharge Rates (per 10,000 Population) by Category of First-Listed Diagnosis and
Sex, New Mexico, 2014
*Except for age-specific rates, all rates are age-adjusted to the 2000 U.S. standard population
Category of First-Listed Diagnosis Diagnosis Codes
(ICD-9CM Codes) Males Females NM
Infectious and Parasitic Diseases 001-139 50.4 47.4 48.7
Neoplasms 140-239 20.1 26.5 23.2
Endocrine, Nutritional and Metabolic
Diseases, and Immunity Disorders 240-279 26.9 26.6 26.8
Diseases of the Blood and Blood-Forming
Organs 280-289 6.0 7.1 6.6
Mental Disorders 290-319 48.1 41.1 44.6
Diseases of the Nervous System and
Sense Organs 320-389 13.8 14.7 14.2
Diseases of the Circulatory System 390-459 94.9 70.3 81.7
Diseases of the Respiratory System 460-519 77.9 70.6 73.7
Diseases of the Digestive System 520-579 85.9 80.6 83.1
Diseases of the Genitourinary System 580-629 27.4 44.0 35.7
Complications of Pregnancy, Childbirth,
and Puerperium 630-677 0.0 36.6 18.0
Diseases of the Skin and Subcutaneous
Tissue 680-709 18.9 14.0 16.4
Diseases of the Muscoloskeletal System
and Connective Tissue 710-739 37.4 40.4 39.1
Congenital Anomalies 740-759 3.2 2.8 3.0
Certain Conditions Originating in the
Perinatal Period 760-779 4.8 3.9 4.4
Symptoms, Signs, and Ill-Defined
Conditions 780-799 17.9 20.2 19.1
Injury and Poisoning 800-999 63.1 57.6 60.9
Supplementary Classifications V01-V84 7.8 226.4 115.1
0.0 0.0 0.0
604.6 830.9 714.3

2014 Hospital Inpatient Discharge Data Report 38 New Mexico Department of Health
Discharges by Category of First-Listed Diagnosis
Appendix Table 3. Number of Discharges by Category of First-Listed Diagnosis and Age Group, New
Mexico, 2014
*Except for age-specific rates, all rates are age-adjusted to the 2000 U.S. standard population
Category of First-Listed Diagnosis Diagnosis Codes
(ICD-9CM Codes)
Age in Years
<15 15-44 45-64 65+ Total
Infectious and Parasitic Diseases 001-139 367 1,973 3,326 5,137 10,803
Neoplasms 140-239 78 764 2,159 2,322 5,323
Endocrine, Nutritional and Metabolic
Diseases, and Immunity Disorders 240-279 481 1,586 1,892 1,882 5,841
Diseases of the Blood and Blood-Forming
Organs 280-289 161 270 380 645 1,456
Mental Disorders 290-319 670 4,822 2,680 963 9,135
Diseases of the Nervous System and
Sense Organs 320-389 363 787 879 1,066 3,095
Diseases of the Circulatory System 390-459 72 1,384 5,497 11,794 18,747
Diseases of the Respiratory System 460-519 3,502 1,678 3,880 7,375 16,435
Diseases of the Digestive System 520-579 781 4,754 6,203 6,357 18,095
Diseases of the Genitourinary System 580-629 339 1,701 2,015 3,684 7,739
Complications of Pregnancy, Childbirth,
and Puerperium 630-677 4 3,499 5 946 4,454
Diseases of the Skin and Subcutaneous
Tissue 680-709 284 1,080 1,206 0 2,570
Diseases of the Muscoloskeletal System
and Connective Tissue 710-739 154 809 3,641 4,679 9,283
Congenital Anomalies 740-759 394 136 61 33 624
Certain Conditions Originating in the
Perinatal Period 760-779 926 0 0 0 926
Symptoms, Signs, and Ill-Defined
Conditions 780-799 472 719 1,278 1,728 4,197
Injury and Poisoning 800-999 707 3,355 3,514 5,694 13,270
Supplementary Classifications V01-V84 169 21,599 537 708 23,013
Ungroupable Diagnoses 0 0 0 0 0
Total 9,924 50,916 39,153 55,013 155,006

2014 Hospital Inpatient Discharge Data Report 39 New Mexico Department of Health
Discharges by Category of First-Listed Diagnosis
Appendix Table 4. Discharge Rates (per 10,000 Population) by Category of First-Listed Diagnosis and
Age Group, New Mexico, 2014
*Except for age-specific rates, all rates are age-adjusted to the 2000 U.S. standard population
Category of First-Listed Diagnosis Diagnosis Codes
(ICD-9CM Codes)
Age in Years
<15 15-44 45-64 65+ NM
Infectious and Parasitic Diseases 001-139 8.4 24.2 60.0 174.4 51.5
Neoplasms 140-239 1.8 9.4 39.0 78.8 25.4
Endocrine, Nutritional and Metabolic
Diseases, and Immunity Disorders 240-279 11.1 19.5 34.1 63.9 27.8
Diseases of the Blood and Blood-Forming
Organs 280-289 3.7 3.3 6.8 21.9 6.9
Mental Disorders 290-319 15.4 59.2 48.4 32.7 43.5
Diseases of the Nervous System and
Sense Organs 320-389 8.4 9.7 15.9 36.2 14.8
Diseases of the Circulatory System 390-459 1.7 17.0 99.2 400.5 89.3
Diseases of the Respiratory System 460-519 80.6 20.6 70.0 250.4 78.3
Diseases of the Digestive System 520-579 18.0 58.3 111.9 215.9 86.2
Diseases of the Genitourinary System 580-629 7.8 20.9 36.4 125.1 36.9
Complications of Pregnancy, Childbirth,
and Puerperium 630-677 0.1 42.9 0.1 0.0 16.7
Diseases of the Skin and Subcutaneous
Tissue 680-709 6.5 13.2 21.8 32.1 16.8
Diseases of the Muscoloskeletal System
and Connective Tissue 710-739 3.5 9.9 65.7 158.9 44.2
Congenital Anomalies 740-759 9.1 1.7 1.1 1.1 3.0
Certain Conditions Originating in the
Perinatal Period 760-779 21.3 0.0 0.0 0.0 4.4
Symptoms, Signs, and Ill-Defined
Conditions 780-799 10.9 8.8 23.0 58.7 20.0
Injury and Poisoning 800-999 16.3 41.2 63.4 193.4 63.2
Supplementary Classifications V01-V84 3.9 265.0 9.7 24.0 109.7

2014 Hospital Inpatient Discharge Data Report 40 New Mexico Department of Health
Discharges by Category of First-Listed Diagnosis
Appendix Table 5. Number of Discharges by Category of First-Listed Diagnosis and Health Region, New
Mexico, 2014
*Except for age-specific rates, all rates are age-adjusted to the 2000 U.S. standard population
Category of First-Listed Diagnosis Diagnosis Codes
(ICD-9CM Codes)
Health Region
NW NE Metro SE SW Total
Infectious and Parasitic Diseases 001-139 1,174 1,374 4,956 1,548 1,751 10,803
Neoplasms 140-239 523 878 2,521 469 932 5,323
Endocrine, Nutritional and Metabolic
Diseases, and Immunity Disorders 240-279 631 713 2,339 959 1,199 5,841
Diseases of the Blood and Blood-
Forming Organs 280-289 139 168 635 219 295 1,456
Mental Disorders 290-319 811 925 3,926 1,882 1,591 9,135
Diseases of the Nervous System and
Sense Organs 320-389 286 403 1,447 380 579 3,095
Diseases of the Circulatory System 390-459 1,965 2,553 8,276 2,378 3,575 18,747
Diseases of the Respiratory System 460-519 1,868 2,382 6,154 2,939 3,092 16,435
Diseases of the Digestive System 520-579 1,929 2,762 7,802 2,199 3,403 18,095
Diseases of the Genitourinary System 580-629 653 1,075 2,990 1,364 1,657 7,739
Complications of Pregnancy, Child-
birth, and Puerperium 630-677 354 415 1,852 432 455 3,508
Diseases of the Skin and Subcutaneous
Tissue 680-709 355 572 1,527 518 544 3,516
Diseases of the Muscoloskeletal Sys-
tem and Connective Tissue 710-739 847 1,549 4,479 831 1,577 9,283
Congenital Anomalies 740-759 98 102 289 47 88 624
Certain Conditions Originating in the
Perinatal Period 760-779 155 144 341 120 166 926
Symptoms, Signs, and Ill-Defined
Conditions 780-799 321 555 1,731 617 973 4,197
Injury and Poisoning 800-999 1,466 2,124 6,239 1,274 2,167 13,270
Supplementary Conditions V01-V84 2,062 2,942 9,795 4,015 4,199 23,013
Ungroupable Diagnoses 0 0 0 0 0 0
Total 15,637 21,636 67,299 22,191 28,243 155,006
2014 Hospital Inpatient Discharge Data Report 41 New Mexico Department of Health
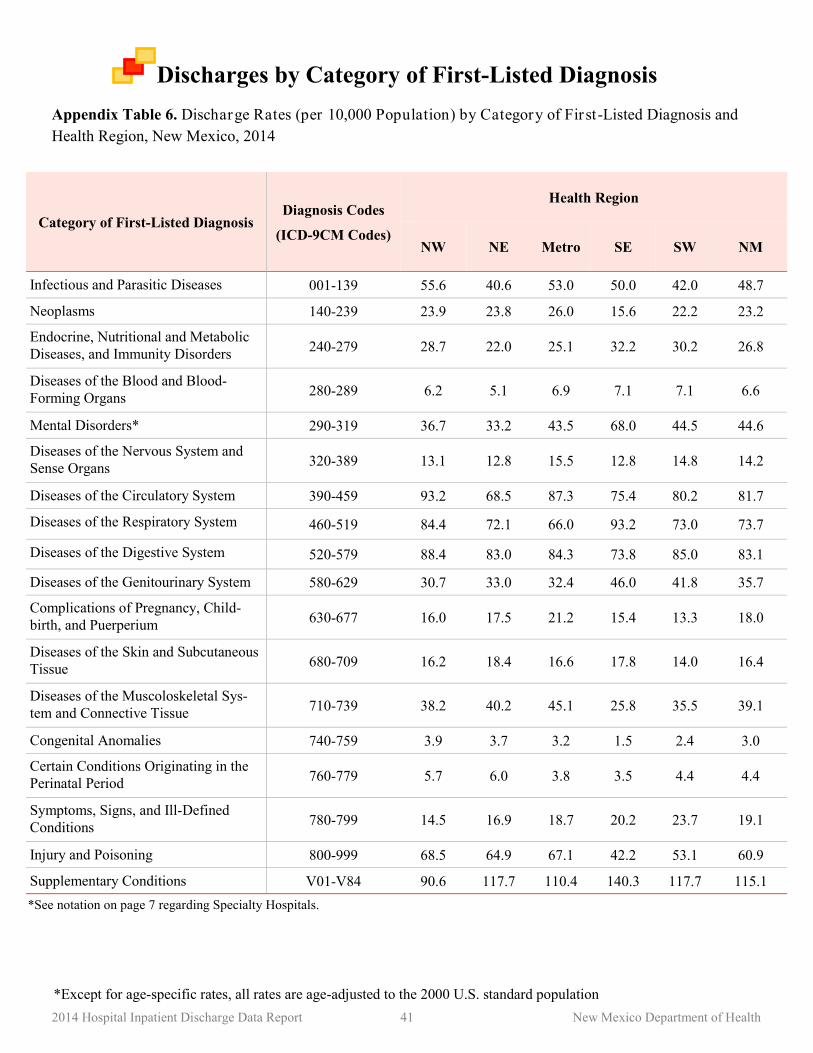
Discharges by Category of First-Listed Diagnosis
Appendix Table 6. Discharge Rates (per 10,000 Population) by Category of First-Listed Diagnosis and
Health Region, New Mexico, 2014
*Except for age-specific rates, all rates are age-adjusted to the 2000 U.S. standard population
Category of First-Listed Diagnosis Diagnosis Codes
(ICD-9CM Codes)
Health Region
NW NE Metro SE SW NM
Infectious and Parasitic Diseases 001-139 55.6 40.6 53.0 50.0 42.0 48.7
Neoplasms 140-239 23.9 23.8 26.0 15.6 22.2 23.2
Endocrine, Nutritional and Metabolic
Diseases, and Immunity Disorders 240-279 28.7 22.0 25.1 32.2 30.2 26.8
Diseases of the Blood and Blood-
Forming Organs 280-289 6.2 5.1 6.9 7.1 7.1 6.6
Mental Disorders* 290-319 36.7 33.2 43.5 68.0 44.5 44.6
Diseases of the Nervous System and
Sense Organs 320-389 13.1 12.8 15.5 12.8 14.8 14.2
Diseases of the Circulatory System 390-459 93.2 68.5 87.3 75.4 80.2 81.7
Diseases of the Respiratory System 460-519 84.4 72.1 66.0 93.2 73.0 73.7
Diseases of the Digestive System 520-579 88.4 83.0 84.3 73.8 85.0 83.1
Diseases of the Genitourinary System 580-629 30.7 33.0 32.4 46.0 41.8 35.7
Complications of Pregnancy, Child-
birth, and Puerperium 630-677 16.0 17.5 21.2 15.4 13.3 18.0
Diseases of the Skin and Subcutaneous
Tissue 680-709 16.2 18.4 16.6 17.8 14.0 16.4
Diseases of the Muscoloskeletal Sys-
tem and Connective Tissue 710-739 38.2 40.2 45.1 25.8 35.5 39.1
Congenital Anomalies 740-759 3.9 3.7 3.2 1.5 2.4 3.0
Certain Conditions Originating in the
Perinatal Period 760-779 5.7 6.0 3.8 3.5 4.4 4.4
Symptoms, Signs, and Ill-Defined
Conditions 780-799 14.5 16.9 18.7 20.2 23.7 19.1
Injury and Poisoning 800-999 68.5 64.9 67.1 42.2 53.1 60.9
Supplementary Conditions V01-V84 90.6 117.7 110.4 140.3 117.7 115.1
*See notation on page 7 regarding Specialty Hospitals.

2014 Hospital Inpatient Discharge Data Report 42 New Mexico Department of Health
Discharges by Category of First-Listed Diagnosis
Appendix Figure 1. Discharge Rates by Category of First-Listed Diagnosis, New Mexico, (2011-2014) and
United States (2010)
*Except for age-specific rates, all rates are age-adjusted to the 2000 U.S. standard population

2014 Hospital Inpatient Discharge Data Report 43 New Mexico Department of Health
Discharges by Category of First-Listed Diagnosis
Appendix Table 7. Average Length of Stay (Days) by Category of First-Listed Diagnosis and Sex, New
Mexico, 2014
*Except for age-specific rates, all rates are age-adjusted to the 2000 U.S. standard population
Category of First-Listed Diagnosis Diagnosis Codes
(ICD-9CM Codes) Males Females
Infectious and Parasitic Diseases 001-139 6.9 6.2
Neoplasms 140-239 6.7 5.9
Endocrine, Nutritional and Metabolic
Diseases, and Immunity Disorders 240-279 4.6 4.2
Diseases of the Blood and Blood-
Forming Organs 280-289 3.9 3.9
Mental Disorders 290-319 6.9 7.6
Diseases of the Nervous System and
Sense Organs 320-389 5.5 4.8
Diseases of the Circulatory System 390-459 4.4 4.4
Diseases of the Respiratory System 460-519 4.5 4.6
Diseases of the Digestive System 520-579 4.5 4.5
Diseases of the Genitourinary System 580-629 4.2 3.8
Complications of Pregnancy, Child-
birth, and Puerperium 630-677 0.0 3.7
Diseases of the Skin and Subcutaneous
Tissue 680-709 4.7 4.3
Diseases of the Muscoloskeletal Sys-
tem and Connective Tissue 710-739 4.0 3.7
Congenital Anomalies 740-759 6.5 5.2
Certain Conditions Originating in the
Perinatal Period 760-779 7.3 6.9
Symptoms, Signs, and Ill-Defined
Conditions 780-799 3.0 3.2
Injury and Poisoning 800-999 6.0 5.4
Supplementary Conditions V01-V84 8.9 2.8

2014 Hospital Inpatient Discharge Data Report 44 New Mexico Department of Health
Discharges by Category of First-Listed Diagnosis
Appendix Table 8. Average Length of Stay (Days) by Category of First-Listed Diagnosis and Health Re-
gion, New Mexico, 2014
*Except for age-specific rates, all rates are age-adjusted to the 2000 U.S. standard population
Category of First-Listed Diagnosis Diagnosis Codes
(ICD-9CM Codes)
Health Region
NW NE Metro SE SW
Infectious and Parasitic Diseases 001-139 7.2 6.3 6.9 5.4 6.3
Neoplasms 140-239 6.6 5.7 6.5 4.8 6.6
Endocrine, Nutritional and Metabolic
Diseases, and Immunity Disorders 240-279 4.9 4.2 4.6 3.6 4.5
Diseases of the Blood and Blood-
Forming Organs 280-289 4.6 3.6 4.2 3.2 3.4
Mental Disorders 290-319 6.5 5.9 8.6 6.3 6.2
Diseases of the Nervous System and
Sense Organs 320-389 5.8 5.1 5.2 3.9 5.4
Diseases of the Circulatory System 390-459 4.7 4.5 4.6 3.7 4.4
Diseases of the Respiratory System 460-519 4.7 4.5 4.5 3.8 5.3
Diseases of the Digestive System 520-579 5.1 4.3 4.7 3.6 4.3
Diseases of the Genitourinary System 580-629 4.6 4.1 4.2 3.3 3.7
Complications of Pregnancy, Child-
birth, and Puerperium 630-677 4.1 4.0 3.9 2.9 3.1
Diseases of the Skin and Subcutaneous
Tissue 680-709 5.3 4.2 4.7 3.8 4.7
Diseases of the Muscoloskeletal Sys-
tem and Connective Tissue 710-739 4.5 3.6 3.8 3.4 4.0
Congenital Anomalies 740-759 7.3 6.1 5.3 8.1 4.9
Certain Conditions Originating in the
Perinatal Period 760-779 11.3 8.5 5.7 6.9 5.3
Symptoms, Signs, and Ill-Defined
Conditions 780-799 3.2 3.3 3.3 2.5 2.9
Injury and Poisoning 800-999 6.8 5.4 5.8 4.5 5.4
Supplementary Conditions V01-V84 2.6 3.9 3.0 2.7 3.1

2014 Hospital Inpatient Discharge Data Report 45 New Mexico Department of Health
Discharges by Category of First-Listed Diagnosis
Appendix Table 9. Average Length of Stay (Days) by Category of First-Listed Diagnosis and Age Group,
New Mexico, 2014
*Except for age-specific rates, all rates are age-adjusted to the 2000 U.S. standard population
Category of First-Listed Diagnosis Diagnosis Codes
(ICD-9CM Codes)
Age in Years
<15 15-44 45-64 65+
Infectious and Parasitic Diseases 001-139 5.2 6.3 7.3 6.2
Neoplasms 140-239 12.4 5.5 5.9 6.6
Endocrine, Nutritional and Metabolic
Diseases, and Immunity Disorders 240-279 4.2 3.7 4.9 4.5
Diseases of the Blood and Blood-Forming
Organs 280-289 3.5 4.4 3.9 3.8
Mental Disorders 290-319 12.4 6.2 7.1 9.1
Diseases of the Nervous System and
Sense Organs 320-389 4.1 4.8 5.2 5.7
Diseases of the Circulatory System 390-459 8.3 4.3 4.4 4.4
Diseases of the Respiratory System 460-519 3.5 4.7 5.0 4.8
Diseases of the Digestive System 520-579 4.2 3.9 4.6 4.9
Diseases of the Genitourinary System 580-629 4.0 3.1 4.0 4.3
Complications of Pregnancy, Childbirth,
and Puerperium 630-677 2.8 3.7 3.8 0.0
Diseases of the Skin and Subcutaneous
Tissue 680-709 3.1 4.1 4.9 5.0
Diseases of the Muscoloskeletal System
and Connective Tissue 710-739 4.4 4.9 3.8 3.7
Congenital Anomalies 740-759 6.7 4.6 4.1 5.6
Certain Conditions Originating in the
Perinatal Period 760-779 7.1 0.0 0.0 0.0
Symptoms, Signs, and Ill-Defined
Conditions 780-799 3.0 3.1 2.9 3.3
Injury and Poisoning 800-999 6.4 5.4 6.1 5.5
Supplementary Classifications V01-V84 5.0 2.6 8.7 11.1
2014 Hospital Inpatient Discharge Data Report 46 New Mexico Department of Health
New Mexico Department of Health
Epidemiology and Response Division
Harold L. Runnels Building
1190 S. St. Francis Drive, STE. N1300
Santa Fe, NM 87502
Phone: (505) 827-2613
Fax: (505) 827-2110
http://www.nmhealth.org