2014 goldman sachs chemical intensity days tio2: opportunity … · 2018-04-14 · comprehensive...
TRANSCRIPT

TZMI.COM
20112015
T Z M I2015 ITA Orlando
The global titanium sponge market
review
David McCoy
Oct 15 INTERNATIONAL TITANIUM ASSOCIATION: ORLANDO, USA © 2015 2
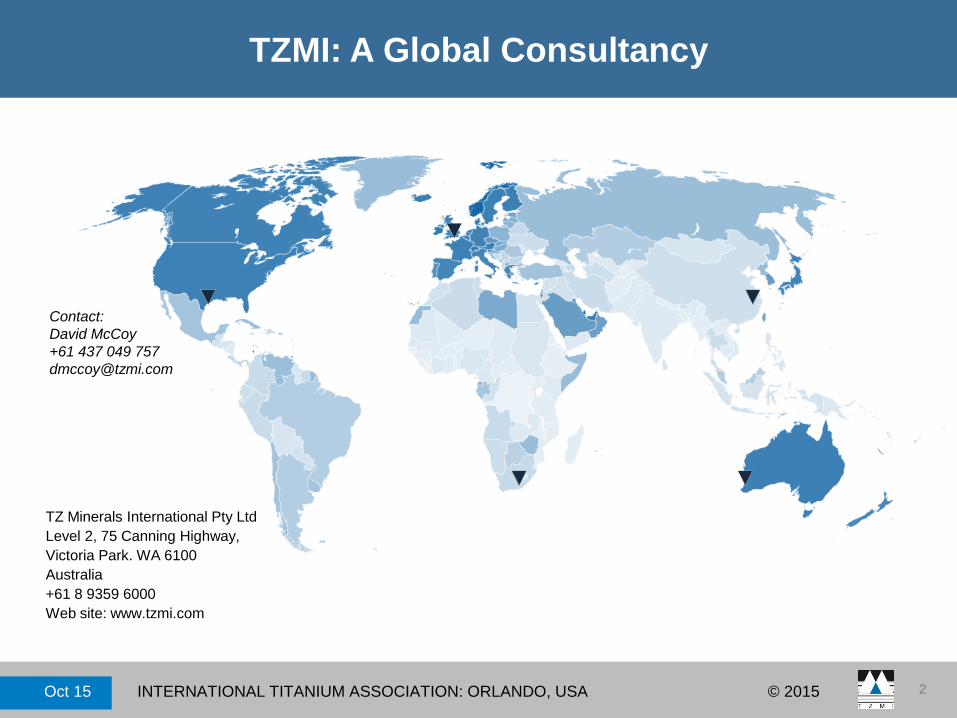
TZMI: A Global Consultancy
TZ Minerals International Pty Ltd
Level 2, 75 Canning Highway,
Victoria Park. WA 6100
Australia
+61 8 9359 6000
Web site: www.tzmi.com
Contact:
David McCoy
+61 437 049 757

Oct 15 INTERNATIONAL TITANIUM ASSOCIATION: ORLANDO, USA © 2015 3
About TZMI
TZ Minerals International (TZMI) is a global, independent consulting and publishing company which specialises in
technical, strategic and commercial analyses of the opaque (non-terminal market) mineral, chemical and metal sectors.
Our clients include the worlds largest mining, financing and OEM companies, together with a wide range of existing and
new market participants.
With a worldwide presence, including head office in Australia, and offices in the US, Africa, Europe and China, TZMI’s
strength in consulting services is a result of our extensive practical experience across all elements of the industries and
from a comprehensive and unique database, which has been built up over many years.
TZMI has proven expertise gained from our consultants having many years of direct operating experience in the
industry in chief executive, senior operational, analytical and marketing roles.
TZMI’s publications and data services provide additional benefit for our clients and ensure up-to-date, high-quality and
comprehensive data, analysis and information across the mineral sands, zircon, TiO2 pigment, vanadium and titanium
metal industries.
To ensure TZMI provides accurate and up to date advice, TZMI maintains the most comprehensive and current
databases of industry production, market information and best practices in the world, including supply and demand
models, technical data and operating cost data for all major producers.
TZMI.COM
Brief history of titanium sponge
Oct 15 INTERNATIONAL TITANIUM ASSOCIATION: ORLANDO, USA © 2015 5
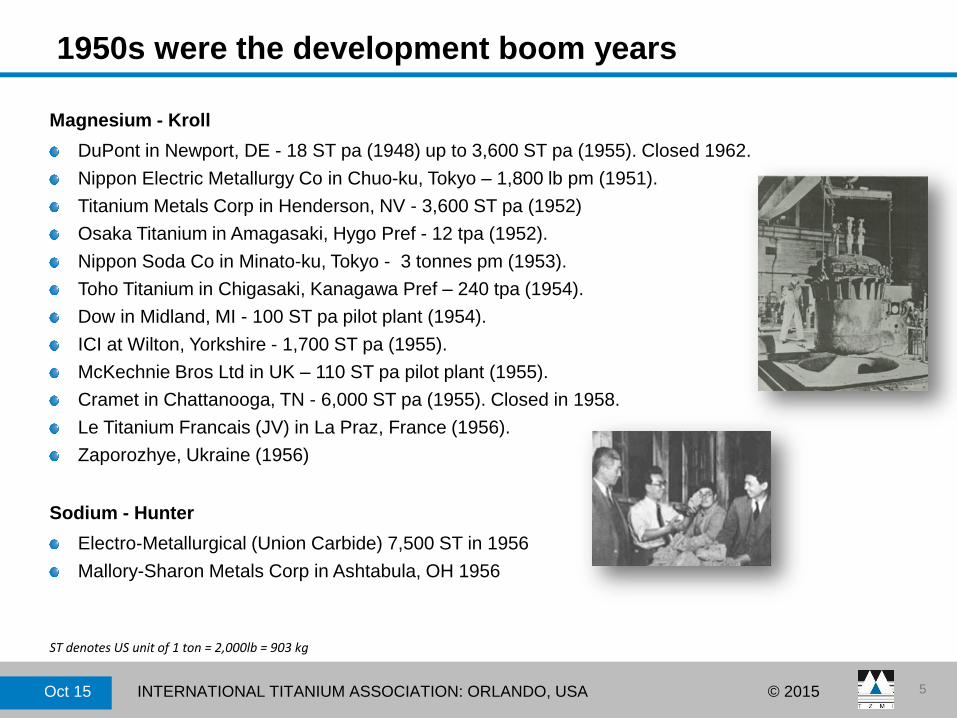
1950s were the development boom years
Magnesium - Kroll
DuPont in Newport, DE - 18 ST pa (1948) up to 3,600 ST pa (1955). Closed 1962.
Nippon Electric Metallurgy Co in Chuo-ku, Tokyo – 1,800 lb pm (1951).
Titanium Metals Corp in Henderson, NV - 3,600 ST pa (1952)
Osaka Titanium in Amagasaki, Hygo Pref - 12 tpa (1952).
Nippon Soda Co in Minato-ku, Tokyo - 3 tonnes pm (1953).
Toho Titanium in Chigasaki, Kanagawa Pref – 240 tpa (1954).
Dow in Midland, MI - 100 ST pa pilot plant (1954).
ICI at Wilton, Yorkshire - 1,700 ST pa (1955).
McKechnie Bros Ltd in UK – 110 ST pa pilot plant (1955).
Cramet in Chattanooga, TN - 6,000 ST pa (1955). Closed in 1958.
Le Titanium Francais (JV) in La Praz, France (1956).
Zaporozhye, Ukraine (1956)
Sodium - Hunter
Electro-Metallurgical (Union Carbide) 7,500 ST in 1956
Mallory-Sharon Metals Corp in Ashtabula, OH 1956
ST denotes US unit of 1 ton = 2,000lb = 903 kg

Oct 15 INTERNATIONAL TITANIUM ASSOCIATION: ORLANDO, USA © 2015 6
1960s saw expansion into new countries
BTMK – Russia (1959)
Zunyi Titanium – China (1965)
UKTMP – Kazakhstan (1965)
Source: UKTMP
Source: Zunyi Titanium
Source: VSMPO

TZMI.COM
Non-Chinese sponge suppliers

Oct 15 INTERNATIONAL TITANIUM ASSOCIATION: ORLANDO, USA © 2015 8
Verkhnaya Salda Metallurgical Production Association
VSMPO sponge production (‘000 tonnes): 2004-2014
20
10
50
0
30
40
20112010200920082007200620052004 2012 20142013
© TZMI - NOT FOR REPRODUCTION
Source: TZMI database

Oct 15 INTERNATIONAL TITANIUM ASSOCIATION: ORLANDO, USA © 2015 9
Japan is a critical player
Japanese sponge production (‘000 tonnes): 2004-2014
60
50
30
10
40
20
0
2010 2011 201420132012200920082007200620052004Source: Osaka Titanium
Source: TZMI database
© TZMI - NOT FOR REPRODUCTION
Source: Toho Titanium

Oct 15 INTERNATIONAL TITANIUM ASSOCIATION: ORLANDO, USA © 2015 10
Japanese sponge exports have decreased recently
Japanese sponge exports (000s tonnes): 2004 – 2014
35
30
15
25
20
10
5
0
8
2014
16
‘000 tonnes
2004 2010
15
2009
9
2008
11
2013
19
2012
31
2011
25
2007
11
2006
13
2005
9
Source: TZMI database
© TZMI - NOT FOR REPRODUCTION

Oct 15 INTERNATIONAL TITANIUM ASSOCIATION: ORLANDO, USA © 2015 11
US output increasing – when the market allows
US sponge production (‘000 tonnes): 2004-2014
4
16
0
20
12
8
20142013201220112010200920082007200620052004
Source: TZMI database
© TZMI - NOT FOR REPRODUCTION
Source: TIMET
Source: ATI

Oct 15 INTERNATIONAL TITANIUM ASSOCIATION: ORLANDO, USA © 2015 12
US sponge imports have curtailed
US sponge imports (‘000 tonnes): 2004 – 2014
Source: TZMI database
33
8
21
424
4
27
2007 2008 2009 2010 2011
7
5
20
6
13
1
13
19
10
16
6
8
8
8
0
6
9 897
912
1512
7
2012 2013 2014
25
5
161
21
2
9
2004 2005 2006
132
33
161
Japan
Kazakhstan
Others
© TZMI - NOT FOR REPRODUCTION
Oct 15 INTERNATIONAL TITANIUM ASSOCIATION: ORLANDO, USA © 2015 13
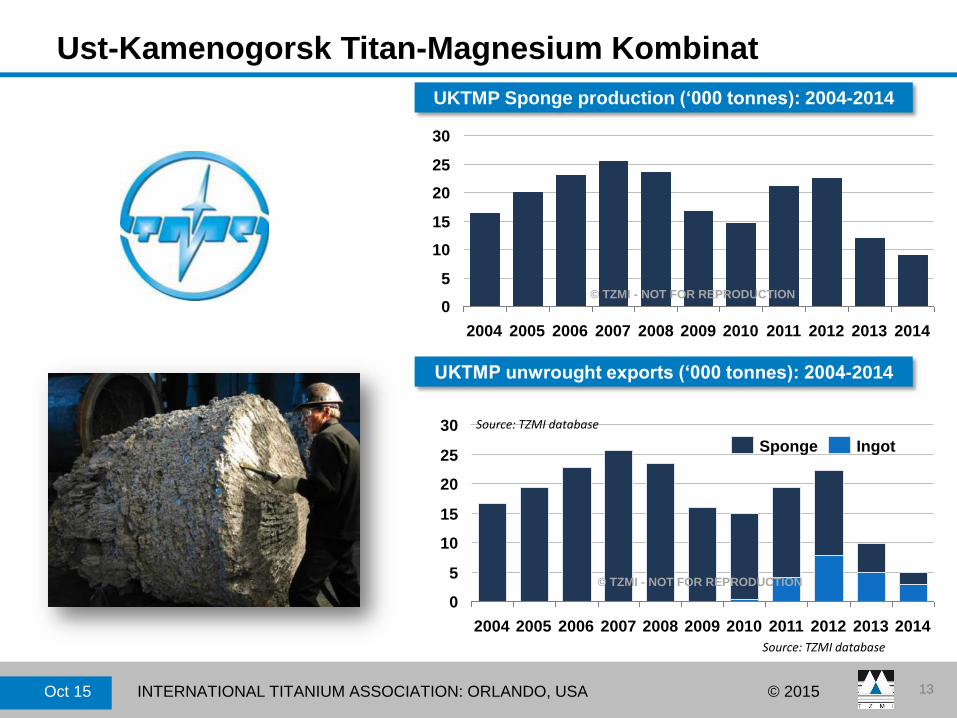
Ust-Kamenogorsk Titan-Magnesium Kombinat
UKTMP Sponge production (‘000 tonnes): 2004-2014
30
25
20
15
10
5
0
201220112010200920082007200620052004 20142013
UKTMP unwrought exports (‘000 tonnes): 2004-2014
25
20
15
10
5
0
30
2007200620052004 2014201320122011201020092008
Source: TZMI database
© TZMI - NOT FOR REPRODUCTION
IngotSponge
© TZMI - NOT FOR REPRODUCTION
Source: TZMI database

Oct 15 INTERNATIONAL TITANIUM ASSOCIATION: ORLANDO, USA © 2015 14
Zaporozhye Titanium & Magnesium Combine
ZTMC Sponge production (‘000 tonnes): 2004-2014
8
10
0
6
4
2
20092007200620052004 2008 20142013201220112010Source: TZMI database
© TZMI - NOT FOR REPRODUCTION

Oct 15 INTERNATIONAL TITANIUM ASSOCIATION: ORLANDO, USA © 2015 15
Solikamsk Magnesium Works
SMG sponge production (‘000 tonnes): 2004-2014
1.5
2.0
1.0
0.5
0.0
201420132012201120102009
© TZMI - NOT FOR REPRODUCTION
Source: TZMI database

Oct 15 INTERNATIONAL TITANIUM ASSOCIATION: ORLANDO, USA © 2015 16
Output is dominated by a select number of producers
Breakdown of titanium sponge output: 2014
Source: TZMI database
Anshan Hailiang Titanium Industry
0.9%
1.8%
1.5%2.2%
Shanxi Zhuofeng Titanium Industry
7.4%
Zhongxin (CITIC) Jinzhou Ferroalloys
8.8%Tangshan Tianhe Titanium Industry
8.9%Chaoyang Baisheng Titanium Industry
11.5%
Chaoyang Jinda Titanium Co Ltd
Jinchuan GroupPanzhihua Xinyu Chemical Industry
Pangang Titanium
12.3%
BaoTi Huashen Titanium Industry
15.8%
12.5%
Luoyang Sunrui Wanji Titanium
Zunyi Titanium Industry
16.4%
© TZMI - NOT FOR REPRODUCTION
Oct 15 INTERNATIONAL TITANIUM ASSOCIATION: ORLANDO, USA © 2015 17
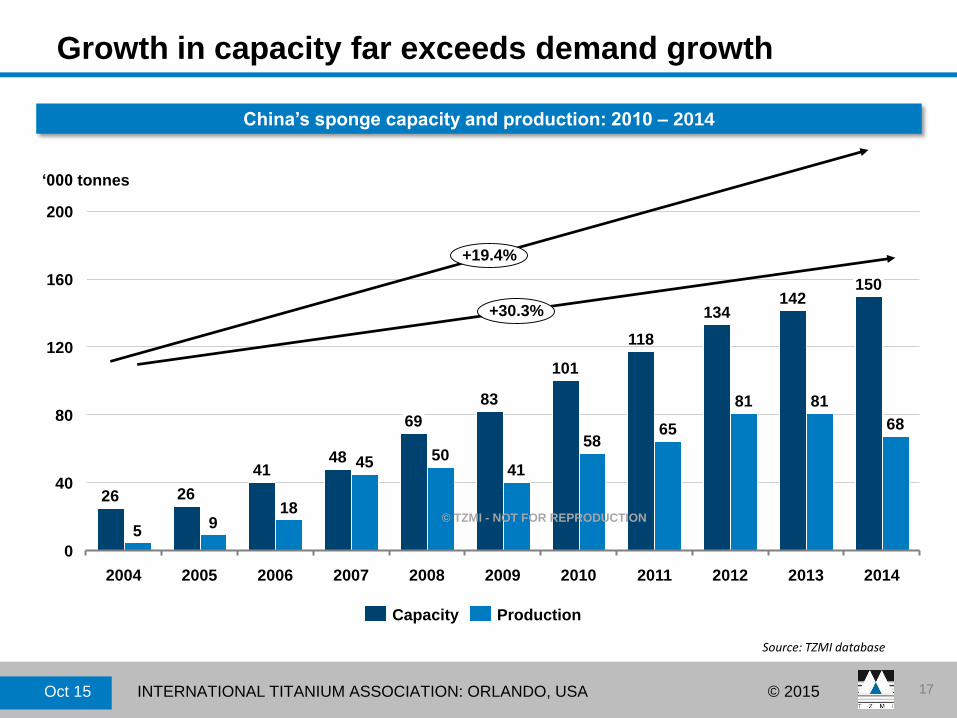
Growth in capacity far exceeds demand growth
China’s sponge capacity and production: 2010 – 2014
40
120
80
160
200
0
2006
65
2004
26
142
2012
81
150
48
2007 2008 2009
58
83
2005
101
‘000 tonnes
5
69
2014
118
+30.3%
+19.4%
20132010
134
81
2011
26
41
918
45 5041
68
Capacity Production
Source: TZMI database
© TZMI - NOT FOR REPRODUCTION

Oct 15 INTERNATIONAL TITANIUM ASSOCIATION: ORLANDO, USA © 2015 18
Chinese sponge exports have fluctuated
China’s sponge exports: 2004 – 2014
2
10
0
8
6
4
12
8
2006
1
3
‘000 tonnes
4
1
2004
11
1
4
6
5
2007 2008 2009 2010 2011 2012 2013 2014
9
2005
Source: TZMI database
© TZMI - NOT FOR REPRODUCTION
Oct 15 INTERNATIONAL TITANIUM ASSOCIATION: ORLANDO, USA © 2015 19
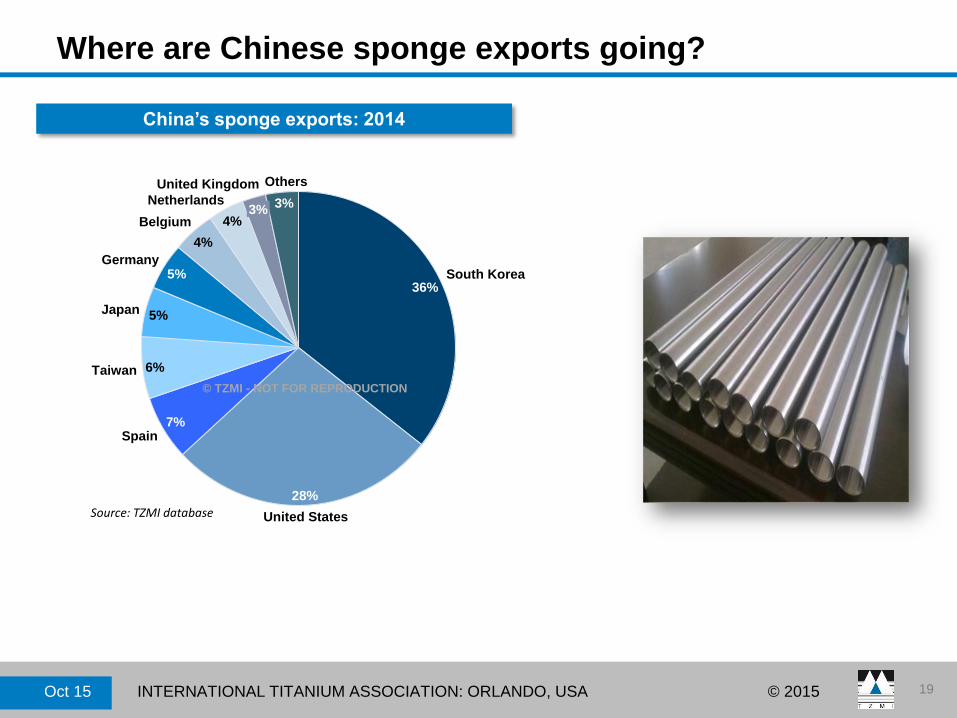
Where are Chinese sponge exports going?
China’s sponge exports: 2014
Source: TZMI database
3%
United Kingdom
3%
4%
Netherlands
South Korea
Others
28%
Spain
6%Taiwan
5%
7%
United States
36%
Belgium
4%
Germany5%
Japan
© TZMI - NOT FOR REPRODUCTION
Oct 15 INTERNATIONAL TITANIUM ASSOCIATION: ORLANDO, USA © 2015 20
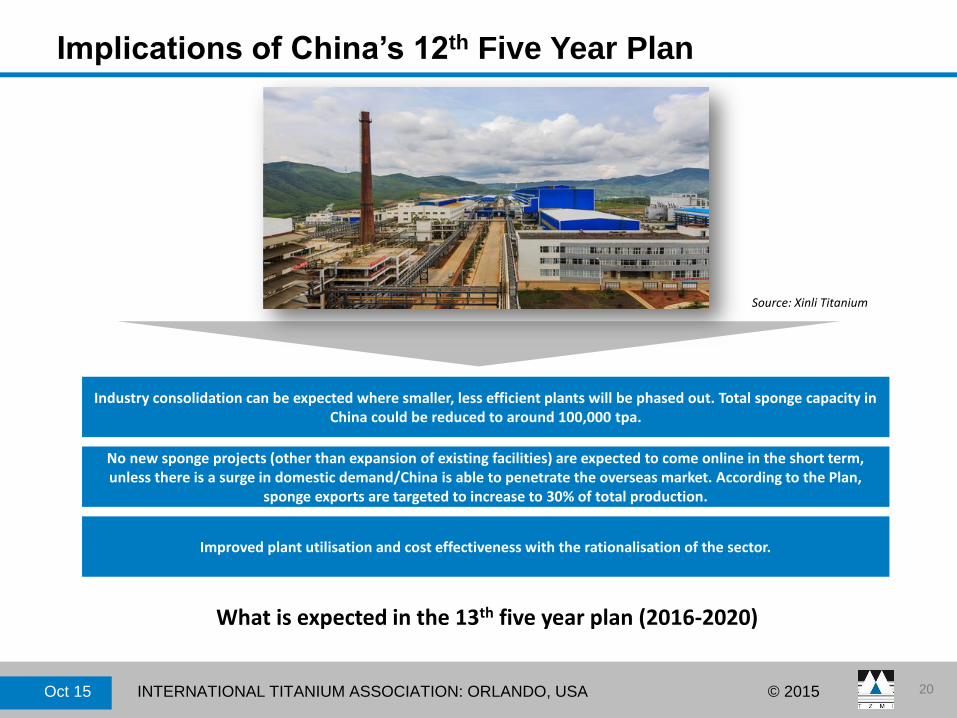
Implications of China’s 12th Five Year Plan
Industry consolidation can be expected where smaller, less efficient plants will be phased out. Total sponge capacity in China could be reduced to around 100,000 tpa.
No new sponge projects (other than expansion of existing facilities) are expected to come online in the short term, unless there is a surge in domestic demand/China is able to penetrate the overseas market. According to the Plan,
sponge exports are targeted to increase to 30% of total production.
Improved plant utilisation and cost effectiveness with the rationalisation of the sector.
Source: Xinli Titanium
What is expected in the 13th five year plan (2016-2020)

Oct 15 INTERNATIONAL TITANIUM ASSOCIATION: ORLANDO, USA © 2015 21
India now developing sponge technology

Oct 15 INTERNATIONAL TITANIUM ASSOCIATION: ORLANDO, USA © 2015 22
A new facility is under construction in Saudi Arabia
Oct 15 INTERNATIONAL TITANIUM ASSOCIATION: ORLANDO, USA © 2015 23
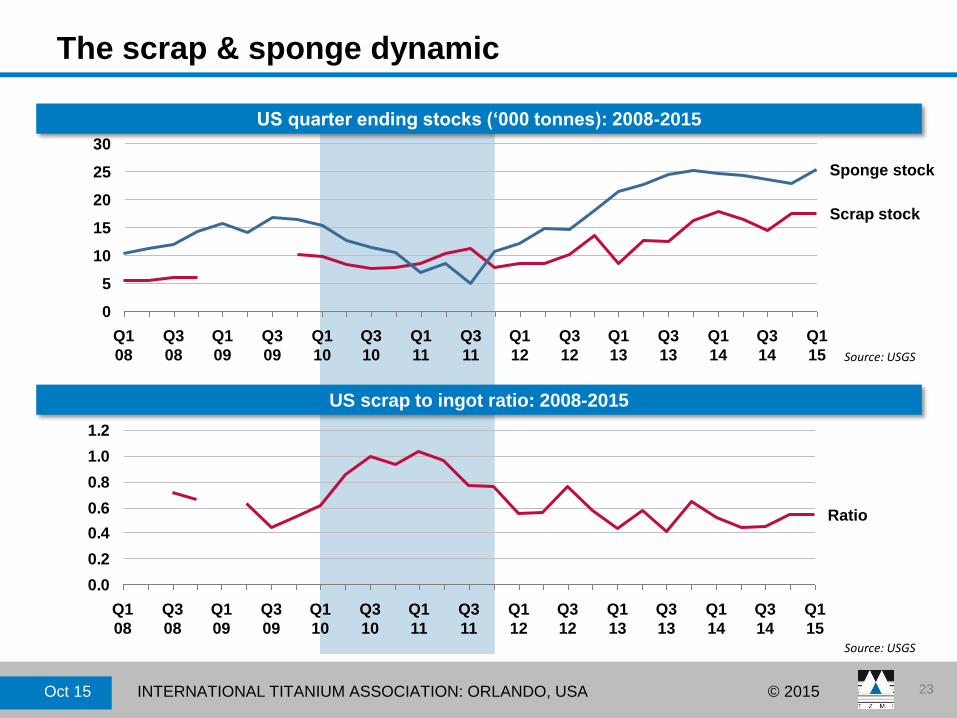
The scrap & sponge dynamic
0.0
0.2
0.4
0.6
0.8
1.0
1.2
Q3
12
Q3
10
Q1
11
Q3
11
Q1
12
Q3
09
Q1
10
Q1
09
Q3
08
Q1
08
Q1
13
Q3
13
Q1
14
Q3
14
Q1
15
Ratio
Source: USGS
US scrap to ingot ratio: 2008-2015
10
25
5
0
15
20
30
Q1
08
Q3
08
Q1
09
Q1
12
Q3
09
Q1
13
Q1
11
Q3
10
Q3
12
Q1
10
Q3
11
Q3
14
Q1
15
Q3
13
Q1
14
Scrap stock
Sponge stock
Source: USGS
US quarter ending stocks (‘000 tonnes): 2008-2015

Oct 15 INTERNATIONAL TITANIUM ASSOCIATION: ORLANDO, USA © 2015 24
TZMI multi-client work
Titanium Feedstock Price Forecast
TiO2 Pigment Price Forecast
PDF report - published quarterly
Mineral Sands Report
TiO2 Market Insight
TiO2 Pigment Industry Report
PDF reports - published monthly
Titanium Feedstock Annual Review 2014 – OUT NOW!
Zircon Annual Review 2014 – OUT NOW!
TiO2 Pigment Annual Review 2014 – OUT NOW!
Titanium Metal Annual Review 2014 – OUT NOW!
TZMI Data Reports
• TiO2 Feedstock Matrix – published annually
• Zircon Trade Matrix – published annually
• Zircon Quarter-to-Quarter published quarterly
Titanium Feedstock Producers
Comparative Cost Study
TiO2 Pigment Producers
Comparative Cost & Profitability Study
PDF reports - published annually
TZMI.COM
20112014
T Z M I
Global delivery of insight and expert advice
End of Presentation