2014 full year results - nexans · issued following their review of the management report. ... 2014...
TRANSCRIPT

2014 Full Year results February 13, 2015

2014 Full Year results 2
Safe Harbor Forward-looking information in this presentation are based on risks and uncertainties, known and unknown to date, which may have an impact on the future performance of the Company, which may materially differ. Readers are also invited to log on to the Group's website where they can view and download the press release of the annual results and the 2014 financial statements and Management Report, which include a description of the Group's risk factors. These risk factors notably include the risks related to investigations launched in 2009 on anti-competitive behavior in the submarine and underground high-voltage cables sector in various countries. To date, these investigations resulted in fines being imposed on the main cable industry players in Europe and Asia by the European Commission in its decision of April 2, 2014. The Group recorded an 80 million euros provision to cover the direct and indirect consequences of the decision of the European Commission and of the procedures underway in other countries relating to the same industry segment. In addition to the risk factors, the main uncertainties for 2015 concern: • the economic environment in Europe where the outlook remains uncertain despite low interest rates and low oil
prices; • the demand from electrical utilities in budget constrained environment of States (Europe, Australia); • the strong currency volatility, especially in emerging countries (and their impact on liquidity particularly in some of
these countries: South America, Africa, China and Russia) but also in mature markets (Switzerland, Canada); • the high volatility of raw material prices that can affect sales and margins in the Group businesses related to the raw
materials industry segment; • the price of oil, which could lead to a further decline in investment of sector actors, beyond the cuts already
announced for 2015; • the marked worsening of the geopolitical situation in some countries in the Middle East and Russia; • operating difficulties related to potential disruptions in supplies of water and electricity, especially in Brazil.
Audit procedures on the consolidated financial statements have been carried out. The Statutory Auditors’ report will be issued following their review of the management report.
Investor relation contact: Michel Gédéon +33 1 73 23 85 31 [email protected] Laura Duquesne +33 1 73 23 84 61 [email protected]

3
1. Long term drivers Frédéric Vincent
Chairman

2014 Full Year results
Electricity consumption
Energy consumption Energy from renewables
Automotive Air passengers
4
Market drivers are favorable for the long term
Population growth +20%
Urbanization +40%
Transport
Expectations for 2030
x2
+60%
x2
+50%
Energy
+40%
2014 2030 Sources: EIA, OECD, United Nation, IHS Automotive

2014 Full Year results 5
Nexans is a solution provider for a more efficient & sustainable future
Power and data infrastructures
Fossil & renewable resources
Transport
Building
Higher voltage & deeper submarine installations Aluminum solutions Smart grids
Fire resistant cables Energy efficiency programs Data cables: higher bandwidth
Safer & more reliable cables resisting to harsher conditions of exploration/extraction
Aluminum solutions for lighter cables Lead free cables Hybrid cables for signaling Anti-theft solutions
37bn€
5.5bn€
7.5bn€
21bn€
Market size (*)
(*) Nexans estimates

2014 Full Year results 6
Vision of Nexans Given market evolution, the company confirms its focus on 4 sectors:
Power transmission Power/data distribution Accessories
Mining O&G Renewables Power plants
Aerospace Railways, city rail Automotive Shipbuilding
Residential Commercial Data
Power and data infrastructures
Fossil & renewable resources
Transport
Building
40%
10%
14%
24%
Exposure to the sector in 2014

7
2. A few moments of pride in 2014
Arnaud Poupart-Lafarge CEO

2014 Full Year results
Biggest ever contract for Nexans 8
NordLink HVDC interconnector between Norway and Germany will use Nexans’ subsea power cables
2014 Full Year results 9
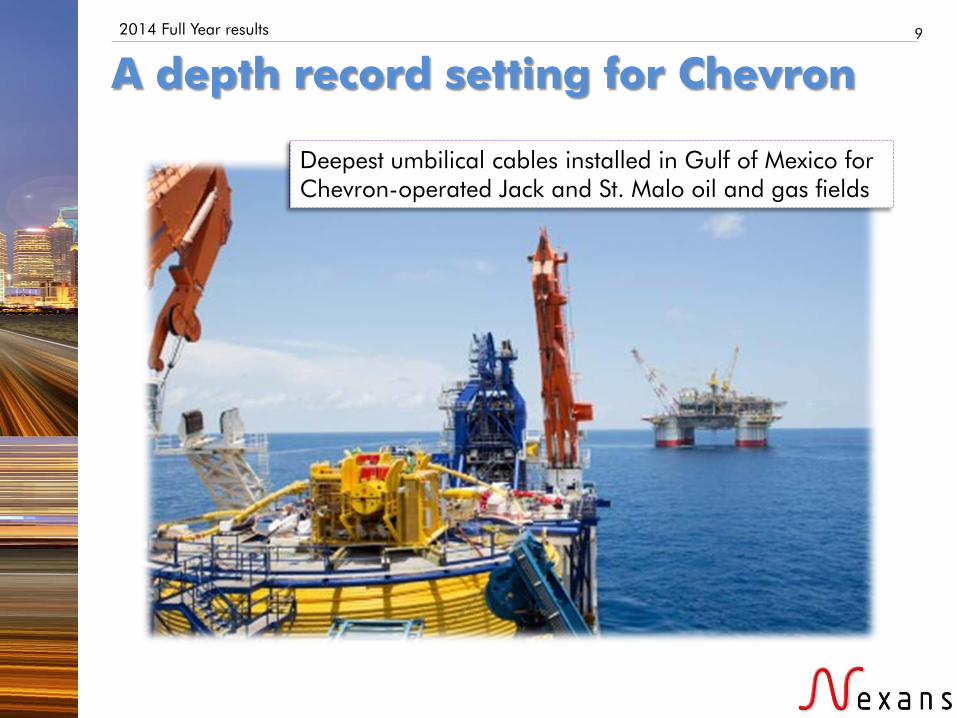
A depth record setting for Chevron
Deepest umbilical cables installed in Gulf of Mexico for Chevron-operated Jack and St. Malo oil and gas fields
2014 Full Year results 10
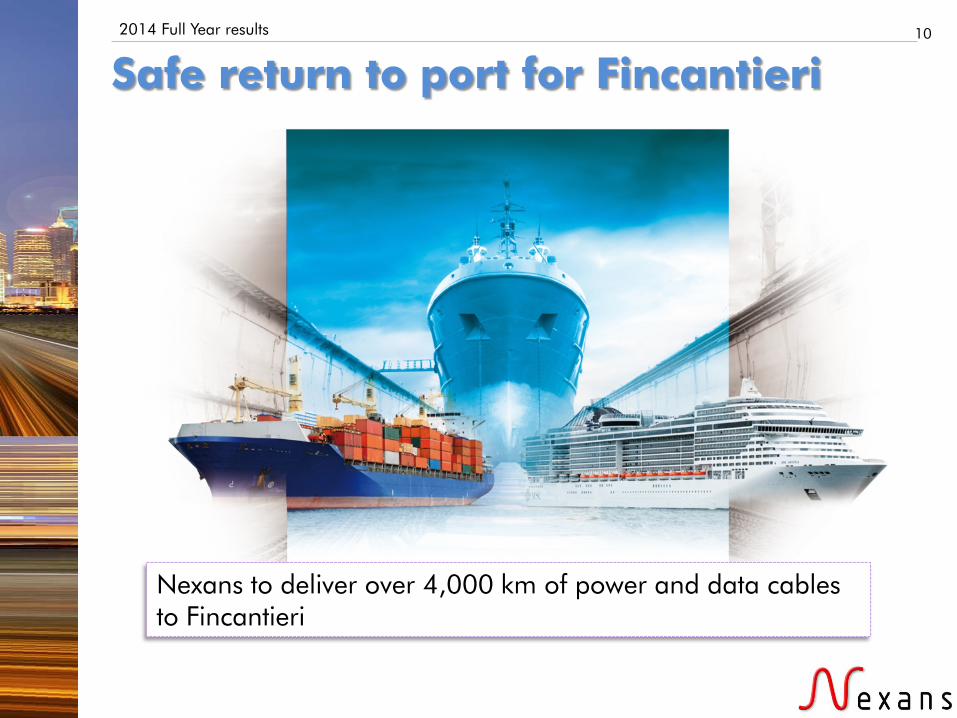
Nexans to deliver over 4,000 km of power and data cables to Fincantieri
Safe return to port for Fincantieri

2014 Full Year results 11
Nexans’ cables to enhance fire safety for world’s largest cruise ship - STX
Biggest cruise ship ever for STX

2014 Full Year results 12
Safest airplanes for Airbus
Airbus selects Nexans as main cable supplier for the next five years

2014 Full Year results 13
SBB signs five-year framework agreement with Nexans for signaling and balise cables for upgrades to Swiss rail network
Safest trains in Switzerland
2014 Full Year results 14
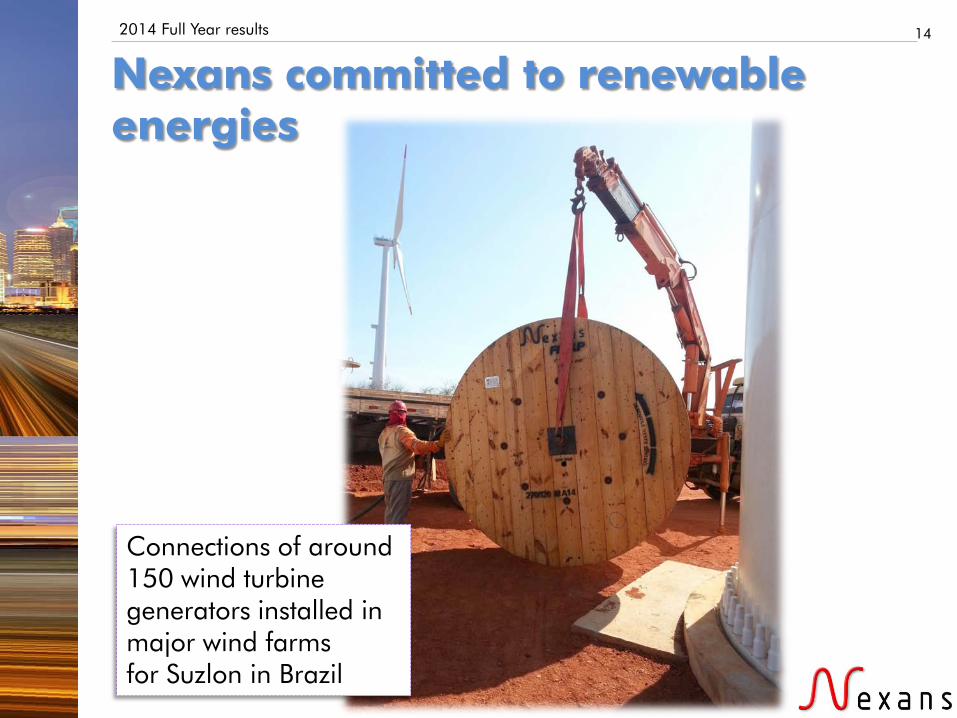
Connections of around 150 wind turbine generators installed in major wind farms for Suzlon in Brazil
Nexans committed to renewable energies
2014 Full Year results 15
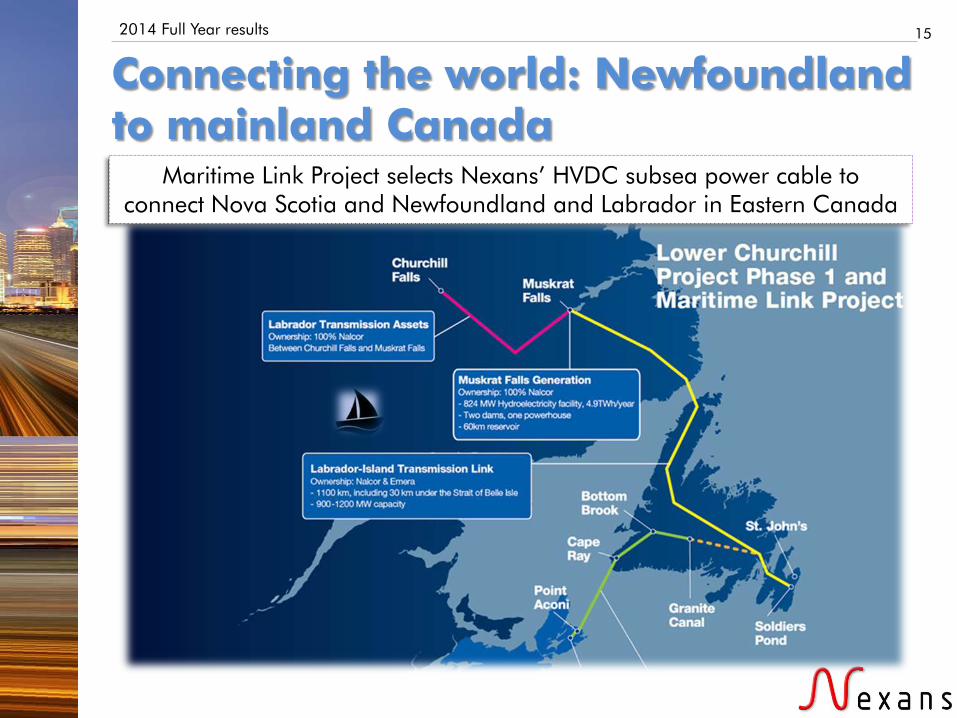
Connecting the world: Newfoundland to mainland Canada
Maritime Link Project selects Nexans’ HVDC subsea power cable to connect Nova Scotia and Newfoundland and Labrador in Eastern Canada

2014 Full Year results 16
First of four contracted umbilicals for Statoil oil and gas projects delivered
Our technology for a better environment
Nexans' Direct Electrical Heating systems selected by Statoil for the Kristin and Maria fields

2014 Full Year results 17
2013 Supplier Award by RWE for Innovation for AmpaCity superconductor project
Imagine the future
18
3. Highlights 2014
Arnaud Poupart-Lafarge CEO

2014 Full Year results 19
Improved profitability on flat volumes
Sales at constant metal prices
+0.7% organic growth
2013 as published
2014
4,689
4,555 4,587
Figures in M€, unless otherwise specified
Net debt
Dec 31, 2013
337
607
460
(*) excluding non recurring pension effect of 30 million euros
2013 as published
2013 at constant FX & scope
2014
135
Operating margin
141(*)
148
2014: 3.2% of sales at constant metal prices, vs 3.0% in 2013
2013 at constant FX & scope
Scope
139
Jun 30, 2014 Dec 31, 2014

2014 Full Year results 20
South America and Australia weigh on sales
North America: +1.7%
Progressive recovery
South America: -7.8%
Strong decline accelerated in H2
MERA: +3.0% Despite political
tensions
Asia Pacific: -3.6%
Positive trend except for Australia
High Voltage: +4.4%
contrasted Europe: +1.6%
Overall stable 14% of sales
8% of sales
16% of sales
43% of sales
6% of sales
13% of sales
Exposure by origin Sales at constant
metal prices
Year on year organic growth by region

2014 Full Year results 21
Industry and Submarine leading the growth
Distributors & Installers
Sales (constant metal prices) 1,120M€
Year on year organic growth -0.5%
Operating margin 26M€
Industry
Sales (constant metal prices) 1,213M€
Year on year organic growth +2.9%
Operating margin 50M€
Transmission, Distribution &
Operators
Sales (constant metal prices) 1,978M€
Year on year organic growth -0.3%
Operating margin 98M€
Other
Sales (constant metal prices) 276M€
Year on year organic growth +3.5%
Operating margin -26M€

2014 Full Year results 22
D&I faces adverse H2 environment
Sales: 1,120M€ Yoy organic growth: -0.5%
South America
Sales and yoy organic growth by region
H1’14: +0.6% H2’14: -1.6%
Europe
North America
MERA
APAC -17%
+1%
+1%
+13%
+7%
-10%
-7%
+9%
+4%
+3%
Weak sales in H2’14 driven by difficult environment in Europe and South America
Better performance in North America, MERA and APAC
Operating margin: 26M€ OM/Sales: 2.3%
Competition & volume issues in Europe and South America
Positive results from restructuring actions in Australia
Improvement in LAN cables in North America
2013 published
2013 comparable
2014
3.2% 2.8%
2.3% FX & scope
Europe & SAM
APAC & NAM
OM/Sales

2014 Full Year results 23
Industry is well oriented
OM/Sales
H1’13 comparable
H2’13 comparable
H1’14 H2’14
Good contribution from harnesses (positive leverage)
Progressive improvement of margins driven by Europe (restructuring actions and repositioning) and China
Sales: 1,213M€ Yoy organic growth: +2.9%
Operating margin: 50M€ OM/Sales: 4.1%
Harnesses accelerating Dynamism in O&G while mining is tough Europe: growth on key segments China: growth resuming (rolling stock)
3.7% 3.3%
3.9%
4.3%

2014 Full Year results 24
Utilities & Operators declines in H2
Yoy organic growth: -3.0%
Utilities – Americas &
APAC
Operators
Utilities – EMEA
H1’14: -1.9% H2’14: -4.0%
+4%
0%
Year on year organic growth by region:
-5%
-14%
-12%
+6%
Utilities: -3% EMEA: recovery in Europe in H2 after tough H1 Decrease in South America in H2 and in
Australia
Operators: -5% Strong in Scandinavia and SAM, down in France
Operating margin: slight decline vs 2013
2013 published
2013 comparable
2014
FX & scope
Americas
APAC
Resilience in Europe
Americas impacted by lower volumes and prices
Positive returns from reorganization of activity in APAC (China & Australia)

2014 Full Year results 25
Transmission is growing 4.4% vs 2013
Sales: Record year in umbilicals Strong in interconnections Operations: Turnaround of Halden factory now complete Large contracts under production Backlog: 1.5bn€, after NordLink award (0.5bn€) on February 12, 2015
Europe: Market remains difficult; restructuring actions implemented slightly ahead of initial schedule Deployment in North America: US factory qualified with 46 utilities Very active tendering activity Deployment in China: Yanggu ramp up progressing, with 40% growth in sales vs 2013 First qualification by Australian customer
Submarine Yoy organic growth:
+9% vs 2013
Land Yoy organic growth:
-5% vs 2013

26
4. Dynamics of our strategic initiatives Arnaud Poupart-Lafarge
CEO

2014 Full Year results 27
Strategic initiatives have materially contributed to FY’14 operating margin
Turnaround in HV
Fixed cost reduction
Variable cost reduction
Portfolio
Unfavorable market conditions have affected the baseline while strategic initiatives have contributed for about half of the operating margin in 2014.
Contribution of strategic initiatives mainly driven by high voltage turnaround and
restructuring actions.
19 73
202
141(*) 148
2012 2013 2014
Operating margin evolution, in M€
Baseline business Strategic initiatives
(*) excluding non recurring pension effect of 30 million euros

2014 Full Year results 28
All initiatives have delivered as planned …
Turnaround in HV 1
Fixed cost reduction 2
2011 2012 2013 2014
Sales
Target achieved on quality, processes, planning, competencies Continue focus on improvement Preparation of growth ahead
Sav ings, in M€
0 5 10 15 20 25 30 35
Europe
Australia
Support functions
Achieved
Left by 15
Left by 17
Europe Industry & Land High voltage: 2 production sites closed, good progress of equipment transfer
Support functions: ahead of schedule Australia: one factory closed, customers
already supplied from Yanggu (China)

2014 Full Year results 29
Variable cost reduction 3
Innovation 4
Growth 5
Harnesses: good development in Europe and progress in China Smart grids: opening of an R&D center (Donchery) to boost product
development
Initiative impacted by deterioration of market conditions Particularly for initiatives related to South America and mining
Manufacturing: redesign-to-cost, energy efficiency, Optimohm Purchasing: renegotiations
… with exception of South America and mining

30
4. Financial results Nicolas Badré
CFO

2014 Full Year results 31
Key figures
Sales at current metal prices
Sales at constant metal prices
EBITDA(2)
Restructuring costs
Net income (Group share)
Net debt
Operating margin
Operational Cash Flow
2013(1) 2014
6,711
4,689
316
171
(180)
(333)
126
337
6,403
4,587
288
148
(51)
(168)
101
460
In M€
(1) 2013 as published, including the non recurring pension effect of 30 million euros elsewhere restated (2) Operating margin before depreciation

2014 Full Year results 32
Income statement (1/2)
In M€ 2013(1) 2014
Sales At constant metal prices
4,689 4,587
Margin on variable costs 1,397 29.8% 1,390 30.3%
Indirect costs (1,081) (1,102)
EBITDA(2) 316 6.7% 288 6.3%
Depreciation (145) (140)
Operating margin 171 3.6% 148 3.2%
Core exposure effect (41) (4)
Restructuring costs (180) (51)
Other operational income (expenses)(3) (131) (129)
Share in net income of associates (1) 1
Operating income (182) (35)
(1) 2013 as published, including the non recurring pension effect of 30 million euros elsewhere restated (2) Operating margin before depreciation (3) Including net asset impairments, metal derivatives, net gain on asset disposal, transaction costs on
external acquisitions

2014 Full Year results 33
Sales evolution
Copper &
Aluminum
FX Scope Organic growth
2013 2014
6,711
6,403
(142)
(187)
(11) +32
Norway
Canada South America
Russia
Turkey
Australia
Sales at current metal prices, in M€

2014 Full Year results 34
EBITDA evolution
2013 2014
FX & scope
High voltage Price/Mix
effect Volume effect
Operating costs
(excl. HV)
288 286(*)
(6) +33
(31)
0+ +6
In M€
(*) excluding non recurring pension effect of 30 million euros

2014 Full Year results
Huge level of uncertainties due to the political crisis:
much lower liquidity
indirect impact of EU/US sanctions
GDP recession in H2’14 and no sign of robust recovery on the short term: mineral/agriculture prices, strong depreciation of the Real, high interest rates and inflation outlooks are sluggish
Electricity crisis; aluminum prices
O&G business impacted by ongoing corruption scandal
Residual goodwill: 30M€
Drop in metal and mineral prices leading to drastic investment reductions from mining companies between 2013 and 2014
Decreasing consumption of electricity weighing on investment decisions (and leading to upcoming privatization of public utilities)
Strengthening of competition due to Asian competitors
Residual goodwill: 52M€
Sharp decline of commodity prices over the last 18 months impacting investment in O&G and mining
Strong decrease of oil price in H2’14 and downward consensus revision increase uncertainty on O&G perspectives
Residual goodwill: 59M€
35
Significant impairments: environment changes in 2014
Russia 11M€
AmerCable 80M€
Brazil 40M€
Australia 66M€
Total: 197M€ AmerCable Australia
Brazil Russia

2014 Full Year results 36
Income statement (2/2)
In M€ 2013 2014
Operating income (182) (35)
Financial charge (109) (103)
Income before tax (291) (138)
Income tax (39) (32)
Net income from operations (330) (170)
Net income Group share (333) (168)

2014 Full Year results 37
Balance sheet
In M€ Dec 31, 2013 Dec 31, 2014
Long-term fixed assets 1,844 1,737 of which goodwill 414 303
Deferred tax assets 120 153
Non-current assets 1,964 1,890
Working Capital 879 803
Total to finance 2,843 2,693
Net financial debt 337 460 Reserves 824 709
Deferred tax liabilities 82 91
Shareholders' equity and Minority interests
1,600 1,433
Total financing 2,843 2,693

2014 Full Year results 38
Net debt evolution
Dec 31, 2013 Dec 31, 2014
(460)
(337)
101 (141)
(77) 78 (71)
OCF CAPEX
Restructuring costs
Working capital
variation
Other
Net debt evolution in M€ (13)
Antitrust fine
212
362
256
255
185
Local borrowings
2019 - 2.50% Convertible Bond
2018 - 4.25% Bond
2017 - 5.75% Bond
2016 - 4% Convertible Bond
Gross debt structure at year-end, in M€
12/31/14 Covenant
Leverage (net debt/EBITDA)
1.9 3.0
Gearing (net debt/equity)
0.3 1.1
Ratios

39
5. Perspectives Arnaud Poupart-Lafarge
CEO

2014 Full Year results 40
Over the next 12 months: Currency and copper volatility create
disruptions Spending from Power Utilities still low O&G and mining depressed Restructuring to weigh on cash flow
generation
2015 outlook: short term perspectives are challenging
Additional initiatives to offset the increasing price/cost squeeze

2014 Full Year results 41
Progressing on 2015 objectives
Turnaround HV
Restructuring
Innovation & growth
Competitiveness
Operating margin evolution, in M€
148
Left to achieve on
current initiatives
New initiatives in Europe
Price/cost squeeze
2014 2015
+77
+12
Product/customer portfolio
streamlining Manufacturing rightsizing Complexity reduction
Uncertainty relies on environment in
2014/2015

2014 Full Year results 42
On the way to 2017: Nexans in motion Key challenges and opportunities: 2/3 of the growth to come from developing countries Europe to remain flat except niches US to show slow recovery
Redesign the strategy:
Regain competitiveness
Strengthen market leadership
Manage portfolio
Fixed cost reduction Variable cost reduction
Optimization of capital employed Active drive of portfolio
Selective organic growth & CAPEX allocation
Go beyond excellence in cables

2014 Full Year results 43
Regain competitiveness
Complete reorganization launched in 2013 on Land High Voltage, Industry and Support functions in Europe Study new projects in order to deliver 100M€ additional savings by 2017
Continue fixed cost reduction
Continue variable cost reduction
Further roll out the industrial efficiency methodology: Process standardization Product redesign-to-cost Purchasing functions
Offset price erosion and cost inflation Improve overall operating margin

2014 Full Year results
Services
44
Strengthen market leadership
Develop commercial offers beyond cables (potential upside by 2017)
Go beyond cable
Electrical design Cable Distribution Assembly/
installation Operations
Cover the full cable making process
Accessories Aftermarket
Grow on specific businesses
Highly performing businesses: submarine HV, automotive harnesses, HV accessories Promising businesses: industrial segments in Europe, China
Outperforming businesses ROCE>15%
Underperforming businesses ROCE between 5 and 15%
Underperforming businesses ROCE<5%
‘BOOST’ Accelerate CAPEX
‘TRANSFORM’ Significantly reduce
CAPEX
‘SOLVE’ Redefine supply chain
Leverage on low cost countries
Prioritize and differentiate CAPEX allocation
2014 Full Year results
45
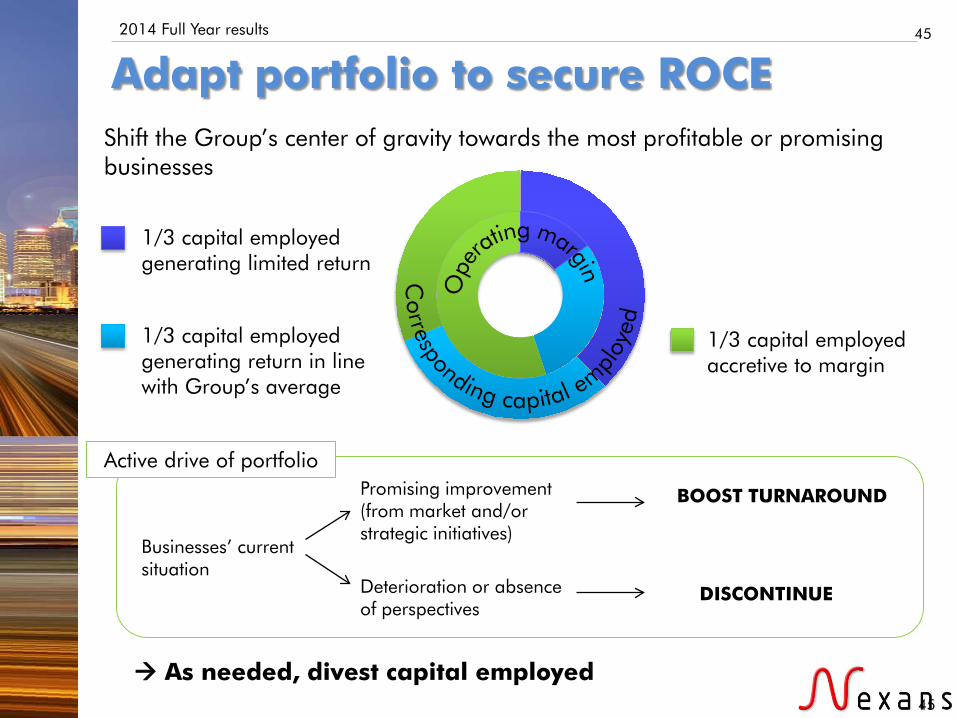
Adapt portfolio to secure ROCE Shift the Group’s center of gravity towards the most profitable or promising businesses
1/3 capital employed generating limited return
1/3 capital employed accretive to margin
1/3 capital employed generating return in line with Group’s average
As needed, divest capital employed
Businesses’ current situation
Promising improvement (from market and/or strategic initiatives)
Deterioration or absence of perspectives
DISCONTINUE
BOOST TURNAROUND
Active drive of portfolio
45

2014 Full Year results
Fixed cost reduction
Variable cost reduction
Market leadership Price/cost
squeeze highly volatile
46
On the way to 2017
2014 2017
Operating margin evolution, in M€
150 Target values of initiatives
135 90
Uncertainty relies on environment in
2014/2017

2014 Full Year results 47
One team, one project, one ambition

48
Appendices

2014 Full Year results 49
Sales and profitability by segment
2013 2014
In M€ Sales OM OM % Sales OM OM %
Transmission, Distribution & Operators
2,034 70 3.5% 1,978 98 5.0%
Industry 1,222 42 3.4% 1,213 50 4.1%
Distributors and Installers 1,155 37 3.2% 1,120 26 2.3%
Other(*) 278 (8) n/a 276 (26) n/a
Total Group 4,689 141 3.0% 4,587 148 3.2%
(*) Operating margin excluding non recurring pension effect of 30 million euros in 2013

2014 Full Year results 50
Impact of foreign exchange and consolidation scope
In M€ 2013 FX Organic
growth Scope 2014
Transmission, Distribution & Operators
2,034 (77) (5) 26 1,978
Industry 1,222 (3) 34 (40) 1,213
Distributors & Installers 1,155 (32) (5) 2 1,120
Other 278 (13) 8 3 276
Total Group 4,689 (125) 32 (9) 4,587

2014 Full Year results 51