2014 first quarter update -...
TRANSCRIPT

2014 First Quarter Update 8 May 2014
8 May 2014 Giordano 2014 First Quarter Update 2
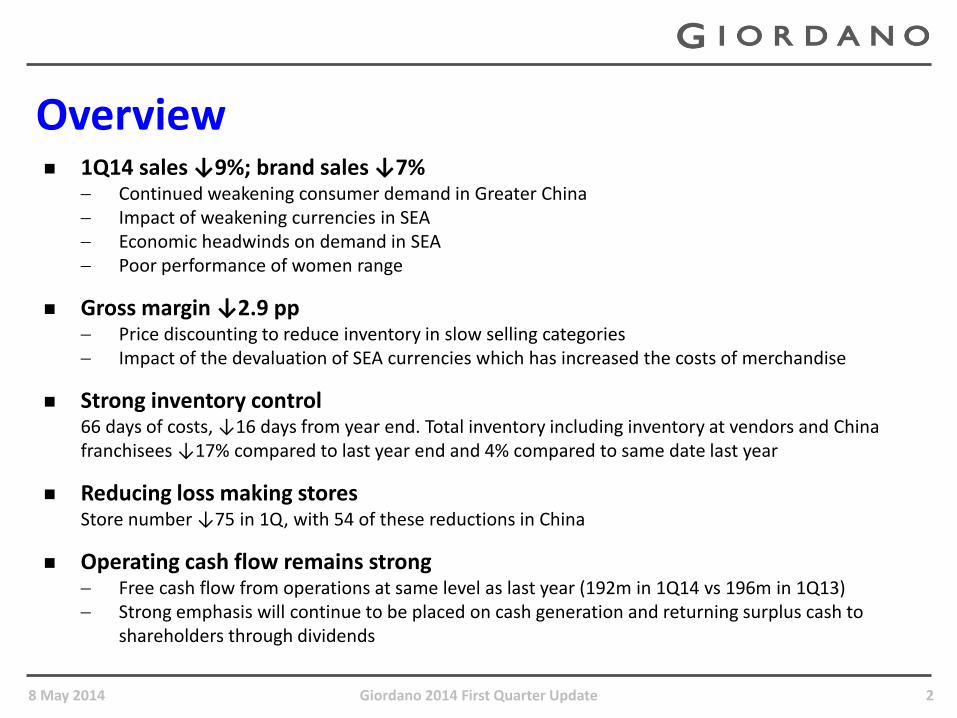
1Q14 sales ↓9%; brand sales ↓7% Continued weakening consumer demand in Greater China Impact of weakening currencies in SEA Economic headwinds on demand in SEA Poor performance of women range
Gross margin ↓2.9 pp Price discounting to reduce inventory in slow selling categories Impact of the devaluation of SEA currencies which has increased the costs of merchandise
Strong inventory control 66 days of costs, ↓16 days from year end. Total inventory including inventory at vendors and China franchisees ↓17% compared to last year end and 4% compared to same date last year
Reducing loss making stores Store number ↓75 in 1Q, with 54 of these reductions in China
Operating cash flow remains strong Free cash flow from operations at same level as last year (192m in 1Q14 vs 196m in 1Q13) Strong emphasis will continue to be placed on cash generation and returning surplus cash to
shareholders through dividends
Overview
8 May 2014 Giordano 2014 First Quarter Update 3
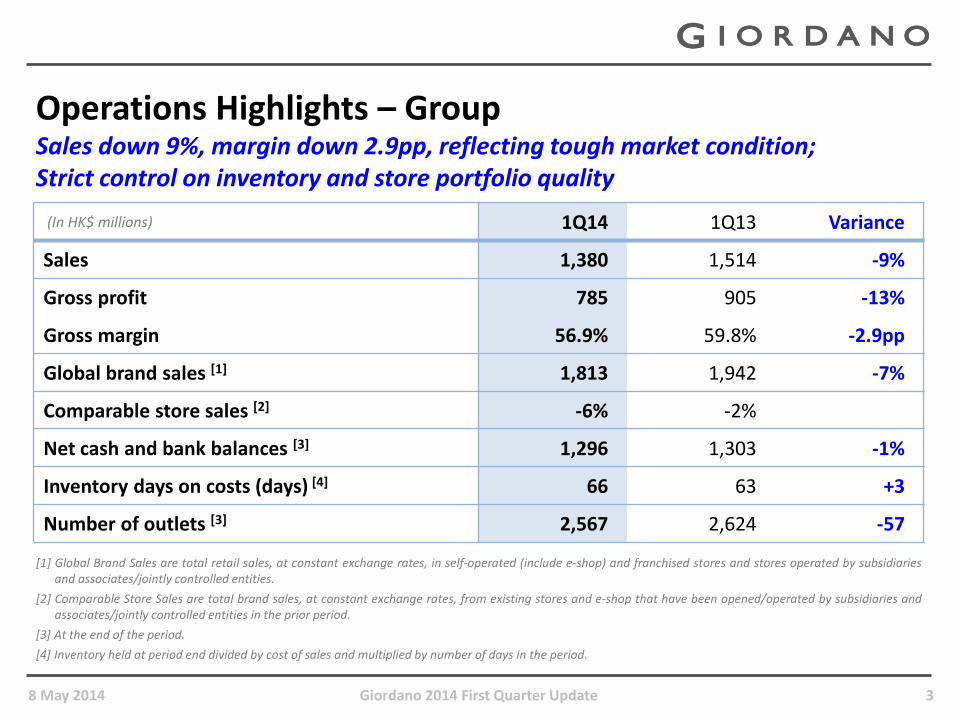
Operations Highlights – Group Sales down 9%, margin down 2.9pp, reflecting tough market condition; Strict control on inventory and store portfolio quality
[1] Global Brand Sales are total retail sales, at constant exchange rates, in self-operated (include e-shop) and franchised stores and stores operated by subsidiaries and associates/jointly controlled entities.
[2] Comparable Store Sales are total brand sales, at constant exchange rates, from existing stores and e-shop that have been opened/operated by subsidiaries and associates/jointly controlled entities in the prior period.
[3] At the end of the period.
[4] Inventory held at period end divided by cost of sales and multiplied by number of days in the period.
(In HK$ millions) 1Q14 1Q13 Variance
Sales 1,380 1,514 -9%
Gross profit 785 905 -13%
Gross margin 56.9% 59.8% -2.9pp
Global brand sales [1] 1,813 1,942 -7%
Comparable store sales [2] -6% -2%
Net cash and bank balances [3] 1,296 1,303 -1%
Inventory days on costs (days) [4] 66 63 +3
Number of outlets [3] 2,567 2,624 -57

8 May 2014 Giordano 2014 First Quarter Update 4
Sales Growth and Contribution by Region Sales continued weakening in Greater China. Weakening currencies and economic headwinds affected sales in SEA. ME delivered 8% growth.
72 (5%) 83 (6%)
144 (9%) 155 (11%)
377 (25%) 320 (23%)
448 (30%) 402 (29%)
473 (31%)
420 (31%)
0
200
400
600
800
1,000
1,200
1,400
1,600
1Q13 1Q14
(HK$ millions)
Mainland China
Hong Kong & Taiwan
Rest of Asia Pacific
Middle East
Wholesale sales to overseas & others
1,514
1,380
Mainland China 11% / 12%*
Hong Kong & Taiwan 10% / 10%*
Rest of Asia Pacific 15% / 6%*
% to group sales in brackets
* Sales growth excludes exchange effects
Wholesale sales to overseas 15%
Middle East 8% / 8%*

8 May 2014 Giordano 2014 First Quarter Update 5
Brand Sales Growth for the last 8 quarters
3%
0%
2%
-1%
-2%
-1%
-3%
-7%
4%
0%
-2%
-1%
-2% -2% -2%
-2%
-6%
5%
-8%
-6%
-4%
-2%
0%
2%
4%
6%
2Q12 3Q12 4Q12 1Q13 2Q13 3Q13 4Q13 1Q14 2QTD14 (upto 4 May)
Total Brand Sales Growth Comparable Store Sales Growth
1Q14 1Q13 Variance
Global brand sales (HK$ millions) 1,813 1,942 -7%
Comparable store sales growth -6% -2%
8 May 2014 Giordano 2014 First Quarter Update 6
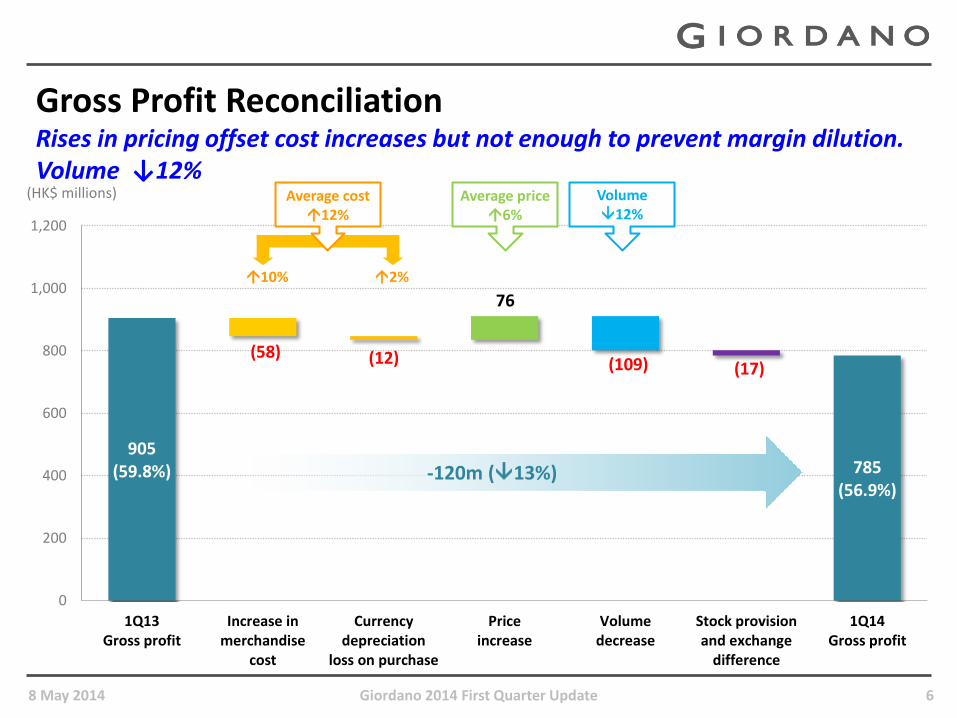
Gross Profit Reconciliation Rises in pricing offset cost increases but not enough to prevent margin dilution. Volume ↓12%
905 (59.8%)
(58) (12) (109) (17)
767
785 (56.9%)
0
200
400
600
800
1,000
1,200
1Q13Gross profit
Increase inmerchandise
cost
Currencydepreciation
loss on purchase
Priceincrease
Volumedecrease
Stock provisionand exchange
difference
1Q14Gross profit
(HK$ millions)
-120m (13%)
10% 2%
Average cost 12%
Average price 6%
Volume 12%
8 May 2014 Giordano 2014 First Quarter Update 7
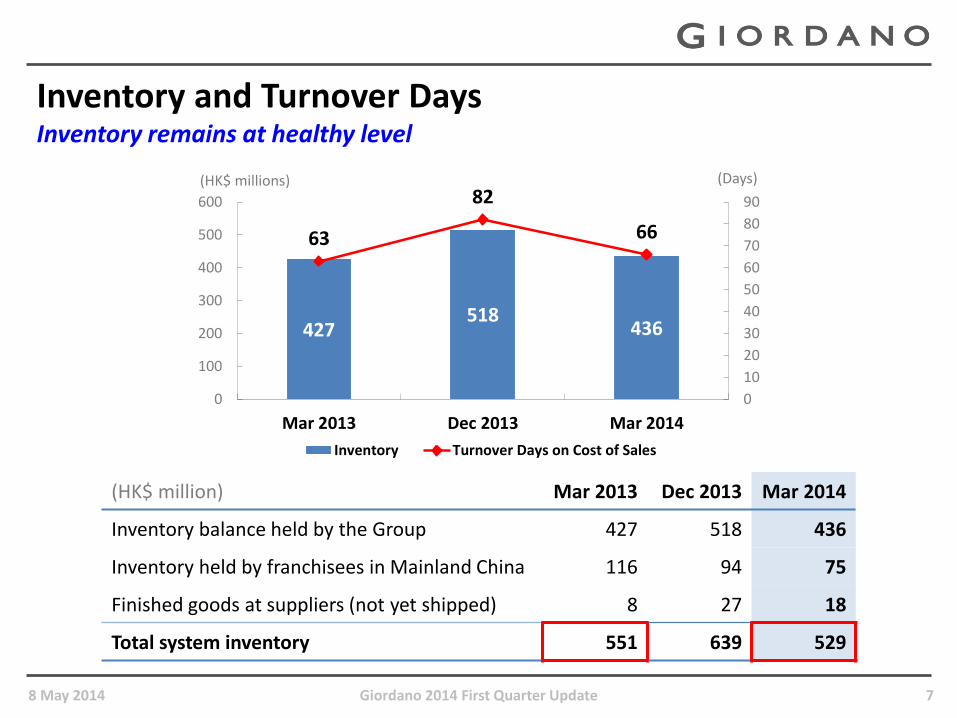
Inventory and Turnover Days Inventory remains at healthy level
427 518
436
63
82
66
0
10
20
30
40
50
60
70
80
90
0
100
200
300
400
500
600
Mar 2013 Dec 2013 Mar 2014
(Days) (HK$ millions)
Inventory Turnover Days on Cost of Sales
(HK$ million) Mar 2013 Dec 2013 Mar 2014
Inventory balance held by the Group 427 518 436
Inventory held by franchisees in Mainland China 116 94 75
Finished goods at suppliers (not yet shipped) 8 27 18
Total system inventory 551 639 529
8 May 2014 Giordano 2014 First Quarter Update 8
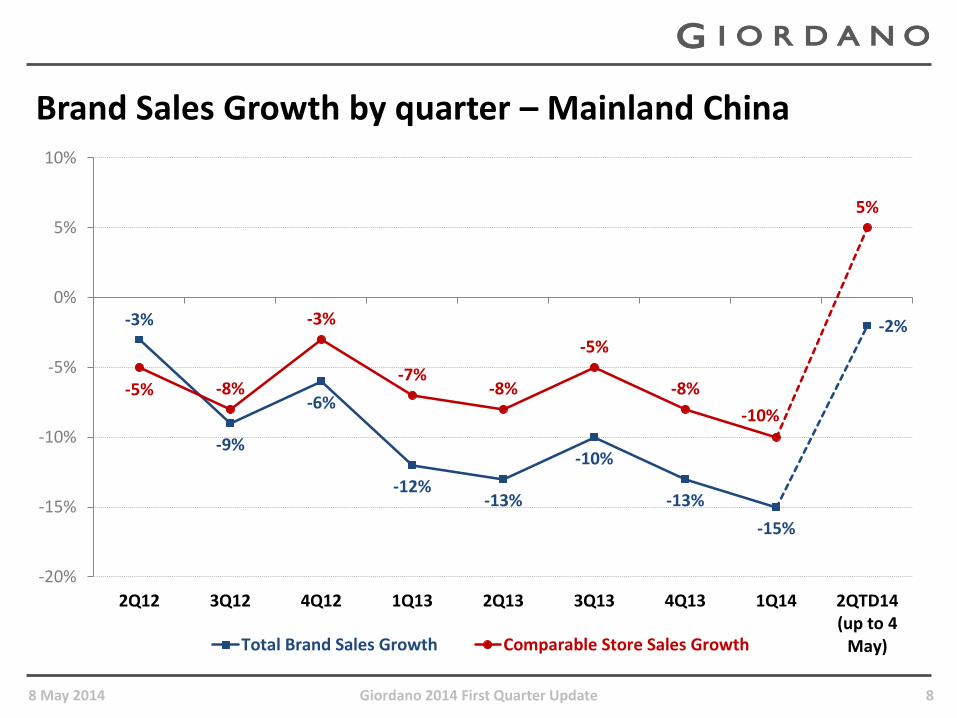
Brand Sales Growth by quarter – Mainland China
-3%
-9%
-6%
-12% -13%
-10%
-13%
-15%
-2%
-5% -8%
-3%
-7% -8%
-5%
-8%
-10%
5%
-20%
-15%
-10%
-5%
0%
5%
10%
2Q12 3Q12 4Q12 1Q13 2Q13 3Q13 4Q13 1Q14 2QTD14(up to 4
May)Total Brand Sales Growth Comparable Store Sales Growth

8 May 2014 Giordano 2014 First Quarter Update 9
Performance Review by Region – Mainland China Negative growth due to closure of shops and weak external demand
[1] Total Sales are total retail sales in self-operated stores and total wholesale sales to franchisees, translated at average exchange rates. [2] Sales Growth excludes exchange effect. [3] Total Brand Sales are total retail sales, at constant exchange rates, in self-operated stores (include e-shop) and franchised stores. [4] Comparable Store Sales are total brand sales, at constant exchange rates, from existing stores and e-shop that have been opened/operated in the prior period. [5] At the end of the period. [6] 12 stores in Hangzhou switched from franchised stores to self-operated stores in 2H13. 1Q13 store number has been restated to include this change in order to
have fairly comparable figures in the two periods.
(In HK$ millions) 1Q14 1Q13 Variance
Total sales [1] 420 473 -11%/-12% [2]
Retail self-operated stores 310 347 -11%
Wholesale sales to franchisees 110 126 -13%
Total brand sales [3] 515 605 -15%
Self-operated stores 310 357 -13%
Franchised stores 205 248 -17%
Comparable store sales [4] -10% -7%
Gross profit 215 258 -17%
Gross margin 51.2% 54.5% -3.3pp
Number of outlets [5] 1,107 1,207 -100
Self-operated stores 513 528 [6] -15
Franchised stores 594 679 [6] -85

8 May 2014 Giordano 2014 First Quarter Update 10
Gross Profit Reconciliation – Mainland China Higher cost product mix offset by heavy discounting to clear excess inventories
258 (54.5%)
(15) (1)
(31)
4
215 (51.2%)
0
50
100
150
200
250
300
1Q13Gross profit
Costincrease
Pricedecrease
Volumedecrease
Stock provisionand exchange
difference
1Q14Gross profit
(HK$ millions)
-43m (17%)
Average cost 8%
Average price 0%
Volume 12%

8 May 2014 Giordano 2014 First Quarter Update 11
Turnaround the business
and enhance the brand position
Right merchandise at right place
Fast marketing
Store portfolio upgrade
AD strategy
2014 Strategies – Mainland China
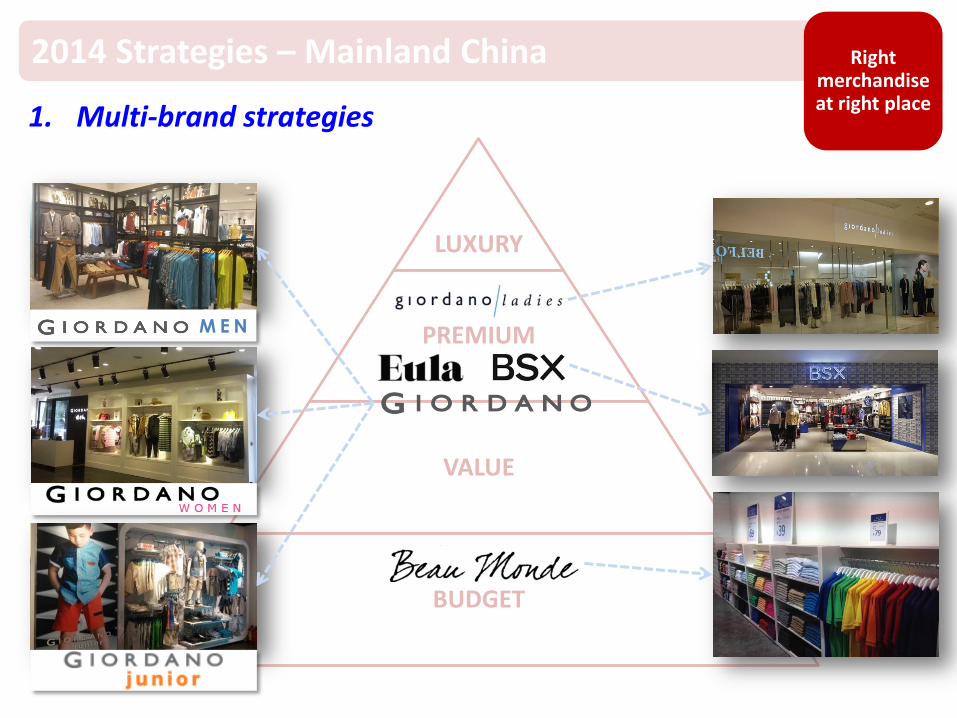
LUXURY
PREMIUM
VALUE
BUDGET
2014 Strategies – Mainland China Right merchandise at right place
1. Multi-brand strategies
M E N

2014 Strategies – Mainland China Right merchandise at right place
2. Channel development
Ch
ann
el D
eve
lop
me
nt
Pri
ori
ty
Street stores • Very poor channel because of high rent very low profitability/ loss making • Will exit loss making stores in FY14 and FY15
Shopping Malls • Supply > Demand low footfall with a proliferation of local brands • High fixed rent • Proceed with caution only open shops in malls anchored by international
brands and offer reasonable rent
E-strategy • Sales grew 15% in FY13, expects more growth in FY14 • Eshop specific merchandise • Collaborate with Alibaba in “online to offline” (O2O) applications (e.g. click and
collect, TigerAnywhere (in-store terminal) x Alipay, store locator system, etc)
Department stores • Main focus for the main brand • On Unisex floor surrounded by local budget brands and sportswear brands low
footfall, poor brand image and positions • Multi-branding
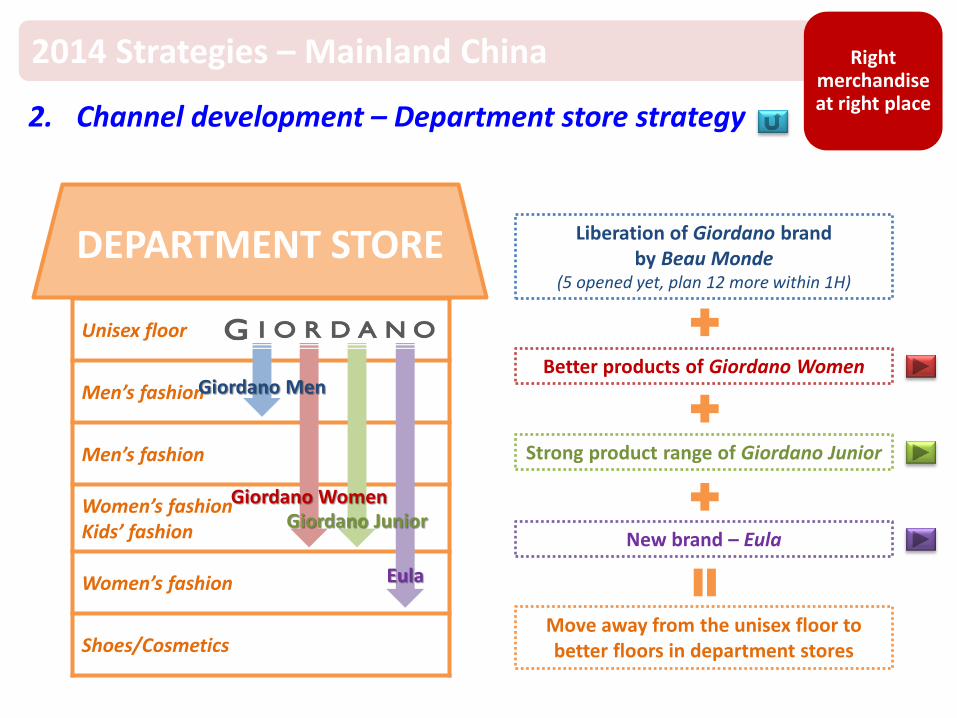
DEPARTMENT STORE
Unisex floor
Men’s fashion
Men’s fashion
Women’s fashion Kids’ fashion
Women’s fashion
Shoes/Cosmetics
2014 Strategies – Mainland China Right merchandise at right place
2. Channel development – Department store strategy
Giordano Men
Eula
Giordano Women Giordano Junior
Liberation of Giordano brand by Beau Monde
(5 opened yet, plan 12 more within 1H)
Better products of Giordano Women
Strong product range of Giordano Junior
New brand – Eula
Move away from the unisex floor to better floors in department stores


Proposition: modern-contemporary, stylish Italian inspired down-to-earth designs in affordable prices
Market positioning:
Target customers: New women of modern metropolis China. New middle class – Generation 2, born after mid-80s, aged 28-35, confident, independent, expressive
Distribution channels: A to B+ grade department stores/shopping malls collocate with international brands
Product category: inspired by Italian art (futurism), lifestyle, fashion and style icons and translated to warm, outgoing, stylish and down-to-earth design all seasons design elements: roses, dots and stripes; warm color (black, red, white, grey)

2014 Strategies – Mainland China Fast
Marketing
1Q14 Fast marketing campaign
Coming fast marketing campaigns…

1. Reduce loss making shops and improve profitability
2. Shop development strategy
2014 Strategies – Mainland China Store portfolio upgrade
• Change to Beau Monde
• Change to outlet
• Loss making Close
Damaging Giordano brand
• More than 50% of our shops
• Increase number of shops
• Renovation upgrade
• Department store strategy
Core locations
• Image stores (Giordano Ladies, BSX) Image stores
Sto
re D
eve
lop
men
t P
rio
rity
Shop classification
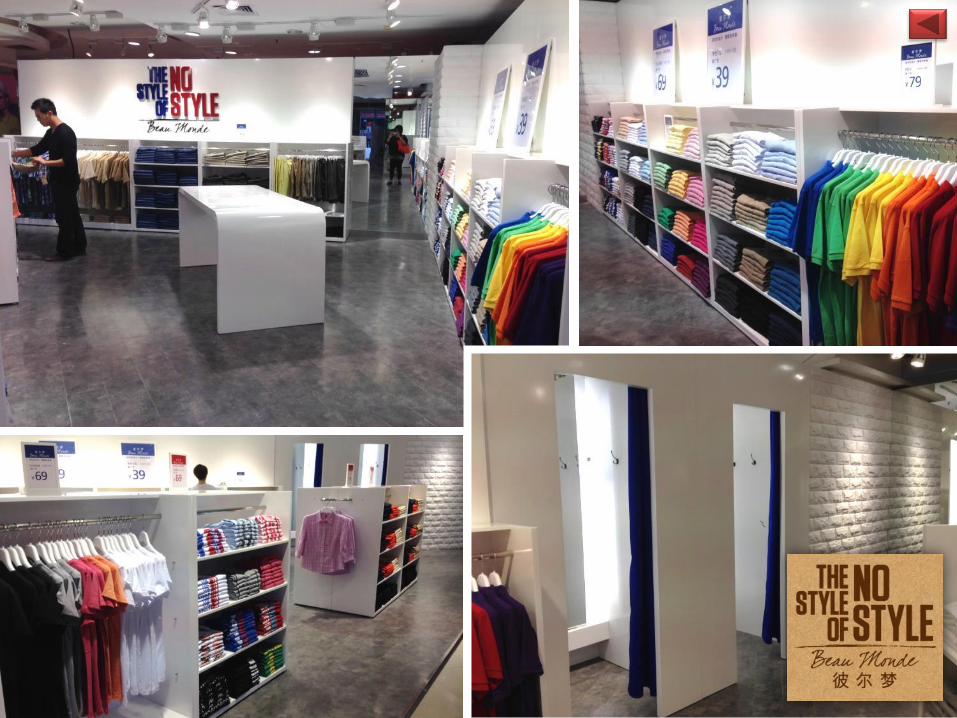
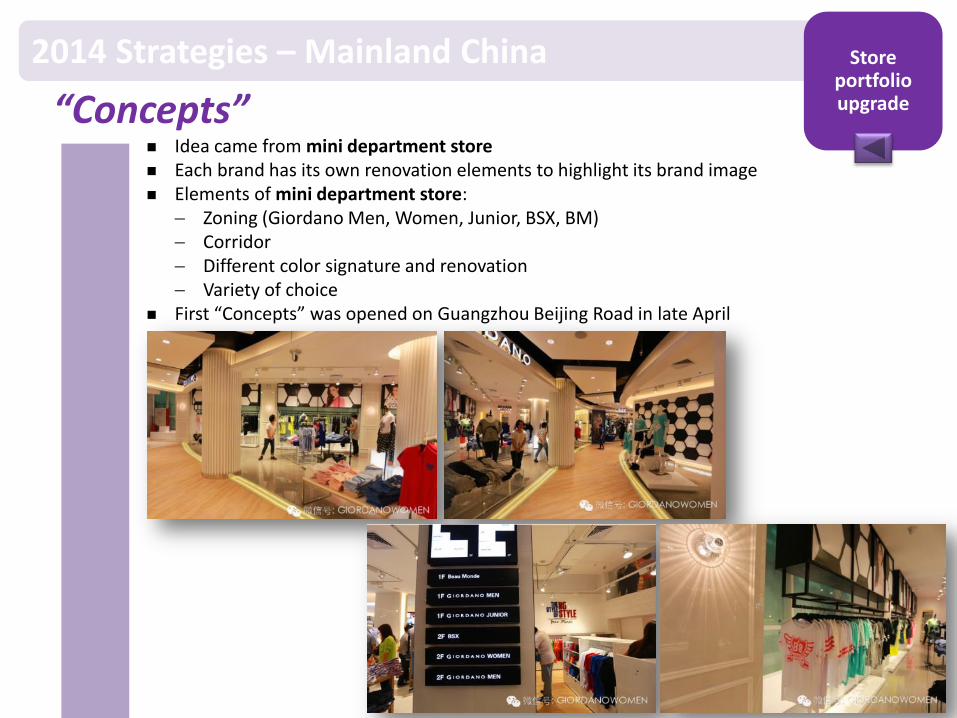
2014 Strategies – Mainland China Store portfolio upgrade “Concepts”
Idea came from mini department store Each brand has its own renovation elements to highlight its brand image Elements of mini department store:
Zoning (Giordano Men, Women, Junior, BSX, BM) Corridor Different color signature and renovation Variety of choice
First “Concepts” was opened on Guangzhou Beijing Road in late April

1. Speed up consolidating ADs
2. Develop super ADs
Be the business partner/consultant of AD
Invest in teams to support merchandizing
Focus on Top 10 ADs (48% of total AD stores)
Redirect subsidies to investment subsidies i.e. marketing and renovation
Support AD gross margin (1Q up 2.5pp)
2014 Strategies – Mainland China AD strategy
8 May 2014 Giordano 2014 First Quarter Update 23
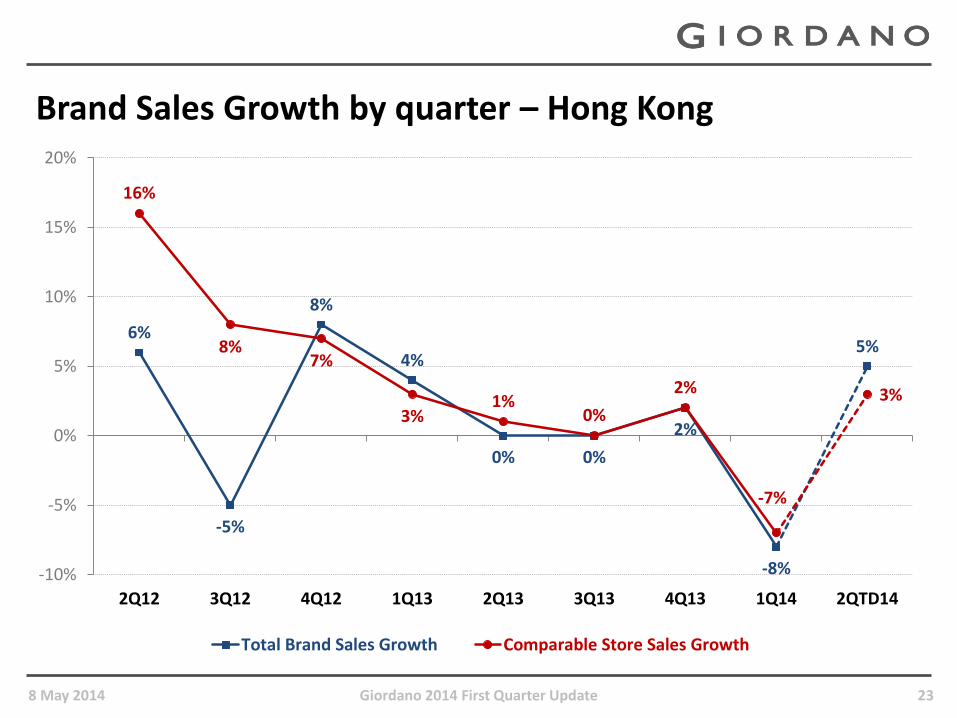
Brand Sales Growth by quarter – Hong Kong
6%
-5%
8%
4%
0% 0%
2%
-8%
5%
16%
8% 7%
3% 1%
0%
2%
-7%
3%
-10%
-5%
0%
5%
10%
15%
20%
2Q12 3Q12 4Q12 1Q13 2Q13 3Q13 4Q13 1Q14 2QTD14
Total Brand Sales Growth Comparable Store Sales Growth

8 May 2014 Giordano 2014 First Quarter Update 24
(In HK$ millions) 1Q14 1Q13 Variance
Total sales [1] 239 261 -8%
Comparable store sales [2] -7% +3%
Gross profit 159 172 -8%
Gross margin 66.5% 65.9% +0.6pp
Number of outlets [3] 84 84
[1] Total Sales are total retail sales translated at average exchange rates.
[2] Comparable Store Sales are total brand sales, at constant exchange rates, from existing stores that have been opened/operated in the prior period.
[3] At the end of the period.
Performance Review by Region – Hong Kong Intense competition and adverse weather in CNY weakening 1Q sales
2014 Strategies – Hong Kong
1. Shop portfolio:
No shop expansion except MTR shops
Extend shop area for Giordano Junior
Open a mini department store in Macau in May
2. Fast marketing:
Continuous fast marketing campaigns
Aberdeen collection by Giordano (“ACBG”) in April
Giordano x Lowe Alpine
8 May 2014 Giordano 2014 First Quarter Update 25


8 May 2014 Giordano 2014 First Quarter Update 28
Brand Sales Growth by quarter – Taiwan
-9% -9%
-12%
-15%
4%
-7%
-3%
-11%
12%
-15% -14%
-16%
-14%
6%
-3%
1%
-10%
15%
-20%
-15%
-10%
-5%
0%
5%
10%
15%
20%
2Q12 3Q12 4Q12 1Q13 2Q13 3Q13 4Q13 1Q14 2QTD14
Total Brand Sales Growth Comparable Store Sales Growth

8 May 2014 Giordano 2014 First Quarter Update 29
(In HK$ millions) 1Q14 1Q13 Variance
Total sales [1] 163 187 -13% / -11% [2]
Comparable store sales [3] -10% -14%
Gross profit 94 114 -18%
Gross margin 57.7% 61.0% -3.3pp
Number of outlets [4] 199 209 -10
[1] Total Sales are total retail sales translated at average exchange rates.
[2] Sales growth excludes exchange effect.
[3] Comparable Store Sales are total brand sales, at constant exchange rates, from existing stores that have been opened/operated in the prior period.
[4] At the end of the period.
Performance Review by Region – Taiwan 1Q sales depressed by weak market conditions but seeing recovery in 2Q after launch of localized products
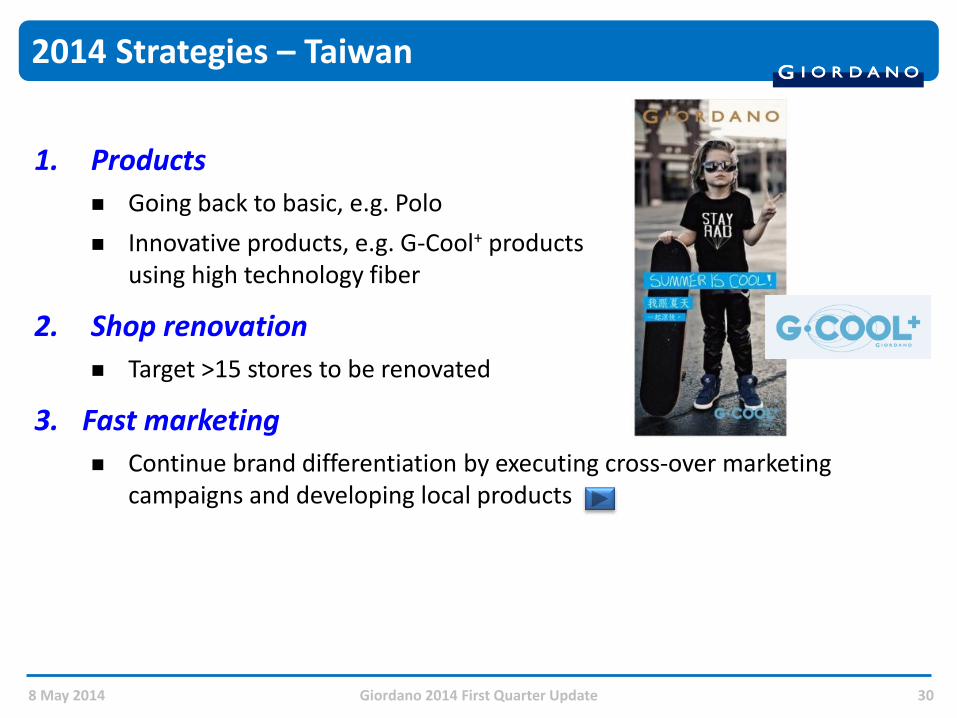
2014 Strategies – Taiwan
1. Products
Going back to basic, e.g. Polo
Innovative products, e.g. G-Cool+ products using high technology fiber
2. Shop renovation
Target >15 stores to be renovated
3. Fast marketing
Continue brand differentiation by executing cross-over marketing campaigns and developing local products
8 May 2014 Giordano 2014 First Quarter Update 30

H E L L OTAIWAN
Related products: Polo
8 May 2014 Giordano 2014 First Quarter Update 32
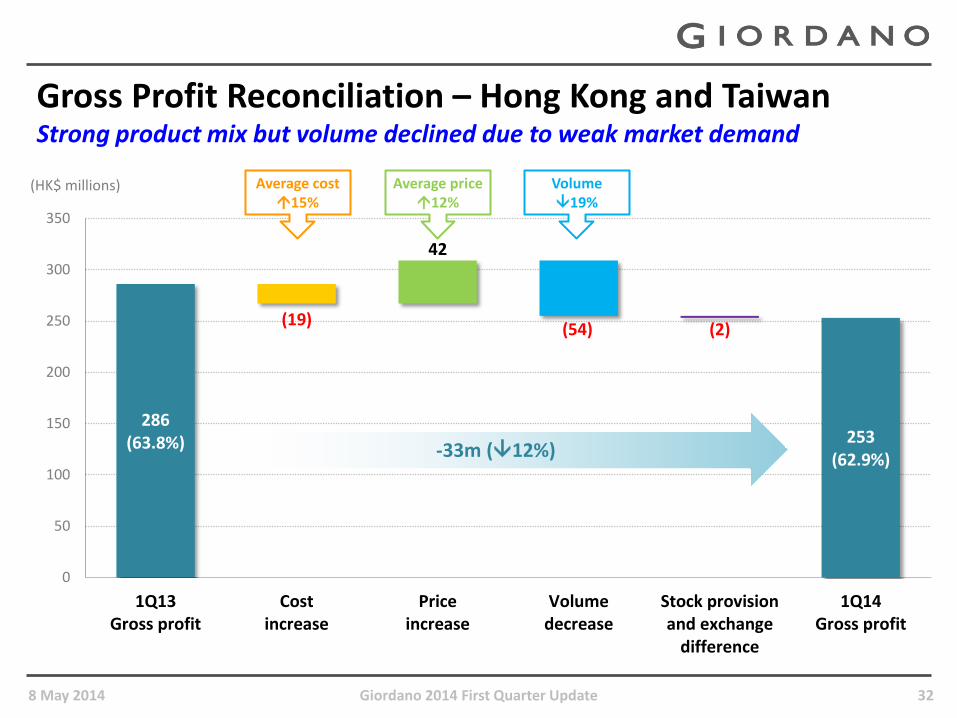
Gross Profit Reconciliation – Hong Kong and Taiwan Strong product mix but volume declined due to weak market demand
286 (63.8%)
(19)
42
(54) (2)
253 (62.9%)
0
50
100
150
200
250
300
350
1Q13Gross profit
Costincrease
Priceincrease
Volumedecrease
Stock provisionand exchange
difference
1Q14Gross profit
(HK$ millions)
-33m (12%)
Average cost 15%
Average price 12%
Volume 19%
8 May 2014 Giordano 2014 First Quarter Update 33
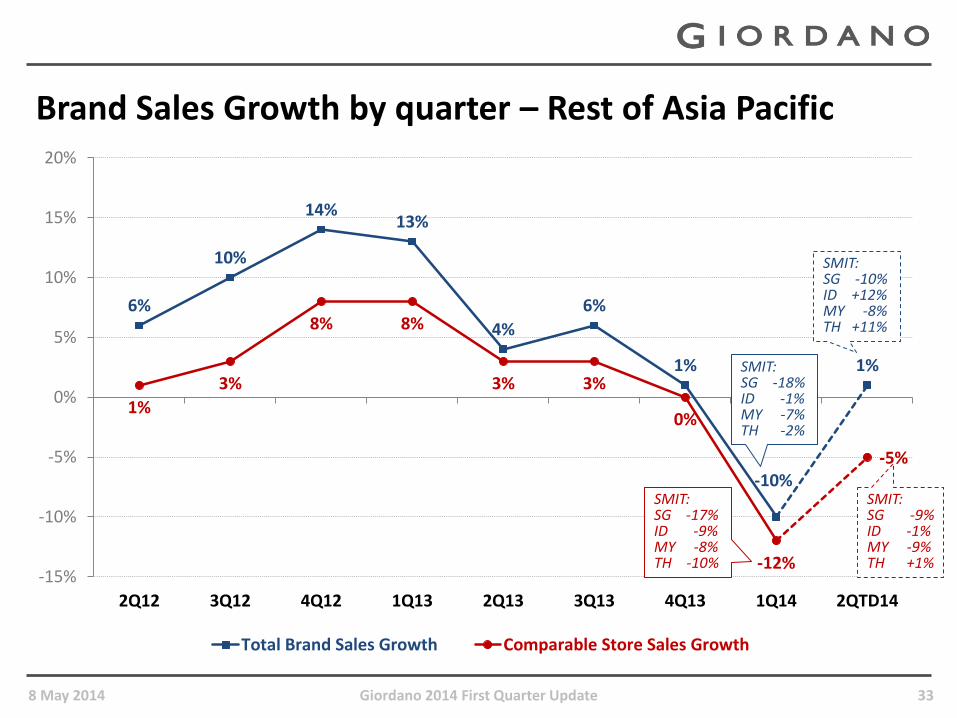
Brand Sales Growth by quarter – Rest of Asia Pacific
6%
10%
14% 13%
4%
6%
1%
-10%
1%
1%
3%
8% 8%
3% 3%
0%
-12%
-5%
-15%
-10%
-5%
0%
5%
10%
15%
20%
2Q12 3Q12 4Q12 1Q13 2Q13 3Q13 4Q13 1Q14 2QTD14
Total Brand Sales Growth Comparable Store Sales Growth
SMIT: SG -18% ID -1% MY -7% TH -2%
SMIT: SG -17% ID -9% MY -8% TH -10%
SMIT: SG -10% ID +12% MY -8% TH +11%
SMIT: SG -9% ID -1% MY -9% TH +1%
8 May 2014 Giordano 2014 First Quarter Update 34
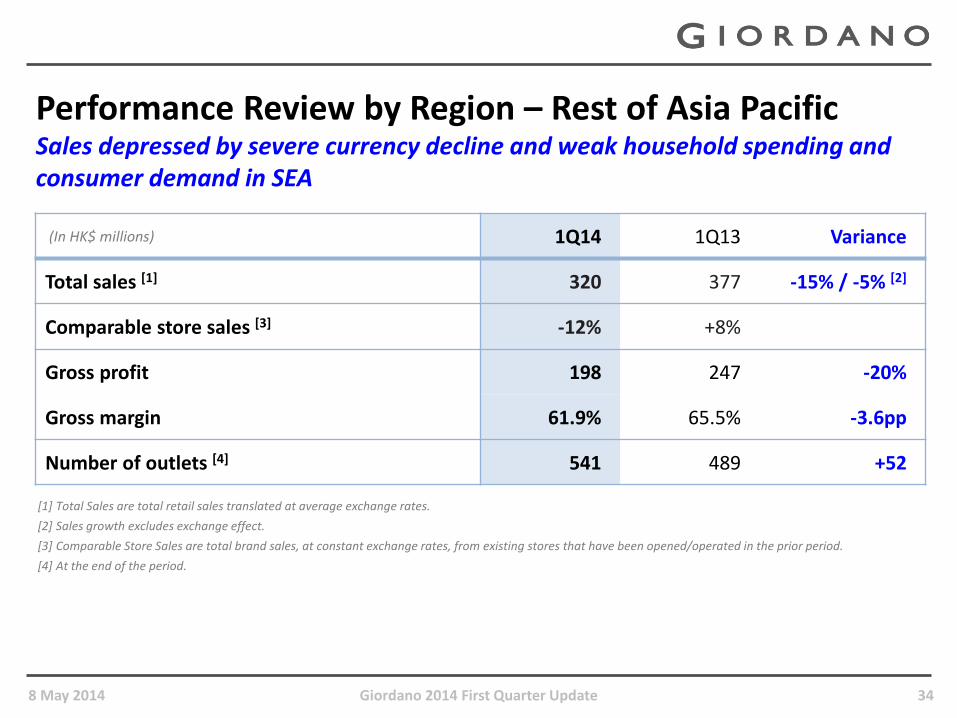
(In HK$ millions) 1Q14 1Q13 Variance
Total sales [1] 320 377 -15% / -5% [2]
Comparable store sales [3] -12% +8%
Gross profit 198 247 -20%
Gross margin 61.9% 65.5% -3.6pp
Number of outlets [4] 541 489 +52
[1] Total Sales are total retail sales translated at average exchange rates.
[2] Sales growth excludes exchange effect.
[3] Comparable Store Sales are total brand sales, at constant exchange rates, from existing stores that have been opened/operated in the prior period.
[4] At the end of the period.
Performance Review by Region – Rest of Asia Pacific Sales depressed by severe currency decline and weak household spending and consumer demand in SEA
8 May 2014 Giordano 2014 First Quarter Update 35
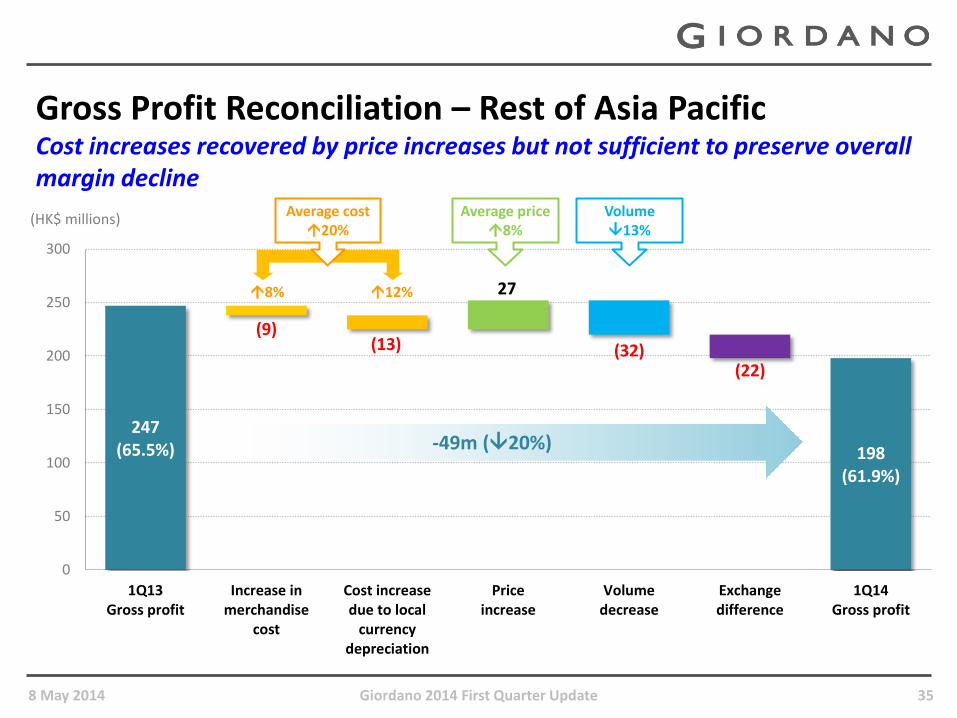
Gross Profit Reconciliation – Rest of Asia Pacific Cost increases recovered by price increases but not sufficient to preserve overall margin decline
247 (65.5%)
(9) (13)
27
(32) (22)
198 (61.9%)
0
50
100
150
200
250
300
1Q13Gross profit
Increase inmerchandise
cost
Cost increasedue to local
currencydepreciation
Priceincrease
Volumedecrease
Exchangedifference
1Q14Gross profit
(HK$ millions)
-49m (20%)
Average price 8%
Volume 13%
8% 12%
Average cost 20%
2014 Strategies – Singapore
8 May 2014 Giordano 2014 First Quarter Update 36
1. A team from the Group is assisting to re-shape Singapore operations
2. Products
Overbought the wrong category in 1Q, now focus on core shirts and shorts
Inventory reduction progress on track
4. Shop renovation
Target 35% of stores to be renovated
3. Fast marketing

2014 Strategies – Indonesia, Malaysia, Thailand
8 May 2014 Giordano 2014 First Quarter Update 37
1. Market slowdown in retail sector in these economies
2. Products Identify merchandise drivers and local fast marketing campaigns to grow
sales
3. Shop expansion Continuous expansion in each country
4. Fast marketing Shared campaigns:
Market-specific campaigns:
Indonesian Young Illustrator
‘HAHAN’
Indonesia Malaysia Thailand
8 May 2014 Giordano 2014 First Quarter Update 38
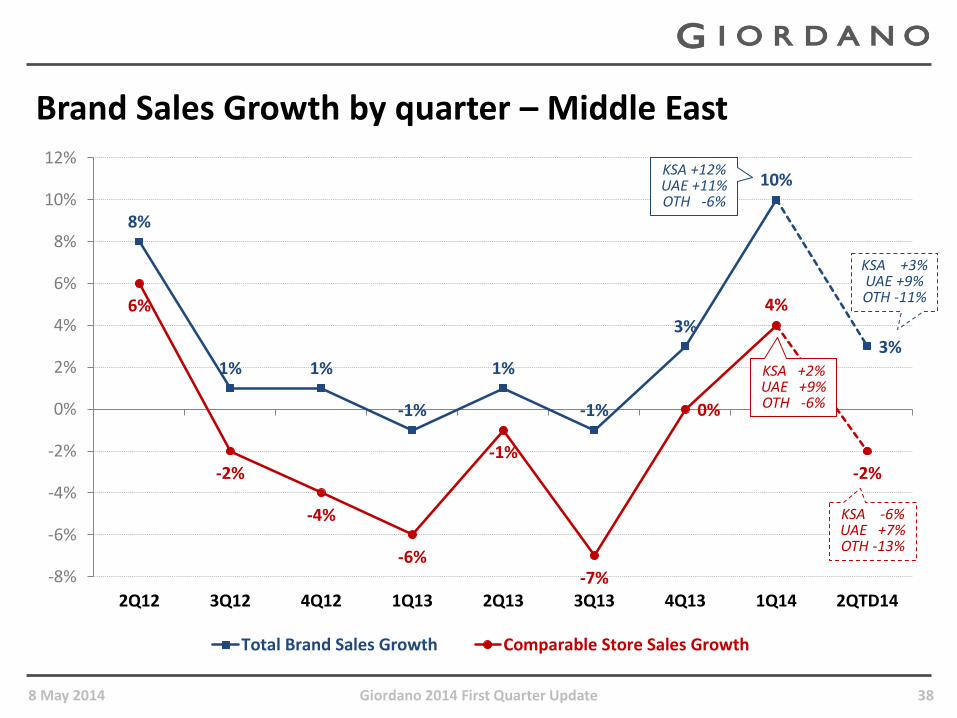
Brand Sales Growth by quarter – Middle East
8%
1% 1%
-1%
1%
-1%
3%
10%
3%
6%
-2%
-4%
-6%
-1%
-7%
0%
4%
-2%
-8%
-6%
-4%
-2%
0%
2%
4%
6%
8%
10%
12%
2Q12 3Q12 4Q12 1Q13 2Q13 3Q13 4Q13 1Q14 2QTD14
Total Brand Sales Growth Comparable Store Sales Growth
KSA +12% UAE +11% OTH -6%
KSA +2% UAE +9% OTH -6%
KSA +3% UAE +9% OTH -11%
KSA -6% UAE +7% OTH -13%
8 May 2014 Giordano 2014 First Quarter Update 39
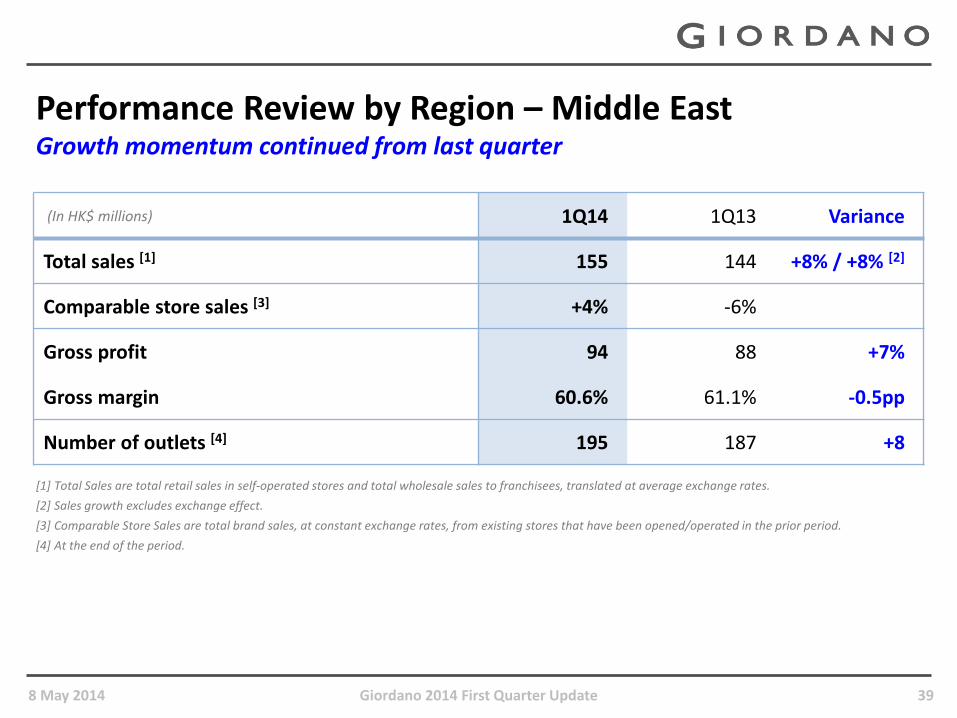
Performance Review by Region – Middle East Growth momentum continued from last quarter
[1] Total Sales are total retail sales in self-operated stores and total wholesale sales to franchisees, translated at average exchange rates.
[2] Sales growth excludes exchange effect.
[3] Comparable Store Sales are total brand sales, at constant exchange rates, from existing stores that have been opened/operated in the prior period.
[4] At the end of the period.
(In HK$ millions) 1Q14 1Q13 Variance
Total sales [1] 155 144 +8% / +8% [2]
Comparable store sales [3] +4% -6%
Gross profit 94 88 +7%
Gross margin 60.6% 61.1% -0.5pp
Number of outlets [4] 195 187 +8
8 May 2014 Giordano 2014 First Quarter Update 40
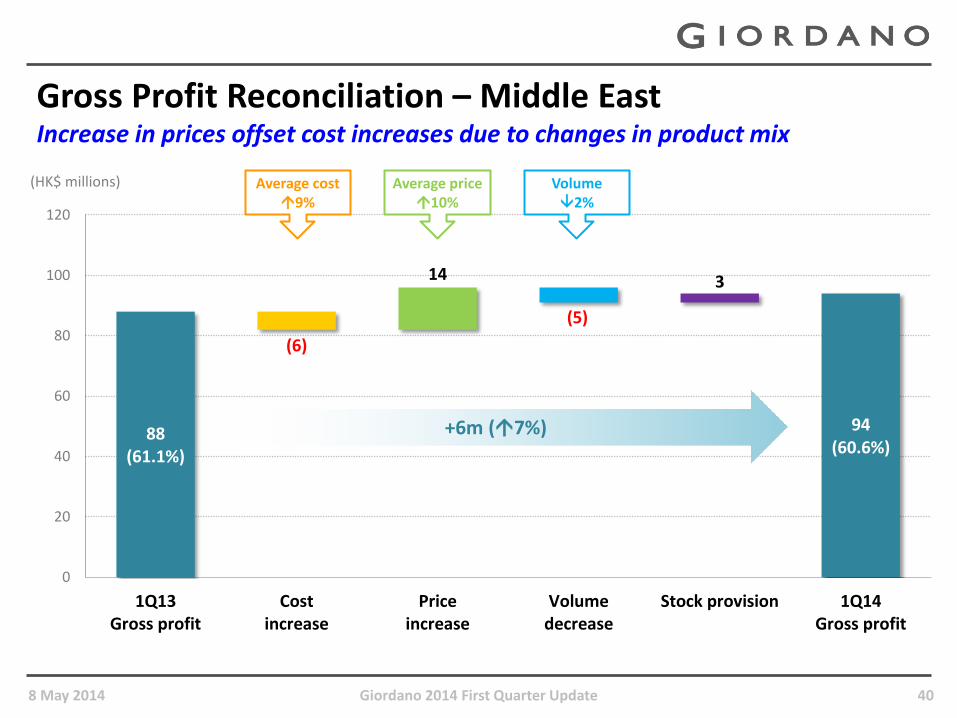
Gross Profit Reconciliation – Middle East Increase in prices offset cost increases due to changes in product mix
88 (61.1%)
(6)
14
(5)
3
94 (60.6%)
0
20
40
60
80
100
120
1Q13Gross profit
Costincrease
Priceincrease
Volumedecrease
Stock provision 1Q14Gross profit
(HK$ millions)
+6m (7%)
Average cost 9%
Average price 10%
Volume 2%

2014 Strategies – Middle East
1. Shop expansion
Target 5% increase in store number mainly in UAE and Saudi Arabia
2. More Engagement with social media
Planned PR exercise: media round table
Much aggressive focus on digital and social media
Radio and press advertisement to promote new lion polo and country polo

8 May 2014 Giordano 2014 First Quarter Update 42
(In HK$ millions) 1Q14 1Q13 Variance
Total sales [1] 396 369 +7% / +5% [2]
Comparable store sales [3] +4% +4%
Gross profit 214 209 +2%
Gross margin 54.0% 56.6% -2.6pp
Number of outlets [4] 236 260 -24
Jointly Controlled Company – South Korea
[1] Total Sales are total retail sales translated at average exchange rates.
[2] Sales growth excludes exchange effect.
[3] Comparable Store Sales are total brand sales, at constant exchange rates, from existing stores that have been opened/operated in the prior period.
[4] At the end of the period.
8 May 2014 Giordano 2014 First Quarter Update 43
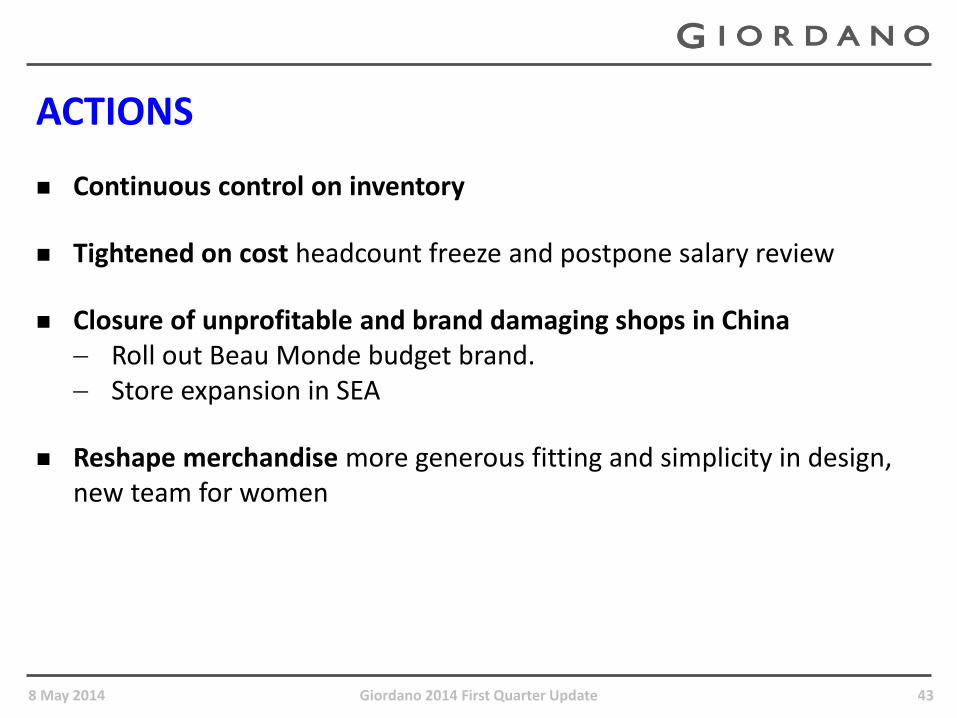
ACTIONS
Continuous control on inventory
Tightened on cost headcount freeze and postpone salary review
Closure of unprofitable and brand damaging shops in China Roll out Beau Monde budget brand. Store expansion in SEA
Reshape merchandise more generous fitting and simplicity in design, new team for women
8 May 2014 Giordano 2014 First Quarter Update 44
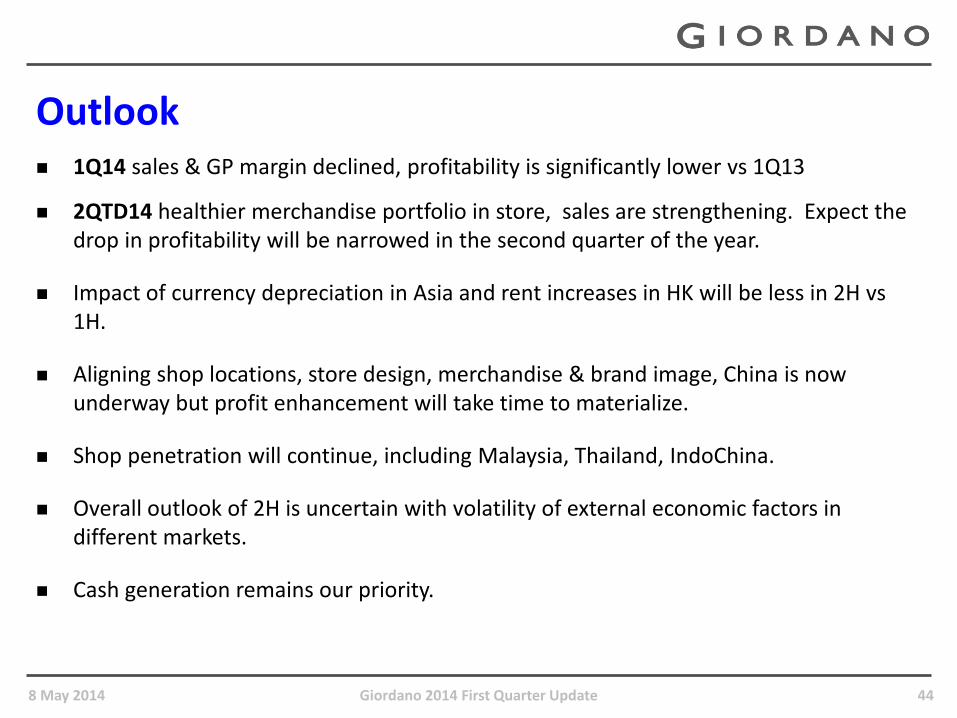
Outlook 1Q14 sales & GP margin declined, profitability is significantly lower vs 1Q13
2QTD14 healthier merchandise portfolio in store, sales are strengthening. Expect the drop in profitability will be narrowed in the second quarter of the year.
Impact of currency depreciation in Asia and rent increases in HK will be less in 2H vs 1H.
Aligning shop locations, store design, merchandise & brand image, China is now underway but profit enhancement will take time to materialize.
Shop penetration will continue, including Malaysia, Thailand, IndoChina.
Overall outlook of 2H is uncertain with volatility of external economic factors in different markets.
Cash generation remains our priority.
Q&A
8 May 2014 Giordano 2014 First Quarter Update 45

8 May 2014 Giordano 2014 First Quarter Update 46
Total sales[1] Comparable store sales[2]
(HK$ millions) 1Q14 1Q13 Variance 1Q14 1Q13
Mainland China 420 473 -11% -10% -7%
Hong Kong 239 261 -8% -7% +3%
Taiwan 163 187 -13% -10% -14%
Singapore 85 106 -20% -17% -1%
Indonesia 96 103 -7% -9% +21%
Malaysia 58 65 -11% -8% +6%
Thailand 51 57 -11% -10% +22%
Australia 25 39 -36% -20% -6%
India 5 7 -29% Flat +19%
UAE 62 55 +13% +9% -10%
Saudi Arabia 79 71 +11% +2% -4%
Other Middle East regions 14 18 -22% -6% -2%
Retail & Distribution total 1,297 1,442 -10% -9% -3%
Wholesale sales to overseas franchisees 83 72 +15% +3% +4%
Group total 1,380 1,514 -9% -6% -2%
[1] Total Sales are total retail sales in self-operated stores and total wholesale sales to franchisees, translated at average exchange rates.
[2] Comparable Store Sales are total brand sales, at constant exchange rates, from existing stores and e-shop that have been opened/operated in the prior period.
Summary of Total Sales and Comparable Store Sales Growth by Market
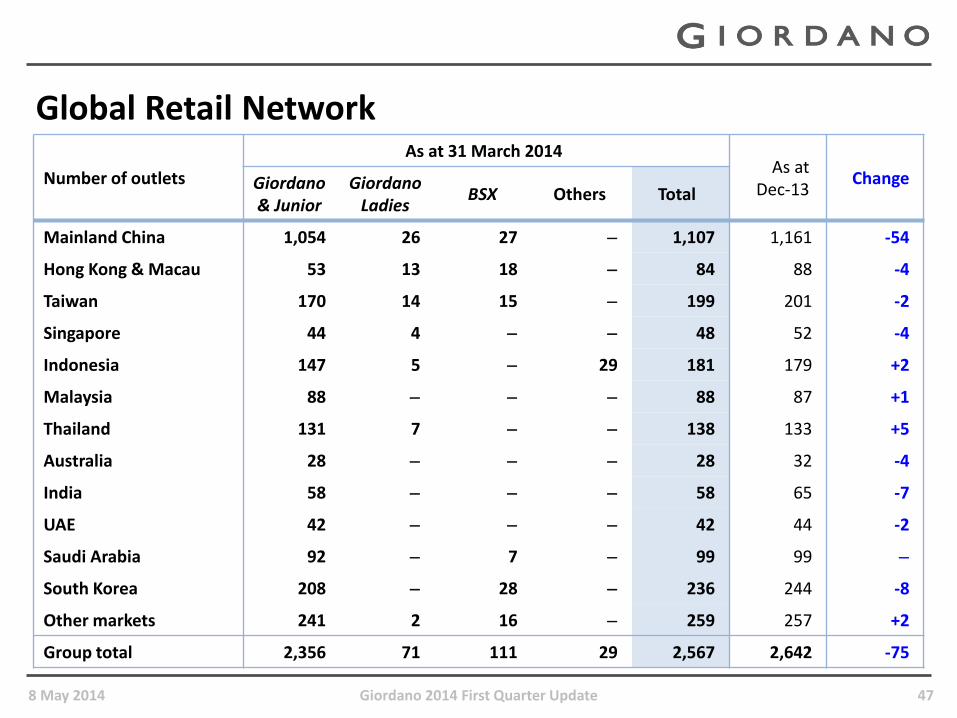
8 May 2014 Giordano 2014 First Quarter Update 47
Number of outlets
As at 31 March 2014 As at
Dec-13 Change Giordano
& Junior Giordano
Ladies BSX Others Total
Mainland China 1,054 26 27 1,107 1,161 -54
Hong Kong & Macau 53 13 18 84 88 -4
Taiwan 170 14 15 199 201 -2
Singapore 44 4 48 52 -4
Indonesia 147 5 29 181 179 +2
Malaysia 88 88 87 +1
Thailand 131 7 138 133 +5
Australia 28 28 32 -4
India 58 58 65 -7
UAE 42 42 44 -2
Saudi Arabia 92 7 99 99
South Korea 208 28 236 244 -8
Other markets 241 2 16 259 257 +2
Group total 2,356 71 111 29 2,567 2,642 -75
Global Retail Network