2014 financial statement ferguson version 2...national kennedy center american college theater...
TRANSCRIPT
FINANCIAL REPORT Year Ended June 30, 2014

Front Cover: Shafer Tower

ii
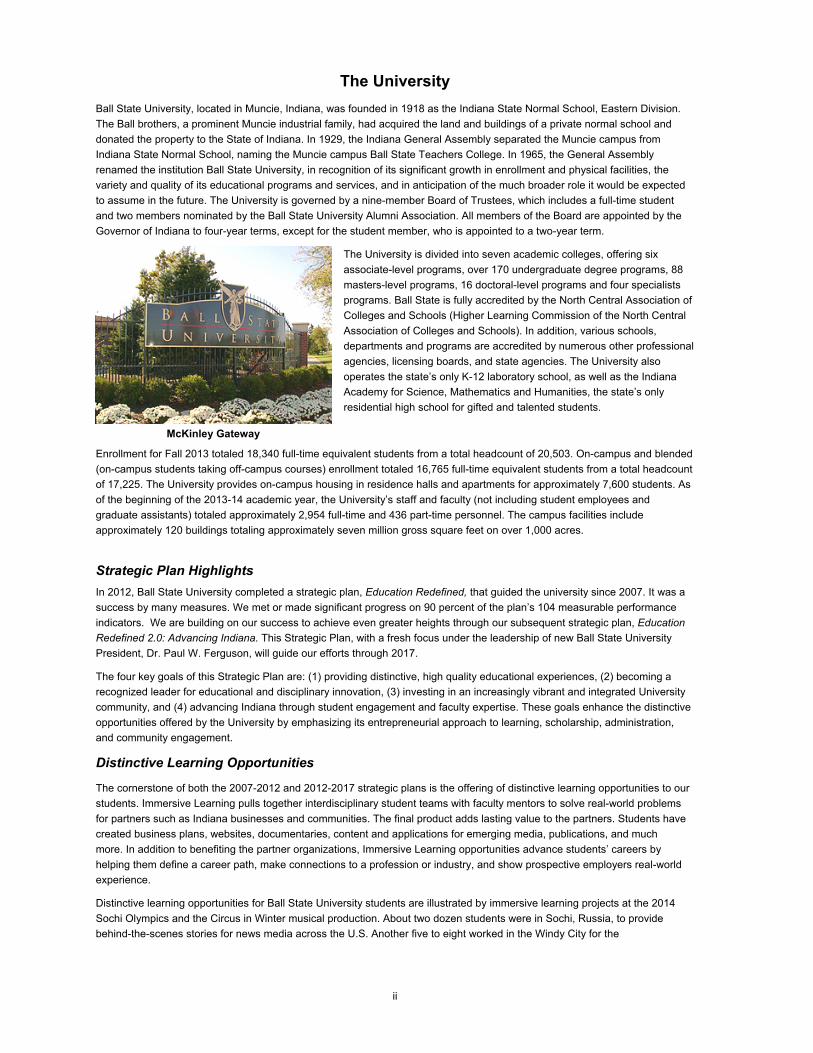
McKinley Gateway
The University
Ball State University, located in Muncie, Indiana, was founded in 1918 as the Indiana State Normal School, Eastern Division.
The Ball brothers, a prominent Muncie industrial family, had acquired the land and buildings of a private normal school and
donated the property to the State of Indiana. In 1929, the Indiana General Assembly separated the Muncie campus from
Indiana State Normal School, naming the Muncie campus Ball State Teachers College. In 1965, the General Assembly
renamed the institution Ball State University, in recognition of its significant growth in enrollment and physical facilities, the
variety and quality of its educational programs and services, and in anticipation of the much broader role it would be expected
to assume in the future. The University is governed by a nine-member Board of Trustees, which includes a full-time student
and two members nominated by the Ball State University Alumni Association. All members of the Board are appointed by the
Governor of Indiana to four-year terms, except for the student member, who is appointed to a two-year term.
The University is divided into seven academic colleges, offering six
associate-level programs, over 170 undergraduate degree programs, 88
masters-level programs, 16 doctoral-level programs and four specialists
programs. Ball State is fully accredited by the North Central Association of
Colleges and Schools (Higher Learning Commission of the North Central
Association of Colleges and Schools). In addition, various schools,
departments and programs are accredited by numerous other professional
agencies, licensing boards, and state agencies. The University also
operates the state’s only K-12 laboratory school, as well as the Indiana
Academy for Science, Mathematics and Humanities, the state’s only
residential high school for gifted and talented students.
Enrollment for Fall 2013 totaled 18,340 full-time equivalent students from a total headcount of 20,503. On-campus and blended
(on-campus students taking off-campus courses) enrollment totaled 16,765 full-time equivalent students from a total headcount
of 17,225. The University provides on-campus housing in residence halls and apartments for approximately 7,600 students. As
of the beginning of the 2013-14 academic year, the University’s staff and faculty (not including student employees and
graduate assistants) totaled approximately 2,954 full-time and 436 part-time personnel. The campus facilities include
approximately 120 buildings totaling approximately seven million gross square feet on over 1,000 acres.
Strategic Plan Highlights
In 2012, Ball State University completed a strategic plan, Education Redefined, that guided the university since 2007. It was a
success by many measures. We met or made significant progress on 90 percent of the plan’s 104 measurable performance
indicators. We are building on our success to achieve even greater heights through our subsequent strategic plan, Education
Redefined 2.0: Advancing Indiana. This Strategic Plan, with a fresh focus under the leadership of new Ball State University
President, Dr. Paul W. Ferguson, will guide our efforts through 2017.
The four key goals of this Strategic Plan are: (1) providing distinctive, high quality educational experiences, (2) becoming a
recognized leader for educational and disciplinary innovation, (3) investing in an increasingly vibrant and integrated University
community, and (4) advancing Indiana through student engagement and faculty expertise. These goals enhance the distinctive
opportunities offered by the University by emphasizing its entrepreneurial approach to learning, scholarship, administration,
and community engagement.
Distinctive Learning Opportunities
The cornerstone of both the 2007-2012 and 2012-2017 strategic plans is the offering of distinctive learning opportunities to our
students. Immersive Learning pulls together interdisciplinary student teams with faculty mentors to solve real-world problems
for partners such as Indiana businesses and communities. The final product adds lasting value to the partners. Students have
created business plans, websites, documentaries, content and applications for emerging media, publications, and much
more. In addition to benefiting the partner organizations, Immersive Learning opportunities advance students’ careers by
helping them define a career path, make connections to a profession or industry, and show prospective employers real-world
experience.
Distinctive learning opportunities for Ball State University students are illustrated by immersive learning projects at the 2014
Sochi Olympics and the Circus in Winter musical production. About two dozen students were in Sochi, Russia, to provide
behind-the-scenes stories for news media across the U.S. Another five to eight worked in the Windy City for the
iii
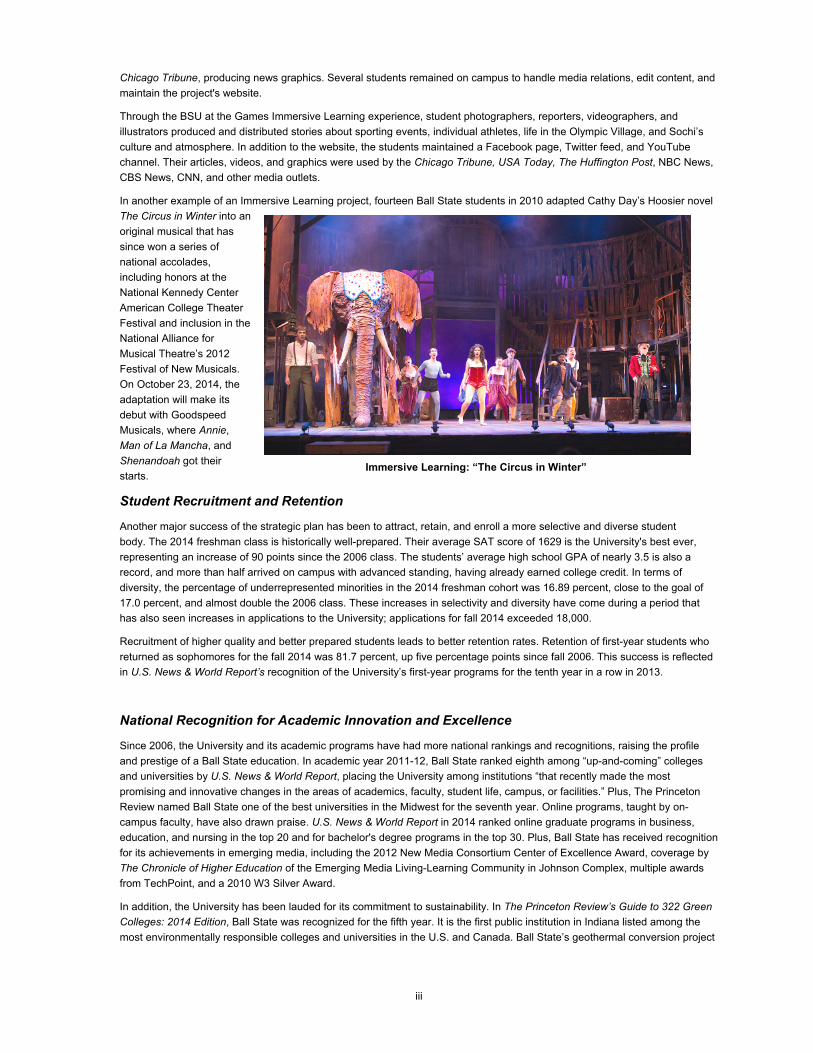
Immersive Learning: “The Circus in Winter”
Chicago Tribune, producing news graphics. Several students remained on campus to handle media relations, edit content, and
maintain the project's website.
Through the BSU at the Games Immersive Learning experience, student photographers, reporters, videographers, and
illustrators produced and distributed stories about sporting events, individual athletes, life in the Olympic Village, and Sochi’s
culture and atmosphere. In addition to the website, the students maintained a Facebook page, Twitter feed, and YouTube
channel. Their articles, videos, and graphics were used by the Chicago Tribune, USA Today, The Huffington Post, NBC News,
CBS News, CNN, and other media outlets.
In another example of an Immersive Learning project, fourteen Ball State students in 2010 adapted Cathy Day’s Hoosier novel
The Circus in Winter into an
original musical that has
since won a series of
national accolades,
including honors at the
National Kennedy Center
American College Theater
Festival and inclusion in the
National Alliance for
Musical Theatre’s 2012
Festival of New Musicals.
On October 23, 2014, the
adaptation will make its
debut with Goodspeed
Musicals, where Annie,
Man of La Mancha, and
Shenandoah got their
starts.
Student Recruitment and Retention
Another major success of the strategic plan has been to attract, retain, and enroll a more selective and diverse student
body. The 2014 freshman class is historically well-prepared. Their average SAT score of 1629 is the University's best ever,
representing an increase of 90 points since the 2006 class. The students’ average high school GPA of nearly 3.5 is also a
record, and more than half arrived on campus with advanced standing, having already earned college credit. In terms of
diversity, the percentage of underrepresented minorities in the 2014 freshman cohort was 16.89 percent, close to the goal of
17.0 percent, and almost double the 2006 class. These increases in selectivity and diversity have come during a period that
has also seen increases in applications to the University; applications for fall 2014 exceeded 18,000.
Recruitment of higher quality and better prepared students leads to better retention rates. Retention of first-year students who
returned as sophomores for the fall 2014 was 81.7 percent, up five percentage points since fall 2006. This success is reflected
in U.S. News & World Report’s recognition of the University’s first-year programs for the tenth year in a row in 2013.
National Recognition for Academic Innovation and Excellence
Since 2006, the University and its academic programs have had more national rankings and recognitions, raising the profile
and prestige of a Ball State education. In academic year 2011-12, Ball State ranked eighth among “up-and-coming” colleges
and universities by U.S. News & World Report, placing the University among institutions “that recently made the most
promising and innovative changes in the areas of academics, faculty, student life, campus, or facilities.” Plus, The Princeton
Review named Ball State one of the best universities in the Midwest for the seventh year. Online programs, taught by on-
campus faculty, have also drawn praise. U.S. News & World Report in 2014 ranked online graduate programs in business,
education, and nursing in the top 20 and for bachelor's degree programs in the top 30. Plus, Ball State has received recognition
for its achievements in emerging media, including the 2012 New Media Consortium Center of Excellence Award, coverage by
The Chronicle of Higher Education of the Emerging Media Living-Learning Community in Johnson Complex, multiple awards
from TechPoint, and a 2010 W3 Silver Award.
In addition, the University has been lauded for its commitment to sustainability. In The Princeton Review’s Guide to 322 Green
Colleges: 2014 Edition, Ball State was recognized for the fifth year. It is the first public institution in Indiana listed among the
most environmentally responsible colleges and universities in the U.S. and Canada. Ball State’s geothermal conversion project
iv
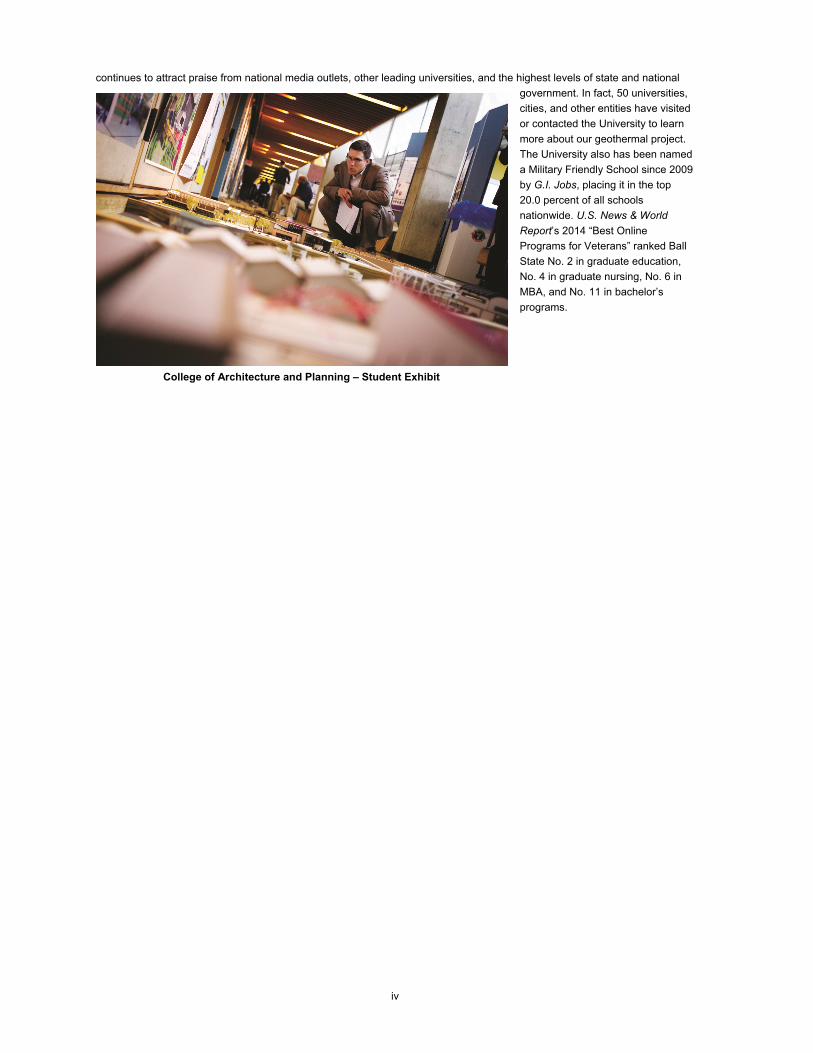
College of Architecture and Planning – Student Exhibit
continues to attract praise from national media outlets, other leading universities, and the highest levels of state and national
government. In fact, 50 universities,
cities, and other entities have visited
or contacted the University to learn
more about our geothermal project.
The University also has been named
a Military Friendly School since 2009
by G.I. Jobs, placing it in the top
20.0 percent of all schools
nationwide. U.S. News & World
Report’s 2014 “Best Online
Programs for Veterans” ranked Ball
State No. 2 in graduate education,
No. 4 in graduate nursing, No. 6 in
MBA, and No. 11 in bachelor’s
programs.

v
This page intentionally left blank
vi
This financial report has been prepared
by the Office of University Controller
Ball State University, Muncie, Indiana 47306
Ball State University provides equal opportunity to all students and applicants for admission in its education programs,
activities, and facilities without regard to race, religion, color, sex (except where sex is a bona fide qualification),
sexual orientation, gender identity/gender expression, physical or mental disability, national origin, ancestry, or age.
Ball State University provides equal opportunity to all employees and applicants for employment in its recruitment,
hiring, retention, promotion, tenure, transfer, layoff, return from layoff, training, and other employment decisions and in
its compensation and benefits programs without regard to race, religion, color, sex (except where sex is a bona fide
occupational qualification), sexual orientation, gender identity/gender expression, physical or mental disability, national
origin, ancestry, age, or citizenship (for U. S. citizens and protected lawfully-admitted aliens).
The University also takes affirmative action to employ and advance minorities, women, qualified disabled persons, and
qualified disabled veterans and veterans of the Vietnam era. Information concerning the University's affirmative action
programs can be obtained from the Office of University Compliance, Ball State University, Muncie, IN 47306.
Each line administrator is responsible for ensuring that educational and employment decisions are made and
implemented in accordance with the University's equal opportunity and affirmative action policy. All persons involved
in the decision-making process, including members of faculty and other employee committees, shall act in a
nondiscriminatory manner. The Office of University Compliance is responsible for developing, coordinating, and
implementing policies and procedures for institutional compliance with all applicable federal and state equal
opportunity laws and regulations and for preparing and monitoring compliance with required affirmative action
programs.
Complaints regarding unlawful discrimination should be filed within 45 calendar days following the alleged act or
incident giving rise to the complaint in the Office of University Compliance in accordance with the Ball State University
Equal Opportunity and Affirmative Action Complaint Investigation Procedure and Appeal Process. A copy of this
document may be obtained by contacting the Office of University Compliance.
The President will review the University's equal opportunity and affirmative action policy and programs at least once
each year, measure progress against the objectives stated in the affirmative action programs, and report findings and
conclusions to the Board of Trustees.
vii
Ball State University
2013-2014
Thomas C. Bracken, Muncie, IN
E. Renae Conley, New Palatine, IL
(appointed March 3, 2014)
R. Wayne Estopinal, Jeffersonville, IN
Marianne Glick, Indianapolis, IN
Frank Hancock, Indianapolis, IN
Richard Hall, Carmel, IN
Hollis E. Hughes Jr., South Bend, IN
Matthew Momper, Fort Wayne, IN
Barbara Phillips, Carmel, IN
(completed term December 31, 2013)
Kyle E. Pierce, Fishers, IN
Officers
Hollis E. Hughes Jr. ………………………….………(completed term December 31, 2013) President
Richard Hall …………………………………….……………….……..(elected January 10, 2014) Chair*
Frank Hancock …………………………………………….………………………………..Vice President
Frank Hancock………………………………..…….…..…..(title change January 10, 2014) Vice Chair*
Thomas C. Bracken………………………………………..……..(elected January 10, 2014) Secretary
Barbara Phillips…………………….….….(completed term December 31, 2013) Assistant Secretary
Marianne Glick………………………...………………(elected January 10, 2014) Assistant Secretary
Randall B. Howard …………………………………………………………………………....…Treasurer
* With passage of new bylaws, the titles of president and vice president were replaced with the titles of chair and vice chair
University President
Jo Ann M. Gora
(retired June 30, 2014)
viii

ix

x
This page intentionally left blank
1
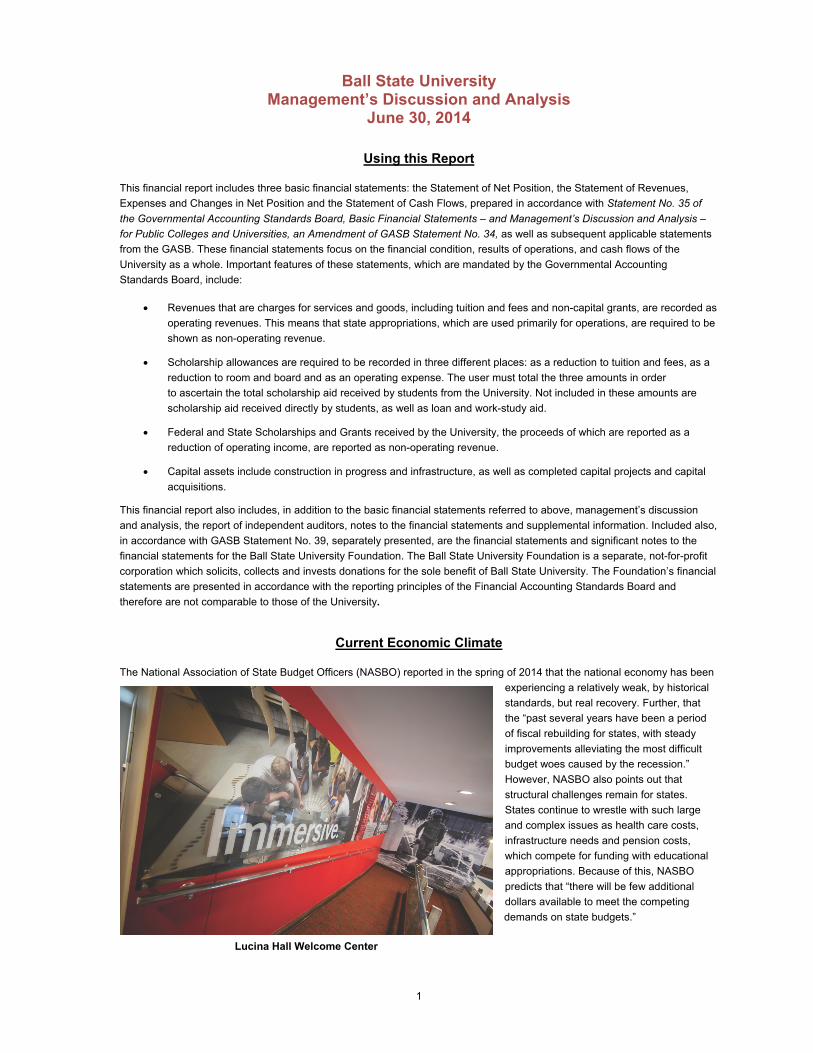
Lucina Hall Welcome Center
Ball State University Management’s Discussion and Analysis
June 30, 2014
Using this Report
This financial report includes three basic financial statements: the Statement of Net Position, the Statement of Revenues,
Expenses and Changes in Net Position and the Statement of Cash Flows, prepared in accordance with Statement No. 35 of
the Governmental Accounting Standards Board, Basic Financial Statements – and Management’s Discussion and Analysis –
for Public Colleges and Universities, an Amendment of GASB Statement No. 34, as well as subsequent applicable statements
from the GASB. These financial statements focus on the financial condition, results of operations, and cash flows of the
University as a whole. Important features of these statements, which are mandated by the Governmental Accounting
Standards Board, include:
Revenues that are charges for services and goods, including tuition and fees and non-capital grants, are recorded as
operating revenues. This means that state appropriations, which are used primarily for operations, are required to be
shown as non-operating revenue.
Scholarship allowances are required to be recorded in three different places: as a reduction to tuition and fees, as a
reduction to room and board and as an operating expense. The user must total the three amounts in order
to ascertain the total scholarship aid received by students from the University. Not included in these amounts are
scholarship aid received directly by students, as well as loan and work-study aid.
Federal and State Scholarships and Grants received by the University, the proceeds of which are reported as a
reduction of operating income, are reported as non-operating revenue.
Capital assets include construction in progress and infrastructure, as well as completed capital projects and capital
acquisitions.
This financial report also includes, in addition to the basic financial statements referred to above, management’s discussion
and analysis, the report of independent auditors, notes to the financial statements and supplemental information. Included also,
in accordance with GASB Statement No. 39, separately presented, are the financial statements and significant notes to the
financial statements for the Ball State University Foundation. The Ball State University Foundation is a separate, not-for-profit
corporation which solicits, collects and invests donations for the sole benefit of Ball State University. The Foundation’s financial
statements are presented in accordance with the reporting principles of the Financial Accounting Standards Board and
therefore are not comparable to those of the University.
Current Economic Climate
The National Association of State Budget Officers (NASBO) reported in the spring of 2014 that the national economy has been
experiencing a relatively weak, by historical
standards, but real recovery. Further, that
the “past several years have been a period
of fiscal rebuilding for states, with steady
improvements alleviating the most difficult
budget woes caused by the recession.”
However, NASBO also points out that
structural challenges remain for states.
States continue to wrestle with such large
and complex issues as health care costs,
infrastructure needs and pension costs,
which compete for funding with educational
appropriations. Because of this, NASBO
predicts that “there will be few additional
dollars available to meet the competing
demands on state budgets.”
Management’s Discussion and Analysis
2
Nursing Simulation and Information Technology Center
Nationwide, revenues are projected to grow at a faster rate in fiscal year 2015. Mid-year budget cuts have been minimal,
supporting the evidence of a slow, but positive recovery. Nationwide, sales tax collections performed well in fiscal year 2014
and are projected to do well again in fiscal year 2015. Personal income tax collections, however, may be hampered by
stagnant wages, as appears to be happening in Indiana. Unless the states see impressive gains in tax revenues, additional
state spending is likely to be modest in fiscal year 2015.
State budget gaps that dominated the fiscal landscape after the Great Recession, have largely, though not entirely subsided. In
2013, eighteen states reported budget gaps exceeding $33 billion. In 2014, through spending constraints and revenue
increases, only 6 states report ongoing budget gaps. State budgets show revenue collections projected to increase by a
collective 3.2 percent in fiscal year 2015. That is good news for states, but still well below the 7.1 percent increase experienced
in 2013. Increased year-end balances also evidence the improved economic vitality of states. In fiscal 2013 total year end
balances among states reached $73.5 billion, an all-time high. But the revenue increases and large year-end balances have
also come with proposals by Governors to reduce net taxes and fees by $2.5 billion in 2015. Overall, 8 governors are
proposing tax increases and fifteen (including Indiana’s) are proposing tax decreases.
In its most recent report advising the Indiana General Assembly on the fiscal year 2013-14 revenue forecast, IHS Global
Insight predicted that the U.S. economy is “poised to accelerate in 2014.” IHS argues that consumer spending will increase,
homebuilding will surge for the next two years, business investment will accelerate, led by equipment spending, and the North
American energy boom will continue to create jobs, investment and a competitive advantage in manufacturing. IHS further
predicts that unemployment will hit 6.0 percent by mid-2015. The Indiana economy is expected to continue to outperform is
Midwestern neighbors and should expect moderate to strong growth for the near term.
Financial Highlights
The University’s financial position, as a whole, improved during the fiscal year ended June 30, 2014, as compared to the
previous year. Net position increased by $8.1 million, due primarily to an increase in restricted net position for construction of
$22.7 million, some of which was offset by a reduction in net investment in capital assets of $5.5 million. Unrestricted net
position decreased by $5.7 million.
The current ratio for the
University, which is
calculated by dividing
current assets by current
liabilities, decreased
from 5.55 to 1 at
June 30, 2013, to
4.08 to 1 at
June 30, 2014, primarily
due to a shift in
investments from short-
term to long-term
holdings. This ratio
measures the
University’s ability to
meet short term
obligations with short
term assets. One of the
most basic determinants
of clear financial health is
the availability of
expendable net position
to cover debt should it
become necessary to settle those debt obligations. The viability ratio measures the University’s ability to fund these long-term
obligations. At June 30, 2014, the University’s viability ratio was 1.45 to 1, down slightly from the June 30, 2013 viability ratio of
1.72 to 1. A ratio above 1 to 1 indicates that the University is able to respond to adverse conditions as well as attract capital
from external resources and fund new objectives.
Management’s Discussion and Analysis
3
Faculty and Students Working in the David
Letterman Communication and Media Building
Appropriations, Gifts and Grants
The 2013-15 biennial budget resulted in a net $6.9 million increase in
state appropriations comprised of an $8.2 million increase in the
Entrepreneurial University line item, a $1.5 million reduction in the
operating appropriation and a new allocation of $0.2 million for dual
credit in fiscal year 2013-14. The University continues to focus its
financial resources on those mission critical programs outlined in the
University Strategic Plan.
The University’s Sponsored Programs Office garnered over $18.2
million in grant awards, contracts awarded to University Centers and
Institutes, and funding to the Ball State University Foundation.
Notable proposals funded in fiscal year 2013-14 include significant
grants from the U.S. Department of State to the Center for
International Development and School of Physical Education, Sport,
and Exercise Science; support for the “Cardinal Connect" program
from the Lilly Endowment; software donations from multiple
companies; multiple research grants from the National Science
Foundation and National Institutes of Health; and support from the
State of Indiana for various community-centered projects from the
Office of Community and Rural Affairs, the Indiana Economic
Development Corporation, and Department of Education, among
others. Grant awards may include cash received in advance, letters of
credit, and cost reimbursable projects.
During fiscal year 2013-14, supporters of Ball State University
contributed private gifts to the Ball State University Foundation
totaling $17.2 million. In addition to funds received during the fiscal
year, the University has also obtained several major multi-year
commitments in support of its capital campaign and strategic plan. These gifts will be reflected in future fiscal year giving
reports.
Other Postemployment Benefits
As of the most recent actuarial study, dated July 1, 2013, Ball State University’s actuarial accrued liability for retiree health care
was estimated to be $203.5 million. As of June 30, 2014, the Voluntary Employee Beneficiary Association (VEBA) Trust (fund
established to assist in financing this liability) had a market value of $218.4 million. At June 30, 2013, the market value of the
VEBA Trust was $181.8 million with a retiree health care plan liability of $181.7 million based on the July 1, 2011 actuarial
study.
Ball State University is not unique in providing health care as a benefit for its retirees. One of Ball State University’s financial
strengths is that it has been engaged since the late 1980’s in the systematic funding of this liability to its current status. As of
June 30, 2014, the VEBA Trust was 101.0 percent actuarially funded. According to a study done by Mercer, of companies
within the S&P 500 that offered an Other Post-Employment Benefits (OPEB) plan, their funded ratio was only 23.0 percent as
of August 31, 2014.
In addition to retiree health care, Ball State also provides life insurance coverage to its retirees. The July 1, 2013, actuarial
study estimated the liability for this benefit at $21.6 million. As of June 30, 2014, the OPEB 115 Trust (formerly Life Insurance
Continuance Fund (LICF)) established to assist in financing this liability had a market value of $23.5 million compared to
$21.9 million as of June 30, 2013. The OPEB 115 Trust was 105.5 percent funded on June 30, 2014. It is expected that the
funding level will vary with general economic conditions over time. The University has a systematic plan in place to fund the
benefit in accordance with the GASB Statement No. 45 rules, and is currently showing a prepaid expense amount, as opposed
to a liability, of $8.8 million, which indicates that the funding is slightly ahead of plan.
Management’s Discussion and Analysis
4
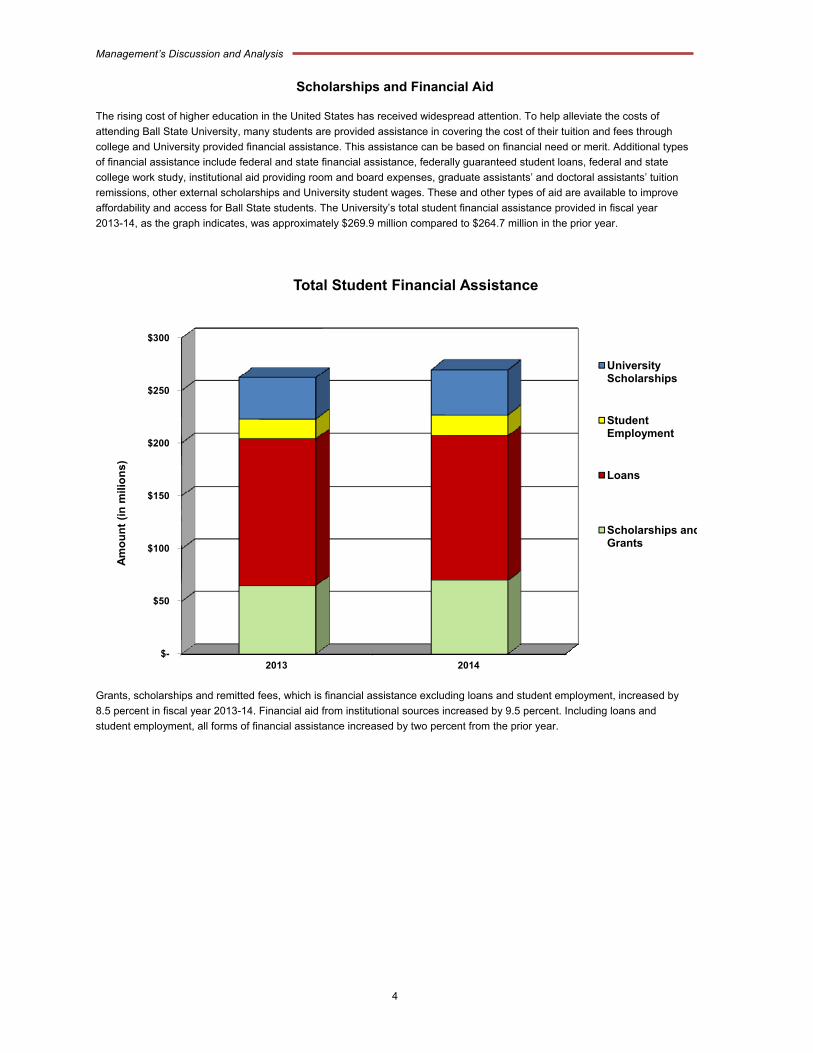
Scholarships and Financial Aid
The rising cost of higher education in the United States has received widespread attention. To help alleviate the costs of
attending Ball State University, many students are provided assistance in covering the cost of their tuition and fees through
college and University provided financial assistance. This assistance can be based on financial need or merit. Additional types
of financial assistance include federal and state financial assistance, federally guaranteed student loans, federal and state
college work study, institutional aid providing room and board expenses, graduate assistants’ and doctoral assistants’ tuition
remissions, other external scholarships and University student wages. These and other types of aid are available to improve
affordability and access for Ball State students. The University’s total student financial assistance provided in fiscal year
2013-14, as the graph indicates, was approximately $269.9 million compared to $264.7 million in the prior year.
$-
$50
$100
$150
$200
$250
$300
2013 2014
Am
ou
nt
(in
mili
on
s)
Total Student Financial Assistance
University Scholarships
Student Employment
Loans
Scholarships andGrants
Grants, scholarships and remitted fees, which is financial assistance excluding loans and student employment, increased by
8.5 percent in fiscal year 2013-14. Financial aid from institutional sources increased by 9.5 percent. Including loans and
student employment, all forms of financial assistance increased by two percent from the prior year.
Management’s Discussion and Analysis
5
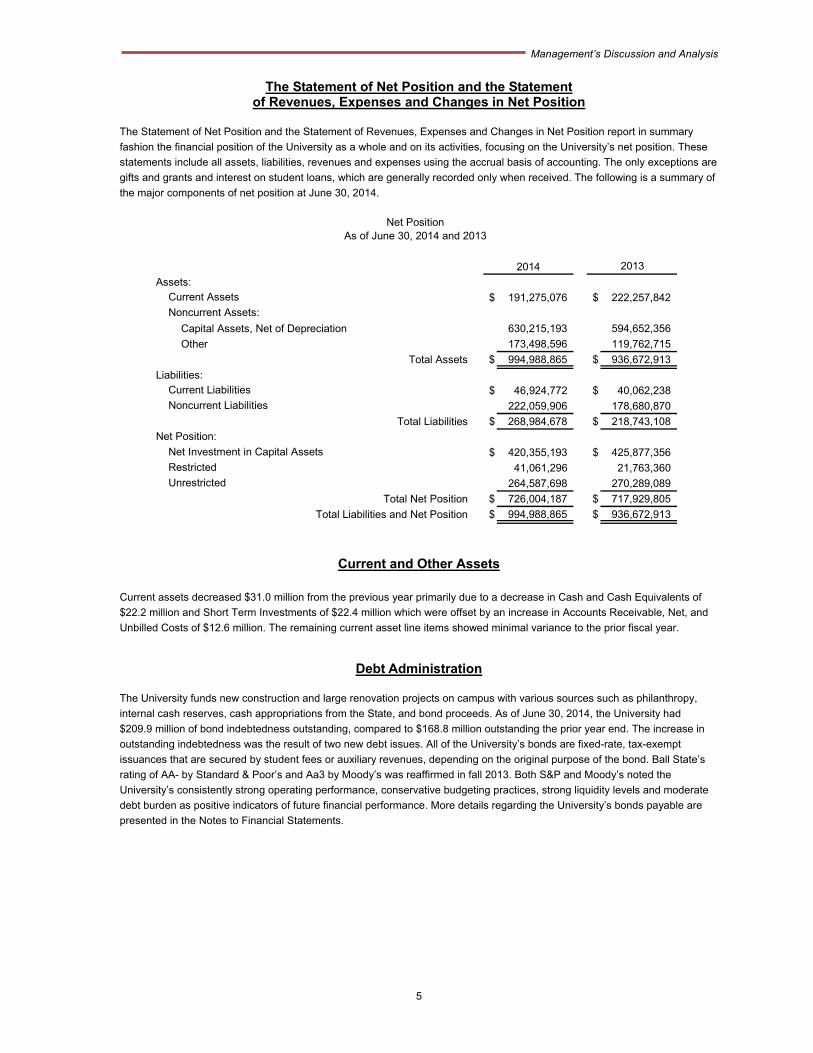
The Statement of Net Position and the Statement of Revenues, Expenses and Changes in Net Position
The Statement of Net Position and the Statement of Revenues, Expenses and Changes in Net Position report in summary
fashion the financial position of the University as a whole and on its activities, focusing on the University’s net position. These
statements include all assets, liabilities, revenues and expenses using the accrual basis of accounting. The only exceptions are
gifts and grants and interest on student loans, which are generally recorded only when received. The following is a summary of
the major components of net position at June 30, 2014.
Assets:
$ 191,275,076 $ 222,257,842
Capital Assets, Net of Depreciation 630,215,193 594,652,356
Other 173,498,596 119,762,715
Total Assets $ 994,988,865 $ 936,672,913
Liabilities:
$ 46,924,772 $ 40,062,238
222,059,906 178,680,870
Total Liabilities $ 268,984,678 $ 218,743,108
$ 420,355,193 $ 425,877,356
41,061,296 21,763,360
264,587,698 270,289,089
Total Net Position $ 726,004,187 $ 717,929,805
Total Liabilities and Net Position $ 994,988,865 $ 936,672,913
Net PositionAs of June 30, 2014 and 2013
Current Liabilities
Current Assets
Net Position:
Unrestricted
2014 2013
Noncurrent Assets:
Noncurrent Liabilities
Net Investment in Capital Assets
Restricted
Current and Other Assets
Current assets decreased $31.0 million from the previous year primarily due to a decrease in Cash and Cash Equivalents of
$22.2 million and Short Term Investments of $22.4 million which were offset by an increase in Accounts Receivable, Net, and
Unbilled Costs of $12.6 million. The remaining current asset line items showed minimal variance to the prior fiscal year.
Debt Administration
The University funds new construction and large renovation projects on campus with various sources such as philanthropy,
internal cash reserves, cash appropriations from the State, and bond proceeds. As of June 30, 2014, the University had
$209.9 million of bond indebtedness outstanding, compared to $168.8 million outstanding the prior year end. The increase in
outstanding indebtedness was the result of two new debt issues. All of the University’s bonds are fixed-rate, tax-exempt
issuances that are secured by student fees or auxiliary revenues, depending on the original purpose of the bond. Ball State’s
rating of AA- by Standard & Poor’s and Aa3 by Moody’s was reaffirmed in fall 2013. Both S&P and Moody’s noted the
University’s consistently strong operating performance, conservative budgeting practices, strong liquidity levels and moderate
debt burden as positive indicators of future financial performance. More details regarding the University’s bonds payable are
presented in the Notes to Financial Statements.
Management’s Discussion and Analysis
6
Charles W. Brown Planetarium
Rendering of Johnson A Residence Hall
Capital Assets
As of June 30, 2014, the University had $420.4 million invested in capital assets, net of accumulated depreciation of
$354.4 million and related debt of $209.9 million. Depreciation charges totaled $24.6 million for the current fiscal year. All of
these amounts reflect cost of construction rather than replacement cost.
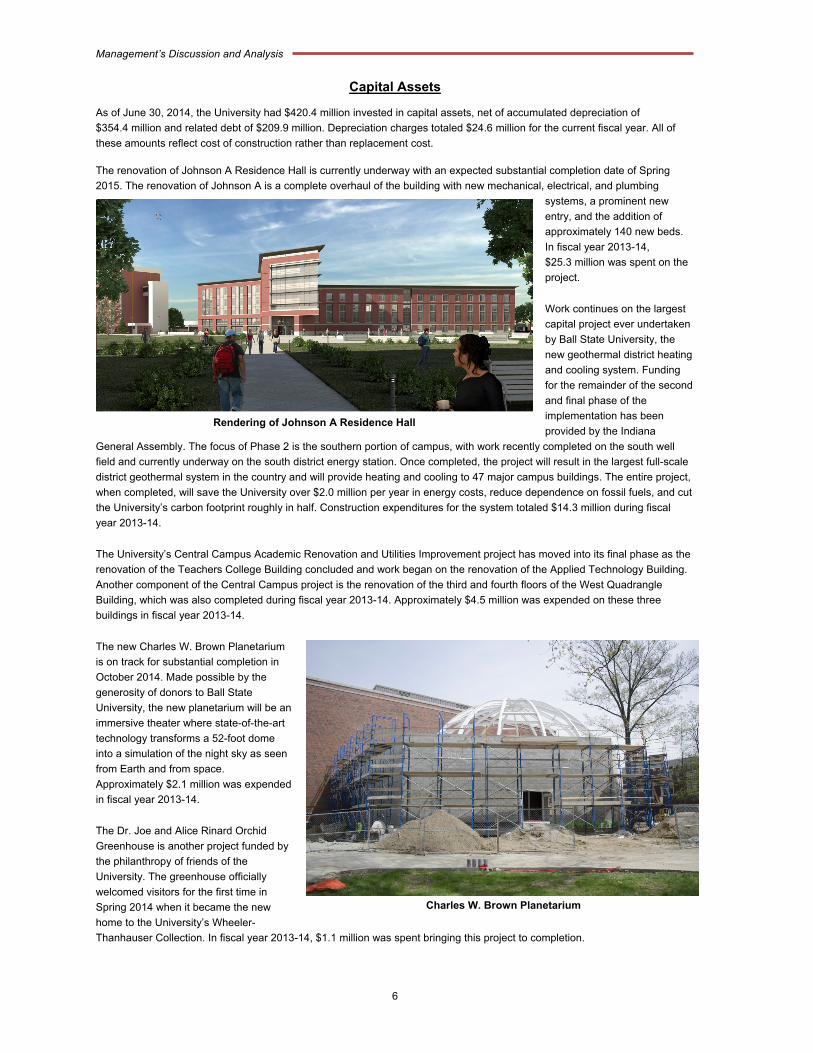
The renovation of Johnson A Residence Hall is currently underway with an expected substantial completion date of Spring
2015. The renovation of Johnson A is a complete overhaul of the building with new mechanical, electrical, and plumbing
systems, a prominent new
entry, and the addition of
approximately 140 new beds.
In fiscal year 2013-14,
$25.3 million was spent on the
project.
Work continues on the largest
capital project ever undertaken
by Ball State University, the
new geothermal district heating
and cooling system. Funding
for the remainder of the second
and final phase of the
implementation has been
provided by the Indiana
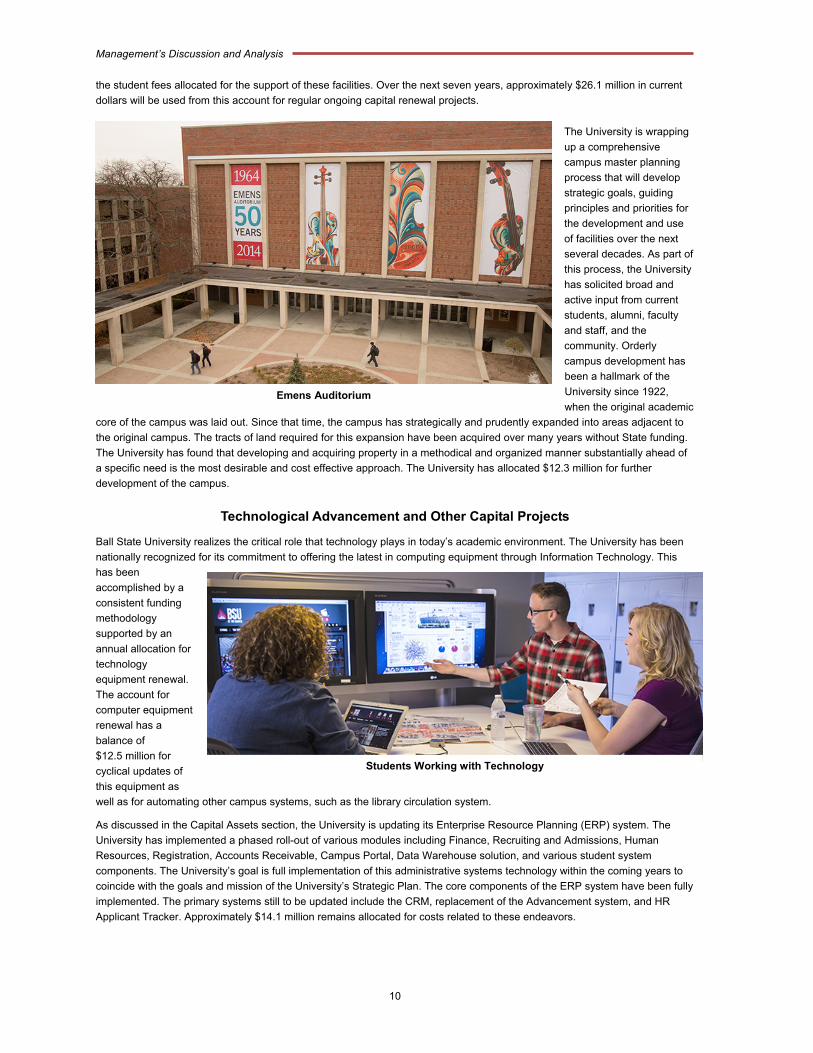
General Assembly. The focus of Phase 2 is the southern portion of campus, with work recently completed on the south well
field and currently underway on the south district energy station. Once completed, the project will result in the largest full-scale
district geothermal system in the country and will provide heating and cooling to 47 major campus buildings. The entire project,
when completed, will save the University over $2.0 million per year in energy costs, reduce dependence on fossil fuels, and cut
the University’s carbon footprint roughly in half. Construction expenditures for the system totaled $14.3 million during fiscal
year 2013-14.
The University’s Central Campus Academic Renovation and Utilities Improvement project has moved into its final phase as the
renovation of the Teachers College Building concluded and work began on the renovation of the Applied Technology Building.
Another component of the Central Campus project is the renovation of the third and fourth floors of the West Quadrangle
Building, which was also completed during fiscal year 2013-14. Approximately $4.5 million was expended on these three
buildings in fiscal year 2013-14.
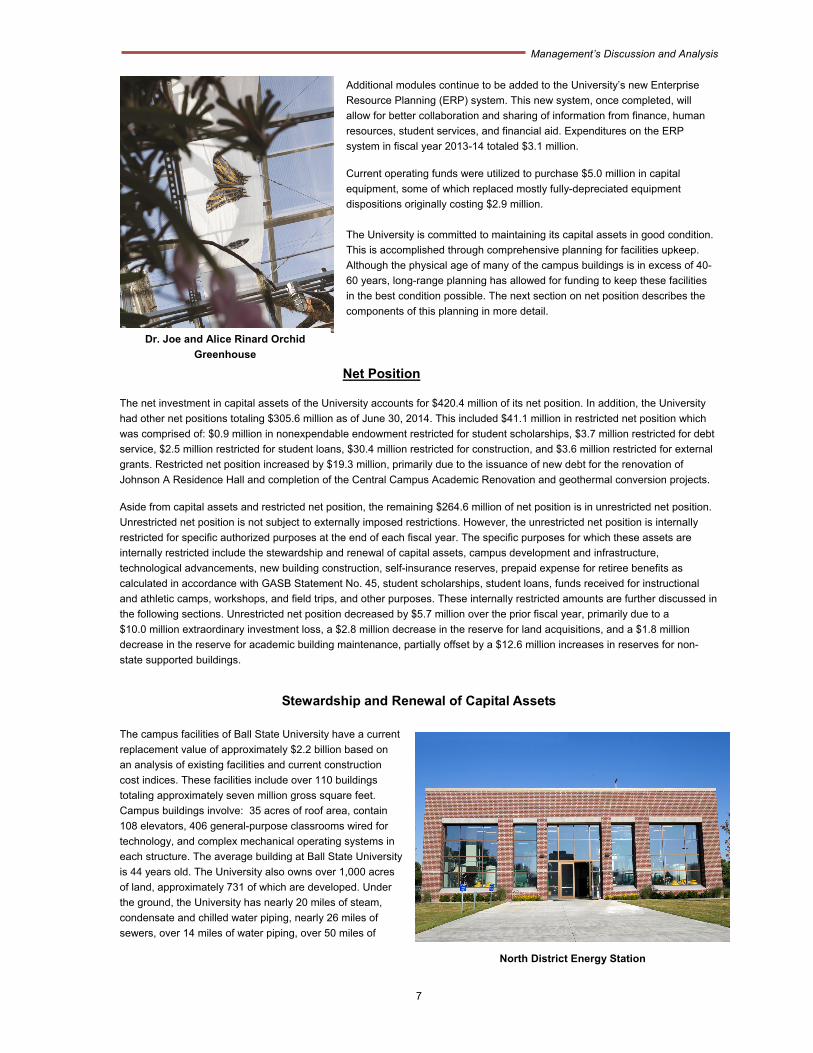
The new Charles W. Brown Planetarium
is on track for substantial completion in
October 2014. Made possible by the
generosity of donors to Ball State
University, the new planetarium will be an
immersive theater where state-of-the-art
technology transforms a 52-foot dome
into a simulation of the night sky as seen
from Earth and from space.
Approximately $2.1 million was expended
in fiscal year 2013-14.
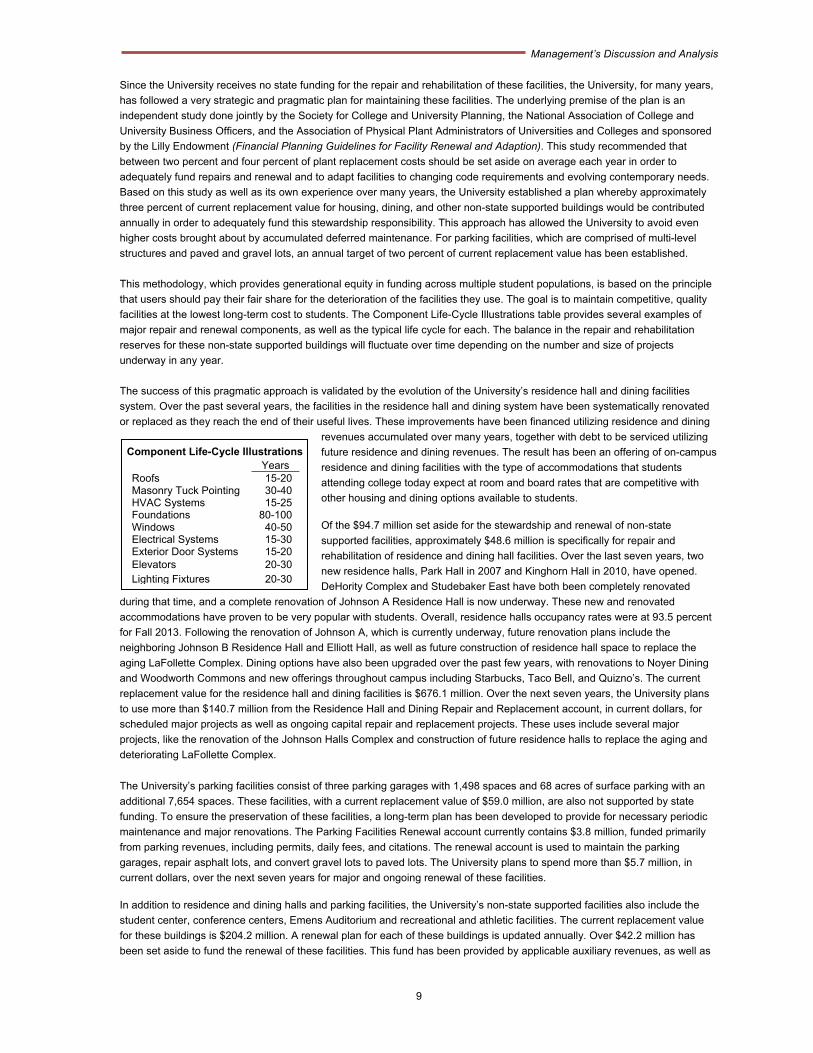
The Dr. Joe and Alice Rinard Orchid
Greenhouse is another project funded by
the philanthropy of friends of the
University. The greenhouse officially
welcomed visitors for the first time in
Spring 2014 when it became the new
home to the University’s Wheeler-
Thanhauser Collection. In fiscal year 2013-14, $1.1 million was spent bringing this project to completion.
Management’s Discussion and Analysis
7
Dr. Joe and Alice Rinard Orchid
Greenhouse
North District Energy Station
Additional modules continue to be added to the University’s new Enterprise
Resource Planning (ERP) system. This new system, once completed, will
allow for better collaboration and sharing of information from finance, human
resources, student services, and financial aid. Expenditures on the ERP
system in fiscal year 2013-14 totaled $3.1 million.
Current operating funds were utilized to purchase $5.0 million in capital
equipment, some of which replaced mostly fully-depreciated equipment
dispositions originally costing $2.9 million.
The University is committed to maintaining its capital assets in good condition.
This is accomplished through comprehensive planning for facilities upkeep.
Although the physical age of many of the campus buildings is in excess of 40-
60 years, long-range planning has allowed for funding to keep these facilities
in the best condition possible. The next section on net position describes the
components of this planning in more detail.
Net Position
The net investment in capital assets of the University accounts for $420.4 million of its net position. In addition, the University
had other net positions totaling $305.6 million as of June 30, 2014. This included $41.1 million in restricted net position which
was comprised of: $0.9 million in nonexpendable endowment restricted for student scholarships, $3.7 million restricted for debt
service, $2.5 million restricted for student loans, $30.4 million restricted for construction, and $3.6 million restricted for external
grants. Restricted net position increased by $19.3 million, primarily due to the issuance of new debt for the renovation of
Johnson A Residence Hall and completion of the Central Campus Academic Renovation and geothermal conversion projects.
Aside from capital assets and restricted net position, the remaining $264.6 million of net position is in unrestricted net position.
Unrestricted net position is not subject to externally imposed restrictions. However, the unrestricted net position is internally
restricted for specific authorized purposes at the end of each fiscal year. The specific purposes for which these assets are
internally restricted include the stewardship and renewal of capital assets, campus development and infrastructure,
technological advancements, new building construction, self-insurance reserves, prepaid expense for retiree benefits as
calculated in accordance with GASB Statement No. 45, student scholarships, student loans, funds received for instructional
and athletic camps, workshops, and field trips, and other purposes. These internally restricted amounts are further discussed in
the following sections. Unrestricted net position decreased by $5.7 million over the prior fiscal year, primarily due to a
$10.0 million extraordinary investment loss, a $2.8 million decrease in the reserve for land acquisitions, and a $1.8 million
decrease in the reserve for academic building maintenance, partially offset by a $12.6 million increases in reserves for non-
state supported buildings.
Stewardship and Renewal of Capital Assets
The campus facilities of Ball State University have a current
replacement value of approximately $2.2 billion based on
an analysis of existing facilities and current construction
cost indices. These facilities include over 110 buildings
totaling approximately seven million gross square feet.
Campus buildings involve: 35 acres of roof area, contain
108 elevators, 406 general-purpose classrooms wired for
technology, and complex mechanical operating systems in
each structure. The average building at Ball State University
is 44 years old. The University also owns over 1,000 acres
of land, approximately 731 of which are developed. Under
the ground, the University has nearly 20 miles of steam,
condensate and chilled water piping, nearly 26 miles of
sewers, over 14 miles of water piping, over 50 miles of

Management’s Discussion and Analysis
8
Gross Square Feet of Campus Buildings
by Year
(in thousands)
0500
1,0001,5002,0002,5003,0003,5004,000
State Supported Non-State Supported
electrical power distribution wiring and over 5,338 miles of communication cable to connect buildings. Much of this
infrastructure is located in the over half a million cubic feet of utility tunnels on campus. In addition, the thousands of boreholes
drilled to date for the geothermal conversion project include over 730 miles of loop piping. Above the ground, the University has
1,489 outside lighting poles, over 34 miles of sidewalks and service roads, and 68 acres of surface parking lots. All of these
assets have their own unique life cycles for maintenance and renewal, and the Facilities Planning & Maintenance staff of the
University is responsible for ensuring that the assets are kept in excellent condition.
The financing of construction and ongoing renewal of University property is dependent on the type and use of the facility
involved. These next two sections discuss how these costs are handled for state supported and non-state supported buildings.
The University is committed to a systematic plan of ongoing renewal of campus facilities and infrastructure systems. This
commitment is evidenced by Ball State University’s strategic initiative of creating a vibrant and supportive campus atmosphere.
State Supported Academic and Administrative Buildings
Campus buildings which serve a primarily academic or administrative purpose are generally funded through bond financing,
state appropriations allocated on a biennial basis
by the Indiana General Assembly, or philanthropic
support. As shown in the accompanying graph,
approximately 45.0 percent of the campus square
footage is dedicated to academic and
administrative uses. As the “state supported”
moniker suggests, the upkeep of these buildings is
intended to be funded by the State of Indiana In
reality, state funding for repair and rehabilitation of
these spaces has been reduced over the last
several biennia, leading to increased deferred
maintenance needs. Deferred maintenance needs
are addressed with internal funds when available
and occasionally through large scale renovation
projects such as the Central Campus Academic
Renovation and Utilities Improvement Project
which was discussed earlier. The University has also set aside approximately $3.6 million of internal funds for maintenance
and equipping of targeted academic buildings where state R&R appropriations are not readily available
Non-State Supported Buildings
The remaining 55.0 percent of campus square footage consists of buildings which are built and maintained without state funds.
These “non-state supported” facilities include dining and residence halls, parking facilities, the student center, performance
venues, athletic facilities, and conference venues. These non-state supported buildings play a critical role in achieving the
University’s mission of fostering educational, cultural, and social development in the student body and the community. Non-
state supported buildings have a current replacement value of approximately $0.9 billion. Between now and 2021,
approximately $172.4 million, in current dollars, is planned or underway for investment in renewal projects on these facilities.
As of the end of fiscal year 2013-14, $94.7 million has been allocated from auxiliary operations revenues and student fees for
the stewardship and renewal of these facilities. The following tables list major non-state supported projects currently underway
or in the planning process for the next few years.
Johnson A Renovation $ 35.7 Johnson B Renovation $ 38.0 - McKinley Commons 25.9
Total Major Projects in Progress $ 35.7 Total Major Projects in Planning $ 63.9
(in millions)(in millions)
Major Construction Projects in PlanningNon-State Supported Buildings
($1.0 million or greater)Budget
Major Construction Projects in ProgressNon-State Supported Buildings
($1.0 million or greater)Budget
Management’s Discussion and Analysis
9
Component Life-Cycle Illustrations Years Roofs 15-20 Masonry Tuck Pointing 30-40 HVAC Systems 15-25 Foundations 80-100 Windows 40-50 Electrical Systems 15-30 Exterior Door Systems 15-20 Elevators 20-30 Lighting Fixtures 20-30
Since the University receives no state funding for the repair and rehabilitation of these facilities, the University, for many years,
has followed a very strategic and pragmatic plan for maintaining these facilities. The underlying premise of the plan is an
independent study done jointly by the Society for College and University Planning, the National Association of College and
University Business Officers, and the Association of Physical Plant Administrators of Universities and Colleges and sponsored
by the Lilly Endowment (Financial Planning Guidelines for Facility Renewal and Adaption). This study recommended that
between two percent and four percent of plant replacement costs should be set aside on average each year in order to
adequately fund repairs and renewal and to adapt facilities to changing code requirements and evolving contemporary needs.
Based on this study as well as its own experience over many years, the University established a plan whereby approximately
three percent of current replacement value for housing, dining, and other non-state supported buildings would be contributed
annually in order to adequately fund this stewardship responsibility. This approach has allowed the University to avoid even
higher costs brought about by accumulated deferred maintenance. For parking facilities, which are comprised of multi-level
structures and paved and gravel lots, an annual target of two percent of current replacement value has been established.
This methodology, which provides generational equity in funding across multiple student populations, is based on the principle
that users should pay their fair share for the deterioration of the facilities they use. The goal is to maintain competitive, quality
facilities at the lowest long-term cost to students. The Component Life-Cycle Illustrations table provides several examples of
major repair and renewal components, as well as the typical life cycle for each. The balance in the repair and rehabilitation
reserves for these non-state supported buildings will fluctuate over time depending on the number and size of projects
underway in any year.
The success of this pragmatic approach is validated by the evolution of the University’s residence hall and dining facilities
system. Over the past several years, the facilities in the residence hall and dining system have been systematically renovated
or replaced as they reach the end of their useful lives. These improvements have been financed utilizing residence and dining
revenues accumulated over many years, together with debt to be serviced utilizing
future residence and dining revenues. The result has been an offering of on-campus
residence and dining facilities with the type of accommodations that students
attending college today expect at room and board rates that are competitive with
other housing and dining options available to students.
Of the $94.7 million set aside for the stewardship and renewal of non-state
supported facilities, approximately $48.6 million is specifically for repair and
rehabilitation of residence and dining hall facilities. Over the last seven years, two
new residence halls, Park Hall in 2007 and Kinghorn Hall in 2010, have opened.
DeHority Complex and Studebaker East have both been completely renovated
during that time, and a complete renovation of Johnson A Residence Hall is now underway. These new and renovated
accommodations have proven to be very popular with students. Overall, residence halls occupancy rates were at 93.5 percent
for Fall 2013. Following the renovation of Johnson A, which is currently underway, future renovation plans include the
neighboring Johnson B Residence Hall and Elliott Hall, as well as future construction of residence hall space to replace the
aging LaFollette Complex. Dining options have also been upgraded over the past few years, with renovations to Noyer Dining
and Woodworth Commons and new offerings throughout campus including Starbucks, Taco Bell, and Quizno’s. The current
replacement value for the residence hall and dining facilities is $676.1 million. Over the next seven years, the University plans
to use more than $140.7 million from the Residence Hall and Dining Repair and Replacement account, in current dollars, for
scheduled major projects as well as ongoing capital repair and replacement projects. These uses include several major
projects, like the renovation of the Johnson Halls Complex and construction of future residence halls to replace the aging and
deteriorating LaFollette Complex.
The University’s parking facilities consist of three parking garages with 1,498 spaces and 68 acres of surface parking with an
additional 7,654 spaces. These facilities, with a current replacement value of $59.0 million, are also not supported by state
funding. To ensure the preservation of these facilities, a long-term plan has been developed to provide for necessary periodic
maintenance and major renovations. The Parking Facilities Renewal account currently contains $3.8 million, funded primarily
from parking revenues, including permits, daily fees, and citations. The renewal account is used to maintain the parking
garages, repair asphalt lots, and convert gravel lots to paved lots. The University plans to spend more than $5.7 million, in
current dollars, over the next seven years for major and ongoing renewal of these facilities.
In addition to residence and dining halls and parking facilities, the University’s non-state supported facilities also include the
student center, conference centers, Emens Auditorium and recreational and athletic facilities. The current replacement value
for these buildings is $204.2 million. A renewal plan for each of these buildings is updated annually. Over $42.2 million has
been set aside to fund the renewal of these facilities. This fund has been provided by applicable auxiliary revenues, as well as
Management’s Discussion and Analysis
10
Students Working with Technology
Emens Auditorium
the student fees allocated for the support of these facilities. Over the next seven years, approximately $26.1 million in current
dollars will be used from this account for regular ongoing capital renewal projects.
The University is wrapping
up a comprehensive
campus master planning
process that will develop
strategic goals, guiding
principles and priorities for
the development and use
of facilities over the next
several decades. As part of
this process, the University
has solicited broad and
active input from current
students, alumni, faculty
and staff, and the
community. Orderly
campus development has
been a hallmark of the
University since 1922,
when the original academic
core of the campus was laid out. Since that time, the campus has strategically and prudently expanded into areas adjacent to
the original campus. The tracts of land required for this expansion have been acquired over many years without State funding.
The University has found that developing and acquiring property in a methodical and organized manner substantially ahead of
a specific need is the most desirable and cost effective approach. The University has allocated $12.3 million for further
development of the campus.
Technological Advancement and Other Capital Projects
Ball State University realizes the critical role that technology plays in today’s academic environment. The University has been
nationally recognized for its commitment to offering the latest in computing equipment through Information Technology. This
has been
accomplished by a
consistent funding
methodology
supported by an
annual allocation for
technology
equipment renewal.
The account for
computer equipment
renewal has a
balance of
$12.5 million for
cyclical updates of
this equipment as
well as for automating other campus systems, such as the library circulation system.
As discussed in the Capital Assets section, the University is updating its Enterprise Resource Planning (ERP) system. The
University has implemented a phased roll-out of various modules including Finance, Recruiting and Admissions, Human
Resources, Registration, Accounts Receivable, Campus Portal, Data Warehouse solution, and various student system
components. The University’s goal is full implementation of this administrative systems technology within the coming years to
coincide with the goals and mission of the University’s Strategic Plan. The core components of the ERP system have been fully
implemented. The primary systems still to be updated include the CRM, replacement of the Advancement system, and HR
Applicant Tracker. Approximately $14.1 million remains allocated for costs related to these endeavors.
Management’s Discussion and Analysis
11
Approximately $12.9 million has been set aside for capital projects that are underway or recently authorized. These projects
include the eventual replacement of the campus telephone system and furnishings and equipment for academic buildings.
Insurance and Other Exposures
Through self-insurance, Ball State University is able to better contain costs and avoid purchasing higher cost insurance
coverage from outside carriers. A requirement of self-insurance, however, is the establishment of sufficient reserves to cover
claims incurred by the University and its constituents. As of June 30, 2014, self-insurance reserves total $13.2 million, of which
$10.6 million pertains to the self-insured health care plan for employees, retirees, and their families. Of the $10.6 million
reserve for health claims, $6.3 million represents claims that were incurred but not yet paid as of year-end, while $4.3 million is
available for higher than anticipated claims in any given year. These amounts are established at the end of each year in
consultation with the University’s outside actuaries. The remaining $2.6 million in insurance reserves includes $1.0 million for
the employee and retiree life insurance plan and $1.6 million to cover higher than expected expenditures in unemployment and
workers’ compensation, as well as the high deductibles for property and casualty insurance. In addition to the insurance
reserves, the requirements of GASB Statement No. 45 resulted in the recognition of $8.8 million in prepaid retiree health care
expense, a decrease of $0.2 million over the prior year.
The University’s student fee bonds are secured by pledges and first liens on student fees. The debt service on a portion of
these bonds is reimbursed by a Fee Replacement Appropriation made by the Indiana General Assembly. There is no
guarantee that this appropriation will be renewed in any subsequent year, as the current General Assembly cannot legally bind
future General Assemblies. In order to facilitate the timely payment of the debt service on the bonds and the receipt of fee
replacement appropriations, the University has established a reserve account. The current balance in this account is
$15.9 million.
The University has allocated $3.4 million, or 1.0 percent of the fiscal year 2013-14 general fund budget, to a contingency
reserve. This reserve is intended to help offset the costs related to a significant, unforeseen event, such as a major pandemic,
a major weather-related event, other adverse acts of nature, or other claims.
Other Allocations
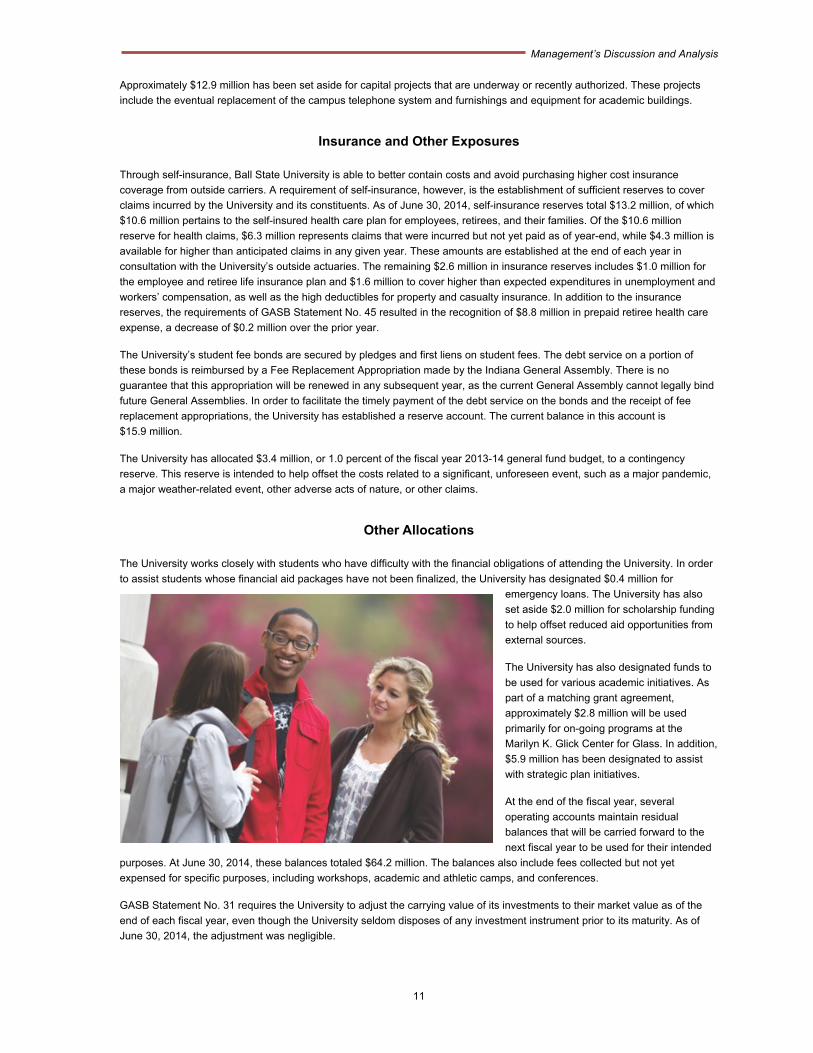
The University works closely with students who have difficulty with the financial obligations of attending the University. In order
to assist students whose financial aid packages have not been finalized, the University has designated $0.4 million for
emergency loans. The University has also
set aside $2.0 million for scholarship funding
to help offset reduced aid opportunities from
external sources.
The University has also designated funds to
be used for various academic initiatives. As
part of a matching grant agreement,
approximately $2.8 million will be used
primarily for on-going programs at the
Marilyn K. Glick Center for Glass. In addition,
$5.9 million has been designated to assist
with strategic plan initiatives.
At the end of the fiscal year, several
operating accounts maintain residual
balances that will be carried forward to the
next fiscal year to be used for their intended
purposes. At June 30, 2014, these balances totaled $64.2 million. The balances also include fees collected but not yet
expensed for specific purposes, including workshops, academic and athletic camps, and conferences.
GASB Statement No. 31 requires the University to adjust the carrying value of its investments to their market value as of the
end of each fiscal year, even though the University seldom disposes of any investment instrument prior to its maturity. As of
June 30, 2014, the adjustment was negligible.
Management’s Discussion and Analysis
12
Change in Net Position
The following is a summary of the revenues and expenses resulting in the changes in net position for the year ended
June 30, 2014. Note that, for purposes of this statement, state appropriations are considered non-operating revenues.
Operating Revenues $ 250,325,765 $ 251,330,630
Operating Expenses 444,560,887 421,135,527
Net Operating Income/(Loss) $ (194,235,122) $ (169,804,897)
Net Non-Operating Revenues 193,985,205 186,658,684
Other Revenue – Capital Appropriations and Gifts 18,347,004 3,658,732
Increase in Net Position Before Extraordinary Item $ 18,097,087 $ 20,512,519
Loss from Extraordinary Item (10,022,705) -
Increase in Net Position After Extraordinary Item $ 8,074,382 $ 20,512,519
Net Position - Beginning of Year 717,929,805 697,417,286 Net Position - End of Year $ 726,004,187 $ 717,929,805
Change in Net PositionYear Ended June 30, 2014 and 2013
2014 2013
Operating Revenues
Operating revenues increase net position and include all transactions that result in sales and/or receipts from goods and
services such as tuition and fees, housing, dining and athletics. In addition, federal, state and private grants are considered
operating if they are not for financial aid or capital purposes.
Gross student tuition and fees for fiscal year 2013-14 increased 2.5 percent while scholarship allowances increased by
11.3 percent resulting in a net revenue decrease of $2.3 million or 1.5 percent as a result of a modest rate increase, slight
enrollment decreases and a large increase in scholarship allowances. Auxiliary enterprise revenue, including housing and
dining net revenues, increased $3.4 million due primarily to an increase in other auxiliary enterprises. Other auxiliary
enterprises includes: revenue from parking, athletic events, and cultural events which produced an increase of $2.8 million.
Grants and contracts revenue decreased by $2.6 million from the prior year to total $13.8 million for fiscal year 2013-14. The
combined balances for sales and services of educational departments and other operating revenue resulted in a $0.5 million
increase.
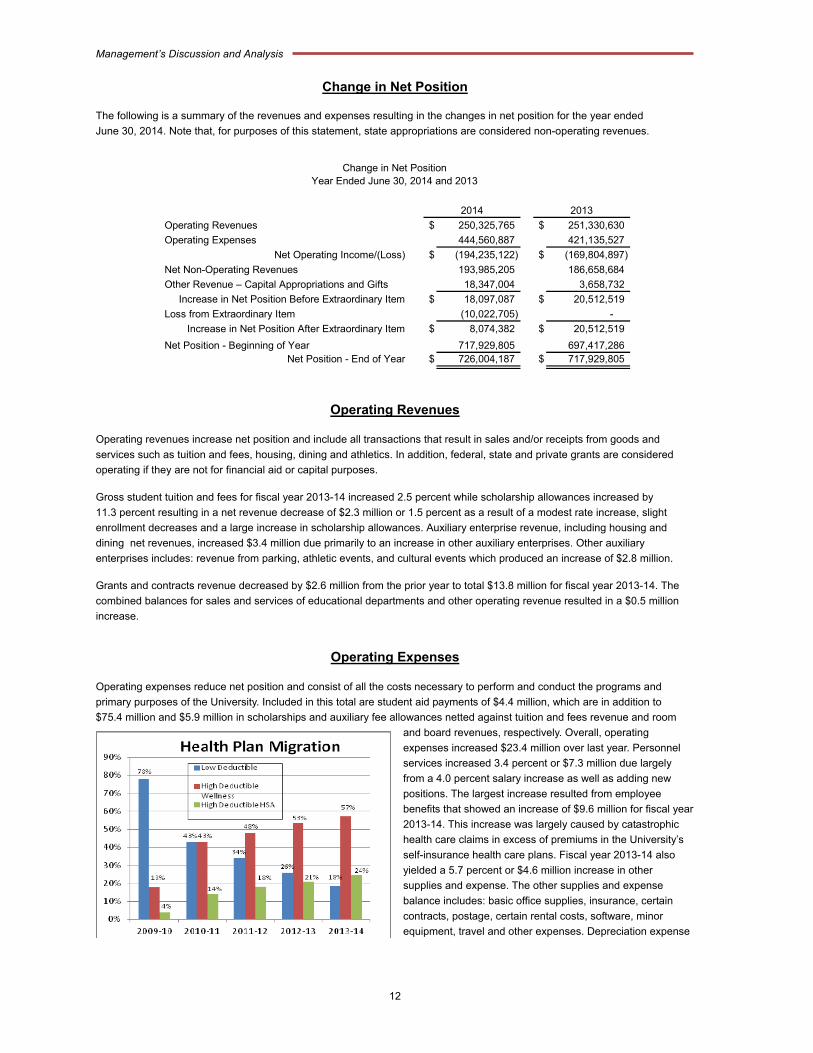
Operating Expenses
Operating expenses reduce net position and consist of all the costs necessary to perform and conduct the programs and
primary purposes of the University. Included in this total are student aid payments of $4.4 million, which are in addition to
$75.4 million and $5.9 million in scholarships and auxiliary fee allowances netted against tuition and fees revenue and room
and board revenues, respectively. Overall, operating
expenses increased $23.4 million over last year. Personnel
services increased 3.4 percent or $7.3 million due largely
from a 4.0 percent salary increase as well as adding new
positions. The largest increase resulted from employee
benefits that showed an increase of $9.6 million for fiscal year
2013-14. This increase was largely caused by catastrophic
health care claims in excess of premiums in the University’s
self-insurance health care plans. Fiscal year 2013-14 also
yielded a 5.7 percent or $4.6 million increase in other
supplies and expense. The other supplies and expense
balance includes: basic office supplies, insurance, certain
contracts, postage, certain rental costs, software, minor
equipment, travel and other expenses. Depreciation expense
Management’s Discussion and Analysis
13
increased by $0.8 million over the prior fiscal year. There were reductions for repairs and maintenance of $0.2 million and an
increase in utilities of $1.0 million.
The largest area of uncertainty in budgeting operating expenses comes from managing the self-insurance health care plan. As
more initiatives of the Patient Protection and Affordable Care Act come into effect, we try to anticipate the effects on health care
expenses. The University is diligent in working to control costs and still provide competitive benefit rich plans. Employees
receive an incentive to migrate to consumer driven heath care plans. The University has been able to reduce premiums paid by
both employee and the University, while at the same time reducing medical claims in the consumer driven health care plans.
Since fiscal year 2006-07, premiums have actually seen a reduction in two of the three health care plans offered by the
University.
The University is committed to providing health enhancement wellness programs to employees to not only improve their level
of health but also to improve their quality of life by expanding its health enhancement program activities, including offering free
health risk assessments and screenings to employees and their spouses, incentives for participation in wellness activities, free
tobacco cessation programs, and continuing to work with employees on managing their chronic health conditions. The
University also continues to monitor and make appropriate changes to the various health plans to encourage good consumer
behavior, such as use of generic drugs and preventative care to control costs, without adversely affecting medical care. Even
with the increase in the healthcare actuarial liability, a contribution to the VEBA Trust was not necessary in fiscal year 2013-14.
Non-Operating Revenues and Expenses
Non-operating revenues increase net position, and non-operating expenses reduce net position. Non-operating revenues and
expenses are generated from transactions that are primarily non-exchange in nature, consisting mainly of state appropriations,
federal and state scholarships and grants, private gifts, interest expense and investment income (interest and dividend income
and realized and unrealized gains and losses).
For fiscal year 2013-14, state operating appropriations distributed to the University increased by $2.0 million from
$139.5 million to $141.5 million. Revenues from private gifts increased 1.2 percent to $7.3 million.
Federal and State Scholarships and Grants increased by $5.8 million. Other Non-Operating Income consists primarily of head
count funds (formerly ADM receipts) for the Indiana Academy for Science, Mathematics and Humanities and for the Burris
Laboratory School, plus a Medicare Retiree Drug Subsidy the total of which decreased $1.5 million. Investment income may
fluctuate from day to day as the amounts reported are tied to market fluctuations and unrealized losses at any given time. At
June 30, 2014, investment income increased by $2.0 million over the prior year.
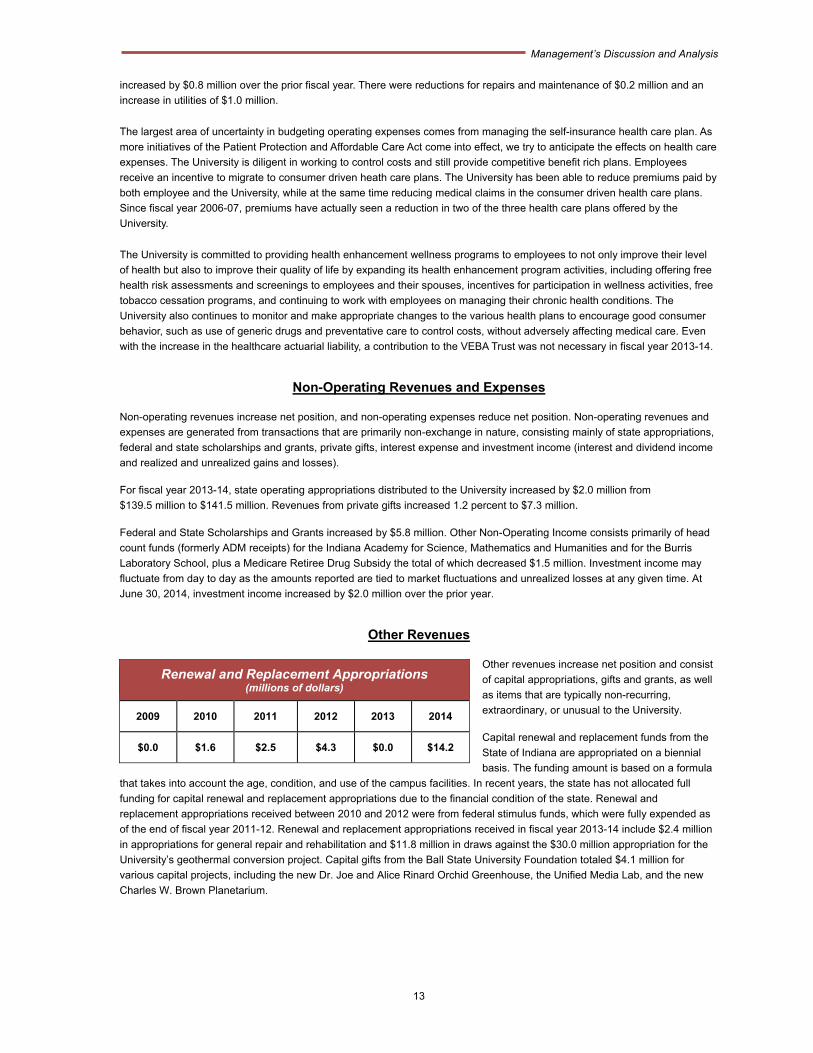
Other Revenues
Other revenues increase net position and consist
of capital appropriations, gifts and grants, as well
as items that are typically non-recurring,
extraordinary, or unusual to the University.
Capital renewal and replacement funds from the
State of Indiana are appropriated on a biennial
basis. The funding amount is based on a formula
that takes into account the age, condition, and use of the campus facilities. In recent years, the state has not allocated full
funding for capital renewal and replacement appropriations due to the financial condition of the state. Renewal and
replacement appropriations received between 2010 and 2012 were from federal stimulus funds, which were fully expended as
of the end of fiscal year 2011-12. Renewal and replacement appropriations received in fiscal year 2013-14 include $2.4 million
in appropriations for general repair and rehabilitation and $11.8 million in draws against the $30.0 million appropriation for the
University’s geothermal conversion project. Capital gifts from the Ball State University Foundation totaled $4.1 million for
various capital projects, including the new Dr. Joe and Alice Rinard Orchid Greenhouse, the Unified Media Lab, and the new
Charles W. Brown Planetarium.
Renewal and Replacement Appropriations (millions of dollars)
2009 2010 2011 2012 2013 2014
$0.0 $1.6 $2.5 $4.3 $0.0 $14.2
Management’s Discussion and Analysis
14
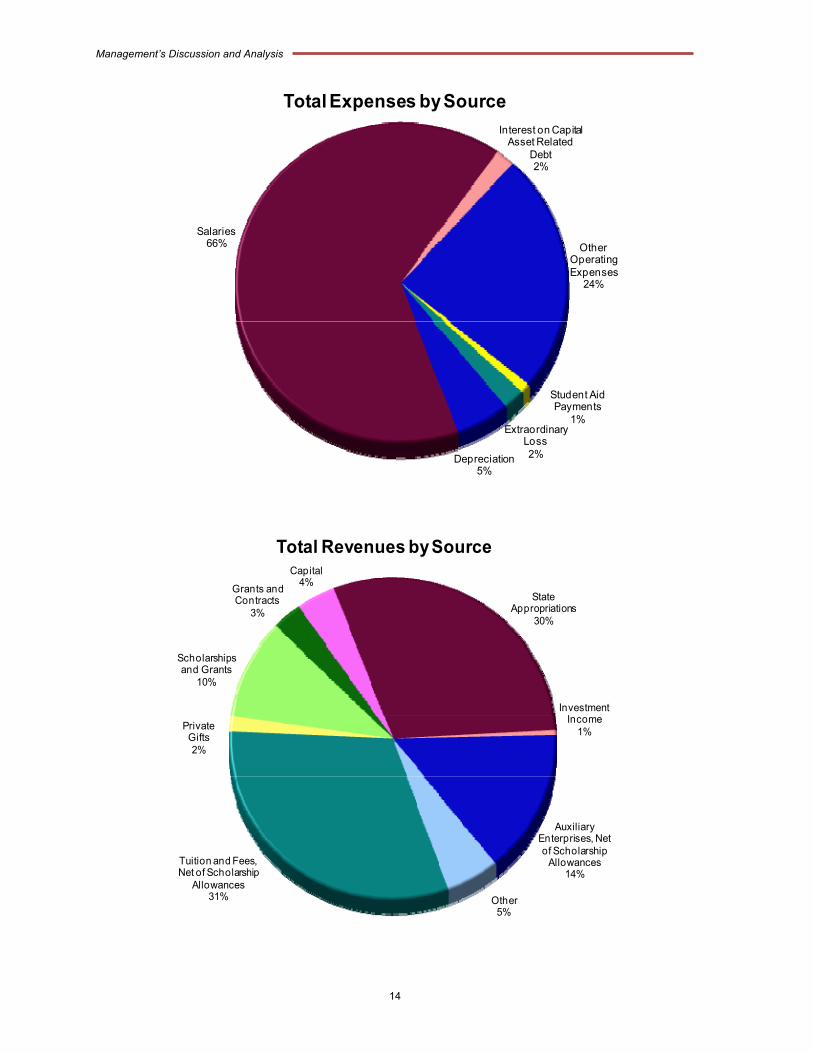
Salaries 66%
Interest on Capital Asset Related
Debt2%
OtherOperating Expenses
24%
Student AidPayments
1%Extraordinary
Loss2%Depreciation
5%
Total Expenses by Source
Tuition and Fees, Net of Scholarship
Allowances31%
PrivateGifts2%
Scholarshipsand Grants
10%
Grants and Contracts
3%
Capital4%
State Appropriations
30%
InvestmentIncome
1%
Auxiliary Enterprises, Netof Scholarship
Allowances14%
Other 5%
Total Revenues by Source
Management’s Discussion and Analysis
15
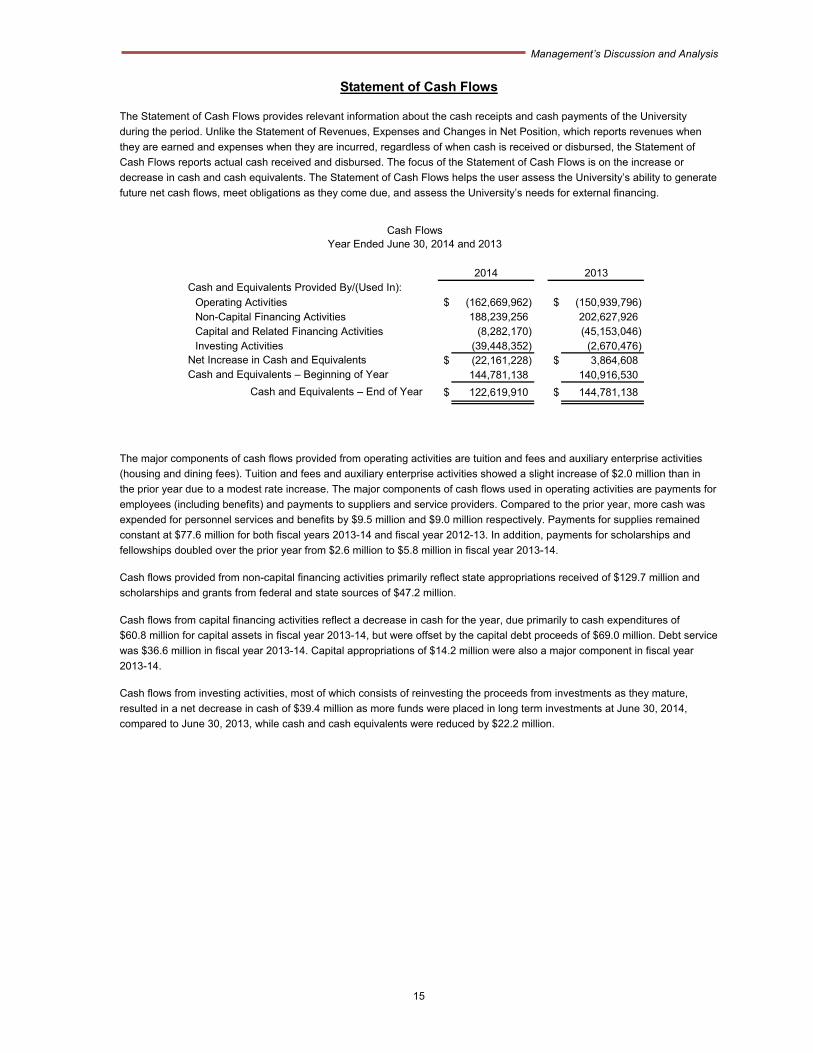
Statement of Cash Flows
The Statement of Cash Flows provides relevant information about the cash receipts and cash payments of the University
during the period. Unlike the Statement of Revenues, Expenses and Changes in Net Position, which reports revenues when
they are earned and expenses when they are incurred, regardless of when cash is received or disbursed, the Statement of
Cash Flows reports actual cash received and disbursed. The focus of the Statement of Cash Flows is on the increase or
decrease in cash and cash equivalents. The Statement of Cash Flows helps the user assess the University’s ability to generate
future net cash flows, meet obligations as they come due, and assess the University’s needs for external financing.
Operating Activities $ (162,669,962) $ (150,939,796) Non-Capital Financing Activities 188,239,256 202,627,926 Capital and Related Financing Activities (8,282,170) (45,153,046) Investing Activities (39,448,352) (2,670,476)
$ (22,161,228) $ 3,864,608 144,781,138 140,916,530
$ 122,619,910 $ 144,781,138
Cash FlowsYear Ended June 30, 2014 and 2013
Cash and Equivalents – End of Year
Cash and Equivalents Provided By/(Used In):
Net Increase in Cash and EquivalentsCash and Equivalents – Beginning of Year
20132014
The major components of cash flows provided from operating activities are tuition and fees and auxiliary enterprise activities
(housing and dining fees). Tuition and fees and auxiliary enterprise activities showed a slight increase of $2.0 million than in
the prior year due to a modest rate increase. The major components of cash flows used in operating activities are payments for
employees (including benefits) and payments to suppliers and service providers. Compared to the prior year, more cash was
expended for personnel services and benefits by $9.5 million and $9.0 million respectively. Payments for supplies remained
constant at $77.6 million for both fiscal years 2013-14 and fiscal year 2012-13. In addition, payments for scholarships and
fellowships doubled over the prior year from $2.6 million to $5.8 million in fiscal year 2013-14.
Cash flows provided from non-capital financing activities primarily reflect state appropriations received of $129.7 million and
scholarships and grants from federal and state sources of $47.2 million.
Cash flows from capital financing activities reflect a decrease in cash for the year, due primarily to cash expenditures of
$60.8 million for capital assets in fiscal year 2013-14, but were offset by the capital debt proceeds of $69.0 million. Debt service
was $36.6 million in fiscal year 2013-14. Capital appropriations of $14.2 million were also a major component in fiscal year
2013-14.
Cash flows from investing activities, most of which consists of reinvesting the proceeds from investments as they mature,
resulted in a net decrease in cash of $39.4 million as more funds were placed in long term investments at June 30, 2014,
compared to June 30, 2013, while cash and cash equivalents were reduced by $22.2 million.
Management’s Discussion and Analysis
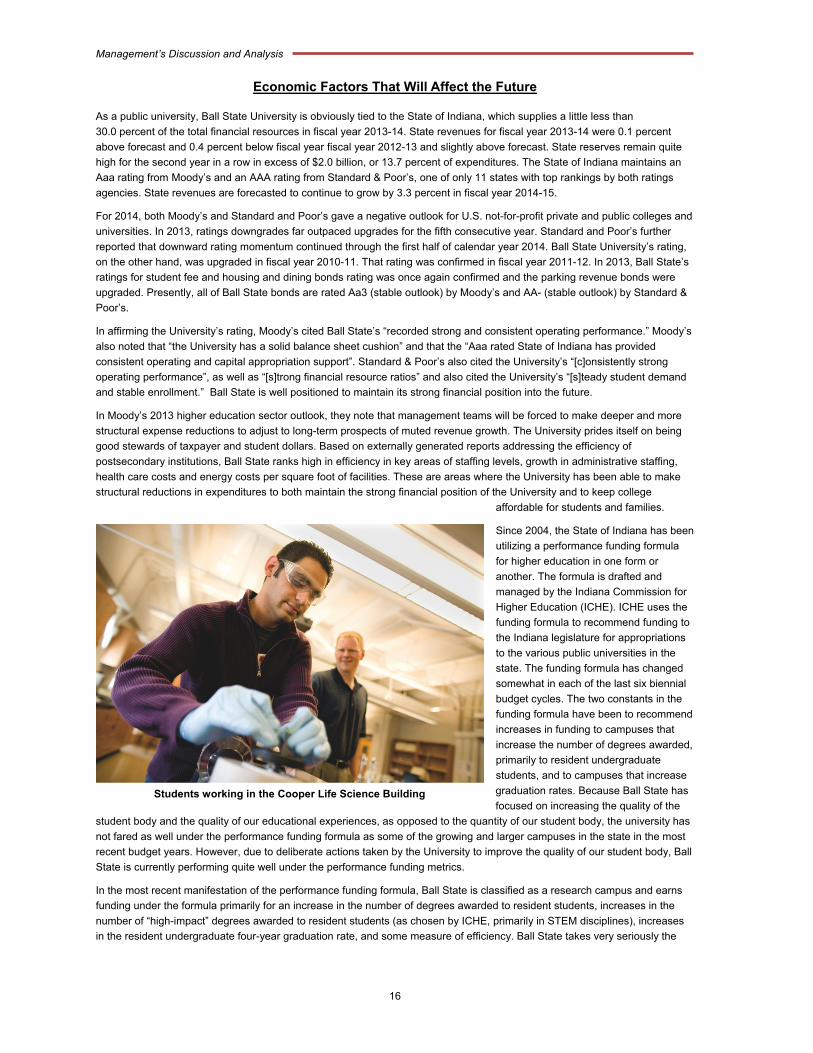
16
Students working in the Cooper Life Science Building
Economic Factors That Will Affect the Future
As a public university, Ball State University is obviously tied to the State of Indiana, which supplies a little less than
30.0 percent of the total financial resources in fiscal year 2013-14. State revenues for fiscal year 2013-14 were 0.1 percent
above forecast and 0.4 percent below fiscal year fiscal year 2012-13 and slightly above forecast. State reserves remain quite
high for the second year in a row in excess of $2.0 billion, or 13.7 percent of expenditures. The State of Indiana maintains an
Aaa rating from Moody’s and an AAA rating from Standard & Poor’s, one of only 11 states with top rankings by both ratings
agencies. State revenues are forecasted to continue to grow by 3.3 percent in fiscal year 2014-15.
For 2014, both Moody’s and Standard and Poor’s gave a negative outlook for U.S. not-for-profit private and public colleges and
universities. In 2013, ratings downgrades far outpaced upgrades for the fifth consecutive year. Standard and Poor’s further
reported that downward rating momentum continued through the first half of calendar year 2014. Ball State University’s rating,
on the other hand, was upgraded in fiscal year 2010-11. That rating was confirmed in fiscal year 2011-12. In 2013, Ball State’s
ratings for student fee and housing and dining bonds rating was once again confirmed and the parking revenue bonds were
upgraded. Presently, all of Ball State bonds are rated Aa3 (stable outlook) by Moody’s and AA- (stable outlook) by Standard &
Poor’s.
In affirming the University’s rating, Moody’s cited Ball State’s “recorded strong and consistent operating performance.” Moody’s
also noted that “the University has a solid balance sheet cushion” and that the “Aaa rated State of Indiana has provided
consistent operating and capital appropriation support”. Standard & Poor’s also cited the University’s “[c]onsistently strong
operating performance”, as well as “[s]trong financial resource ratios” and also cited the University’s “[s]teady student demand
and stable enrollment.” Ball State is well positioned to maintain its strong financial position into the future.
In Moody’s 2013 higher education sector outlook, they note that management teams will be forced to make deeper and more
structural expense reductions to adjust to long-term prospects of muted revenue growth. The University prides itself on being
good stewards of taxpayer and student dollars. Based on externally generated reports addressing the efficiency of
postsecondary institutions, Ball State ranks high in efficiency in key areas of staffing levels, growth in administrative staffing,
health care costs and energy costs per square foot of facilities. These are areas where the University has been able to make
structural reductions in expenditures to both maintain the strong financial position of the University and to keep college
affordable for students and families.
Since 2004, the State of Indiana has been
utilizing a performance funding formula
for higher education in one form or
another. The formula is drafted and
managed by the Indiana Commission for
Higher Education (ICHE). ICHE uses the
funding formula to recommend funding to
the Indiana legislature for appropriations
to the various public universities in the
state. The funding formula has changed
somewhat in each of the last six biennial
budget cycles. The two constants in the
funding formula have been to recommend
increases in funding to campuses that
increase the number of degrees awarded,
primarily to resident undergraduate
students, and to campuses that increase
graduation rates. Because Ball State has
focused on increasing the quality of the
student body and the quality of our educational experiences, as opposed to the quantity of our student body, the university has
not fared as well under the performance funding formula as some of the growing and larger campuses in the state in the most
recent budget years. However, due to deliberate actions taken by the University to improve the quality of our student body, Ball
State is currently performing quite well under the performance funding metrics.
In the most recent manifestation of the performance funding formula, Ball State is classified as a research campus and earns
funding under the formula primarily for an increase in the number of degrees awarded to resident students, increases in the
number of “high-impact” degrees awarded to resident students (as chosen by ICHE, primarily in STEM disciplines), increases
in the resident undergraduate four-year graduation rate, and some measure of efficiency. Ball State takes very seriously the
Management’s Discussion and Analysis
17
goals set forth by ICHE in creating their budget recommendations. With an eye toward increasing the amount of funding that
Ball State receives under the Performance Funding formula, while being true to our strategic direction of becoming better and
not bigger, the University continues to focus on enrolling students who are increasingly better academically prepared. In part
because of our increasing selectivity in student admissions, and in part through a concerted set of policy initiatives, the
University’s graduation and retention rates have been growing steadily and substantially. In fact, the Chronicle of Higher
Education found that between 2002 and 2008, Ball State showed the sixth highest improvement in six-year graduation rate of
any public research university in the country. In addition, since 2002, Ball State has had the fastest growing four-year
graduation rate among all Indiana public universities.
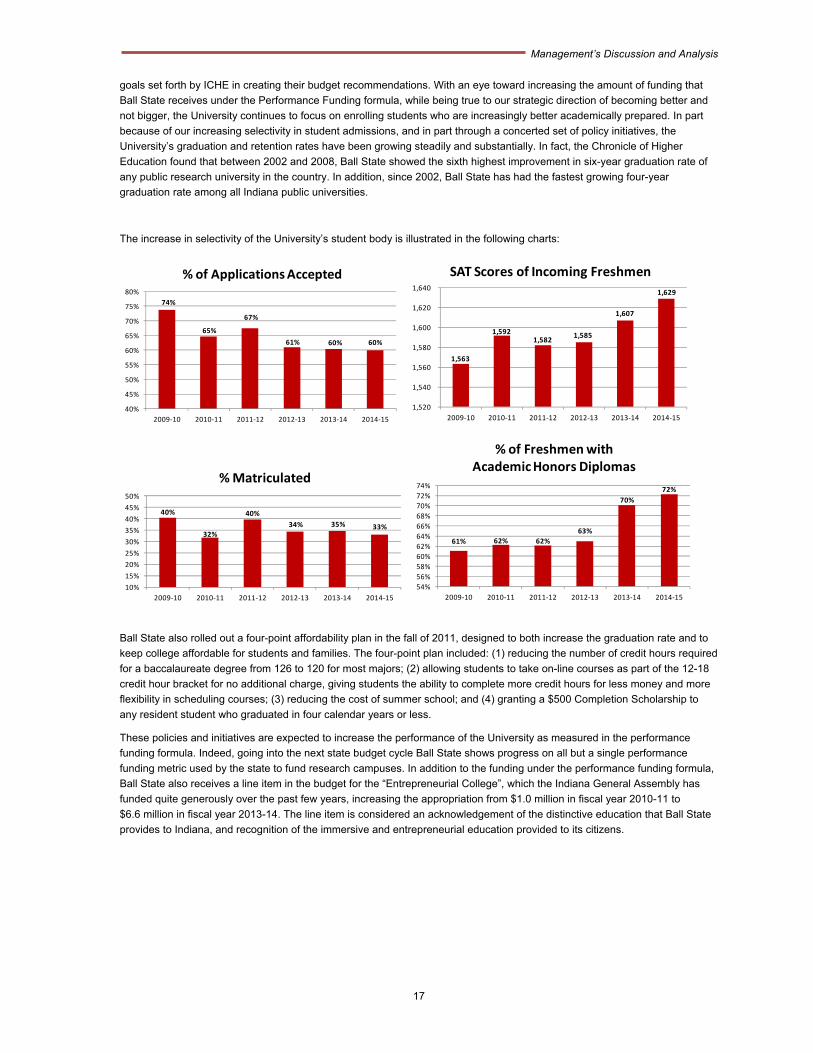
The increase in selectivity of the University’s student body is illustrated in the following charts:
74%
65%
67%
61% 60% 60%
40%
45%
50%
55%
60%
65%
70%
75%
80%
2009‐10 2010‐11 2011‐12 2012‐13 2013‐14 2014‐15
% of Applications Accepted
1,563
1,592 1,582
1,585
1,607
1,629
1,520
1,540
1,560
1,580
1,600
1,620
1,640
2009‐10 2010‐11 2011‐12 2012‐13 2013‐14 2014‐15
SAT Scores of Incoming Freshmen
40%
32%
40%
34% 35% 33%
10%
15%
20%
25%
30%
35%
40%
45%
50%
2009‐10 2010‐11 2011‐12 2012‐13 2013‐14 2014‐15
% Matriculated
61% 62% 62%
63%
70%
72%
54%
56%
58%
60%
62%
64%
66%
68%
70%
72%
74%
2009‐10 2010‐11 2011‐12 2012‐13 2013‐14 2014‐15
% of Freshmen withAcademic Honors Diplomas
Ball State also rolled out a four-point affordability plan in the fall of 2011, designed to both increase the graduation rate and to
keep college affordable for students and families. The four-point plan included: (1) reducing the number of credit hours required
for a baccalaureate degree from 126 to 120 for most majors; (2) allowing students to take on-line courses as part of the 12-18
credit hour bracket for no additional charge, giving students the ability to complete more credit hours for less money and more
flexibility in scheduling courses; (3) reducing the cost of summer school; and (4) granting a $500 Completion Scholarship to
any resident student who graduated in four calendar years or less.
These policies and initiatives are expected to increase the performance of the University as measured in the performance
funding formula. Indeed, going into the next state budget cycle Ball State shows progress on all but a single performance
funding metric used by the state to fund research campuses. In addition to the funding under the performance funding formula,
Ball State also receives a line item in the budget for the “Entrepreneurial College”, which the Indiana General Assembly has
funded quite generously over the past few years, increasing the appropriation from $1.0 million in fiscal year 2010-11 to
$6.6 million in fiscal year 2013-14. The line item is considered an acknowledgement of the distinctive education that Ball State
provides to Indiana, and recognition of the immersive and entrepreneurial education provided to its citizens.
Management’s Discussion and Analysis
18
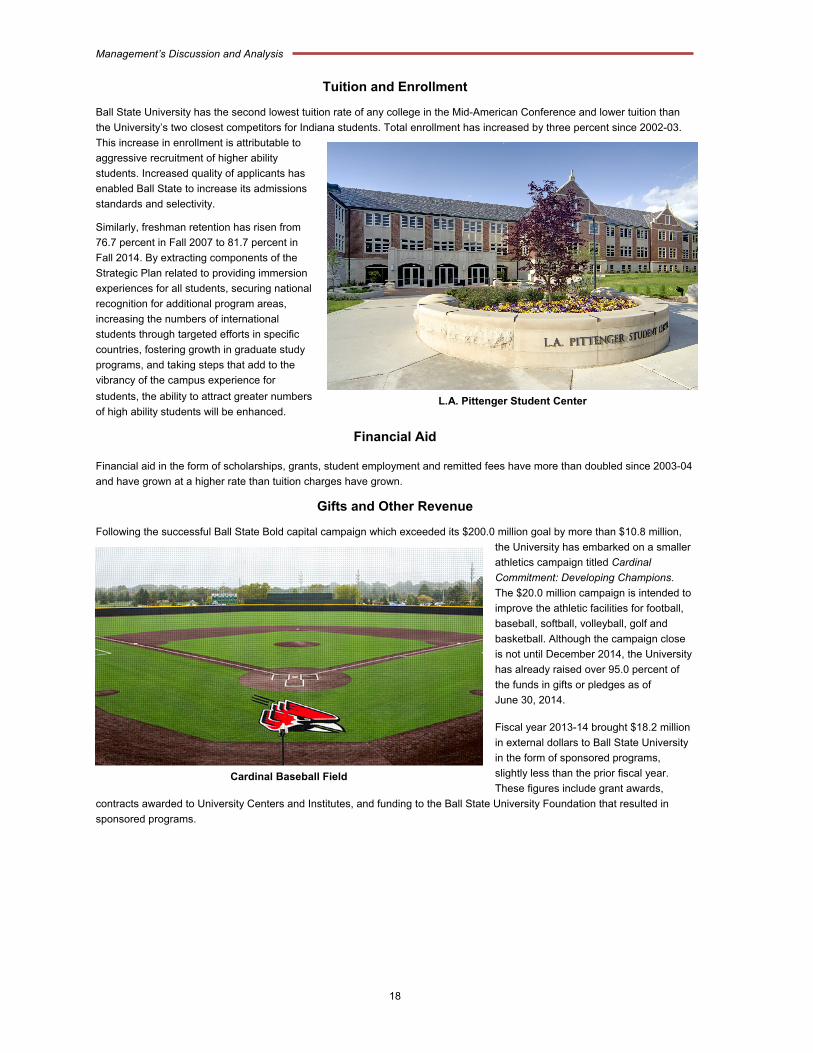
Cardinal Baseball Field
L.A. Pittenger Student Center
Tuition and Enrollment
Ball State University has the second lowest tuition rate of any college in the Mid-American Conference and lower tuition than
the University’s two closest competitors for Indiana students. Total enrollment has increased by three percent since 2002-03.
This increase in enrollment is attributable to
aggressive recruitment of higher ability
students. Increased quality of applicants has
enabled Ball State to increase its admissions
standards and selectivity.
Similarly, freshman retention has risen from
76.7 percent in Fall 2007 to 81.7 percent in
Fall 2014. By extracting components of the
Strategic Plan related to providing immersion
experiences for all students, securing national
recognition for additional program areas,
increasing the numbers of international
students through targeted efforts in specific
countries, fostering growth in graduate study
programs, and taking steps that add to the
vibrancy of the campus experience for
students, the ability to attract greater numbers
of high ability students will be enhanced.
Financial Aid
Financial aid in the form of scholarships, grants, student employment and remitted fees have more than doubled since 2003-04
and have grown at a higher rate than tuition charges have grown.
Gifts and Other Revenue
Following the successful Ball State Bold capital campaign which exceeded its $200.0 million goal by more than $10.8 million,
the University has embarked on a smaller
athletics campaign titled Cardinal
Commitment: Developing Champions.
The $20.0 million campaign is intended to
improve the athletic facilities for football,
baseball, softball, volleyball, golf and
basketball. Although the campaign close
is not until December 2014, the University
has already raised over 95.0 percent of
the funds in gifts or pledges as of
June 30, 2014.
Fiscal year 2013-14 brought $18.2 million
in external dollars to Ball State University
in the form of sponsored programs,
slightly less than the prior fiscal year.
These figures include grant awards,
contracts awarded to University Centers and Institutes, and funding to the Ball State University Foundation that resulted in
sponsored programs.
Management’s Discussion and Analysis
19
Conclusion
In summary, as the financial statements indicate, the University has been an effective steward of the human, physical and
financial resources entrusted to it, based on a planned approach to addressing long-term needs and liabilities while facing
shorter-term challenges not unlike other public institutions nationwide. In addition, Ball State’s distinctive educational offerings,
solid financial position, efficient operations and growing reputation make the University well positioned for the future. With the
2007-12 Strategic Plan now completed and the new 2012-17 Strategic Plan well underway, the University has a solid plan for
the future. When all of this is taken into consideration, Ball State University remains in a strong position to be a major asset of
significant benefit to the citizens of the State of Indiana.

20
This page intentionally left blank
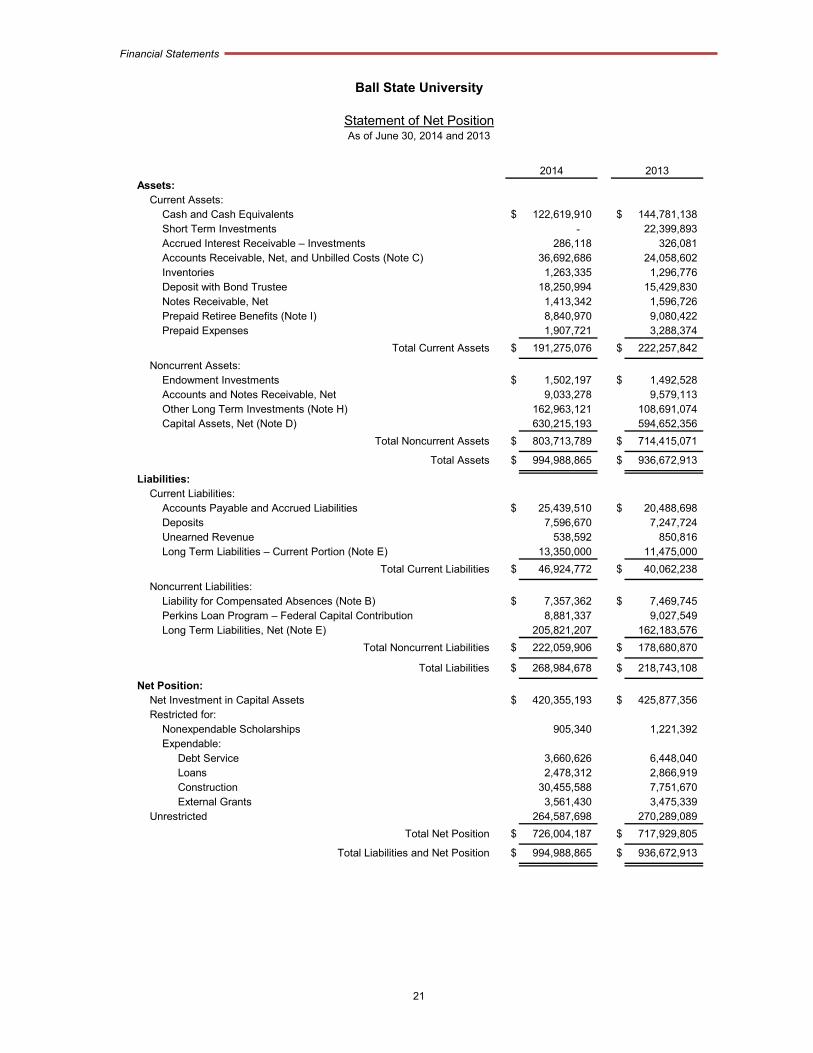
Financial Statements
21
Assets:Current Assets:
Cash and Cash Equivalents $ 122,619,910 $ 144,781,138 Short Term Investments - 22,399,893 Accrued Interest Receivable – Investments 286,118 326,081 Accounts Receivable, Net, and Unbilled Costs (Note C) 36,692,686 24,058,602 Inventories 1,263,335 1,296,776 Deposit with Bond Trustee 18,250,994 15,429,830 Notes Receivable, Net 1,413,342 1,596,726 Prepaid Retiree Benefits (Note I) 8,840,970 9,080,422 Prepaid Expenses 1,907,721 3,288,374
Total Current Assets $ 191,275,076 $ 222,257,842
Noncurrent Assets:Endowment Investments $ 1,502,197 $ 1,492,528 Accounts and Notes Receivable, Net 9,033,278 9,579,113 Other Long Term Investments (Note H) 162,963,121 108,691,074 Capital Assets, Net (Note D) 630,215,193 594,652,356
Total Noncurrent Assets $ 803,713,789 $ 714,415,071
Total Assets $ 994,988,865 $ 936,672,913
Liabilities:Current Liabilities:
Accounts Payable and Accrued Liabilities $ 25,439,510 $ 20,488,698 Deposits 7,596,670 7,247,724 Unearned Revenue 538,592 850,816 Long Term Liabilities – Current Portion (Note E) 13,350,000 11,475,000
Total Current Liabilities $ 46,924,772 $ 40,062,238
Noncurrent Liabilities:Liability for Compensated Absences (Note B) $ 7,357,362 $ 7,469,745 Perkins Loan Program – Federal Capital Contribution 8,881,337 9,027,549 Long Term Liabilities, Net (Note E) 205,821,207 162,183,576
Total Noncurrent Liabilities $ 222,059,906 $ 178,680,870
Total Liabilities $ 268,984,678 $ 218,743,108
Net Position: Net Investment in Capital Assets $ 420,355,193 $ 425,877,356 Restricted for:
Nonexpendable Scholarships 905,340 1,221,392 Expendable:
Debt Service 3,660,626 6,448,040 Loans 2,478,312 2,866,919 Construction 30,455,588 7,751,670 External Grants 3,561,430 3,475,339
Unrestricted 264,587,698 270,289,089
Total Net Position $ 726,004,187 $ 717,929,805
Total Liabilities and Net Position $ 994,988,865 $ 936,672,913
Ball State University
20132014
Statement of Net PositionAs of June 30, 2014 and 2013
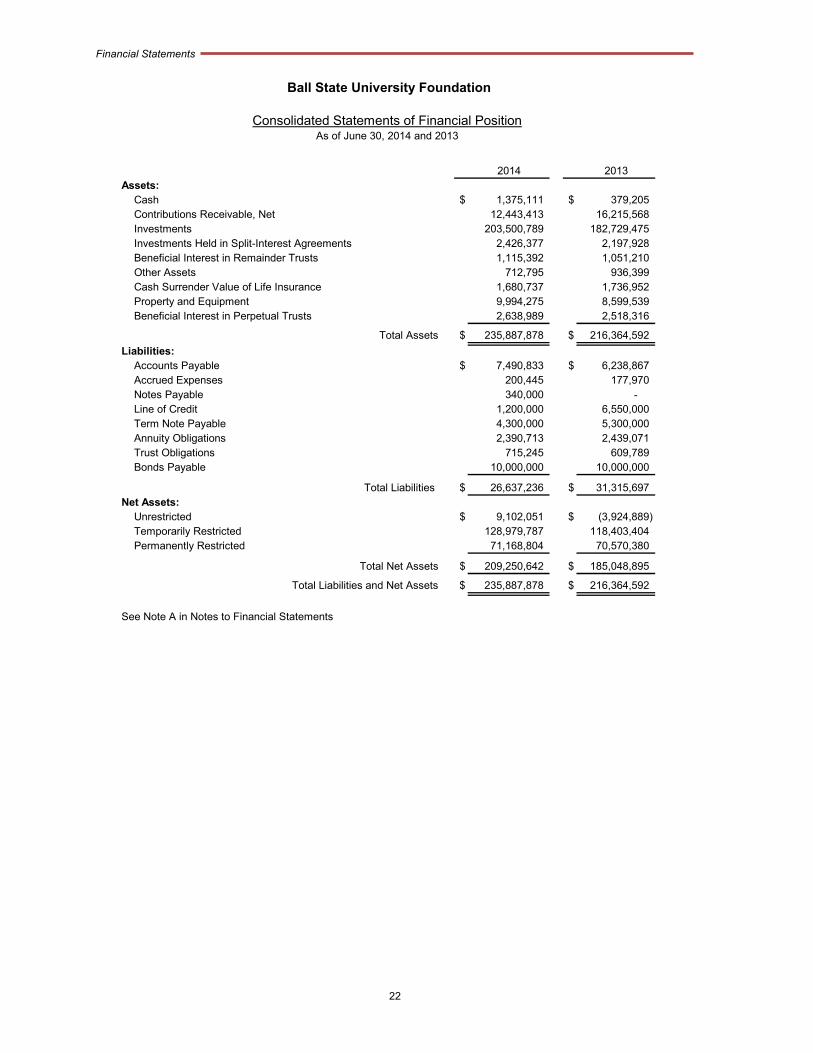
Financial Statements
22
2014 2013Assets:
Cash $ 1,375,111 $ 379,205 Contributions Receivable, Net 12,443,413 16,215,568 Investments 203,500,789 182,729,475 Investments Held in Split-Interest Agreements 2,426,377 2,197,928 Beneficial Interest in Remainder Trusts 1,115,392 1,051,210 Other Assets 712,795 936,399 Cash Surrender Value of Life Insurance 1,680,737 1,736,952 Property and Equipment 9,994,275 8,599,539 Beneficial Interest in Perpetual Trusts 2,638,989 2,518,316
Total Assets $ 235,887,878 $ 216,364,592
Liabilities:Accounts Payable $ 7,490,833 $ 6,238,867 Accrued Expenses 200,445 177,970 Notes Payable 340,000 - Line of Credit 1,200,000 6,550,000 Term Note Payable 4,300,000 5,300,000 Annuity Obligations 2,390,713 2,439,071 Trust Obligations 715,245 609,789 Bonds Payable 10,000,000 10,000,000
Total Liabilities $ 26,637,236 $ 31,315,697 Net Assets:
Unrestricted $ 9,102,051 $ (3,924,889) Temporarily Restricted 128,979,787 118,403,404 Permanently Restricted 71,168,804 70,570,380
Total Net Assets $ 209,250,642 $ 185,048,895
Total Liabilities and Net Assets $ 235,887,878 $ 216,364,592
See Note A in Notes to Financial Statements
Ball State University Foundation
As of June 30, 2014 and 2013Consolidated Statements of Financial Position
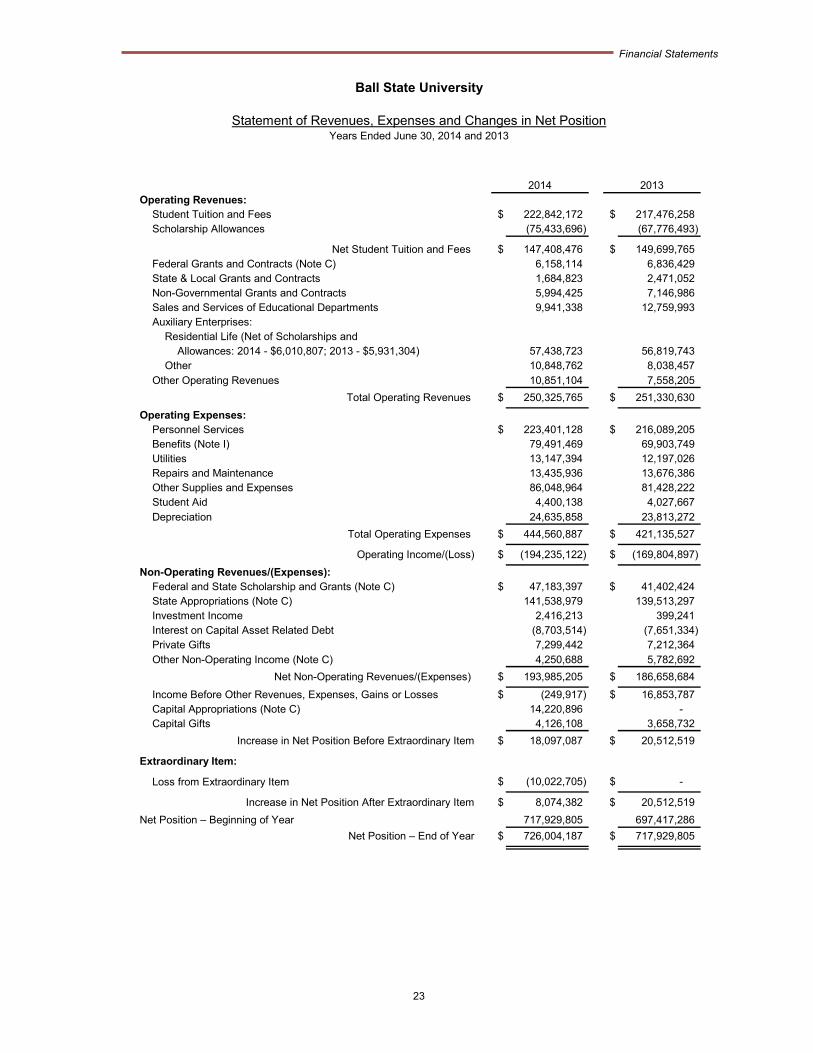
Financial Statements
23
Operating Revenues:Student Tuition and Fees $ 222,842,172 $ 217,476,258 Scholarship Allowances (75,433,696) (67,776,493)
Net Student Tuition and Fees $ 147,408,476 $ 149,699,765 Federal Grants and Contracts (Note C) 6,158,114 6,836,429 State & Local Grants and Contracts 1,684,823 2,471,052 Non-Governmental Grants and Contracts 5,994,425 7,146,986 Sales and Services of Educational Departments 9,941,338 12,759,993 Auxiliary Enterprises:
Residential Life (Net of Scholarships and Allowances: 2014 - $6,010,807; 2013 - $5,931,304) 57,438,723 56,819,743
Other 10,848,762 8,038,457 Other Operating Revenues 10,851,104 7,558,205
Total Operating Revenues $ 250,325,765 $ 251,330,630
Operating Expenses:Personnel Services $ 223,401,128 $ 216,089,205 Benefits (Note I) 79,491,469 69,903,749 Utilities 13,147,394 12,197,026 Repairs and Maintenance 13,435,936 13,676,386 Other Supplies and Expenses 86,048,964 81,428,222 Student Aid 4,400,138 4,027,667 Depreciation 24,635,858 23,813,272
Total Operating Expenses $ 444,560,887 $ 421,135,527
Operating Income/(Loss) $ (194,235,122) $ (169,804,897)
Non-Operating Revenues/(Expenses):Federal and State Scholarship and Grants (Note C) $ 47,183,397 $ 41,402,424 State Appropriations (Note C) 141,538,979 139,513,297 Investment Income 2,416,213 399,241 Interest on Capital Asset Related Debt (8,703,514) (7,651,334) Private Gifts 7,299,442 7,212,364 Other Non-Operating Income (Note C) 4,250,688 5,782,692
Net Non-Operating Revenues/(Expenses) $ 193,985,205 $ 186,658,684
Income Before Other Revenues, Expenses, Gains or Losses $ (249,917) $ 16,853,787 Capital Appropriations (Note C) 14,220,896 - Capital Gifts 4,126,108 3,658,732
$ 18,097,087 $ 20,512,519
Extraordinary Item:
Loss from Extraordinary Item $ (10,022,705) $ -
$ 8,074,382 $ 20,512,519
717,929,805 697,417,286
Net Position – End of Year $ 726,004,187 $ 717,929,805
Ball State University
Increase in Net Position Before Extraordinary Item
Net Position – Beginning of Year
20132014
Years Ended June 30, 2014 and 2013Statement of Revenues, Expenses and Changes in Net Position
Increase in Net Position After Extraordinary Item
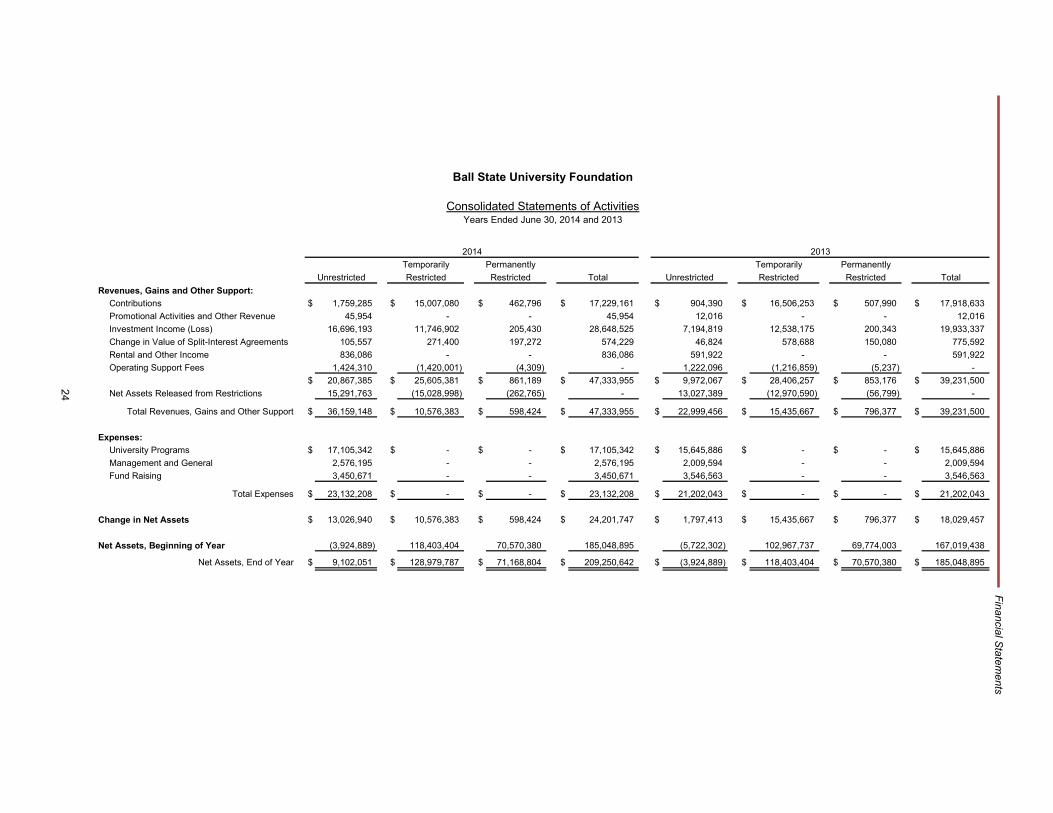
Revenues, Gains and Other Support:
Contributions $ 1,759,285 $ 15,007,080 $ 462,796 $ 17,229,161 $ 904,390 $ 16,506,253 $ 507,990 $ 17,918,633
Promotional Activities and Other Revenue 45,954 - - 45,954 12,016 - - 12,016
Investment Income (Loss) 16,696,193 11,746,902 205,430 28,648,525 7,194,819 12,538,175 200,343 19,933,337
Change in Value of Split-Interest Agreements 105,557 271,400 197,272 574,229 46,824 578,688 150,080 775,592
Rental and Other Income 836,086 - - 836,086 591,922 - - 591,922
Operating Support Fees 1,424,310 (1,420,001) (4,309) - 1,222,096 (1,216,859) (5,237) -
$ 20,867,385 $ 25,605,381 $ 861,189 $ 47,333,955 $ 9,972,067 $ 28,406,257 $ 853,176 $ 39,231,500
Net Assets Released from Restrictions 15,291,763 (15,028,998) (262,765) - 13,027,389 (12,970,590) (56,799) -
Total Revenues, Gains and Other Support $ 36,159,148 $ 10,576,383 $ 598,424 $ 47,333,955 $ 22,999,456 $ 15,435,667 $ 796,377 $ 39,231,500
Expenses:
University Programs $ 17,105,342 $ - $ - $ 17,105,342 $ 15,645,886 $ - $ - $ 15,645,886
Management and General 2,576,195 - - 2,576,195 2,009,594 - - 2,009,594
Fund Raising 3,450,671 - - 3,450,671 3,546,563 - - 3,546,563
Total Expenses $ 23,132,208 $ - $ - $ 23,132,208 $ 21,202,043 $ - $ - $ 21,202,043
Change in Net Assets $ 13,026,940 $ 10,576,383 $ 598,424 $ 24,201,747 $ 1,797,413 $ 15,435,667 $ 796,377 $ 18,029,457
Net Assets, Beginning of Year (3,924,889) 118,403,404 70,570,380 185,048,895 (5,722,302) 102,967,737 69,774,003 167,019,438
Net Assets, End of Year $ 9,102,051 $ 128,979,787 $ 71,168,804 $ 209,250,642 $ (3,924,889) $ 118,403,404 $ 70,570,380 $ 185,048,895
Years Ended June 30, 2014 and 2013Consolidated Statements of Activities
2013
Ball State University Foundation
Restricted
Permanently
2014
Total Total
Temporarily Permanently
Restricted RestrictedUnrestricted Restricted Unrestricted
Temporarily
24
Financial S
tatements
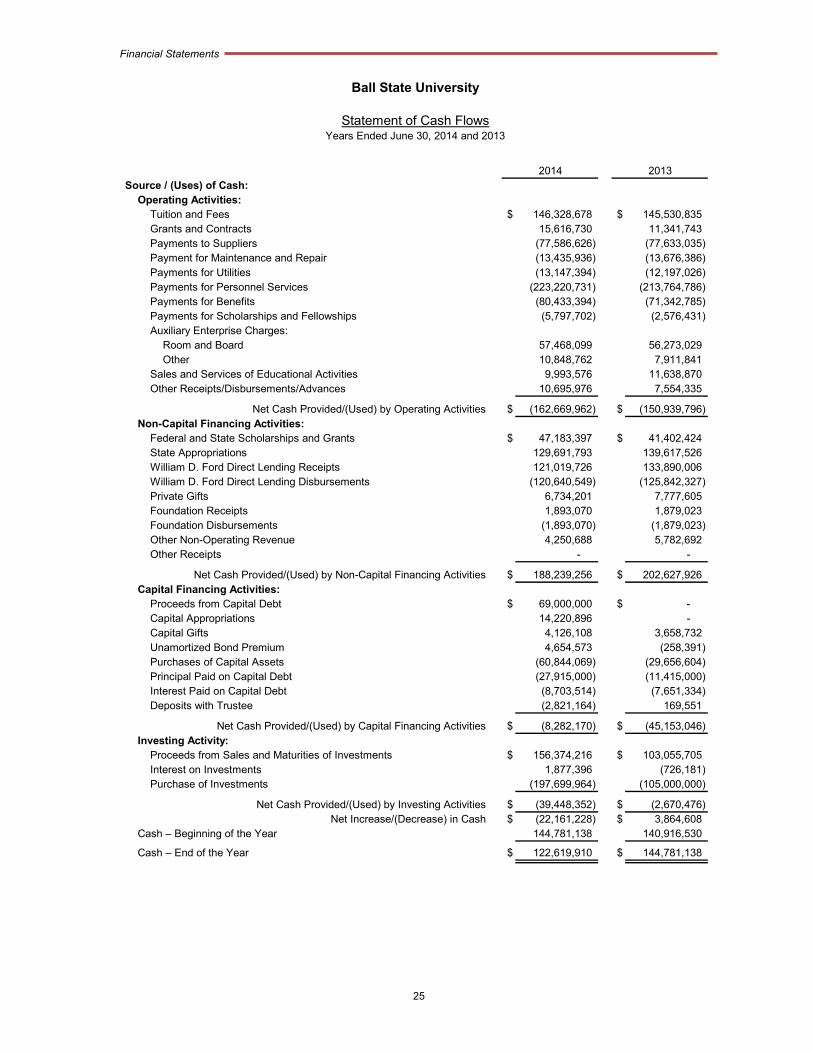
Financial Statements
25
Source / (Uses) of Cash:Operating Activities:
Tuition and Fees $ 146,328,678 $ 145,530,835 Grants and Contracts 15,616,730 11,341,743 Payments to Suppliers (77,586,626) (77,633,035) Payment for Maintenance and Repair (13,435,936) (13,676,386) Payments for Utilities (13,147,394) (12,197,026) Payments for Personnel Services (223,220,731) (213,764,786) Payments for Benefits (80,433,394) (71,342,785) Payments for Scholarships and Fellowships (5,797,702) (2,576,431) Auxiliary Enterprise Charges:
Room and Board 57,468,099 56,273,029 Other 10,848,762 7,911,841
Sales and Services of Educational Activities 9,993,576 11,638,870 Other Receipts/Disbursements/Advances 10,695,976 7,554,335
Net Cash Provided/(Used) by Operating Activities $ (162,669,962) $ (150,939,796) Non-Capital Financing Activities:
Federal and State Scholarships and Grants $ 47,183,397 $ 41,402,424 State Appropriations 129,691,793 139,617,526 William D. Ford Direct Lending Receipts 121,019,726 133,890,006 William D. Ford Direct Lending Disbursements (120,640,549) (125,842,327) Private Gifts 6,734,201 7,777,605 Foundation Receipts 1,893,070 1,879,023 Foundation Disbursements (1,893,070) (1,879,023) Other Non-Operating Revenue 4,250,688 5,782,692 Other Receipts - -
Net Cash Provided/(Used) by Non-Capital Financing Activities $ 188,239,256 $ 202,627,926 Capital Financing Activities:
Proceeds from Capital Debt $ 69,000,000 $ - Capital Appropriations 14,220,896 -
Capital Gifts 4,126,108 3,658,732 Unamortized Bond Premium 4,654,573 (258,391) Purchases of Capital Assets (60,844,069) (29,656,604) Principal Paid on Capital Debt (27,915,000) (11,415,000) Interest Paid on Capital Debt (8,703,514) (7,651,334) Deposits with Trustee (2,821,164) 169,551
Net Cash Provided/(Used) by Capital Financing Activities $ (8,282,170) $ (45,153,046) Investing Activity:
Proceeds from Sales and Maturities of Investments $ 156,374,216 $ 103,055,705 Interest on Investments 1,877,396 (726,181) Purchase of Investments (197,699,964) (105,000,000)
Net Cash Provided/(Used) by Investing Activities $ (39,448,352) $ (2,670,476) Net Increase/(Decrease) in Cash $ (22,161,228) $ 3,864,608
Cash – Beginning of the Year 144,781,138 140,916,530
Cash – End of the Year $ 122,619,910 $ 144,781,138
Ball State University
Years Ended June 30, 2014 and 2013Statement of Cash Flows
2014 2013
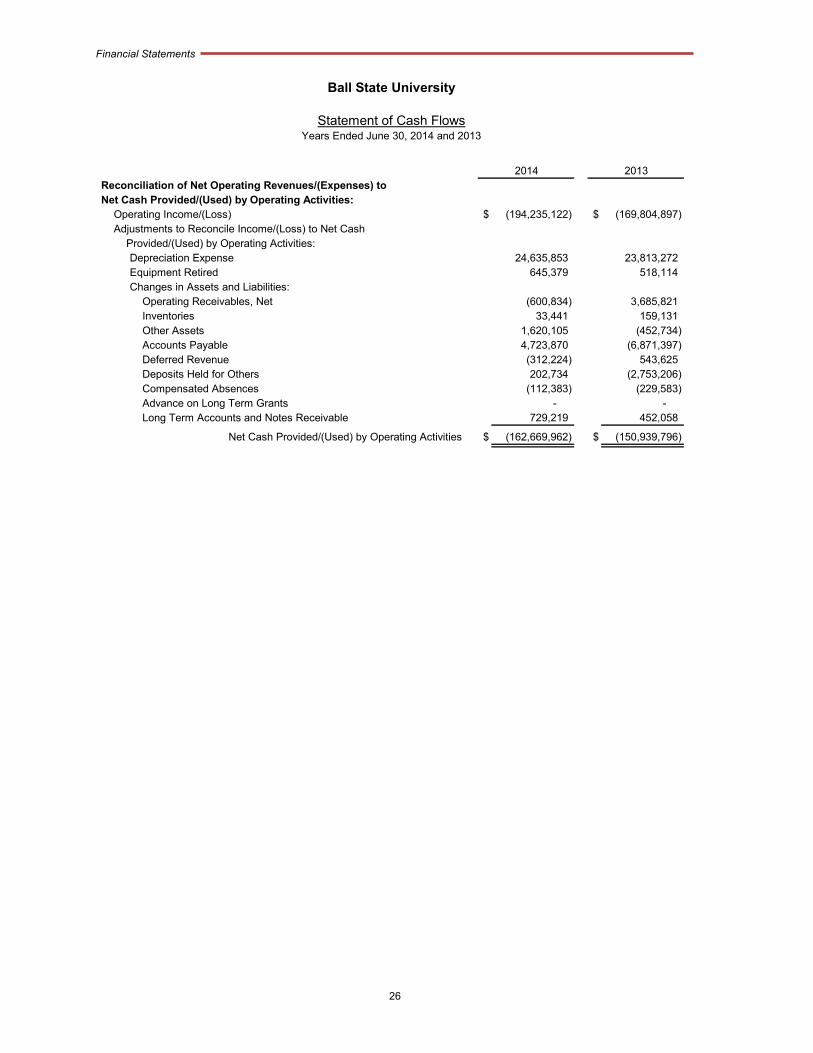
Financial Statements
26
Reconciliation of Net Operating Revenues/(Expenses) to Net Cash Provided/(Used) by Operating Activities:
Operating Income/(Loss) $ (194,235,122) $ (169,804,897) Adjustments to Reconcile Income/(Loss) to Net Cash
Provided/(Used) by Operating Activities:Depreciation Expense 24,635,853 23,813,272 Equipment Retired 645,379 518,114 Changes in Assets and Liabilities:
Operating Receivables, Net (600,834) 3,685,821 Inventories 33,441 159,131 Other Assets 1,620,105 (452,734) Accounts Payable 4,723,870 (6,871,397) Deferred Revenue (312,224) 543,625 Deposits Held for Others 202,734 (2,753,206) Compensated Absences (112,383) (229,583) Advance on Long Term Grants - - Long Term Accounts and Notes Receivable 729,219 452,058
Net Cash Provided/(Used) by Operating Activities $ (162,669,962) $ (150,939,796)
2014 2013
Years Ended June 30, 2014 and 2013
Ball State University
Statement of Cash Flows
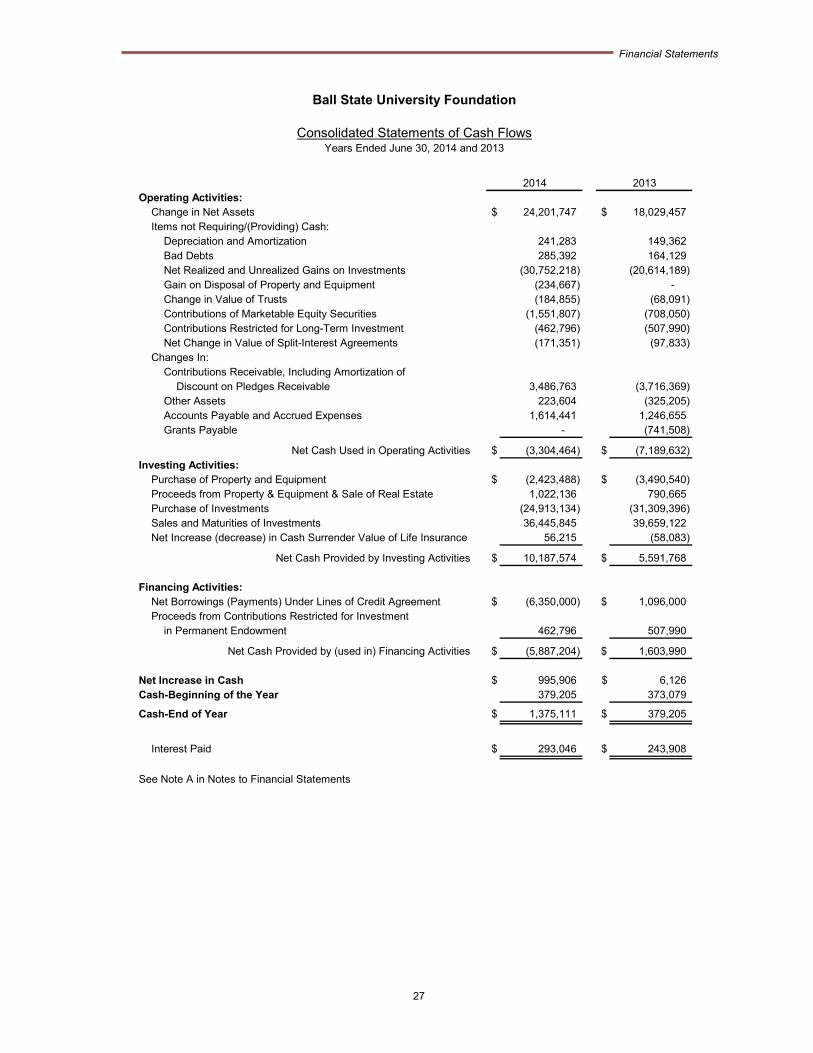
Financial Statements
27
Operating Activities:Change in Net Assets $ 24,201,747 $ 18,029,457 Items not Requiring/(Providing) Cash:
Depreciation and Amortization 241,283 149,362 Bad Debts 285,392 164,129 Net Realized and Unrealized Gains on Investments (30,752,218) (20,614,189) Gain on Disposal of Property and Equipment (234,667) - Change in Value of Trusts (184,855) (68,091) Contributions of Marketable Equity Securities (1,551,807) (708,050) Contributions Restricted for Long-Term Investment (462,796) (507,990) Net Change in Value of Split-Interest Agreements (171,351) (97,833)
Changes In:Contributions Receivable, Including Amortization of
Discount on Pledges Receivable 3,486,763 (3,716,369) Other Assets 223,604 (325,205) Accounts Payable and Accrued Expenses 1,614,441 1,246,655 Grants Payable - (741,508)
Net Cash Used in Operating Activities $ (3,304,464) $ (7,189,632) Investing Activities:
Purchase of Property and Equipment $ (2,423,488) $ (3,490,540) Proceeds from Property & Equipment & Sale of Real Estate 1,022,136 790,665 Purchase of Investments (24,913,134) (31,309,396) Sales and Maturities of Investments 36,445,845 39,659,122 Net Increase (decrease) in Cash Surrender Value of Life Insurance 56,215 (58,083)
Net Cash Provided by Investing Activities $ 10,187,574 $ 5,591,768
Financing Activities:Net Borrowings (Payments) Under Lines of Credit Agreement $ (6,350,000) $ 1,096,000 Proceeds from Contributions Restricted for Investment
in Permanent Endowment 462,796 507,990
Net Cash Provided by (used in) Financing Activities $ (5,887,204) $ 1,603,990
Net Increase in Cash $ 995,906 $ 6,126 Cash-Beginning of the Year 379,205 373,079
Cash-End of Year $ 1,375,111 $ 379,205
Interest Paid $ 293,046 $ 243,908
See Note A in Notes to Financial Statements
20132014
Ball State University Foundation
Years Ended June 30, 2014 and 2013Consolidated Statements of Cash Flows
28
Ball State University Notes to Financial Statements
June 30, 2014
Note A – Significant Accounting Policies
Reporting Entity
Ball State University (University) is a public institution of higher education governed by a nine-member Board of Trustees in
accordance with IC 21-19-3. The University is considered to be a component unit of the State of Indiana. The Governor of
Indiana appoints the Trustees, one of whom is a full-time student at the University and two of whom are nominated or selected
by the Ball State University Alumni Association. All members of the Board of Trustees are appointed for terms of four years,
except for the student member whose term is two years. No more than six of the non-student Trustees may be of the same
sex, and at least one of them must be a resident of Delaware County, Indiana.
The University is included in the State’s financial statements as a discrete component unit. Transactions with the State of
Indiana relate primarily to: appropriations for operations, repairs and rehabilitations, and debt service for academic buildings;
appropriations and other revenues for operation of the Indiana Academy for Science, Mathematics, and Humanities; grants for
other purposes; and payments to State retirement programs for University employees.
Financial Statements
The financial statements of the University are prepared in accordance with the principles outlined in Statement No. 35 of the
Governmental Accounting Standards Board (GASB). The University has elected to report its financial results as a special-
purpose government engaged only in business-type activities, using proprietary fund accounting and financial reporting.
Required financial statements consist of:
Management’s Discussion and Analysis
Statement of Net Position
Statement of Revenues, Expenses and Changes in Net Position
Statement of Cash Flows
Notes to Financial Statements
Required Supplemental Information other than Management Discussion and Analysis.
The financial statements have been prepared using the economic resource measurement focus and the accrual basis of
accounting with the following exceptions, which are common practices in colleges and universities:
Interest on student loans is recorded only when received.
Gifts are recorded when received.
Major sources of revenues recorded in advance of the year in which the predominant amount of service is rendered are
classified as unearned income on the Statement of Net Position. Advances on exchange activities are recorded as unearned
income. All other earned receipts are reported as revenue in the period they are received. Internal service activity revenues,
including overhead charges, are offset against the expenses of internal service activities. Restricted and unrestricted resources
are spent and tracked at the discretion of the department within the guidelines of donor restrictions.
Notes to Financial Statements
29
Operating Revenues/Expenses
Operating revenues encompass all revenues from exchange transactions arising from the activities necessary to carry out the
primary mission of the University, including tuition and fees, grants and contracts, sales and services of educational
departments and auxiliary enterprises net revenues. Revenues from investing activities, Ball State University Foundation
donations, federal and state financial aid, and state appropriations are considered to be non-operating revenue.
Operating expenses encompass all expenses paid to acquire goods and services provided in return for operating revenues and
to carry out the mission of the University. Examples include personnel services, benefits, and other supplies and expenses.
Expenses are reported using natural classifications in the Statement of Revenues, Expenses and Changes in Net Position.
Student Tuition and Fees
Student tuition and fees are net of scholarship allowances funded from University funds as well as scholarships and fellowships
funded from federal, state and other grants, to the extent that these funds offset all or a portion of each student’s tuition and
fees. Scholarships and grants awarded by third parties directly to students without University involvement in the decision-
making process are not treated as a reduction of tuition and fees but rather as a source of direct payment.
The University conducts summer classes, which for billing purposes consist of two five-week summer sessions and a ten-week
summer semester. The first summer session takes place during May and June, while the second summer session takes place
during June and July, with slightly more days falling in July. The summer semester takes place during the two summer
sessions. Bills are due on June 1. By June 30, students have exhausted most of their rights to any refund of tuition and fees.
Therefore, all summer tuition and fees are reported as revenue for the year ended June 30 of that summer. Faculty salaries for
summer are paid in June for first summer session and half of summer semester and in July for second summer session and
the second half of summer semester.
Cash and Investments
Investments are reported at fair value. Investments with a maturity date of one year or less are considered to be short-term
investments, with the exception of those with a maturity date of three months or less, which are considered to be cash
equivalents. All other investments are considered to be long-term.
Accounts Receivable and Notes Receivable
Accounts Receivable and Notes Receivable are both reported net of a calculated reserve for uncollectible items. The reserves
as of June 30, 2014, and June 30, 2013, were $7,276,948 and $7,217,258 respectively for accounts receivable. For notes
receivable, the reserves were $2,263,265 and $2,045,265 for the same dates.
Inventories
Inventories are stated at the lower of cost or market value, based on a physical count. Cost is based on purchases, and
determined on a moving average basis for Central Stores and a first-in, first-out basis for all other inventories.
Notes to Financial Statements
30
Capital Assets
Capital assets consist of land and land improvements, infrastructure, buildings and building improvements, construction in
progress, and equipment and are recorded at cost or, for contributed assets, at fair value at the date of acquisition. Additionally,
in accordance with GASB 51, intangible assets costing in excess of $100,000 and having a life greater than one year are
capitalized. All land and building acquisitions are capitalized. Capital assets also include land improvements and infrastructure
costing in excess of $100,000. Building improvements are capitalized if the project cost is more than $100,000 or 20.0 percent
of the building’s replacement value and either extends the useful life of the building, changes the use or purpose of the original
building, or expands the total square footage of the building. The University capitalizes equipment with a cost of $5,000 or more
and a useful life in excess of one year. Construction costs that cross fiscal years are capitalized as Construction in Progress,
but are not depreciated until the assets are placed in service. Non-capital equipment and facility costs, routine repairs, and
maintenance are charged to operating expenses in the year the expense was incurred.
Depreciation expense is computed using the straight-line method over the estimated useful lives of the respective assets,
generally 50 years for buildings, ten to 50 years for exhaustible land improvements, and three to ten years for equipment. Land
and inexhaustible land improvements are not depreciated.
The library collection is not depreciated. All items in the collection are deemed to retain their full value if they are still on hand.
All new additions to the collection are treated as an expense at the time of purchase.
The art collection, housed primarily in the David Owsley Museum of Art at Ball State University, is not included, due to the
difficulty in determining an accurate value, plus the restrictions in place regarding sales of artwork and use of the funds
resulting from such sales, as well as disposition of the artwork in the unlikely event that the museum would cease to exist.
Component Unit
Discrete Component Unit
The Ball State University Foundation (Foundation) is a legally separate, tax-exempt Indiana nonprofit corporation that is an
Internal Revenue Code Section 170(b) (1) (A) organization organized and operated for the benefit of the University. Under the
reporting standards of the Governmental Accounting Standards Board (GASB), the Foundation is defined to be a component
unit of the University. The Foundation acts primarily as a fund-raising organization to supplement the resources that are
available to the University in support of its programs. The Foundation by-laws allow for thirty-one voting directors, seven of
whom serve by position. The seven directors who serve by position include the President of the University Board of Trustees,
the University President, the Vice-Presidents of Business Affairs and Advancement and two other members of the University
Board of Trustees. Although the University does not control the timing or amount of receipts from the Foundation, the majority
of resources or income thereon that the Foundation holds and invests are restricted to the activities of the University by the
donors. Because these restricted resources held by the Foundation can only be used by, or for the benefit of, the University,
the Foundation is considered a component unit of the University and is discretely presented in the University’s financial
statements.
Transactions with the Foundation primarily involve the funding of expenditures for which University funds are not available.
These include both unrestricted funds and those restricted by donors. Expenditures include scholarships, funding of
distinguished professorships, capital expenditures, and operational support.
The Foundation is a private nonprofit organization that reports under Financial Accounting Standards Board (FASB) standards,
including FASB Statement No. 117, Financial Reporting for Not-for-Profit Organizations. As such, certain revenue recognition
criteria and presentation features are different from GASB revenue recognition criteria and presentation features. No
modifications have been made to the Foundation’s financial information in the University’s annual report for these differences.
To assist those reading the financial statements of the Foundation, the following excerpts from the Notes to Consolidated
Financial Statements of the Ball State University Foundation are reproduced as follows:
Notes to Financial Statements
31
Note 7: Line of Credit and Term Note Payable (complete reproduction)
The Foundation has a $15,000,000 unsecured revolving line of credit with a group of banks
expiring in June 2015. At June 30, 2014, there was $1,200,000 borrowed against this line. Interest
varies with the one month London InterBank Offer Rate (LIBOR) plus 2.00 percent. There is a
minimum interest rate of 3.25 percent, which was the interest rate in effect at June 30, 2014.
The Foundation also has a term loan facility that is due December 30, 2018. The line is unsecured, with a fixed
interest rate of 3.30 percent. There was $4,300,000 borrowed against this facility at June 30, 2014. Repayments are
$250,000 quarterly beginning in October 2010 and extending through December 2018, when the remaining balance
outstanding is due.
Both of these agreements contain covenants, which include maintaining minimum net assets of $100,000,000. As of
June 30, 2014, the Foundation was in compliance with the financial covenants.
Complete financial statements for the Foundation can be requested from the Ball State University Foundation office at
2800 W. Bethel Ave., Muncie, IN 47306.
Related Entities
The financial reporting entity consists of the primary government, organizations for which the primary government is financially
accountable, and other organizations for which the nature and significance of their relationship with the primary government
are such that exclusion would cause the reporting entity’s financial statements to be misleading or incomplete, as required by
GASB Statement No. 14, The Financial Reporting Entity. As additionally required by GASB Statement No. 39, Determining
Whether Certain Organizations Are Component Units, organizations that raise and hold economic resources for the direct
benefit of the University are included in the reporting entity. The reporting entity is further clarified by the addition of GASB
Statement No. 61, The Financial Reporting Entity: Omnibus an amendment of GASB Statements No. 14 and No. 34. This
statement modifies certain requirements for inclusion of component units in the financial reporting entity. A financial benefit or
burden relationship must now also exist between the primary government and the component unit before it becomes part of the
reporting entity. The University evaluates potential component units for inclusion in the reporting entity based on all of these
criteria.
Service Concession Agreements
The University has entered into agreements with various vendors. They are all considered Service Concession Agreements as
Ball State University is the transferor and each of these entities is recognized as an operator under GASB Statement No. 60,
Accounting and Financial Reporting for Service Concession Agreements. However, none of the agreements have resulted in
significant deferred inflows or outflows of resources that would require further disclosure as of June 30, 2014.
Note B – Compensated Absences
The University records a liability for all unused vacation and sick leave balances that are payable upon employee termination in
accordance with University policy. Accumulation of vacation and sick leave are dependent upon a University employee’s job
classification. University policy determines other variables within each job classification such as: job classification, years of
service, employee’s age, and employee’s eligibility for retirement, and in which retirement plan the employee participates. All of
these variables are considered in computing the University’s liability for compensated absences.
Notes to Financial Statements
32
Note C – American Recovery and Reimbursement Act of 2009 (ARRA) The American Recovery and Reimbursement Act of 2009 was signed into law on February 17, 2009. The law provides federal
spending and tax relief to stabilize and/or stimulate the economy. The University, Burris Laboratory School, and Indiana
Academy for Science, Mathematics, and Humanities have been sub-recipients of ARRA funds.
From the inception of the ARRA, the University has received funding for various projects and programs. The State of Indiana
received funds from the ARRA to stabilize the state’s budget. The University has been awarded and received ARRA funds
through the State of Indiana to supplant State Appropriations and Capital Appropriations. The University has also received
funds from the Auditor of State for Burris Laboratory School and Indiana Academy for Science, Mathematics, and Humanities.
Other ARRA funds have been recorded through the Office of Contracts and Grants for various grant awards and programs. The
University has also been awarded and/or received ARRA funding for Federal Work Study and COBRA premium subsidies.
ARRA funds received or those due from ARRA projects that have been started and not reimbursed are recorded on the
financial statements. The receivable revenue equals the amount of the unreimbursed expenditures for the Office of Contracts
and Grants. The Accounts Receivable, Net and Unbilled Costs from the Statement of Net Position, includes $38,821 of ARRA
receivables at June 30, 2014.
The following summarized schedule, presents the effect of the ARRA funding on the University’s Statement of Revenues,
Expenses and Changes in Net Position:
2014 2013
Operating Revenues:
Federal Grants and Contracts * $ 38,821 $ (1,362)
Total ARRA Operating Revenues and Receivables $ 38,821 $ (1,362)
Non-Operating Revenues/(Expenses):
Federal and State Scholarship and Grants $ - $ -
State Appropriations - -
Other Non-Operating Income - -
Total ARRA Non-Operating Revenues $ - $ -
Capital Appropriations $ - $ -
Total ARRA Funding $ 38,821 $ (1,362)
*ARRA revenue adjusted in FY 2012 and FY 2013 for overstatement in FY 2011, resulting in negative revenue listed for
FY 2012 and FY 2013.
In accordance with the Section 1512 of the Recovery Act, the University will continue to provide quarterly reports to the funding
agencies.
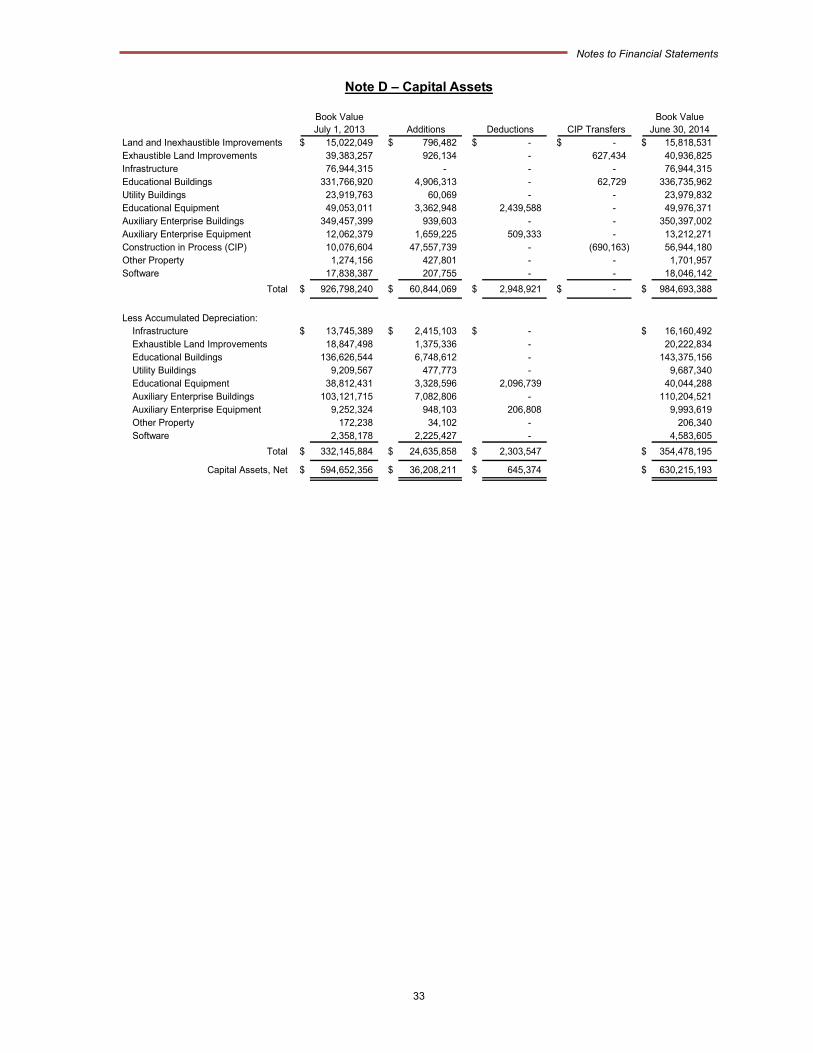
Notes to Financial Statements
33
Note D – Capital Assets
Land and Inexhaustible Improvements $ 15,022,049 $ 796,482 $ - $ - $ 15,818,531 Exhaustible Land Improvements 39,383,257 926,134 - 627,434 40,936,825 Infrastructure 76,944,315 - - - 76,944,315 Educational Buildings 331,766,920 4,906,313 - 62,729 336,735,962 Utility Buildings 23,919,763 60,069 - - 23,979,832 Educational Equipment 49,053,011 3,362,948 2,439,588 - 49,976,371 Auxiliary Enterprise Buildings 349,457,399 939,603 - - 350,397,002 Auxiliary Enterprise Equipment 12,062,379 1,659,225 509,333 - 13,212,271 Construction in Process (CIP) 10,076,604 47,557,739 - (690,163) 56,944,180 Other Property 1,274,156 427,801 - - 1,701,957 Software 17,838,387 207,755 - - 18,046,142
Total $ 926,798,240 $ 60,844,069 $ 2,948,921 $ - $ 984,693,388
Less Accumulated Depreciation:Infrastructure $ 13,745,389 $ 2,415,103 $ - $ 16,160,492 Exhaustible Land Improvements 18,847,498 1,375,336 - 20,222,834 Educational Buildings 136,626,544 6,748,612 - 143,375,156 Utility Buildings 9,209,567 477,773 - 9,687,340 Educational Equipment 38,812,431 3,328,596 2,096,739 40,044,288 Auxiliary Enterprise Buildings 103,121,715 7,082,806 - 110,204,521 Auxiliary Enterprise Equipment 9,252,324 948,103 206,808 9,993,619 Other Property 172,238 34,102 - 206,340 Software 2,358,178 2,225,427 - 4,583,605
Total $ 332,145,884 $ 24,635,858 $ 2,303,547 $ 354,478,195
Capital Assets, Net $ 594,652,356 $ 36,208,211 $ 645,374 $ 630,215,193
Book ValueJuly 1, 2013
Book ValueJune 30, 2014Additions Deductions CIP Transfers
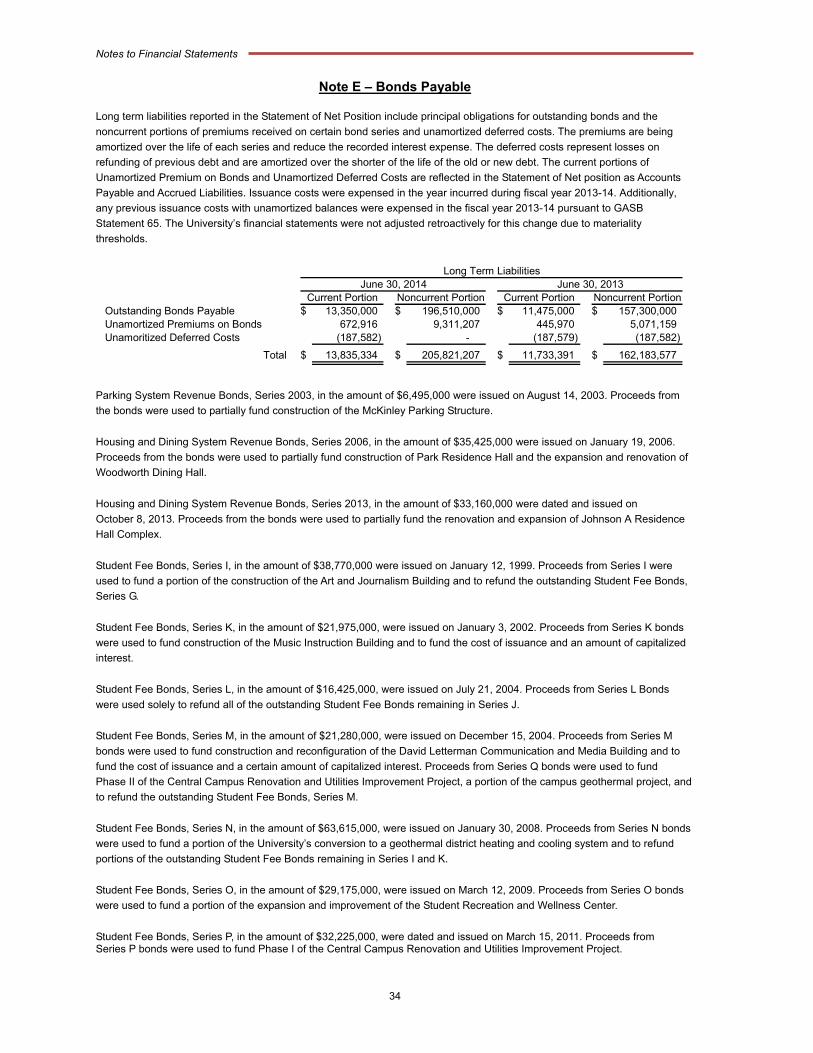
Notes to Financial Statements
34
Note E – Bonds Payable
Long term liabilities reported in the Statement of Net Position include principal obligations for outstanding bonds and the
noncurrent portions of premiums received on certain bond series and unamortized deferred costs. The premiums are being
amortized over the life of each series and reduce the recorded interest expense. The deferred costs represent losses on
refunding of previous debt and are amortized over the shorter of the life of the old or new debt. The current portions of
Unamortized Premium on Bonds and Unamortized Deferred Costs are reflected in the Statement of Net position as Accounts
Payable and Accrued Liabilities. Issuance costs were expensed in the year incurred during fiscal year 2013-14. Additionally,
any previous issuance costs with unamortized balances were expensed in the fiscal year 2013-14 pursuant to GASB
Statement 65. The University’s financial statements were not adjusted retroactively for this change due to materiality
thresholds.
Outstanding Bonds Payable $ 13,350,000 $ 196,510,000 $ 11,475,000 $ 157,300,000 Unamortized Premiums on Bonds 672,916 9,311,207 445,970 5,071,159 Unamoritized Deferred Costs (187,582) - (187,579) (187,582)
Total $ 13,835,334 $ 205,821,207 $ 11,733,391 $ 162,183,577
Long Term Liabilities
Current PortionJune 30, 2014 June 30, 2013
Current Portion Noncurrent PortionNoncurrent Portion
Parking System Revenue Bonds, Series 2003, in the amount of $6,495,000 were issued on August 14, 2003. Proceeds from
the bonds were used to partially fund construction of the McKinley Parking Structure.
Housing and Dining System Revenue Bonds, Series 2006, in the amount of $35,425,000 were issued on January 19, 2006.
Proceeds from the bonds were used to partially fund construction of Park Residence Hall and the expansion and renovation of
Woodworth Dining Hall.
Housing and Dining System Revenue Bonds, Series 2013, in the amount of $33,160,000 were dated and issued on
October 8, 2013. Proceeds from the bonds were used to partially fund the renovation and expansion of Johnson A Residence
Hall Complex.
Student Fee Bonds, Series I, in the amount of $38,770,000 were issued on January 12, 1999. Proceeds from Series I were
used to fund a portion of the construction of the Art and Journalism Building and to refund the outstanding Student Fee Bonds,
Series G.
Student Fee Bonds, Series K, in the amount of $21,975,000, were issued on January 3, 2002. Proceeds from Series K bonds
were used to fund construction of the Music Instruction Building and to fund the cost of issuance and an amount of capitalized
interest.
Student Fee Bonds, Series L, in the amount of $16,425,000, were issued on July 21, 2004. Proceeds from Series L Bonds
were used solely to refund all of the outstanding Student Fee Bonds remaining in Series J.
Student Fee Bonds, Series M, in the amount of $21,280,000, were issued on December 15, 2004. Proceeds from Series M
bonds were used to fund construction and reconfiguration of the David Letterman Communication and Media Building and to
fund the cost of issuance and a certain amount of capitalized interest. Proceeds from Series Q bonds were used to fund
Phase II of the Central Campus Renovation and Utilities Improvement Project, a portion of the campus geothermal project, and
to refund the outstanding Student Fee Bonds, Series M.
Student Fee Bonds, Series N, in the amount of $63,615,000, were issued on January 30, 2008. Proceeds from Series N bonds
were used to fund a portion of the University’s conversion to a geothermal district heating and cooling system and to refund
portions of the outstanding Student Fee Bonds remaining in Series I and K.
Student Fee Bonds, Series O, in the amount of $29,175,000, were issued on March 12, 2009. Proceeds from Series O bonds
were used to fund a portion of the expansion and improvement of the Student Recreation and Wellness Center.
Student Fee Bonds, Series P, in the amount of $32,225,000, were dated and issued on March 15, 2011. Proceeds from Series P bonds were used to fund Phase I of the Central Campus Renovation and Utilities Improvement Project.
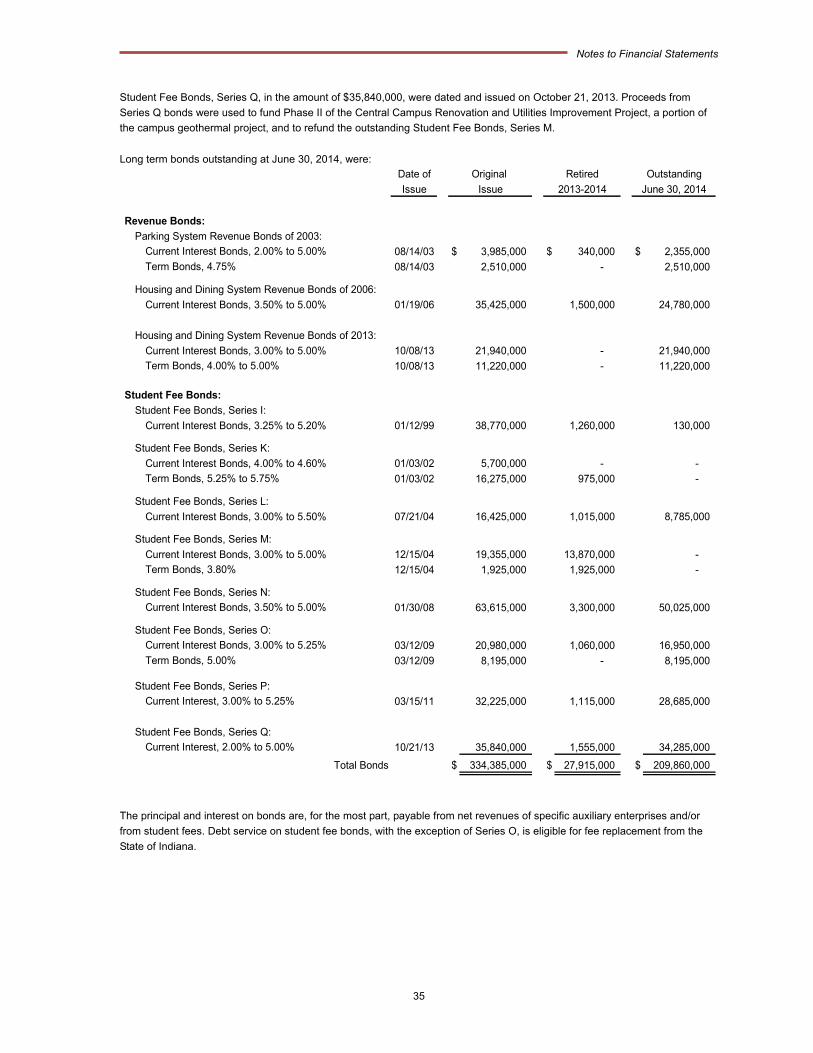
Notes to Financial Statements
35
Student Fee Bonds, Series Q, in the amount of $35,840,000, were dated and issued on October 21, 2013. Proceeds from
Series Q bonds were used to fund Phase II of the Central Campus Renovation and Utilities Improvement Project, a portion of
the campus geothermal project, and to refund the outstanding Student Fee Bonds, Series M.
Long term bonds outstanding at June 30, 2014, were:
Date of
Issue
Revenue Bonds:
Parking System Revenue Bonds of 2003:
Current Interest Bonds, 2.00% to 5.00% 08/14/03 $ 3,985,000 $ 340,000 $ 2,355,000
Term Bonds, 4.75% 08/14/03 2,510,000 - 2,510,000
Current Interest Bonds, 3.50% to 5.00% 01/19/06 35,425,000 1,500,000 24,780,000
Current Interest Bonds, 3.00% to 5.00% 10/08/13 21,940,000 - 21,940,000
Term Bonds, 4.00% to 5.00% 10/08/13 11,220,000 - 11,220,000
Student Fee Bonds:
Student Fee Bonds, Series I:
Current Interest Bonds, 3.25% to 5.20% 01/12/99 38,770,000 1,260,000 130,000
Current Interest Bonds, 4.00% to 4.60% 01/03/02 5,700,000 - -
Term Bonds, 5.25% to 5.75% 01/03/02 16,275,000 975,000 -
Current Interest Bonds, 3.00% to 5.50% 07/21/04 16,425,000 1,015,000 8,785,000
Current Interest Bonds, 3.00% to 5.00% 12/15/04 19,355,000 13,870,000 -
Term Bonds, 3.80% 12/15/04 1,925,000 1,925,000 -
Current Interest Bonds, 3.50% to 5.00% 01/30/08 63,615,000 3,300,000 50,025,000
Current Interest Bonds, 3.00% to 5.25% 03/12/09 20,980,000 1,060,000 16,950,000
Term Bonds, 5.00% 03/12/09 8,195,000 - 8,195,000
Student Fee Bonds, Series P:
Current Interest, 3.00% to 5.25% 03/15/11 32,225,000 1,115,000 28,685,000
Student Fee Bonds, Series Q:
Current Interest, 2.00% to 5.00% 10/21/13 35,840,000 1,555,000 34,285,000
Total Bonds $ 334,385,000 $ 27,915,000 $ 209,860,000
Outstanding
June 30, 2014
Original
Issue
Retired
2013-2014
Housing and Dining System Revenue Bonds of 2006:
Student Fee Bonds, Series O:
Student Fee Bonds, Series K:
Student Fee Bonds, Series M:
Student Fee Bonds, Series L:
Student Fee Bonds, Series N:
Housing and Dining System Revenue Bonds of 2013:
The principal and interest on bonds are, for the most part, payable from net revenues of specific auxiliary enterprises and/or
from student fees. Debt service on student fee bonds, with the exception of Series O, is eligible for fee replacement from the
State of Indiana.

Notes to Financial Statements
36
Future debt service requirements for all bonds outstanding are as follows:
Principal2015 $ 13,350,000 $ 9,563,141 $ 22,913,141 2016 11,970,000 9,076,950 21,046,950 2017 11,620,000 8,554,832 20,174,832 2018 12,170,000 7,988,906 20,158,906 2019 12,765,000 7,383,206 20,148,206 2020-2024 69,030,000 27,154,063 96,184,063 2025-2029 55,025,000 11,462,545 66,487,545 2030-2034 23,930,000 2,237,419 26,167,419
Total $ 209,860,000 $ 83,421,062 $ 293,281,062
Total
Interest andCapital
Appreciation
Note F – Defeased Bonds
Escrow accounts have been established with First Merchants Bank, N.A., Muncie, Indiana to meet all future debt service requirements of certain series of defeased Building Facilities Fee Bonds. The funds held in the escrow accounts are invested in federal, state, and local government securities. Proceeds of Student Fee Bonds, Series Q, dated October 21, 2013, were used to refund the outstanding Student Fee Bonds, Series M and to provide funding for Phase II of the Central Campus Renovation and Utilities Improvement Project and a portion of the campus geothermal project. The refunding resulted in an accounting loss of $182,395 which was recognized during fiscal year 2013-14. Through the refunding, the University reduced its aggregate debt service payment by $1,589,883, which will be realized over the next thirteen years. There was an economic gain (difference between the present values of the old and new debt service payments) of $1,318,070 on the refinancing activity. The entire gain on this transaction accrues to the State of Indiana in that it reduces the amount of fee replacement funds provided to the University by the State. Under the terms of the escrow agreements, the University is relieved of all liability for the defeased issues. At June 30, 2014, the unpaid principal for the defeased Building Facilities Fee Bonds was $14,885,000, the entire amount of which matured on July 1, 2014.
Note G – Operating Leases
The University leases various buildings and equipment under operating lease rental agreements. Operating leases do not give
rise to property rights or meet other capital lease criteria and, therefore, the related assets and liabilities are not recorded in the
accompanying financial statements. The total rental expense under these agreements was $307,725 for the year ended
June 30, 2014.
Future minimum lease payments on all significant operating leases with initial terms in excess of one year, as of June 30, 2014,
are as follows:
2015 $ 353,192 2016 144,410 2017 8,443 2018 - 2019 -
Total $ 506,045
Future Lease
Payments
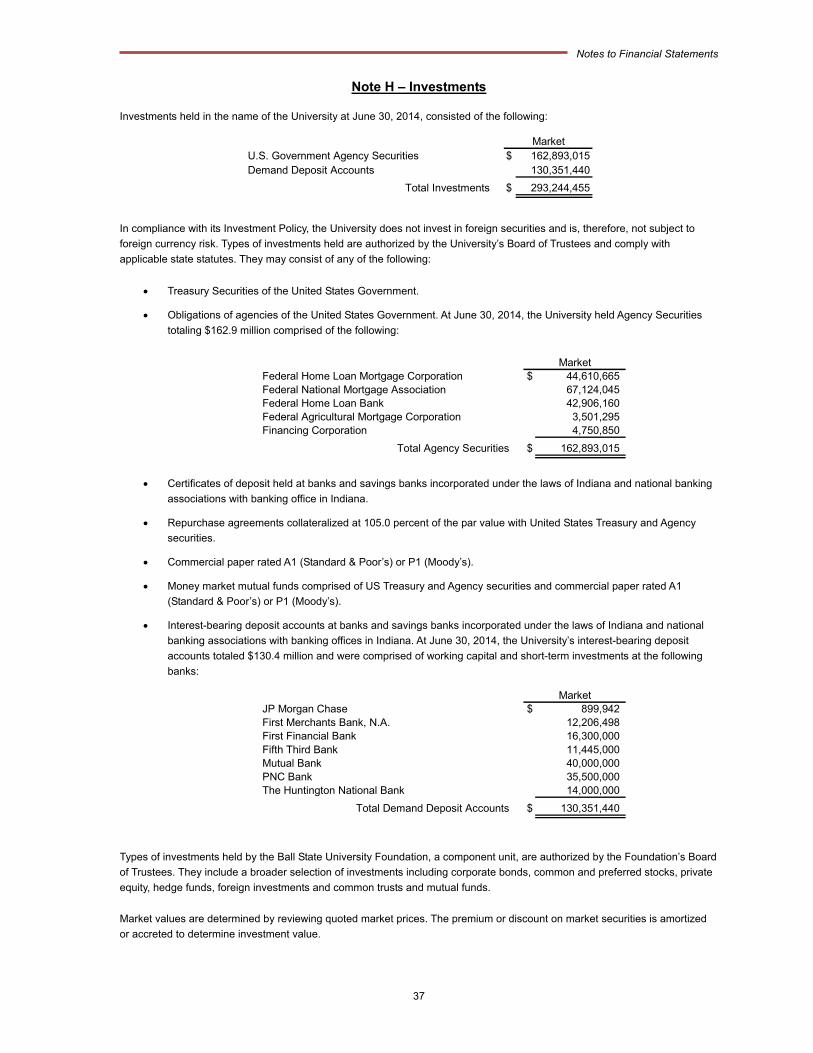
Notes to Financial Statements
37
Note H – Investments
Investments held in the name of the University at June 30, 2014, consisted of the following:
MarketU.S. Government Agency Securities $ 162,893,015Demand Deposit Accounts 130,351,440
Total Investments $ 293,244,455
In compliance with its Investment Policy, the University does not invest in foreign securities and is, therefore, not subject to
foreign currency risk. Types of investments held are authorized by the University’s Board of Trustees and comply with
applicable state statutes. They may consist of any of the following:
Treasury Securities of the United States Government.
Obligations of agencies of the United States Government. At June 30, 2014, the University held Agency Securities
totaling $162.9 million comprised of the following:
Federal Home Loan Mortgage Corporation $ 44,610,665 Federal National Mortgage Association 67,124,045 Federal Home Loan Bank 42,906,160 Federal Agricultural Mortgage Corporation 3,501,295 Financing Corporation 4,750,850
Total Agency Securities $ 162,893,015
Market
Certificates of deposit held at banks and savings banks incorporated under the laws of Indiana and national banking
associations with banking office in Indiana.
Repurchase agreements collateralized at 105.0 percent of the par value with United States Treasury and Agency
securities.
Commercial paper rated A1 (Standard & Poor’s) or P1 (Moody’s).
Money market mutual funds comprised of US Treasury and Agency securities and commercial paper rated A1
(Standard & Poor’s) or P1 (Moody’s).
Interest-bearing deposit accounts at banks and savings banks incorporated under the laws of Indiana and national
banking associations with banking offices in Indiana. At June 30, 2014, the University’s interest-bearing deposit
accounts totaled $130.4 million and were comprised of working capital and short-term investments at the following
banks:
JP Morgan Chase $ 899,942 First Merchants Bank, N.A. 12,206,498 First Financial Bank 16,300,000 Fifth Third Bank 11,445,000 Mutual Bank 40,000,000 PNC Bank 35,500,000 The Huntington National Bank 14,000,000
Total Demand Deposit Accounts $ 130,351,440
Market
Types of investments held by the Ball State University Foundation, a component unit, are authorized by the Foundation’s Board
of Trustees. They include a broader selection of investments including corporate bonds, common and preferred stocks, private
equity, hedge funds, foreign investments and common trusts and mutual funds.
Market values are determined by reviewing quoted market prices. The premium or discount on market securities is amortized
or accreted to determine investment value.
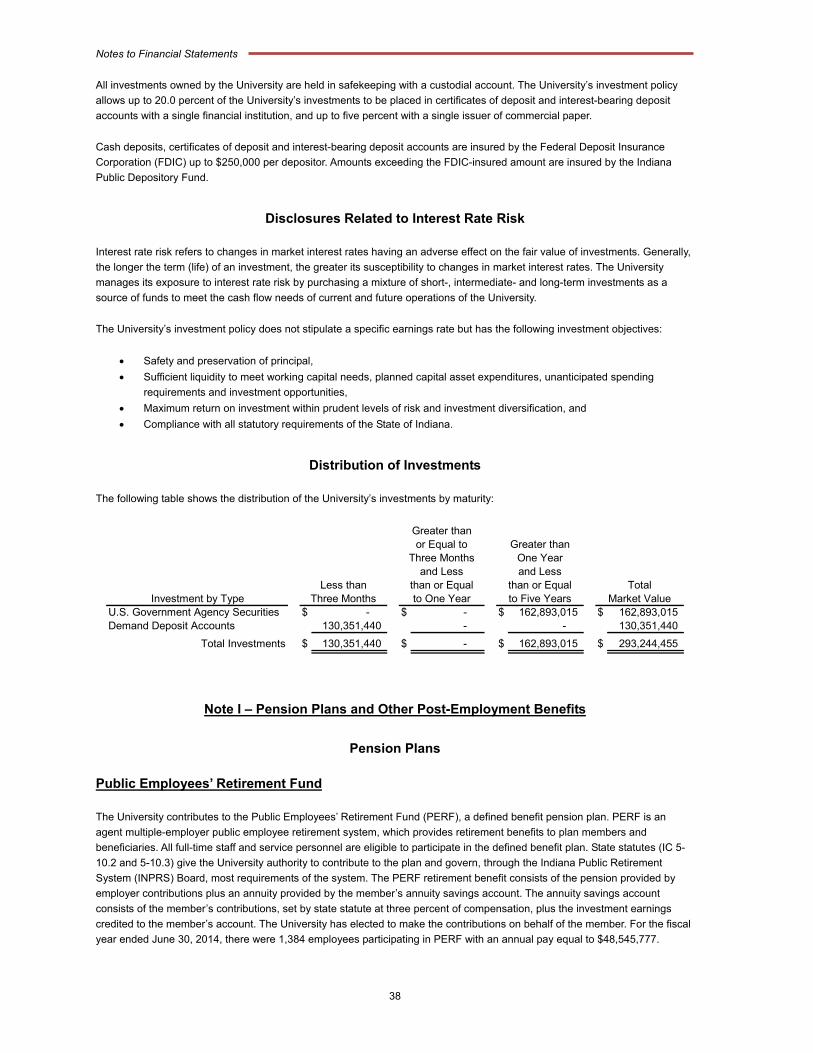
Notes to Financial Statements
38
All investments owned by the University are held in safekeeping with a custodial account. The University’s investment policy
allows up to 20.0 percent of the University’s investments to be placed in certificates of deposit and interest-bearing deposit
accounts with a single financial institution, and up to five percent with a single issuer of commercial paper.
Cash deposits, certificates of deposit and interest-bearing deposit accounts are insured by the Federal Deposit Insurance
Corporation (FDIC) up to $250,000 per depositor. Amounts exceeding the FDIC-insured amount are insured by the Indiana
Public Depository Fund.
Disclosures Related to Interest Rate Risk
Interest rate risk refers to changes in market interest rates having an adverse effect on the fair value of investments. Generally,
the longer the term (life) of an investment, the greater its susceptibility to changes in market interest rates. The University
manages its exposure to interest rate risk by purchasing a mixture of short-, intermediate- and long-term investments as a
source of funds to meet the cash flow needs of current and future operations of the University.
The University’s investment policy does not stipulate a specific earnings rate but has the following investment objectives:
Safety and preservation of principal,
Sufficient liquidity to meet working capital needs, planned capital asset expenditures, unanticipated spending
requirements and investment opportunities,
Maximum return on investment within prudent levels of risk and investment diversification, and
Compliance with all statutory requirements of the State of Indiana.
Distribution of Investments
The following table shows the distribution of the University’s investments by maturity:
Investment by TypeU.S. Government Agency Securities $ - $ - $ 162,893,015 $ 162,893,015 Demand Deposit Accounts 130,351,440 - - 130,351,440
Total Investments $ 130,351,440 $ - $ 162,893,015 $ 293,244,455
Greater thanGreater thanor Equal to
and Lessand LessThree Months One Year
to Five Years Market ValueTotalthan or Equal
Three Months to One Yearthan or EqualLess than
Note I – Pension Plans and Other Post-Employment Benefits
Pension Plans
Public Employees’ Retirement Fund
The University contributes to the Public Employees’ Retirement Fund (PERF), a defined benefit pension plan. PERF is an
agent multiple-employer public employee retirement system, which provides retirement benefits to plan members and
beneficiaries. All full-time staff and service personnel are eligible to participate in the defined benefit plan. State statutes (IC 5-
10.2 and 5-10.3) give the University authority to contribute to the plan and govern, through the Indiana Public Retirement
System (INPRS) Board, most requirements of the system. The PERF retirement benefit consists of the pension provided by
employer contributions plus an annuity provided by the member’s annuity savings account. The annuity savings account
consists of the member’s contributions, set by state statute at three percent of compensation, plus the investment earnings
credited to the member’s account. The University has elected to make the contributions on behalf of the member. For the fiscal
year ended June 30, 2014, there were 1,384 employees participating in PERF with an annual pay equal to $48,545,777.
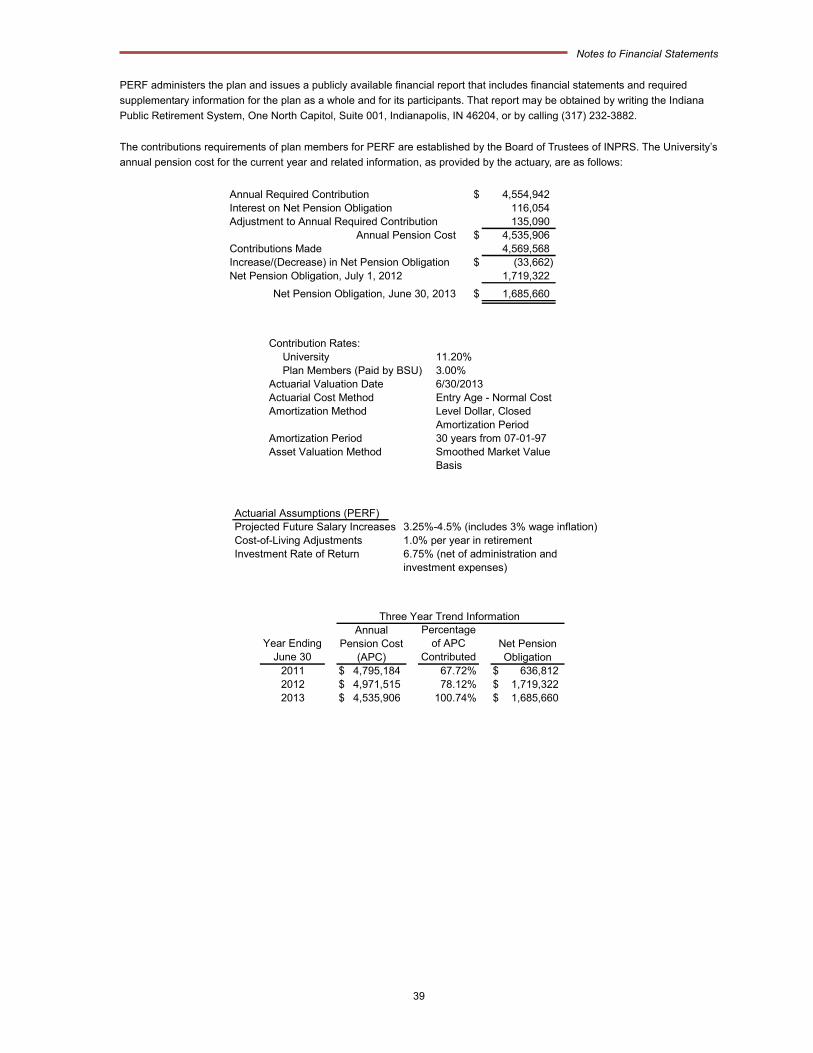
Notes to Financial Statements
39
PERF administers the plan and issues a publicly available financial report that includes financial statements and required
supplementary information for the plan as a whole and for its participants. That report may be obtained by writing the Indiana
Public Retirement System, One North Capitol, Suite 001, Indianapolis, IN 46204, or by calling (317) 232-3882.
The contributions requirements of plan members for PERF are established by the Board of Trustees of INPRS. The University’s
annual pension cost for the current year and related information, as provided by the actuary, are as follows:
Annual Required Contribution $ 4,554,942 Interest on Net Pension Obligation 116,054 Adjustment to Annual Required Contribution 135,090
Annual Pension Cost $ 4,535,906 Contributions Made 4,569,568 Increase/(Decrease) in Net Pension Obligation $ (33,662) Net Pension Obligation, July 1, 2012 1,719,322
Net Pension Obligation, June 30, 2013 $ 1,685,660
Contribution Rates:University 11.20%Plan Members (Paid by BSU) 3.00%
Actuarial Valuation Date 6/30/2013Actuarial Cost Method Entry Age - Normal CostAmortization Method Level Dollar, Closed
Amortization PeriodAmortization Period 30 years from 07-01-97Asset Valuation Method Smoothed Market Value
Basis
Actuarial Assumptions (PERF)Projected Future Salary Increases 3.25%-4.5% (includes 3% wage inflation)Cost-of-Living Adjustments 1.0% per year in retirementInvestment Rate of Return 6.75% (net of administration and
investment expenses)
Year EndingJune 30
Percentageof APC
Contributed2011 $ 4,795,184 67.72% $ 636,8122012 $ 4,971,515 78.12% $ 1,719,3222013 $ 4,535,906 100.74% $ 1,685,660
AnnualPension Cost
(APC)Net Pension Obligation
Three Year Trend Information
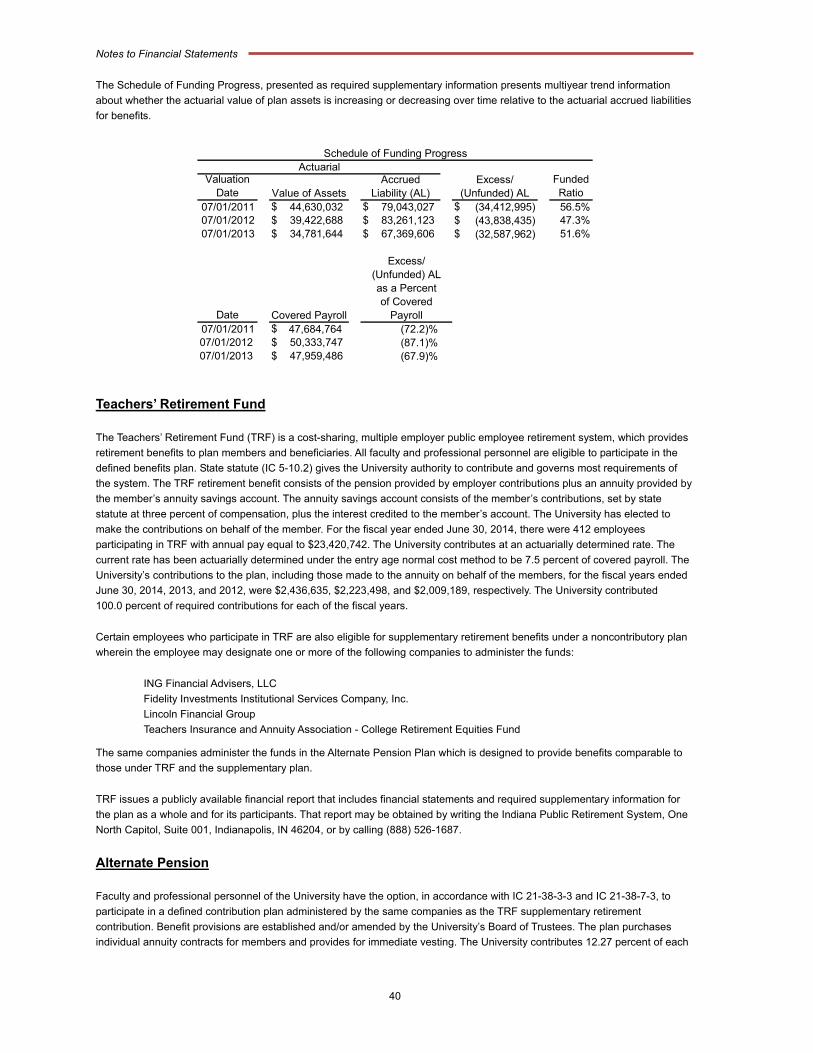
Notes to Financial Statements
40
The Schedule of Funding Progress, presented as required supplementary information presents multiyear trend information
about whether the actuarial value of plan assets is increasing or decreasing over time relative to the actuarial accrued liabilities
for benefits.
ValuationDate
FundedRatio
07/01/2011 $ 44,630,032 $ 79,043,027 $ (34,412,995) 56.5%07/01/2012 $ 39,422,688 $ 83,261,123 $ (43,838,435) 47.3%07/01/2013 $ 34,781,644 $ 67,369,606 $ (32,587,962) 51.6%
Date07/01/2011 $ 47,684,764 (72.2)%07/01/2012 $ 50,333,747 (87.1)%07/01/2013 $ 47,959,486 (67.9)%
Covered Payroll
Schedule of Funding ProgressActuarial
Value of AssetsAccrued
Liability (AL)
Excess/(Unfunded) ALas a Percent of Covered
Payroll
Excess/(Unfunded) AL
Teachers’ Retirement Fund
The Teachers’ Retirement Fund (TRF) is a cost-sharing, multiple employer public employee retirement system, which provides
retirement benefits to plan members and beneficiaries. All faculty and professional personnel are eligible to participate in the
defined benefits plan. State statute (IC 5-10.2) gives the University authority to contribute and governs most requirements of
the system. The TRF retirement benefit consists of the pension provided by employer contributions plus an annuity provided by
the member’s annuity savings account. The annuity savings account consists of the member’s contributions, set by state
statute at three percent of compensation, plus the interest credited to the member’s account. The University has elected to
make the contributions on behalf of the member. For the fiscal year ended June 30, 2014, there were 412 employees
participating in TRF with annual pay equal to $23,420,742. The University contributes at an actuarially determined rate. The
current rate has been actuarially determined under the entry age normal cost method to be 7.5 percent of covered payroll. The
University’s contributions to the plan, including those made to the annuity on behalf of the members, for the fiscal years ended
June 30, 2014, 2013, and 2012, were $2,436,635, $2,223,498, and $2,009,189, respectively. The University contributed
100.0 percent of required contributions for each of the fiscal years.
Certain employees who participate in TRF are also eligible for supplementary retirement benefits under a noncontributory plan
wherein the employee may designate one or more of the following companies to administer the funds:
ING Financial Advisers, LLC
Fidelity Investments Institutional Services Company, Inc.
Lincoln Financial Group
Teachers Insurance and Annuity Association - College Retirement Equities Fund
The same companies administer the funds in the Alternate Pension Plan which is designed to provide benefits comparable to
those under TRF and the supplementary plan.
TRF issues a publicly available financial report that includes financial statements and required supplementary information for
the plan as a whole and for its participants. That report may be obtained by writing the Indiana Public Retirement System, One
North Capitol, Suite 001, Indianapolis, IN 46204, or by calling (888) 526-1687.
Alternate Pension
Faculty and professional personnel of the University have the option, in accordance with IC 21-38-3-3 and IC 21-38-7-3, to
participate in a defined contribution plan administered by the same companies as the TRF supplementary retirement
contribution. Benefit provisions are established and/or amended by the University’s Board of Trustees. The plan purchases
individual annuity contracts for members and provides for immediate vesting. The University contributes 12.27 percent of each
Notes to Financial Statements
41
participating employee’s base salary. For employees hired on or after October 1, 2010, the University contributes five percent
of each employee’s base salary for the first three years and 10.5 percent for each year thereafter. For the fiscal year ended
June 30, 2014, the University contributed $11,992,431 to this plan for 1,546 participating employees with annual payroll totaling
$111,348,662, and for fiscal year ended June 30, 2013, the University contributed $12,064,703 for 1,613 employees with
payroll totaling $108,304,100.
Early Retirement Program
Eligible employees may participate in an early retirement program. The plan provides a severance payment equivalent to
15.0 percent of the employee’s final year’s pay. Such payments are made in the final year of employment; therefore, no liability
exists beyond the end of the fiscal year in which employment terminates. Prior to fiscal year 2012-13, the plan would also
permit participants to select a cash settlement option in lieu of life insurance that is equal to 40.0 percent of that life insurance.
Payments were made in two equal installments on January 31 of the calendar year following the calendar year in which
retirement takes place and the next succeeding January 31. During fiscal year 2012-13, it was determined to discontinue the
cash settlement option. Therefore, beginning fiscal year 2013-14, the cash settlement option was no longer available. The
fiscal year 2012-13 and remaining payments for fiscal year 2011-12 were accelerated and most were paid by June 30, 2013.
However, there were some payments that were made in the first few months of fiscal year 2013-14. As of June 30, 2013,
$306,761 was recorded as a liability representing payments to be made in fiscal year 2013-14 to employees who retired under
the program. As of June 30, 2014, there is no remaining liability.
Other Post-Employment Benefits
In addition to providing pension benefits, the University, as authorized by the University’s Board of Trustees, provides certain
health care and life insurance benefits for retired employees. Substantially all of the University’s regular employees may
become eligible for those benefits if they retire from the University after accruing the required years of service (15 years at age
62; 15 years at age 50 for those hired before July 1, 2009; ten years at age 60 for those hired before September 1, 1999). As of
June 30, 2014, approximately 1,957 participants were eligible and were receiving one or both of these benefits.
Plan Description
The University’s Retiree Health and Life Insurance Plans (Plans) are single-employer defined benefit health and life insurance
plans administered by the University. The Plans provide medical, dental, and prescription drug insurance benefits to eligible
retirees and spouses and life insurance benefits to eligible retirees. IC 21-38-3-3 assigns authority to the University’s Board of
Trustees to establish and amend benefit provisions for the University. The Plans issue a publicly available financial report that
includes financial statements and required supplementary information for the Plans as a whole and for the participants. That
report may be obtained by contacting Ball State University, Office of University Controller, AD 301, Muncie, IN 47306.
Funding Policy
The contribution requirements for members of the Plans are established by the University’s Board of Trustees. The required
contribution is based on projected pay-as-you-go financing requirements, as well as amounts necessary to prefund benefits as
determined annually by the University. In addition, the University has followed a practice of contributing additional amounts
generated by savings within the employee plans as well as the retiree plans. For the fiscal year ended June 30, 2014, the
University contributed $8,689,781 for current claims and estimated applicable administrative costs and an additional
$2,811,362 from Medicare prescription drug subsidies, rebates on prescription drugs, and savings generated within the
employee and retiree plans this year and last year, in order to prefund benefits. Plan members receiving benefits contributed
$2,739,136 for health insurance and $40,690 for life insurance or approximately 25.0 percent of the total premiums assessed,
through their required contributions, which for health insurance and dental insurance ranged, for those not eligible for Medicare,
from $48.24 to $325.57 per month for single coverage and $125.13 to $725.43 for family coverage. For those eligible for
Medicare, the monthly premiums were $100.84 for medical and prescription drug coverage and $9.56 for optional dental
coverage. These premium amounts were also paid by Medicare-eligible spouses for their coverage. Retiree life insurance
monthly premiums are on a sliding scale based on coverage in the last year employed, with $37,500 being the maximum
amount available for retirees. The monthly premium is $0.692 per $1,000 of coverage with the University paying 75.0 percent
of the premium.
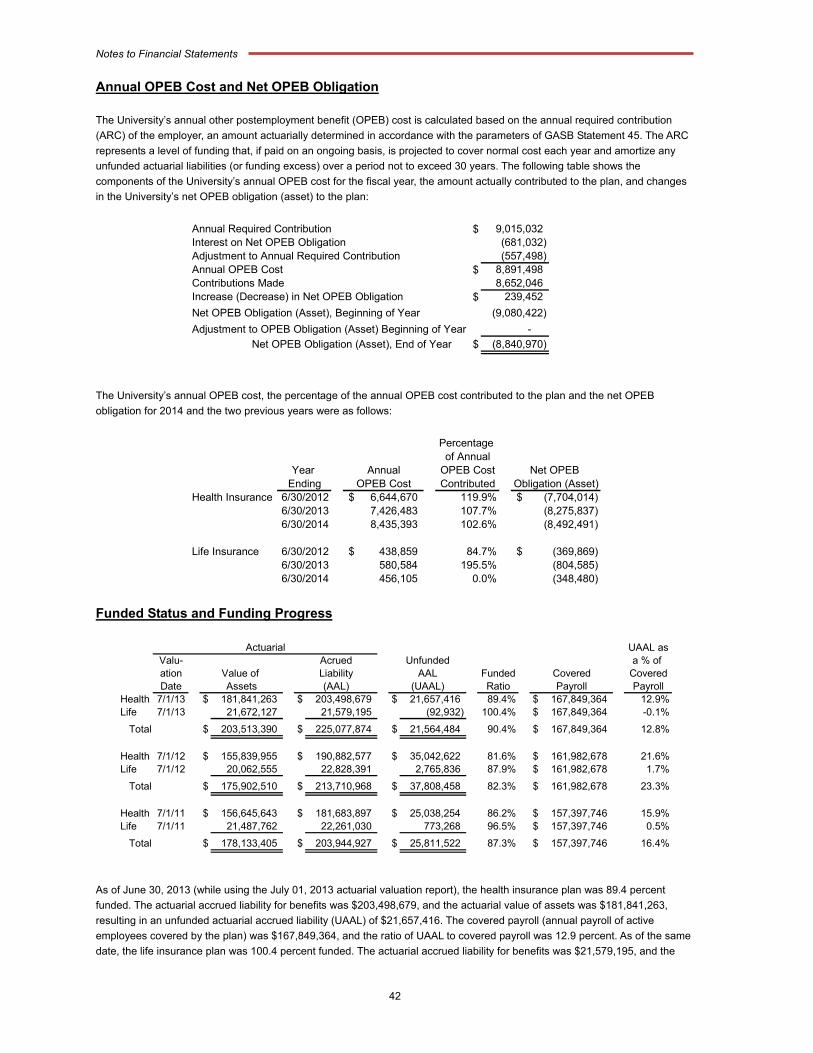
Notes to Financial Statements
42
Annual OPEB Cost and Net OPEB Obligation
The University’s annual other postemployment benefit (OPEB) cost is calculated based on the annual required contribution
(ARC) of the employer, an amount actuarially determined in accordance with the parameters of GASB Statement 45. The ARC
represents a level of funding that, if paid on an ongoing basis, is projected to cover normal cost each year and amortize any
unfunded actuarial liabilities (or funding excess) over a period not to exceed 30 years. The following table shows the
components of the University’s annual OPEB cost for the fiscal year, the amount actually contributed to the plan, and changes
in the University’s net OPEB obligation (asset) to the plan:
Annual Required Contribution $ 9,015,032 Interest on Net OPEB Obligation (681,032) Adjustment to Annual Required Contribution (557,498) Annual OPEB Cost $ 8,891,498 Contributions Made 8,652,046 Increase (Decrease) in Net OPEB Obligation $ 239,452
Net OPEB Obligation (Asset), Beginning of Year (9,080,422)
Adjustment to OPEB Obligation (Asset) Beginning of Year -
Net OPEB Obligation (Asset), End of Year $ (8,840,970)
The University’s annual OPEB cost, the percentage of the annual OPEB cost contributed to the plan and the net OPEB
obligation for 2014 and the two previous years were as follows:
Percentage of Annual
Year OPEB CostEnding Contributed
Health Insurance 6/30/2012 $ 6,644,670 119.9% $ (7,704,014) 6/30/2013 7,426,483 107.7% (8,275,837) 6/30/2014 8,435,393 102.6% (8,492,491)
Life Insurance 6/30/2012 $ 438,859 84.7% $ (369,869) 6/30/2013 580,584 195.5% (804,585) 6/30/2014 456,105 0.0% (348,480)
Obligation (Asset)Net OPEB Annual
OPEB Cost
Funded Status and Funding Progress
UAAL asValu- a % of ation Funded CoveredDate Ratio Payroll
Health 7/1/13 $ 181,841,263 $ 203,498,679 $ 21,657,416 89.4% $ 167,849,364 12.9%Life 7/1/13 21,672,127 21,579,195 (92,932) 100.4% $ 167,849,364 -0.1%
Total $ 203,513,390 $ 225,077,874 $ 21,564,484 90.4% $ 167,849,364 12.8%
Health 7/1/12 $ 155,839,955 $ 190,882,577 $ 35,042,622 81.6% $ 161,982,678 21.6%Life 7/1/12 20,062,555 22,828,391 2,765,836 87.9% $ 161,982,678 1.7%
Total $ 175,902,510 $ 213,710,968 $ 37,808,458 82.3% $ 161,982,678 23.3%
Health 7/1/11 $ 156,645,643 $ 181,683,897 $ 25,038,254 86.2% $ 157,397,746 15.9%Life 7/1/11 21,487,762 22,261,030 773,268 96.5% $ 157,397,746 0.5%
Total $ 178,133,405 $ 203,944,927 $ 25,811,522 87.3% $ 157,397,746 16.4%
Value of AcruedLiability
Assets (AAL) Payroll
Actuarial
CoveredAAL(UAAL)
Unfunded
As of June 30, 2013 (while using the July 01, 2013 actuarial valuation report), the health insurance plan was 89.4 percent
funded. The actuarial accrued liability for benefits was $203,498,679, and the actuarial value of assets was $181,841,263,
resulting in an unfunded actuarial accrued liability (UAAL) of $21,657,416. The covered payroll (annual payroll of active
employees covered by the plan) was $167,849,364, and the ratio of UAAL to covered payroll was 12.9 percent. As of the same
date, the life insurance plan was 100.4 percent funded. The actuarial accrued liability for benefits was $21,579,195, and the
Notes to Financial Statements
43
actuarial value of assets was $21,672,127, resulting in a surplus of funding equivalent to $92,900. The covered payroll (annual
payroll of active employees covered by the plan) was $167,849,364, and the ratio of the UAAL to covered payroll was
-0.1 percent which indicates the OPEB 115 Trust is over 100.0 percent funded at fiscal year end June 30, 2014.
Actuarial valuations of an ongoing plan involve estimates of the value of reported amounts and assumptions about the
probability of occurrence of events far into the future. Examples include assumptions about future employment, mortality, and
the healthcare cost trend. Amounts determined regarding the funded status of the plan and the annual required contributions of
the employer are subject to continual revision as actual results are compared with past expectations and new estimates are
made about the future. The Schedule of Funding Progress, presented as required supplementary information following the
notes to the financial statements, presents multiyear trend information about whether the actuarial value of plan assets is
increasing or decreasing over time relative to the actuarial accrued liabilities for benefits
Actuarial Methods and Assumptions
Projections of benefits for financial reporting purposes are based on the substantive plan (the plan as understood by the
employer and the plan members) and include the types of benefits provided at the time of each valuation and the historical
pattern of sharing of benefit costs between the employer and plan members to that point. The actuarial methods and
assumptions used include techniques that are consistent with the long-term perspective of the calculations.
In the July 01, 2007, 2009, 2011 and 2013 actuarial valuations, the projected unit credit actuarial cost method was used. The
actuarial assumptions included a 7.5 percent investment rate of return (net of administrative expenses), which is the expected
long-term investment return on plan assets, and is appropriate as long as the University makes annual contributions (through a
combination of benefits paid from general assets and contributions to the VEBA Trust) that are at least as large as the ARC. If
the OPEB is “unfunded,” the ARC would be calculated using a discount rate reflective of the University’s internal rates of return,
which would result in a significantly larger ARC. The actuarial assumptions for 2009 and 2011 also included an annual
healthcare cost trend rate initially of eight percent for non-Medicare medical, seven percent for Medicare eligible medical,
eight percent for prescription drugs, five percent for dental, and four percent for administrative costs, reduced to an ultimate
rate of four percent for administrative costs and 4.5 percent for everything else after 16 years. The actuarial assumptions for
2013 include an annual healthcare cost trend rate with an initial 8.25 percent, decreasing to 7.5 percent the following year and
decreasing incrementally thereafter to an ultimate rate of four percent after ten years. However, the dental care cost trend rate
remains at a static four percent throughout the entire projection period. A payroll growth rate of four percent is assumed
throughout. The actuarial value of the plan assets is market value for the VEBA Trust (Retiree Healthcare). The OPEB 115
Trust (Retiree Life Insurance) calculates actuarial value of the plan assets as market value adjusted for the value of the IBNP
(Incurred But Not Processed claims) at year end. The UAAL is being amortized as a level percentage of projected payroll on a
closed basis. The remaining amortization period at June 30, 2013, was 24 years.
Fund Balances and Activity The VEBA Trust fund established for the sole purpose of funding future retiree health care had the following activity for the year
ended June 30, 2014:
Market Value at July 1, 2013 $ 181,841,263 Transfer from Ball State University - Reinvested Net Earnings (Loss) 12,324,598 Unrealized Gain (Loss) 24,243,706
Fund Balance at June 30, 2014 $ 218,409,567
These funds cannot under any circumstances revert to the University.
Notes to Financial Statements
44
The OPEB 115 Trust Fund (formerly Life Insurance Continuance Fund) established for the sole purpose of funding future
retiree life insurance benefits had the following activity for the year ended June 30, 2014:
Fund Balance at July 1, 2013 $ 21,927,626 Transfer from Ball State University - Reinvested Net Earnings (Loss) 5,587,919 Unrealized Gain (Loss) (2,803,357) Death Claims and Related Charges (1,245,959)
Fund Balance at June 30, 2014 $ 23,466,229
These funds cannot under any circumstances revert to the University.
Note J – Included Entities
The University operates Burris Laboratory School and the Indiana Academy for Science, Mathematics, and Humanities under
the direction of the Teachers College. The financial activity for these entities is included in the exhibits.
Note K – Commitments and Contingent Liability
During the normal course of operations, the University has become an interested party to various legal and administrative
actions, the resolutions of which are not yet known. However, in the opinion of legal counsel and University management, the
disposition of all pending litigation and actions will not have a material adverse effect on the financial condition of the University.
To protect the integrity of any litigation or action, further details are held confidential.
The University has entered into loan guaranty agreements on two properties as discussed below:
Sigma Chi Fraternity, Epsilon Omega chapter in Muncie, Indiana – The loan agreement provided for the refinancing
of an existing mortgage to gain more favorable terms and to obtain additional funds for renovation of the fraternity
house. The University is guarantor of the loan that was issued for $460,000. Current financial statements provided by
the chapter show the housing corporation has the ability to service the debt and meet its other financial obligations.
Sigma Phi Epsilon Alumni Corporation – The loan agreement allowed for the construction of a new fraternity house
for Sigma Phi Epsilon Fraternity, Indiana Gamma chapter in Muncie, Indiana. On June 18, 2009, the University
guaranteed a term loan in the amount of $1,040,000 and a term note in the amount of $559,000. On January 2,
2014, the loan and note were consolidated with a reduction in the original interest rate at the request of the housing
corporation and the consent of the University for a total consolidated loan of $1,068,957.13. Current financial
statements provided by the chapter show the housing corporation has the ability to service the debt and meet its
other financial obligations.
The University has outstanding commitments for capital construction contracts of $26,407,516 at June 30, 2014.
Note L – Risk Management
The University is exposed to risks of loss related to:
torts;
theft of, damage to, or destruction of assets;
errors or omissions;
job-related illnesses or injuries to employees;
life, health and other medical benefits provided to employees and their dependents; and,
long-term disability benefits provided to employees.
The University handles these risks of loss through combinations of risk retention and commercial insurance. For buildings,
contents and general liability the risk retention per incident is $100,000. The University retains the entire risk for job-related
illnesses or injury to employees, property damage to its auto fleet, and short-term disability. Auto liability, life insurance and
long-term disability are handled through fully insured commercial policies. The University retains the risk for its medical
benefits.
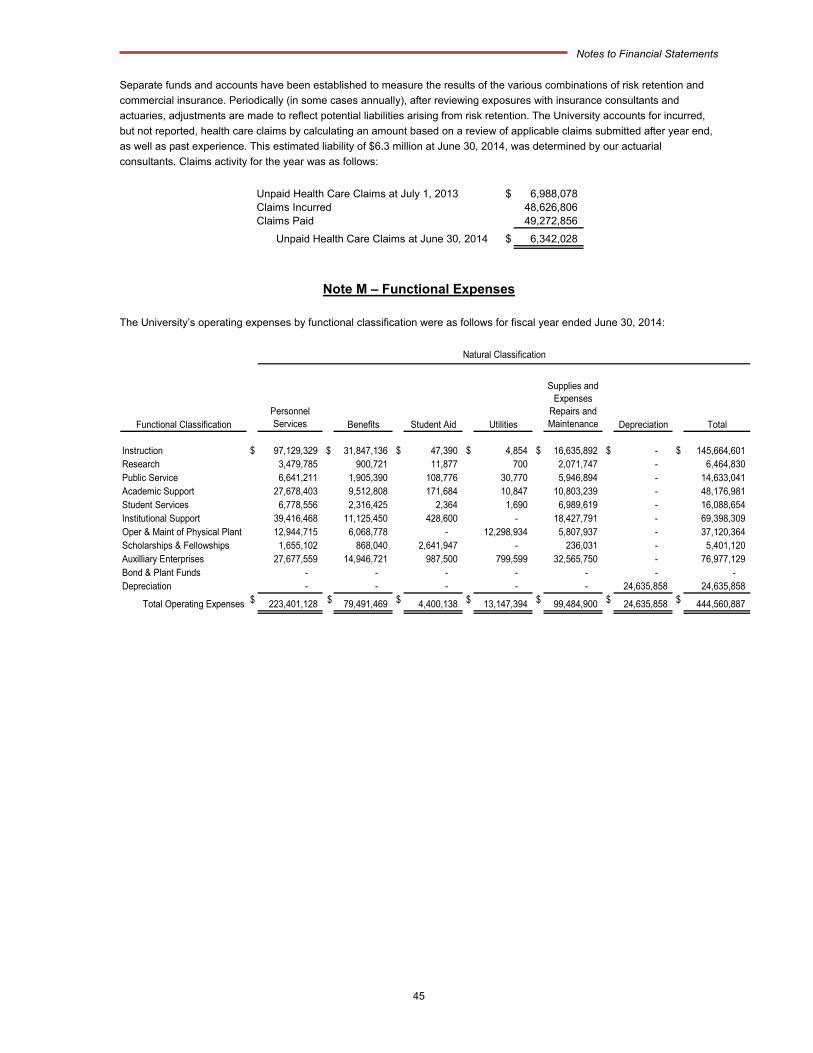
Notes to Financial Statements
45
Separate funds and accounts have been established to measure the results of the various combinations of risk retention and
commercial insurance. Periodically (in some cases annually), after reviewing exposures with insurance consultants and
actuaries, adjustments are made to reflect potential liabilities arising from risk retention. The University accounts for incurred,
but not reported, health care claims by calculating an amount based on a review of applicable claims submitted after year end,
as well as past experience. This estimated liability of $6.3 million at June 30, 2014, was determined by our actuarial
consultants. Claims activity for the year was as follows:
Unpaid Health Care Claims at July 1, 2013 $ 6,988,078 Claims Incurred 48,626,806 Claims Paid 49,272,856
Unpaid Health Care Claims at June 30, 2014 $ 6,342,028
Note M – Functional Expenses
The University’s operating expenses by functional classification were as follows for fiscal year ended June 30, 2014:
Functional ClassificationPersonnel Services Benefits Student Aid Utilities
Supplies and Expenses
Repairs and Maintenance Depreciation Total
Instruction $ 97,129,329 $ 31,847,136 $ 47,390 $ 4,854 $ 16,635,892 $ - $ 145,664,601 Research 3,479,785 900,721 11,877 700 2,071,747 - 6,464,830 Public Service 6,641,211 1,905,390 108,776 30,770 5,946,894 - 14,633,041 Academic Support 27,678,403 9,512,808 171,684 10,847 10,803,239 - 48,176,981 Student Services 6,778,556 2,316,425 2,364 1,690 6,989,619 - 16,088,654 Institutional Support 39,416,468 11,125,450 428,600 - 18,427,791 - 69,398,309 Oper & Maint of Physical Plant 12,944,715 6,068,778 - 12,298,934 5,807,937 - 37,120,364 Scholarships & Fellowships 1,655,102 868,040 2,641,947 - 236,031 - 5,401,120 Auxilliary Enterprises 27,677,559 14,946,721 987,500 799,599 32,565,750 - 76,977,129 Bond & Plant Funds - - - - - - - Depreciation - - - - - 24,635,858 24,635,858
Total Operating Expenses $ 223,401,128 $ 79,491,469 $ 4,400,138 $ 13,147,394 $ 99,484,900 $ 24,635,858 $ 444,560,887
Natural Classification
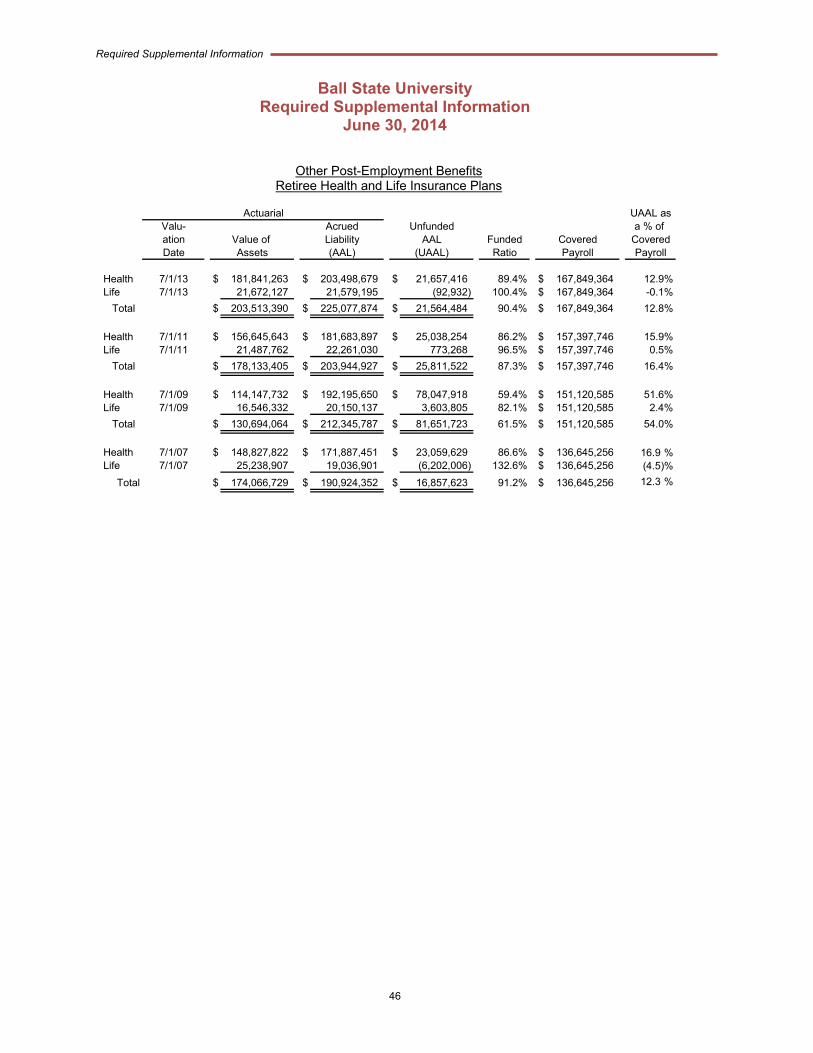
Required Supplemental Information
46
Ball State University Required Supplemental Information
June 30, 2014
UAAL asValu- a % of ation Funded CoveredDate Ratio Payroll
Health 7/1/13 $ 181,841,263 $ 203,498,679 $ 21,657,416 89.4% $ 167,849,364 12.9%Life 7/1/13 21,672,127 21,579,195 (92,932) 100.4% $ 167,849,364 -0.1%
Total $ 203,513,390 $ 225,077,874 $ 21,564,484 90.4% $ 167,849,364 12.8%
Health 7/1/11 $ 156,645,643 $ 181,683,897 $ 25,038,254 86.2% $ 157,397,746 15.9%Life 7/1/11 21,487,762 22,261,030 773,268 96.5% $ 157,397,746 0.5%
Total $ 178,133,405 $ 203,944,927 $ 25,811,522 87.3% $ 157,397,746 16.4%
Health 7/1/09 $ 114,147,732 $ 192,195,650 $ 78,047,918 59.4% $ 151,120,585 51.6%Life 7/1/09 16,546,332 20,150,137 3,603,805 82.1% $ 151,120,585 2.4%
Total $ 130,694,064 $ 212,345,787 $ 81,651,723 61.5% $ 151,120,585 54.0%
Health 7/1/07 $ 148,827,822 $ 171,887,451 $ 23,059,629 86.6% $ 136,645,256 16.9 %Life 7/1/07 25,238,907 19,036,901 (6,202,006) 132.6% $ 136,645,256 (4.5)%
Total $ 174,066,729 $ 190,924,352 $ 16,857,623 91.2% $ 136,645,256 12.3 %
Other Post-Employment BenefitsRetiree Health and Life Insurance Plans
ActuarialAcrued Unfunded
Value of Liability AAL CoveredAssets (AAL) (UAAL) Payroll
47
Supplemental Information
The following supplemental information has not been subjected to the auditing
procedures applied to the basic financial statements and accordingly, the
State Board of Accounts expresses no opinion thereon.
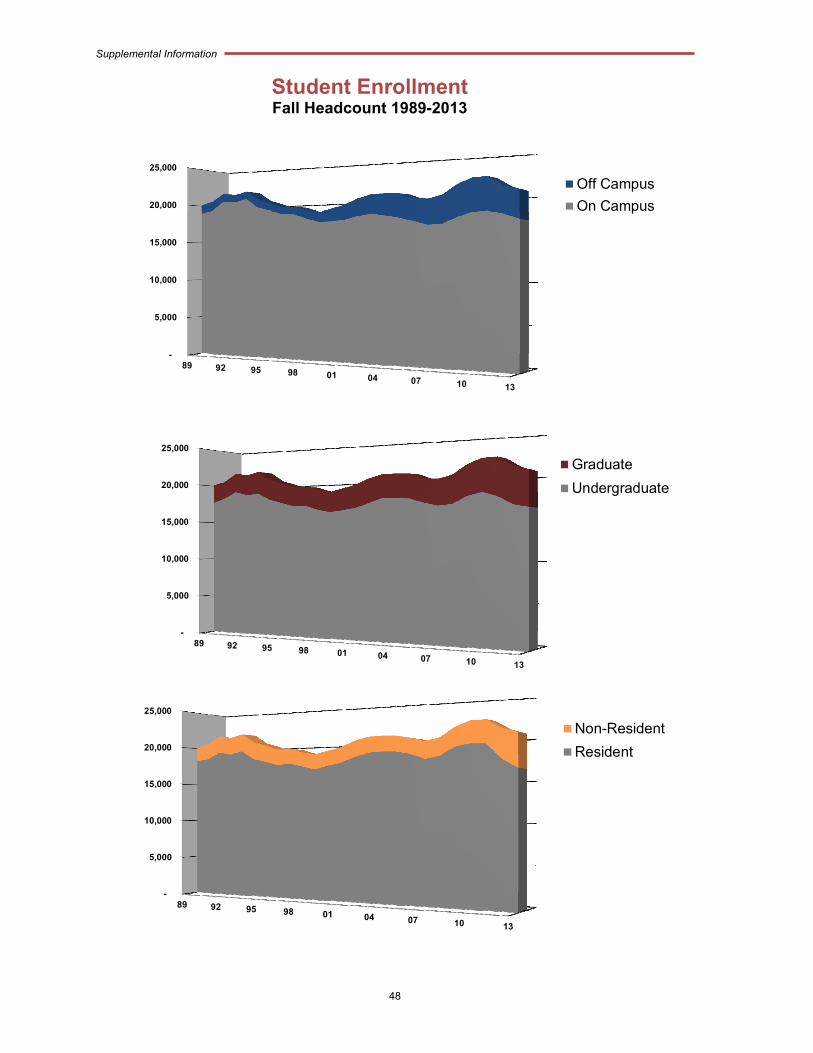
Supplemental Information
48
-
5,000
10,000
15,000
20,000
25,000
89 92 95 98 01 04 07 10 13
Off Campus
On Campus
-
5,000
10,000
15,000
20,000
25,000
89 92 95 98 01 04 07 10 13
Graduate
Undergraduate
-
5,000
10,000
15,000
20,000
25,000
89 92 95 98 01 04 07 10 13
Non-Resident
Resident
Student Enrollment Fall Headcount 1989-2013
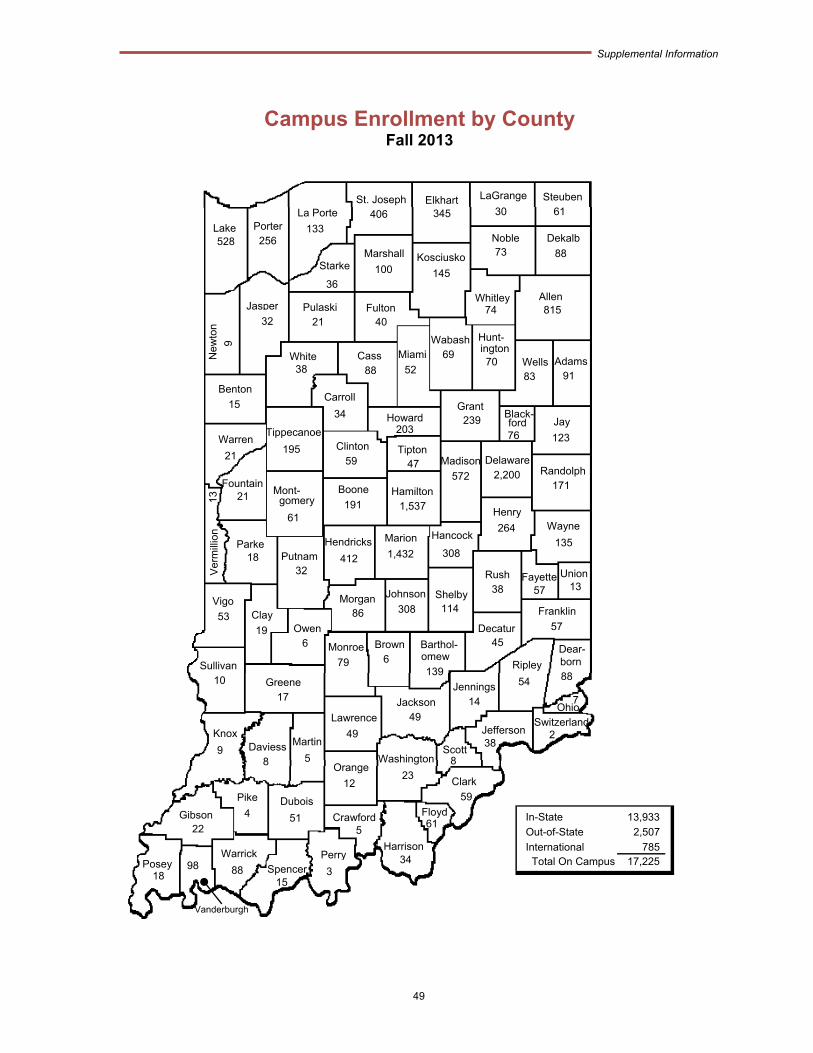
Supplemental Information
49
Campus Enrollment by County Fall 2013
Lake 528
Porter 256
La Porte
133
St. Joseph 406
Elkhart 345
LaGrange
30 Steuben
61
Dekalb
88
Noble 73 Kosciusko
145
Marshall
100Starke
36
Jasper
32
New
ton
9
Benton
15
Pulaski 21
Fulton 40
Whitley 74
Allen 815
Adams 91
Wells 83
Hunt- ington 70
Wabash 69 Miami
52 Cass
88 White
38
Carroll
34
Tippecanoe
195
Howard 203
Grant239
Black- ford 76
Jay
123
Randolph 171
Delaware 2,200
Madison
572
Tipton 47
Clinton 59
Warren
21
Fountain 21 Mont-
gomery
61
Ver
mill
ion
13
Parke 18
Boone
191Hamilton
1,537
Wayne
135
Henry
264 Hancock
308
Marion
1,432 Hendricks
412 Putnam 32
Vigo
53 Clay
19
Morgan 86
Johnson
308 Shelby
114
Rush 38
Fayette 57
Union 13
Owen 6
Franklin
57 Decatur 45 Barthol-
omew
139
Brown 6
Monroe
79 Sullivan 10 Greene
17
Dear- born 88
Ripley
54 Jennings 14Jackson
49 Lawrence
49
Ohio Switzerland
2 Knox
9 Daviess 8
Martin
5
Gibson 22
Pike
4 Dubois
51
Orange
12
Washington
23
Scott 8
Jefferson 38
Posey 18
Vanderburgh
98 Warrick
88 Spencer 15
Perry
3
Crawford 5
Harrison 34
Floyd 61
Clark
59
7
In-State 13,933
Out-of-State 2,507
International 785
Total On Campus 17,225
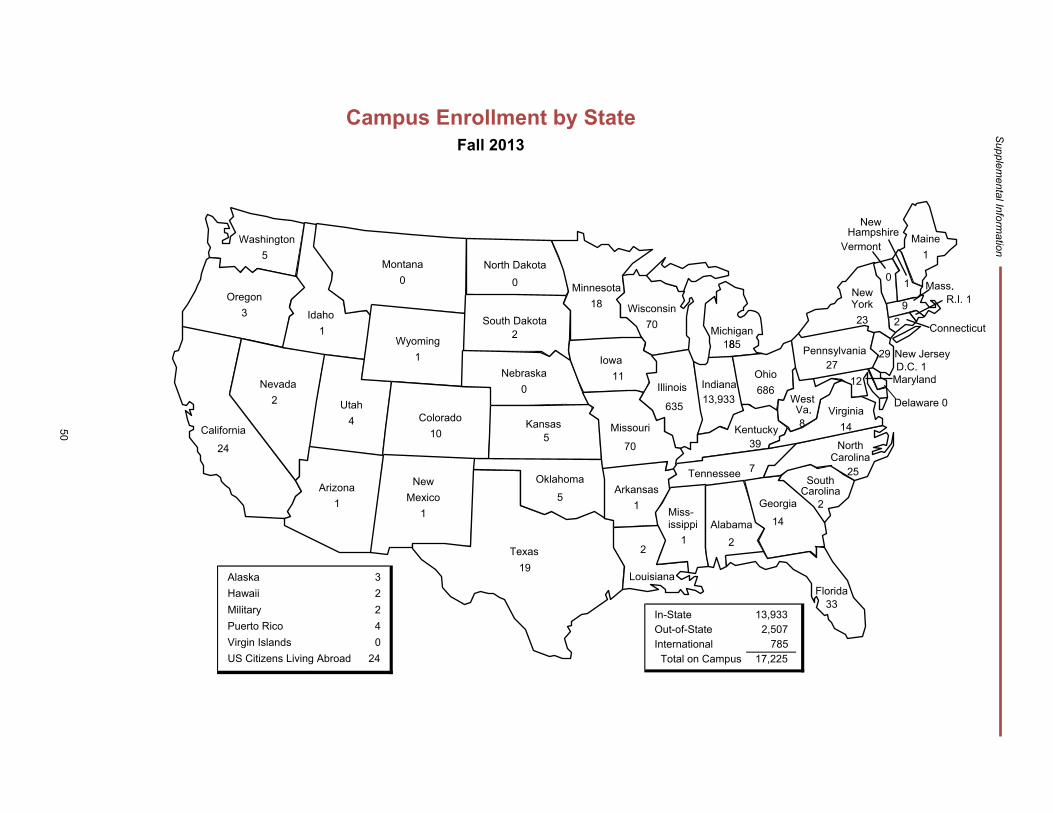
Campus Enrollment by State Fall 2013
50
Supplem
ental Information
In-State 13,933 Out-of-State 2,507 International 785
Total on Campus 17,225
Alaska 3
Hawaii 2
Military 2
Puerto Rico 4
Virgin Islands 0
US Citizens Living Abroad 24
Washington 5
Idaho 1
Montana 0
Oregon 3
Wyoming 1
North Dakota
0
South Dakota
2
Nebraska
0
Minnesota 18 Wisconsin
70 Michigan
1885
California
24
Nevada 2 Utah
4 Colorado 10
Kansas 5
Oklahoma
5 Arizona
1
New Mexico
1
Texas 19
Louisiana
Arkansas
1
Missouri
70
Iowa 11
Illinois
635
Indiana
13,933
Ohio
686
Kentucky 39
Tennessee
1
Alabama
2
Georgia 14
Florida 33
South Carolina
2
North Carolina
25
Virginia
14
West Va.
Pennsylvania 27
New York 23
Vermont
0
New Hampshire
1
Maine 1
Mass.
9 2
Connecticut
New Jersey 29
Maryland 12
Delaware 0
7
2
8
D.C. 1
R.I. 1
Miss- issippi
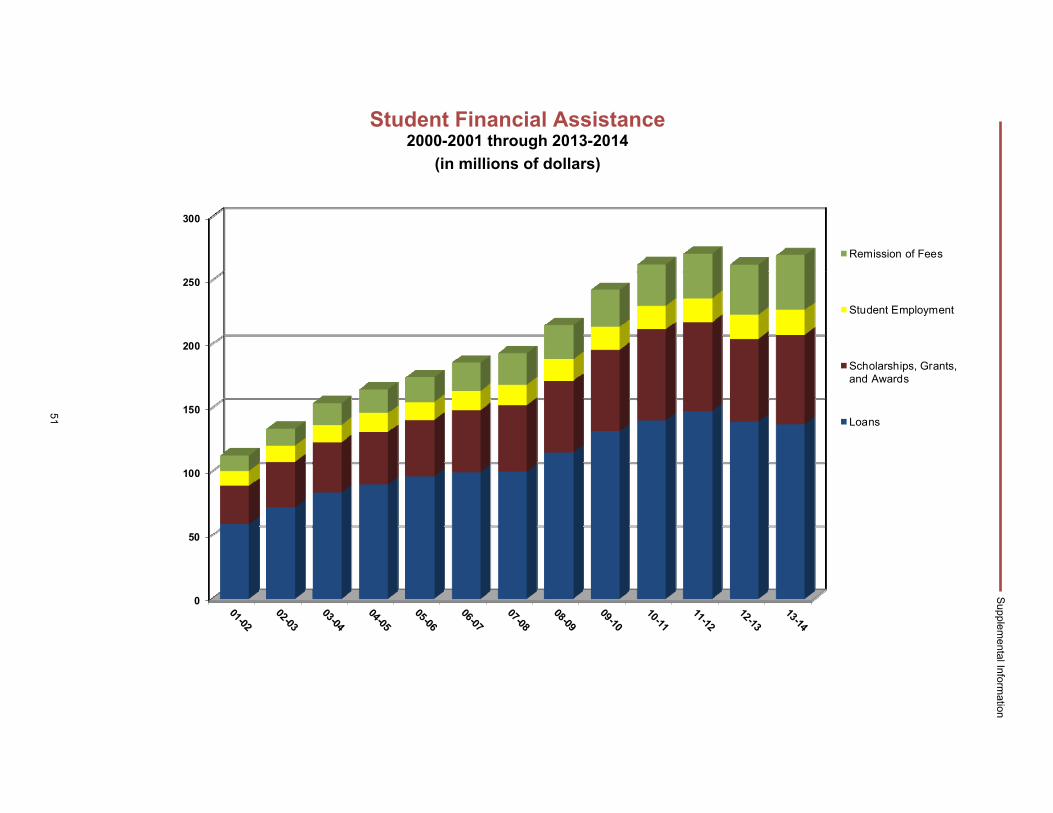
0
50
100
150
200
250
300
Remission of Fees
Student Employment
Scholarships, Grants,and Awards
Loans
Supplem
ental Information
51
Student Financial Assistance 2000-2001 through 2013-2014
(in millions of dollars)
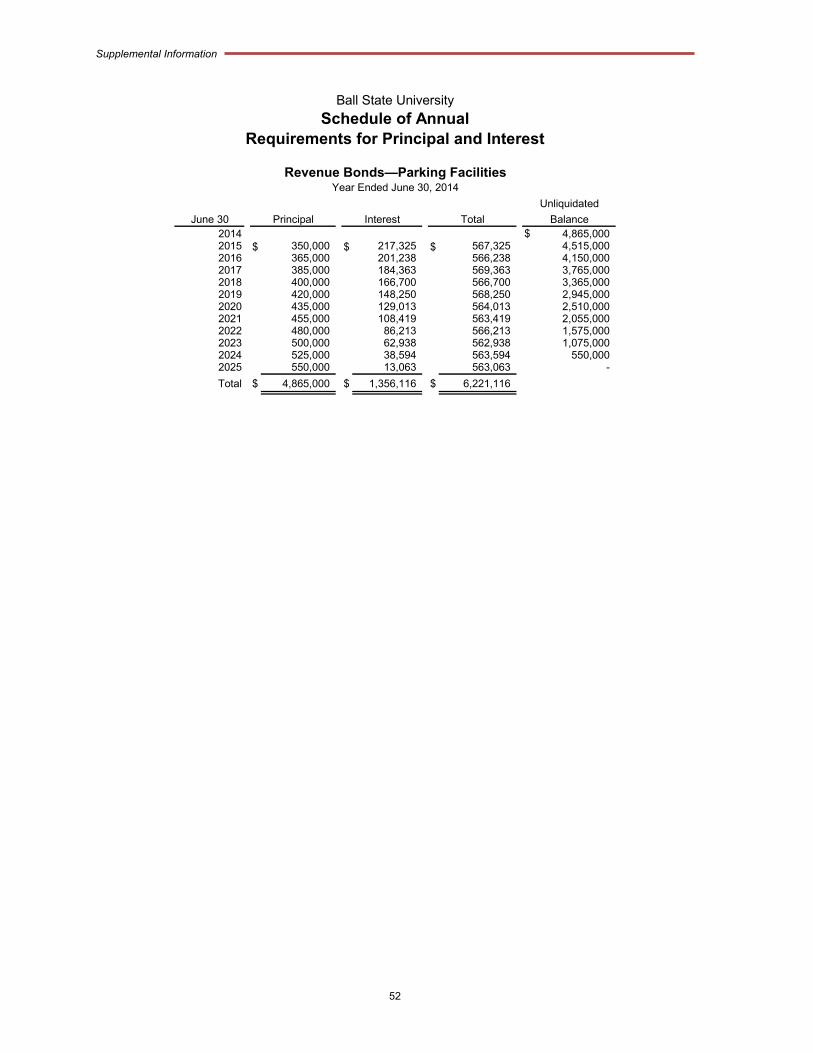
Supplemental Information
52
Revenue Bonds—Parking FacilitiesYear Ended June 30, 2014
Unliquidated
June 30 Principal Interest Total Balance2014 $ 4,865,000 2015 $ 350,000 $ 217,325 $ 567,325 4,515,000 2016 365,000 201,238 566,238 4,150,000 2017 385,000 184,363 569,363 3,765,000 2018 400,000 166,700 566,700 3,365,000 2019 420,000 148,250 568,250 2,945,000 2020 435,000 129,013 564,013 2,510,000 2021 455,000 108,419 563,419 2,055,000 2022 480,000 86,213 566,213 1,575,000 2023 500,000 62,938 562,938 1,075,000 2024 525,000 38,594 563,594 550,000 2025 550,000 13,063 563,063 -
Total $ 4,865,000 $ 1,356,116 $ 6,221,116
Ball State University
Schedule of Annual Requirements for Principal and Interest
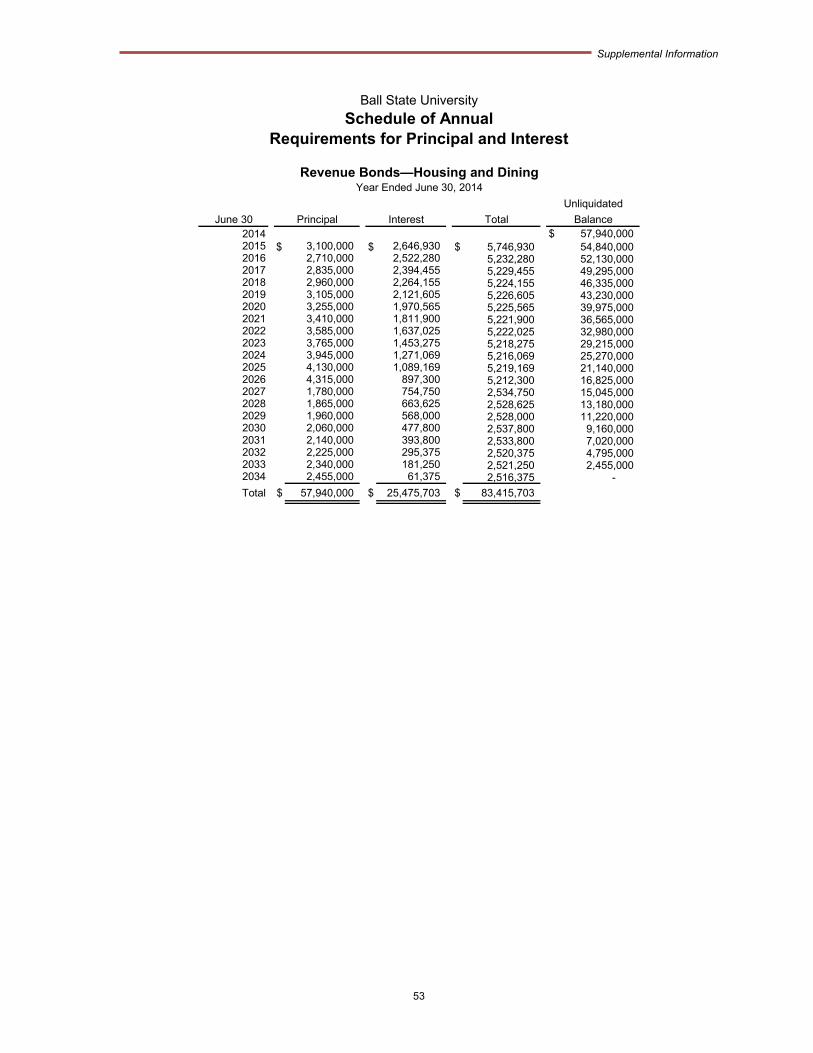
Supplemental Information
53
Revenue Bonds—Housing and DiningYear Ended June 30, 2014
Unliquidated
June 30 Principal Interest Total Balance2014 $ 57,940,000 2015 $ 3,100,000 $ 2,646,930 $ 5,746,930 54,840,000 2016 2,710,000 2,522,280 5,232,280 52,130,000 2017 2,835,000 2,394,455 5,229,455 49,295,000 2018 2,960,000 2,264,155 5,224,155 46,335,000 2019 3,105,000 2,121,605 5,226,605 43,230,000 2020 3,255,000 1,970,565 5,225,565 39,975,000 2021 3,410,000 1,811,900 5,221,900 36,565,000 2022 3,585,000 1,637,025 5,222,025 32,980,000 2023 3,765,000 1,453,275 5,218,275 29,215,000 2024 3,945,000 1,271,069 5,216,069 25,270,000 2025 4,130,000 1,089,169 5,219,169 21,140,000 2026 4,315,000 897,300 5,212,300 16,825,000 2027 1,780,000 754,750 2,534,750 15,045,000 2028 1,865,000 663,625 2,528,625 13,180,000 2029 1,960,000 568,000 2,528,000 11,220,000 2030 2,060,000 477,800 2,537,800 9,160,000 2031 2,140,000 393,800 2,533,800 7,020,000 2032 2,225,000 295,375 2,520,375 4,795,000 2033 2,340,000 181,250 2,521,250 2,455,000 2034 2,455,000 61,375 2,516,375 -
Total $ 57,940,000 $ 25,475,703 $ 83,415,703
Ball State University
Schedule of Annual Requirements for Principal and Interest
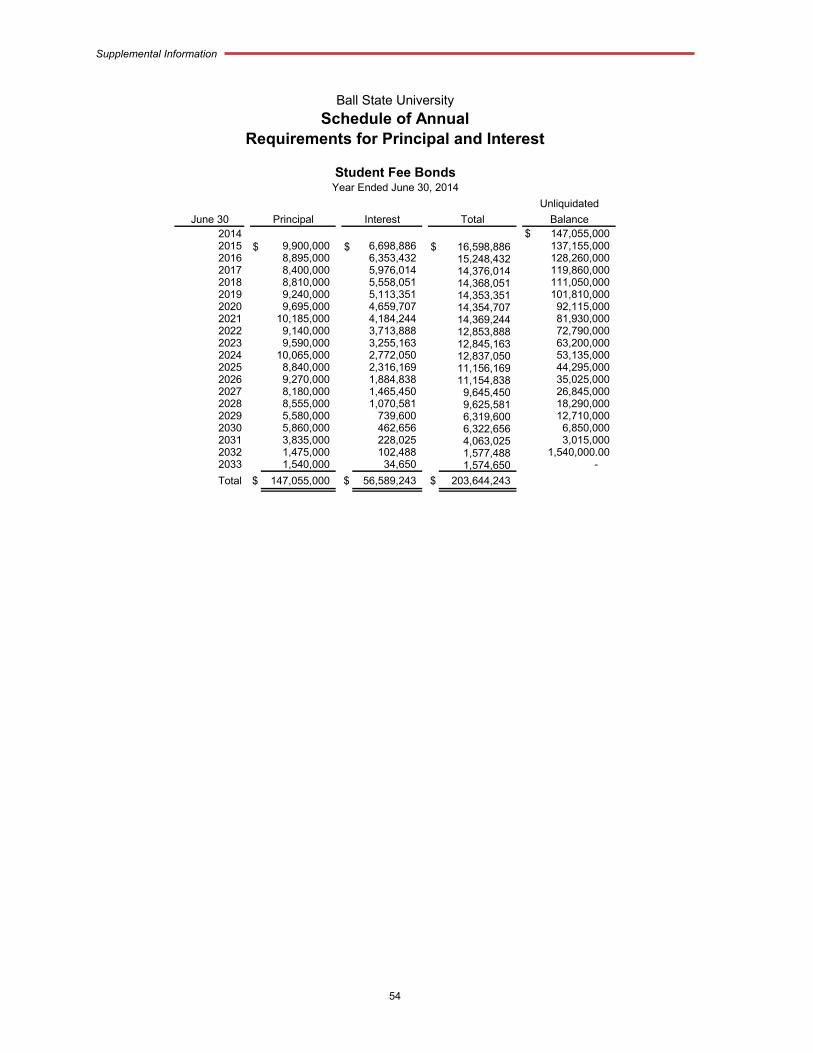
Supplemental Information
54
Student Fee BondsYear Ended June 30, 2014
Unliquidated
June 30 Principal Interest Total Balance2014 $ 147,055,000 2015 $ 9,900,000 $ 6,698,886 $ 16,598,886 137,155,000 2016 8,895,000 6,353,432 15,248,432 128,260,000 2017 8,400,000 5,976,014 14,376,014 119,860,000 2018 8,810,000 5,558,051 14,368,051 111,050,000 2019 9,240,000 5,113,351 14,353,351 101,810,000 2020 9,695,000 4,659,707 14,354,707 92,115,000 2021 10,185,000 4,184,244 14,369,244 81,930,000 2022 9,140,000 3,713,888 12,853,888 72,790,000 2023 9,590,000 3,255,163 12,845,163 63,200,000 2024 10,065,000 2,772,050 12,837,050 53,135,000 2025 8,840,000 2,316,169 11,156,169 44,295,000 2026 9,270,000 1,884,838 11,154,838 35,025,000 2027 8,180,000 1,465,450 9,645,450 26,845,000 2028 8,555,000 1,070,581 9,625,581 18,290,000 2029 5,580,000 739,600 6,319,600 12,710,000 2030 5,860,000 462,656 6,322,656 6,850,000 2031 3,835,000 228,025 4,063,025 3,015,000 2032 1,475,000 102,488 1,577,488 1,540,000.00 2033 1,540,000 34,650 1,574,650 -
Total $ 147,055,000 $ 56,589,243 $ 203,644,243
Ball State University
Schedule of Annual Requirements for Principal and Interest
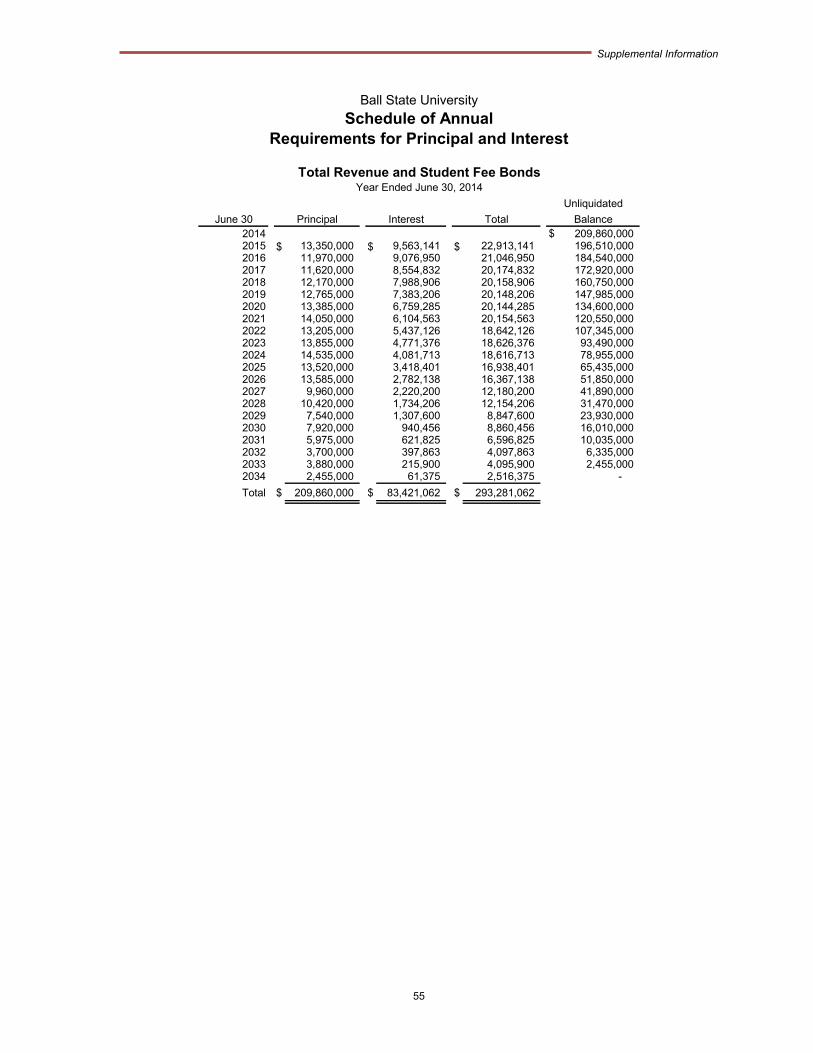
Supplemental Information
55
Total Revenue and Student Fee BondsYear Ended June 30, 2014
Unliquidated
June 30 Principal Interest Total Balance2014 $ 209,860,000 2015 $ 13,350,000 $ 9,563,141 $ 22,913,141 196,510,000 2016 11,970,000 9,076,950 21,046,950 184,540,000 2017 11,620,000 8,554,832 20,174,832 172,920,000 2018 12,170,000 7,988,906 20,158,906 160,750,000 2019 12,765,000 7,383,206 20,148,206 147,985,000 2020 13,385,000 6,759,285 20,144,285 134,600,000 2021 14,050,000 6,104,563 20,154,563 120,550,000 2022 13,205,000 5,437,126 18,642,126 107,345,000 2023 13,855,000 4,771,376 18,626,376 93,490,000 2024 14,535,000 4,081,713 18,616,713 78,955,000 2025 13,520,000 3,418,401 16,938,401 65,435,000 2026 13,585,000 2,782,138 16,367,138 51,850,000 2027 9,960,000 2,220,200 12,180,200 41,890,000 2028 10,420,000 1,734,206 12,154,206 31,470,000 2029 7,540,000 1,307,600 8,847,600 23,930,000 2030 7,920,000 940,456 8,860,456 16,010,000 2031 5,975,000 621,825 6,596,825 10,035,000 2032 3,700,000 397,863 4,097,863 6,335,000 2033 3,880,000 215,900 4,095,900 2,455,000 2034 2,455,000 61,375 2,516,375 -
Total $ 209,860,000 $ 83,421,062 $ 293,281,062
Ball State University
Schedule of Annual Requirements for Principal and Interest

56
This page intentionally left blank